Article

Performance Evaluation of a UAV-Based Graded Precision Spraying System: Analysis of Spray Accuracy, Response Errors, and Field Efficacy

1
Interdisciplinary Program in Smart Agriculture, College of Agricultural and Life Sciences, Kangwon National University, Chuncheon 24341, Republic of Korea
2
Department of Mechanical and Electrical Engineering, Shandong Water Conservancy Vocational College, Rizhao 276826, China
3
Department of Agricultural Engineering, National Institute of Agricultural Sciences, Rural Development Administration, Jeonju 54875, Republic of Korea
4
Department of Crops and Food, Jeonbuk State Agricultural Research and Extension Services, Iksan 54591, Republic of Korea
5
Department of Biosystems Machinery Engineering, Chungnam National University, Daejeon 34134, Republic of Korea
6
Department of Biosystems Engineering, College of Agricultural and Life Sciences, Kangwon National University, Chuncheon 24341, Republic of Korea
*
Author to whom correspondence should be addressed.
Agriculture 2025, 15(19), 2070; https://doi.org/10.3390/agriculture15192070
Submission received: 5 August 2025 / Revised: 26 September 2025 / Accepted: 1 October 2025 / Published: 2 October 2025
(This article belongs to the Special Issue Design and Development of Smart Crop Protection Equipment)

Abstract

Advances in sensor technology have significantly improved the efficiency and precision of agricultural spraying. Unmanned aerial vehicles (UAVs) are widely utilized for applying plant protection products (PPPs) and fertilizers, offering enhanced spatial control and operational flexibility. This study evaluated the performance of an autonomous UAV-based precision spraying system that applies variable rates based on zone levels defined in a prescription map. The system integrates real-time kinematic global navigation satellite system positioning with a proximity-triggered spray algorithm. Field experiments on a rice field were conducted to assess spray accuracy and fertilization efficacy with liquid fertilizer. Spray deposition patterns on water-sensitive paper showed that the graded strategy distinguished among zone levels, with the highest deposition in high-spray zones, moderate in medium zones, and minimal in no-spray zones. However, entry and exit deviations—used to measure system response delays—averaged 0.878 m and 0.955 m, respectively, indicating slight lags in spray activation and deactivation. Fertilization results showed that higher application levels significantly increased the grain-filling rate and thousand-grain weight (both p < 0.001), but had no significant effect on panicle number or grain count per panicle (p > 0.05). This suggests that increased fertilization primarily enhances grain development rather than overall plant structure. Overall, the system shows strong potential to optimize inputs and yields, though UAV path tracking errors and system response delays require further refinement to enhance spray uniformity and accuracy under real-world applications.

1. Introduction

The rapid advancement of sensor technology and artificial intelligence is digitalizing agriculture, transforming it from a labor-intensive, resource-dependent industry into an intelligent, data-driven sector. Modern farms are increasingly leveraging precision, automation, and data analytics to boost productivity and sustainability [1,2]. High-resolution sensors, machine vision, and deep learning now enable real-time monitoring of crop growth, soil moisture, and pest outbreaks, optimizing resource use and guiding management decisions [3,4,5]. With this technological shift, unmanned aerial vehicles (UAVs) have become indispensable to smart agriculture, offering efficiency, flexibility, and automation in field operations.
Precision spraying of plant protection products (PPPs) and fertilizers using UAVs has attracted considerable interest for its ability to reduce chemical waste, limit environmental impact, and lower labor costs compared to conventional methods [6]. UAV-based sprayers adapt readily to varied terrains and crop types. Prior research in this domain has primarily focused on two major aspects: (1) optimizing UAV flight paths and endurance for large-scale missions [7,8] and (2) fine-tuning spray parameters to achieve uniform deposition across diverse crops [9,10].
UAV spraying is constrained by payload and battery life, which restricts operations mainly to small-scale plots. To overcome these limitations and extend coverage, recent studies have investigated advanced path planning in complex terrains [11,12], multi-UAV coordination, and UAV-unmanned ground vehicle collaboration. For example, Xu et al. [13] developed a spraying-path-optimization algorithm using an improved simulated annealing/Lin–Kernighan–Helsgaun approach, enabling multiple UAVs to achieve full-coverage pesticide application along the shortest routes for orchard plant protection. The effectiveness of UAV spraying, however, is influenced by multiple factors, including wind speed and direction, droplet characteristics, canopy density, and leaf morphology, all of which vary across crop species and hinder the development of a universal spraying model [14,15]. To address this challenge, crop-specific spraying strategies have been proposed. Shi et al. [16] used multi-criteria weighting to optimize flight altitude, speed, and application rate for tobacco; Wongsuk et al. [17] evaluated nozzle type, UAV model, flight speed, and droplet characteristics to determine the optimal spraying configurations for rice pest control; and Shan et al. [18] demonstrated that a 2 m spray height, 90 L ha−1 application rate, and the use of adjuvants markedly improved deposition in orchards. In addition, UAV-based LiDAR has recently been employed to extract canopy features and support variable spraying decisions [19].
Despite these advancements, two critical challenges hinder the practical deployment of UAV spraying in production environments. First, although precision aerial applications show strong potential, its adoption is constrained by high system costs and integration complexity [20,21]. Many commercial solutions depend on proprietary hardware and tightly coupled flight–spray controllers, making them prohibitively expensive for small- and medium-scale farmers. This highlights the need for retrofit-friendly, cost-effective variable-rate controllers that can be easily mounted on existing UAV platforms. Second, prescription maps are central to site-specific crop management, as they delineate spatially variable input requirements and enable differential variable-rate application [22]. However, the literature lacks quantitative evidence on the performance of zone-triggered graded spraying under realistic field disturbances (e.g., trajectory deviations, response delays), especially regarding zone-level deposition uniformity and agronomic outcomes.
Our previous research developed a modular, graded-precision UAV spraying system and validated its spray-uniformity logic under controlled conditions, employing a coefficient-of-variation (CV)–based decision strategy [23,24]. This system is compatible with diverse UAV platforms—including older models—facilitating intelligent spraying with minimal hardware modification and reduced costs. It implements a three-level graded spraying strategy that simplifies actuation while still providing zone-scale differentiation, making it well-suited for retrofit applications. However, comprehensive field-scale evaluation of prescription-map-guided graded spraying remains scarce, particularly in relation to cross-zone differentiation, within-zone deposition uniformity, lateral bias caused by trajectory deviations, and entry/exit response errors at zone boundaries.
To address these gaps, this study presents a comprehensive field evaluation of a modular graded-precision UAV spraying system guided by prescription maps in rice fields under practical operating conditions. The objective is to provide field-validated evidence on the capabilities and limitations of prescription-based graded spraying, identify key issues, and guide optimization. Ultimately, the findings aim to accelerate the adoption of intelligent spraying systems and contribute to more sustainable, data-driven agricultural practices. The specific objectives of this study were as follows:
(1)
Field flight accuracy assessment—evaluate the UAV’s flight precision and trajectory stability under real-world agricultural conditions;
(2)
Spraying effectiveness evaluation—analyze spray uniformity and deposition efficiency in field trials using water-sensitive paper (WSP);
(3)
Fertilizer application experiment—implement graded fertilizer spraying with the proposed precision UAV system and assess its impact on rice yield;
(4)
Correlation analysis of spraying and harvest outcomes—investigate the relationships between spraying levels and various harvest indicators to quantify the system’s agronomic benefits.

2. Materials and Methods

2.1. Hardware Design of the Automatic UAV-Based Spraying System

2.1.1. System Components and Architecture

Figure 1 illustrates the modular UAV-based spraying system and its auxiliary control unit [23,24]. The system comprises two main components: the ground base station (GBS) and the control spraying assistant (CSA), which work together to optimize spray accuracy and operational efficiency.
The GBS (Figure 1a) collects real-time environmental data and provides high-accuracy positioning corrections. It is equipped with an RK 120-07 ultrasonic anemometer (Hunan Rika Electronic Tech, Changsha, China) for real-time monitoring of wind speed and direction. The collected data are transmitted to a Raspberry Pi 4 Model B (RPI; Sony UK Technology Center, Pencoed, Wales) via a Modbus RS232/485/TTL gateway (Waveshare, Shenzhen, China) for on-site processing. To improve positional accuracy, the GBS is equipped with an RTK-GNSS base station (simpleRTK2B, Ardusimple, Lleida, Spain), which achieves horizontal accuracy of ≤2 cm and vertical accuracy of ≤3 cm according to device specifications. Correction signals from the RTK-GNSS are processed by the RPI to ensure high-precision positioning, which is essential for precise spraying applications. Furthermore, the GBS integrates a LoRa communication module (HAT SX1262 915 MHz, Waveshare, Shenzhen, China) to relay wind speed data and RTK corrections to the CSA over distances beyond 2 km. Additionally, an XBee module (Ardusimple, Lleida, Spain) provides an alternative communication channel, enhancing stability and minimizing interference. The LoRa-equipped RPI at the core of the GBS records environmental parameters, improves positioning accuracy, and ensures seamless wireless data transmission to the CSA. This integration enables the system to adapt to fluctuating wind conditions while maintaining precise positional corrections, ensuring efficient and accurate spraying.
The CSA (Figure 1b), mounted on an SG-10P octocopter (Hankook Samgong, Seoul, Republic of Korea), serves as the primary control unit for real-time spray optimization. In this study, spray operations were executed according to zone levels specified in the prescription map. The CSA’s spray-control system comprises three key subsystems: (1) a data acquisition module for real-time environmental and operational inputs; (2) a spray decision algorithm for zone-based execution; and (3) a position recognition system for ensuring accurate spraying at designated waypoints. Hardware components—including a GNSS rover, LoRa and XBee modules, and an RPI—coordinate with the GBS’s positioning and communication modules. The RPI serves as the central processor, managing real-time data exchange and regulating the dual pumps via the relay module to ensure precise, efficient spraying during UAV operation.
In this study, four TeeJet XR11004 flat-fan nozzles (TeeJet Technologies, Springfield, MA, USA) were symmetrically mounted beneath the four side rotors and powered by a dual-pump system, as shown in Figure 1b. A two-channel relay module (Vallemen Group, Gavere, Belgium) controlled the pump system to facilitate synchronized spraying at an operating pressure of 275.79 kPa (40 psi), the recommended pressure for the XR11004 nozzles. To ensure precise PPP or fertilizer application, the CSA is equipped with a water-flow sensor (Adafruit Industries, New York City, NY, USA), which measures flow rates in the range of 1–30 L min−1 for real-time monitoring. This range was well suited to the system’s operational flow of 3–6 L min−1, depending on the number of active nozzles. Across three repeated trials, the measured deviations were within ±5% for Level 1 spraying, confirming system reliability.

2.1.2. System Operation Principle

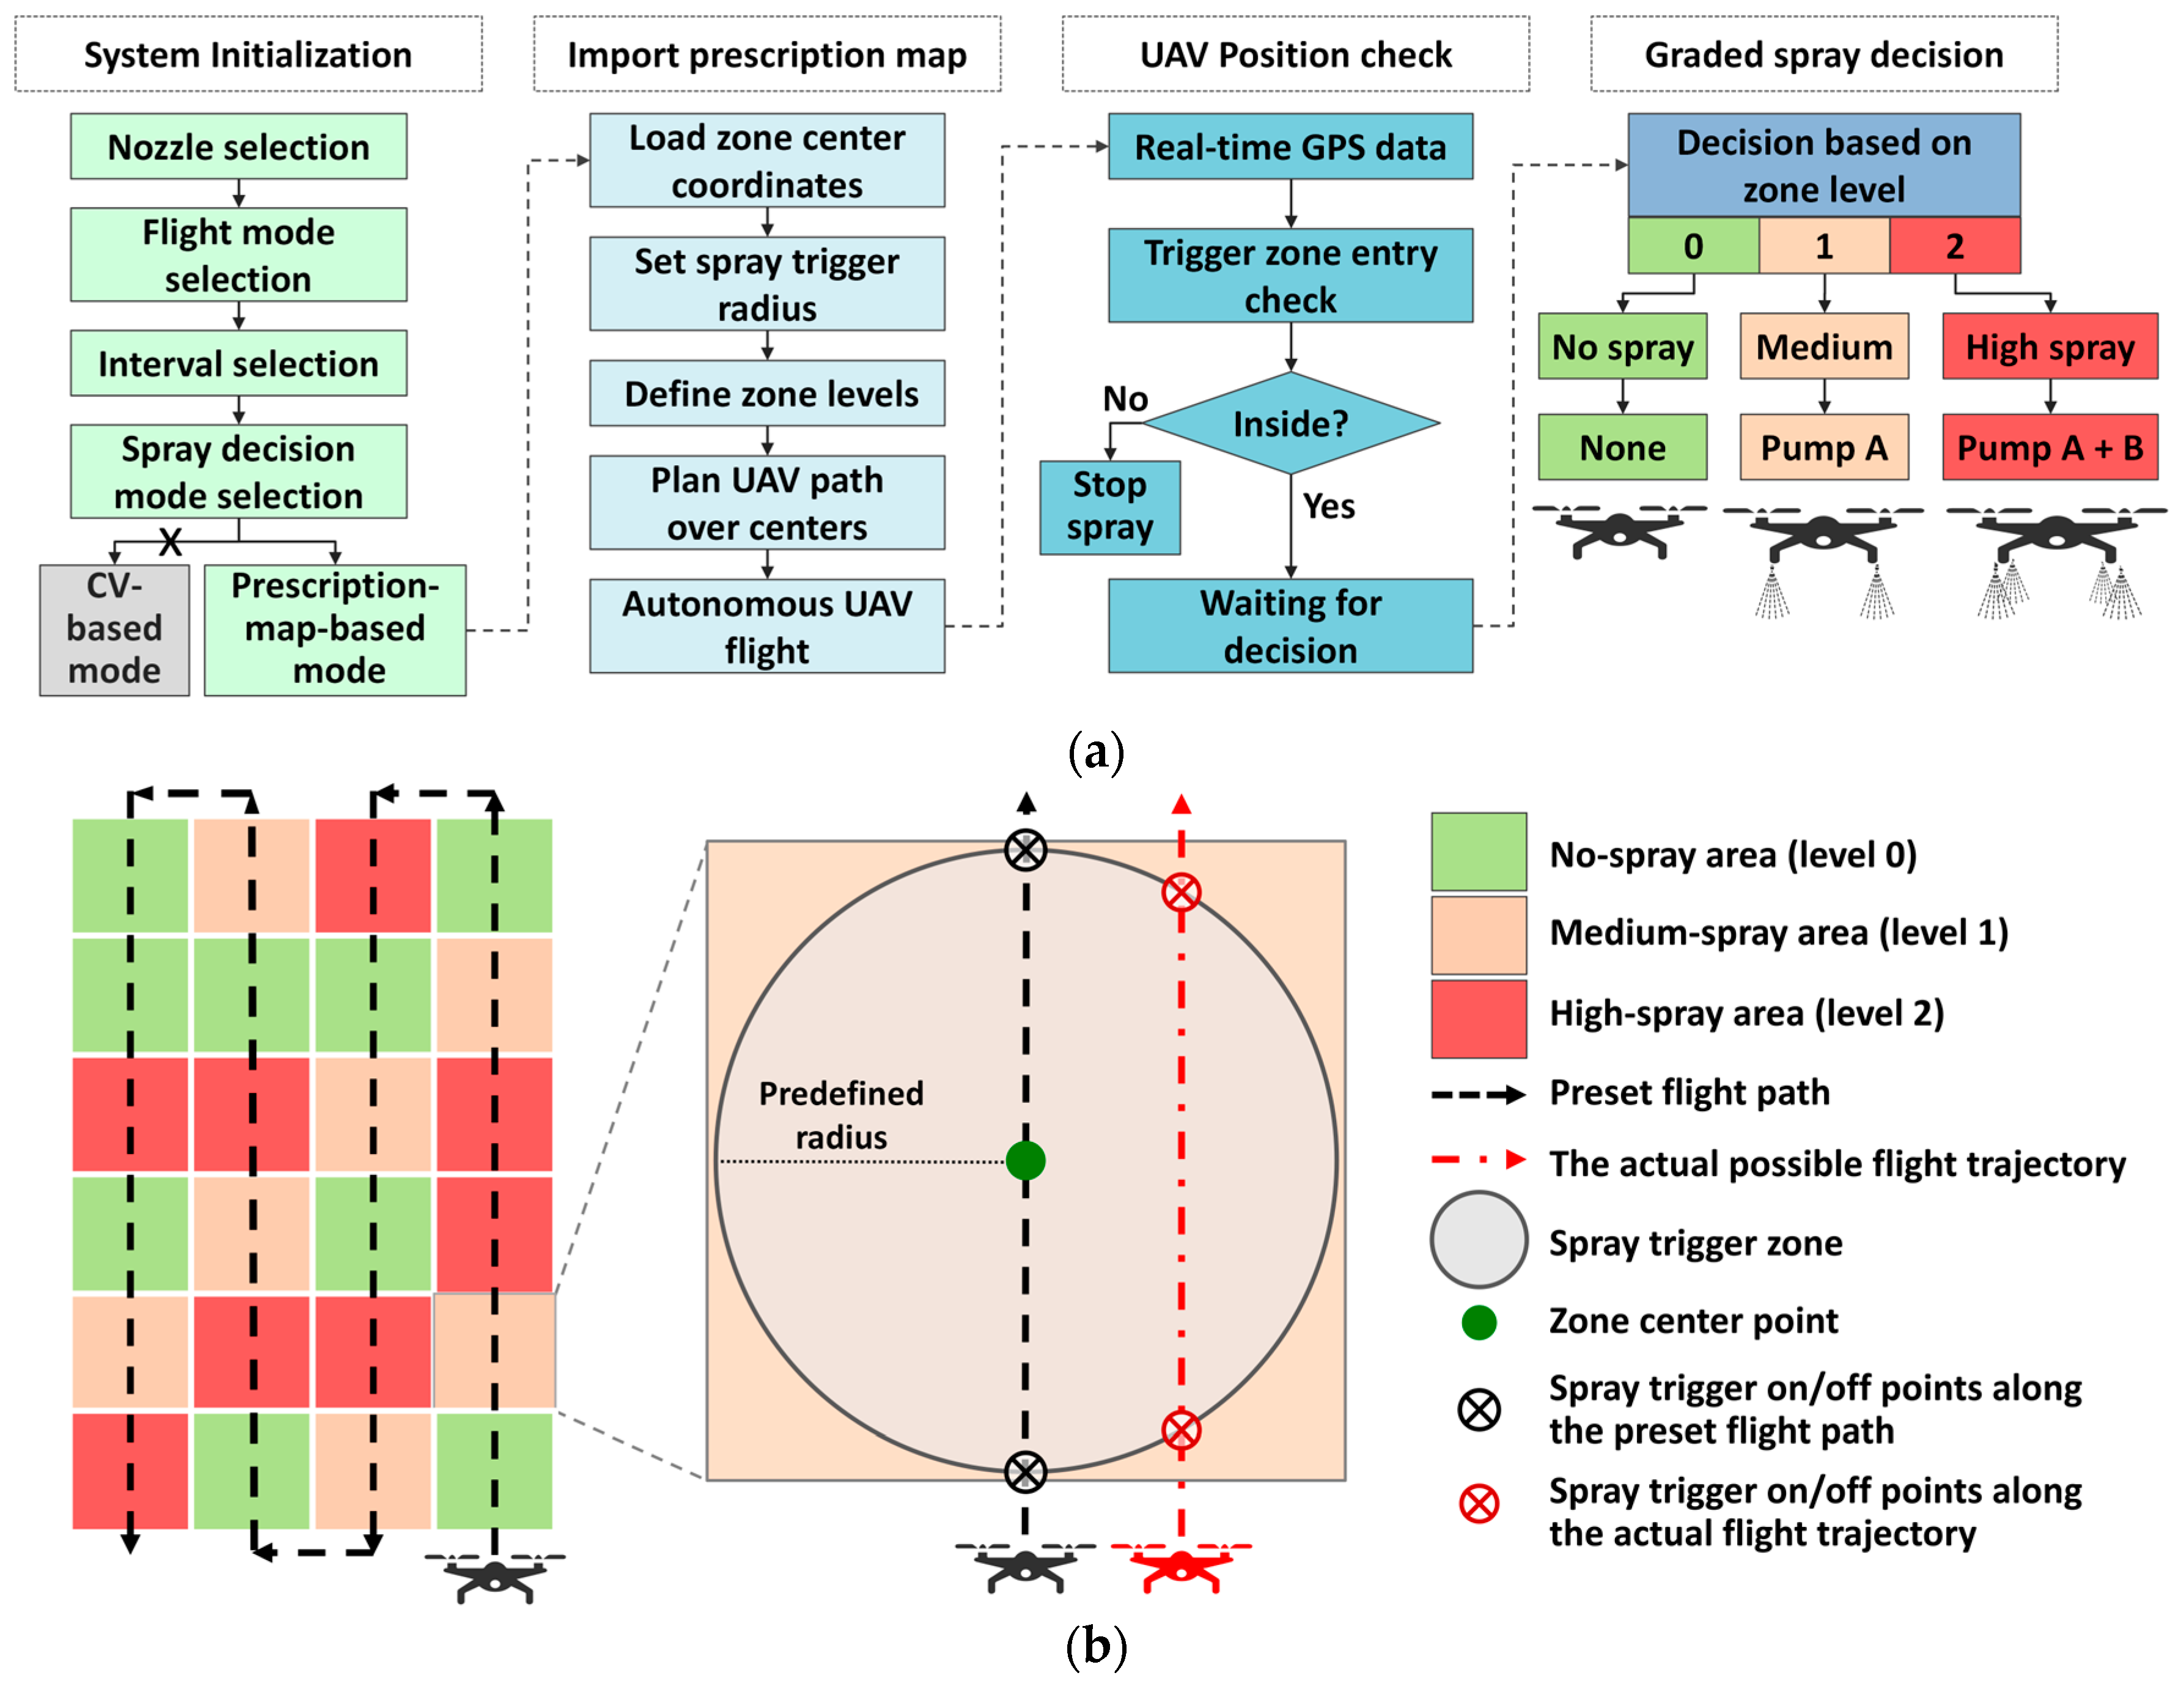
Figure 2a illustrates the system’s operational principle. Upon activation, the user selects the appropriate nozzle type according to crop and spraying requirements and then chooses a flight mode from common patterns such as back-and-forth or race-and-track spraying [23]. The system supports two spraying decision modes: (i) a CV-based mode, which dynamically adjusts nozzle activation in response to real-time environmental data and has been validated in earlier controlled experiments [23,24], and (ii) a prescription-map-based mode. As this study emphasizes field evaluation of graded spraying, only the prescription-map mode was employed.
In this mode, management zones and spray levels are predefined based on agronomic information derived from ground surveys, UAV-acquired datasets (e.g., vegetation indices such as NDVI or disease distribution maps), and prior field knowledge. These inputs are processed into prescription maps that delineate zones of varying management intensity. For experimental consistency and to match the elongated coverage patterns of UAV spraying, zones were defined in rectangular form. A preset trigger radius around each zone center determines UAV entry, with spraying activated once the designated boundary is crossed. As shown in Figure 2b, deviations between the actual trajectory and planned path may shift trigger timing, leading to delays or uneven deposition at zone boundaries.
The system employs three discrete spraying levels: Level 0 (no spray; Pumps A and B off), Level 1 (medium; Pump A on), and Level 2 (high; Pumps A and B on). While advanced continuous-rate systems are available, this simplified three-level scheme was intentionally designed for retrofit applications, prioritizing compatibility with low-cost hardware and ease of actuation. Pumps are activated according to the assigned zone level, providing practical differentiation at the management scale with minimizing system complexity. However, limitations such as reduced zone-level uniformity and response delays necessitate rigorous validation. Accordingly, this study presents a comprehensive field evaluation to quantify deposition uniformity, entry/exit response accuracy, and agronomic outcomes under real-world rice production conditions.

2.2. Experimental Methodology and Design

2.2.1. Experimental Site and Layout

The field experiment was conducted in a 4000 m2 rice field (35°55′25″ N, 126°59′58″ E) cultivated with the ‘Chamdongjin’ variety at the Jeonbuk Agricultural Research and Extension Services, Republic of Korea (Figure 3). Seedlings were mechanically transplanted on 20 June 2024, at a density of 18 plants m−2. The field was divided into three sections, each designated for a specific experimental purpose. UAV-based spraying of water and fertilizer was performed on 14 August 2024. All harvest-related indicators were recorded after crop maturity and harvest in early October 2024 to ensure an accurate assessment of treatment effects.

2.2.2. Flight Plan and Spraying Experiments

The performance of the UAV-based spraying system was evaluated through two experiments: (1) a spraying error detection experiment, which assessed the system’s spray accuracy, and (2) a field efficacy testing experiment, which evaluated the effects of fertilizer application on crop growth and yield. Since the field efficacy experiment required the analysis of various harvest indicators, water was used as a substitute spray medium in the error detection experiment to maintain consistent experimental conditions. Among the primary spray treatments—PPPs and fertilizers—liquid fertilizer was selected for the field efficacy experiment due to its suitability for quantitative assessment. Unlike PPPs, whose effects are difficult to measure precisely, fertilizer application produces direct and measurable outcomes in rice production.
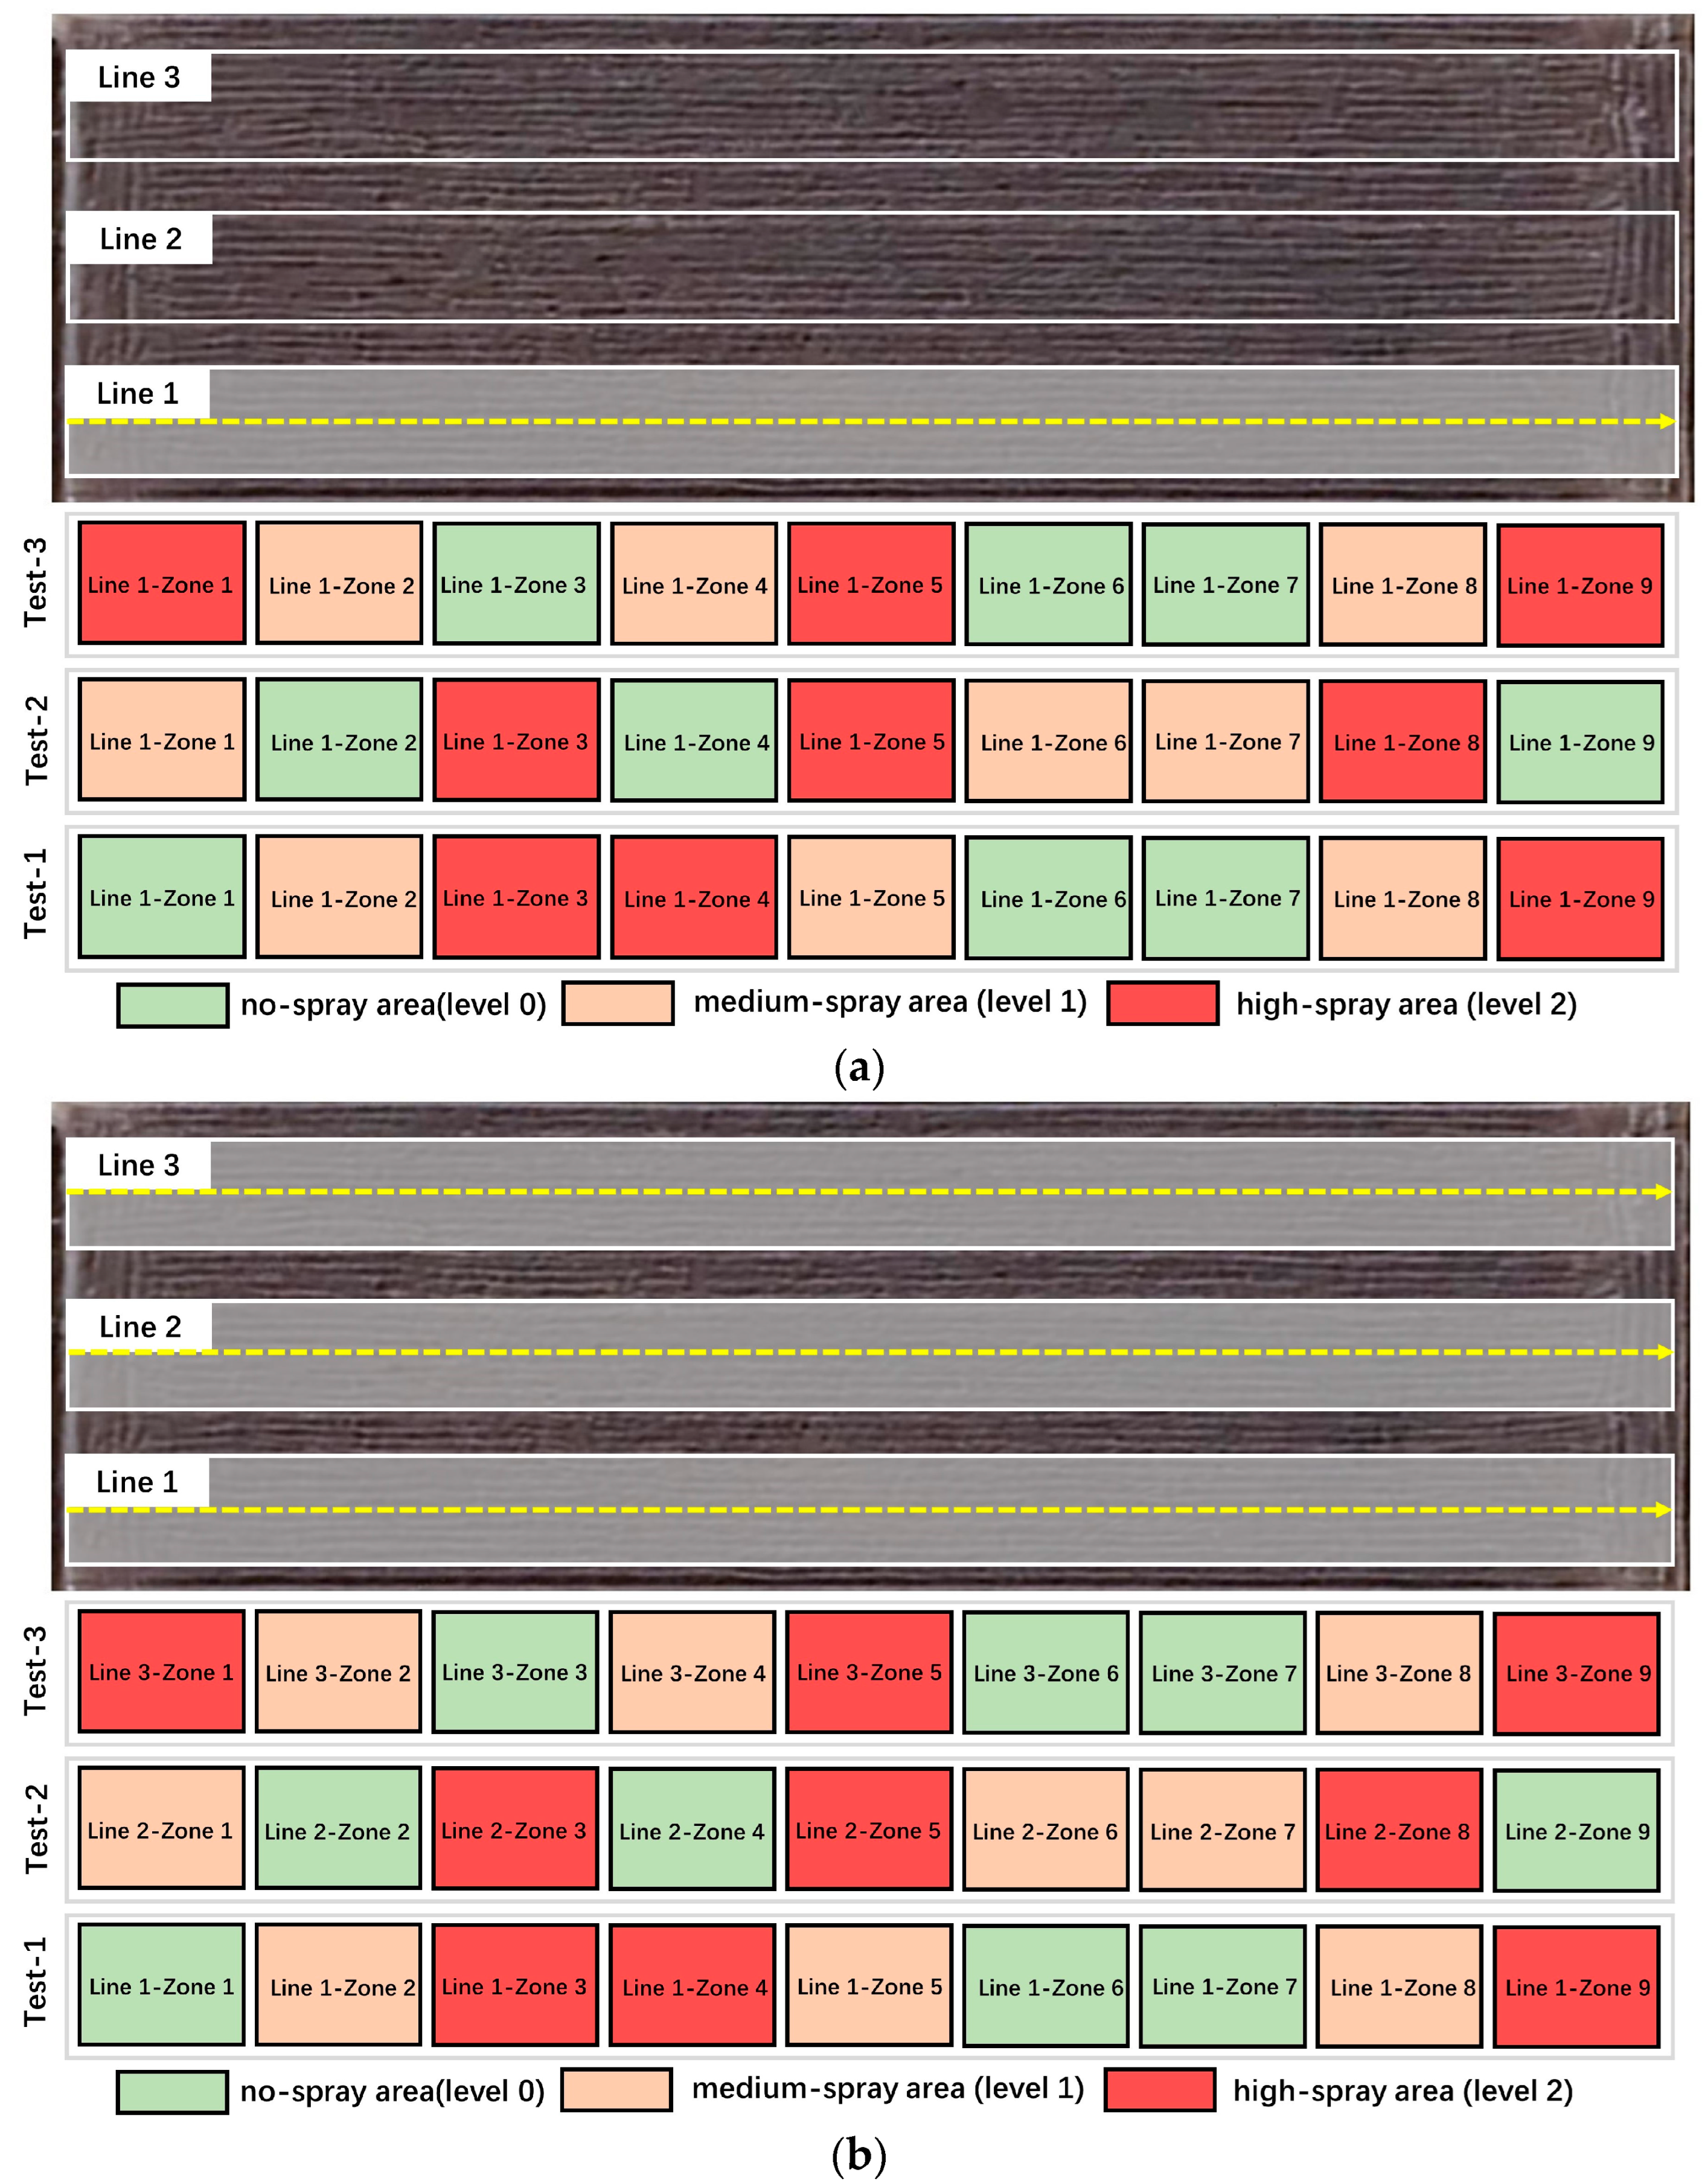
Figure 4a,b illustrate the flight plans and spraying arrangements. To ensure precise operation and minimize errors caused by droplet splashing, the spraying error detection experiment was conducted exclusively along Line 1, with three repetitions. To maintain accuracy and accommodate UAV endurance limitations, continuous flights were avoided. Instead, each flight covered a single, straight path from start to finish (100 m). Along this path, nine zones were delineated, each assigned a unique spraying level.
To minimize external variability and accurately evaluate the zone-based graded spraying system under real field conditions, the UAV maintained a constant altitude of 2 m and a speed of 1 m s−1 throughout the spraying process. These parameters were derived from prior simulations and field validation studies [23,24] to strike an optimal balance between spray accuracy and operational efficiency—avoiding the drift associated with higher altitudes and the reduced deposition caused by excessive speed. Moreover, these settings align with common local agricultural practices, further reinforcing their practical relevance. To replicate real-world variability, the spraying level sequence across zones was randomized. The designated sequences for the three trials (Figure 4a) were Test 1: 012–210–012, Test 2: 102–021–120, and Test 3: 210–120–012, where each digit represents a spraying level (0 = no spray, 1 = medium spray, 2 = high spray).
For the field efficacy experiment (Figure 4b), Drone-N 23-0-1 liquid urea fertilizer (KG Chemical, Seoul, Republic of Korea) was applied. This inorganic fertilizer, formulated with an N:P:K ratio of 23:0:1, is specifically designed to promote rice growth. During the experiment, 5 kg of the fertilizer was diluted with 10 L of water and uniformly applied using the UAV, corresponding to an application rate of approximately 20 kg N ha−1 with all four nozzles active. The experiment was conducted after the error detection experiment. Before initiating fertilizer spraying, all WSP samples were collected, and the experimental area was cleared. The fertilizer was sprayed sequentially across all designated zones, with the UAV following the same flight pattern for each trial. The spraying sequences were Test 1/Line 1: 012–210–012, Test 2/Line 2: 102–021–120, and Test 3/Line 3: 210–120–012. After spraying, the field remained undisturbed until rice harvest, at which point the data were collected and analyzed.

2.3. Experimental Method for Spray Error Analysis

2.3.1. WSP Placement and Droplet Deposition Analysis

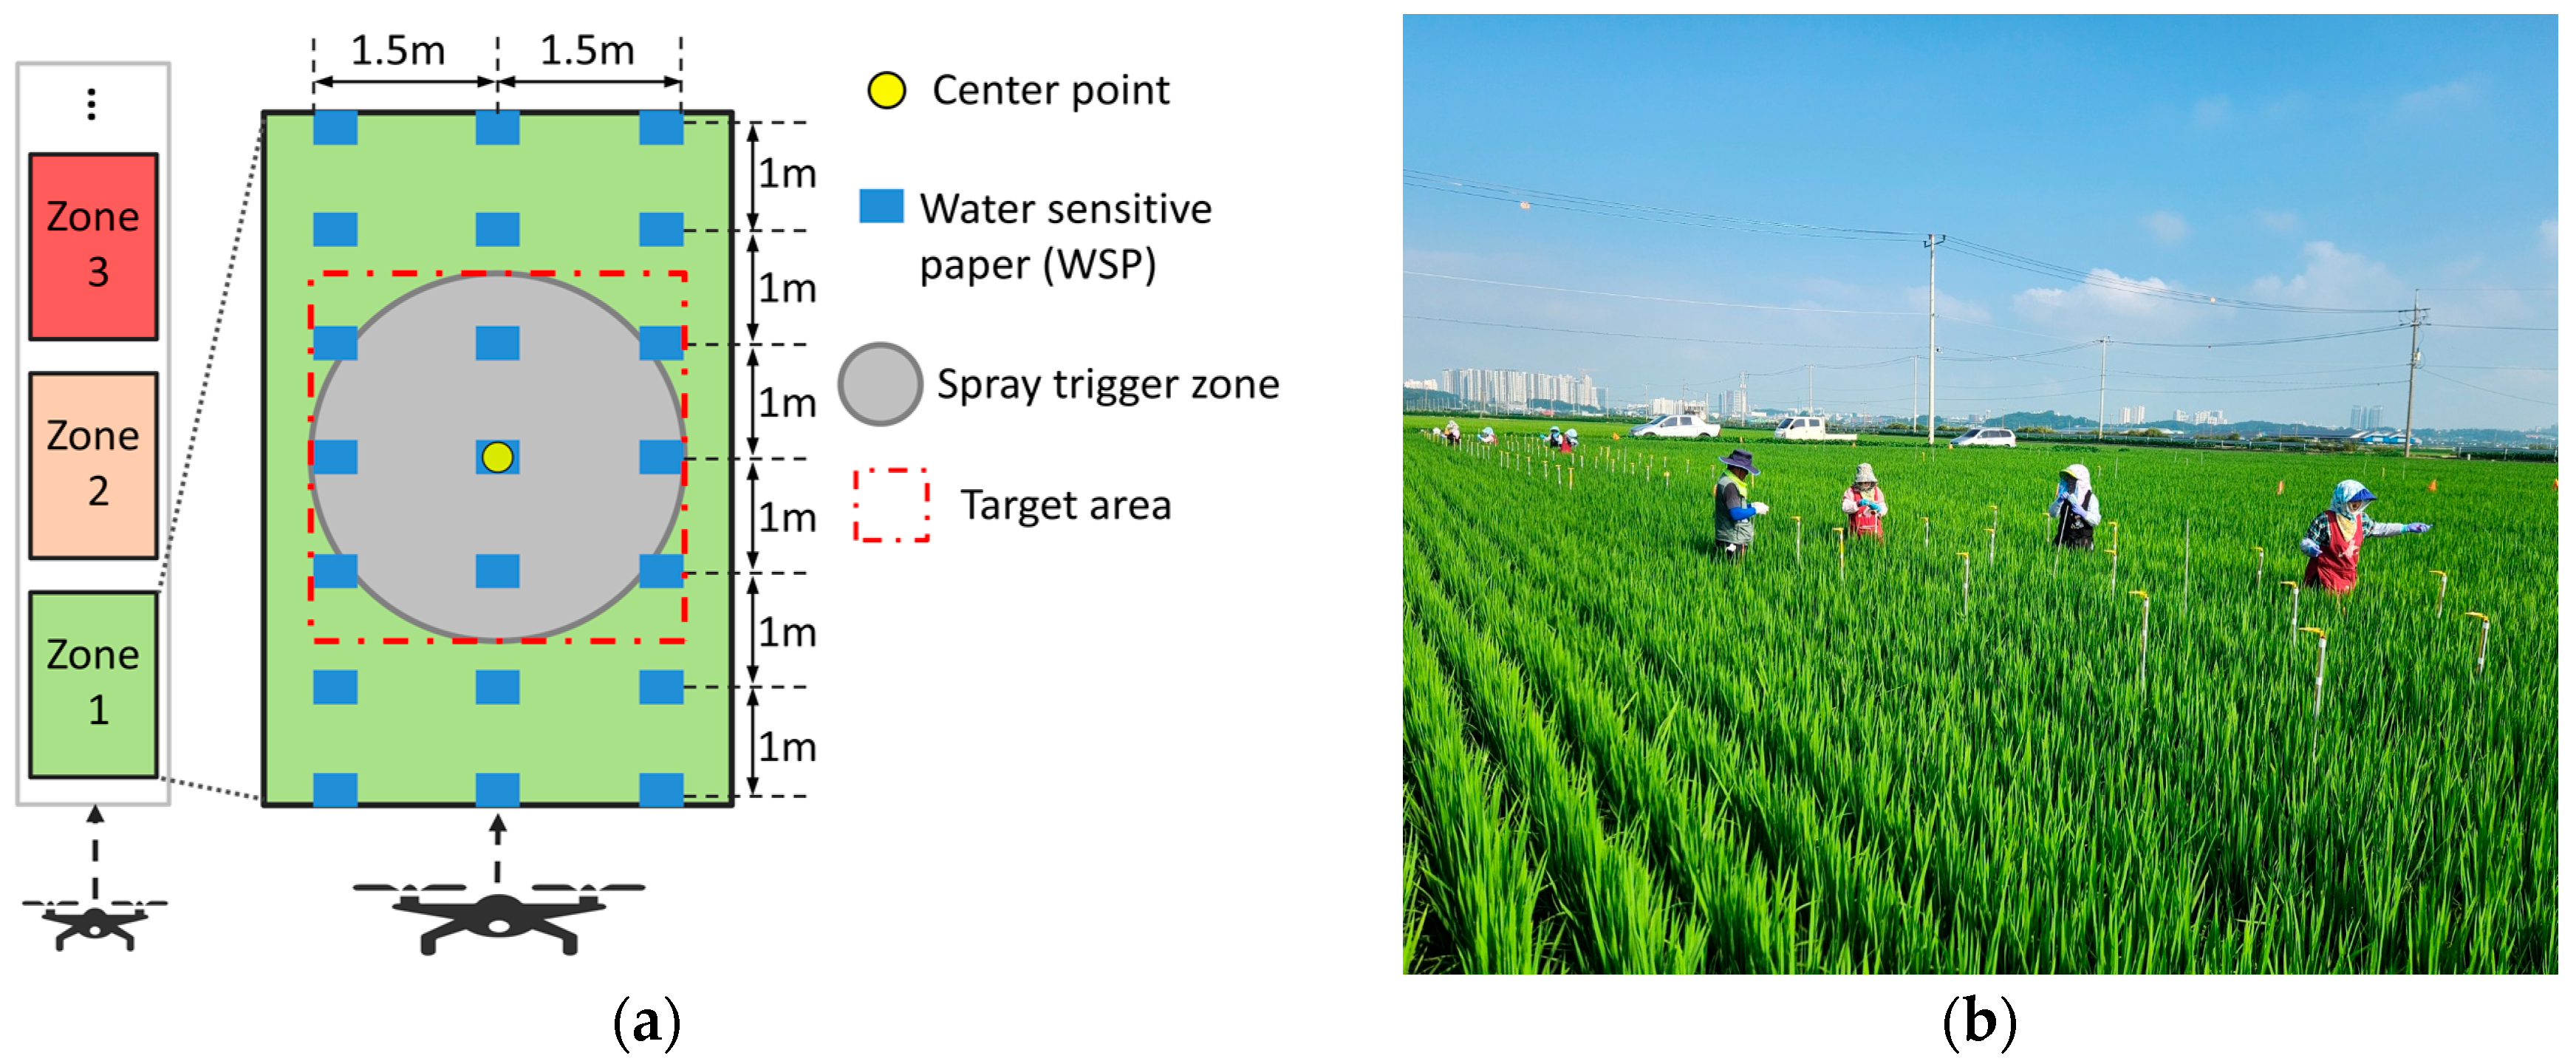
WSP sheets were deployed across the rice field to evaluate spray deposition and droplet distribution characteristics (Figure 5a). The 100 m straight flight path was divided into nine spraying zones, each 6 m long, with a 5 m buffer between adjacent zones to reduce cross-contamination. Within each designated spray zone, WSP sheets were arranged systematically in a 3-column × 7-row grid pattern centered around the target point (yellow circle) to ensure uniform coverage. The sheets in each column were spaced 1 m apart, and the columns were separated by 1.5 m, facilitating uniform coverage and spray distribution analysis. The target area (dashed red box), measuring 3 m × 3 m, corresponds to the spray trigger zone, which has a radius of 1.5 m from the center point and contains nine key measurement points to evaluate droplet deposition and spray uniformity. Additionally, WSP sheets were placed across a broader area to determine droplet dispersion trends beyond the core spray zone. WSP sheets were mounted on brackets positioned 1 m above the rice field surface, while the rice canopy height was approximately 70 cm. To minimize the influence of environmental variables on spray deposition, the field experiments were conducted under clear weather conditions (Figure 5b), with average wind speeds below 1 m/s to ensure stable and consistent trial conditions.
To ensure optimal distribution of the WSP sheets within the experimental area, a minimum spacing of 1–1.5 m between adjacent sheets was maintained. However, this layout resulted in limited spatial resolution, which restricted the level of droplet distribution details captured. To address this limitation, the original two-dimensional (2D) data were refined through cubic interpolation, a technique that enhanced spatial resolution and generated a more detailed heatmap, enabling more accurate characterization of the droplet deposition patterns (Equation (1)). Cubic interpolation is widely used for interpolating irregularly distributed multidimensional data. Given a set of scattered data points x i , y i , z i i = 1 N in a 2D space ( x , y ) , cubic interpolation constructs a cubic polynomial interpolation function P ( x , y ) within each triangle of the Delaunay triangulation:
P ( x , y ) = a 0 + a 1 x + a 2 y + a 3 x 2 + a 4 x y + a 5 y 2 + a 6 x 3 + a 7 x 2 y + a 8 x y 2 + a 9 y 3
where x and y denote the interpolation positions, and P ( x , y ) represents the estimated droplet deposition at a given coordinate ( x , y ) . The coefficients a n ( n [ 0,9 ] ) control various aspects of the interpolation function, including overall plane adjustment, inclination along the x - or y -axis, surface curvature, and gradient continuity, ensuring a smooth and accurate representation of the droplet distribution.

2.3.2. Comprehensive Statistical Analysis of Spraying Errors

To evaluate the spatial distribution of the droplets at different spray levels, the spray coverage rates on the WSP sheets placed along each UAV flight path were comprehensively analyzed. Coverage data were first extracted and grouped according to the three predefined spray levels (Levels 0, 1, and 2), enabling structured comparisons of spray deposition patterns under varying spray intensities. For each spray level, the mean coverage rate was calculated to assess general spraying efficiency. Given that the WSP sheets were arranged in three lateral columns, the coverage data also reflected the distribution of droplets across the spray width. To further characterize spatial variability, the interquartile range (IQR, 25th–75th percentile) was computed for each spray level and column. This statistical dispersion metric captured variations in deposition, offering insight into spray uniformity, directional bias, and consistency across treatments.

2.4. Experimental Analysis of Spraying System Response Errors

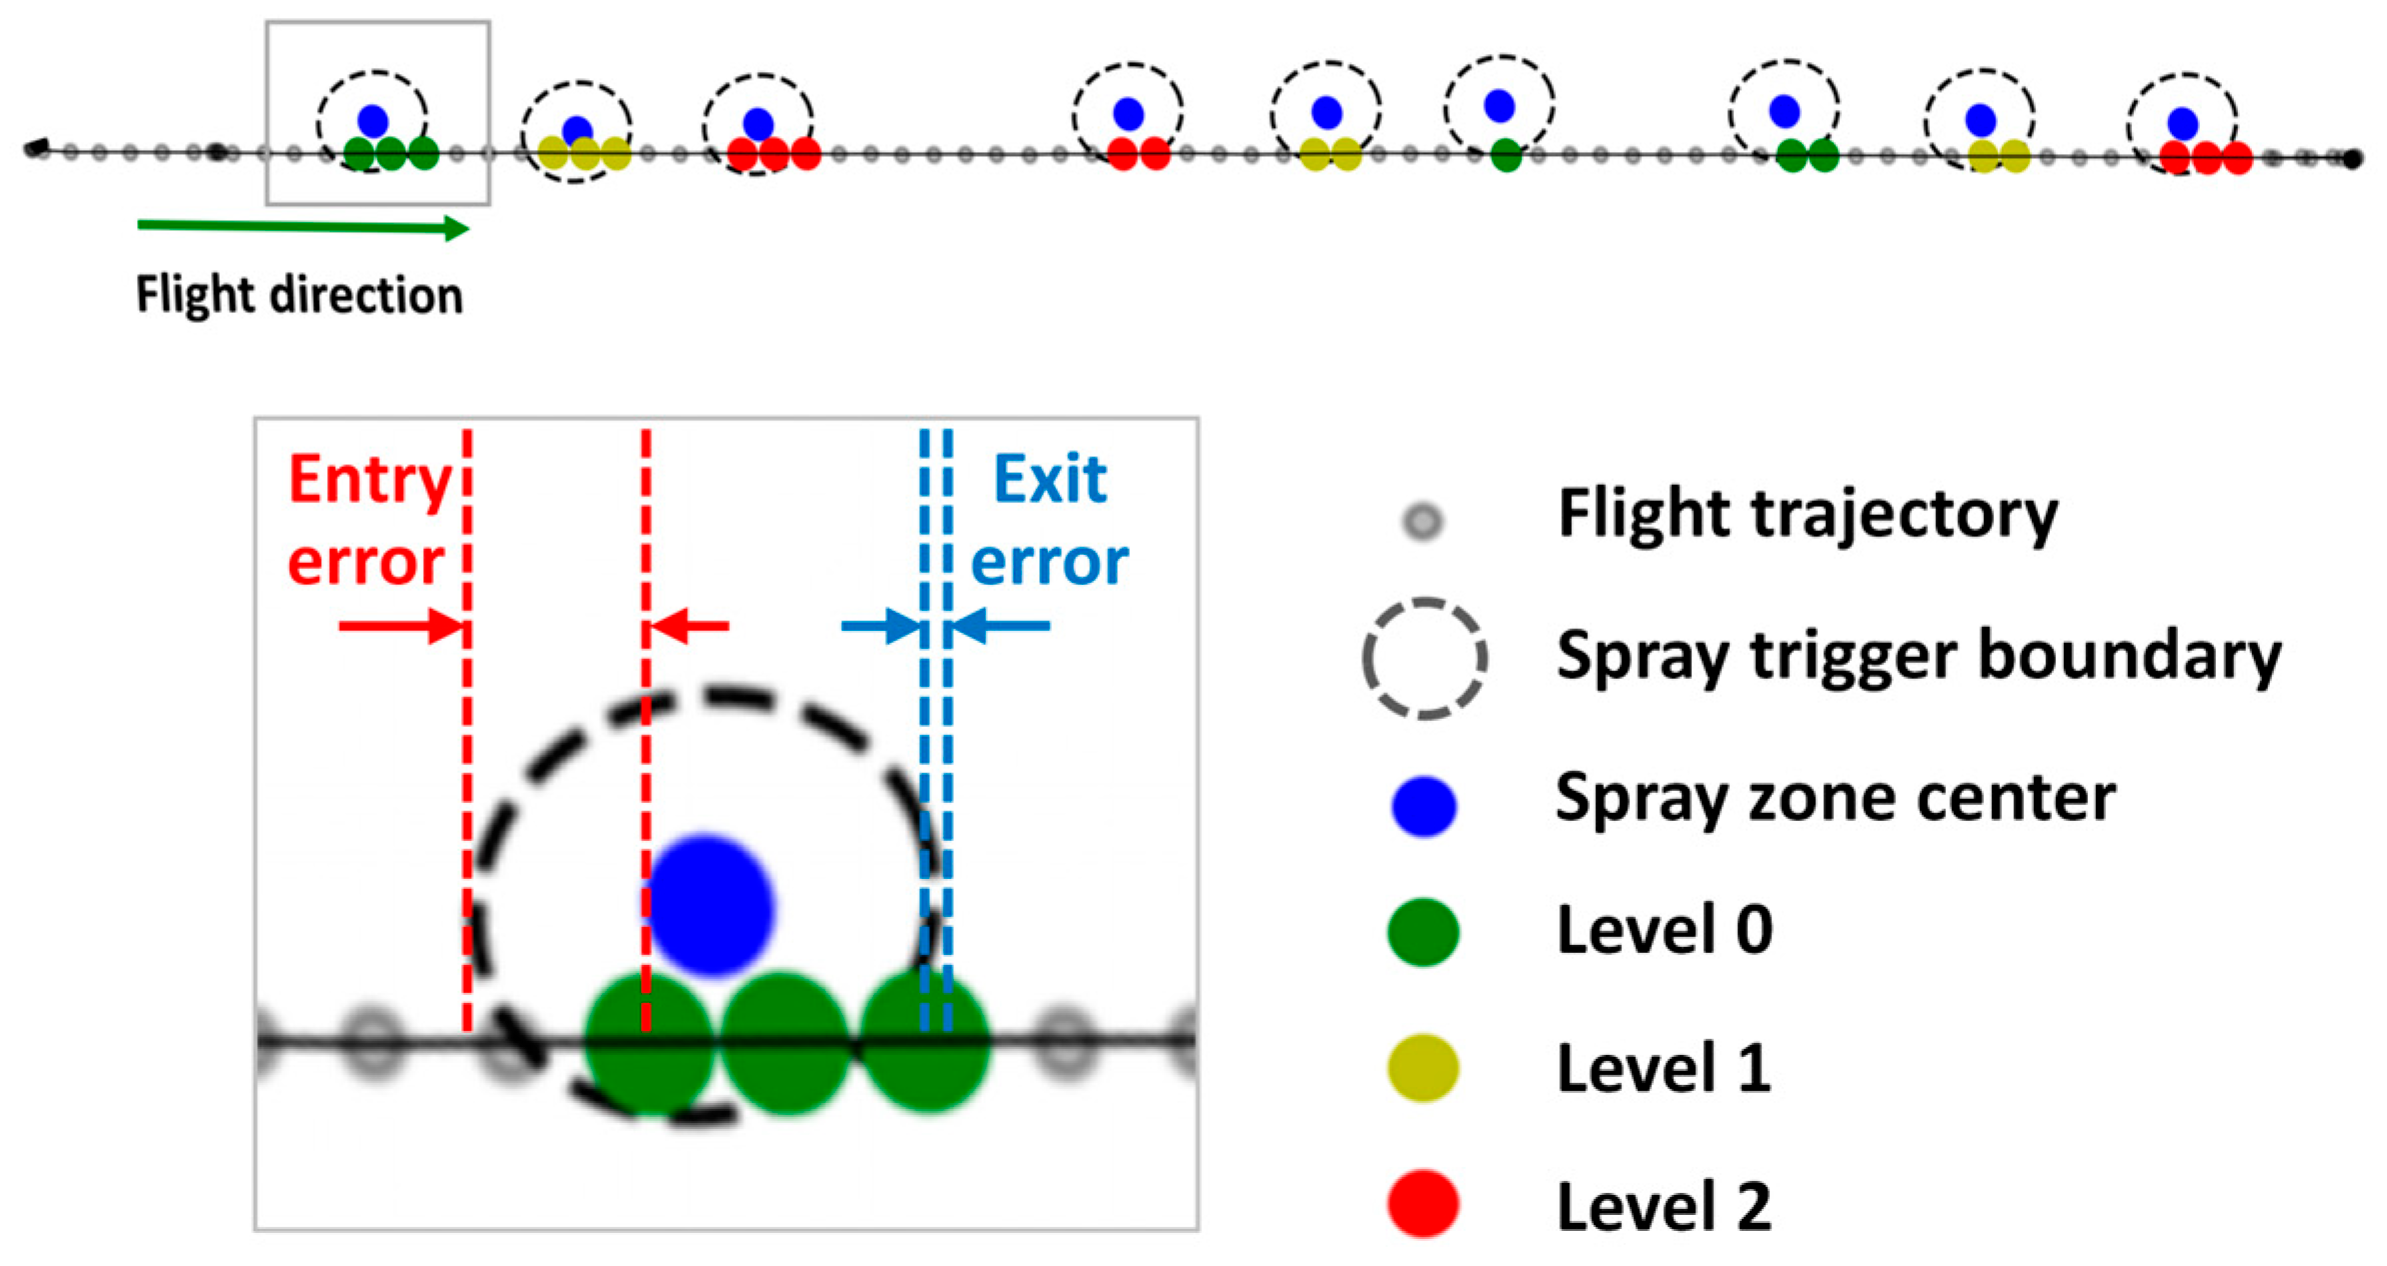
Figure 6 presents the methodology used to quantify response errors in the UAV spraying system. The predetermined spray center points of the target zones and the designated spray trigger zones are shown as blue dots and gray dashed circles, respectively. The system was designed to initiate spraying upon entering the target area and to cease spraying upon exiting it, with the spray level determined by predefined values (Level 0: green; Level 1: yellow; Level 2: red).
Under ideal conditions, the UAV should pass directly over each zone’s center. However, real-world flight paths often deviate due to measurement inaccuracies, GNSS limitations, and latency in system response (Figure 2b). To evaluate these deviations, all recorded spray trigger points were compiled and the flight trajectory was fitted to a representative flight path. The perpendicular distance between the spray trigger boundary (dashed circles) and the actual flight trajectory (gray dots) was calculated by constructing a line that was both orthogonal to the flight path and tangent to the designated trigger boundary. The intersection of this line with the boundary determined the theoretical spray start and end points. By comparing these theoretical points with the UAV’s actual spray initiation and termination along the flight direction, the entry and exit errors within each spray zone were determined. This approach enabled a precise evaluation of the UAV’s spraying accuracy and effectively identified deviations from the intended application pattern.
All raw data were initially recorded in latitude and longitude coordinates and then converted into Universal Transverse Mercator (UTM) coordinates through computational conversion. This transformation provided a consistent spatial reference system, enabling precise response error analysis. To quantify spray deviation, the baseline (expected) values were compared with the actual recorded values within each designated spray area. The difference between these values, measured along the flight direction, was used to calculate the entry and exit errors for each individual spray region. After determining the errors across all spray regions on a given flight path, the mean error for that path was computed. These path-level mean errors were then aggregated to calculate the overall average response error, offering a comprehensive assessment of the UAV’s spraying accuracy.

2.5. Analysis of Fertilizer Spraying Effectiveness

2.5.1. Evaluation Metrics for Post-Fertilization Rice Harvest

Following rice maturation, the plots treated with varying levels of graded fertilizer application were harvested separately to ensure accurate and individualized data collection. For each harvested section, the number of rice plants was recorded, and the total number of grains was counted. Subsequently, statistical analysis was conducted based on standard harvest indicators, which are summarized in Table 1.
As detailed in Section 2.2.1, rice was transplanted at a uniform density of 18 plants m−2. Based on this setup, the number of panicles per plant (NPP) was calculated using the number of grains per square meter (NGSM) and the number of grains per panicle (NGP). The grain-filling rate (GFR) was determined as the ratio of mature grains to the total grain count. Additionally, the thousand-grain weight (TGW) and the yield of white rice (YWR) were determined through direct measurement and standard yield computation methods. Collectively, these indicators offered a comprehensive evaluation of how different fertilization levels affected rice production.

2.5.2. Correlation Analysis of Rice Harvest After Fertilization

To evaluate the impact of fertilization level (FL) on rice harvest performance, data were first categorized by FL. Subsequently, Pearson correlation analysis and one-way analysis of variance (ANOVA) were conducted to examine the relationships between FL and various harvest indicators.
Pearson correlation analysis (Equation (2)) was used to assess the presence and strength of linear associations between FL and each harvest metric. The correlation coefficient ( r ) quantifies the direction and magnitude of the relationship, while the corresponding p -value indicates the statistical significance. A p -value less than 0.05 suggests that variations in FL are significantly associated with changes in the specified harvest indicator.
r = X i X ¯ Y i Y ¯ X i X ¯ 2 · Y i Y ¯ 2 t = r · n 2 1 r 2 p = 2 · P ( T > | t | )
where X i and Y i represent individual sample values of the variables X and Y , respectively. The test statistic t assesses the significance of the correlation coefficient r , and p denotes the corresponding p-value.
Subsequently, one-way ANOVA (Equation (3)) was applied to assess whether FL had a statistically significant impact on the harvest indicators. This analysis compared the mean values across different FL groups to identify any meaningful differences. The F-statistic, measuring the ratio of the variance between groups to the variance within groups, was calculated to determine whether FL exerted a significant influence on any of the harvest indicators. A p-value below 0.05 was considered statistically significant, indicating that variations in FL had a meaningful effect on the corresponding harvest indicator.
F = n k X ¯ k X ¯ 2 K 1 X i k X ¯ k 2 N K p = P F > F critical
where F is the F-statistic, p is the p-value, K is the number of groups (FL), N is the total number of observations, n k is the sample size for group k , X ¯ k is the mean value for group k , X ¯ is the overall mean for all observations, X i k is the i -th sample in group k , and P F > F critical denotes the probability of obtaining an F-value that exceeds the critical threshold, indicating statistically significant differences between groups.

3. Results

3.1. Analysis of Spray Errors and Distribution Patterns

3.1.1. Characterization of Droplet Deposition Patterns Under Different Spray Levels

Figure 7a illustrates the workflow for WSP processing and analysis. Each WSP was first photographed under uniform lighting using a dedicated imaging setup. The region of interest (ROI) was then extracted from each image to eliminate the influence of the surrounding WSP holder. Subsequently, the ROI was binarized using a predefined threshold, and the coverage ratio—defined as the proportion of black (droplet-covered) pixels—was automatically calculated by the software. Once the coverage ratio for each WSP position was determined, an interpolation-based heatmap was generated to visualize the spatial distribution of spray coverage. The red dashed box indicates the central target spray area mentioned in Figure 5a.
Figure 7b–d display representative examples of WSP coverage heatmaps at each spray level, clearly demonstrating that higher spray levels significantly improve both coverage area and deposition intensity. At Level 0 (Test1-Line1-Zone1, Figure 7b), the heatmap exhibited extremely low coverage, with minimal to no visible spray traces, indicating negligible liquid deposition. In contrast, at Level 1 (Test1-Line1-Zone2, Figure 7c), moderate spray coverage was observed, with some areas showing partial but uneven coverage. Level 2 (Test1-Line1-Zone3, Figure 7d) provided maximum coverage, exhibiting a significant increase in spray intensity compared to Level 1. The distribution at this level was more uniform, confirming that higher spray levels enhance both spray uniformity and coverage area. These findings highlight the positive correlation between spray level intensity and droplet deposition efficiency.

3.1.2. Comprehensive Statistical Analysis of Spraying Performance Across All Regions

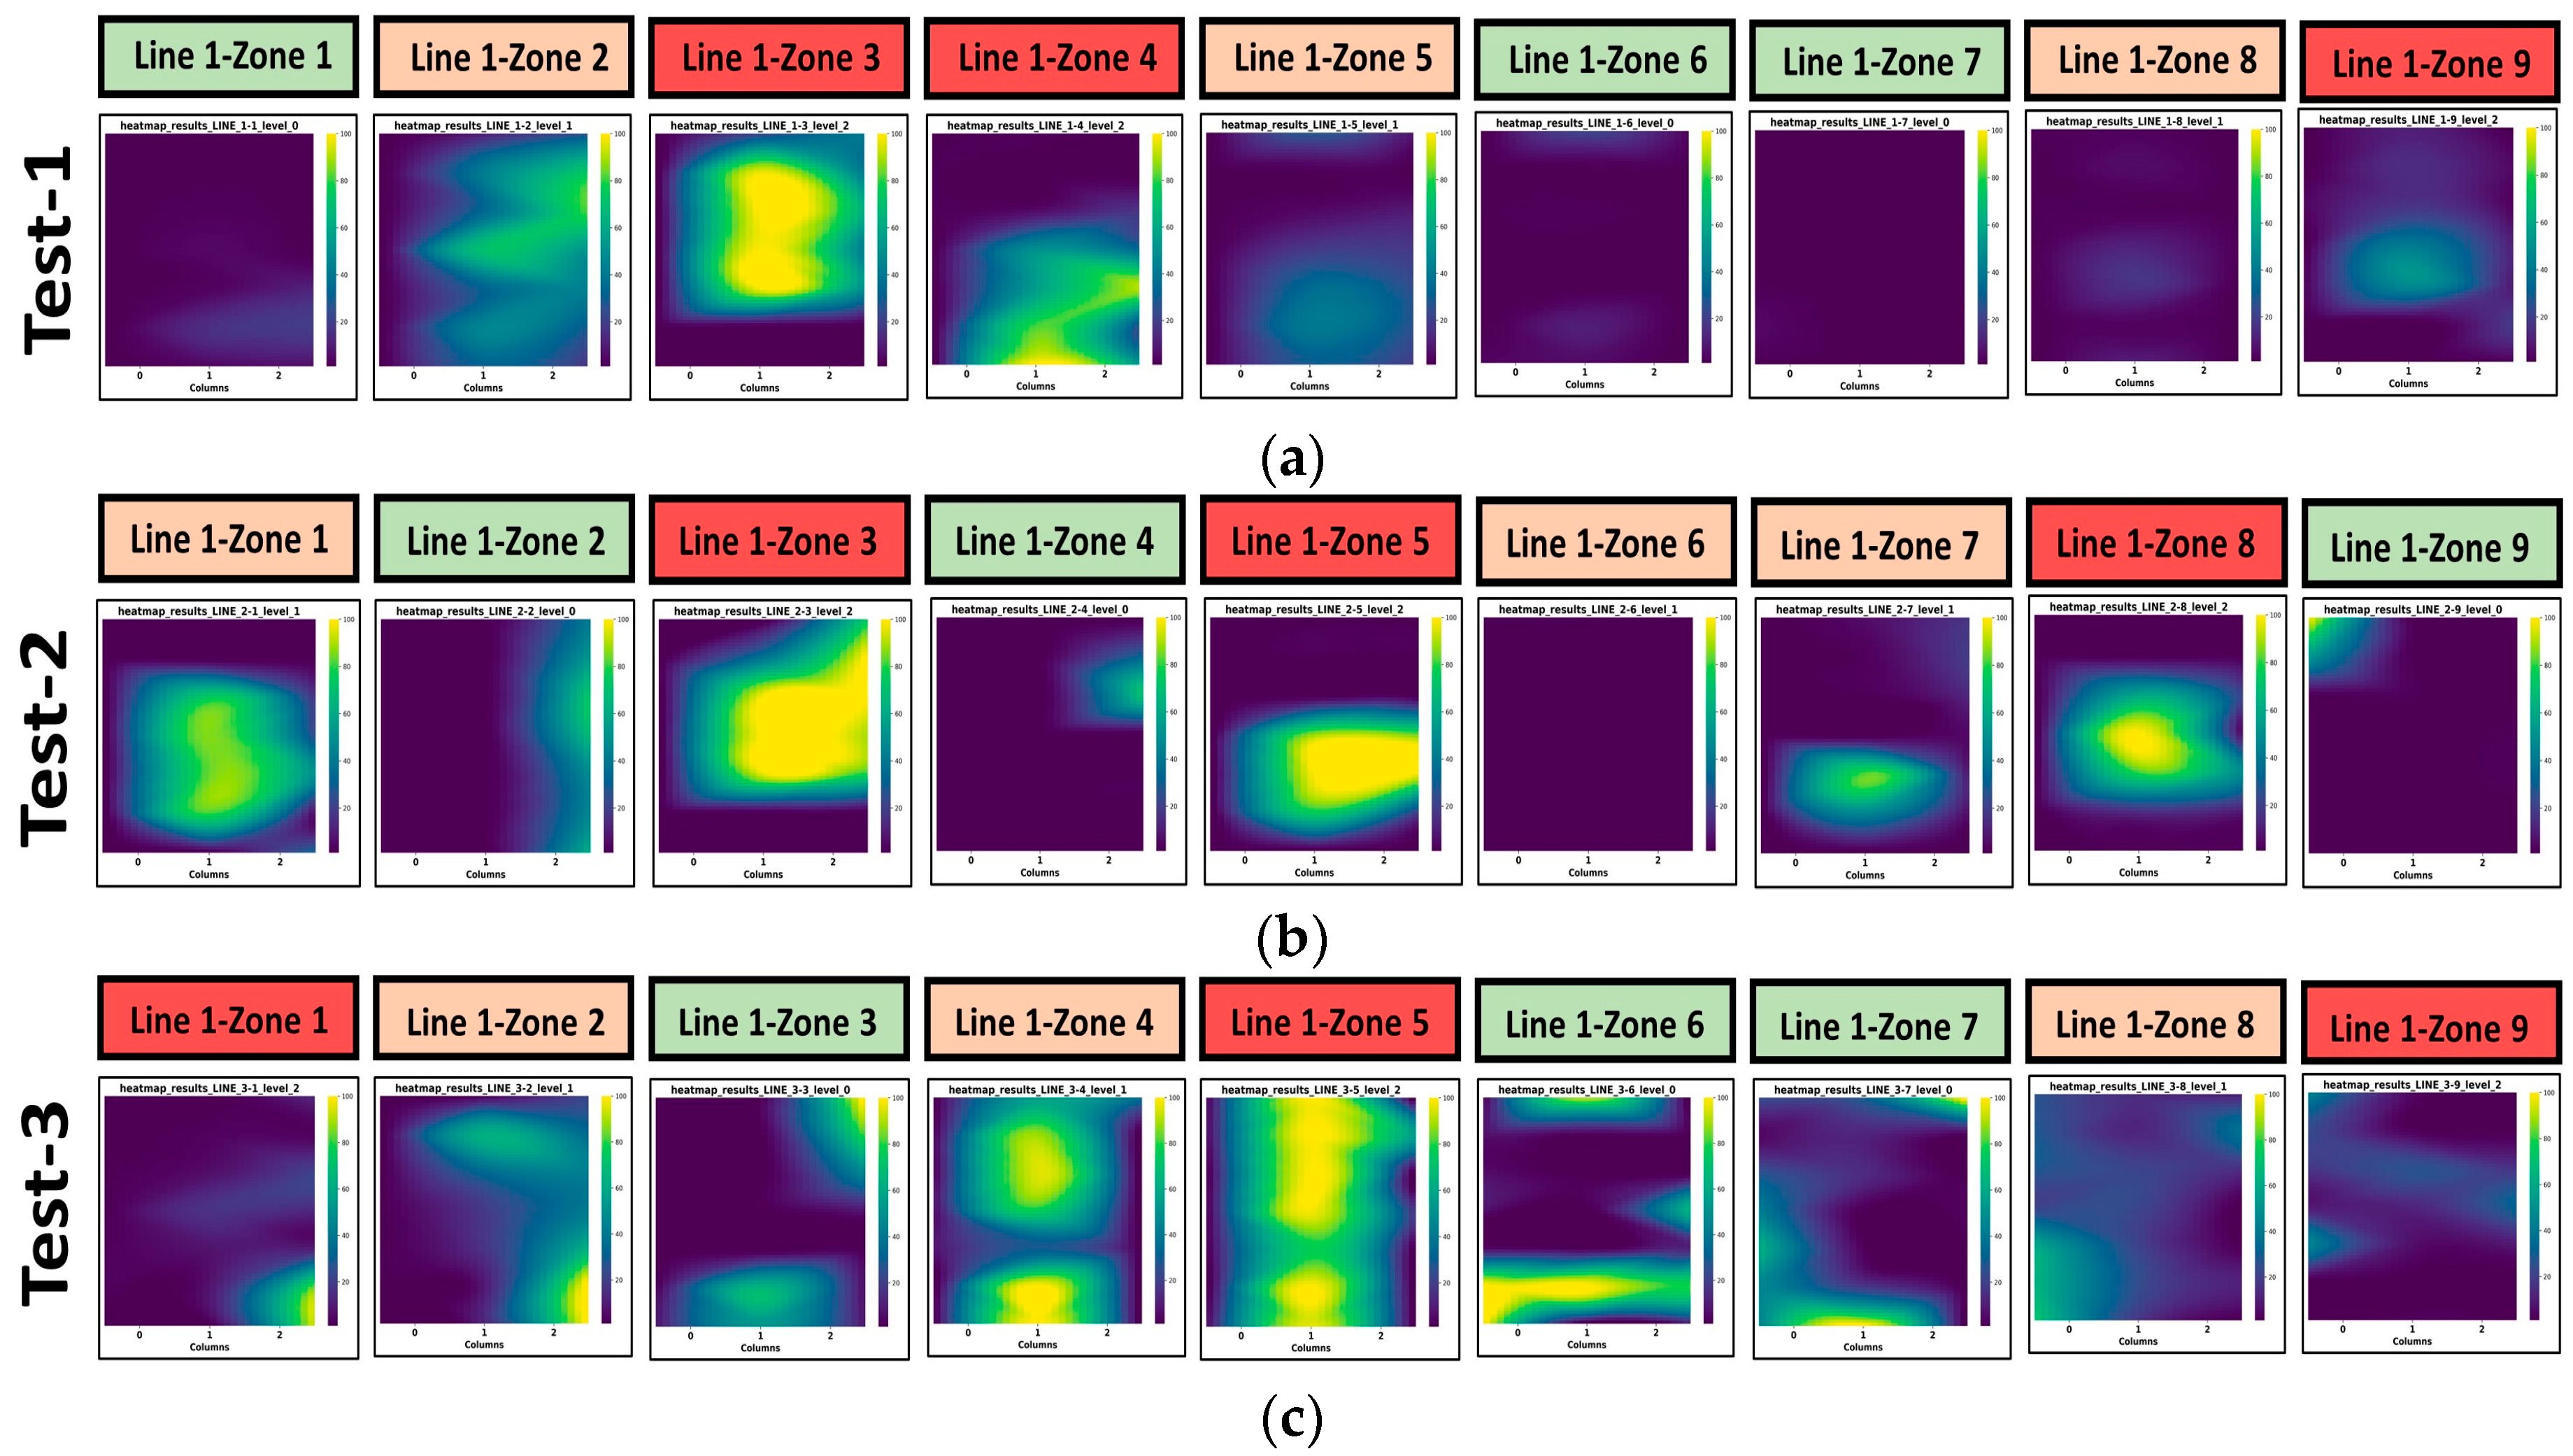
Figure 8a–c present the WSP spray coverage heatmaps under the three test conditions, providing insights into the performance and limitations of the graded spraying strategy. The analysis revealed variations in droplet deposition patterns, influenced by spray level settings, UAV trajectory deviations, and environmental factors such as wind. In Test 1 (Figure 8a), the high-spray areas (Line 1/Zone 3, Line 1/Zone 4, and Line 1/Zone 9) exhibited significant droplet deposition, with noticeable concentrations in the central regions. However, in Line 1/Zone 4, the highest deposition shifted toward the edges rather than the center, suggesting spray dispersion inconsistencies. The medium-spray areas (Line 1/Zone 2, Line 1/Zone 5, and Line 1/Zone 8) showed moderate coverage, although Line 1/Zone 8 demonstrated localized under-deposition, likely due to spray timing errors or wind-induced drift. The no-spray areas (Line 1/Zone 1, Line 1/Zone 6, and Line 1/Zone 7) displayed minimal deposition, indicating that the spray-control system largely adhered to the preset spraying parameters. In Test 2 (Figure 8b), the high-spray areas (Line 1/Zone 3, Line 1/Zone 5, and Line 1/Zone 8) continued to exhibit strong liquid deposition, particularly Line 1/Zone 3, where spray distribution appeared more concentrated compared to Test 1. However, in Line 1/Zone 5, high-intensity spraying shifted slightly from the center, suggesting minor UAV trajectory deviations. Medium-spray areas (Line 1/Zone 1 and Line 1/Zone 7) demonstrated improved coverage relative to Test 1, although Line 1/Zone 1 exhibited a slight rightward shift. As expected, the no-spray areas (Line 1/Zone 2, Line 1/Zone 4, and Line 1/Zone 9) maintained minimal deposition.
In Test 3 (Figure 8c), the high-spray areas (Line 1/Zone 1, Line 1/Zone 5, and Line 1/Zone 9) displayed varied droplet deposition patterns. Line 1/Zone 5 displayed a particularly concentrated and uniform spray distribution, suggesting effective coverage. In contrast, Line 1/Zone 1 and Line 1/Zone 9 exhibited weaker and more uneven deposition. The medium-spray areas (Line 1/Zone 2, Line 1/Zone 4, and Line 1/Zone 8) demonstrated moderate coverage, although irregular distribution was evident in Line 1/Zone 4, and edge weaknesses were observed in Line 1/Zone 8, likely due to spray drift or timing delays. The no-spray areas (Line 1/Zone 3, Line 1/Zone 6, and Line 1/Zone 7) again displayed minimal deposition, confirming the effectiveness of the spray-control system; however, a slight unintended deposition was observed in Line 1/Zone 3 and Line 1/Zone 6, suggesting minor spray drift or UAV path inconsistencies.
Despite the overall effectiveness of the graded spraying strategy, several operational challenges persisted:
(1)
Non-uniform deposition: Across the three tests, droplet distribution was concentrated in certain regions instead of being evenly dispersed.
(2)
Inconsistent coverage in medium-spray zones: Coverage gaps and irregularities were frequently observed, likely due to wind effects or flight path deviations.
(3)
Unintended droplet dispersion in no-spray areas: Trace deposition outside designated spray zones suggests minor spray drift.
These findings underscore the importance of further optimizing UAV flight stability, spray timing synchronization, and environmental monitoring to maximize uniformity and minimize spray errors in precision agriculture.
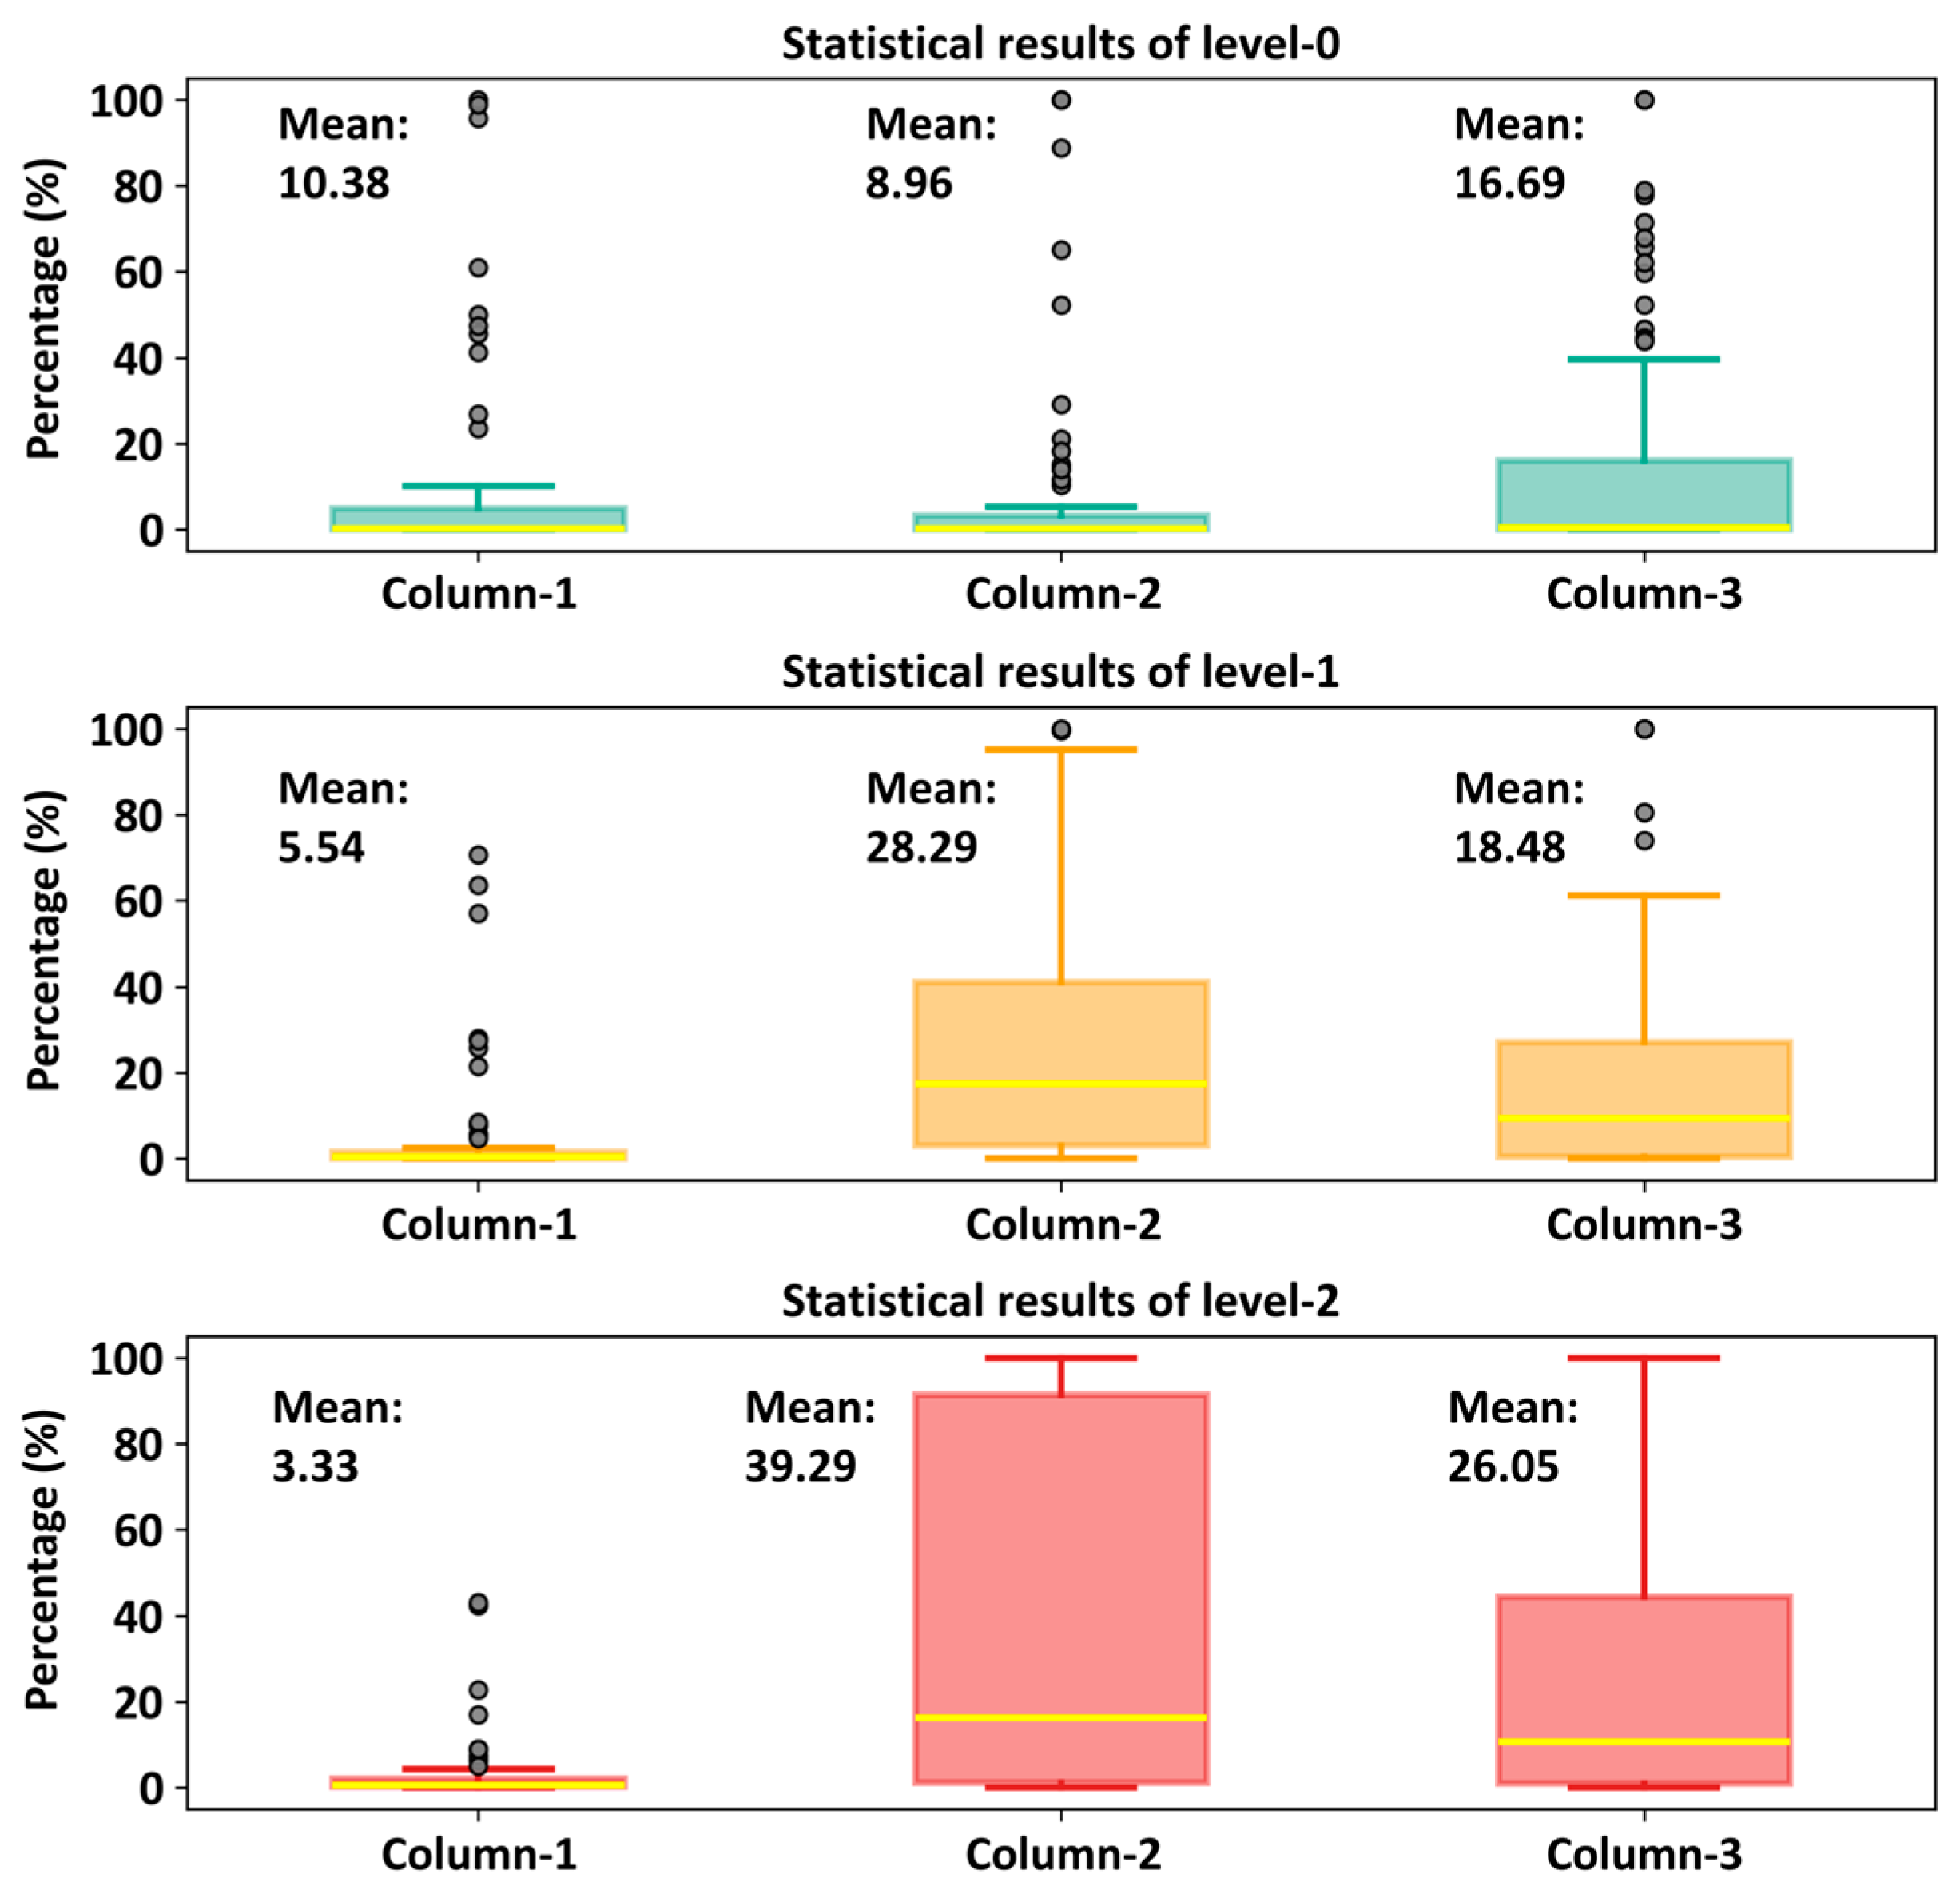
Figure 9 and Table 2 present the statistical parameters of WSP coverage across the three columns and spray levels. The results confirm the effectiveness of the graded spraying strategy, showing that higher spray levels consistently provide greater coverage than lower levels. Coverage increased progressively with the spray level. At Level 0, in the no-spray areas, coverage remained minimal, with mean values of 10.38% (Column 1), 8.96% (Column 2), and 16.69% (Column 3). The average IQR of 0.04–8.06% suggests that the system maintained precise spray control, minimizing unnecessary deposition. While minor spray drift at the boundaries may have caused slight unintended deposition, the system largely restricted coverage in the no-sprayed zones. At Level 1, coverage was more evenly distributed, especially in Columns 2 and 3, where mean coverage rates were 28.29% and 18.48%, respectively. The IQR (1.13–23.2%) indicated moderate variation, suggesting reasonably uniform coverage within medium-spray zones. Column 1, with a mean coverage of 5.54%, exhibited lower coverage than expected, possibly due to lateral deviation in droplet deposition. Level 2 (high-spray zones) exhibited markedly higher deposition, with Column 2 averaging 39.29% and some areas exceeding 90%. However, a wide IQR (0.75–45.94%) and pronounced lateral bias in Columns 3 (26.05%) and 1 (3.33%) indicate uneven distribution, highlighting potential instability at high spray intensities under field conditions.
Across all spray levels, the coverage exhibited a directional bias, with spray intensity concentrated on the right-hand side (Column 3), consistent with trajectory deviations observed in the flight path data. This shift is likely due to system asymmetry or environmental factors such as wind drift during the tests. Even at Level 0, the lowest average coverage across Columns 1, 2, and 3 was ~9%, suggesting that system response delays and droplet drift contributed to unintended deposition errors. These findings emphasize the need for optimizing the UAV’s spray timing, trajectory stability, and environmental resistance to minimize spray drift and maximize coverage precision.

3.2. Comprehensive Analysis of Spraying System Response Errors

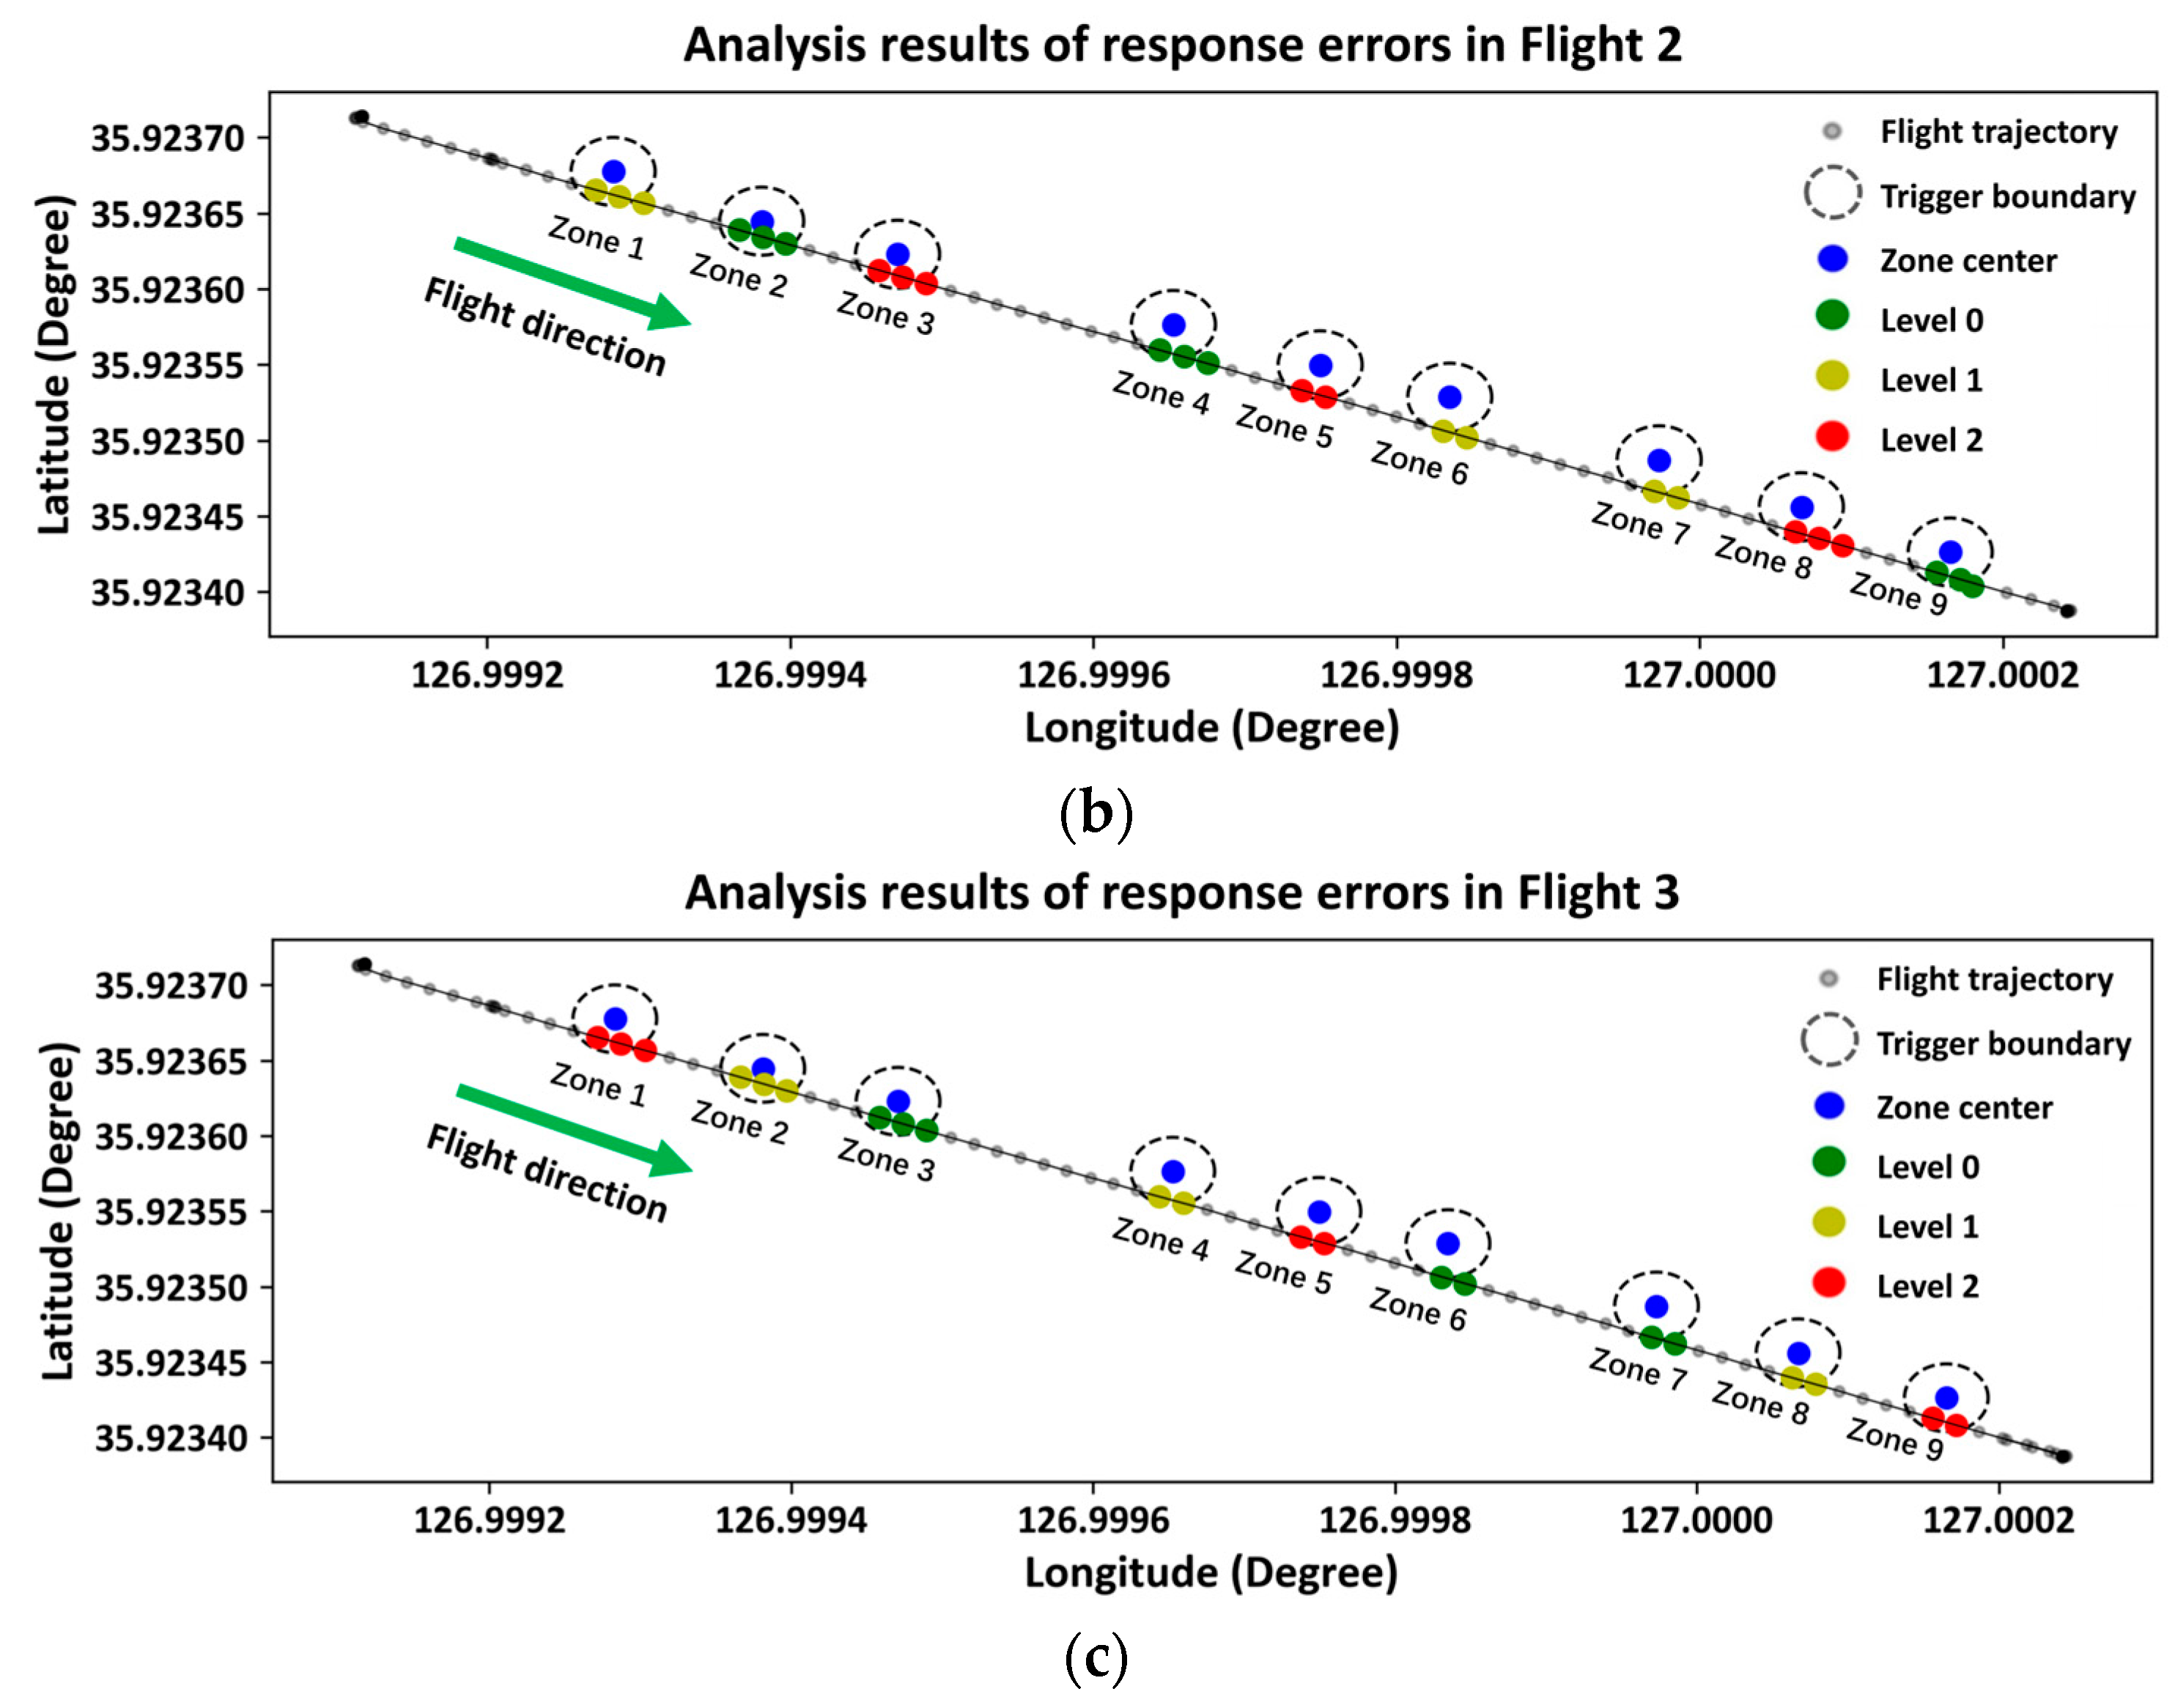
Figure 10 illustrates UAV flight trajectories across three trials (Flights 1, 2, and 3), showing the predefined spray trigger zones (dashed circles), actual spray point distributions for the three spray levels (green, yellow, and red for Levels 0, 1, and 2, respectively), and GNSS-tracked flight paths (gray points). Overall, while the UAV’s flight trajectory remained largely stable, slight rightward deviations from the center (blue point) were consistently observed within each spray zone, indicating minor but systematic lateral shifts. These deviations likely contributed to spray misalignment and uneven droplet distribution, consistent with the lateral bias identified in Section 3.1.2. In high-spray-intensity regions (Level 2, red points), some spray points shifted rearward along the flight direction, failing to align precisely with zone centers. This pattern suggests a delay in the UAV’s spray system activation, causing misalignment between the intended and actual spray locations. Additionally, variations in spray distribution were evident across the flight trials. For example, in Flight 3 (Figure 10c), high-spray areas showed a denser but more scattered pattern, indicating reduced targeting precision. In contrast, Flight 2 (Figure 10b) demonstrated a more uniform spray point distribution with fewer deviations, suggesting better control and accuracy.
Table 3 presents the spatial deviation characteristics of the spray zones, detailing entry and exit errors across three spray levels and flight trials. Variations in spray accuracy were assessed sequentially from Zone 1 (flight start point) to Zone 9 (flight end point). On average, the UAV exhibited entry errors between 0.8 and 1.0 m across the three flights, primarily attributed to system response delays. Zones 6 and 8 showed particularly pronounced deviations, with entry errors exceeding 1.3 m—likely resulting from a combination of system latency, flight inertia, and corrective maneuvers, all of which impeded precise spray initiation. Exit errors, by comparison, were consistently lower, suggesting improved stability in spray termination. Notably, the average exit error in Flight 3 (0.5586 m) was 28.6% lower than that in Flight 1 (0.7823 m), reflecting enhanced termination accuracy—potentially due to adaptive control learning or greater flight consistency over time. Despite this improvement, high-spray-intensity zones such as Zone 8 still recorded substantial deviations, including a maximum exit error of 2.0803 m. This indicates that, under elevated spray demands, trajectory instability and response delays continued to impair spray precision. These findings underscore the need to refine trajectory-correction algorithms and synchronize spray timing more effectively to reduce spatial deviation and ensure uniform application.

3.3. Correlation Analysis of Post-Fertilization Rice Harvest Outcomes

3.3.1. Analysis of Harvest Metrics

Table 4 summarizes the harvest indicators—NPP, NGP, NGSM, GFR, YWR, and TGW—under varying FLs. As the spray level increased, the harvest characteristics exhibited distinct trends. For the no-spray zone (FL = 0), the average NPP was 14.1, while NGP and NGSM were 101–116 grains and 25,153–30,756 grains/m2, respectively. Additionally, GFR, YWR, and TGW were 0.80–0.83, 439–526 kg/10a, and 27.4–28.0 g, respectively.
For the medium-spray zone (FL = 1), NPP remained similar to that for FL = 0, while NGP and NGSM showed a slight decrease. Specifically, NGSM fluctuated between 26,236 and 28,793 grains/m2, suggesting improved uniformity in grain density. GFR increased slightly, peaking at 0.87, while YWR reached a maximum of 561 kg/10a. Additionally, TGW peaked at 28.2 g, reflecting a modest increase in yield under moderate spray levels.
In the high-spray zone (FL = 2), the average NPP declined slightly to 13.9, compared with 14.1 in FL = 0. NGP and NGSM ranged from 101 to 121 and 25,680 to grains/m2, respectively. GFR peaked at 0.88, indicating improved grain-filling efficiency, while YWR reached 506–624 kg/10a, suggesting that higher spray levels may enhance yield. TGW remained relatively stable across all high-spray zones, ranging from 28.1 to 28.4 g.
Overall, these results indicate that increasing the spray levels enhances yield-related traits, indicating GFR, TGW, and YWR. However, this benefit is accompanied by a slight reduction in NPP in high-spray zones, suggesting a trade-off: improvements in grain-filling efficiency and grain weight may occur at the expense of fewer productive panicles, potentially due to localized over-application or physiological stress.

3.3.2. Correlation Analysis Between Fertilizer Application Rate and Harvest Outcomes

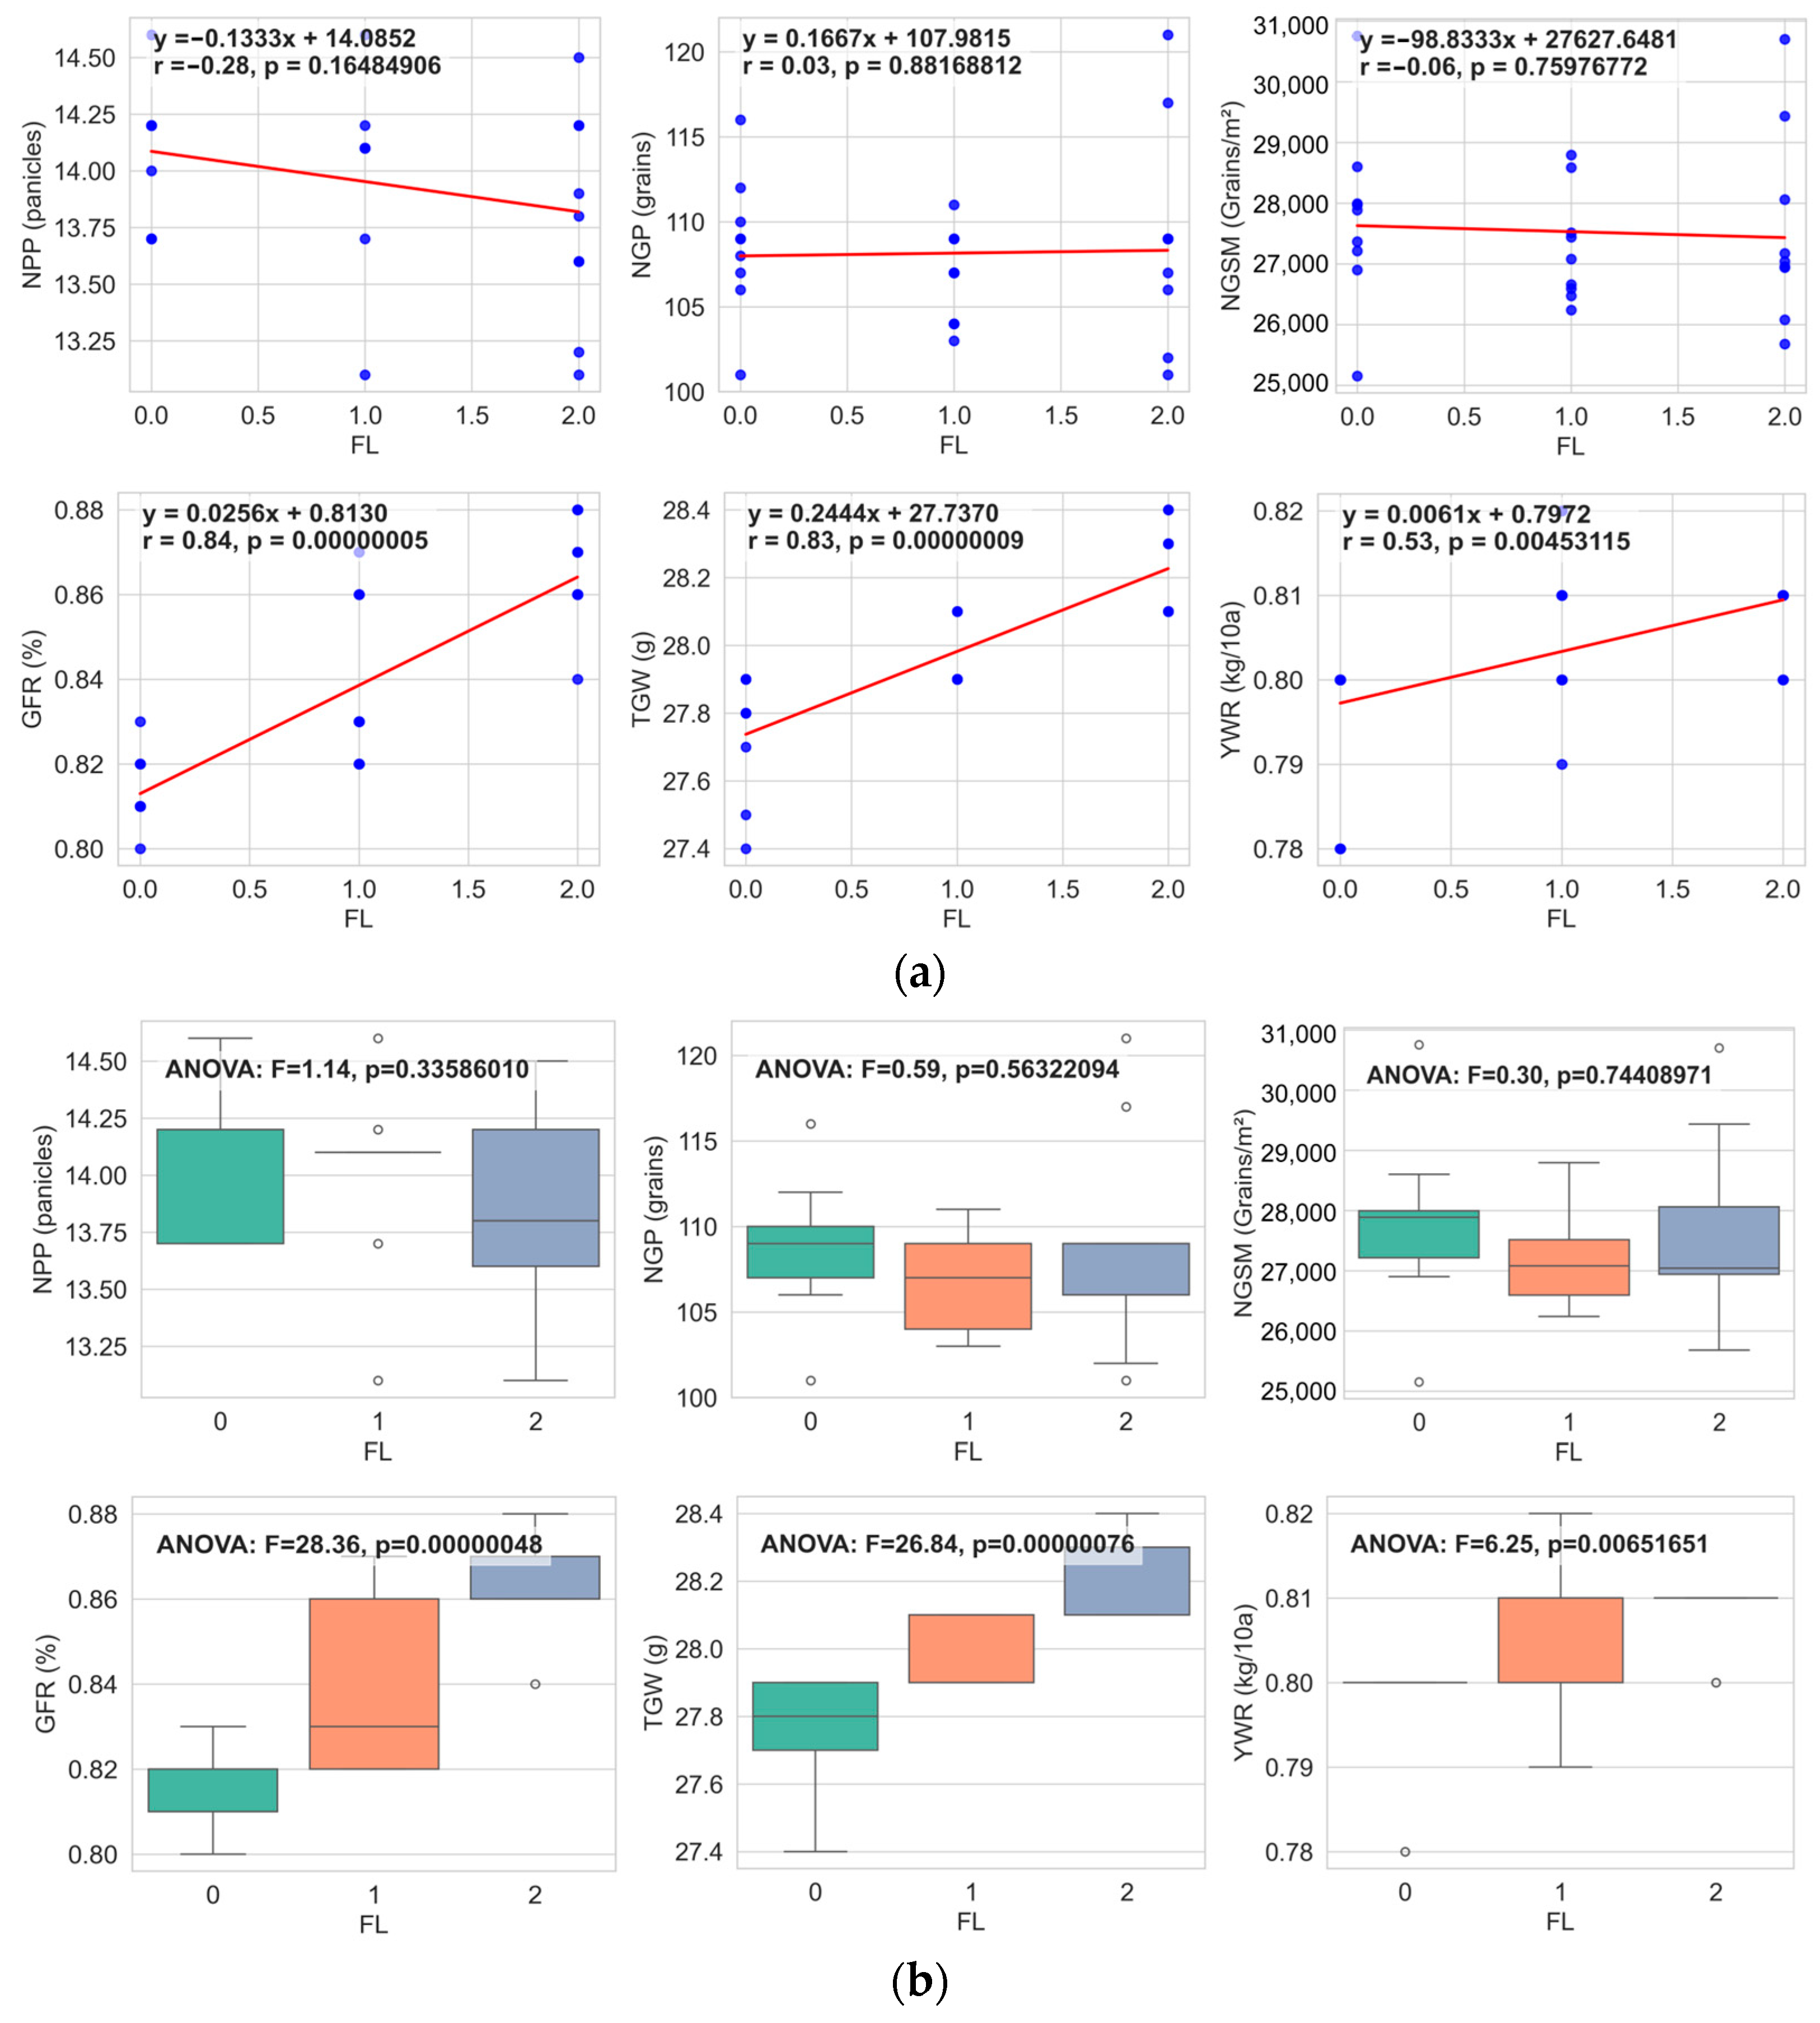
Figure 11 and Table 5 summarize the Pearson correlation and ANOVA results for rice harvest indicators in relation to FL. Figure 11a presents scatter plots and fitted regression lines that illustrate the varying responses of the indicators to increasing spray levels. NPP exhibited a slight negative correlation (r = −0.28, p = 0.1648), suggesting a minor decline with higher FL, though this effect was not statistically significant (p > 0.05). Similarly, NGP (r = 0.03, p = 0.8817) and NGSM (r = −0.06, p = 0.7598) exhibited weak correlations with FL, indicating minimal response to spray level variations. In contrast, GFR (r = 0.84) and TGW (r = 0.83) exhibited strong positive correlations with FL, with p-values far below 0.01, confirming that increased spray levels significantly enhanced grain filling and grain weight. YWR showed a moderate positive correlation (r = 0.53, p = 0.0045), suggesting that higher FLs contributed to increased rice yield, though the effect was less pronounced than that observed for GFR and TGW. The regression lines in Figure 11a are presented only as visual guides to illustrate trends; given the limited number of groups and small sample size, the statistical robustness of these regressions is constrained.
The one-way ANOVA results (Figure 11b) further support these findings by quantifying the statistical significance of the effects of spray levels on harvest indicators. NPP, NGP, and NGSM exhibited relatively low F-values (1.14, 0.59, and 0.30, respectively) with non-significant p-values (p > 0.05), indicating that the spray level did not significantly influence these indicators. Conversely, GFR and TGW displayed high F-values (28.36 and 26.84, respectively) with extremely low p-values (p < 0.000001), confirming that higher spray levels significantly improved GFR and TGW. YWR also exhibited a notably high F-value of 6.25 (p = 0.0065), further supporting the positive effect of increased spray intensity on yield. Overall, the ANOVA results aligned closely with the Pearson correlation data, confirming that higher spray levels positively influenced grain development and final yield, with minimal impact on NPP, NGP, and NGSM.

4. Discussion

UAV spraying has emerged as a key technology in smart agriculture, offering ease of operation, strong adaptability, and precision for efficient application of fertilizers and PPPs. This study presents a modular, cost-efficient, and autonomous spraying system designed to overcome real-world challenges. It employs a zone-level, target-distance-triggered spray model, enabling effective zone-based management through the use of prescription maps. In contrast to conventional systems that rely on continuous spraying or tight integration with UAV flight controllers, the developed system enables real-time spray-level differentiation using positional logic. This enhances adaptability to variable field zones while reducing agrochemical waste. Additionally, the design supports retrofit compatibility with existing UAV platforms, making it both cost-effective and widely applicable. In contrast to prior work [24], which provided only a preliminary validation of the model under simulated conditions, this study extends the approach to large-scale field deployment and assesses its performance under real-world environmental disturbances.
A comprehensive field experiment was conducted to assess the system’s performance, identifying both its strengths and areas for improvement. The experimental results demonstrated that the system supported multi-level spraying (Levels 0, 1, and 2) in large-scale precision spraying scenarios, effectively meeting the fine-grained requirements of agricultural UAVs. Fertilizer-spraying trials further indicated that this graded strategy had a moderately positive effect on rice yield, confirming the agronomic potential of differentiated spraying. These findings validate the system’s feasibility for transitioning from a conceptual model to a field-ready technology.
However, several sources of performance limitations and spraying errors were identified, stemming from both the system architecture and operating conditions. First, the control unit, which utilized a cost-effective RPI and operated at a limited GNSS update rate (1 Hz), lacked sufficient computational power and temporal resolution, leading to delays in position updates and spray control. Second, the UAV used in this study lacked RTK-enabled navigation, restricting its path control precision. Although the spraying control unit incorporated RTK positioning, it was only used to detect spray zone entry rather than to guide flight, contributing to positioning deviations. These factors were the primary causes of longitudinal entry/exit offsets and the observed lateral rightward bias. Finally, environmental factors such as wind, rotor-induced airflow, and turbulence contributed to spray drift, affecting overall deposition uniformity.
To address the identified issues and enhance spraying accuracy, several technical improvements are recommended:
(1)
Higher-performance embedded platforms: Replacing the RPI with a more powerful unit would reduce computational latency and enhance the accuracy of real-time spraying decisions.
(2)
Higher GNSS sampling frequency: Increasing the GNSS sampling rate to 5 Hz or higher, along with short-term trajectory corrections using inertial measurement unit sensors, would help compensate for UAV path deviations [25].
(3)
Wind-resistant control mechanisms: A real-time wind-adaptive spraying model that adjusts spray parameters based on wind speed and direction would improve spray uniformity [26].
(4)
Optimized nozzle design: Implementing adjustable spray angles or wind-field-compensation nozzles could reduce wind-induced spray drift, improving spray precision [27,28,29].
(5)
Airflow sensor integration: Incorporating real-time airflow sensors into the system would further strengthen spraying strategies, improving droplet stability in varying environmental conditions.
Building upon previous work by Hanif et al. [23] and Wang et al. [24], this study implemented a dual-pump spraying mechanism capable of delivering three discrete spray levels. This design was chosen for its simplicity, compatibility with the modular platform, and reliable performance under field conditions. Prior studies have shown that a three-level control strategy effectively supports zone-based differentiation and aligns well with the region’s commonly used three-level prescription maps. While the proposed system currently supports both CV-based uniform spraying and zone-based graded spraying strategies, real-world agricultural applications often require finer control over spray intensity. Advanced spraying systems typically use pulse-width modulation (PWM) signals to regulate spray flow, achieving greater precision. Future research could focus on the following techniques:
(1)
Increasing PWM resolution: Expanding the number of PWM levels from 3 to 5 or 10 would enable more refined adjustments to spray levels [30].
(2)
AI-driven dynamic spray adjustments: Integrating real-time AI-based predictions could enable automated fine-tuning of spray levels based on crop conditions and environmental factors [31].
(3)
Exploring pressure-regulated spray technologies: Combining variable-pressure spraying with prescription maps could further enhance spraying efficiency and reduce agrochemical waste.
In this study, WSP was employed as a practical tool for evaluating spray performance, selected for its low cost, ease of deployment, environmental friendliness, and ability to visually capture spatial spray distribution. Previous research by Lee et al. [32] introduced a method for estimating droplet coverage from field-acquired WSP images, highlighting its potential for rapid, on-site assessment. Despite these advantages, WSP has inherent limitations in accurately quantifying spray deposition volume. To address this, future studies may benefit from integrating WSP analysis with complementary techniques such as fluorescent tracers to enhance measurement accuracy and reliability.
It should be noted that the field experiments were conducted under simplified conditions, including straight-line flight paths and calm weather with wind speeds below 1 m/s. These settings were intentionally chosen to minimize environmental variability and assess the baseline performance of the proposed spraying system. However, practical agricultural UAV operations often involve more complex flight trajectories, turning maneuvers, variable wind conditions, and diverse crop types. Future studies should therefore evaluate the system under realistic scenarios and include control groups, such as manual spraying, to comprehensively validate its robustness and adaptability.
Overall, the developed autonomous spraying system demonstrates strong potential for precision and multi-level spraying in agricultural UAV applications. Its modular design and real-time decision-making capabilities differentiate it from traditional systems. The graded spray control and proposed improvements offer a practical path to cost-effective, intelligent UAV spraying. Field validation demonstrated that zone-based spraying with positional awareness can promote more sustainable fertilizer use and enhance crop yields. However, further optimization is necessary to enhance error control, spray uniformity, and the granularity of spray levels. To maximize the effectiveness and reliability of UAV-based smart spraying technology, future research should focus on integrating higher-performance computing units, refining UAV path control, and improving environmental adaptability. Additionally, future studies should prioritize optimizing droplet descent under rotor-induced airflow and integrating drift-reducing nozzles to minimize off-target spray and mitigate environmental impact. Collectively, these improvements will support the practical implementation of intelligent spraying systems in large-scale precision agriculture.

5. Conclusions

This study presents a field-level evaluation of a cost-effective, modular UAV-based auxiliary spraying system tailored for precision agriculture. The system’s performance was assessed through two key experiments: (1) spray error and response error analyses to evaluate spray uniformity and entry/exit errors, and (2) a fertilizer efficacy test to measure the system’s impact on rice harvest indicators. The spray error analysis, performed using WSP, confirmed the system’s capability for graded spraying. Droplet deposition exhibited IQRs of 0.75–45.94% at Level 2, 1.13–23.20% at Level 1, and 0.04–8.06% at Level 0. However, the entry (0.878 m) and exit (0.955 m) errors underscored the need for improved flight path accuracy and spray timing to avoid overlaps or untreated areas. The fertilizer efficacy experiment showed that higher spray levels significantly enhanced grain development metrics: GFR increased from 0.81 (FL = 0) to 0.86 (FL = 2), and TGW rose from 27.7 g to 28.2 g (p < 0.001 for both). In contrast, NPP and NGP remained largely unchanged, suggesting that precision spraying primarily promotes grain filling rather than overall plant growth. Overall, the proposed system offers a promising solution for targeted fertilizer and PPP application in UAV-based agriculture. Future research should focus on optimizing path control, refining spray timing algorithms, and enhancing environmental adaptability through sensor integration and AI-driven decision-making. These improvements will be essential to elevate spray precision, reduce environmental impact, and support the widespread adoption of intelligent UAV spraying systems in modern agriculture.

Author Contributions

Conceptualization, X.H.; methodology, X.H., Y.L. and P.W.; data curation, Y.L. and P.W.; formal analysis, Y.L. and P.W.; visualization, Y.L. and P.W.; supervision, X.H.; writing—original draft, Y.L. and P.W.; writing—review and editing, X.H., S.-H.Y., C.-G.L., D.-H.L. and Y.-H.K. All authors have read and agreed to the published version of the manuscript.

Funding

This work was supported by the Institute of Information & Communications Technology Planning & Evaluation (IITP)—Innovative Human Resource Development for Local Intellectualization program grant funded by the Korea government (MSIT) (IITP-2025-RS-2023-00260267).

Data Availability Statement

The original contributions presented in this study are included in the article. Further inquiries can be directed to the corresponding author.

Conflicts of Interest

The authors declare no conflicts of interest.

References

  1. Yang, X.; Shu, L.; Chen, J.; Ferrag, M.A.; Wu, J.; Nurellari, E.; Huang, K. A Survey on Smart Agriculture: Development Modes, Technologies, and Security and Privacy Challenges. IEEE/CAA J. Autom. Sin. 2021, 8, 273–302. [Google Scholar] [CrossRef]
  2. Da Silveira, F.; Lermen, F.H.; Amaral, F.G. An overview of agriculture 4.0 development: Systematic review of descriptions, technologies, barriers, advantages, and disadvantages. Comput. Electron. Agric. 2021, 189, 106405. [Google Scholar] [CrossRef]
  3. Shaikh, F.K.; Karim, S.; Zeadally, S.; Nebhen, J. Recent Trends in Internet-of-Things-Enabled Sensor Technologies for Smart Agriculture. IEEE Internet Things J. 2022, 9, 23583–23598. [Google Scholar] [CrossRef]
  4. Shaikh, T.A.; Mir, W.A.; Rasool, T.; Sofi, S. Machine Learning for Smart Agriculture and Precision Farming: Towards Making the Fields Talk. Arch. Comput. Methods Eng. 2022, 29, 4557–4597. [Google Scholar] [CrossRef]
  5. Adli, H.K.; Remli, M.A.; Wan Salihin Wong, K.N.S.; Ismail, N.A.; González-Briones, A.; Corchado, J.M.; Mohamad, M.S. Recent Advancements and Challenges of AIoT Application in Smart Agriculture: A Review. Sensors 2023, 23, 3752. [Google Scholar] [CrossRef]
  6. García-Munguía, A.; Guerra-Ávila, P.L.; Islas-Ojeda, E.; Flores-Sánchez, J.L.; Vázquez-Martínez, O.; García-Munguía, A.M.; García-Munguía, O. A Review of Drone Technology and Operation Processes in Agricultural Crop Spraying. Drones 2024, 8, 674. [Google Scholar] [CrossRef]
  7. Elmeseiry, N.; Alshaer, N.; Ismail, T. A detailed survey and future directions of unmanned aerial vehicles (uavs) with potential applications. Aerospace 2021, 8, 363. [Google Scholar] [CrossRef]
  8. Huang, J.; Du, B.; Zhang, Y.; Quan, Q.; Wang, B.; Mu, L. A Pesticide Spraying Mission Allocation and Path Planning with Multicopters. IEEE Trans. Aerosp. Electron. Syst. 2024, 60, 2277–2291. [Google Scholar] [CrossRef]
  9. Li, Y.; Xu, Y.; Xue, X.; Liu, X.; Liu, X. Optimal spraying task assignment problem in crop protection with multi-UAV systems and its order irrelevant enumeration solution. Biosyst. Eng. 2022, 214, 177–192. [Google Scholar] [CrossRef]
  10. Chen, S.; Lan, Y.; Zhou, Z.; Ouyang, F.; Wang, G.; Huang, X.; Cheng, S. Effect of droplet size parameters on droplet deposition and drift of aerial spraying by using plant protection UAV. Agronomy 2020, 10, 195. [Google Scholar] [CrossRef]
  11. Zhang, P.; Liu, Y.; Du, H. An integrated framework for UAV-based precision plant protection in complex terrain: The ACHAGA solution for multi-tea fields. Front. Plant Sci. 2024, 15, 1440234. [Google Scholar] [CrossRef]
  12. Guebsi, R.; Mami, S.; Chokmani, K. Drones in Precision Agriculture: A Comprehensive Review of Applications, Technologies, and Challenges. Drones 2024, 8, 686. [Google Scholar] [CrossRef]
  13. Xu, J.; Liu, C.; Shao, J.; Xue, Y.; Li, Y. Collaborative orchard pesticide spraying routing problem with multi-vehicles supported multi-UAVs. J. Clean. Prod. 2024, 458, 142429. [Google Scholar] [CrossRef]
  14. Yallappa, D.; Kavitha, R.; Surendrakumar, A.; Suthakar, B.; Mohan Kumar, A.P.; Kannan, B.; Kalarani, M.K. Improving agricultural spraying with multi-rotor drones: A technical study on operational parameter optimization. Front. Nutr. 2024, 11, 1487074. [Google Scholar] [CrossRef] [PubMed]
  15. Liao, J.; Zang, Y.; Luo, X.; Zhou, Z.; Lan, Y.; Zang, Y.; Gu, X.; Xu, W.; Hewitt, A.J. Optimization of variables for maximizing efficacy and efficiency in aerial spray application to cotton using unmanned aerial systems. Int. J. Agric. Biol. Eng. 2019, 12, 10–17. [Google Scholar] [CrossRef]
  16. Shi, X.; Du, Y.; Liu, X.; Liu, C.; Hou, Q.; Chen, L.; Yong, R.; Ma, J.; Yang, D.; Yuan, H.; et al. Optimizing UAV spray parameters to improve precise control of tobacco pests at different growth stages. Pest Manag. Sci. 2024, 80, 5809–5819. [Google Scholar] [CrossRef]
  17. Wongsuk, S.; Qi, P.; Wang, C.; Zeng, A.; Sun, F.; Yu, F.; Zhao, X.; Xiongkui, H. Spray performance and control efficacy against pests in paddy rice by UAV-based pesticide application: Effects of atomization, UAV configuration and flight velocity. Pest Manag. Sci. 2024, 80, 2072–2084. [Google Scholar] [CrossRef] [PubMed]
  18. Shan, C.; Xue, C.; Zhang, L.; Song, C.; Kaousar, R.; Wang, G.; Lan, Y. Effects of different spray parameters of plant protection UAV on the deposition characteristics of droplets in apple trees. Crop Prot. 2024, 184, 106835. [Google Scholar] [CrossRef]
  19. Luo, S.; Wen, S.; Zhang, L.; Lan, Y.; Chen, X. Extraction of crop canopy features and decision-making for variable spraying based on unmanned aerial vehicle LiDAR data. Comput. Electron. Agric. 2024, 224, 109197. [Google Scholar] [CrossRef]
  20. Cavalaris, C.; Tagarakis, A.C.; Kateris, D.; Bochtis, D. Cost Analysis of Using UAV Sprayers for Olive Fruit Fly Control. AgriEngineering 2023, 5, 1925–1942. [Google Scholar] [CrossRef]
  21. Shahrooz, M.; Talaeizadeh, A.; Alasty, A. Agricultural Spraying Drones: Advantages and Disadvantages. In Proceedings of the 2020 Virtual Symposium in Plant Omics Sciences (OMICAS), Bogotá, Colombia, 23–27 November 2020; pp. 1–5. [Google Scholar] [CrossRef]
  22. Lan, Y.; Thomson, S.J.; Huang, Y.; Hoffmann, W.C.; Zhang, H. Current status and future directions of precision aerial application for site-specific crop management in the USA. Comput. Electron. Agric. 2010, 74, 34–38. [Google Scholar] [CrossRef]
  23. Hanif, A.S.; Han, X.; Yu, S.H.; Han, C.; Baek, S.W.; Lee, C.G.; Lee, D.H.; Kang, Y.H. Modeling of the control logic of a UASS based on coefficient of variation spraying distribution analysis in an indoor flight simulator. Front. Plant Sci. 2023, 14, 1235548. [Google Scholar] [CrossRef]
  24. Wang, P.; Saiful Hanif, A.; Yu, S.-H.; Lee, C.-G.; Ho Kang, Y.; Lee, D.-H.; Han, X. Development of an autonomous drone spraying control system based on the coefficient of variation of spray distribution. Comput. Electron. Agric. 2024, 227, 109529. [Google Scholar] [CrossRef]
  25. Toscano, F.; Fiorentino, C.; Capece, N.; Erra, U.; Travascia, D.; Scopa, A.; Drosos, M.; D’Antonio, P. Unmanned Aerial Vehicle for Precision Agriculture: A Review. IEEE Access 2024, 12, 69188–69205. [Google Scholar] [CrossRef]
  26. Li, W.; Wu, B. Computational fluid dynamics investigation of pesticide spraying by agricultural drones. Comput. Electron. Agric. 2024, 227, 109506. [Google Scholar] [CrossRef]
  27. Wang, G.; Zhang, T.; Song, C.; Yu, X.; Shan, C.; Gu, H.; Lan, Y. Evaluation of Spray Drift of Plant Protection Drone Nozzles Based on Wind Tunnel Test. Agriculture 2023, 13, 628. [Google Scholar] [CrossRef]
  28. Kim, S.K.; Ahmad, H.; Moon, J.W.; Jung, S.Y. Nozzle with a Feedback Channel for Agricultural Drones. Appl. Sci. 2021, 11, 2138. [Google Scholar] [CrossRef]
  29. Aminjan, K.K.; Sedaghat, M.; Heidari, M.; Khashehchi, M.; Mohammadzadeh, K.; Salahinezhad, M.; Bina, R. Numerical investigation of the impact of fuel temperature on spray characteristics in a pressure-swirl atomizer with spiral path. Exp. Comput. Multiph. Flow 2024, 6, 428–445. [Google Scholar] [CrossRef]
  30. Li, X.J.; Liang, Z.; Yang, G.; Lin, T.; Liu, B. Assessing the Severity of Verticillium Wilt in Cotton Fields and Constructing Pesticide Application Prescription Maps Using Unmanned Aerial Vehicle (UAV) Multispectral Images. Drones 2024, 8, 176. [Google Scholar] [CrossRef]
  31. Taseer, A.; Han, X. Advancements in variable rate spraying for precise spray requirements in precision agriculture using Unmanned aerial spraying Systems: A review. Comput. Electron. Agric. 2024, 219, 108841. [Google Scholar] [CrossRef]
  32. Lee, D.-H.; Seong, B.-G.; Baek, S.-Y.; Lee, C.-G.; Kang, Y.-H.; Han, X.; Yu, S.-H. Coverage Estimation of Droplets Sprayed on Water-Sensitive Papers Based on Domain-Adaptive Segmentation. Drones 2024, 8, 670. [Google Scholar] [CrossRef]
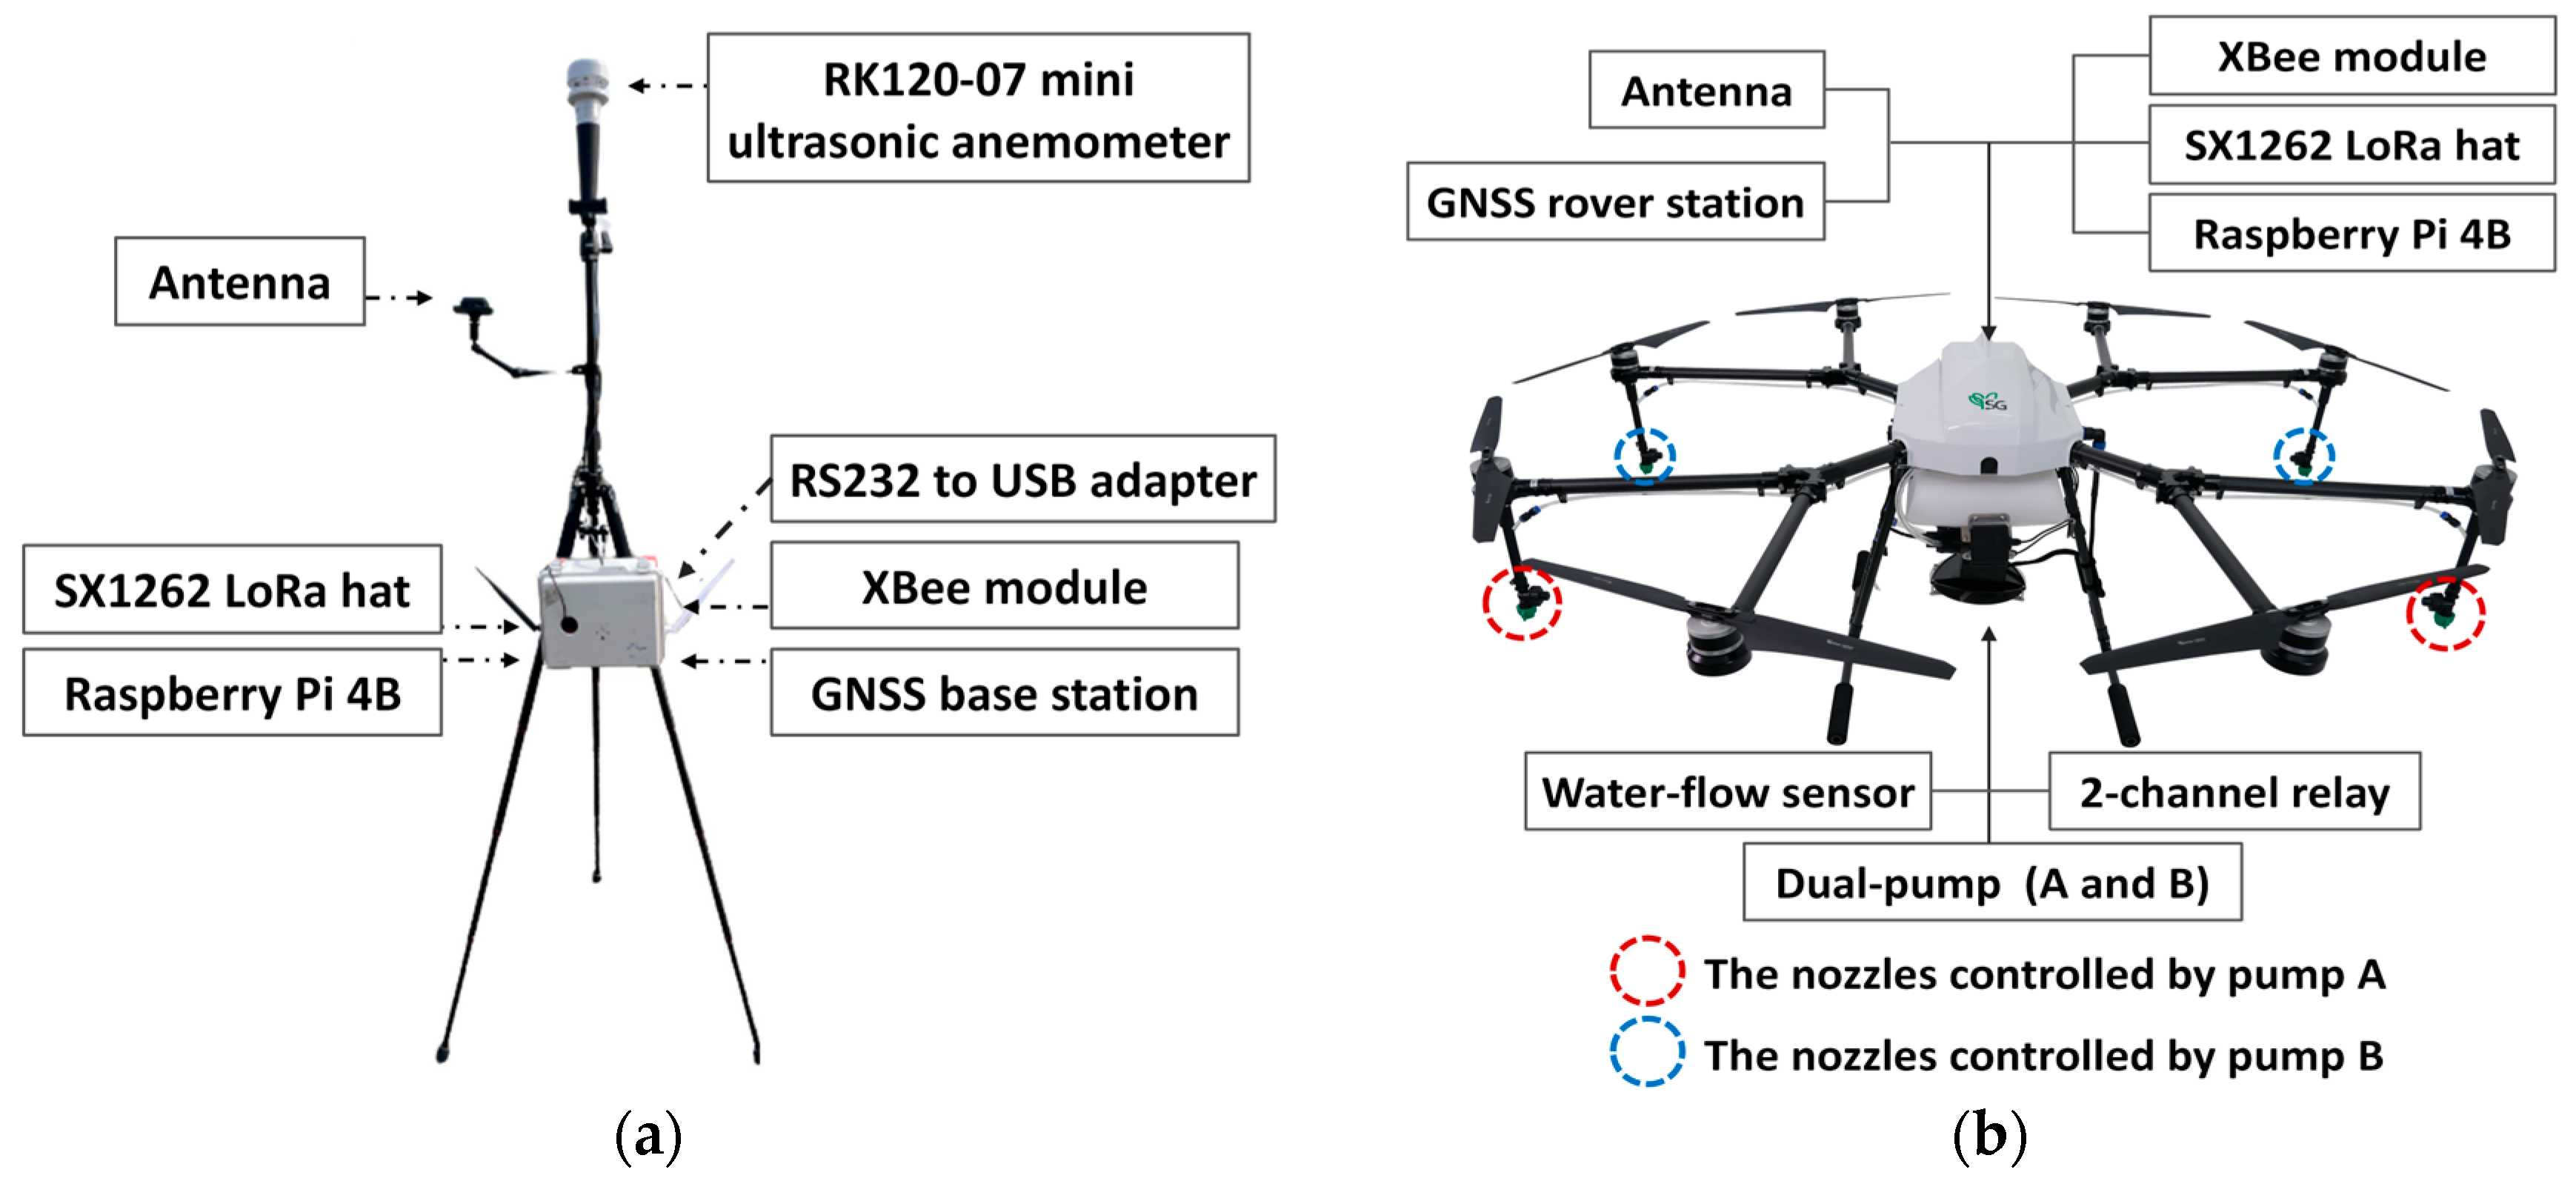
Figure 1. Schematic diagram of the developed graded-precision UAV spraying system: (a) the ground base station (GBS) transmits spray parameters and RTK correction signals; (b) the control spraying assistant (CSA) receives these inputs to execute real-time, zone-specific spraying with high spatial precision.
Agriculture 15 02070 g001
Figure 2. Operational principle of the developed graded-precision spraying system: (a) workflow illustrating the end-to-end process from external data acquisition to nozzle actuation, guided by predefined management zones and application levels specified in the prescription map; (b) schematic representation of zone-specific spraying, demonstrating the system’s ability to adjust spray levels across different zones while accounting for potential trajectory deviations that could affect application accuracy.
Agriculture 15 02070 g002
Figure 3. UAV spraying experiment site with field dimensions, geographic coordinates (35°55′25″ N, 126°59′58″ E), and deployed equipment.
Agriculture 15 02070 g003
Figure 4. Field experiment setup: (a) spraying error detection conducted on Line 1 using water to evaluate spray uniformity and distribution; three tests were conducted, with Line 1 divided into nine zones, each assigned predefined spray levels; (b) field efficacy testing using liquid urea fertilizer across Lines 1–3 to evaluate the effects of graded spraying on crop growth; each line was subdivided into nine zones with predefined spraying levels—Line 1 for Test 1, Line 2 for Test 2, and Line 3 for Test 3.
Agriculture 15 02070 g004
Figure 5. Placement of WSPs in the experimental field: (a) layout of WSP sheets and segmentation of the precision spraying area for droplet distribution assessment; (b) research personnel deploying WSP sheets across the rice field in preparation for spray pattern analysis.
Agriculture 15 02070 g005
Figure 6. Schematic illustration of spray distribution along the UAV flight trajectory, showing the spray center (blue), graded spray levels within the designated coverage zones (dashed circles), and entry (red) and exit (blue) errors. These errors represent deviations in spray initiation and termination timing, which can negatively impact overall spray precision and zone-specific application accuracy.
Agriculture 15 02070 g006
Figure 7. (a) Workflow for processing and analyzing WSP images; (bd) representative heatmaps illustrating droplet coverage at different spray levels from Test 1 on Line 1: (b) Level 0—no spray (Zone 1); (c) Level 1—medium spray (Zone 2); (d) Level 2—high spray (Zone 3). Heatmaps visualize the spatial distribution and intensity of spray deposition across each zone.
Agriculture 15 02070 g007
Figure 8. Heatmaps of WSP spray coverage under graded spraying conditions: (a) Test 1; (b) Test 2; (c) Test 3. Each heatmap illustrates the spatial distribution of spray deposition across zones with varying application levels.
Agriculture 15 02070 g008
Figure 9. Statistical analysis of spray coverage across lateral positions (Columns 1–3) for each spray level. Boxplots display the distribution of coverage values, with the yellow line indicating the mean for each group.
Agriculture 15 02070 g009
Figure 10. UAV flight trajectories along with predefined spray trigger zones (dashed circles), actual spray trigger positions by level (green, yellow, and red dots), and GNSS-fitted flight paths (gray point segments): (a) Flight 1; (b) Flight 2; (c) Flight 3.
Agriculture 15 02070 g010aAgriculture 15 02070 g010b
Figure 11. Correlation analysis between FL and key indices: (a) Pearson correlation results; (b) one-way ANOVA results.
Agriculture 15 02070 g011
Table 1. Key indicators used for evaluating rice harvest outcomes.
Experimental IndicatorUnit
Fertilization levels (FL)0, 1, 2
Number of panicles per plant (NPP)Panicles
Number of grains per panicle (NGP)Grains
Number of grains per square meter (NGSM)Grains/m2
Grain-filling rate (GFR)%
Thousand-grain weight (TGW)g
Yield of white rice (YWR)kg/10a
Table 2. Interquartile range (IQR; 25th–75th percentile) of spray coverage at lateral positions (Columns 1–3) under different spray levels.
Column 1 (%)Column 2 (%)Column 3 (%)Average (%)
Level 00.03–4.900.025–3.180.07–16.110.04–8.06
Level 10.06–1.532.985–40.950.35–27.131.13–23.20
Level 20.25–2.141.125–91.360.88–44.340.75–45.94
Table 3. Entry and exit errors at various spray trigger points across three UAV flight trials.
Zone1st Entry
Error (m)
1st Exit
Error (m)
2nd Entry
Error (m)
2nd Exit
Error (m)
3rd Entry
Error (m)
3rd Exit
Error (m)
10.59921.19490.59921.19490.59921.1949
20.08970.57350.08970.57350.08970.5735
30.49600.99890.49600.99890.49600.9989
41.0657−0.15041.06571.61901.0657−0.1504
50.7048−0.52620.7048−0.52620.7048−0.5262
61.3358−1.33581.33580.43391.33580.4339
71.23610.51081.23610.51081.23610.5108
81.42380.33071.42382.08031.42380.3307
90.95151.41910.95150.65890.9405−0.3084
Average0.87810.78230.87810.95520.87680.5586
Note: Negative exit errors indicate that spraying ceased before the UAV reached the zone boundary.
Table 4. Harvest indicators under different FLs.
SampleFLNPP
(Panicles)
NGP
(Grains)
NGSM
(Grains/m2)
GFR
YWR
(kg/10a)
TGW
(g)
1013.710927,2140.8244727.4
2013.710826,9020.8147327.9
3013.710125,1530.8143927.5
4014.210827,8840.8049527.9
5014.011228,6020.8144027.4
6014.611630,7560.8150527.8
7014.011027,9900.8352628.0
8014.210627,3670.8049627.7
9014.410727,9730.8250027.9
10114.210326,5930.8652228.1
11113.011126,2360.8752128.2
12114.010426,4730.8249327.9
13114.110426,6620.8348728.1
14114.410928,5800.8153327.9
15113.710927,1510.8250727.9
16114.810728,7930.8456128.1
17114.610227,0760.8351227.9
18114.110727,4410.8654328.1
19214.210126,0760.8752028.4
20213.210725,6800.8750928.3
21214.012130,7030.8662428.2
22213.910727,0420.8854728.2
23213.610926,9530.8250628.1
24214.110627,1750.8754228.1
25214.210928,0590.8656128.2
26213.811729,4340.8456128.3
27214.510226,9400.8653628.4
Avg. 1 (FL = 0)14.110927,7600.8148027.7
Avg. 2 (FL = 1)14.110627,2230.8452028.0
Avg. 3 (FL = 2)13.910927,5630.8654528.2
Table 5. Pearson correlation and ANOVA results for harvest indicators in relation to FL.
Pearson CorrelationANOVA
Pearson rp-ValueF-Statisticp-Value
FL-NPP−0.275129990.164849061.142199190.33586010
FL-NGP0.030058170.881688120.588037070.56322094
FL-NGSM−0.061712560.759767720.299264400.74408971
FL-GFR0.83798114 ***0.00000005 ***28.35714286 ***0.00000048 ***
FL-TGW0.83013943 ***0.00000009 ***26.83870968 ***0.00000076 ***
FL-YWR0.52923775 **0.00453115 **6.25352113 **0.00651651 **
** p < 0.01, *** p < 0.001.
Disclaimer/Publisher’s Note: The statements, opinions and data contained in all publications are solely those of the individual author(s) and contributor(s) and not of MDPI and/or the editor(s). MDPI and/or the editor(s) disclaim responsibility for any injury to people or property resulting from any ideas, methods, instructions or products referred to in the content.