Article

Quantifying the Spatiotemporal Response of Winter Wheat Yield to Climate Change in Henan Province via APSIM Simulations

1
College of Water Conservancy, North China University of Water Resources and Electric Power, Zhengzhou 450045, China
2
School of Water Resources and Environment Engineering, Nanyang Normal University, Nanyang 473061, China
3
School of Water Resources and Hydro-Electric Engineering, Xi’an University of Technology, Xi’an 710048, China
4
Institute of Soil and Water Conservation, Northwest A&F University, Xianyang 712100, China
*
Author to whom correspondence should be addressed.
Agriculture 2025, 15(19), 2059; https://doi.org/10.3390/agriculture15192059
Submission received: 3 September 2025 / Revised: 24 September 2025 / Accepted: 29 September 2025 / Published: 30 September 2025
(This article belongs to the Section Ecosystem, Environment and Climate Change in Agriculture)

Abstract

Global warming poses a growing threat to winter wheat production in Henan Province, a critical region for China’s food security, necessitating a quantitative assessment of climate impacts. This study aimed to quantify the dominant climatic drivers of winter wheat yield and assess its spatiotemporal evolution and future risks under climate change, thereby providing a scientific basis for targeted adaptation strategies. Thus, the APSIM model in combination with the Geodetector method was applied to quantify the spatiotemporal response of winter wheat yield to climate change in Henan Province under historical (1957–2020) and SSP245 scenarios. The study results demonstrated significant trends in climatic factors during the winter wheat growing season: precipitation decreased by an average of 3.09 mm/decade, sunshine hours declined by 36 h/decade, wind speed reduced by 0.447 m/(s·decade), and evaporation decreased by 14.7 mm/decade. In contrast, the accumulated temperature ≥ 0 °C significantly increased by 70.9 °C·d/decade. Geodetector analysis further identified accumulated temperature as the dominant climatic driver (q = 0.548), followed by precipitation (q = 0.340) and sunshine hours (q = 0.261). Yield simulations from 1960 to 2018 indicated that most regions maintained stable or slightly increasing yields (<50 kg·ha−1·decade−1), though some areas experienced fluctuating declines. Under future scenarios, major production regions in Henan Province (Zhengzhou, Xinxiang, Luoyang) are projected to see substantial yield increases, with growth rates of 147.2–148.9 kg·ha−1·decade−1. Specifically, Xinxiang is expected to achieve yields of 6200 kg·ha−1. The frequency of climate-induced negative yield years decreased by approximately 35% after 2003, highlighting the role of improved agricultural technologies in enhancing climate resilience. This study clarifies how multiple climatic factors jointly affect winter wheat yield, identifying rising accumulated temperature and water stress as key future constraints. It recommends optimizing varietal selection and cultivation practices according to regional climate patterns to improve policy relevance and local applicability.

1. Introduction

Climate change, characterized by global warming, poses one of the most serious challenges to sustainable agricultural development in the 21st century [1]. According to the Sixth Assessment Report of the Intergovernmental Panel on Climate Change (IPCC AR6), global temperature may exceed the 1.5 °C threshold by mid-century if effective emissions reduction measures are not implemented [2]. Concurrently, global precipitation patterns have undergone significant changes, with increasing frequency and intensity of extreme climate events, such as droughts, heatwaves, and heavy rainfall, posing multifaceted threats to crop production systems [3]. These changes not only affect the physiological processes, growth, and development of crops, but also have profound impacts on the stability and productivity of agricultural ecosystems by altering the dynamics of pest and disease outbreaks, soil water balance, and nutrient cycling [4,5].
Internationally, IPCC assessment reports have consistently highlighted the threats posed by rising temperatures to global food security, noting the particular vulnerability of C3 crops such as wheat to combined heat water stress [6,7]. Extensive studies using process-based crop models (e.g., DSSAT, APSIM, EPIC) under future climate scenarios have been conducted across major wheat-producing regions—including Europe, North America, and Australia—to evaluate production risks [8,9,10]. These studies consistently conclude that although mid-latitude regions may benefit from warmers and the CO2 fertilization effect, the increasing frequency of extreme climate events could significantly amplify interannual yield variability, potentially offsetting these positive effects. For instance, a global synthesis suggests that each 1 °C rise in temperature may reduce wheat yields by 4.1–6.4%, accompanied by alterations in key quality traits [11].
As the world’s largest wheat producer and consumer, China’s wheat production security holds strategic significance for national food security and social stability [12]. Winter wheat, a primary staple crop, exhibits high climate sensitivity due to its long growth cycle and strong phenological synchrony with environmental conditions [13]. Domestic research has systematically examined climate impacts on winter wheat through several key approaches: (1) identifying critical meteorological factors and thresholds using statistical models, regression analysis, and machine learning to analyze historical climate-yield relationships [14]; (2) simulating and validating the adaptability of varieties and management practices via crop models at site-specific scales [15]; and (3) investigating the trade-offs between the positive effects of elevated CO2 on photosynthesis and the negative impacts of high temperature stress [16]. Collectively, these studies establish a critical foundation for understanding the mechanisms by which climate change influences crop productivity.
Henan Province, situated in the Huang-Huai-Hai Plain of central-eastern China, is the nation’s largest winter wheat producer, contributing over one-quarter of the national output and widely recognized as the “Central Plains Granary.” The region lies in a climate-sensitive transition zone between northern subtropical and warm temperate monsoon climates, rendering its agricultural systems highly vulnerable to environmental fluctuations [17]. Recent decades have witnessed a distinct “warming and drying” trend, characterized by rising temperatures, increased interannual precipitation variability, and more frequent drought occurrences [18]. Concurrently, the growing intensity of extreme precipitation events poses additional risks of substantial agricultural losses [19]. These climatic shifts directly impair yield and quality formation in winter wheat by disrupting key physiological processes, including photosynthesis, nutrient uptake, and phenological development [4,20]. For instance, earlier spring warming advances the jointing stage, elevating exposure to late-spring frost; meanwhile, heat stress during the grain-filling paccelerates premature senescence, significantly reducing the 1000-kernel weight [21].
However, existing research exhibits notable limitations: (1) most studies are conducted at the site scale, lacking high-resolution, spatially explicit regional simulations that can adequately capture spatial heterogeneity in climate-yield relationships [22,23]; (2) quantitative analysis of the interactive effects of multiple climatic factors is still insufficient, with many studies often focusing on individual factors in isolation [24,25]; (3) the representation of extreme climate events and the integrated assessment of agricultural adaptation options in future scenario simulations remain relatively weak [26]; and (4) there is a scarcity of systematic, multi-model, multi-scenario comprehensive risk assessments focused specifically on Henan as a critical winter wheat production zone [17,22].
To address these research gaps, this study employs the APSIM model integrated with multi-source data fusion to conduct a high-resolution analysis of winter wheat yield responses to historical and future climate change across Henan Province. The investigation focuses on three primary objectives: (1) to characterize the spatiotemporal dynamics of key agroclimatic resources, including solar radiation, temperature, and water during the winter wheat growing period; (2) to analyze spatiotemporal patterns in actual yield and climate-driven yield, applying spatial statistical methods such as Geodetector to quantify the key climate factors and their interactions influencing yield formation; and (3) to project yield trends under the SSP245 scenario by integrating Global Climate Models (GCMs) and Shared Socioeconomic Pathways (SSPs). By coupling process-based models with spatial analysis, this study aims to overcome existing limitations in mechanistic understanding and spatial explicitness, thereby advancing the comprehension of climate–crop–soil interactions and providing a scientific foundation for the design of region-specific climate adaptation strategies to enhance regional and national food security.

2. Materials and Methods

2.1. Study Area

Henan Province is located in central-eastern China (31°23′–36°22′ N, 110°21′–116°39′ E), spanning four major river basins: the Yellow River, Yangtze River, Huai River, and Hai River (Figure 1). The topography is generally higher in the west and lower in the east, with mountain ranges bordering the northern, western, and southern regions. The eastern region is dominated by the alluvial plains of the Huang-Huai-Hai Plain, while the northeast falls within the Yellow River Plain and the southeast lies within the Huai River Plain. Diverse geomorphological features are present, including mountains, hills, plains, and basins. The northwest adjoins the Taihang Mountains, and the southwest represents the eastern extension of the Qinling Mountains, incorporating ranges such as the Funiu and Xiong’er Mountains. Climatically, Henan exhibits a clear north–south gradient: the north has a warm temperate semi-arid climate, while the south transitions to a northern subtropical semi-humid climate. The region is characterized by cold, dry winters with limited snowfall and rainfall; dry and windy springs; and hot, rainy summers. As a key agricultural province in China, Henan primarily employs a winter wheat–summer maize double-cropping system, along with cash crops such as cotton. The province accounts for over 26% of the nation’s winter wheat output, with a steady increasing trend in recent years. The typical growth cycle of winter wheat includes sowing in early October, dormancy by mid-to-late December, green-up between late February and early March of the following year, jointing in early April, heading from mid-April to early May, and maturation and harvesting starting in early June.

2.2. Data Collection and Processing

2.2.1. Quantifying Long-Term Trends of Meteorological Elements with Climate Tendency Rate

Daily meteorological data for the period 1951–2017 were obtained from the National Meteorological Science Data Center (http://data.cma.cn/, accessed on 8 March 2025). The dataset included daily precipitation, mean temperature, sunshine hours, evaporation, humidity, wind speed, and other variables. Stations with significant missing records (>5%) were excluded from the analysis. Subsequently, the spatial distribution characteristics of key climatic variables were analyzed using the spatial analysis tools in ArcGIS.
Meteorological data for the baseline period (1951–2018) in Henan Province were simulated using Global Climate Models (GCMs). These simulations were compared and validated against projected changes in agro-meteorological resources under future climate conditions. Future climate data were derived from the Coupled Model Intercomparison Project Phase 6 (CMIP6) General Circulation Models (GCMs) under the SSP245 emissions scenario. All CMIP6 data are publicly accessible for download at https://esgf-node.llnl.gov/projects/cmip6/, accessed on 12 Janury 2025. These processed datasets were used to generate daily input files for the APSIM model. In addition, the Statistical downscaling method is used to make up for the shortcomings of this scenario model, so as to apply it to the North China Plain and predict the future climate data.
To ensure the reliability of the meteorological data, particularly during the early observation period (1960s–1980s), a multi-tier quality control protocol was applied. The procedure consisted of internal consistency checks, validation against physically plausible ranges to identify outliers, and statistical comparison across stations using one-way Analysis of Variance (ANOVA) to detect systematic biases. While some uncertainty persists—especially regarding early instrumental precision and derived variables such as solar radiation—the implemented quality assurance measures support the suitability of the data for conducting long-term trend analysis in this study.
Spatially discontinuous meteorological data cannot be directly applied to crop growth models and often require downscaling to specific temporal and spatial resolutions. As described by Lin et al. (2023) [27], the downscaling procedure in this study was conducted as follows: First, the Quantile Delta Mapping (QDM) method was applied to correct biases in the CMIP6 model outputs at a 1.0° × 1.0° resolution using the MSWX dataset as the reference. The bias-corrected GCM data were then downscaled to a 0.1° × 0.1° resolution. The resulting high-resolution dataset, termed the Deep-Learning-Based East Asian Climate Change Map with Bias-Corrected Underlying Datasets (CLIMEA-BCUD), is publicly accessible via the Science Data Bank (https://www.scidb.cn/en, accessed on 21 Janury 2025). From this dataset, nine near-surface meteorological variables—including 2 m air temperature, precipitation, 10 m wind speed, and downward longwave and shortwave radiation—were extracted for each meteorological station. After downscaling the GCM climate data to make them applicable to the Henan plain region, the APSIM-Wheat model was calibrated and parameterized using experimental data.
The climate tendency rate is a classical mathematical method in climate trend analysis, used to characterize the temporal evolution of meteorological elements. This method is grounded in the theoretical basis that climate system changes exhibit continuity and directionality. From a dynamical perspective, it essentially performs linear feature extraction on meteorological element time series. The specific calculation procedure and principles are as follows:
Consider a time series of a specific element at a meteorological station as y1, y2, …, yn, which can be fitted by a polynomial:
y n ^ ( t ) = a 0 + a 1 t + a 2 t 2 + a m t n ( m < n )
where, t represents time, year. For elements such as temperature and precipitation, a first-order linear equation y ( t ) = a 0 + a 1 t is typically sufficient to accurately describe their long-term trends.
The trend change rate can be expressed as d y / d t = a 1 . To enhance interpretability, a 1 × 10 is defined as the climate tendency rate, with units of °C/10a or mm/10a, representing the average change per decade. A climate tendency rate greater than 0 indicates an increasing trend, while a value less than 0 indicates a decreasing trend. This standardization aligns with World Meteorological Organization guidelines for climate trend reporting and facilitates comparison across different elements. The coefficients of the equation are determined using the least squares method to ensure statistical reliability of the trend estimation.
In this study, the univariate linear regression model y = a x + b is employed to fit trends for key meteorological elements (including accumulated temperature, sunshine duration, precipitation, evaporation, wind speed, and relative humidity) during different growth stages of winter wheat at representative stations. By calculating the climate tendency rate of each element, the direction and magnitude of change during each growth period can be quantified, providing a basis for subsequent analysis of the potential impacts of climate change on winter wheat production.

2.2.2. Agricultural Statistical Data

Historical yield data of winter wheat were directly obtained from the China Rural Statistical Yearbook (1985–2021) and the official website of the National Bureau of Statistics of China (http://www.stats.gov.cn/, accessed on 12 March 2025). By consulting the statistical yearbooks and rural statistical yearbooks of 17 prefecture-level cities in Henan Province, we collected as comprehensive winter wheat coverage trial records and yield data as possible. To improve data accuracy, questionable records were corrected based on field investigations and literature review. These data were used for the calibration and validation of the APSIM model to evaluate its performance in replicating historical yield trends and inter-annual variability.
The soil data used in this study were primarily sourced from the international soil information platform ISRIC (https://data.isric.org, accessed on 5 December 2024). Key properties for the 0–150 cm soil profile included bulk density (BD), lower limit (LL15, wilting point), drained upper limit (DUL, field capacity), soil organic carbon (SOC), total nitrogen content (%), and soil pH.
Crop-related data were mainly derived from previously published literature and the crop variety promotion platform (http://202.127.42.47:6006/Home/BigDataIndex, accessed on 19 November 2024). Representative winter wheat cultivars and their associated parameters in the study region were identified, including sowing date, flowering date, maturity date, planting density, fertilization, irrigation regime, and yield.
To assess the stability of winter wheat production, the calibrated APSIM model was driven by historical meteorological data from 17 stations across Henan Province to simulate yields for a historical baseline period. The stability of these simulated yields, both for the baseline and under future climate scenarios, was quantified using the coefficient of variation (CV). The CV, calculated as the ratio of the standard deviation to the mean (Equation (3); [28]), serves as a key metric: a lower CV value indicates greater yield stability, and vice versa.
C V = 1 n i = 1 n ( x i x ¯ ) 2 x ¯
where, x i is the value of element in year i, and x ¯ is the multi-year average value.

2.2.3. Data Integration and Spatial Analysis

All spatial datasets, including meteorological, soil, and agricultural statistical data, were projected into a unified coordinate system (WGS 1984) and resampled to a consistent spatial resolution (1 km × 1 km grid) using ArcGIS 10.8. This process facilitated the extraction of location-specific input parameters for point-based APSIM model simulations across the entire study region. Historical meteorological data and statistical yield records were collected, organized, and analyzed to investigate the spatiotemporal variation characteristics of major agroclimatic resources in Henan Province. Multi-temporal MODIS remote sensing images from the Google Earth Engine (GEE) platform were used as data sources to extract the cumulative planting years of winter wheat in Henan Province, which were subsequently spatialized into a continuous distribution layer. Spatiotemporal analysis of model outputs, including yield and key phenological dates, was conducted using zonal statistics and trend analysis tools within the geographic information system platform. The results were visualized through a series of thematic maps to illustrate the spatial patterns and temporal dynamics of winter wheat production under both historical and future climate scenarios.
The weights are determined by the distance between the prediction point and the sample points: the closer the distance, the larger the weight; as the distance increases, the weight gradually decreases. This method is based on the assumption that “things that are closer are more similar than those that are farther away.” Therefore, points near the prediction location have a greater influence on the estimated value, while points farther away have less impact. This allows the method to better reflect local characteristics and reduce interference from distant points. However, its effectiveness needs to be validated and adjusted according to the specific problem and data characteristics. Further optimization can be achieved by adjusting parameters such as the size of the neighborhood and the choice of weight decay function. Compared to other interpolation methods, IDW has a significant advantage in computational efficiency. Its mathematical expression is as follows [29]:
Z = i = 1 n ( Z i × W i ) i = 1 n W i
In the formula, Z represents the interpolated value at the target point, Zi denotes the measured value at the i-th station, and Wi is the weight assigned to the i-th station.
To quantify the relationship between climate change and climate yield, this study employs mathematical statistical methods to decompose the winter wheat yield in Henan Province into three components: (1) Trend yield, which reflects the systematic influence of socio-economic factors such as technological progress, improved agricultural policies, and increased material inputs on yield over time, encompassing the combined effects of cultivated land area, agricultural population, agricultural technology development, capital investment, and market demand; (2) Climate yield, which refers to the yield component affected by fluctuations in meteorological elements such as precipitation and temperature, with its variation amplitude indicating the direct impact of climate variability on winter wheat production; (3) Random error yield, caused by uncontrollable random factors and thus generally negligible [30]. The expression is as follows:
Y = Y ϖ + Y t + ε
where Y denotes the actual yield, Yϖ represents the trend yield, Yt is the climate yield, and stands for the random error yield.

2.2.4. Correlation Analysis

The interaction effects among climatic factors influencing winter wheat yield were analyzed using the Geodetector package implemented in R. The factor detection module of Geodetector is a spatial analysis method that examines the significance of relationships and potential causal mechanisms between independent variables (e.g., climatic factors) and dependent variables (e.g., climate-induced yield) by assessing the degree of dissimilarity in their spatial distributions. If the spatial patterns of both variables show consistency, it indicates that the independent variable plays a significant role in driving the spatial variation of the geographical phenomenon. The strength of the association is quantified using the q-statistic, which is defined as follows [21,31]:
q = 1 h = 1 L N h σ h 2 N σ 2 = 1 S S W S S T
S S W = h = 1 L N h σ h 2 ,   S S W = N σ 2
where h = 1, …, L, denotes the strata (partitions or categories) of the variable or factor; Nh and N are the number of units in stratum h and the entire region, respectively; σ h 2 and σ 2 represent the variances of the dependent variable Y within stratum h and the entire region. SSW is the within-sum of squares, and SST is the total sum of squares. The value of q ranges between [0, 1], with higher values indicating a stronger explanatory power of the independent variable X over Y.

2.3. APSIM Model Configuration and Calibration

2.3.1. Model Setup and Parameterization

The APSIM model, one of the world’s leading crop growth simulation models, is widely used in numerous agricultural production and research fields, including precision agriculture, water and nutrient management, climate change, food security, soil carbon turnover, environmental impact, agricultural sustainability, and agroecology [9,32]. This study employs the R language and the APSIM-Wheat model (version 7.10) to simulate historical and future winter wheat yield and phenological changes in response to climate variables in Henan Province, using both observed and projected meteorological data.
Utilizing meteorological, soil, irrigation, and fertilization data spanning from 1951 to 2017, an APSIM model was developed to simulate winter wheat growth in Henan Province, with the widely cultivated variety selected for simulation. Within the APSIM framework, cultivar-specific parameters governing winter wheat development are primarily classified into two functional categories: crop growth/development and yield formation. Key processes determining yield in the model include vernalization sensitivity, radiation use efficiency, dry matter partitioning, grain filling rate, potential grain number, and constraints imposed by water and nitrogen availability. For conciseness, only the parameters exerting substantial influence on winter wheat performance are presented; the major calibrated parameters are summarized in Table 1.
Considering the differences in terrain and climate of Henan, field data from three representative stations (Zhengzhou, Luoyang, and Xinxiang), including key management practices such as sowing dates, irrigation, and fertilization, along with three widely cultivated wheat varieties (detailed in Table 2), were selected for model calibration. The validation is conducted under consistent soil conditions (as outlined in Table 3).

2.3.2. Model Calibration and Accuracy Validation

This project will adjust and validate model parameters based on experimental data, with the expected outcome of obtaining parameters for winter wheat varieties—including both growth period and yield formation parameters—across different regions of Henan Province. Assuming no change in crop cultivars across years, other management parameters were determined referring to field experiments. This study will compare yield estimation results derived from the APSIM (version 7.10) model with actual statistical data, and use the coefficient of determination (R2) and root mean square error (RMSE) to evaluate the model’s accuracy and reliability [28,30]. The APSIM 7.10 model will also be employed to simulate winter wheat yield under future climate change scenarios, predicting potential impacts of climate change on crop production.
R 2 = i = 1 n ( y ^ i y i ¯ ) 2 i = 1 n ( y i y i ¯ ) 2
R M S E = 1 n n = 1 n ( y i ^ y i ) 2
R R M S E = R M S E O ¯ × 100 %
In this formula, n represents the sample size, yᵢ denotes the actual value of the target variable, and ŷᵢ indicates the predicted value from the model. The coefficient of determination, R2, is used to evaluate the consistency between simulated and observed values. A value closer to 1 indicates higher predictive accuracy. The root mean square error (RMSE) reflects the absolute deviation between simulated and actual values, with a smaller value representing better prediction performance.
The APSIM model effectively mitigates the propagation of meteorological data uncertainty through its process-based framework and localized parameter calibration. Its simulation mechanism, grounded in crop physiology (such as photosynthesis and stress response), reduces sensitivity to input data variability. Furthermore, the localized optimization of cultivar parameters and field management practices further diminishes the influence of uncertainties in initial conditions and model parameters. To ensure the accuracy of yield simulations, the model was validated not only by comparing the means of simulated and observed values but also by incorporating indicators such as the coefficient of variation (CV) to analyze inter-annual fluctuation patterns, thereby providing quantitative evidence for the reliability of the simulation results. This combined strategy of process-based modeling plus statistical validation enables APSIM to deliver robust yield projections in climate change impact assessments, offering dependable support for agricultural adaptation decision-making.

3. Results

3.1. Spatiotemporal Dynamics of Agroclimatic Resources During the Winter Wheat Growing Season

3.1.1. Interannual Trends of Meteorological Factors

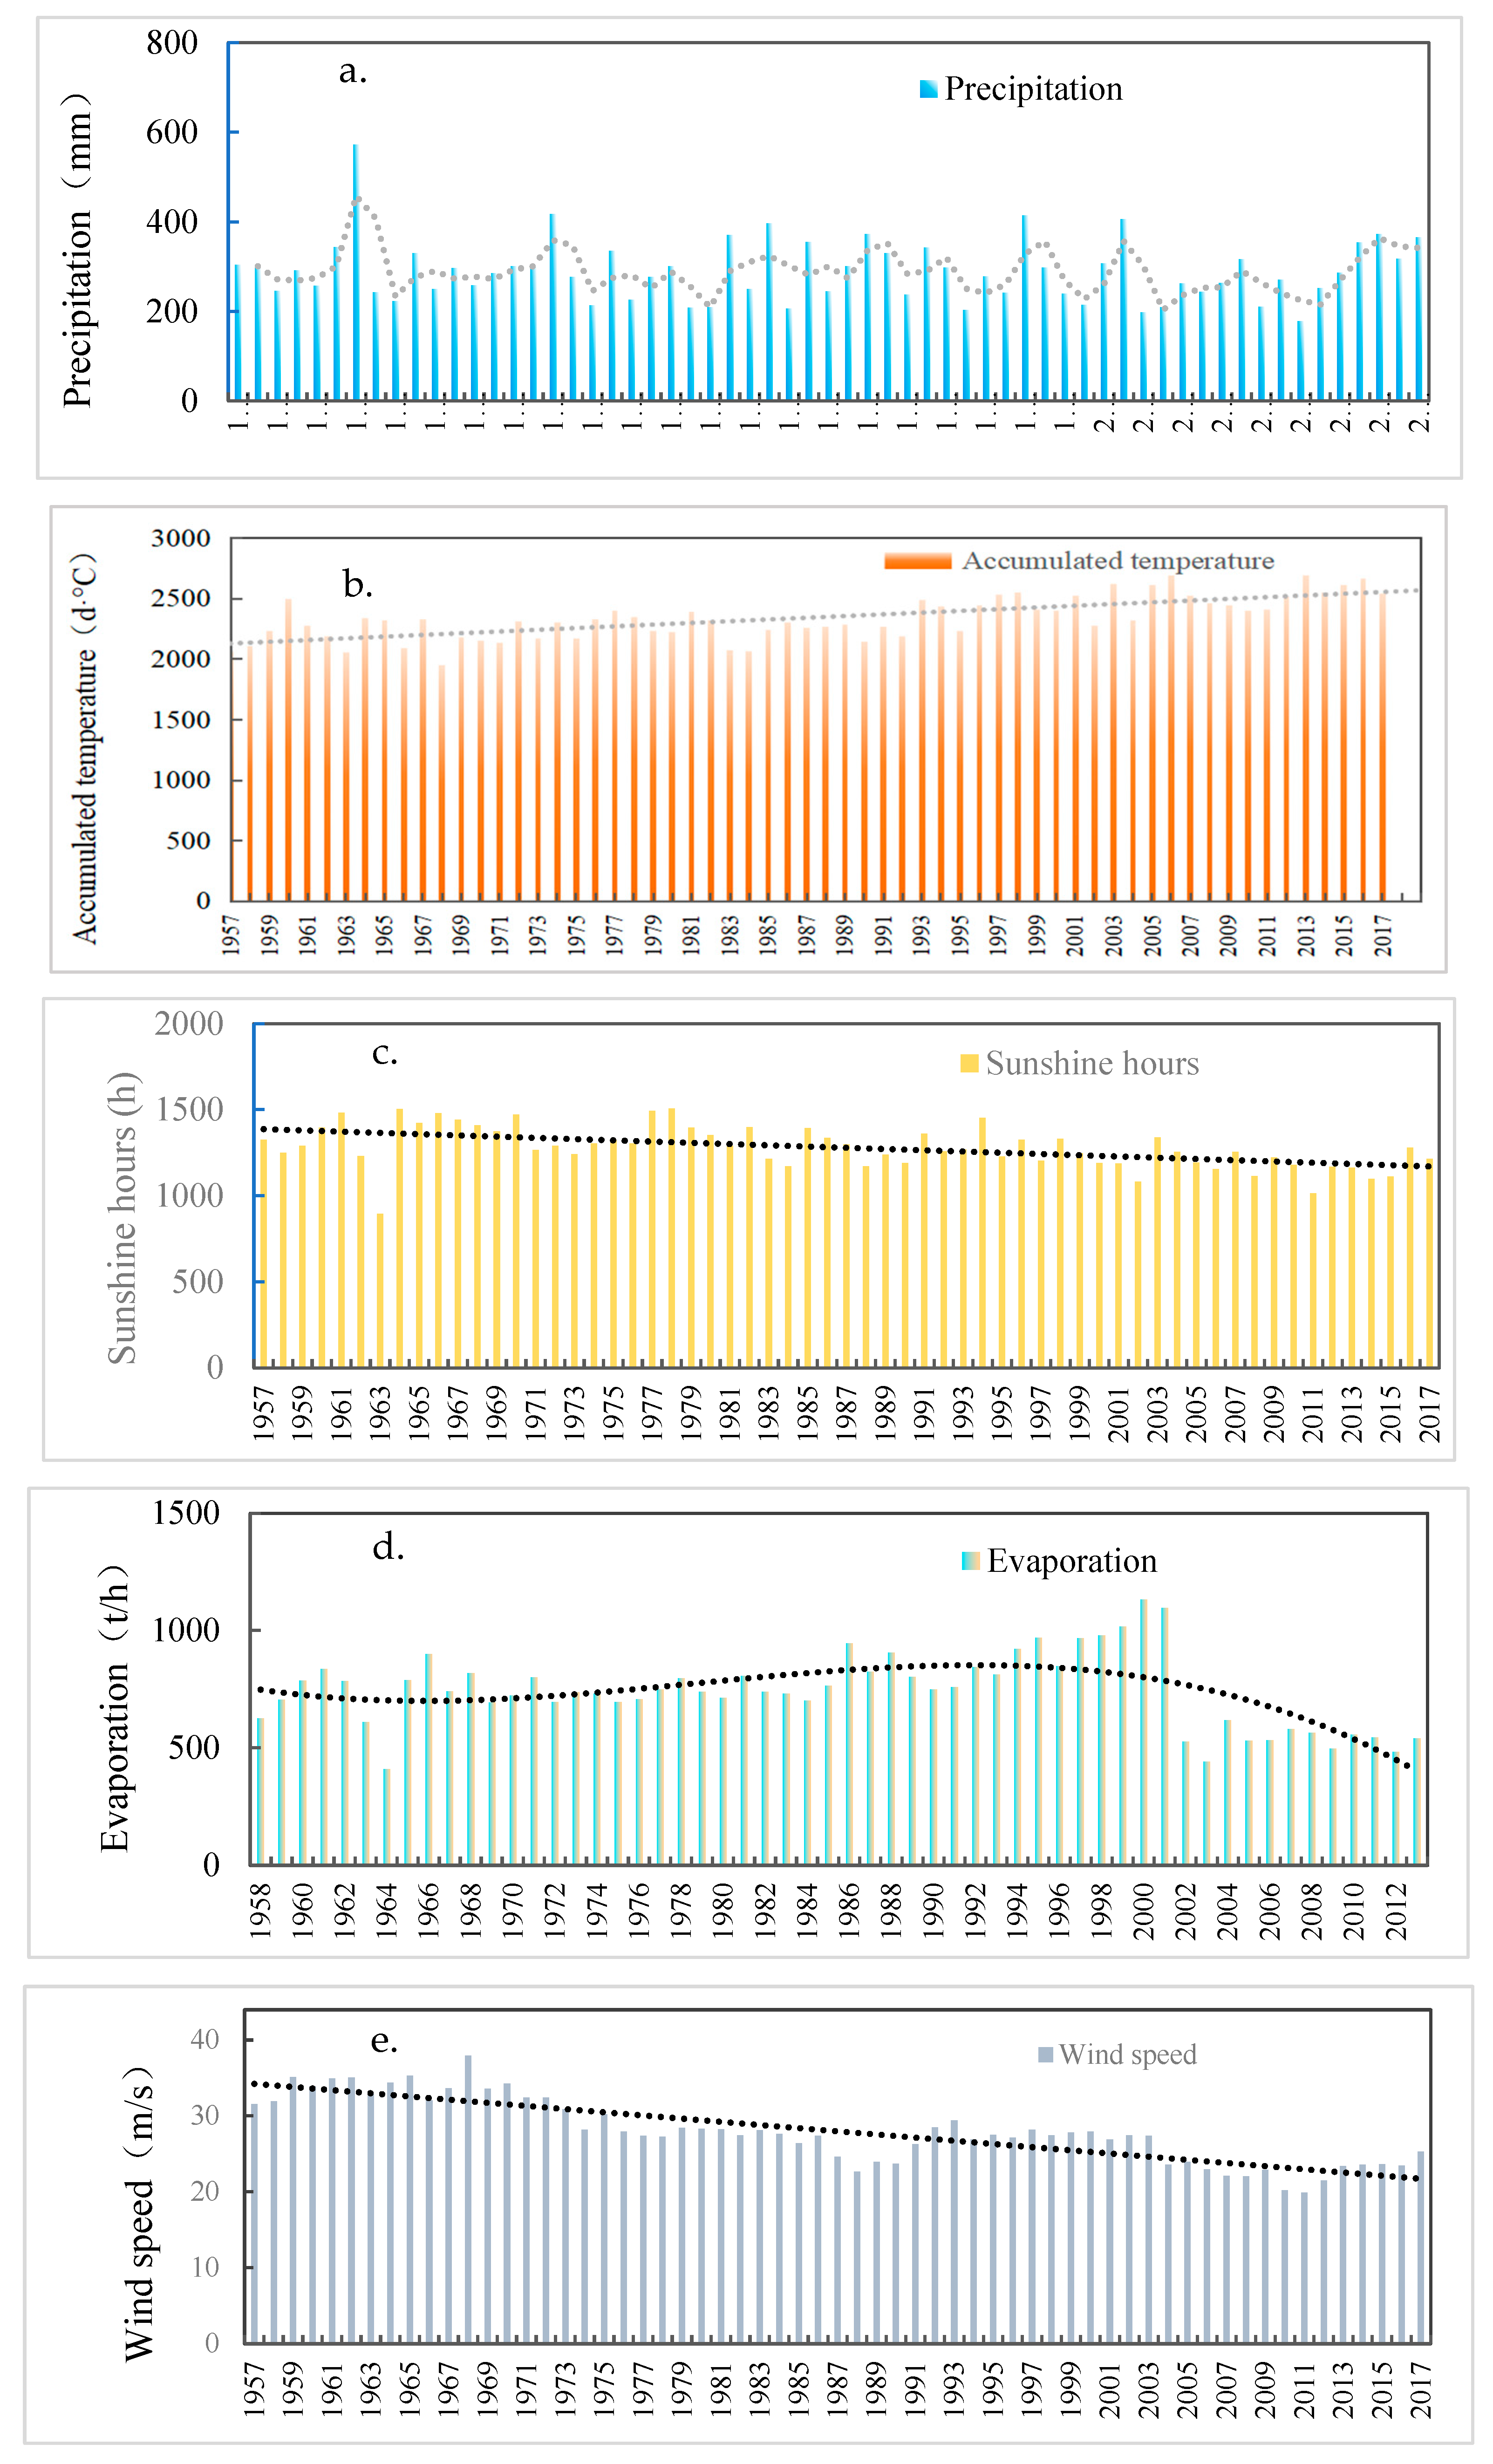
Meteorological data used in this study were collected from 17 major weather stations across Henan Province. The data from these stations were aggregated, averaged, and subsequently analyzed to determine the interannual trends of key climatic variables. The resulting trends are visually summarized in Figure 2.
Precipitation refers to the total amount of atmospheric precipitation (including rain, snow, hail, etc.) over a specific period, measured in millimeters (mm). Figure 2a shows that the average precipitation during the winter wheat growing season in Henan Province from 1957 to 2017 exhibited a non-significant decreasing trend, with a climatic tendency rate of −3.09 mm/10a, dominated mainly by interannual variability. Extreme values occurred in 1963 (573 mm) and 2009 (178 mm).
Accumulated temperature is the sum of daily average temperatures over a period and serves as an indicator of the cumulative effect of temperature on crop development, measured in degrees Celsius (°C). Figure 2b indicates that the accumulated temperature during the winter wheat growing period increased significantly over the study period, with a change rate of 70.9 °C/10a. The highest value occurred in 2006 (2695.8 d·°C), and the lowest in 1968 (1948.8 d·°C).
Sunshine duration represents the actual time the earth’s surface receives direct solar radiation, measured in hours. As shown in Figure 2c, the sunshine duration in Henan Province during this period generally decreased, with a climatic tendency rate of −36 h/10a. The longest duration occurred in 1978 (1505 h), and the shortest in 1963 (892 h).
Evaporation refers to the amount of water evaporated from a water surface or soil per unit time, measured in millimeters. Figure 2d shows that evaporation showed a decreasing trend from 1957 to 2013, with a change rate of −14.7 mm/10a. The highest value was recorded in 2000 (1132 mm), and the lowest in 1964 (410 mm).
Wind speed reflects the rate of air movement, measured in meters per second (m/s). Figure 2e demonstrates that the average wind speed during the winter wheat growing season decreased significantly, with a change rate of −0.447 m/(s·10a). The highest speed occurred in 1968 (8.14 m/s), and the lowest in 2011 (4.26 m/s).

3.1.2. Spatial Distribution Characteristics of Meteorological Factors

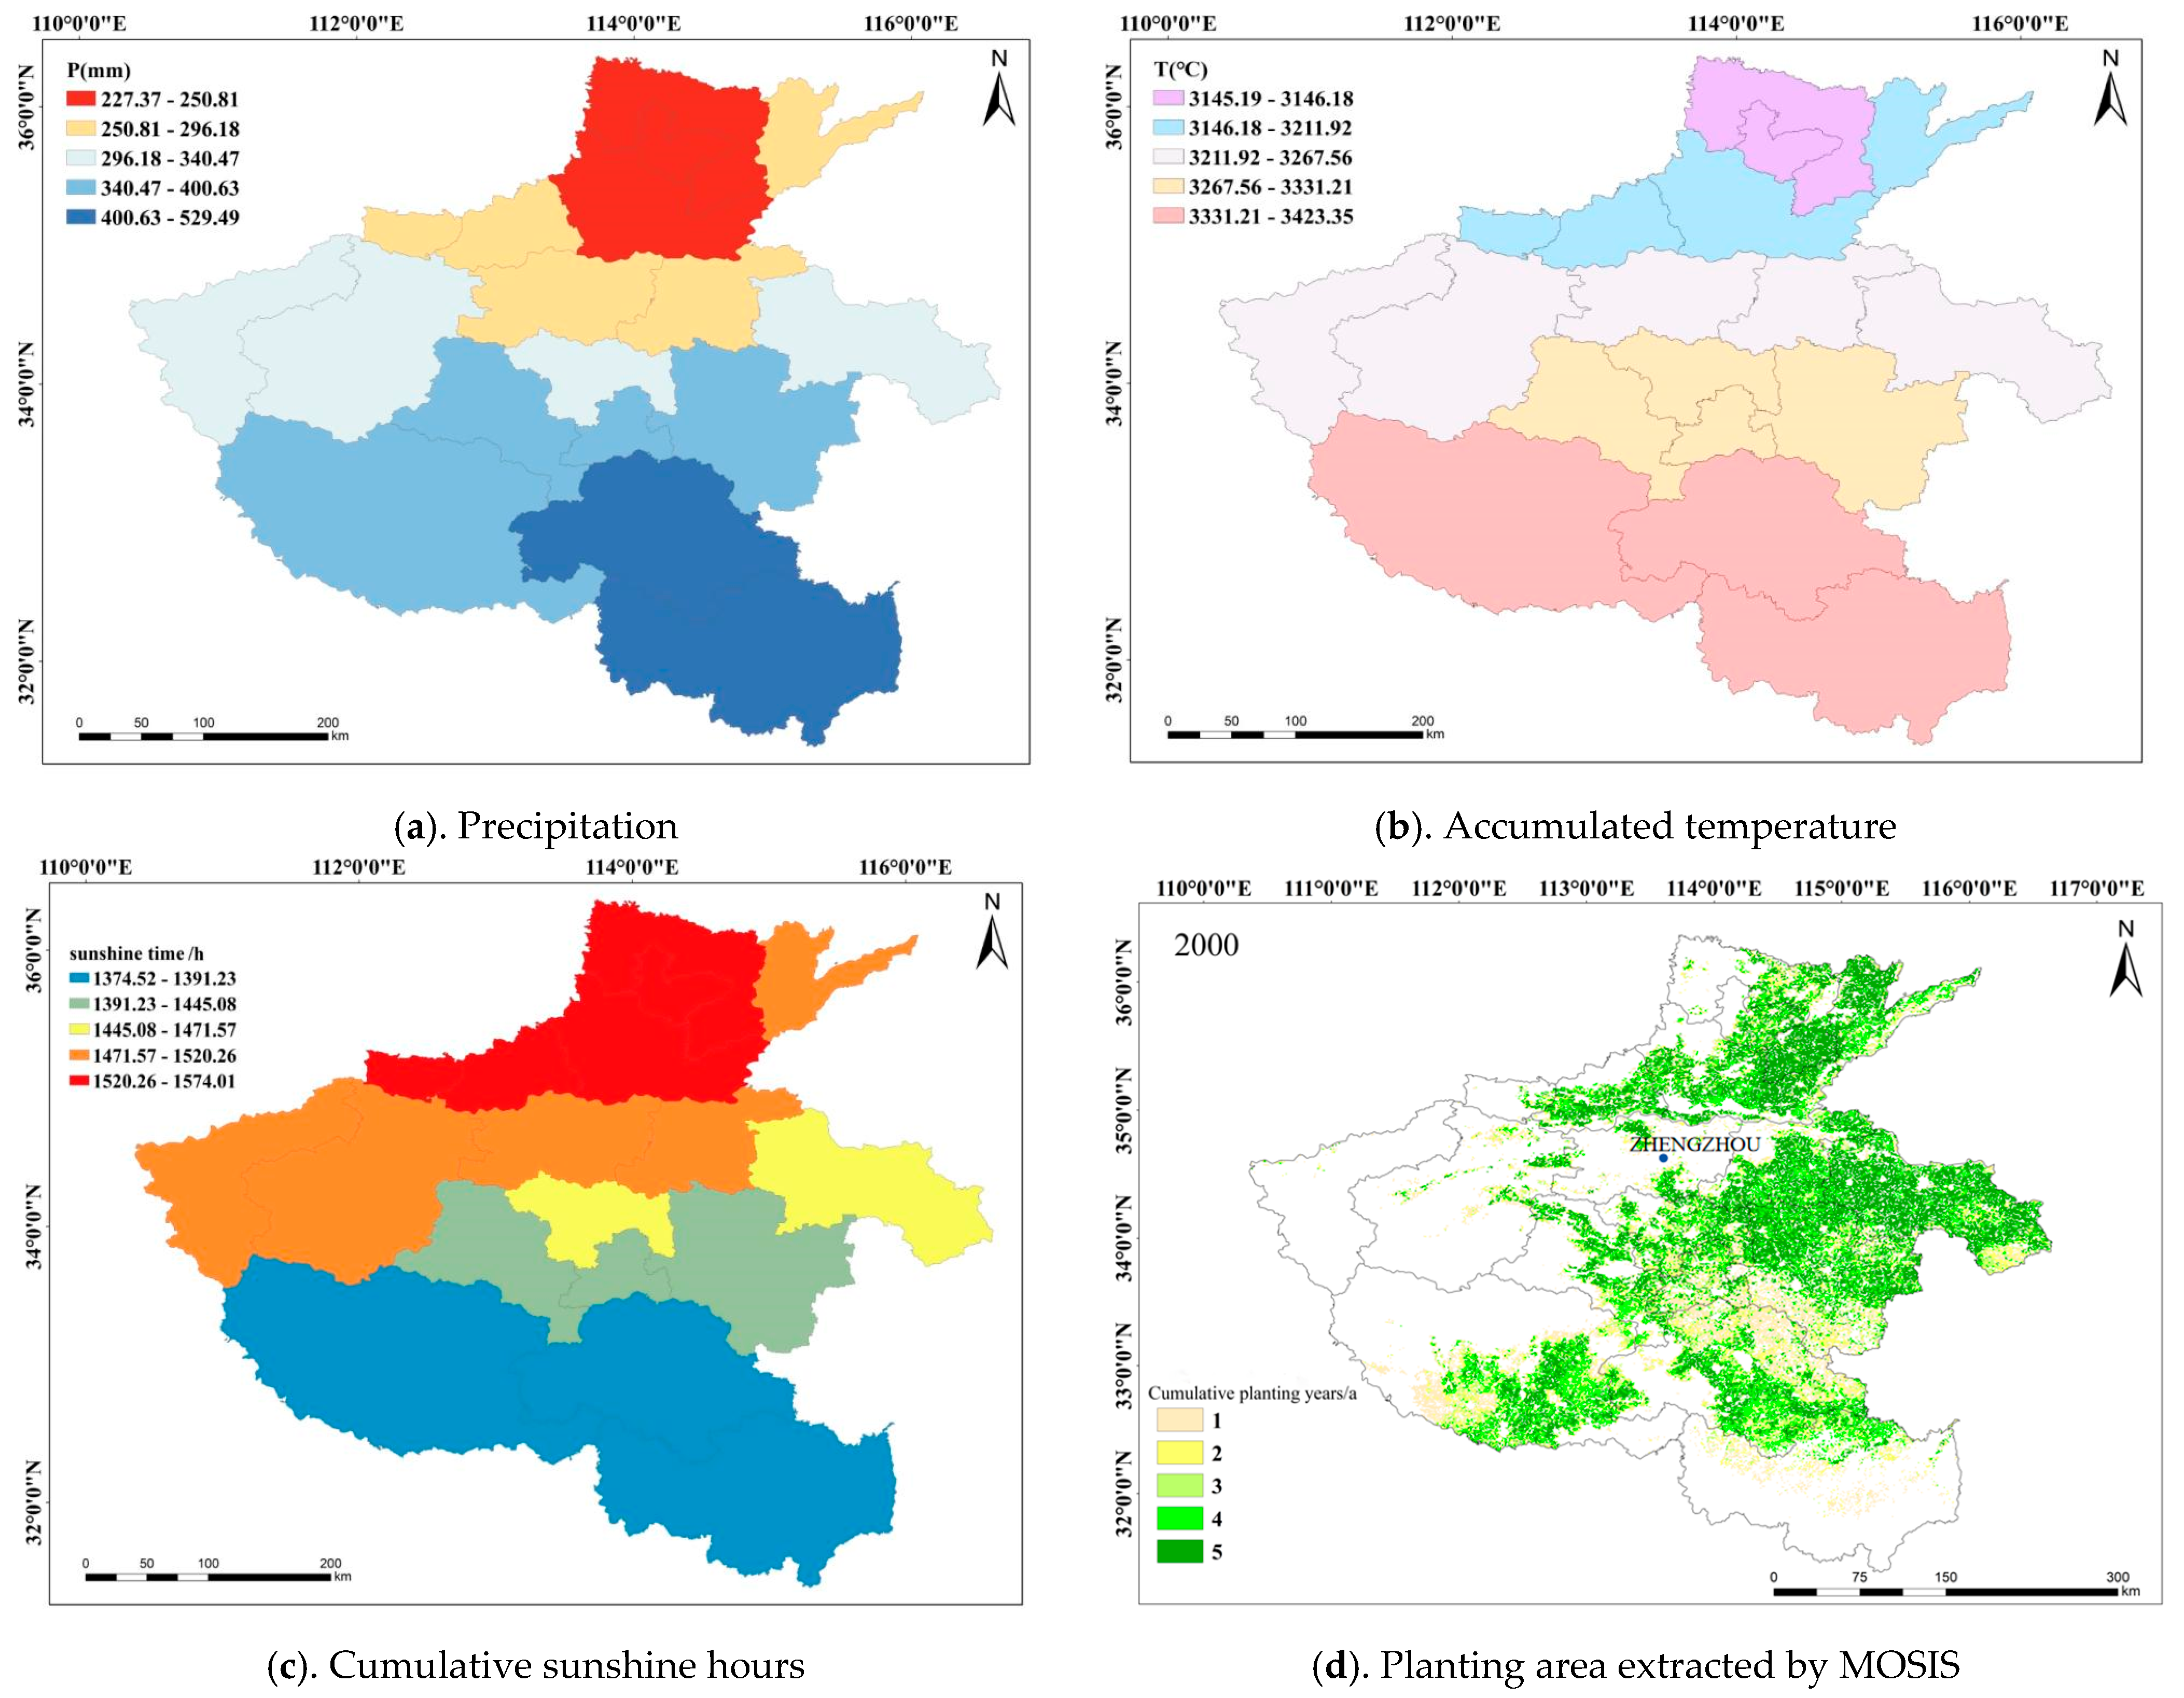
Figure 3a shows the average precipitation during the winter wheat growing season in Henan Province from 1980 to 2018, ranging from 227 to 529 mm, with a general decreasing trend from south to north. The highest precipitation (401–529 mm) occurred in parts of Xinyang and Zhumadian in the south, while most central and northern regions received less than 296 mm. The provincial average precipitation was 296.18–340.47 mm, significantly lower than the water requirement of winter wheat, making irrigation a critical measure for high yield. Spatial variations were mainly influenced by transitional climate zones, topography, and monsoon circulation. As shown in Figure 3b, the accumulated temperature during the growing season ranged from 3145 to 3423 °C, increasing from north to south. The lowest values (3145.19–3146.18 °C) were observed in Anyang and Hebi, while the highest (3331.21–3423.35 °C) occurred in southern regions. The distribution was jointly affected by latitude, topography, and solar radiation, with lower values in western and northern mountainous areas and higher values in the southern plains. Figure 3c indicates that sunshine hours decreased from north to south, ranging from 1374.52 to 1574.01 h. Longer durations (1471.57–1574.01 h) were recorded in northern Anyang and Hebi, as well as western Sanmenxia and Luoyang, whereas shorter durations (1374.52–1391.23 h) occurred in the Nanyang Basin and southern Xinyang and Zhumadian. The distribution was closely related to altitude, latitude, and weather conditions, with sufficient sunshine being crucial for winter wheat growth and yield formation.
This study utilized remote sensing data acquired from the Moderate Resolution Imaging Spectroradiometer (MODIS) in conjunction with Geographic Information System (GIS) techniques to visualize the spatial distribution and continuous planting years of winter wheat in the study region. Multi-temporal MODIS imagery from the Google Earth Engine (GEE) platform was integrated with agricultural statistical data to extract the cumulative planted area of winter wheat in Henan Province from 2000 to 2012 (Figure 3d). Comparative analysis with the spatial distributions of climatic factors, specifically precipitation, accumulated temperature, and sunshine hours (Figure 3a–c), revealed a strong spatial concordance between winter wheat cultivation extent and climatic patterns. This alignment underscores the dominant role of climate conditions in shaping the spatial variability of winter wheat planting. These findings demonstrate the synergistic value of combining remote sensing and climate data for agricultural spatial analysis.

3.2. Spatiotemporal Distribution Characteristics of Winter Wheat Yield

This study utilized the actual yield data of winter wheat in Henan Province from 1978 to 2018, with the average yield from 2009 to 2018 for each prefecture-level city serving as a representative value of the actual winter wheat yield in the study area. In this section, we employed collected and organized data, including statistical yearbooks and rural statistical yearbooks from various cities in the study area, to analyze and clarify the spatial distribution characteristics and temporal variation trends of the actual winter wheat yield from both spatial and temporal perspectives.

3.2.1. Temporal Variation of Actual Yield and Detrended Climate-Driven Yield

Figure 4 illustrates the temporal trends in winter wheat actual yield among prefecture-level cities within the study area from 1978 to 2018. The regional average yield exhibited a significant increasing trend, with a growth rate of 104.11 kg·ha−1·yr−1. This upward trend can be primarily ascribed to advancements in agricultural technology and enhanced field management practices in Henan Province during this period, including optimized fertilization, effective pest and disease control. Furthermore, the reinforcement of agricultural infrastructure, particularly the modernization of irrigation systems, ensured timely and adequate water supply, thereby supporting optimal crop growth and stable yield increase.
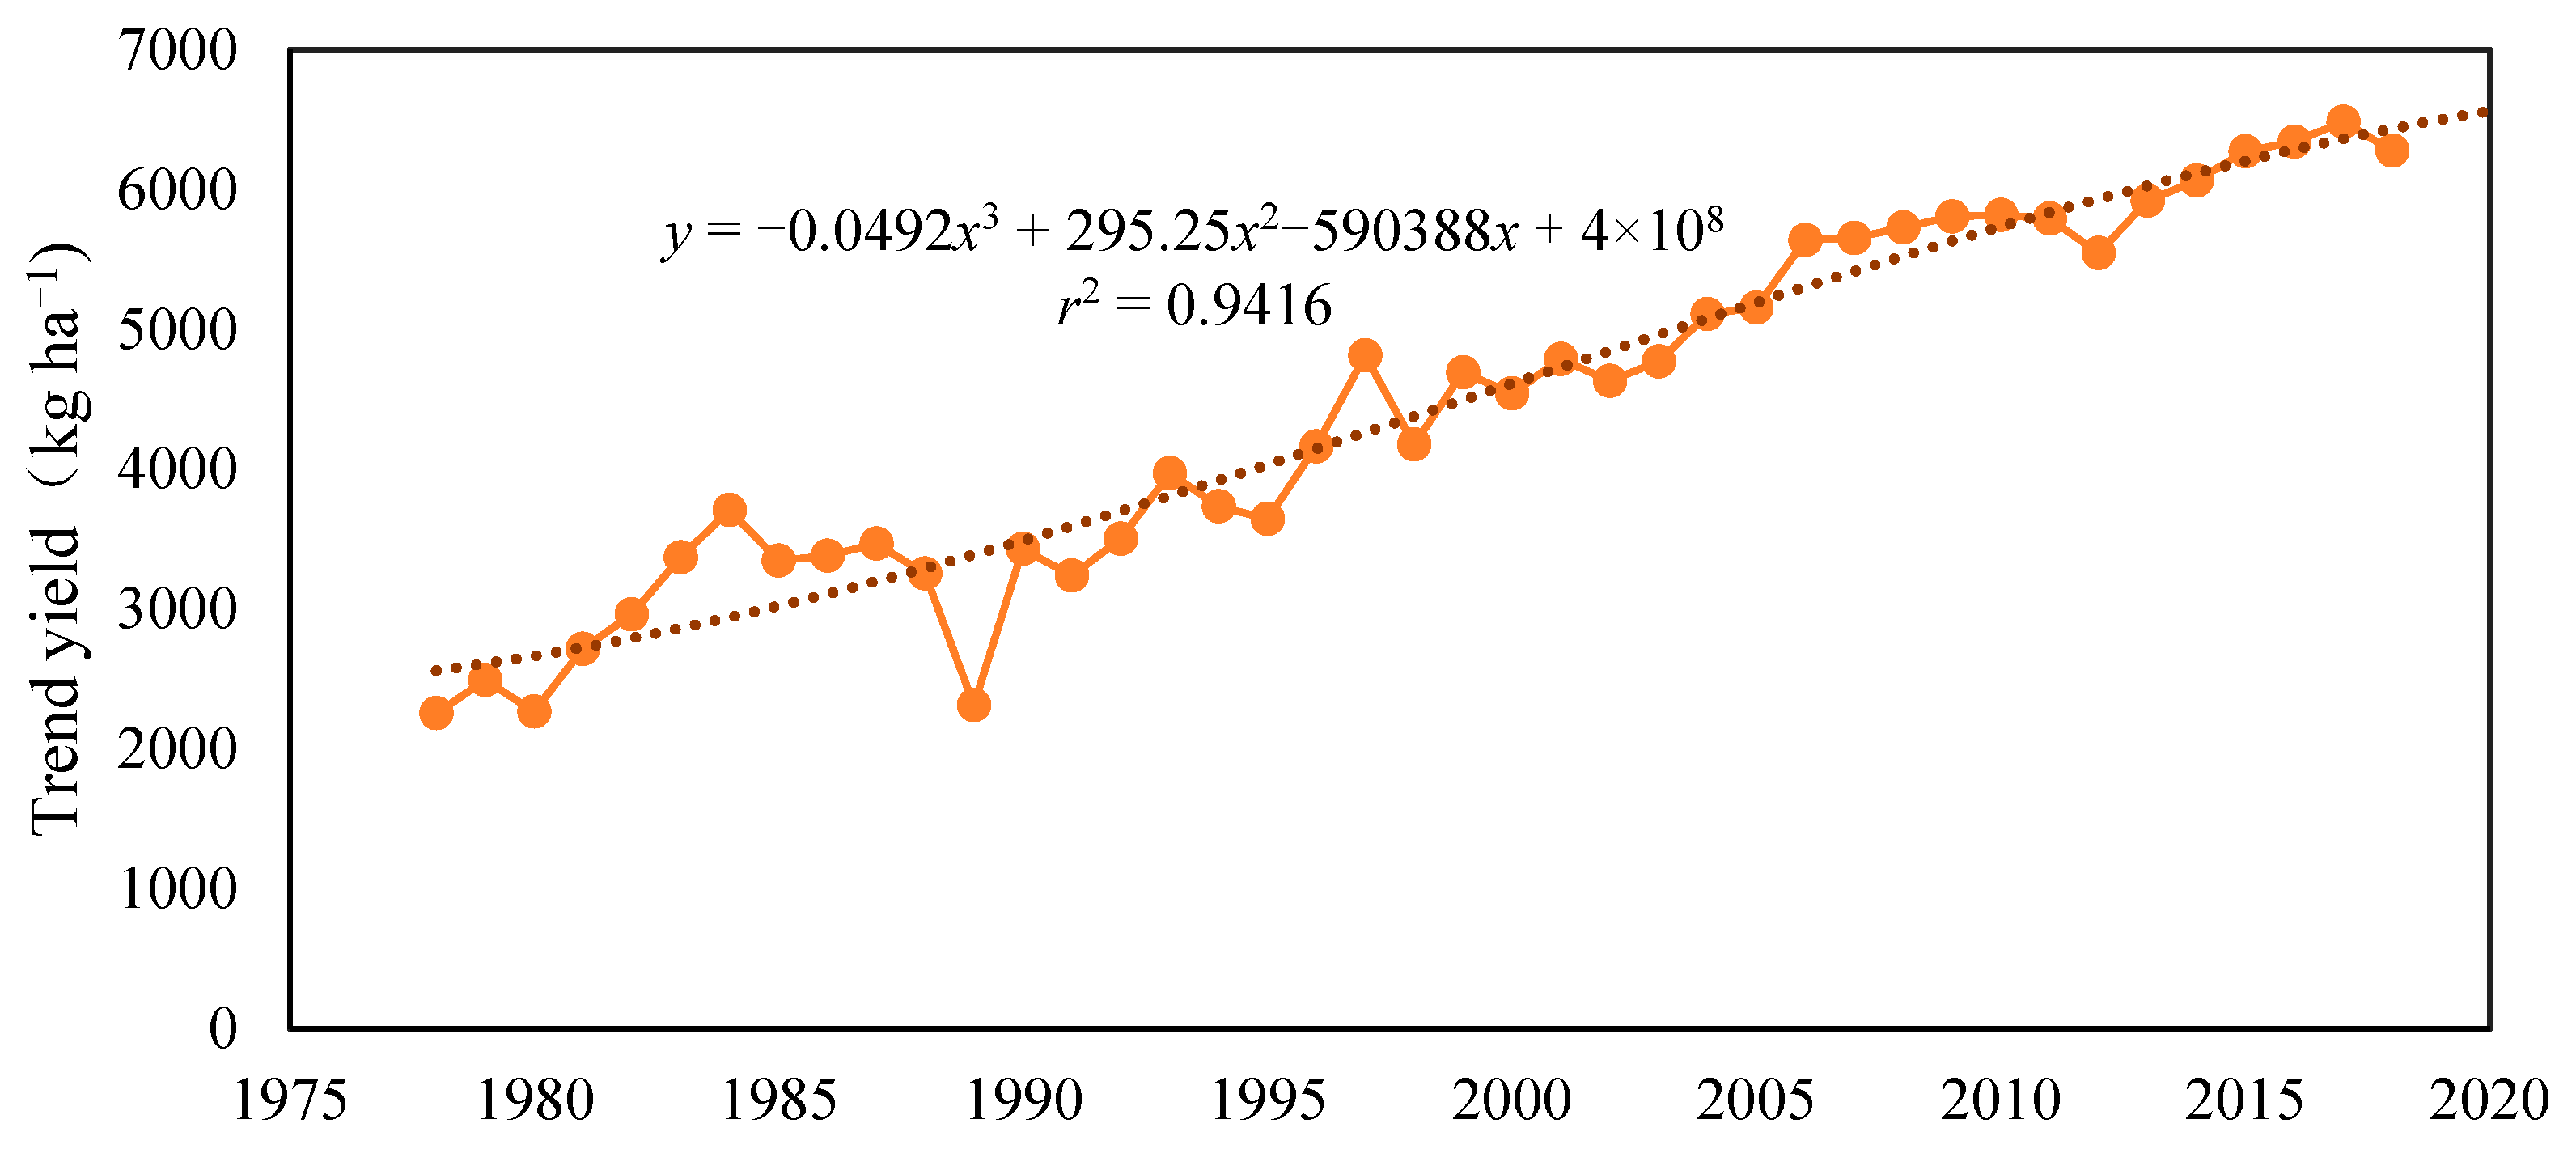
Selecting an appropriate method for separating trend yield and climate-driven yield is crucial for accurately analyzing crop production in relation to climatic characteristics. Based on established methodologies, this study applied a cubic polynomial function to fit the trend yield of winter wheat in Henan Province using yield data from 1978 to 2018. As shown in Figure 5, the fitted trend yield generally exhibited an upward trajectory over time and aligned closely with the actual yield in most years. However, the cubic polynomial method did not accurately capture yield fluctuations during the period 1987–1996, when actual yields first declined and then increased, indicating that this approach may not be fully suitable for our study. Refined decomposition of climate-induced yield is needed to improve fitting accuracy.
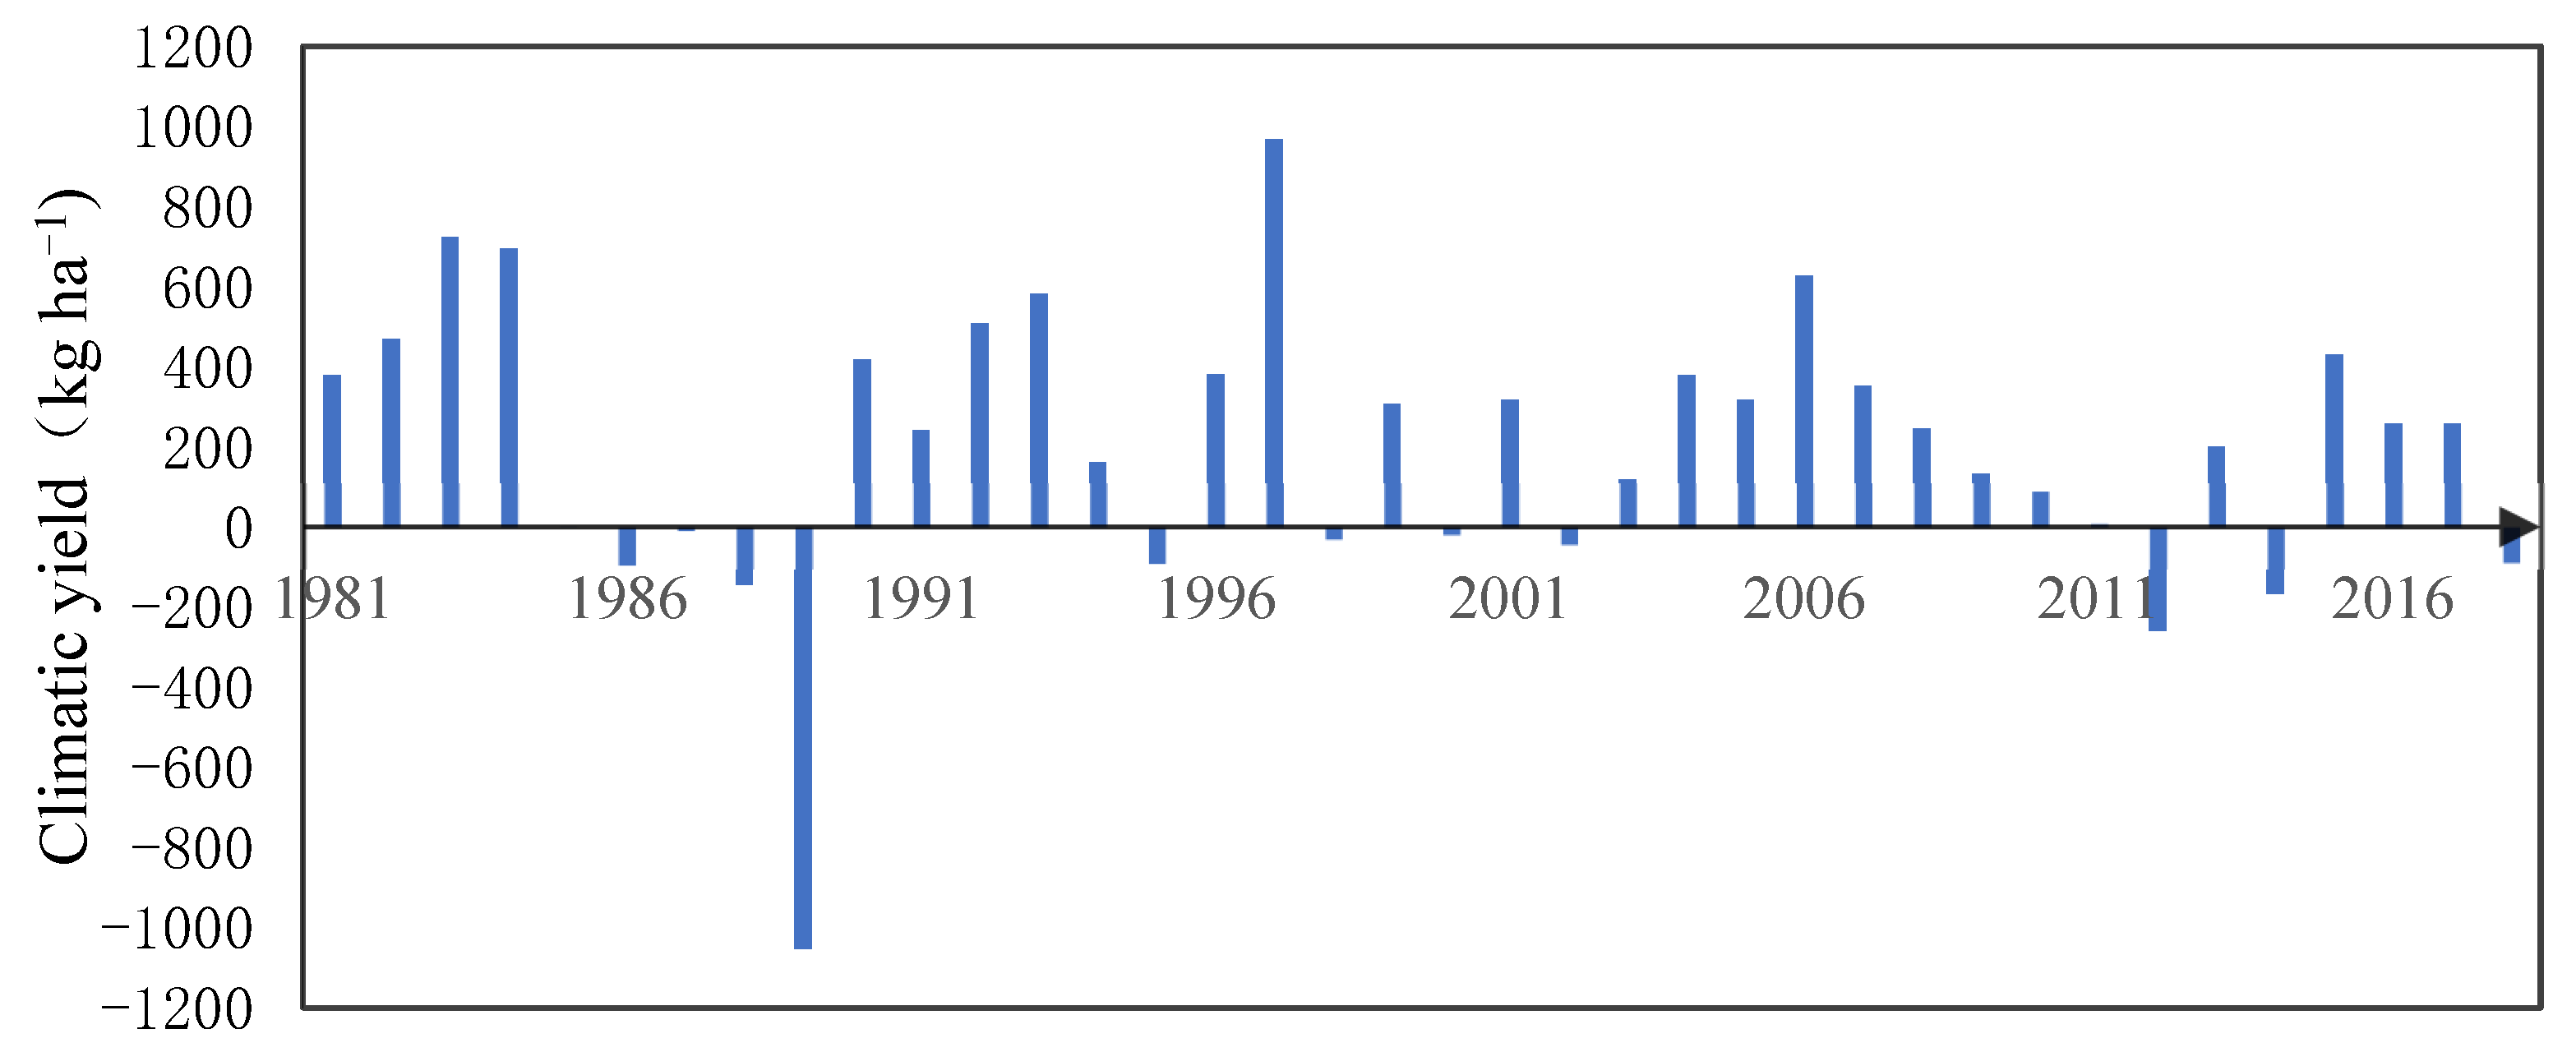
Figure 6 presents the climate yield, where positive and negative values indicate beneficial and adverse impacts of climate variations on winter wheat yield, respectively, while the magnitude of fluctuations reflects the extent of these impacts. The chart reveals that, prior to 2003, climate variability had a pronounced effect on yield, with a higher frequency of yield-reduction years. After 2003, the occurrence of negative climate yield values decreased noticeably. This shift can be attributed to continuous improvements in agricultural technologies, scientific innovations in farming practices, and enhanced expertise among farmers, which collectively have strengthened resilience to climate variability. It is also noteworthy that climate yield continues to exhibit considerable interannual variability, underscoring the severe impact of extreme weather events—such as droughts and floods—on winter wheat production.

3.2.2. Spatial Distribution of Actual Yield and Climate-Driven Yield

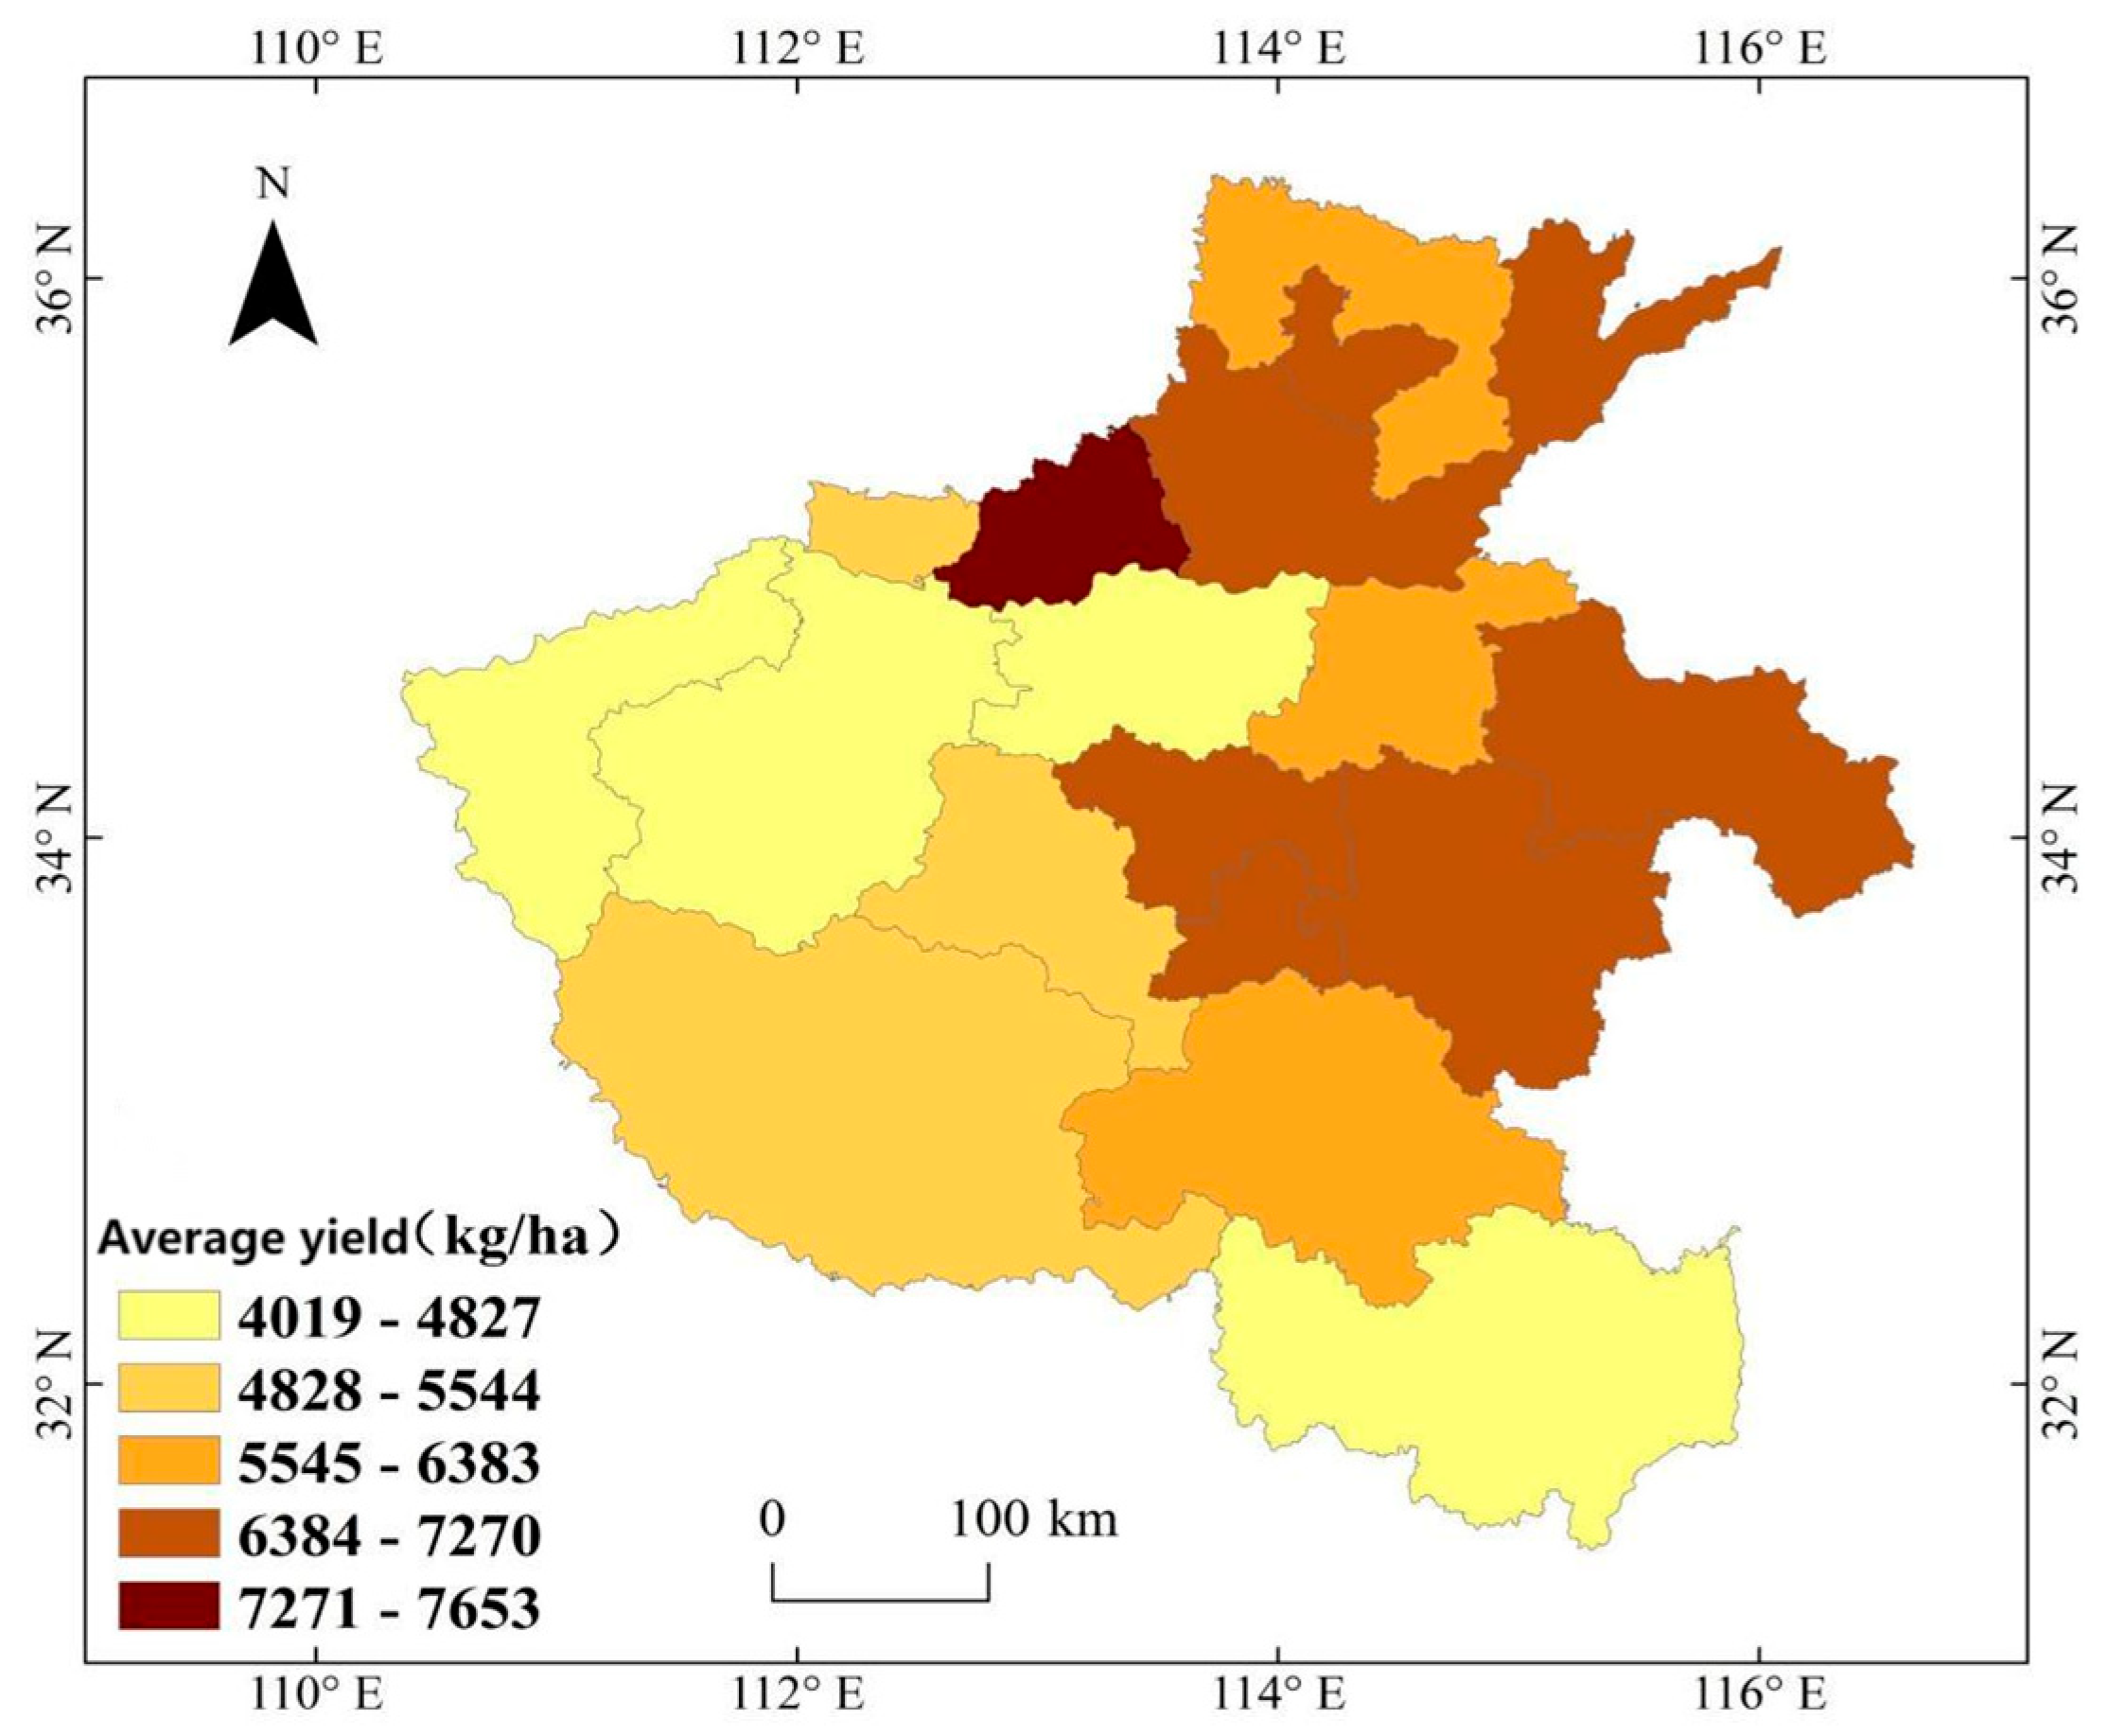
Figure 7 illustrates pronounced spatial heterogeneity in winter wheat yield across the study area, driven by climatic, edaphic, agronomic, and socioeconomic factors. Higher yields are observed in northern (e.g., Hebi, Jiaozuo, Xinxiang, Puyang) and eastern (e.g., Xuchang, Luohe, Zhoukou, Shangqiu) cities, whereas lower yields occur in western regions such as Sanmenxia and Luoyang. Topography plays a critical role in this distribution: the flat, fertile plains of eastern and northern Henan, with superior irrigation infrastructure and mechanization capacity, support high yields. In contrast, mountainous and hilly terrain in western and southern areas (e.g., Sanmenxia, Luoyang, Xinyang) restricts arable land, limits mechanization, and reduces yield potential.
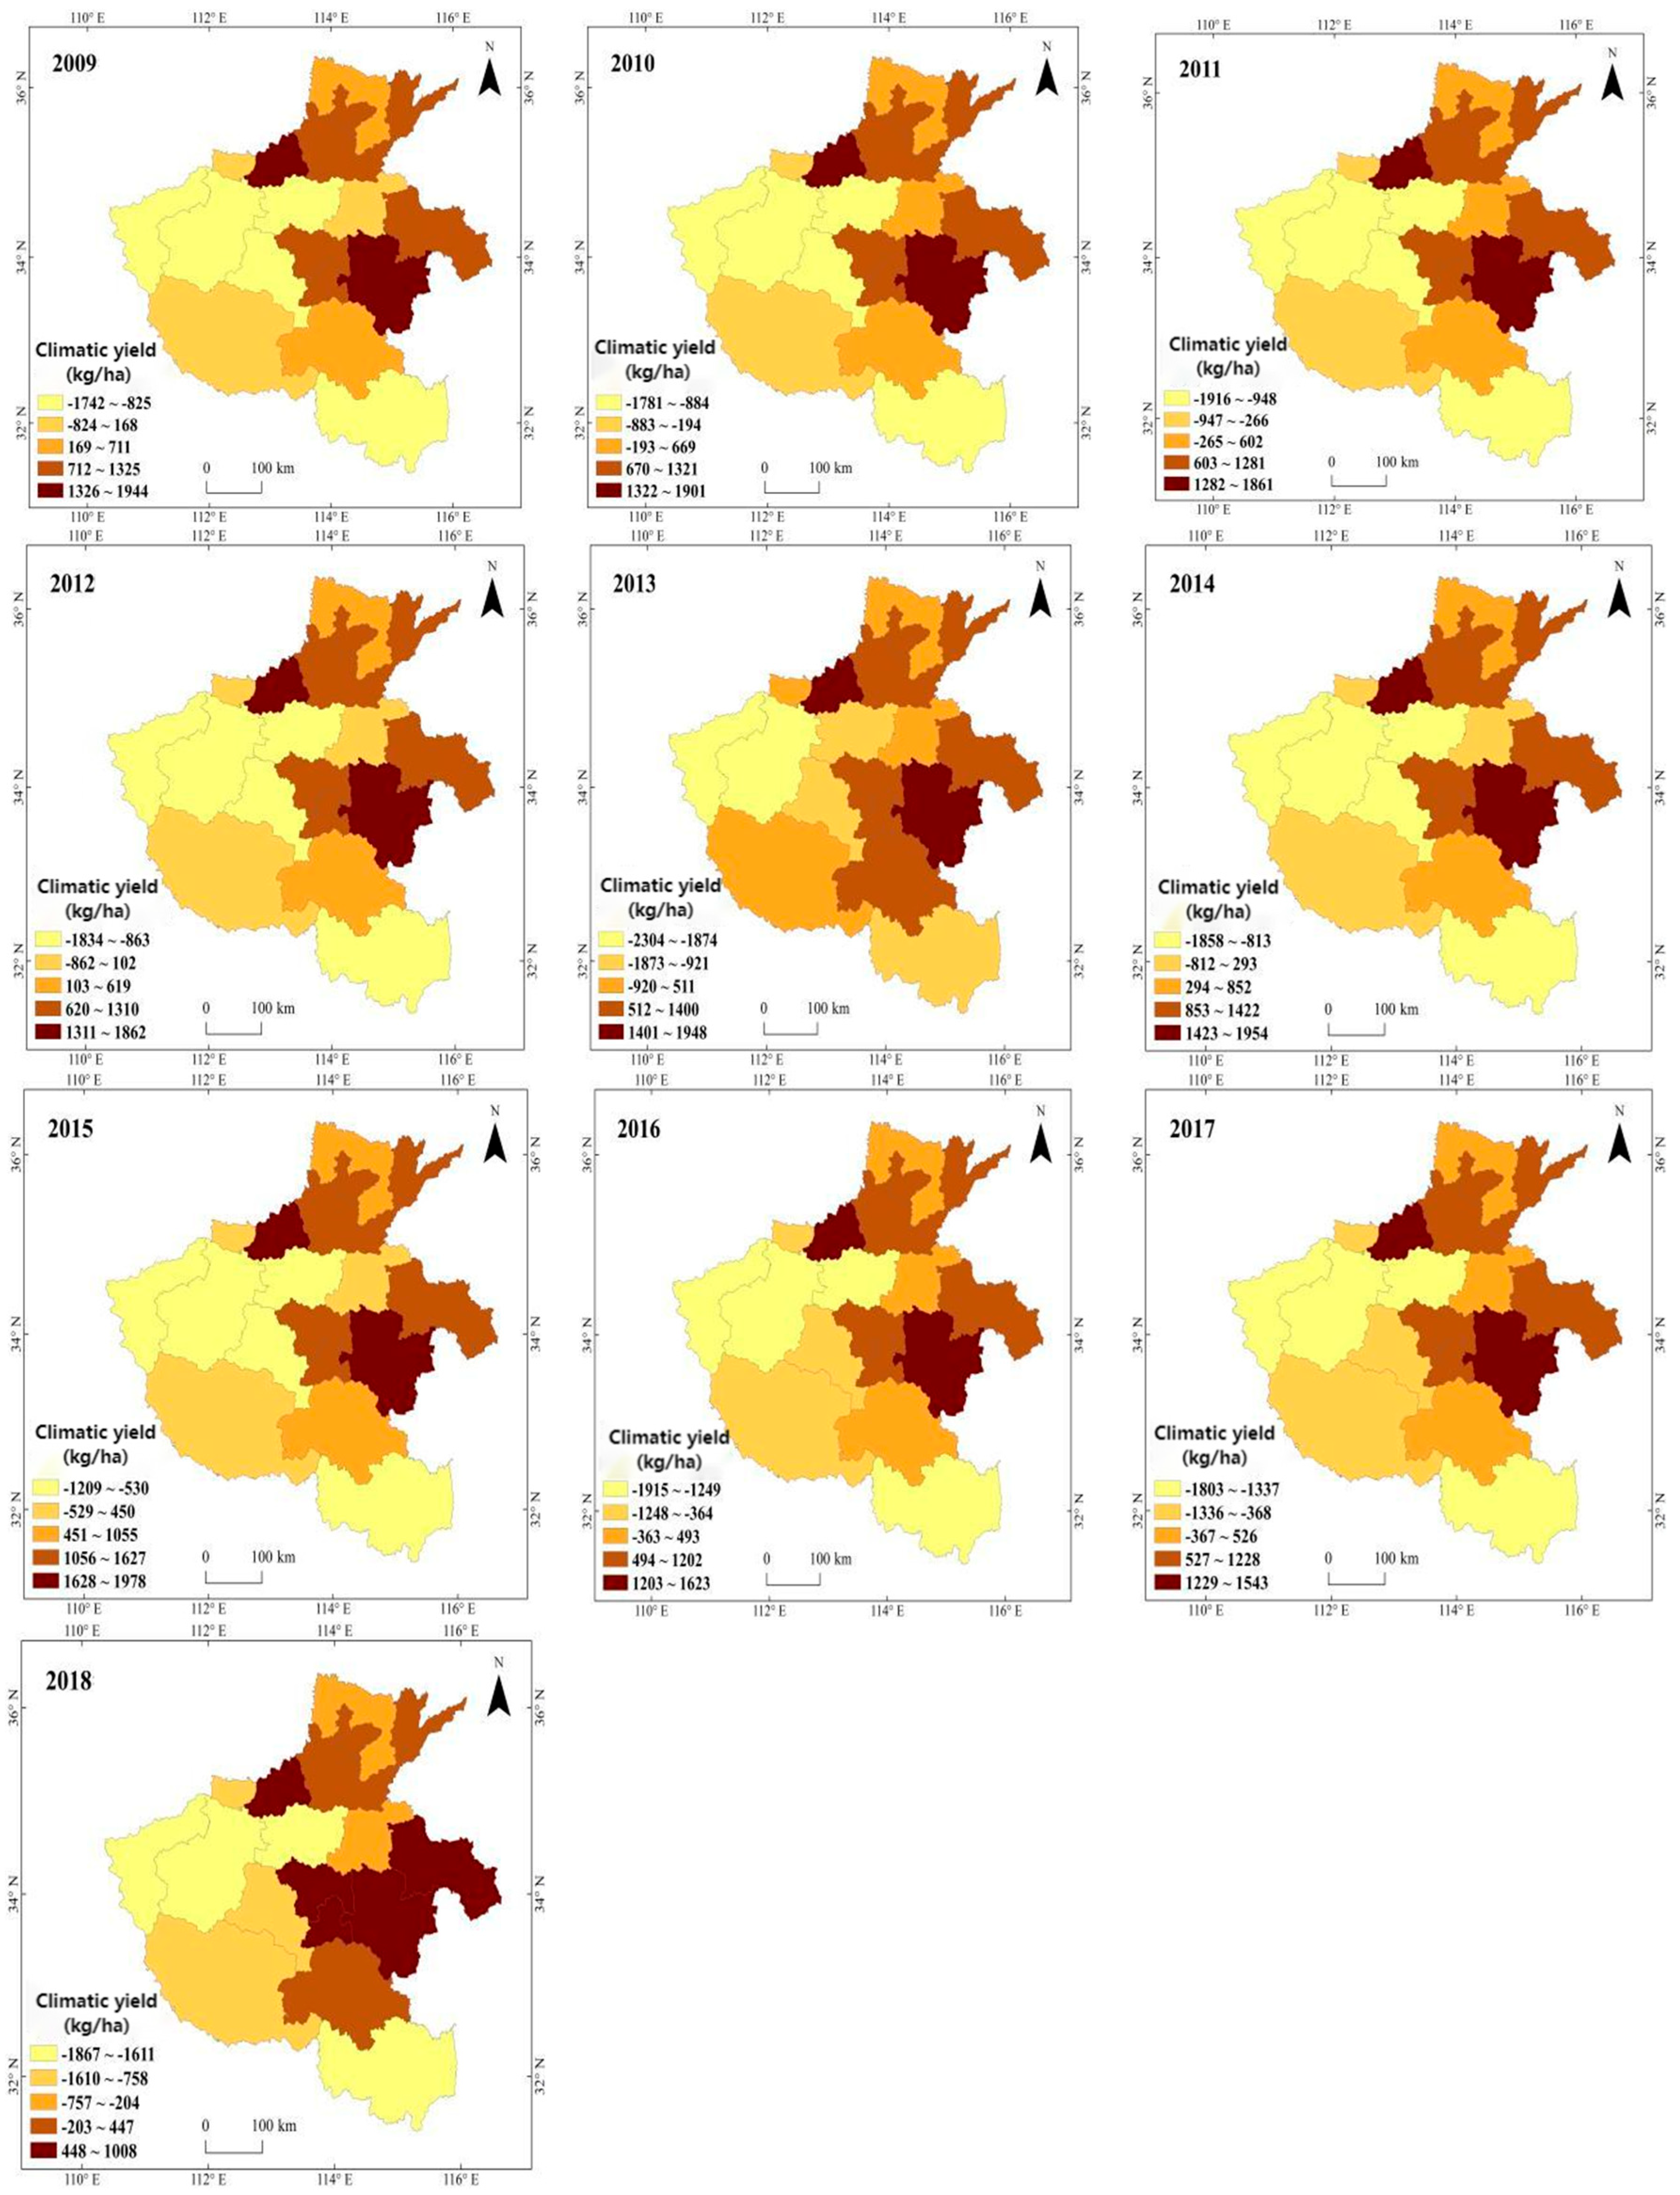
Figure 8 presents the spatial distribution of climate-driven yield anomalies for winter wheat across 18 prefecture-level cities in Henan Province from 2009 to 2018. The results indicate a relatively stable interannual variability in climate yield across the province. Although the humid climate in southern regions is generally conducive to wheat growth, excessive precipitation has frequently led to increased disease and pest pressures, as well as harvesting difficulties, thereby negatively affecting yield formation. However, because winter wheat is cultivated on a smaller scale in the south, the impact of climate-induced yield fluctuations there is less pronounced. In contrast, the larger cultivation areas in the north amplify climate-related risks.
Firstly, the factor detector module of the Geodetector was employed to obtain the relative importance values (q) of the influencing factors on climate-sensitive yield, as detailed in Table 4. Among these six influencing factors, accumulated temperature, precipitation, and sunshine hours exhibit relatively stronger explanatory power, whereas wind speed and soil type show comparatively weaker influences.
Secondly, by integrating historical climate data with yield records for historical yield simulation analysis, we can thoroughly investigate the correlation between climate change and winter wheat yield, thereby elucidating the actual impact of climate variability on agricultural productivity. Thus, we further investigated the effects of key meteorological factors during the growing season—including precipitation, accumulated temperature, sunshine hours, humidity, wind speed, and evaporation—on winter wheat yield and analyzed their correlations, as illustrated in Figure 9. Using the Geodetector method, we also evaluated the interactive effects between pairs of these factors on climate-driven yield. The results reveal that for most factor pairs, the interaction effect exceeded the sum of their individual effects, indicating a non-linear enhancement. All six factors exhibited mutually reinforcing interactions, suggesting that synergistic amplification among meteorological drivers significantly enhances their individual impacts on climate yield. To achieve long-term yield stability, it is essential to account for the influence of climate factors and their variability when formulating region-specific irrigation, fertilization, and cultivation practices.

3.3. Winter Wheat Yield Analysis and Prediction Under Future Climate Scenarios

3.3.1. Calibration and Validation of APSIM Model

As shown in Figure 10a–c, under the SSP245 climate scenario, the APSIM model was able to explain more than 62.9%, 82.6%, and 76.4% of the observed variance in winter wheat yield in Zhengzhou, Xinxiang, and Luoyang, respectively, during the period 2013–2023. The simulated values showed good agreement with the observed data, with most data points distributed near the 1:1 line.
The accuracy evaluation results of APSIM indicated that the RRMSE between the simulated and observed values was 3.2% for Zhengzhou, 7.2% for Luoyang, and 7.6% for Xinxiang. All values were below 15%, demonstrating high calibration and validation accuracy of the model and confirming its suitability for simulating climate change impacts. Figure 11 is the simulation results displayed in the APSIM model interface.
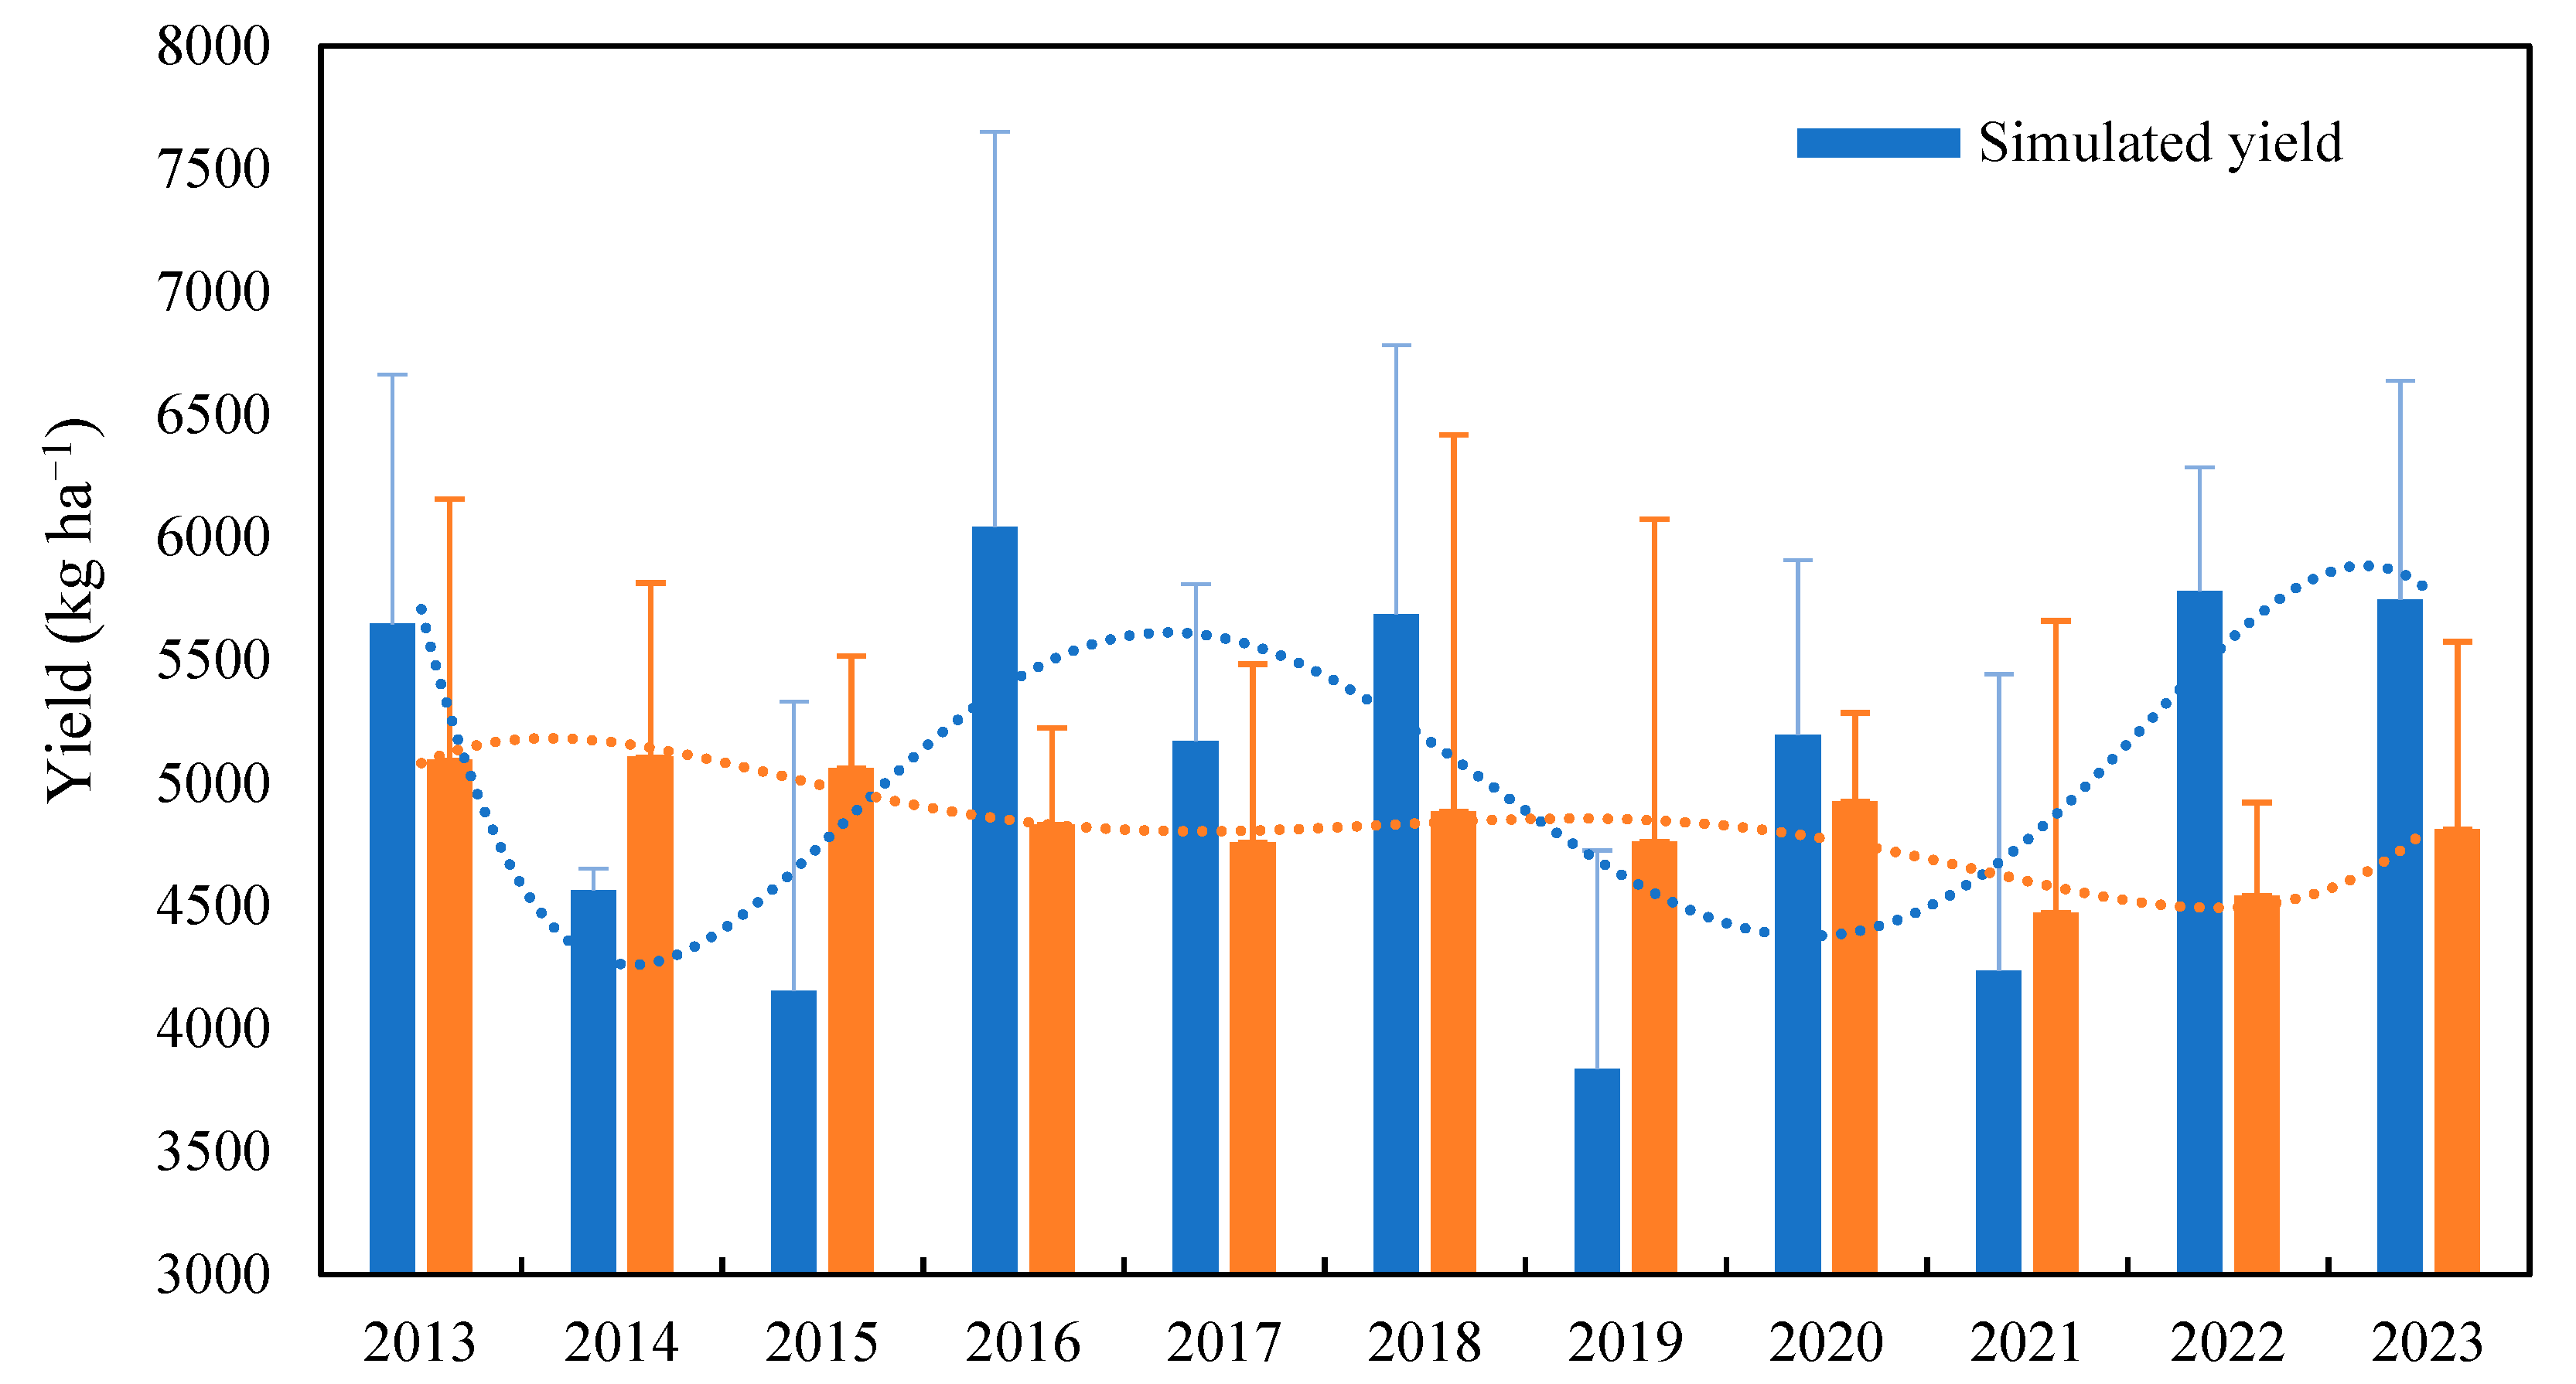
A comparison between simulated and actual yields indicates a high model fit, demonstrating strong predictive capability for winter wheat yield. The validated model was subsequently applied to simulate yield in various cities of Henan Province through the year 2100. These simulations provide valuable insights for formulating agricultural policies and management strategies, thereby supporting scientific decision-making in agricultural management. Taking Zhengzhou as a representative site, the simulation of historical winter wheat yields from 2013 to 2023 (Figure 12) reveals a generally stable yield trend over the period.
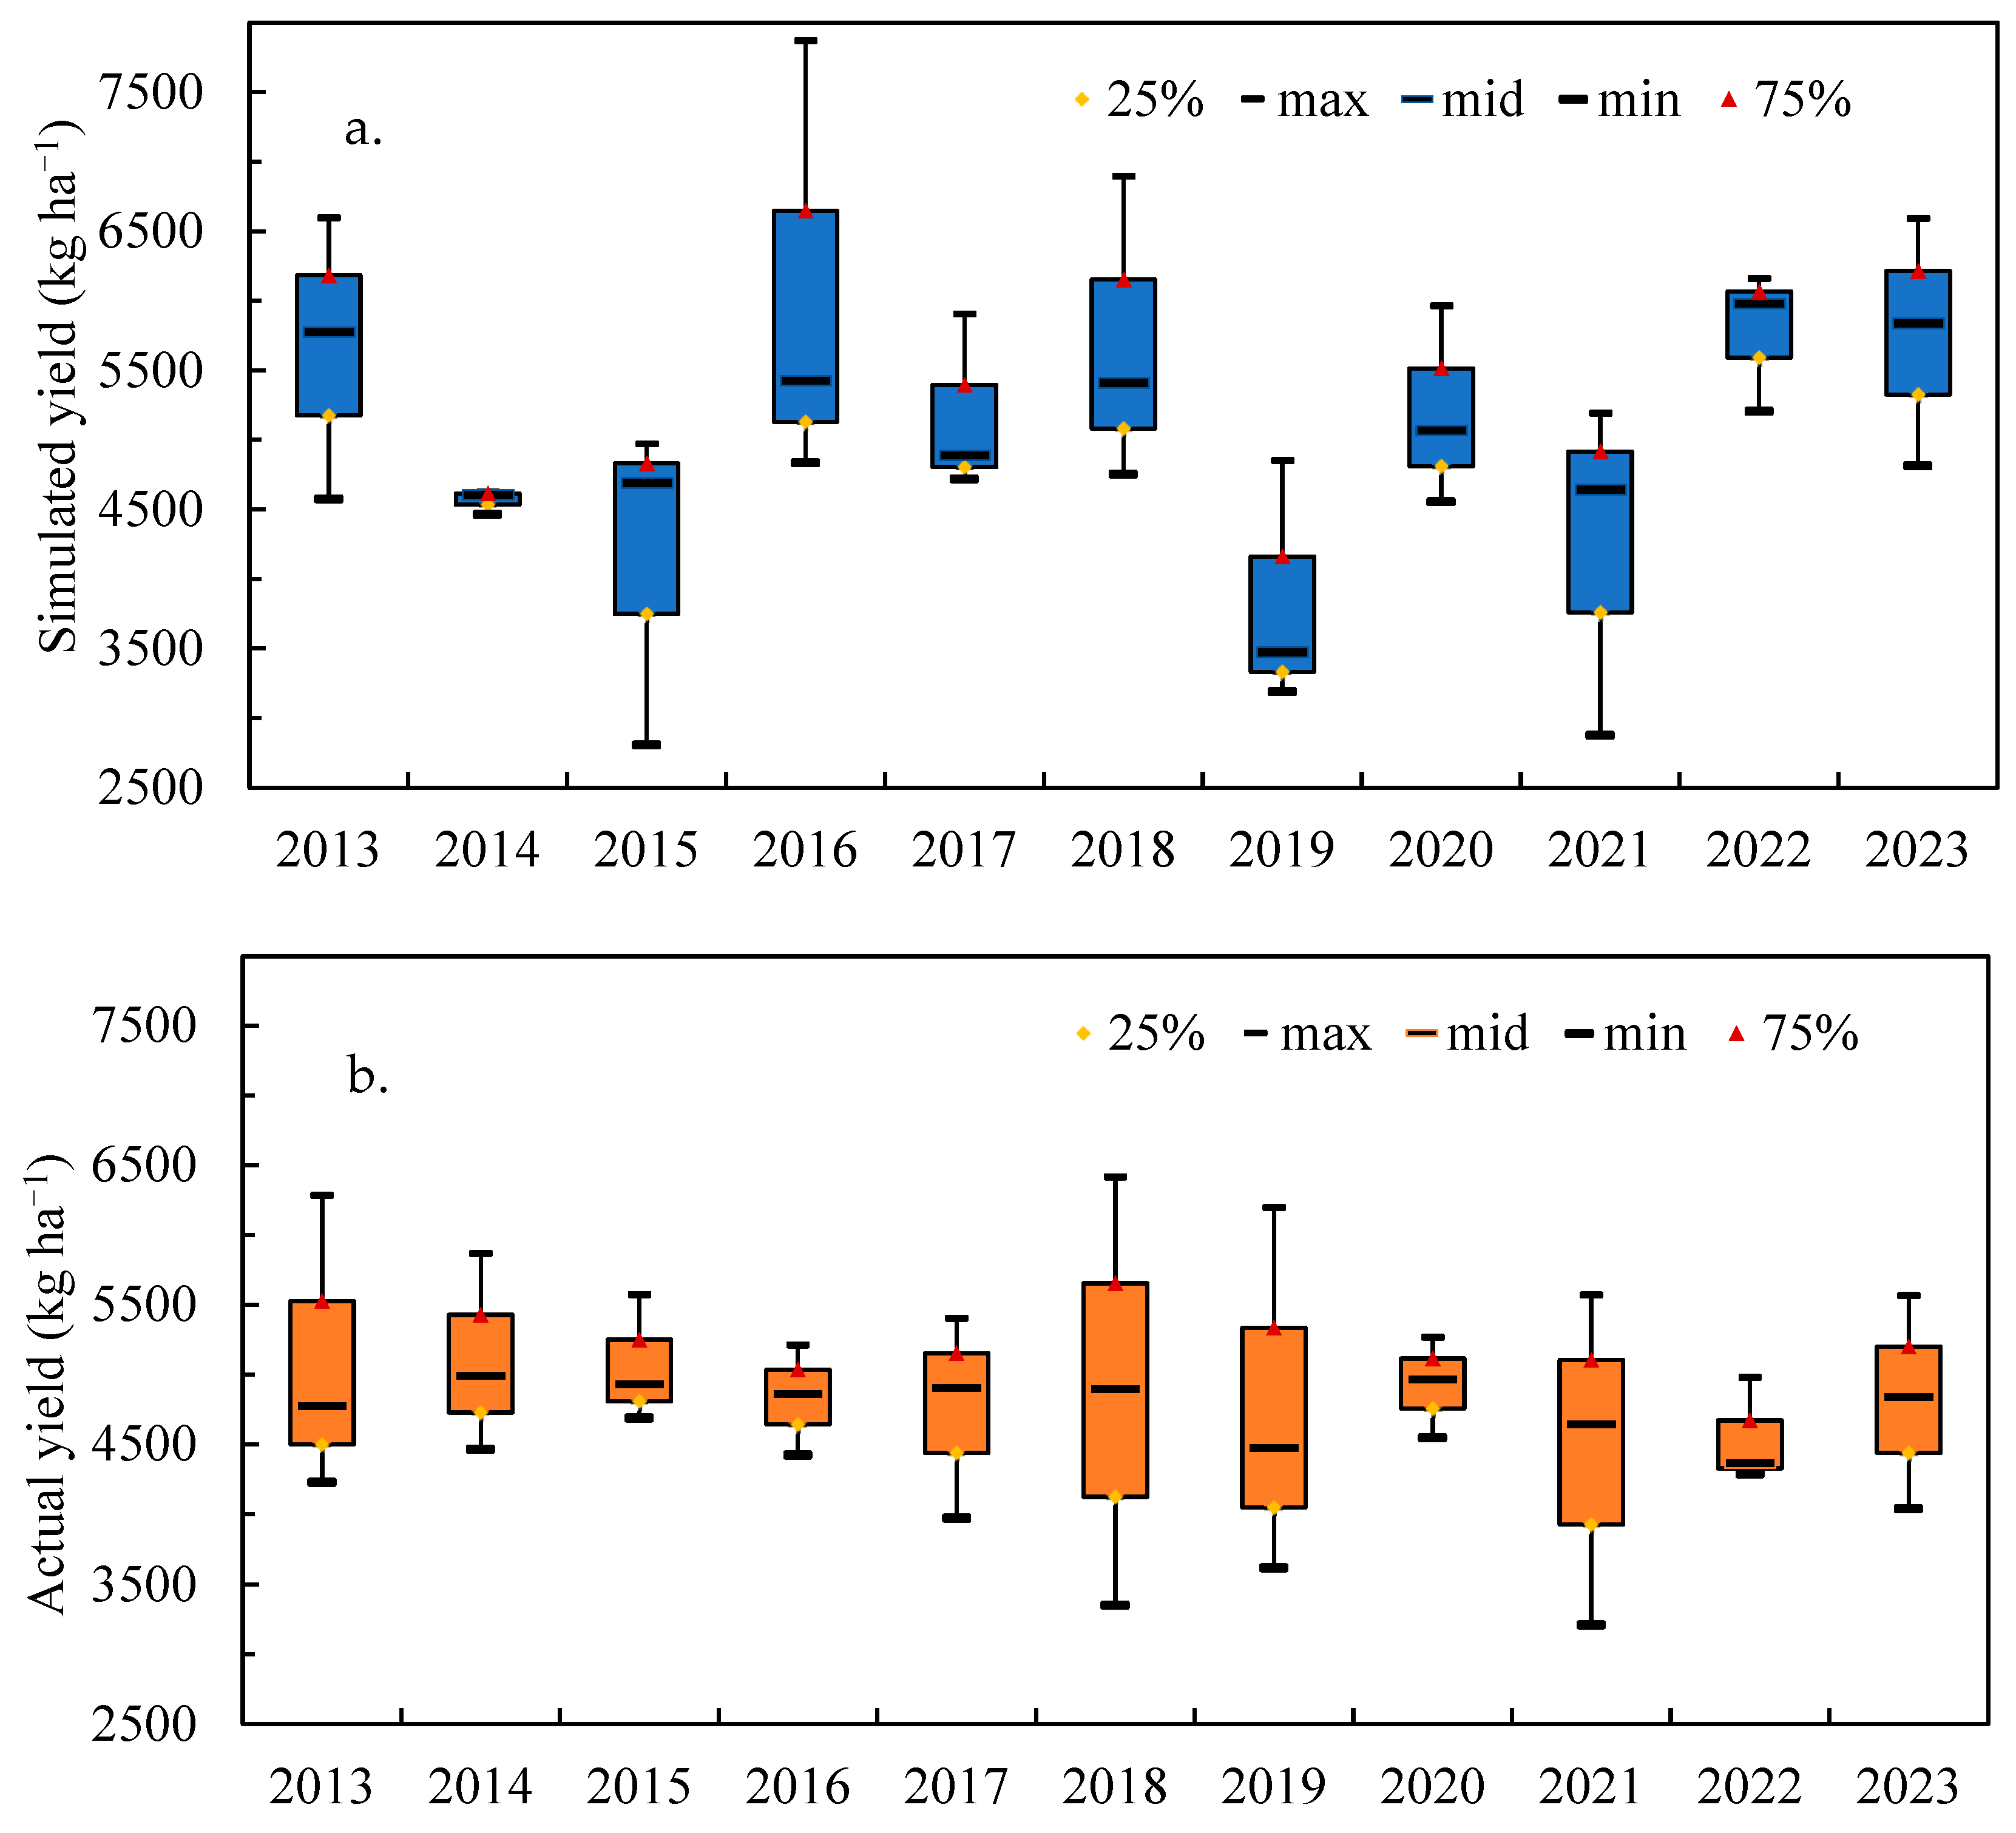
As shown in Figure 13, both the simulated and observed winter wheat yields exhibited similar periodic fluctuations, although the amplitudes differed. To quantitatively assess this variability, we calculated the coefficient of variation (CV). The CV of the simulated yields was 0.18 ± 0.08, compared to 0.17 ± 0.09 for the observed yields. The close agreement between these CV values, along with the fact that both datasets approximately followed a normal distribution, indicates that the APSIM model effectively captures the inter-annual yield variability observed in reality, demonstrating its robust simulation capability. In conclusion, the main findings of this study regarding the spatiotemporal patterns and yield increase potential under SSP245 are robust across the considered uncertainties.

3.3.2. Winter Wheat Potential Yield Prediction Under Future Climate Scenarios

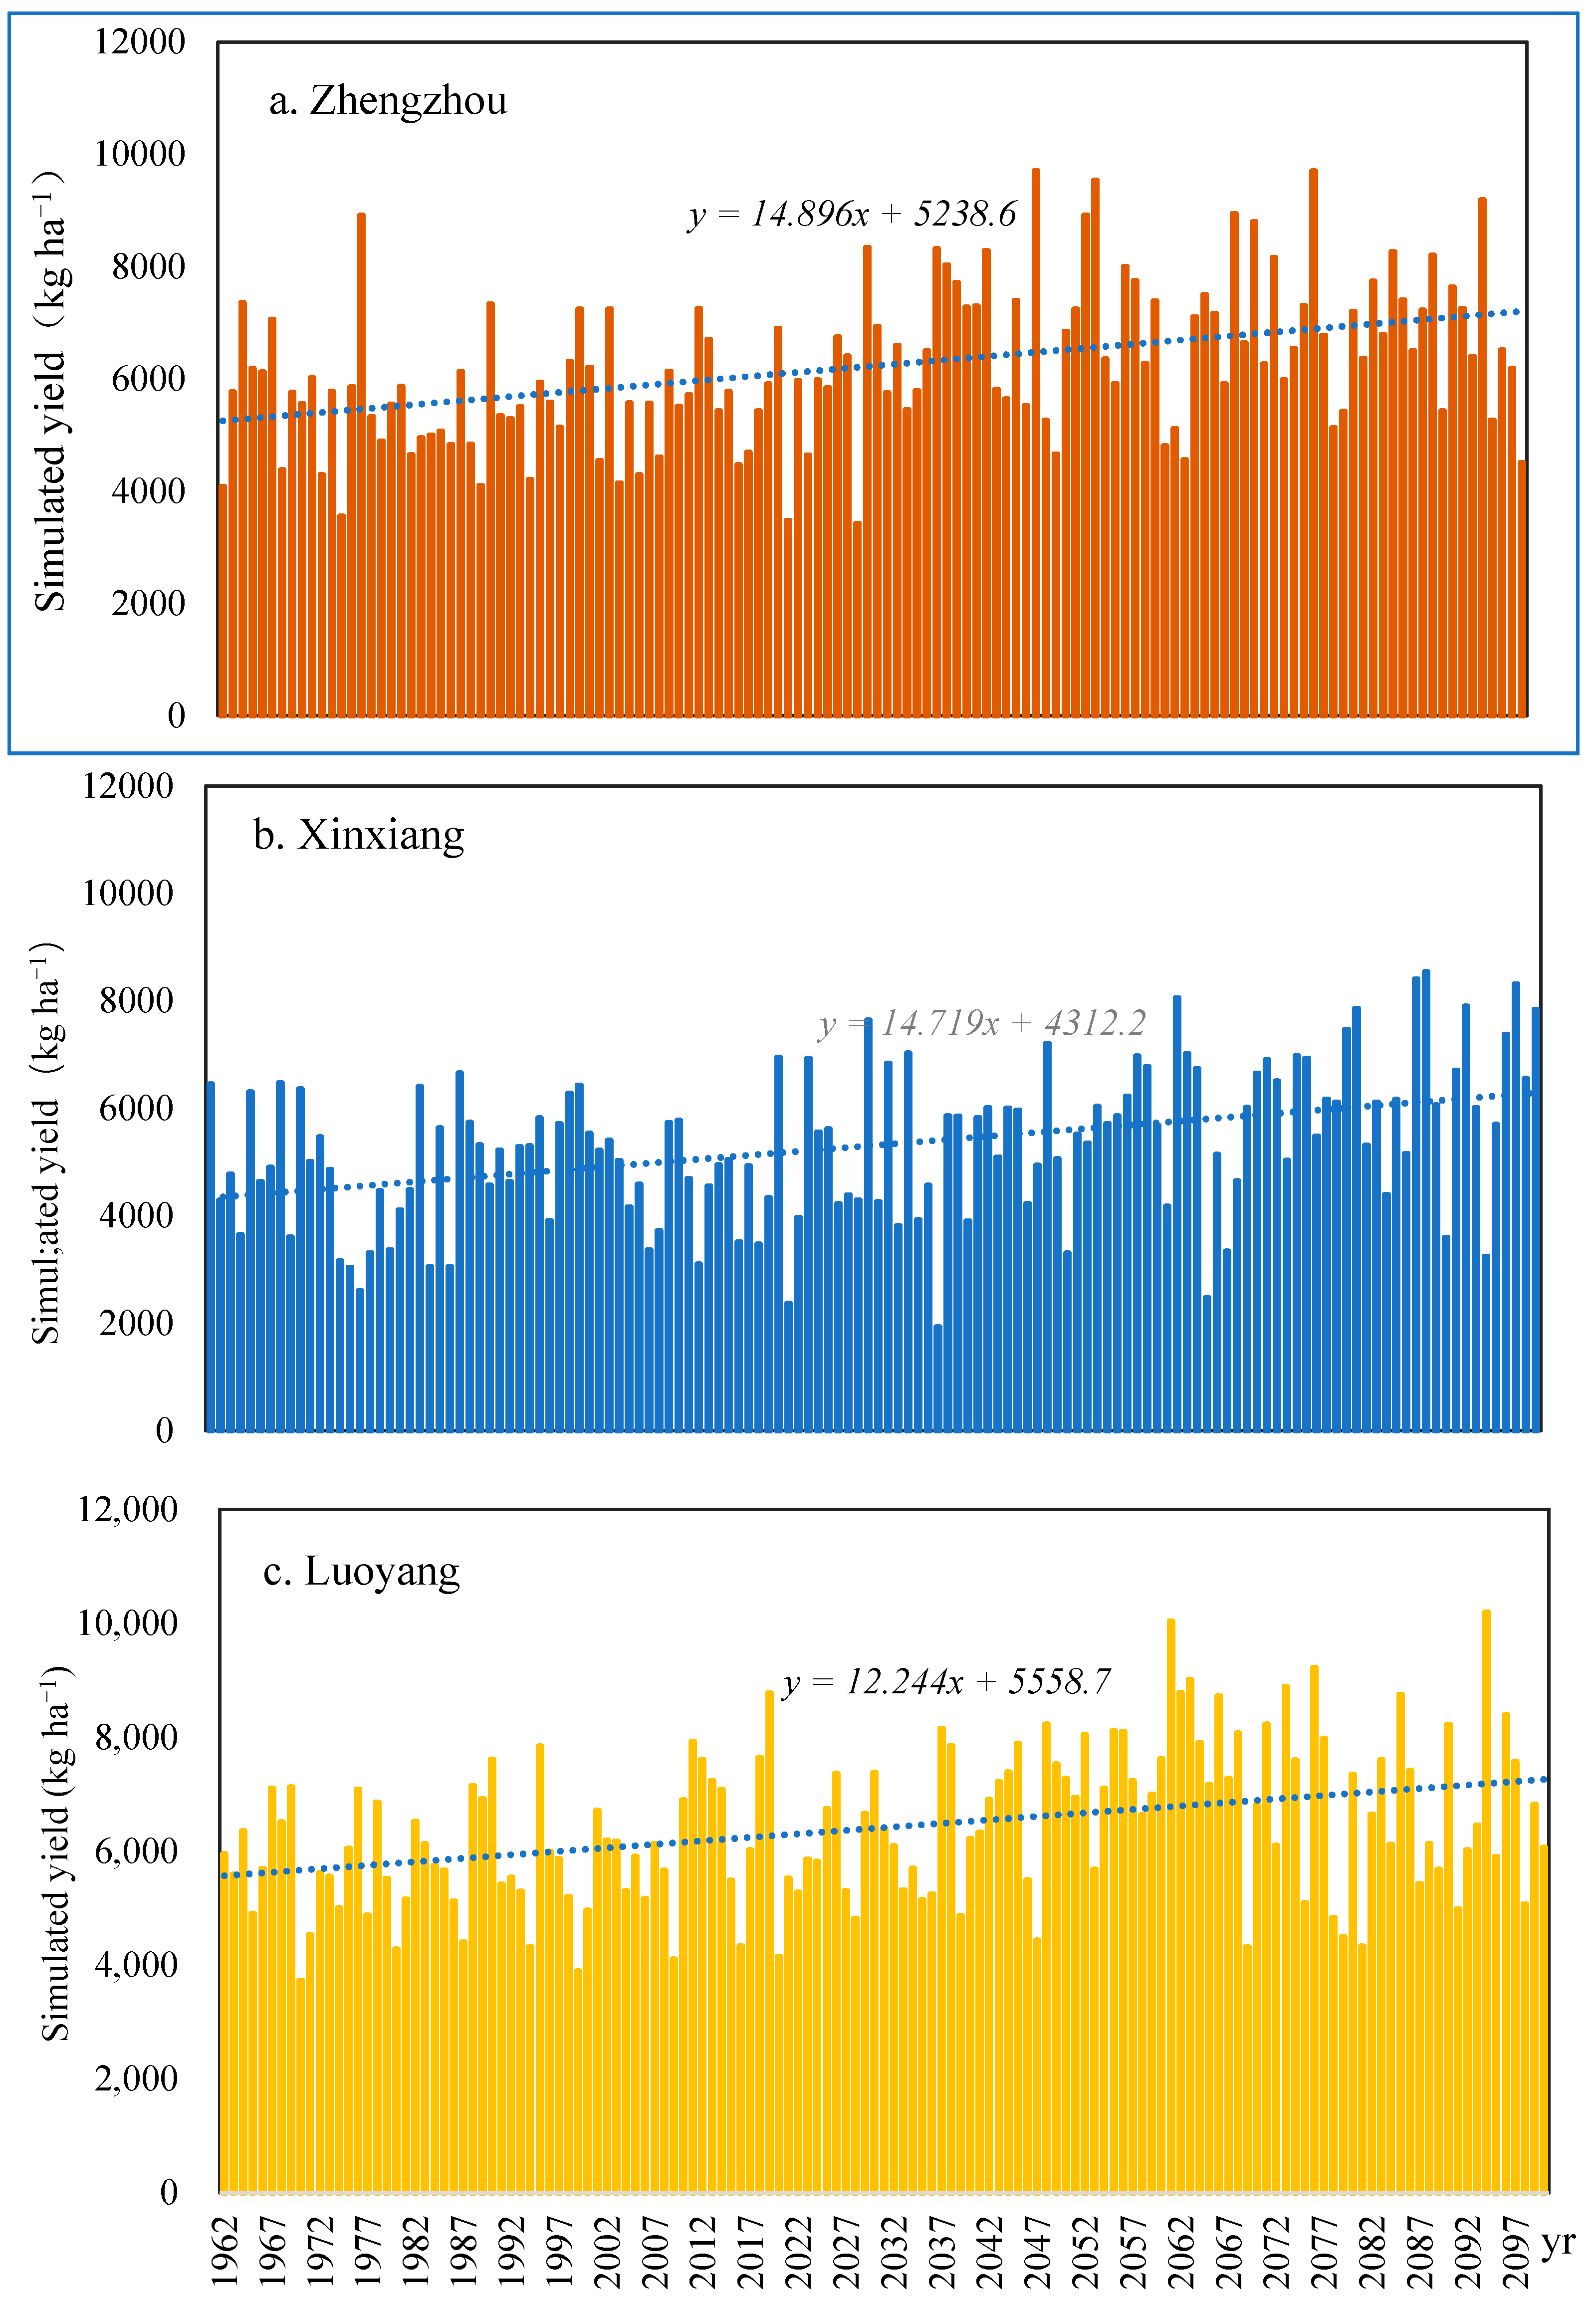
This study evaluates future winter wheat yield trends in Henan Province under the SSP245 scenario. SSP245 integrates the Shared Socioeconomic Pathways (SSP) with the Representative Concentration Pathways (RCP) framework, representing a moderate climate forcing pathway characterized by intermediate socioeconomic development and mild climate mitigation strategies. Within this scenario, a multi-model ensemble—including Global Climate Models (GCMs) and Regional Climate Models (RCMs)—was employed to simulate and analyze future winter wheat yields in the region. Due to limitations in meteorological data availability, the simulation focused on three representative cities within the Yellow River Basin in Henan Province: Zhengzhou, Xinxiang, and Luoyang (Figure 14).
Through these future yield simulations, this study aims to provide proactive production layout recommendations for farmers and agricultural sectors, thereby supporting strategic planning for regional grain supply stability. Furthermore, it seeks to elucidate the potential impacts of climate change on winter wheat production, offering a scientific basis for the formulation of climate-adaptive agricultural policies. These insights offer valuable information for policymakers to develop strategic planning, which could contribute to long-term agricultural resilience and help address potential challenges to food security under climate change.
The results indicate that under the SSP245 climate scenario, the winter wheat yield in Zhengzhou is projected to show a steady increasing trend until 2100, with a change rate of 148.9 kg·ha−1·10a−1 (Figure 14a). Notable yield mutations occurred in 1975 and 2018, which may be attributed to contemporary agricultural policies and environmental factors. In Xinxiang, the simulated winter wheat yield from 1961 to 2100 also exhibits a significant upward trend, with a growth rate of 147.2 kg·ha−1·10a−1, and the yield is expected to reach 6200 kg·ha−1 in the future (Figure 14b). Similarly, the simulated yield in Luoyang during 1961–2017 shows a notable increasing trend (Figure 14c), indicating a positive response of winter wheat production in this region to current and historical climatic conditions. These consistent findings suggest that winter wheat yield in the study area has the potential for sustained growth over the medium to long term. This trend may be attributed to the combined effects of factors such as cultivar improvement, advancements in agricultural practices, and the CO2 fertilization effect. Furthermore, the results underscore the importance of adapting agricultural management strategies to future climate change.

4. Discussion

4.1. Interpretation of Agroclimatic Resource Variations and Their Biophysical Implications

Our findings demonstrate significant alterations in key agroclimatic parameters during the winter wheat growing season in Henan Province. The multi-decadal analysis reveals a coherent pattern of changes consistent with the broader “warming-drying” trend observed across the North China Plain [33]. Specifically, we observed a statistically significant decline in precipitation, sunshine hours, wind speed, and evaporation. Conversely, accumulated temperature (>0 °C) showed a pronounced increasing trend, alongside a clear upward trajectory in relative humidity. These coordinated changes represent a fundamental shift in the agricultural climate system that has direct implications for winter wheat production [34].
To quantitatively attribute the relative importance of these climatic factors to yield variability, we employed the Geodetector method. This approach was selected over traditional regression-based models or structural equation modeling (SEM) due to its ability to handle nonlinear relationships and factor interactions without requiring linear assumptions or pre-specified causal structures [21]. Geodetector operates by stratifying the explanatory variables (e.g., accumulated temperature, precipitation) and comparing the variance in yield within and across these strata using the q-statistic, which quantifies the extent to which a climatic factor explains the spatial heterogeneity of yield [21,31]. The value of q ranges from 0 to 1, with larger values indicating stronger explanatory power. This method is particularly suited to our study as it allows for the identification of dominant drivers and their interactive effects under complex, non-uniform environmental conditions.
These changes may have important physiological implications Applying the Geodetector model enabled us to move beyond correlation and better assess causality in the climate-yield relationship. Reduced sunshine hours directly limit photosynthetic active radiation, potentially constraining the photosynthetic capacity of winter wheat during critical growth stages [35]. Meanwhile, the decline in precipitation coupled with increased temperature creates conflicting water stress conditions—while reduced rainfall increases drought risk, the concomitant decrease in evaporation partially mitigates soil moisture loss. The results highlighted accumulated temperature as the dominant driver, consistently explaining the crucial role of thermal accumulation in driving phenological development. Warmer temperatures accelerate phenological progression, potentially reducing the duration of key growth stages [36]. While accelerated development may reduce exposure to terminal heat stress during the grain-filling period, the concomitant shortening of this critical phase may compromise yield potential by limiting the amount of photosynthate allocated to grains [37]. Furthermore, the method revealed significant interactive effects between certain drivers, such as between temperature and humidity (interaction q > q1 + q2), suggesting synergistic impacts on yield formation.
These complex biophysical interactions necessitate tailored management strategies. For instance, elevated accumulated temperature coupled with reduced wind speed can compromise pollen viability during grain filling by altering canopy microenvironments [38], while increased humidity may elevate fungal disease pressure despite partially alleviating water stress [39]. Effective adaptation requires aligning sowing dates with shifting thermal windows, selecting climate-resilient cultivars, and implementing water-saving technologies to optimize resource use [30].

4.2. Drivers of Spatial Yield Variability and Adaptive Capacity

The pronounced spatial heterogeneity in winter wheat yield patterns across Henan Province arises from the complex interplay of biophysical constraints and socioeconomic factors [18]. This heterogeneity stems primarily from superior edaphic conditions in northern and eastern regions, particularly the deep, fertile alluvial soils of the North China Plain, which provide excellent water retention and nutrient holding capacity [40]. These regions benefit from advanced irrigation infrastructure, with approximately 85% of farmland under regulated irrigation systems capable of mitigating rainfall deficits [41]. Furthermore, these areas demonstrate higher adoption rates of modern agricultural practices, including precision fertilization, integrated pest management, and mechanized operations, which collectively enhance productivity [42]. While the flat topography of these areas further facilitates large-scale farming operations and efficient field management. In contrast, the mountainous terrain of western and southern regions imposes fundamental constraints to agricultural intensification, as fragmented land holdings limit mechanization and economies of scale [43]. Slope-induced water runoff reduces water infiltration and increases soil erosion, exacerbating nutrient loss and reducing soil fertility.
The synergistic interactions between climatic factors, particularly between temperature and precipitation, generate compound effects on crop productivity [30,44]. It is demonstrated that the adverse effect of low precipitation is amplified under elevated temperatures, resulting in compound stress events that impose significant yield penalties. The significant reduction in climate-induced yield anomalies observed after 2003 implies a considerable enhancement of adaptive capacity. This enhancement is likely driven by multiple factors, including the adoption of improved cultivars and water-saving technologies, supportive policies such as subsidies and insurance, and advanced management practices like conservation and precision agriculture [43,45]. The spatial variation in adaptive capacity itself represents a crucial determinant of yield outcomes. Regions with better infrastructure, higher farmer education levels, and greater access to agricultural extension services demonstrate greater resilience to climate variability. This highlights the potential for targeted interventions to reduce spatial disparities and enhance overall system resilience [46]. Future adaptation strategies should address both biophysical constraints and socioeconomic limitations through integrated approaches that combine technological solutions with institutional support and capacity building. This comprehensive perspective is essential for developing effective climate-resilient agricultural systems in the region.

4.3. Future Yield Projections and Knowledge Gaps in Climate Change Impact Assessment

Future climate projections highlight a fundamental trade-off between CO2 fertilization effects and heat-induced constraints on winter wheat productivity. Under moderate warming scenarios, yields are projected to stagnate, while high-emission pathways lead to discernible yield declines despite the positive influence of elevated CO2 [47,48]. These responses are largely attributable to projected temperature increases of 1.8–2.3 °C by mid-century, accompanied by more variable and less reliable precipitation patterns. The resulting increase in evapotranspiration demand and frequency of heat stress during reproductive stages poses significant challenges to crop viability. Of particular concern is the synergistic impact of combined heat and water stress, where coincident extreme events during critical growth phases may result in crop failure—a risk that remains poorly represented in seasonal climate averages [45,49].
While this study advances past research by quantifying climatic interaction effects, key limitations persist. The parameterization of the APSIM model, particularly regarding management practices, irrigation regimes, and cultivar selection, represents a significant source of uncertainty in yield projections. As demonstrated by He et al. (2015) [50] and Wang et al. (2025) [28], it is important to note that different management and irrigation practices, as well as crop varieties, can significantly affect winter wheat yield. In this study, the model was calibrated using local high-yield management practices (Table 2), which may represent an optimal rather than average scenario. Consequently, while the relative importance of climatic drivers and spatiotemporal patterns identified herein are robust, the absolute yield values should be interpreted as yield potential under current best management practices. Future studies should incorporate sensitivity analysis of key management parameters and explore a wider range of adaptation strategies, including cultivar substitution and flexible irrigation scheduling.
Specifically, variations in key parameters (Table 1)such as vernalization index, photoperiod index, etc. can alter phenological development and resource partitioning patterns, thereby modulating the crop’s response to climate stressors. For instance, cultivars with higher heat tolerance and adjusted phenology may better avoid terminal heat stress during grain filling, while optimized irrigation scheduling can mitigate water deficit during critical growth stages. Futhermore, current crop models often inadequately simulate extreme events (e.g., flowering-phase heatwaves and compound drought-heat stress) [50], and our SSP245-focused analysis warrants expansion to SSP126 and SSP585 scenarios for broader policy relevance [30,47]. Future work should integrate socioeconomic dimensions, such as farmer decision-making, market dynamics, and policy impacts, through coupled agent-based and biophysical modeling to better capture human-system adaptations.
Additionally, several emerging factors require greater attention in future research: the impacts of elevated ozone levels interacting with higher temperatures, the potential for pest and disease range expansion under warming scenarios, and the effects of changing atmospheric humidity on crop physiology [51,52]. The representation of soil health dynamics and nutrient cycling under changing climate conditions also needs improvement in current models [53,54]. Addressing these knowledge gaps will require interdisciplinary collaboration across climate science, crop physiology, agricultural economics, and social sciences to develop more comprehensive assessment frameworks. Such frameworks are essential to support effective adaptation planning and policy formulation for sustainable agricultural systems under evolving climate conditions.

5. Conclusions

This study systematically investigated the response patterns of winter wheat yield to climate change in Henan Province by coupling process-based modeling with spatial analysis. The main conclusions are as follows:
(1).
Regional-scale analysis establishes accumulated temperature as the primary driver of winter wheat yield variation, significantly outweighing precipitation and solar radiation. This finding elucidates the physiological mechanism of heat accumulation under warming-drying trends. Observed phenological shifts, particularly growth period extension and negative correlations with water/sunshine availability, require implementing adapted cultivars and modified cultivation practices to maintain productivity under evolving climatic conditions.
(2).
Historical yield simulations demonstrate significant climate resilience in current agricultural management systems, manifested through stable production across most regions and a marked decline in the frequency of climate-induced crop failure years. This trend highlights the crucial role of technological advances and management optimization in mitigating climate risks. Future scenario projections further confirm substantial yield increases in Henan’s major crop-producing areas—including Zhengzhou, Xinxiang, and Luoyang—indicating positive adaptation potential under medium-emission scenarios.
This study enhances understanding of climate–crop interactions by addressing scale transition and factor interactions through multi-method integration. Future work should incorporate multi-model ensembles approaches—particularly using climate model ensembles to better capture uncertainty in future climate projections, along with multi-crop-model simulations to improve the robustness of yield response estimates. Furthermore, research should explore integrated socioeconomic pathways to improve prediction accuracy and support robust policy-making.

Author Contributions

Conceptualization, Y.L. (Yanbin Li) and D.W.; methodology, D.W.; software, T.S.; validation, Y.L. (Yijie Li) and T.S.; data curation, Y.L. (Yijie Li); writing—original draft preparation, D.W.; writing—review and editing, D.W.; Formal analysis, H.Z. and Z.L.; Supervision, S.L. and Q.D.; funding acquisition, Y.L. (Yanbin Li). All authors have read and agreed to the published version of the manuscript.

Funding

This research was funded by the Henan Province Key R&D and Promotion Special Project (Science and Technology Targeted) (252102110352), the Natural Science Foundation of Henan Province (242300420035), and the National Key Research and Development Program of China (2022YFD1900402).

Data Availability Statement

Data is contained within the article.

Acknowledgments

We are indebted to Jipo Li, Yongjie Yu, Ke Zhang, Zongyang Li, Hanglong Zhang, for their help in collecting a large quantity of meteorological and yield data. We appreciate the technical help from Shiren Li, Sun Yat-sen University, China. We thank the anonymous reviewers for their valuable reviews and comments on the manuscript.

Conflicts of Interest

The authors declare that they have no known competing financial interests or personal relationships that could have appeared to influence the work reported in this paper.

References

  1. Zheng, J.; Wang, W.; Wang, W.; Cui, T.; Chen, S.; Xu, C.; Enge, B. FACE-ing Climate Change: Propagation of Risks and Opportunities for Cropping Systems in Mid-High-Latitude Regions: A Case Study between U.S. and China Corn Belts. Agric. Syst. 2024, 220, 104087. [Google Scholar] [CrossRef]
  2. Livingston, J.E.; Rummukainen, M. Making Policy-Relevant Knowledge in the IPCC Special Report on 1.5 Degrees: An Analysis of Reviewer Comments. Environ. Sci. Policy 2023, 147, 305–314. [Google Scholar] [CrossRef]
  3. Zhang, W.; Furtado, K.; Wu, P.L.; Zhou, T.; Chadwick, R.; Marzin, C.; Rostron, J.; Sexton, D. Increasing Precipitation Variability on Daily-to-Multiyear Timescales in a Warmer World. Sci. Adv. 2021, 7, eabf8021. [Google Scholar] [CrossRef]
  4. Campos-Avelar, I.; Montoya Martínez, A.C.; Morales Sandoval, P.H.; Cervantes Enriquez, É.P.; Parra Cota, F.I.; de los Santos Villalobos, S. Impact of Climate Change on Food Security and Plant Disease Management. In Climate Change and Agricultural Ecosystems, 2nd ed.; Woodhead Publishing: Cambridge, UK, 2025; pp. 331–367. [Google Scholar] [CrossRef]
  5. Pérez-Lucas, G.; Navarro, G.; Navarro, S. Adapting Agriculture and Pesticide Use in Mediterranean Regions under Climate Change Scenarios: A Comprehensive Review. Eur. J. Agron. 2024, 161, 127337. [Google Scholar] [CrossRef]
  6. Cao, Y.; Qiu, X.; Kang, M.; Zhang, L.; Lu, W.; Liu, B.; Tang, L.; Xiao, L.; Zhu, Y.; Cao, W.; et al. Evaluating the Impacts of Climatic Factors and Global Climate Change on the Yield and Resource Use Efficiency of Winter Wheat in China. Eur. J. Agron. 2024, 159, 127295. [Google Scholar] [CrossRef]
  7. Challinor, A.J.; Watson, J.; Lobell, D.B.; Howden, S.M.; Smith, D.R.; Chhetri, N. A Meta-Analysis of Crop Yield under Climate Change and Adaptation. Nat. Clim. Chang. 2014, 4, 287–291. [Google Scholar] [CrossRef]
  8. Yao, Y.; Li, G.; Lu, Y.H.; Liu, S. Modelling the Impact of Climate Change and Tillage Practices on Soil CO2 Emissions from Dry Farmland in the Loess Plateau of China. Ecol. Model. 2023, 478, 110276. [Google Scholar] [CrossRef]
  9. Jiang, T.; Wang, B.; Duan, X.N.; Liu, D.L.; He, J.; He, L.; Jin, N.; Feng, H.; Yu, Q. Prioritizing Agronomic Practices and Uncertainty Assessment under Climate Change for Winter Wheat in the Loess Plateau, China. Agric. Syst. 2023, 212, 103770. [Google Scholar] [CrossRef]
  10. Innes, P.; Tan, D.; Van Ogtrop, F.; Amthor, J. Effects of High-Temperature Episodes on Wheat Yields in New South Wales, Australia. Agric. For. Meteorol. 2015, 208, 95–107. [Google Scholar]
  11. Lenka, N.K.; Lenka, S.; Yashona, D.S.; Jat, D. Elevated Temperature and Low Nitrogen Partially Offset the Yield, Evapotranspiration, and Water Use Efficiency of Winter Wheat under Carbon Dioxide Enrichment. Agric. Water Manag. 2021, 250, 106856. [Google Scholar] [CrossRef]
  12. Sun, H.; Wang, Y.; Wang, L. Impact of Climate Change on Wheat Production in China. Eur. J. Agron. 2024, 153, 127066. [Google Scholar] [CrossRef]
  13. Li, Y.; Tao, F. Interactions of Genotype, Environment and Management on Wheat Traits and Grain Yield Variations in Different Climate Zones across China. Agric. Syst. 2022, 203, 103521. [Google Scholar] [CrossRef]
  14. Erokhin, V.; Esaulko, A.; Pismennaya, E.; Golosnoy, E.; Vlasova, O.; Ivolga, A. Combined Impact of Climate Change and Land Qualities on Winter Wheat Yield in Central Fore-Caucasus: The Long-Term Retrospective Study. Land 2021, 10, 1339. [Google Scholar] [CrossRef]
  15. Farrell, A.D.; Deryng, D.; Neufeldt, H. Modelling Adaptation and Transformative Adaptation in Cropping Systems: Recent Advances and Future Directions. Curr. Opin. Environ. Sustain. 2023, 61, 101265. [Google Scholar] [CrossRef]
  16. Chen, Y.; Liang, K.; Cui, B.; Hou, J.; Rosenqvist, E.; Fang, L.; Liu, F. Incorporating the Temperature Responses of Stomatal and Non-Stomatal Limitations to Photosynthesis Improves the Predictability of the Unified Stomatal Optimization Model for Wheat under Heat Stress. Agric. For. Meteorol. 2025, 362, 110381. [Google Scholar] [CrossRef]
  17. Wang, D.; Guo, M.; Liu, S.; Li, Y.; Dong, Q.; Gong, X.; Ge, J.; Wu, F.; Feng, H. Spatiotemporal Evolution of Winter Wheat Planting Area and Meteorology-Driven Effects on Yield under Climate Change in Henan Province of China. Plants 2024, 13, 2109. [Google Scholar] [CrossRef]
  18. Feng, X.; Wu, F.; Zai, S.; Wang, D.; Zhang, Y.; Chai, Q. Characteristics and Impacts of Water-Thermal Variation on Grain Yield in the Henan Province, China, on Multiple Time Scales. Agronomy 2023, 13, 429. [Google Scholar] [CrossRef]
  19. Duan, R.; Huang, G.; Li, Y.; Zhou, X.; Ren, J.; Tian, C. Stepwise Clustering Future Meteorological Drought Projection and Multi-Level Factorial Analysis under Climate Change: A Case Study of the Pearl River Basin, China. Environ. Res. 2021, 196, 110368. [Google Scholar] [CrossRef]
  20. Wu, J.; Shen, H.; Yang, Y.; Zhao, J.; Ding, T.; Zhao, W. Optimizing Winter Wheat Varieties for Yield and Net Ecosystem Productivity under Climate Change in the North China Plain. Eur. J. Agron. 2025, 169, 127675. [Google Scholar] [CrossRef]
  21. Tao, F.L.; Xiao, D.P.; Zhang, S.; Zhang, Z.; Rötter, R.P. Wheat Yield Benefited from Increases in Minimum Temperature in the Huang-Huai-Hai Plain of China in the Past Three Decades. Agric. For. Meteorol. 2017, 239, 1–14. [Google Scholar] [CrossRef]
  22. Wang, D.; Liu, S.; Guo, M.; Cheng, Y.; Shi, L.; Li, J.; Yu, Y.; Wu, S.; Dong, Q.; Ge, J.; et al. Optimizing Nitrogen Fertilization and Irrigation Practices for Enhanced Winter Wheat Productivity in the North China Plain: A Meta-Analysis. Plants 2025, 14, 1686. [Google Scholar] [CrossRef]
  23. Kadiyala, M.D.M.; Nedumaran, S.; Singh, P.; Chukka, S.; Irshad, M.A.; Bantilan, M.C.S. An Integrated Crop Model and GIS Decision Support System for Assisting Agronomic Decision Making under Climate Change. Sci. Total Environ. 2015, 521–522, 123–134. [Google Scholar] [CrossRef]
  24. Mohamad, M.A. An Innovative Intelligent System Based on Remote Sensing and Mathematical Models for Improving Crop Yield Estimation. Inf. Process. Agric. 2019, 6, 316–325. [Google Scholar] [CrossRef]
  25. Wang, X.Q.; Jia, Z.K.; Li, Y.B. Research on Wheat Production Potential of Henan Based on AEZ Modeling. J. Northwest A&F Univ. (Nat. Sci. Ed.) 2018, 26, 547–558. [Google Scholar] [CrossRef]
  26. Yang, X.; Li, Z.; Cui, S.; Cao, Q.; Deng, J.; Lai, X.; Shen, Y. Cropping System Productivity and Evapotranspiration in the Semiarid Loess Plateau of China under Future Temperature and Precipitation Changes: An APSIM-Based Analysis of Rotational vs. Continuous Systems. Agric. Water Manag. 2020, 229, 105959. [Google Scholar] [CrossRef]
  27. Lin, H.; Tang, J.; Wang, S.; Wang, S.; Dong, G. Deep learning downscaled high- resolution daily near surface meteorological datasets over east asia. Sci. Data 2023, 10, 890. [Google Scholar] [CrossRef]
  28. Wang, D.L.; Li, Y.B.; Zhang, B.B.; Jiang, T.C.; Wu, S.Y.; Wu, W.J.; Li, Y.; Liu, D.L.; He, J.Q.; Dong, Q.G.; et al. Exploring the Evolution of Winter Wheat Production and Its Response to Climate Change under Varying Precipitation Years on the Loess Plateau of China. Agric. Water Manag. 2025, 309, 109335. [Google Scholar] [CrossRef]
  29. Zhang, L.L. Analysis of Winter Wheat Yield Gap and Water-Nitrogen Use Efficiency on the Loess Plateau. Ph.D. Thesis, Chinese Academy of Sciences, Beijing, China, 2019. [Google Scholar]
  30. Gong, J.J.; Liu, Z.J.; Zhu, G.X.; Shi, D.Y.; Zhang, Z.T.; Fu, Z.Z.; Lu, X.M.; Qu, H.H.; Yang, X.G. Impacts of Climate Change on Maize Productivity in China from 2015 to 2100 Based on the APSIM Model. Trans. Chin. Soc. Agric. Eng. 2023, 39, 167–178. [Google Scholar]
  31. Juez, C.; Garijo, N.; Nadal-Romero, E.; Vicente-Serrano, S.M. Wavelet analysis of hydro-climatic time-series and vegetation trends of the Upper Aragón catchment (Central SpanishPyrenees). J. Hydrol. 2022, 614 Pt B, 128584. [Google Scholar]
  32. Sun, H.W.; Ma, J.H.; Wang, L. Simulation of Suitable Planting Areas for Winter Wheat on the Loess Plateau Under Future Climate Change Scenarios Using the APSIM Model. J. Triticeae Crops 2021, 41, 771–782. [Google Scholar]
  33. Wu, J.J.; Gu, Y.H.; Wang, N.; Shen, H.Z.; Ma, X.Y. Risk Probability Assessment of Winter Wheat Net Primary Productivity Loss and Its Driving Factors in the North China Plain. Field Crops Res. 2023, 300, 109013. [Google Scholar] [CrossRef]
  34. Zhou, W.M.; Ata-Ul-Karim, S.T.; Kato, Y.; Liu, H.Y.; Wang, K.C. Exploring the Climate Signal in the Variation of Winter Wheat Quality Records in the North China Plain. Agric. For. Meteorol. 2025, 369, 110567. [Google Scholar] [CrossRef]
  35. Jiang, L.F. Response of Winter Wheat Phenology to Climate Change and Its Impact on Yield in Henan Province. Master’s Thesis, Chang’an University, Xi’an, China, 2022. [Google Scholar]
  36. Tan, K.Y.; Fang, S.B.; Ren, S.X. Experimental Study on the Impact of Warming on Winter Wheat Production in North China. Acta Meteorol. Sin. 2012, 70, 902–908. [Google Scholar]
  37. Xu, Z.X.; Su, H.B.; Jiang, X.D.; Ye, X.F.; Zeng, Y. Impacts of Climate Warming on Growth, Yield and Quality of Winter Wheat. Chin. Agric. Sci. Bull. 2020, 36, 101–105. [Google Scholar]
  38. Li, M.; Lai, C.J.; Li, J.P.; Li, J.C.; Zhu, Y.L.; Song, Y.H. Effects of High Temperature during Grain Filling Stage on Physiological Characteristics of Source Leaves and Grain Sinks in Winter Wheat. J. Triticeae Crops 2022, 42, 1567–1574. [Google Scholar]
  39. Peltoniemi, K.; Velmala, S.; Lloret, E.; Ollio, I.; Hyvönen, J.; Liski, E.; Brandt, K.K.; Campillo-Cora, C.; Fritze, H.; Iivonen, S.; et al. Soil and Climatic Characteristics and Farming System Shape Fungal Communities in European Wheat Fields. Agric. Ecosyst. Environ. 2024, 370, 109035. [Google Scholar] [CrossRef]
  40. Fan, X.; Schütze, N. Assessing Crop Yield and Water Balance in Crop Rotation Irrigation Systems: Exploring Sensitivity to Soil Hydraulic Characteristics and Initial Moisture Conditions in the North China Plain. Agric. Water Manag. 2024, 300, 108897. [Google Scholar] [CrossRef]
  41. Gao, Z.; Wang, C.; Zhao, J.; Wang, K.; Shang, M.; Qin, Y.; Bo, X.; Chen, F.; Chu, Q. Adopting Different Irrigation and Nitrogen Management Based on Precipitation Year Types Balances Winter Wheat Yields and Greenhouse Gas Emissions. Field Crops Res. 2022, 280, 108484. [Google Scholar] [CrossRef]
  42. Lu, F.; Meng, J.; Cheng, B. How Does Improving Agricultural Mechanization Affect the Green Development of Agriculture? Evidence from China. J. Clean. Prod. 2024, 472, 143298. [Google Scholar] [CrossRef]
  43. Song, H.; Li, X.; Xin, L.; Wang, X. Improving Mechanization Conditions or Encouraging Non-Grain Crop Production? Strategies for Mitigating Farmland Abandonment in China’s Mountainous Areas. Land Use Policy 2025, 149, 107421. [Google Scholar] [CrossRef]
  44. Malakouti, S.M. Utilizing Time Series Data from 1961 to 2019 Recorded Around the World and Machine Learning to Create a Global Temperature Change Prediction Model. Case Stud. Chem. Environ. Eng. 2023, 7, 100312. [Google Scholar]
  45. Elsayed, M.L.; Elkot, A.F.; Noreldin, T.; Richard, B.; Qi, A.; Shabana, Y.M.; Saleh, S.M.; Fitt, B.D.L.; Kheir, A.M.S. Optimizing Wheat Yield and Water Productivity under Water Scarcity: A Modeling Approach for Irrigation and Cultivar Selection across Different Agro-Climatic Zones of Egypt. Agric. Water Manag. 2025, 317, 109668. [Google Scholar] [CrossRef]
  46. Zheng, H.; Lu, J.; He, H.; Wu, Y.; He, M.; Cheng, D.; Yao, Z.; Gomez, C. Quantifying Spatial Heterogeneity and Driving Mechanisms of Water-Energy-Food Coordination in the Yellow River Basin: A Hybrid Framework Approach. Energy 2025, 334, 137757. [Google Scholar] [CrossRef]
  47. Wang, D.; Guo, M.; Li, J.; Wu, S.; Cheng, Y.; Shi, L.; Liu, S.; Ge, J.; Dong, Q.; Li, Y.; et al. Impact of climate change on the winter wheat productivity under varying climate scenarios in the Loess Plateau: An APSIM analysis (1961–2100). Agronomy 2024, 14, 2609. [Google Scholar] [CrossRef]
  48. Bai, Y.; Liu, L.; Li, H.; Huang, G. Synergistic Interactions of CO2 Fertilization with Water, Heat, and Nitrogen under Climate Change: Evidence from Maize, Rice, and Wheat. Field Crops Res. 2025, 332, 110016. [Google Scholar] [CrossRef]
  49. Ding, Z.; Ali, E.F.; Elmahdy, A.M.; Ragab, K.E.; Seleiman, M.F.; Kheir, A.M.S. Modeling the Combined Impacts of Deficit Irrigation, Rising Temperature and Compost Application on Wheat Yield and Water Productivity. Agric. Water Manag. 2021, 244, 106626. [Google Scholar] [CrossRef]
  50. He, L.; Asseng, S.; Zhao, G.; Wu, D.R.; Yang, X.Y.; Zhuang, W.; Jin, N.; Yu, Q. Impacts of Recent Climate Warming, Cultivar Changes, and Crop Management on Winter Wheat Phenology across the Loess Plateau of China. Agric. For. Meteorol. 2015, 200, 135–143. [Google Scholar] [CrossRef]
  51. Nguyen, T.H.; Cappelli, G.A.; Emberson, L.; Fernandez, I.G.; Irimescu, A.; Francesco, S.; Fabrizio, G.; Booth, N.; Boldeanu, G.; Bermejo, V.; et al. Assessing the Spatio-Temporal Tropospheric Ozone and Drought Impacts on Leaf Growth and Grain Yield of Wheat across Europe through Crop Modeling and Remote Sensing Data. Eur. J. Agron. 2024, 153, 127052. [Google Scholar] [CrossRef]
  52. Uzoma, S.; Alencar, E.R.; Faroni, L.R.D.; Silva, M.V.A.; Sitoe, E.P.E.; Pandiselvam, R.; Machado, S.G. Association between Low-Temperature Drying and Ozonation Processes to Control Pests and Preserve Maize Quality. Food Control. 2024, 156, 110119. [Google Scholar] [CrossRef]
  53. Kukal, M.S.; Irmak, S.; Dobos, R.; Gupta, S. Atmospheric Dryness Impacts on Crop Yields Are Buffered in Soils with Higher Available Water Capacity. Geoderma 2023, 429, 116270. [Google Scholar] [CrossRef]
  54. Mehta, H.; Kumar, P.; Banyal, V.; Sharma, N.; Kumar, N. Driving Sustainability in Fruit-Based Cropping Systems: Intercropping Impacts on Growth, Soil Health, Microbial Dynamics and Yield Stability. Physiol. Mol. Plant Pathol. 2025, 139, 102774. [Google Scholar] [CrossRef]
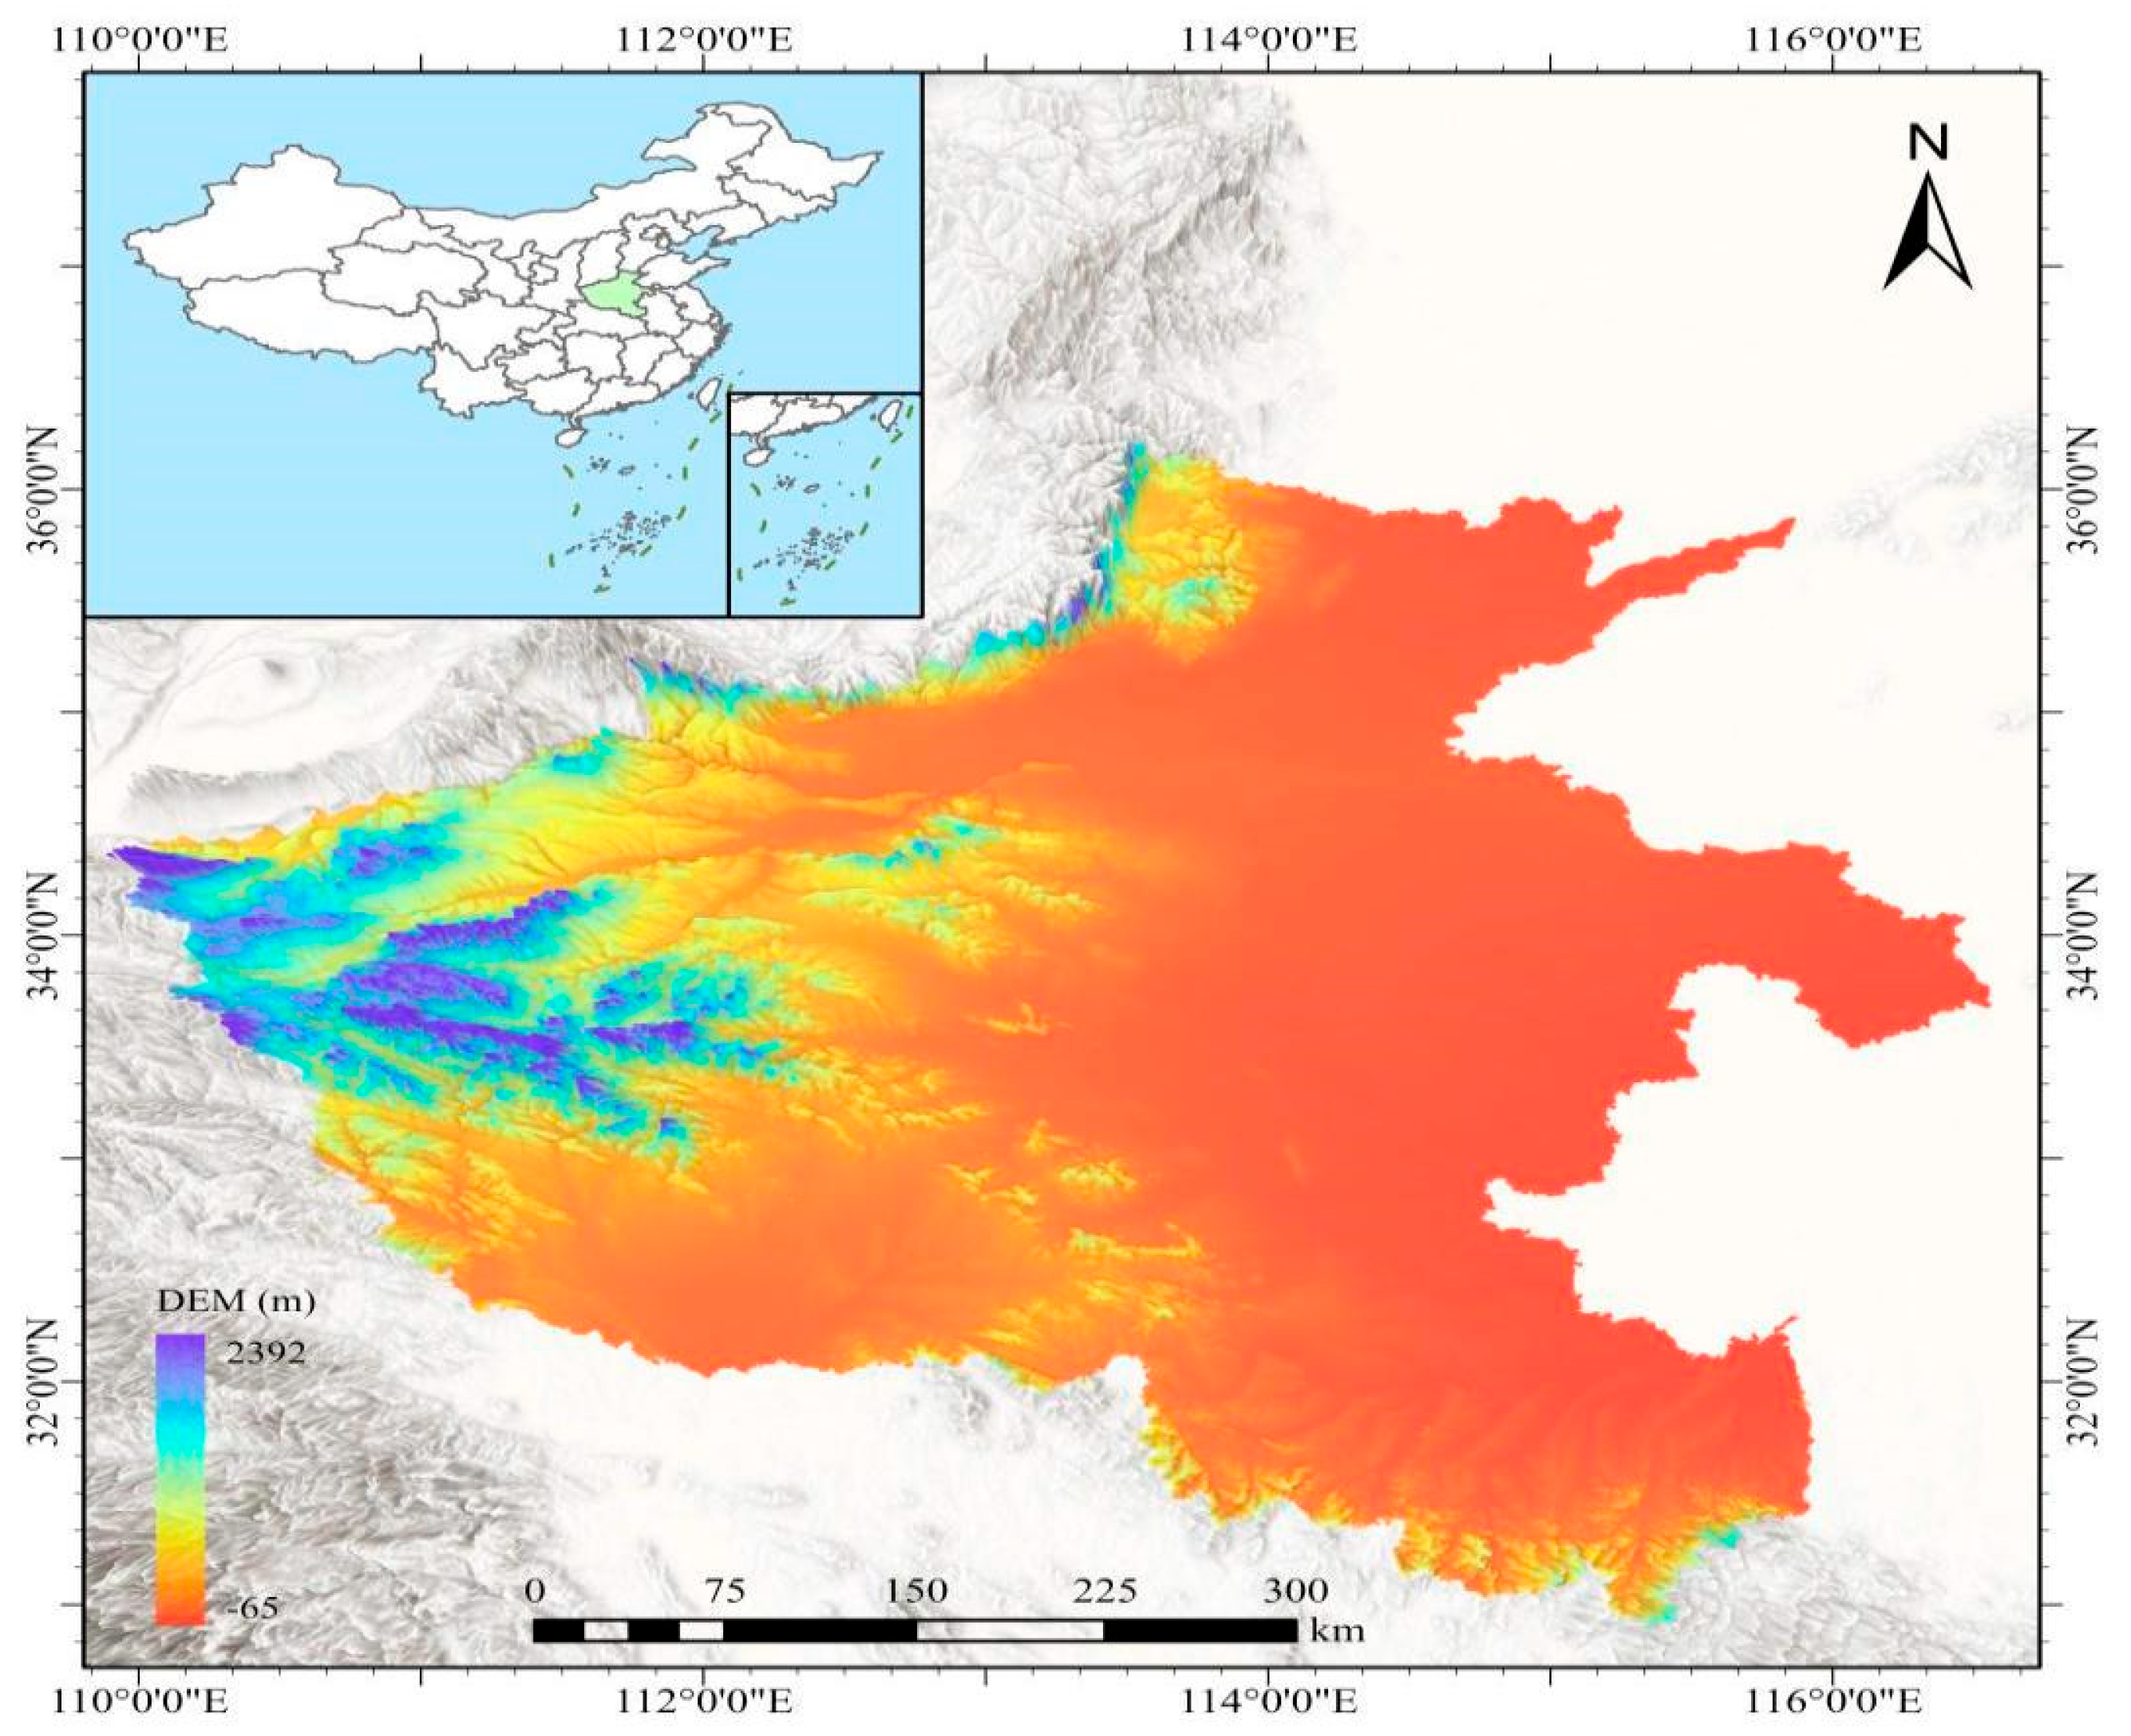
Figure 1. The geographical location and Digital Elevation Model (DEM) of Henan Province.
Agriculture 15 02059 g001
Figure 2. Interannual variation trends of various meteorological factors (ae) during the growing period of winter wheat in Henan Province from 1957 to 2017.
Agriculture 15 02059 g002
Figure 3. Spatial distribution of meteorological elements such as precipitation (a), accumulated temperature (b), sunshine hours (c) during the winter wheat growth period and the planting area extracted by MODIS (d) in Henan Province from 1980 to 2018.
Agriculture 15 02059 g003
Figure 4. The temporal variation of the actual harvest yield of winter wheat in Henan Province from 1978 to 2018.
Agriculture 15 02059 g004
Figure 5. Cubic Polynomial Trend Yield Fitting Curve.
Agriculture 15 02059 g005
Figure 6. A multi-year time series of climatic yield from 1978 to 2018.
Agriculture 15 02059 g006
Figure 7. Spatial distribution of winter wheat actual yield in various cities of Henan Province from 2009 to 2018.
Agriculture 15 02059 g007
Figure 8. Spatial distribution of climatic yield anomaly for winter wheat across 18 prefecture-level cities in Henan Province (2009–2018).
Agriculture 15 02059 g008
Figure 9. Interaction detection results of multiple factors based on geodetector.
Agriculture 15 02059 g009
Figure 10. Validation of APSIM model simulated yield at Zhengzhou (a), Xinxiang (b), and Luoyang (c) sites.
Agriculture 15 02059 g010
Figure 11. Interface of APSIM-Wheat Model Validation Results.
Agriculture 15 02059 g011
Figure 12. Comparison of actual vs. simulated yield in Zhengzhou of Henan Province from 2013 to 2023.
Agriculture 15 02059 g012
Figure 13. Changes of the simulated yield (a) and actual yield (b) in Zhengzhou over 2013–2023 under the climate scenarios SSP245.
Agriculture 15 02059 g013
Figure 14. Simulation Results of Winter Wheat Yield under Future Climate Scenario SSP2-4.5 for Key Prefecture-level Cities ((a). Zhengzhoug; (b). Xinxiang; (c). Luoyang) in Henan Province, China (1962–2100).
Agriculture 15 02059 g014
Table 1. The main control parameters in the model simulation process.
ParametersDefinitionValue
Vern_SensVernalization index3.0
Pohtop_sensPhotoperiodic index3.5
tt_start_grain_fillAccumulated temperature during the filling period800
tt_floweringAccumulated temperature during the flowering period120
tt_floral_initiationAccumulated temperature during the initial flowering period400
tt_end_of_juvenileThe accumulated temperature from emergence to jointing500
max_grain_sizeMaximum grain weight0.043
grains_per_gram_stemThe weight of grains per stem15
Table 2. Basic information about the winter wheat management details used for model calibration and validation at Zhenegzhou, Luoyang and Xinxiang in this study.
Experiment Sites Crop SeasonCultivarsFertilizer
(kg N ha−1)
Irrigation
(mm ha−1)
Sowing DateHarvest DateSeeding Density
(kg ha−1)
ZhengzhouCalibration2022–2023Jiman221804530-Sep5-Jun300
Validation2022–2024Jiman221804517-Oct30-May300
LuoyangCalibration2018–2029Luomai26180458-Oct3-Jun300
Validation2022–2024Luomai26180459-Oct9-Oct300
XinxiangCalibration2013–2014Zhongmai5781804512-Oct13-Jun225
Validation2016–2018Zhongmai5781804517-Oct8-Jun225
Table 3. Soil physical and chemical properties of the soil (0–60 cm depth) at the plot site.
Soil Depth
(cm)
Soil Physical PropertiesSoil Particle Composition
Soil Volume
(g/cm3)
Field Capacity (cm3/cm3)Nitrate Nitrogen
(mg/cm3)
Ammonium Nitrogen
(mg/cm3)
Soil Organic Matter (g·kg−1)Total N
(g·kg−1)
Sandy (%)Soil
(%)
Clay
(%)
0~201.35320.03680.01049.160.56650.170.640.19
20~401.56340.02040.00336.670.36350.110.650.24
40~601.41340.01320.00182.790.19450.090.650.26
Table 4. Single-factor analysis of Influencing factors on climate Yield of Winter Wheat in Henan Province.
Factorsq
Precipitation0.340
Soil type0.136
Accumulated temperature0.548
Wind speed0.208
Sunshine hours0.261
Humidity0.226
Disclaimer/Publisher’s Note: The statements, opinions and data contained in all publications are solely those of the individual author(s) and contributor(s) and not of MDPI and/or the editor(s). MDPI and/or the editor(s) disclaim responsibility for any injury to people or property resulting from any ideas, methods, instructions or products referred to in the content.