1. Introduction
Against the backdrop of global climate change and increasing water scarcity, improving water use efficiency has become a critical task for achieving sustainable agricultural development [
1]. As a major agricultural producer, China faces the challenges of high total agricultural water consumption and low irrigation efficiency, with an effective utilization rate of only about 52%, far below the 70–80% level commonly reported in developed countries such as the United States, Israel, and countries in Western Europe [
2,
3]. A scientifically sound and efficient irrigation regime is a key approach to improving agricultural water use efficiency. Typically characterized by irrigation scheduling based on accurate crop water demand, soil moisture status, and local meteorological conditions, aiming to minimize water loss while maintaining crop yield and quality. Evapotranspiration (
ETc), as a core parameter in the hydrological cycle and farmland water management, plays a central role in water resource regulation and irrigation scheduling [
4,
5,
6,
7,
8]. Actual evapotranspiration (
ETc) refers to the combined water loss from soil evaporation and crop transpiration under field conditions, whereas reference evapotranspiration (
ET0) represents the evapotranspiration from a hypothetical reference crop (typically well-watered grass) under standard conditions, as defined in FAO Irrigation and Drainage Paper No. 56. Crop evapotranspiration (
ETc) is then derived by multiplying
ET0 with a crop coefficient (
Kc) that reflects crop-specific growth characteristics and development stages [
9]. Accurate
ETc estimation not only supports the formulation of rational irrigation strategies but also effectively enhances water use efficiency, making it vital for sustaining both agricultural production and ecological environments.
As a quantitative indicator of crop water demand,
ETc is a critical basis for farmland water management because it directly guides irrigation scheduling, irrigation volume determination, and water use efficiency optimization. In recent years, remote sensing technology—owing to its advantages of wide coverage and periodic observations—has emerged as a major approach for
ETc estimation at the regional scale. For example, freely available satellite products such as Sentinel-2 (10 m spatial resolution, 5-day revisit, multispectral) and MODIS onboard Terra and Aqua (250–1000 m spatial resolution, daily revisit, multispectral and thermal bands) provide cost-effective, long-term time series of imagery that have been widely used in agricultural monitoring [
10]. Energy balance models based on satellite imagery (e.g., SEBAL, METRIC) have been widely applied to evapotranspiration monitoring in many cropping systems [
11,
12,
13]. However, some satellite platforms suffer from inherent limitations, particularly in the thermal domain, where spatial resolution is often coarse (e.g., Landsat-8 TIRS, 100 m thermal resolution, 16-day revisit), making it difficult to capture the fine-scale heterogeneity required for small- and medium-sized agricultural fields. Although robust atmospheric correction models exist to minimize gas absorption and scattering effects, residual errors may still reduce ET accuracy [
14,
15,
16]. In contrast, traditional ground-based monitoring methods (e.g., lysimeters, stem flow gauges, soil moisture sensors) offer high accuracy at specific points but have several drawbacks: they are point-based and fail to capture spatial distribution patterns at a large scale; their timeliness is poor, with data often requiring manual collection or intermittent transmission, limiting real-time monitoring and they involve complex procedures for deployment, frequent calibration, data cleaning and integration, alongside high maintenance costs [
17,
18,
19]. These limitations make them less efficient and cost-effective for large-scale agricultural irrigation systems, as also reported in previous studies [
20]. Therefore, UAV-based remote sensing provides a practical alternative for bridging the gap between point-based ground monitoring and coarse-resolution satellite observations. Equipped with multispectral and thermal sensors, UAVs can provide on-demand, high-resolution (<0.5 m) imagery suitable for daily irrigation management. UAV sensors and optical filters typically require radiometric calibration before each flight using calibration plates or reference panels, a process that usually takes only a few minutes. Ground-truth sensors (e.g., sap flow, lysimeters) calibrated in the field are essential for validating ET models derived from UAV imagery, while satellite products (e.g., MODIS, Landsat, Sentinel-2) can also serve as independent benchmarks for cross-validation of UAV-based estimates [
21]. Atmospheric effects on UAV imagery are relatively small compared to satellites due to low flight altitudes, and radiometric calibration plates are typically used to correct for illumination and atmospheric variability, ensuring accuracy in surface reflectance and temperature retrievals.
Unmanned aerial vehicle (UAV) remote sensing, with its high spatiotemporal resolution, strong operational flexibility, and low cost, offers a promising alternative for small-scale farmland
ETc monitoring [
22,
23]. In recent years, UAV-based ET estimation has been conducted using a variety of models. Energy balance approaches, such as SEBAL, METRIC, and TSEB, have been widely applied to UAV thermal imagery for ET retrieval, offering physically based interpretations but requiring detailed meteorological and surface parameters [
24]. Empirical and statistical methods, including crop coefficient approaches and vegetation index-based regression models, provide simpler alternatives but often lack robustness across different sites and growth stages. For example, a crop coefficient calibrated for maize may lead to biased
ETc estimates when directly applied to wheat or citrus due to differences in canopy structure and phenology [
25]. With advances in data-driven techniques, machine learning models such as random forests and support vector regression have also been employed to map
ETc, demonstrating flexibility but sometimes limited interpretability [
26]. More recently, multi-source data fusion methods integrating thermal, multispectral, and meteorological information have shown improved accuracy and adaptability across heterogeneous agricultural landscapes [
27]. Nevertheless,
ETc estimation based on a single data source or model often suffers from poor adaptability and suboptimal accuracy. Integrating multi-source datasets and multiple modeling approaches to improve both accuracy and timeliness has thus become a key research direction in remote sensing and agricultural water resource management. Multi-source modeling for evapotranspiration retrieval—by combining meteorological data (e.g., air temperature, humidity, solar radiation, wind speed), remote sensing imagery (e.g., UAV multispectral, UAV thermal, Sentinel-2 multispectral, Landsat-8 thermal), and ground-based observations (e.g., sap flow, lysimeters, soil moisture sensors), as well as integrating physical models (SEBAL, METRIC, TSEB), data-driven models (random forest, support vector regression), and spatiotemporal fusion techniques (e.g., STARFM, ESTARFM, downscaling approaches)—has emerged as a prominent topic in hydrology and remote sensing [
28]. Such approaches enable the generation of
ETc datasets with both high spatial resolution (<1 m for UAV; 10–30 m for satellites) and high temporal resolution (daily to sub-daily with UAV flights, 5–16 days for satellites), meeting diverse research needs such as precision irrigation scheduling, drought monitoring, crop growth modeling, and water resource allocation [
29]. The combination of multiple data sources also improves estimation accuracy and reliability, with RMSE reduced by 20–40% compared to single-source models (e.g., from 0.43 mm/d in the
Kc-based model to 0.19 mm/d in the fusion model during the young fruit stage), thereby optimizing irrigation scheduling and enhancing water resource utilization efficiency [
30]. Moreover, multi-source retrieval methods are well-suited for heterogeneous surfaces such as agricultural and urban areas, and have shown broad application potential in agriculture, hydrology, and climate change research by better capturing the spatiotemporal variability of evapotranspiration and supporting water resource management and climate adaptation studies [
31,
32].
To address the above challenges, this study focuses on a representative citrus orchard in Yichang, Hubei Province—a leading citrus production area in China with favorable agro-climatic conditions for Citrus reticulata Blanco cv. ‘Yichangmiju’ [
33,
34]. However, few studies have explicitly addressed the integration of UAV thermal and multispectral data with in situ sap flow validation across multiple phenological stages, leaving a research gap in developing and validating adaptable
ETc estimation models for perennial fruit orchards. Leveraging the high spatiotemporal resolution of UAV remote sensing, we developed an
ETc estimation method tailored for hilly orchard landscapes. Multispectral and thermal infrared cameras mounted on UAVs were used to capture imagery of the citrus orchard during key phenological stages. Sap flow meters were deployed to monitor tree transpiration, and soil evaporation was simultaneously measured using a self-made evaporation bucket. The sum of transpiration and evaporation was then used to approximate actual
ETc. Simultaneously, meteorological data (air temperature, daily net radiation,
ETc.) were collected from a nearby weather station located approximately 300 m from the orchard. Orthomosaics were generated using DJI Terra (version 3.8.0, DJI, shenzhen, China) software, multispectral indices were extracted using ENVI 5.3 (Exelis Visual Information Solutions, Boulder, CO, USA), and thermal infrared imagery was calibrated against ground-measured temperatures for bias correction and accuracy validation, ensuring data reliability. Yichang’s citrus cultivation area exceeds 140,000 ha, with annual production exceeding 4 million tons, making it one of China’s leading citrus-producing regions [
35,
36,
37]. However, its subtropical monsoon climate results in uneven spatiotemporal rainfall distribution, leading to fluctuating irrigation needs that directly affect citrus yield and quality [
38,
39]. Most existing studies have relied on single-model approaches for
ETc estimation, such as SEBAL and METRIC based on satellite data [
40], or crop coefficient-based methods using vegetation indices [
41], with limited exploration of multi-source fusion methods based on UAV remote sensing.
The value of this work lies in its integrated approach, combining UAV-acquired thermal and multispectral imagery with direct sap flow measurements throughout the growing season of citrus crops. The innovations of this study are threefold: (1) the development of a weighted fusion model driven by multispectral and thermal infrared data, integrating the single crop coefficient (
Kc) method with the S-I energy balance model to exploit their complementary strengths, i.e., the
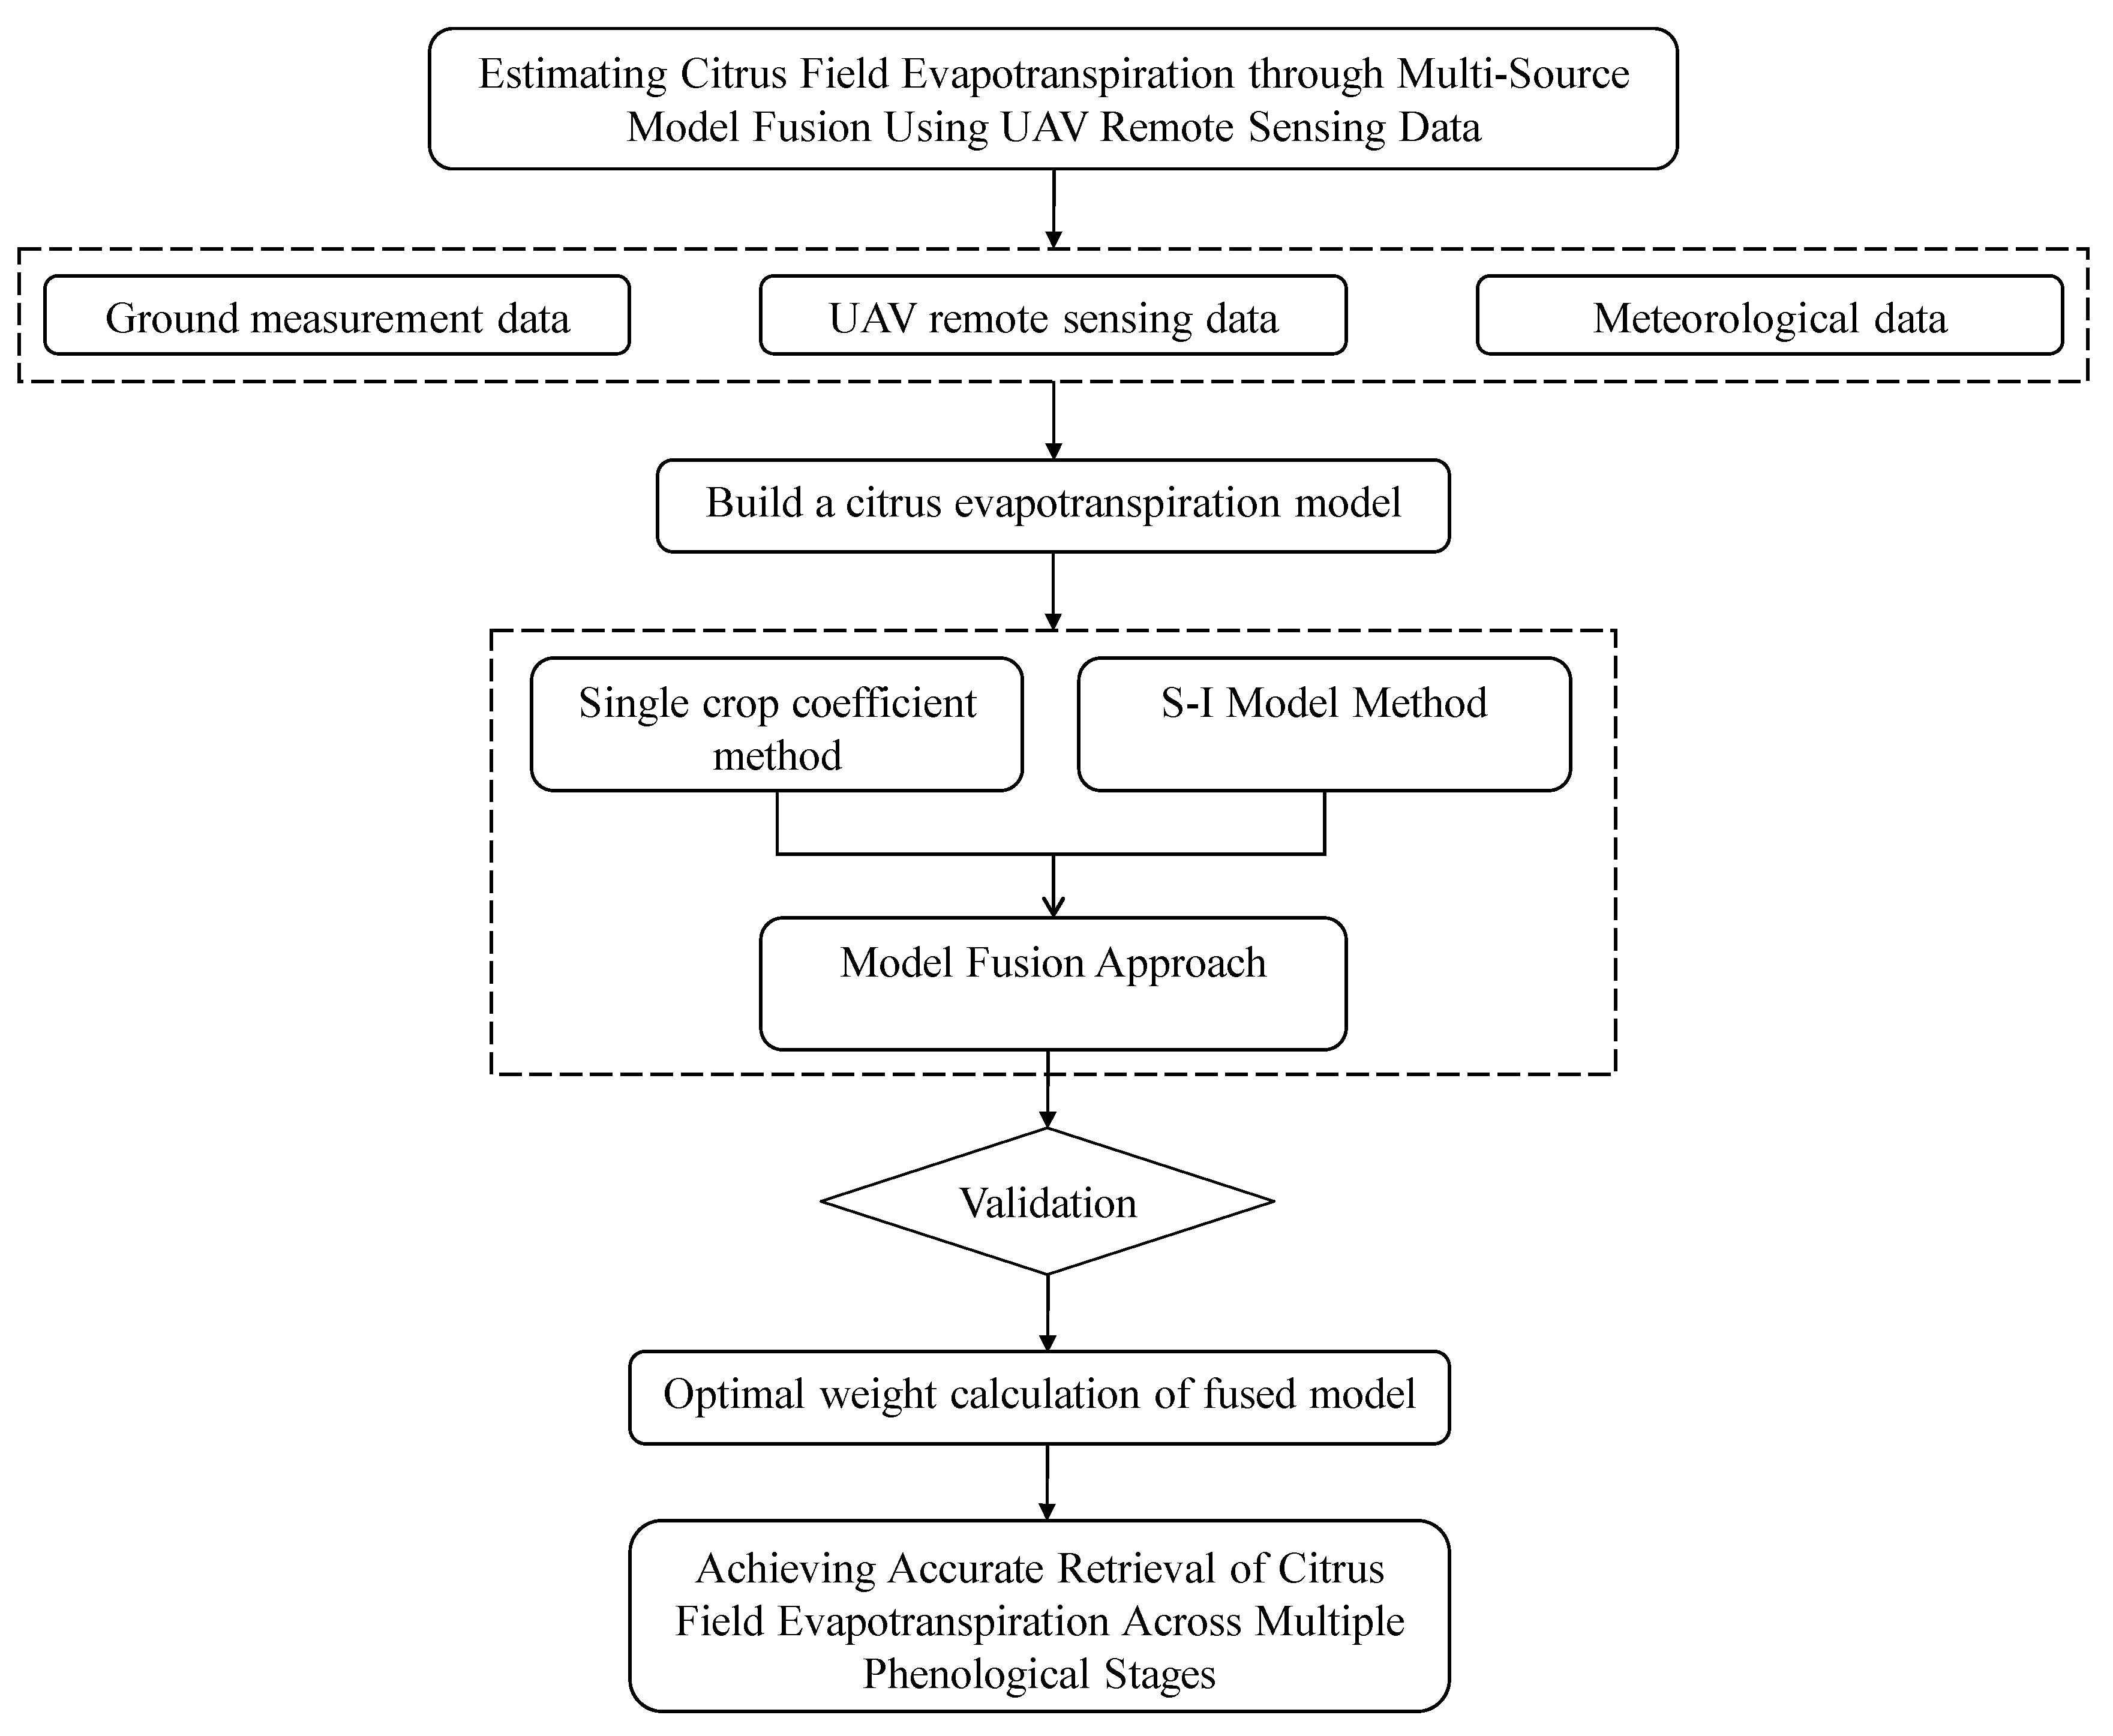
Kc method’s simplicity and stability in capturing vegetation growth dynamics and the S-I model’s capability to directly reflect canopy energy balance and water stress conditions; (2) the incorporation of a multi-phenological-stage dynamic observation strategy to enhance model adaptability and accuracy throughout the crop growth cycle; and (3) the validation of retrieval results against field measurements to strengthen the model’s practical applicability. The research framework follows the technical pathway of remote sensing data acquisition—data preprocessing—model construction and optimization—result validation and analysis, which has now been reformatted into a clearer stepwise description. Specifically, UAV-based multi-source remote sensing was used to obtain high spatiotemporal resolution imagery, multispectral indices and thermal infrared temperatures were extracted and integrated into a weighted fusion model, and
ETc estimation accuracy was improved through the combination of in situ stem flow measurements and meteorological variables. Finally, model accuracy and influencing factors (including meteorological drivers such as net radiation, air temperature, and sunshine duration, as well as crop physiological factors such as chlorophyll content and leaf water content) were analyzed to assess applicability and potential for wider adoption. The results provide a comprehensive understanding of the spatiotemporal dynamics of citrus orchard
ETc, offering a scientific basis and technical support for precision orchard irrigation and efficient water resource utilization. Given the single-site, single-year design, the results are primarily representative of the study region, but they provide an important reference for extending UAV-based
ETc estimation approaches to similar hilly agricultural areas. This study holds significant practical relevance for promoting water-saving irrigation in the hilly agricultural areas of western Hubei, improving regional agricultural water management, and expanding the methodological boundaries of UAV-based multi-source fusion models for smart agriculture. To further illustrate the overall research framework and workflow, a schematic diagram has been added as
Figure 1.
2. Materials and Methods
2.1. Overview of the Study Area
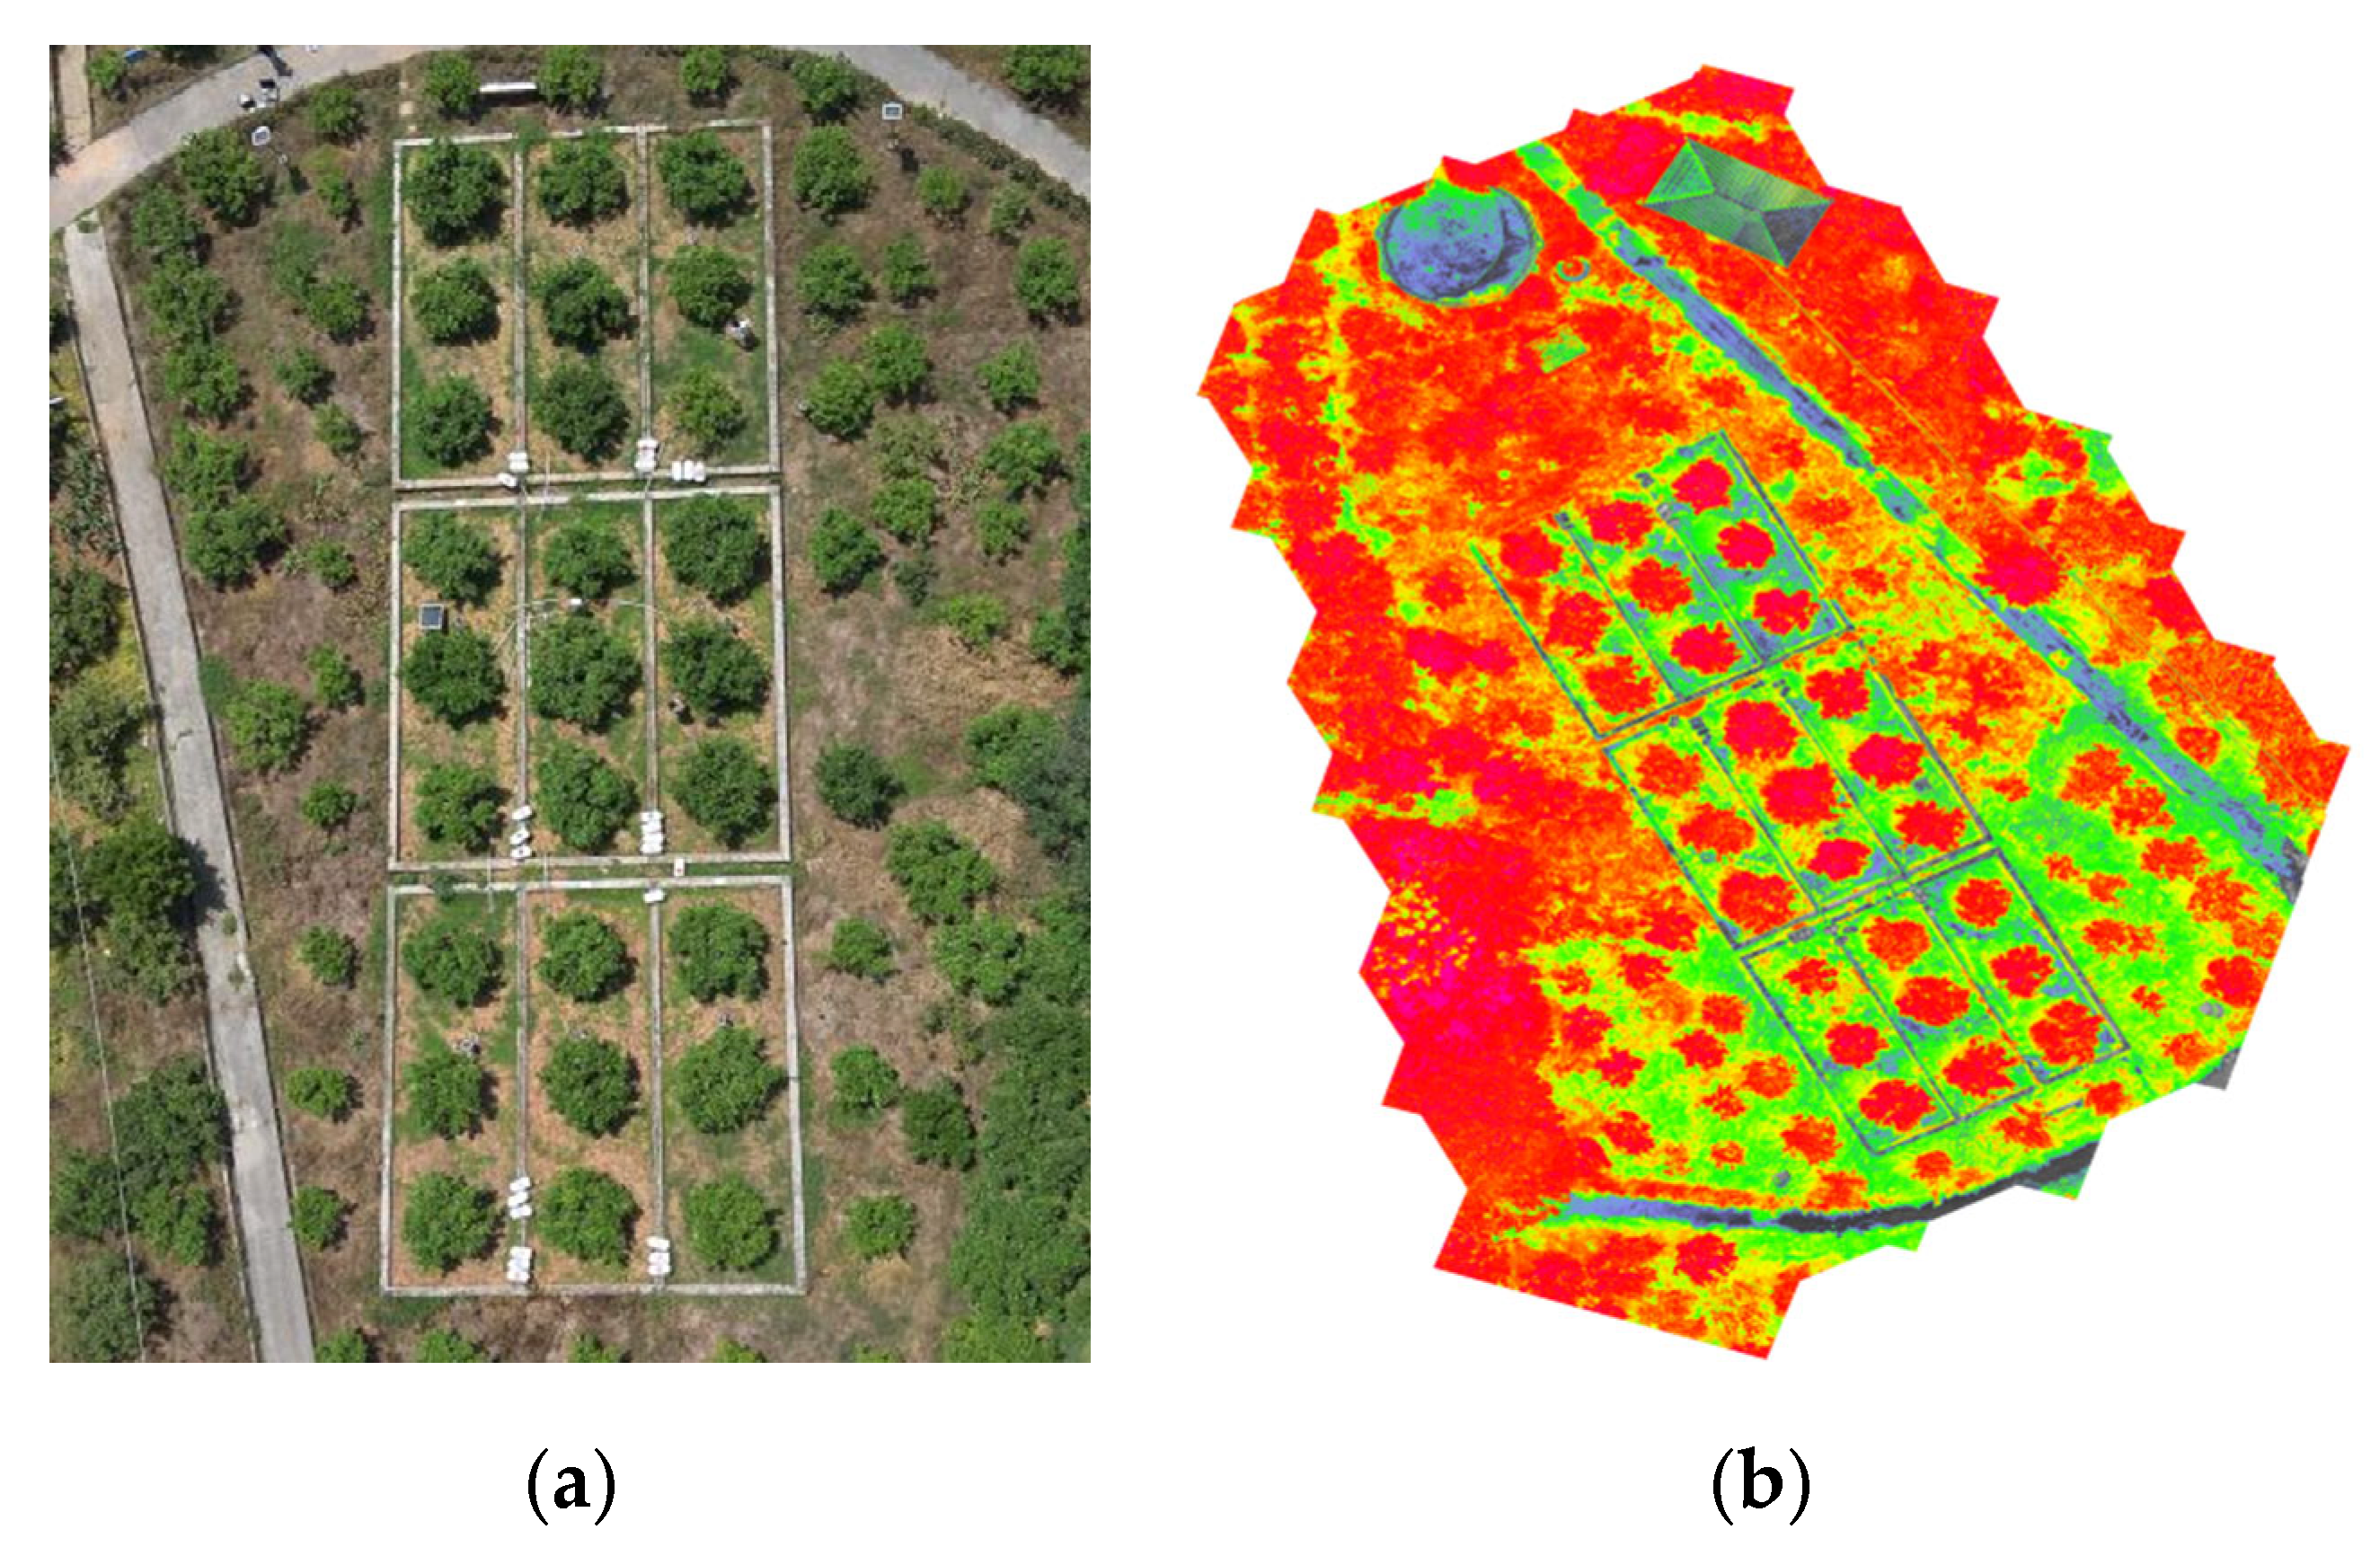
The field experiment was conducted at the Citrus Experimental Station of China Three Gorges University, Cangwubang, Yichang, Hubei Province, China (30°45′ N, 110°41′ E; elevation 343 m) (
Figure 2). The station covers an area of 1.4 ha and is located within a nationally designated dominant citrus production region. The site experiences a subtropical monsoon climate, with a mean annual temperature of 17 °C, average annual precipitation of 1200–1300 mm, average relative humidity of 75.6%, mean wind speed of 1.4 m s
−1, average annual sunshine duration of 1665.9 h, and a frost-free period of 250–300 days [
42]. The soil at the site is classified as yellow-brown loam, with an organic matter content of 15.6 g kg
−1, total nitrogen content of 1.32 g kg
−1, total phosphorus content of 1.84 g kg
−1, pH ranging from 5.5 to 6.5, bulk density of 1.30 g cm
−3, and a texture well-suited for citrus cultivation [
43]. The experimental crop was Citrus reticulata Blanco cv. ‘Yichangmiju’, with uniform growth status and planted at a spacing of 3 m × 4 m. The citrus phenological stages during the experimental period were classified into four stages: Stage I—budburst and flowering (mid-March to late April); Stage II—young fruit stage (early May to late June); Stage III—fruit enlargement (early July to late August); and Stage IV—fruit coloration and sugar accumulation (early September to late October). The station is equipped with a complete stem-flow gauge system and irrigation facilities, ensuring the continuous acquisition of stem-flow data and meeting the irrigation requirements of the experiment.
2.2. Experimental Design
The field experiment was conducted from April to October 2024, covering the budburst and flowering, young fruit, fruit enlargement, and fruit coloration–sugar accumulation stages, at the Citrus Experimental Station of China Three Gorges University, Cangwubang, Yichang, Hubei Province, China (30°58′ N, 110°41′ E; elevation 343 m). The experimental crop was Citrus reticulata Blanco cv. ‘Yichangmiju’. The study area was divided into nine plots with uniform tree growth to ensure data reliability. Eight of the plots were each equipped with a sap flow sensor to monitor crop transpiration in real time. To minimize inter-plot interference, protective buffer zones were established between plots. Each plot contained three citrus trees, giving a total of 27 trees for the experiment. Uniform tree growth was defined based on tree age (12 years), similar trunk diameter (8–10 cm), tree height (2.5–3.0 m), and consistent canopy volume, with all trees free from visible pest or disease stress. The selected plots were located on relatively homogeneous soil with a similar management history to minimize environmental variability. Although nine plots with three trees each were monitored, variability was reduced by averaging sap flow across multiple trees within each plot and by excluding any trees showing abnormal physiological conditions during the monitoring period. This ensured that the sap flow measurements were representative of the orchard’s overall conditions.
Irrigation was applied via a drip irrigation system, with emitters placed 0.45 m horizontally from the tree base and buried at a depth of 0.35 m. Each emitter had a discharge rate of 2 L h−1 under a working pressure of 0.1 MPa. Irrigation was metered using a water flow meter, and four emitters were symmetrically arranged on both sides of each tree to ensure uniform water distribution. Irrigation was triggered when soil moisture in a plot dropped to, or approached, the predetermined lower threshold. Fertilization was fixed at 400 kg ha−1 nitrogen (N), 240 kg ha−1 phosphorus (P2O5), and 460 kg ha−1 potassium (K2O), applied in the forms of urea (46% N), superphosphate (16% P2O5), and potassium sulfate (52% K2O), respectively. Other orchard management practices—including weeding, pest and disease control, and pruning—were consistent with standard regional management protocols.
The experimental field was equipped with a plant sap flow monitoring system (DJ-6393B, Dianjiang Technology Co., Ltd., Shanghai, China), a soil moisture monitoring instrument (BK-GTS6, Shandong Boke Instrument Co., Ltd. Weifang, China), and a handheld infrared thermal imager (Testo 865, Testo SE & Co. KGaA, Lenzkirch, Germany) for monitoring sap flow, soil moisture, and canopy temperature, respectively. Data were recorded at 30 min intervals. For each data collection session, multispectral imagery was acquired using a DJI Phantom 4 UAV (DJI, Shenzhen, China), while thermal infrared imagery was collected using a DJI Matrice M30T UAV (DJI, Shenzhen, China). In addition, citrus soil evaporation was measured with a self-designed micro-lysimeter. Ground measurements included citrus leaf chlorophyll content (Chl; mg m−2), leaf water content (LWC; %), land surface temperature (LST; °C), canopy temperature (CT; °C), and soil moisture (SM; %). Conventional meteorological variables—including air temperature (AT; °C), relative humidity (RH; %), sunshine duration (SH; h), atmospheric pressure (AP; hPa), wind speed (WS; m s−1), and precipitation (P; mm)—were obtained from the local meteorological station.
2.3. Remote Sensing Data Collection
Multispectral imagery was acquired using a DJI Phantom 4 Multispectral (DJI P4M) UAV at a flight altitude of 30 m. According to the manufacturer’s specifications, the ground sampling distance (GSD) for the P4M is given by GSD ≈ (H/18.9) cm per pixel, where H is the flight altitude in meters. At 30 m altitude, this corresponds to a GSD of approximately 1.6 cm/pixel for the multispectral bands, with an image resolution of 1280 × 720 pixels. The spectral bands covered the following wavelength ranges: blue (434–466 nm), green (544–576 nm), red (634–666 nm), red edge (714–746 nm), and near-infrared (814–866 nm). Data collection was conducted during the key phenological stages of the citrus orchard from April to October, including budburst and flowering, young fruit, fruit enlargement, and fruit coloration–sugar accumulation stages. Flights were performed under clear and calm (or light breeze) weather conditions, primarily around solar noon to ensure stable illumination. The flight altitude was set at 30 m, with both forward and side overlaps maintained at 80%, and the flight speed was kept at 3 m s−1. A total of 11 flight lines were planned for each acquisition. Image mosaicking and geometric correction were conducted in DJI Terra. Radiometric calibration was performed using a MAPIR Spectral Reflectance Calibration Panel (MAPIR, San Diego, CA, USA), which consists of four diffuse reflectance targets with known reflectance values. This empirical line calibration (ELC) method converted the raw digital number (DN) values into surface reflectance, thereby minimizing atmospheric and illumination effects under low-altitude UAV flights. Subsequently, multispectral band data were extracted in ENVI 5.3 for further analysis.
Following UAV-based multispectral data acquisition, the fragmented TIF images were processed using DJI Terra software. Radiometric calibration was performed using the reflectance data from a pre-captured spectral calibration panel, followed by geometric correction and conversion to generate a complete raw orthomosaic of the citrus orchard. The orthomosaic underwent atmospheric correction, image calibration, and mosaicking within DJI Terra to produce a complete spectral dataset for each acquisition date (
Figure 3a). Thermal infrared imagery was simultaneously acquired using the DJI Matrice 30T, whose onboard thermal sensor operates in the 8–14 μm range. In processing the thermal data, a vegetation emissivity value of 0.98 was applied, consistent with commonly reported values for green vegetation canopies, to ensure accurate conversion of radiometric temperature to surface temperature. Subsequently, ENVI 5.3 software was employed to process the calibrated multispectral images, enabling visualization of the spatial distribution of DN values across the orchard.
Thermal infrared (TIR) imagery was acquired concurrently with multispectral imagery during field monitoring using a DJI Matrice 30T UAV. The onboard thermal camera had a resolution of 1920 × 1200 pixels, enabling the detection of subtle temperature differences. The sensor featured a 7.02-inch detector, ensuring high image quality and sensitivity. Prior to each flight, the thermal infrared camera was radiometrically calibrated. To further improve the accuracy of temperature correction, the actual surface temperature of target objects was measured in situ using a handheld infrared thermometer, and these measurements were used to calibrate the image-derived temperatures. Validation against in situ ground measurements showed that the root mean square error (RMSE) between UAV-derived canopy temperatures and ground-measured surface temperatures was 4.52 °C, confirming the reliability and accuracy of the thermal dataset.
The positional and orientation system (POS) data embedded in each TIR image were extracted using the DJI Thermal Analysis Tool 3. The imagery and POS data were then imported into Pix4Dmapper (version 4.8.2, Pix4D S.A., Prilly, Switzerland) software for orthorectification, producing high-quality raw orthomosaic thermal images (grayscale;
Figure 3a). Subsequent temperature calibration was conducted in ENVI software, where grayscale values were converted to canopy and land surface temperature maps (
Figure 3b). Validation was performed against ground-based temperature measurements obtained using a handheld infrared thermometer, which operates in the 8–14 μm wavelength range consistent with the UAV thermal sensor. The calibrated temperatures were validated against ground-based measurements, and necessary bias corrections were applied to ensure data accuracy and reliability (
Table 1). Sap flow was continuously monitored using stem sap flow sensors (Model: Thermal Dissipation, Dianjiang Technology Co., Ltd., Shanghai, China), with a measurement accuracy of ±10% and a measurement range of 0–500 g h
−1 per probe. For soil heat flux (G) calculation, the soil surface temperature (Ts) was directly derived from UAV thermal imagery to maintain consistency with the remotely sensed energy balance inputs.
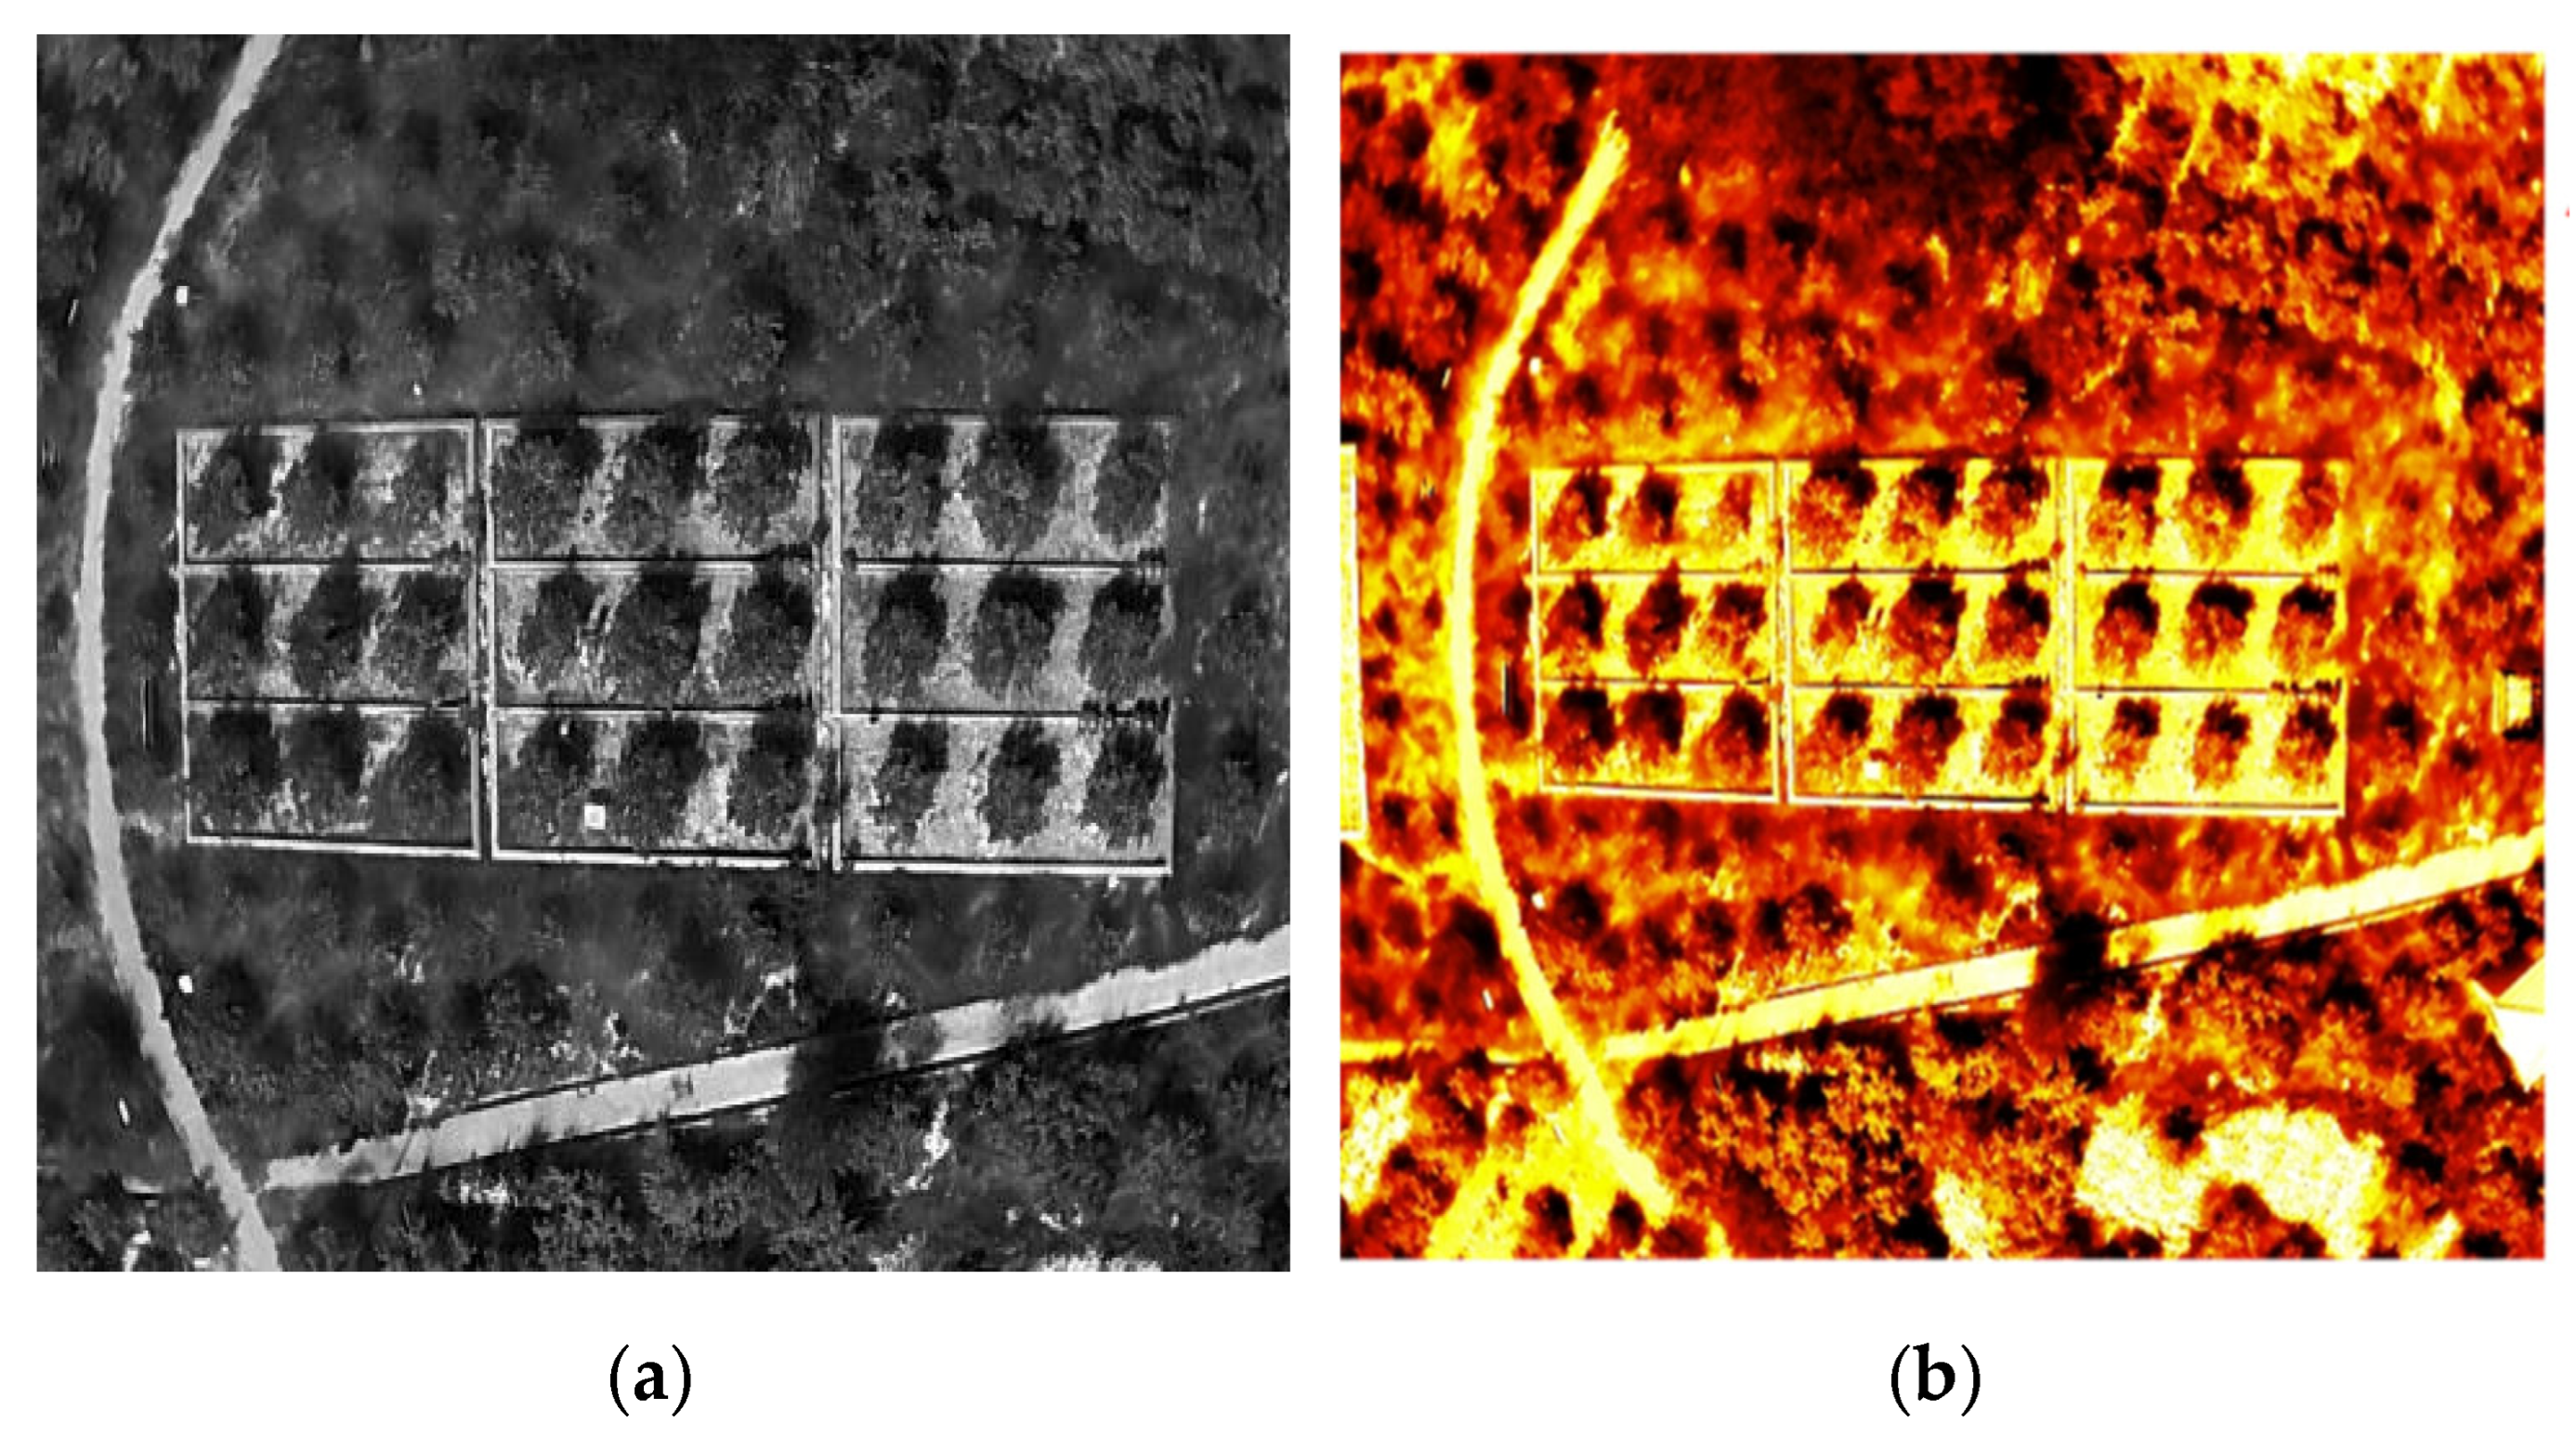
The POS data embedded in each TIR image was extracted using the DJI Thermal Analysis Tool 3. The imagery and POS data were subsequently imported into Pix4Dmapper software for orthorectification, generating high-quality raw orthomosaic thermal images in grayscale (
Figure 4a). Temperature calibration was then performed in ENVI software, where grayscale values were converted into pseudo-color canopy and land surface temperature maps (
Figure 4b). Finally, the extracted canopy and land surface temperatures were compared with field-measured data to validate the results, and bias correction was applied to improve the accuracy and reliability of the dataset (
Table 2).
2.4. Ground Data Collection
Ground-based and image-based data acquisition were combined to monitor key citrus growth parameters, including chlorophyll content, land surface temperature, canopy temperature, leaf water content, and soil moisture. In each experimental plot, land surface temperature and canopy temperature were measured using a handheld infrared thermometer in synchronization with UAV-based data acquisition, enabling comprehensive thermal monitoring of the citrus growing area.
A meteorological observation and in-field crop transpiration monitoring system was established. Conventional meteorological variables—including air temperature, relative humidity, sunshine duration, atmospheric pressure, wind speed, and precipitation—were automatically recorded every 30 min by the local meteorological station, ensuring data continuity and timeliness. Concurrently, a plant sap flow monitoring system (DJ-6393B, Dianjiang Technology Co., Ltd., Shanghai, China) was used to automatically record daily transpiration rates at the field scale. Rigorous sensor calibration, data validation, and outlier removal procedures were applied to ensure the accuracy and reliability of both meteorological and crop transpiration datasets, thereby providing high-quality, precise data for agro-meteorological research, crop growth modeling, and precision agriculture management.
2.5. Mathematical Model
- (1)
Single crop coefficient method
The FAO-56 recommended single crop coefficient method is widely used for estimating crop evapotranspiration (
ETc) over daily or longer periods due to its simplicity and ease of application [
44]. The method primarily involves calculating the reference crop evapotranspiration (
ET0) first, then adjusting it by multiplying it by a crop coefficient (
Kc) that reflects the actual crop growth status and field soil moisture conditions. Reference evapotranspiration (
ET0) represents the evapotranspiration from a hypothetical reference grass surface under well-watered conditions, while actual crop evapotranspiration (
ETc) accounts for both crop transpiration and evaporation from soil and wet vegetation, thus reflecting the real water consumption of a specific crop under actual field conditions However, the single crop coefficient method is inherently empirical and may not accurately estimate
ETc across all regions and crop types. The crop coefficient is influenced by multiple factors, including external conditions such as climate, soil properties, and cultivation practices, as well as internal factors related to crop growth stages [
45]. Therefore, validation with measured evapotranspiration data is necessary to ensure estimation accuracy. The daily reference evapotranspiration (
ET0) is calculated using the FAO Penman-Monteith equation provided by the Food and Agriculture Organization (FAO) [
46]:
Calculation of
ETc crop coefficient method [
47]:
where
ET0 is the daily reference crop evapotranspiration (mm·d
−1);
Rₙ is the net radiation at the crop canopy surface (MJ·m
−2·d
−1);
G is the soil heat flux (MJ·m
−2·d
−1);
T is the mean air temperature (°C);
U2 is the mean wind speed at 2 m height (m·s
−1);
eₛ is the saturation vapor pressure (kPa);
eₐ is the actual vapor pressure (kPa); Δ is the slope of the saturation vapor pressure–temperature curve (kPa·°C
−1);
γ is the psychrometric constant (kPa·°C
−1);
ETc is the actual crop evapotranspiration (mm·d
−1); and
Kc is the crop coefficient.
To enhance the estimation of soil heat flux (
G) and account more accurately for vegetation effects on evapotranspiration, a multispectral data–based approach was adopted [
48]. This method extends the applicability of the FAO-56 single crop coefficient framework to a wider range of field conditions. In this study, Formula (2) and (3) was selected for
G calculation to better reflect the actual conditions of the open-field experimental environment.
where
α is the surface albedo, and
Tₛ is the land surface temperature (
K).
The normalized difference vegetation index (
NDVI) is calculated as follows [
49]:
where
NIR is the reflectance in the near-infrared band, and
R is the reflectance in the red band.
- (2)
S-I model method
Crop canopy temperature refers to the average temperature of the stem and leaf surfaces at different heights within the crop canopy. This parameter is not only useful for drought monitoring and irrigation scheduling but is also closely related to crop energy balance principles and water status, making it an excellent indicator for scale linkage and scale transformation [
50]. Therefore, measuring crop canopy temperature enables effective monitoring of crop water status, thereby providing a scientific basis for precision irrigation decision-making.
In 1977, Jackson et al. [
51] proposed a model for estimating actual regional evapotranspiration based on the difference between canopy and air temperatures:
where
ER is the actual evapotranspiration,
Rn is the net radiation,
D is a semi-empirical coefficient, and
Ta and
Ts are the air temperature and crop canopy surface temperature, respectively. This model is used to estimate evapotranspiration over large-scale agricultural fields.
In 1983, Seguin and Itier [
52] improved upon Jackson’s canopy–air temperature difference method for estimating daily crop evapotranspiration by omitting terms in the energy balance equation with relatively small contributions (e.g., soil heat flux). They proposed a simplified calculation model with fewer parameters, hereafter referred to as the S-I model:
where
ETc is the daily crop evapotranspiration (mm·d
−1);
Rn is the daily net radiation (mm·d
−1);
Tc is the canopy temperature (°C);
Ta is the air temperature (°C); and
a and
b are empirical coefficients. The parameters
a and
b are influenced by factors such as crop type, wind speed, and radiation, and therefore require calibration and validation according to the specific crop and local environmental conditions. In this study, UAV thermal imagery was processed in ENVI software using the Region of Interest (ROI) method to separate canopy and soil surface pixels. The canopy temperature (
Tc) was extracted from orchard canopy ROIs, while the soil surface temperature (
Ts) was obtained from ROIs corresponding to exposed soil areas.
- (3)
Construction of the Data Fusion Model
To further enhance the accuracy of UAV-based remote sensing in estimating citrus orchard evapotranspiration, this study proposes a multi-source fusion model integrating thermal infrared and multispectral remote sensing data. The proposed fusion model combines the S-I model driven by thermal infrared remote sensing with the single crop coefficient model driven by multispectral remote sensing, and is constructed by applying a weighted summation of the evapotranspiration estimates derived from the two models:
where
ETc1 denotes the evapotranspiration estimated using the S-I model driven by thermal infrared remote sensing,
ETc2 represents the evapotranspiration estimated using the single crop coefficient model driven by multispectral remote sensing, and
α and
β are weighting coefficients optimized by minimizing the root mean square error (RMSE) between the model estimates and the corresponding field measurements. The optimization was performed using the Solver tool in Microsoft Excel (GRG Nonlinear method), ensuring convergence to optimal weighting factors under the constraint
α +
β = 1.
- (4)
Stem flow meter detection method
where Formula denotes the stem (sap) flow rate (g h
−1);
V is the stem (sap) flow velocity (g m
−2 s
−1);
SA represents the sapwood area (m
2);
K is a dimensionless variable;
S denotes the canopy coverage area (cm
2); and
T is the crop transpiration (mm). This method follows the approach of Granier [
53].
3. Results
3.1. Calibration of the S-I Model
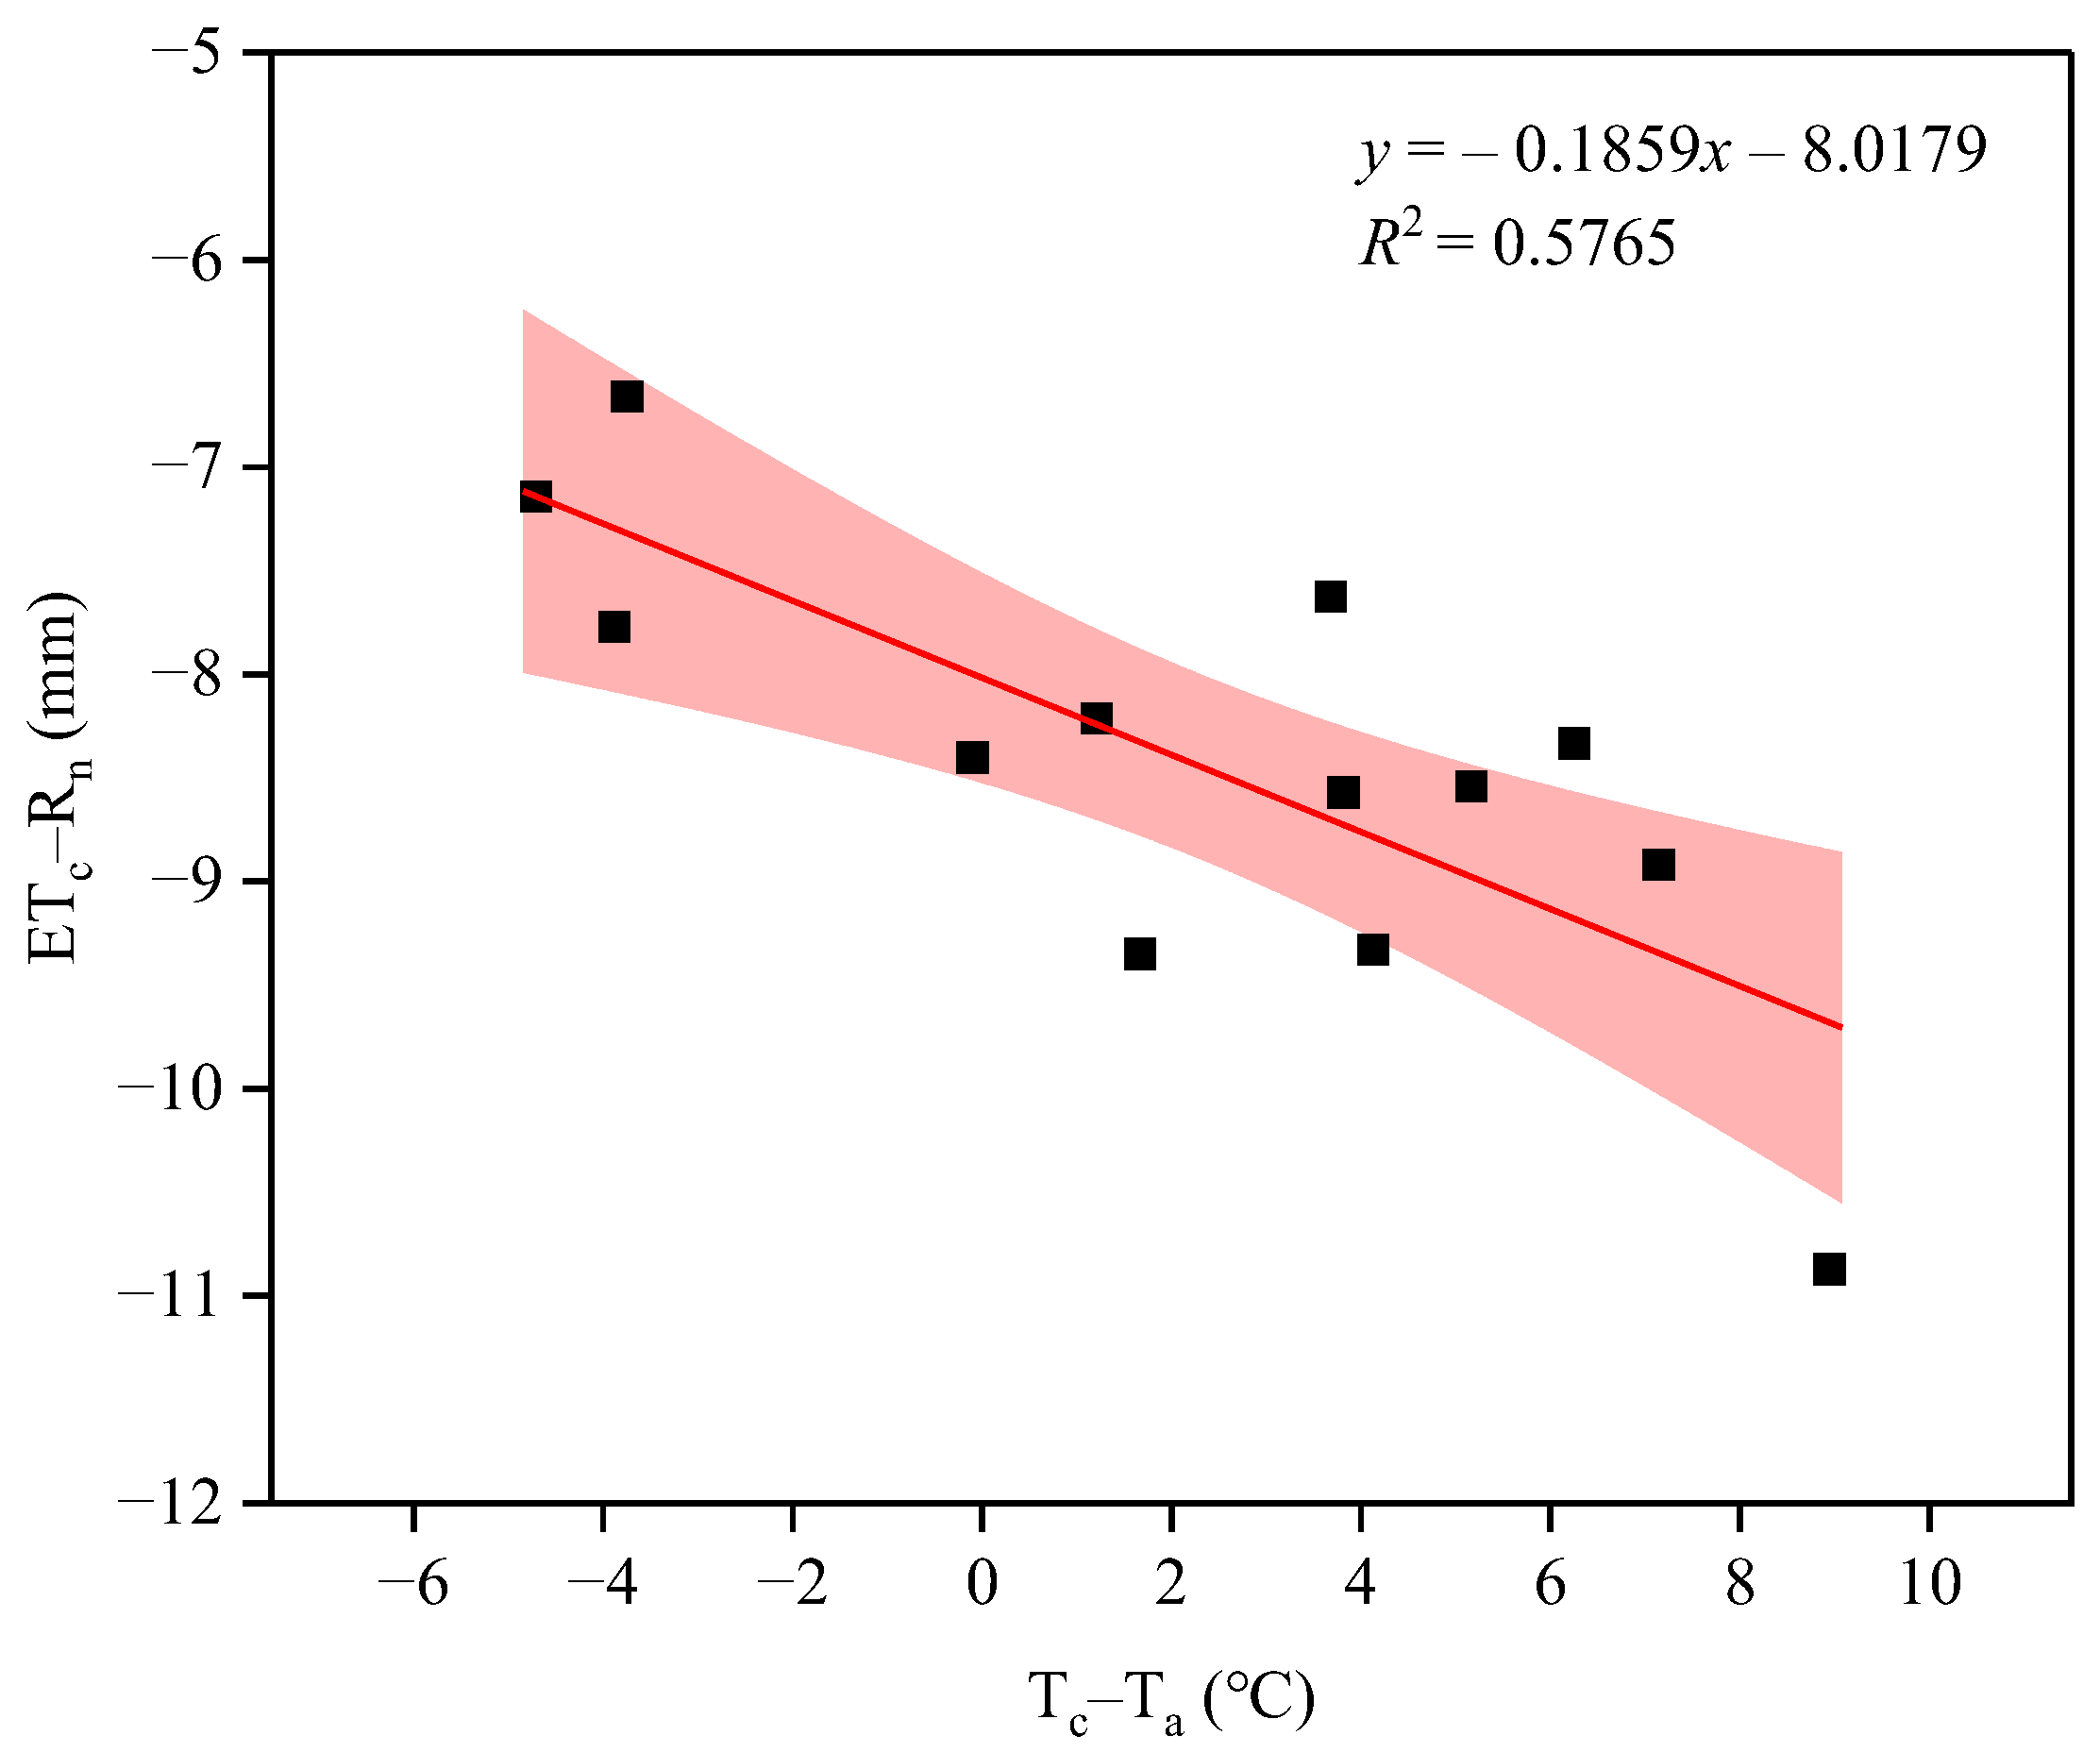
When applying the S-I model to estimate daily evapotranspiration of citrus, it is necessary to calibrate the model parameters a and b according to the underlying surface conditions of the citrus orchard to ensure the model’s applicability. In this study, the daily citrus evapotranspiration measured by the sap flow system, along with daily net radiation recorded by the weather station and the citrus canopy and air temperatures, were used to calibrate parameters a and b in the S-I model. Correlation analysis between ETc–Rn and Tc–Ta indicated a significant positive relationship (R2 = 0.5765, p < 0.01), demonstrating that Tc–Ta can reliably be used to estimate the S-I model parameters. The dataset was divided such that approximately 70% of the observations were used for calibration of the S-I model parameters, while the remaining 30% were reserved for validation. Within the validation subset, a further split of 70% for training and 30% for testing was applied to evaluate model performance.
The linear relationship between the difference in daily citrus evapotranspiration and daily net radiation, and the difference between citrus canopy temperature and air temperature is shown in
Figure 5. After calibrating the S-I model parameters, parameter a was determined to be −8.0179, and parameter b was −0.1859, both negative values. The coefficient of determination R
2 between the difference in daily citrus evapotranspiration and daily net radiation and the instantaneous difference between citrus canopy and air temperatures was 0.5765, indicating a certain linear relationship between them.
3.2. Validation of ET Estimation Accuracy Using the S-I Model
Based on the calibrated parameters a and b, daily citrus ETc was estimated using the S-I model by inputting canopy temperature extracted from UAV thermal infrared imagery, along with air temperature and daily net radiation measured at the meteorological station. The estimated ETc values were then compared with the measured ETc obtained from the sap flow system.
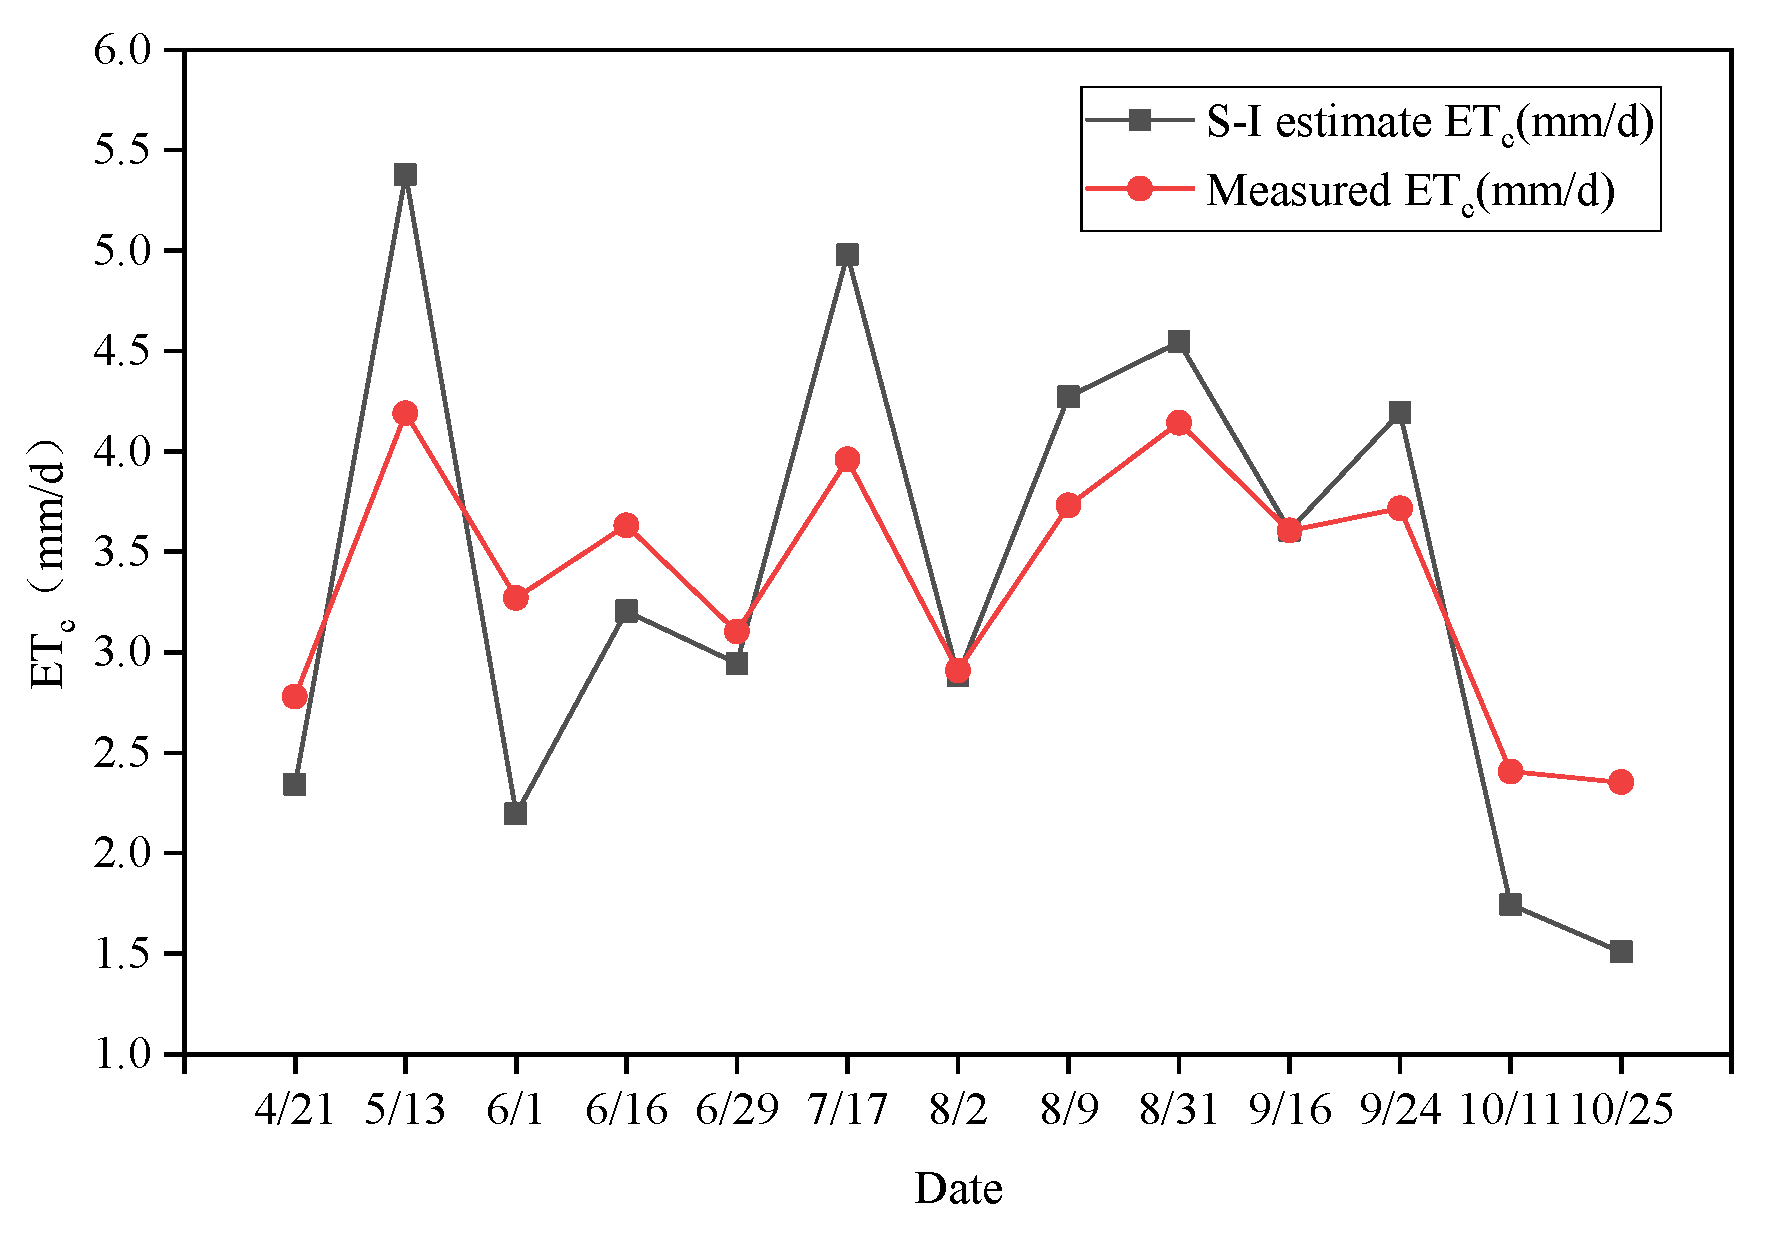
As shown in
Figure 6, the
ETc estimated by the S-I model closely follows the trends of the sap flow measurements, with no significant deviations. During the bud and flowering stage, citrus growth is slow and vegetation coverage is low, resulting in lower transpiration and a larger proportion of soil evaporation; on 21 April,
ETc was 2.34 mm. During the young fruit and fruit expansion stages, canopy coverage increases, enhancing transpiration, and
ETc rises to 5.38 mm on 13 May. In the color-change and sugar-accumulation stage, leaf senescence and fruit maturation cause
ETc to decrease, reaching 1.74 mm on 11 October. The estimated
ETc values reflect the developmental stages of citrus, with fluctuations within the normal range. Nevertheless, slight deviations were observed on 13 May, 1 June, 17 July, and in October, which may be attributed to transient meteorological conditions (e.g., sudden changes in solar radiation or rainfall), measurement uncertainties in the sap flow system, and simplifying assumptions of the S-I model that cannot fully capture canopy and soil heterogeneity. Meteorological conditions also influence
ETc: on 13 May, increased sunlight slightly elevated
ETc above the typical value, whereas on 1 June and 2 August, prior rainfall reduced temperature and sunlight, resulting in lower
ETc values of 2.20 mm and 2.88 mm, respectively.
Figure 7 shows that the 13 experimental data points are mostly distributed near the 1:1 line, indicating good agreement between the S-I model estimates and measured
ETc. A significant linear relationship was observed at
p < 0.01, with the estimation accuracy exceeding 80%. The coefficient of determination (R
2) was 0.8775, the root mean square error (RMSE) was 0.6708 mm/d, and the mean absolute error (MAE) was 0.5589 mm/d. The fitting results of the simple linear regression model between the S-I model and measured
ETc are presented in
Figure 7. The estimated
ETc values in this study are consistent with previously reported daily evapotranspiration rates for citrus orchards and other perennial crops. For example, Rana et al. [
54] reported daily
ETc ranging from 1.5 to 5.5 mm for citrus in Mediterranean conditions, Longo-Minnolo et al. [
55] observed similar values using the ArcDualKc model. These comparisons indicate that the S-I model provides reliable and realistic estimates of citrus evapotranspiration.
3.3. Estimation of Citrus Evapotranspiration Based on the S-I Model
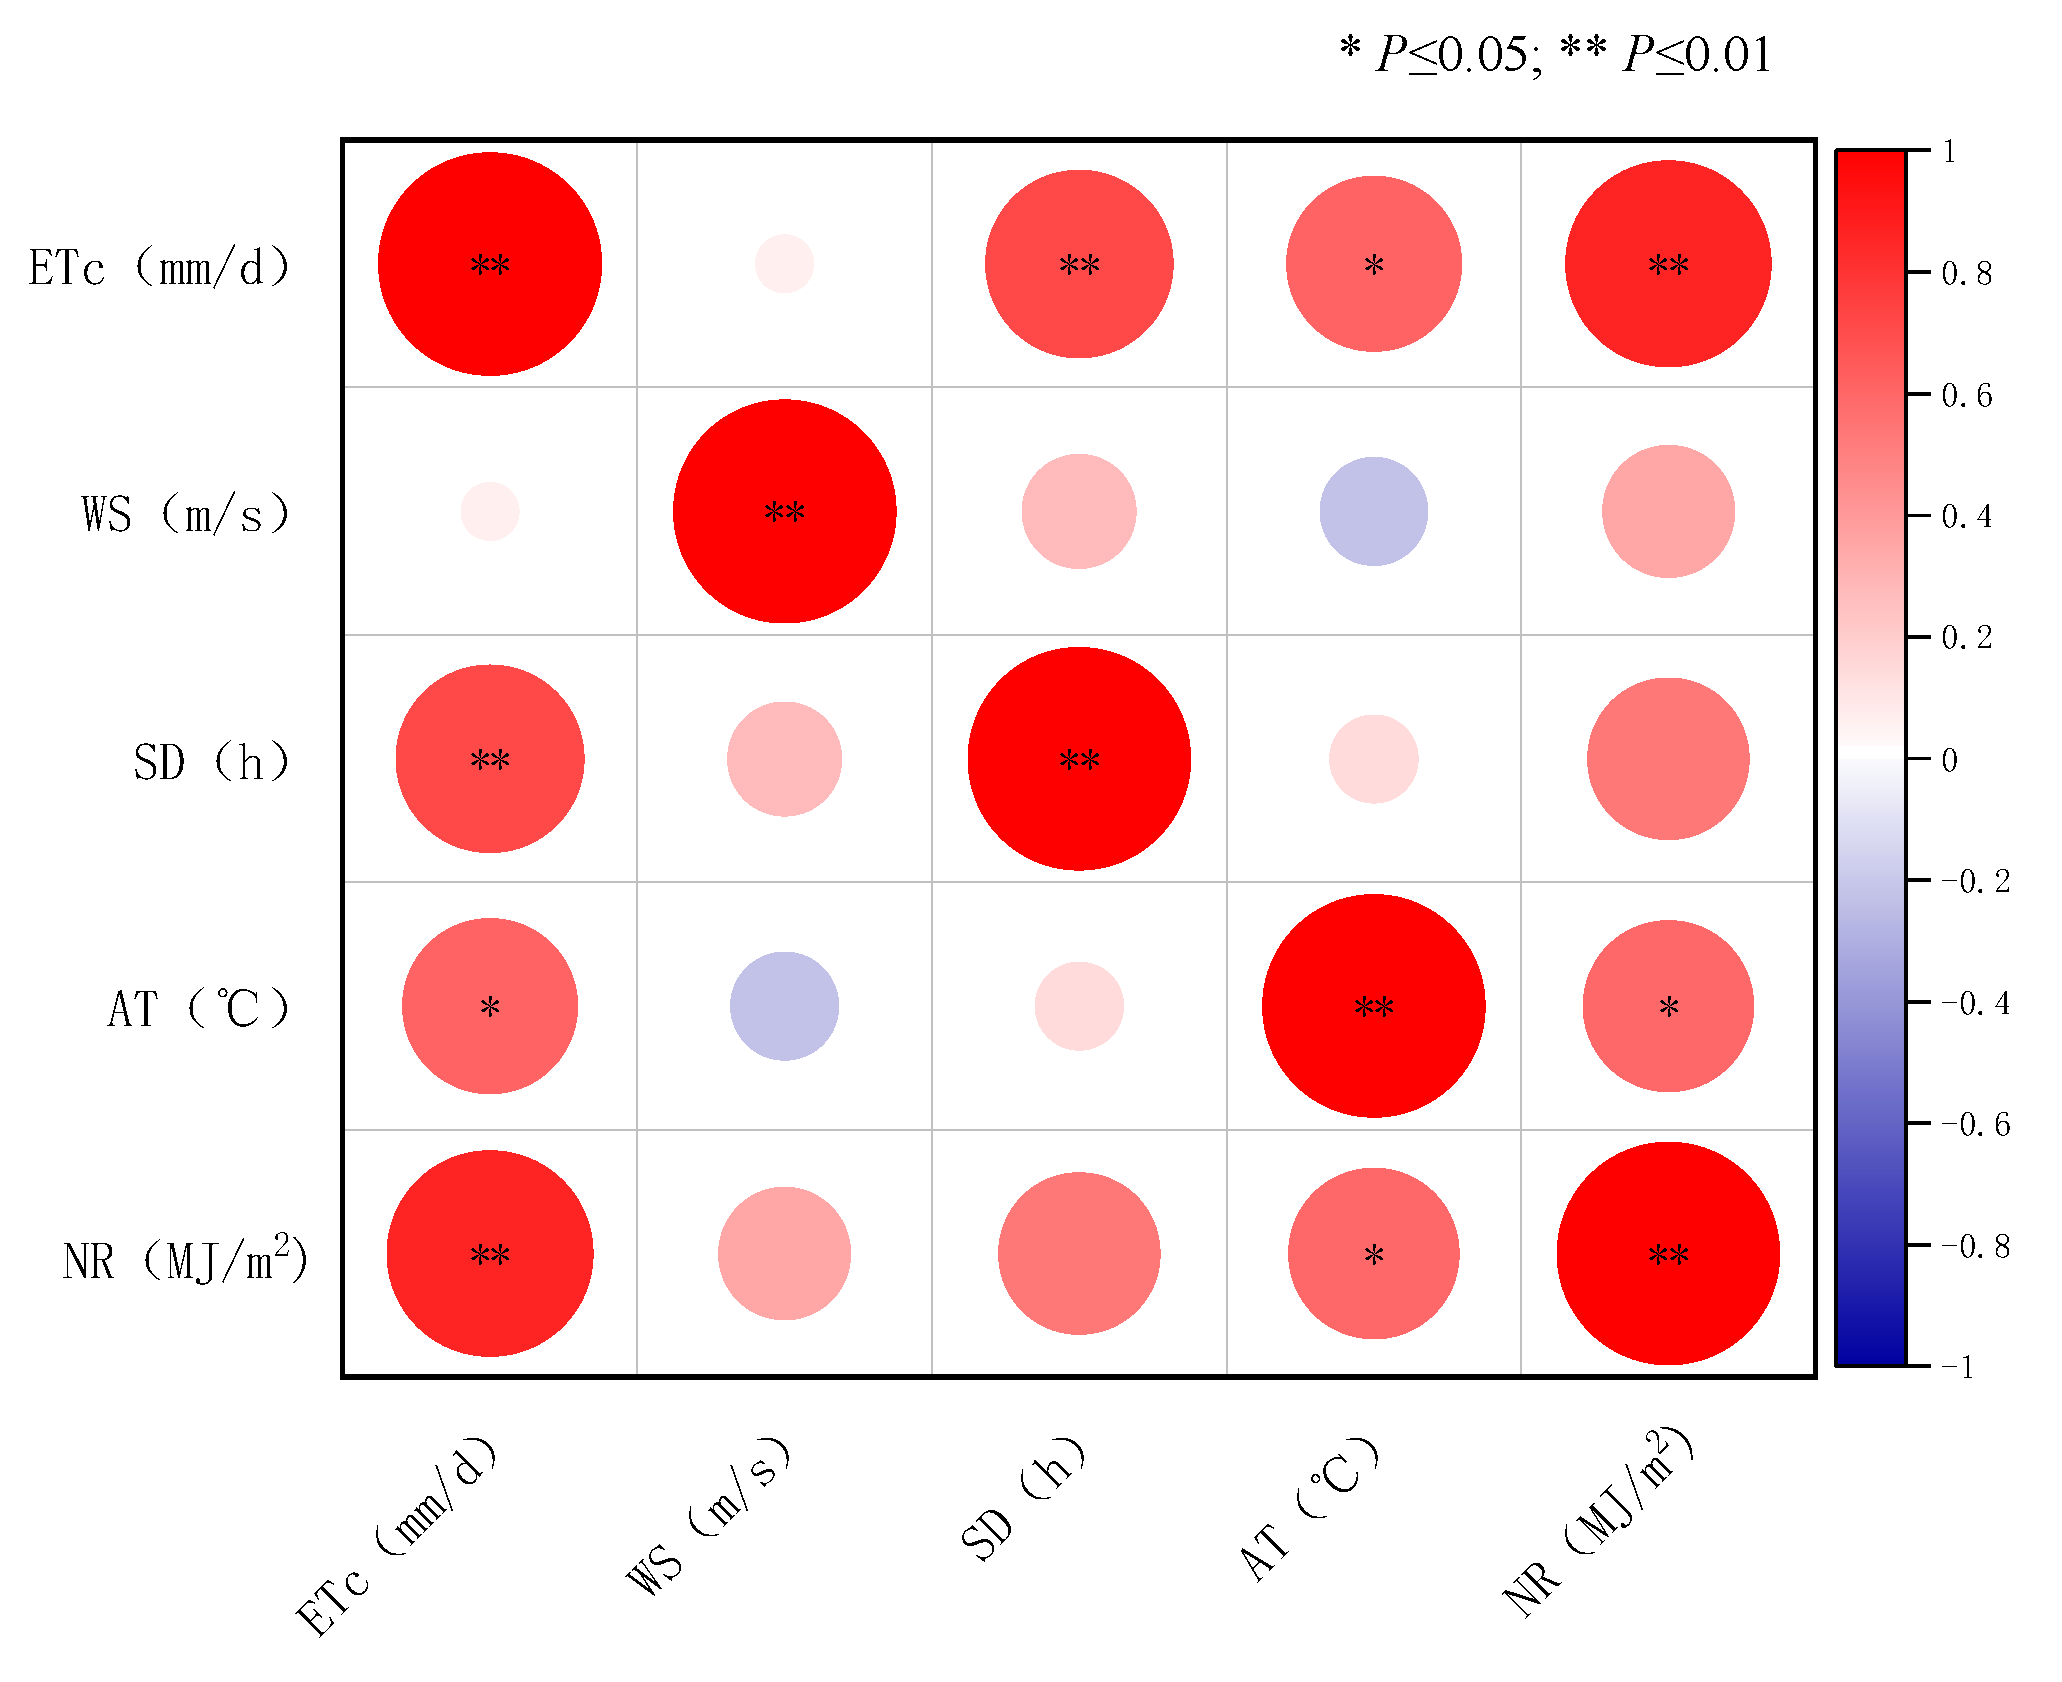
Based on the S-I model, the correlation between citrus
ETc and meteorological and non-meteorological factors was analyzed. The summary of these influencing factors is presented in
Table 3. Although NDVI is generally expected to correlate positively with canopy condition and crop transpiration, in this study, its relationship with citrus
ETc was weak (R
2 = 0.0157). This may be attributed to NDVI saturation in dense citrus canopies, which reduces its sensitivity to variations in transpiration, as well as the fact that the S-I model primarily relies on canopy temperature relative to air temperature, making NDVI less directly influential on
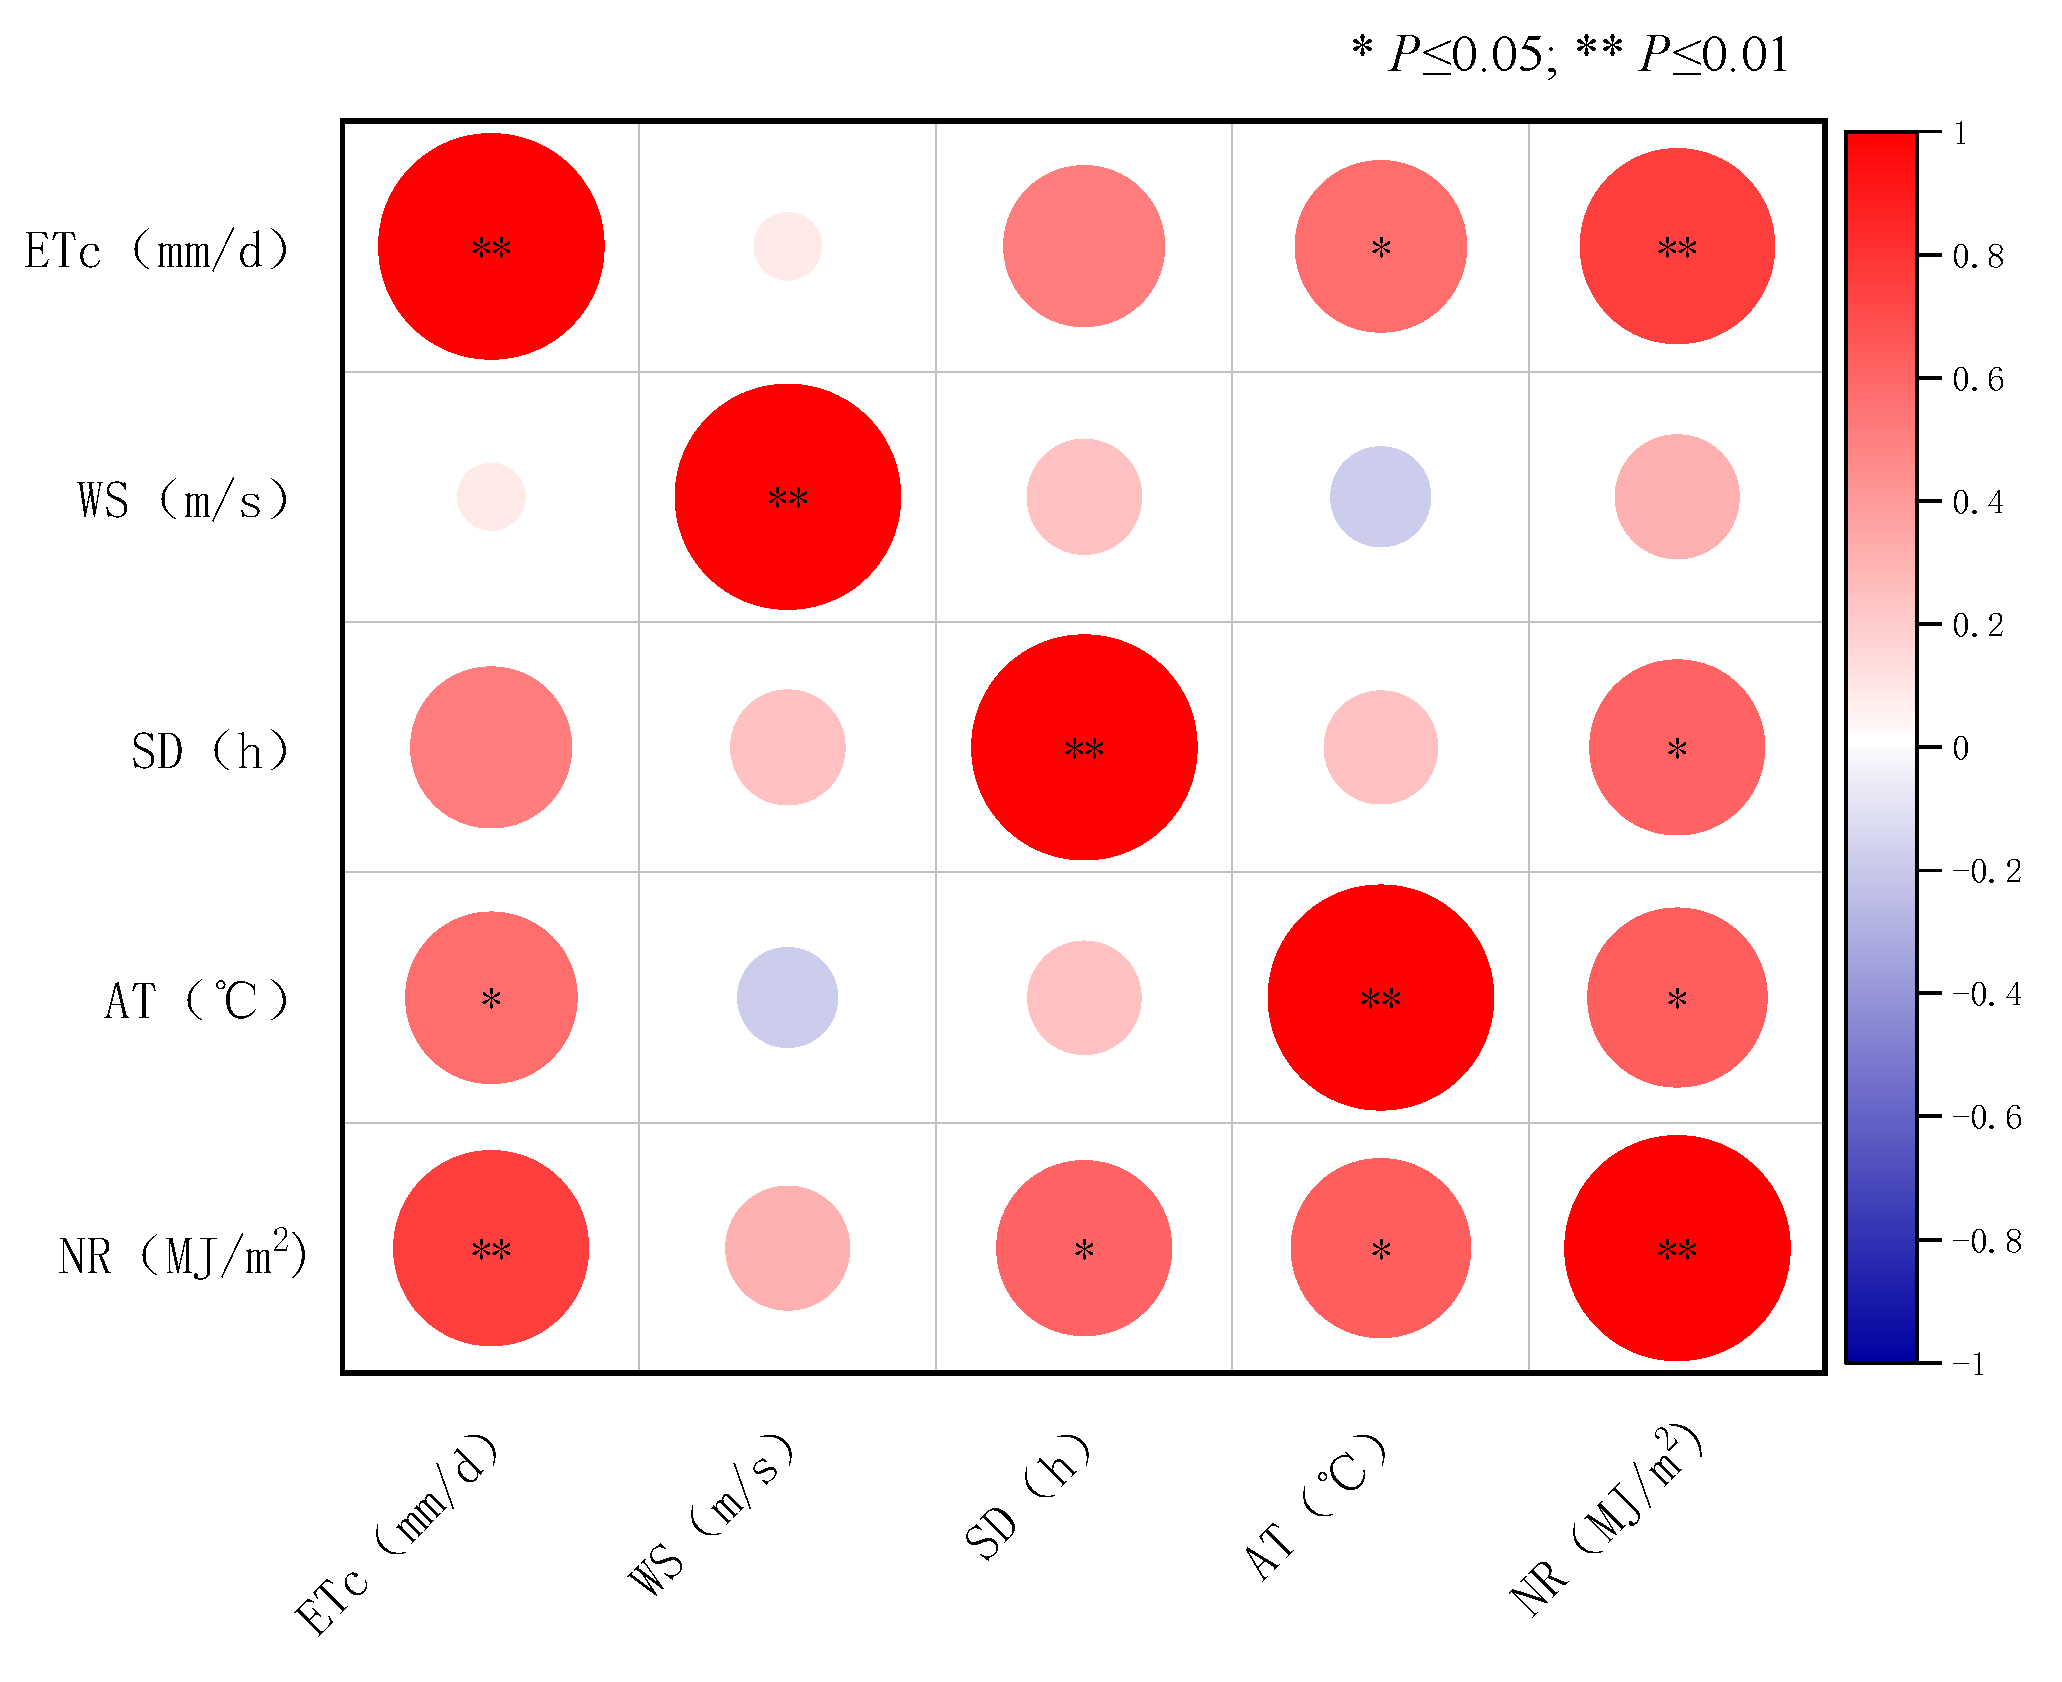
ETc estimation. The results show that net radiation is the main meteorological factor affecting
ETc [
56], with the highest correlation with
ETc (R
2 = 0.7059,
p < 0.01) (
Figure 8). As the direct driving force of evapotranspiration, net radiation is the main source of energy input, providing the necessary energy for plant transpiration and soil evaporation, and plays a key role in the evapotranspiration process [
57,
58]. Sunshine duration and air temperature have secondary effects on
ETc (R
2 = 0.5038,
p < 0.01; R
2 = 0.4954,
p < 0.05), with sunshine duration directly affecting the intensity and duration of net radiation, thereby influencing
ETc [
59]; air temperature regulates transpiration by affecting saturated vapor pressure, with higher temperatures leading to greater saturated vapor pressure and stronger transpiration; wind speed has the least effect (R
2 = 0.1837).
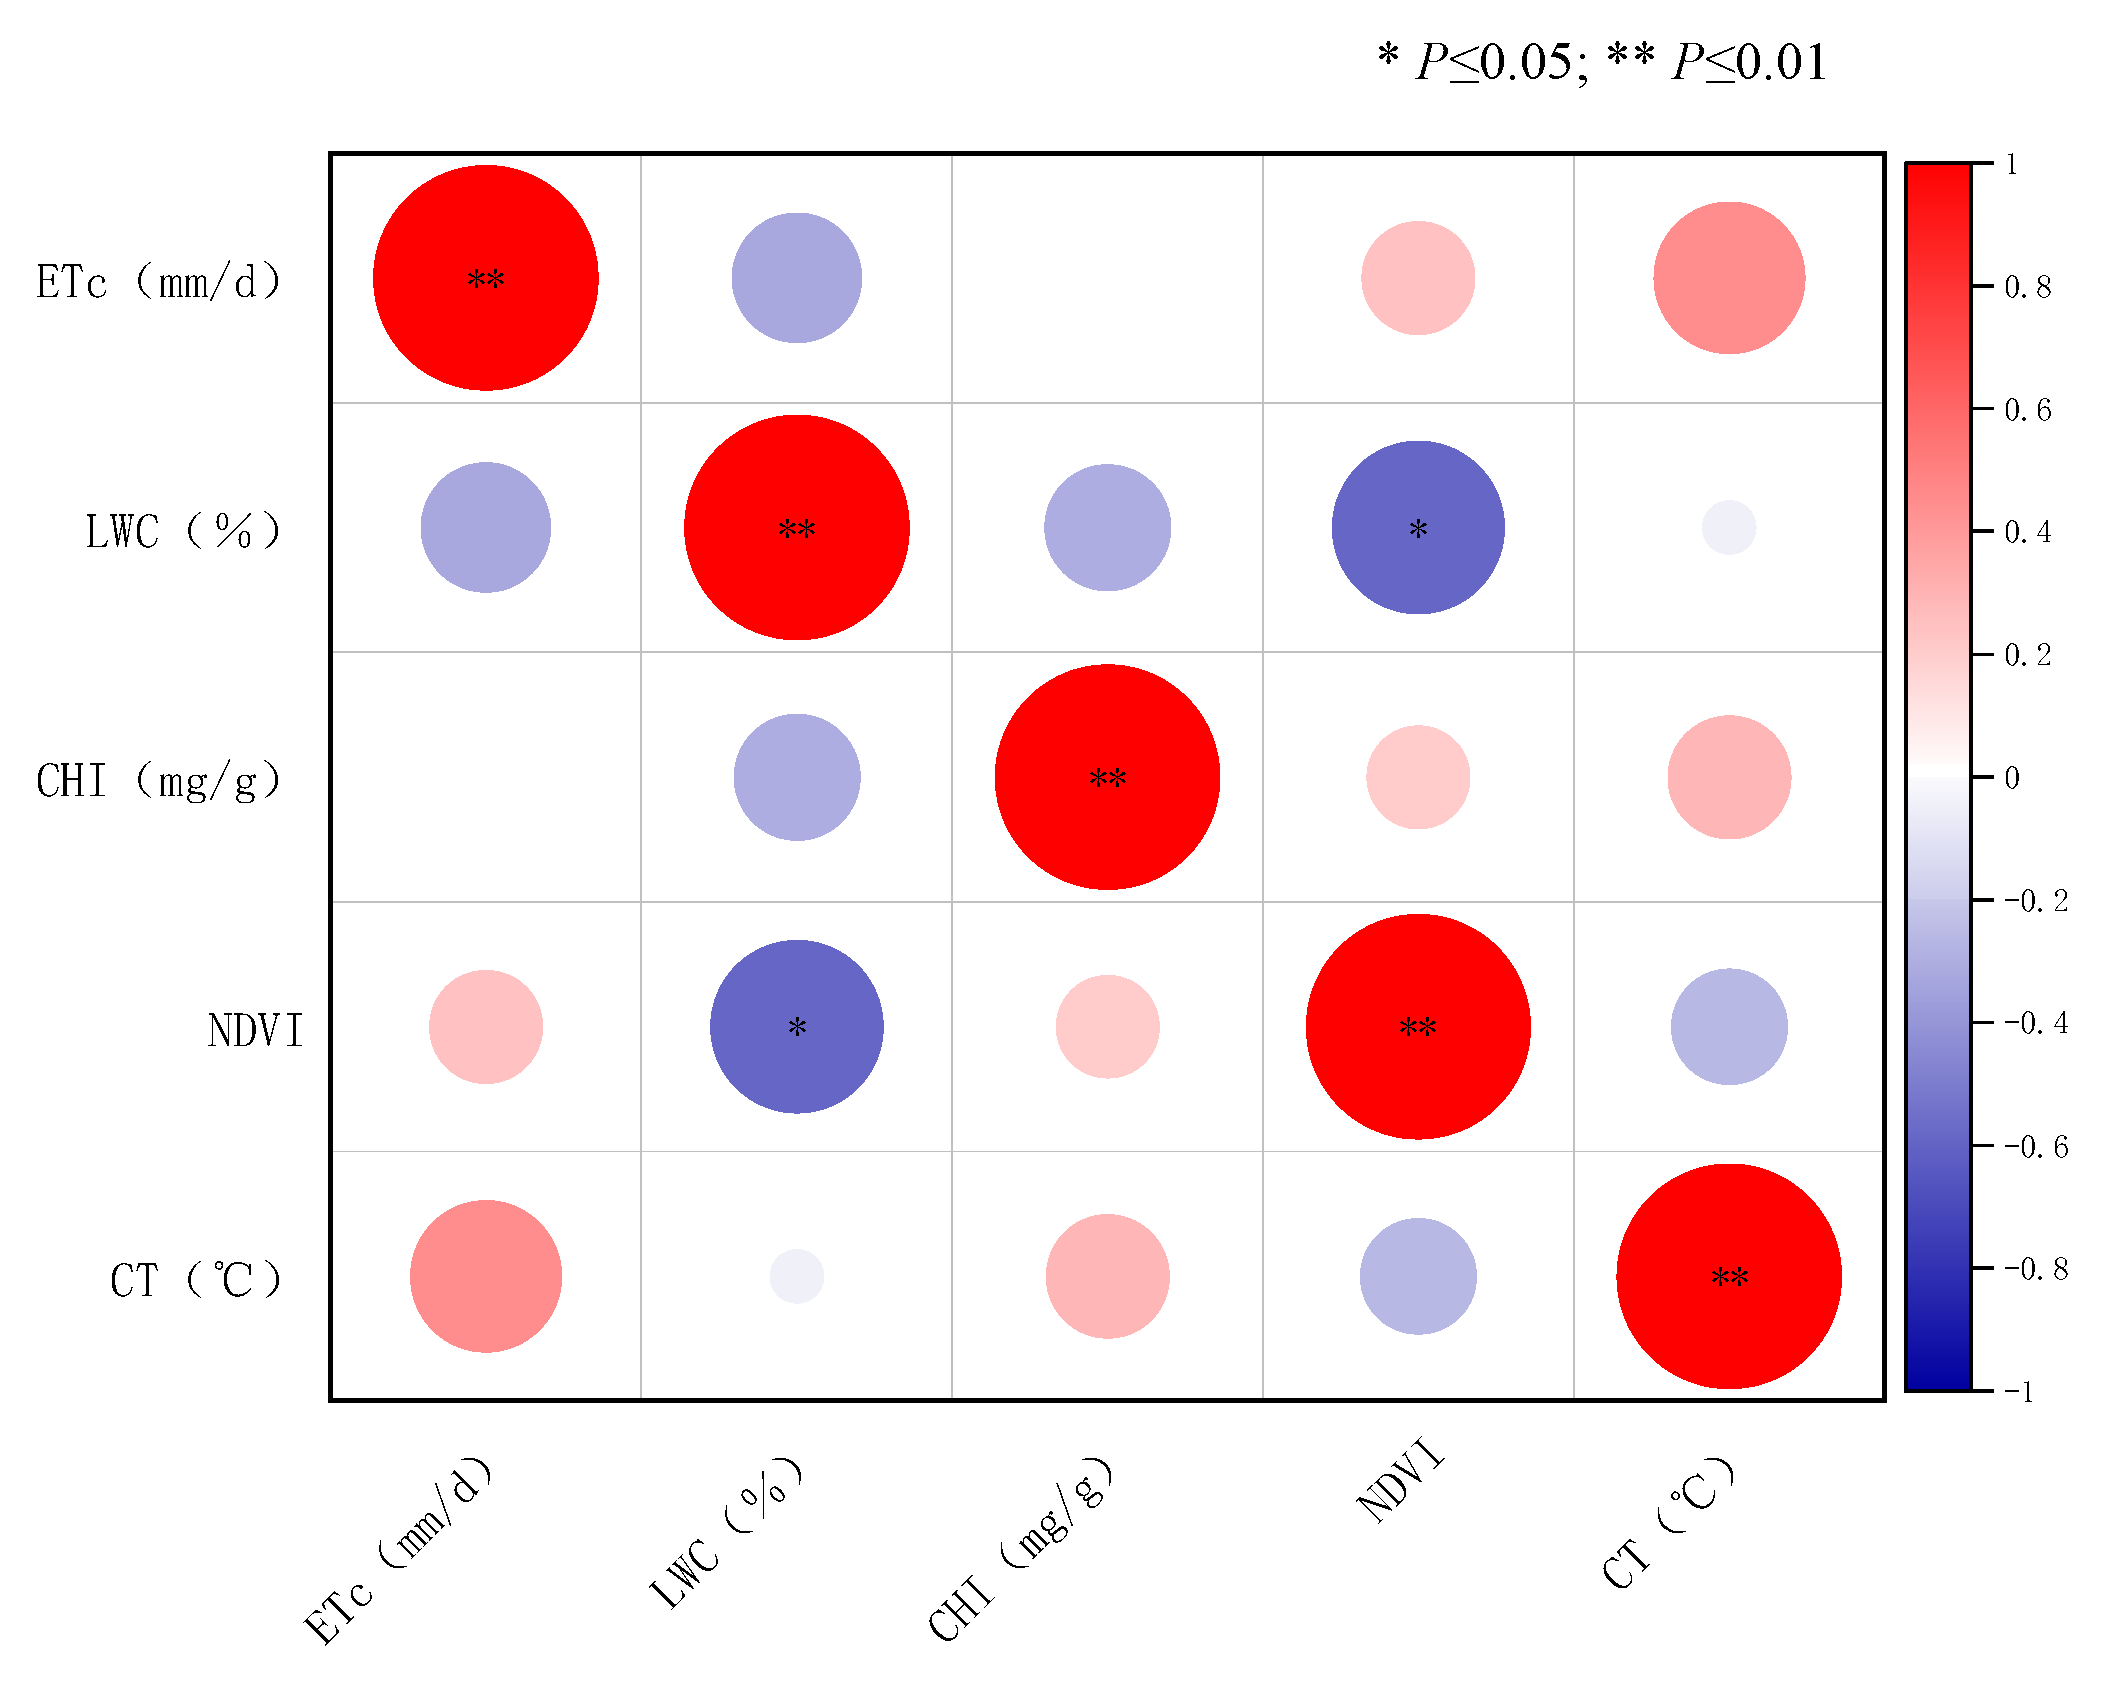
For non-meteorological factors, leaf water content shows a certain correlation with
ETc (R
2 = 0.3743) (
Figure 9). Changes in leaf water content can reflect the plant’s water use efficiency; when leaf water content is high, stomatal opening is larger, transpiration is stronger, and evapotranspiration increases [
60]. In contrast, NDVI, chlorophyll content, and canopy temperature have low correlations with
ETc (R
2 = 0.0157, 0.0502, and 0.1534, respectively). Unlike crops such as wheat, maize, and rice, citrus NDVI values remain relatively stable during different growth stages [
61]. Changes in chlorophyll content at different citrus growth stages may be influenced by multiple factors, making chlorophyll variations irregular across stages and weakly correlated with evapotranspiration [
62]; canopy temperature is influenced not only by meteorological factors but also by soil moisture conditions [
63]. In conclusion, canopy temperature (CT) is the most important non-meteorological factor affecting citrus
ETc, while NDVI and chlorophyll content have moderate effects, and leaf water content (LWC) shows the lowest importance.
3.4. Estimating the Evapotranspiration of Citrus Crops Based on Single Crop Coefficients
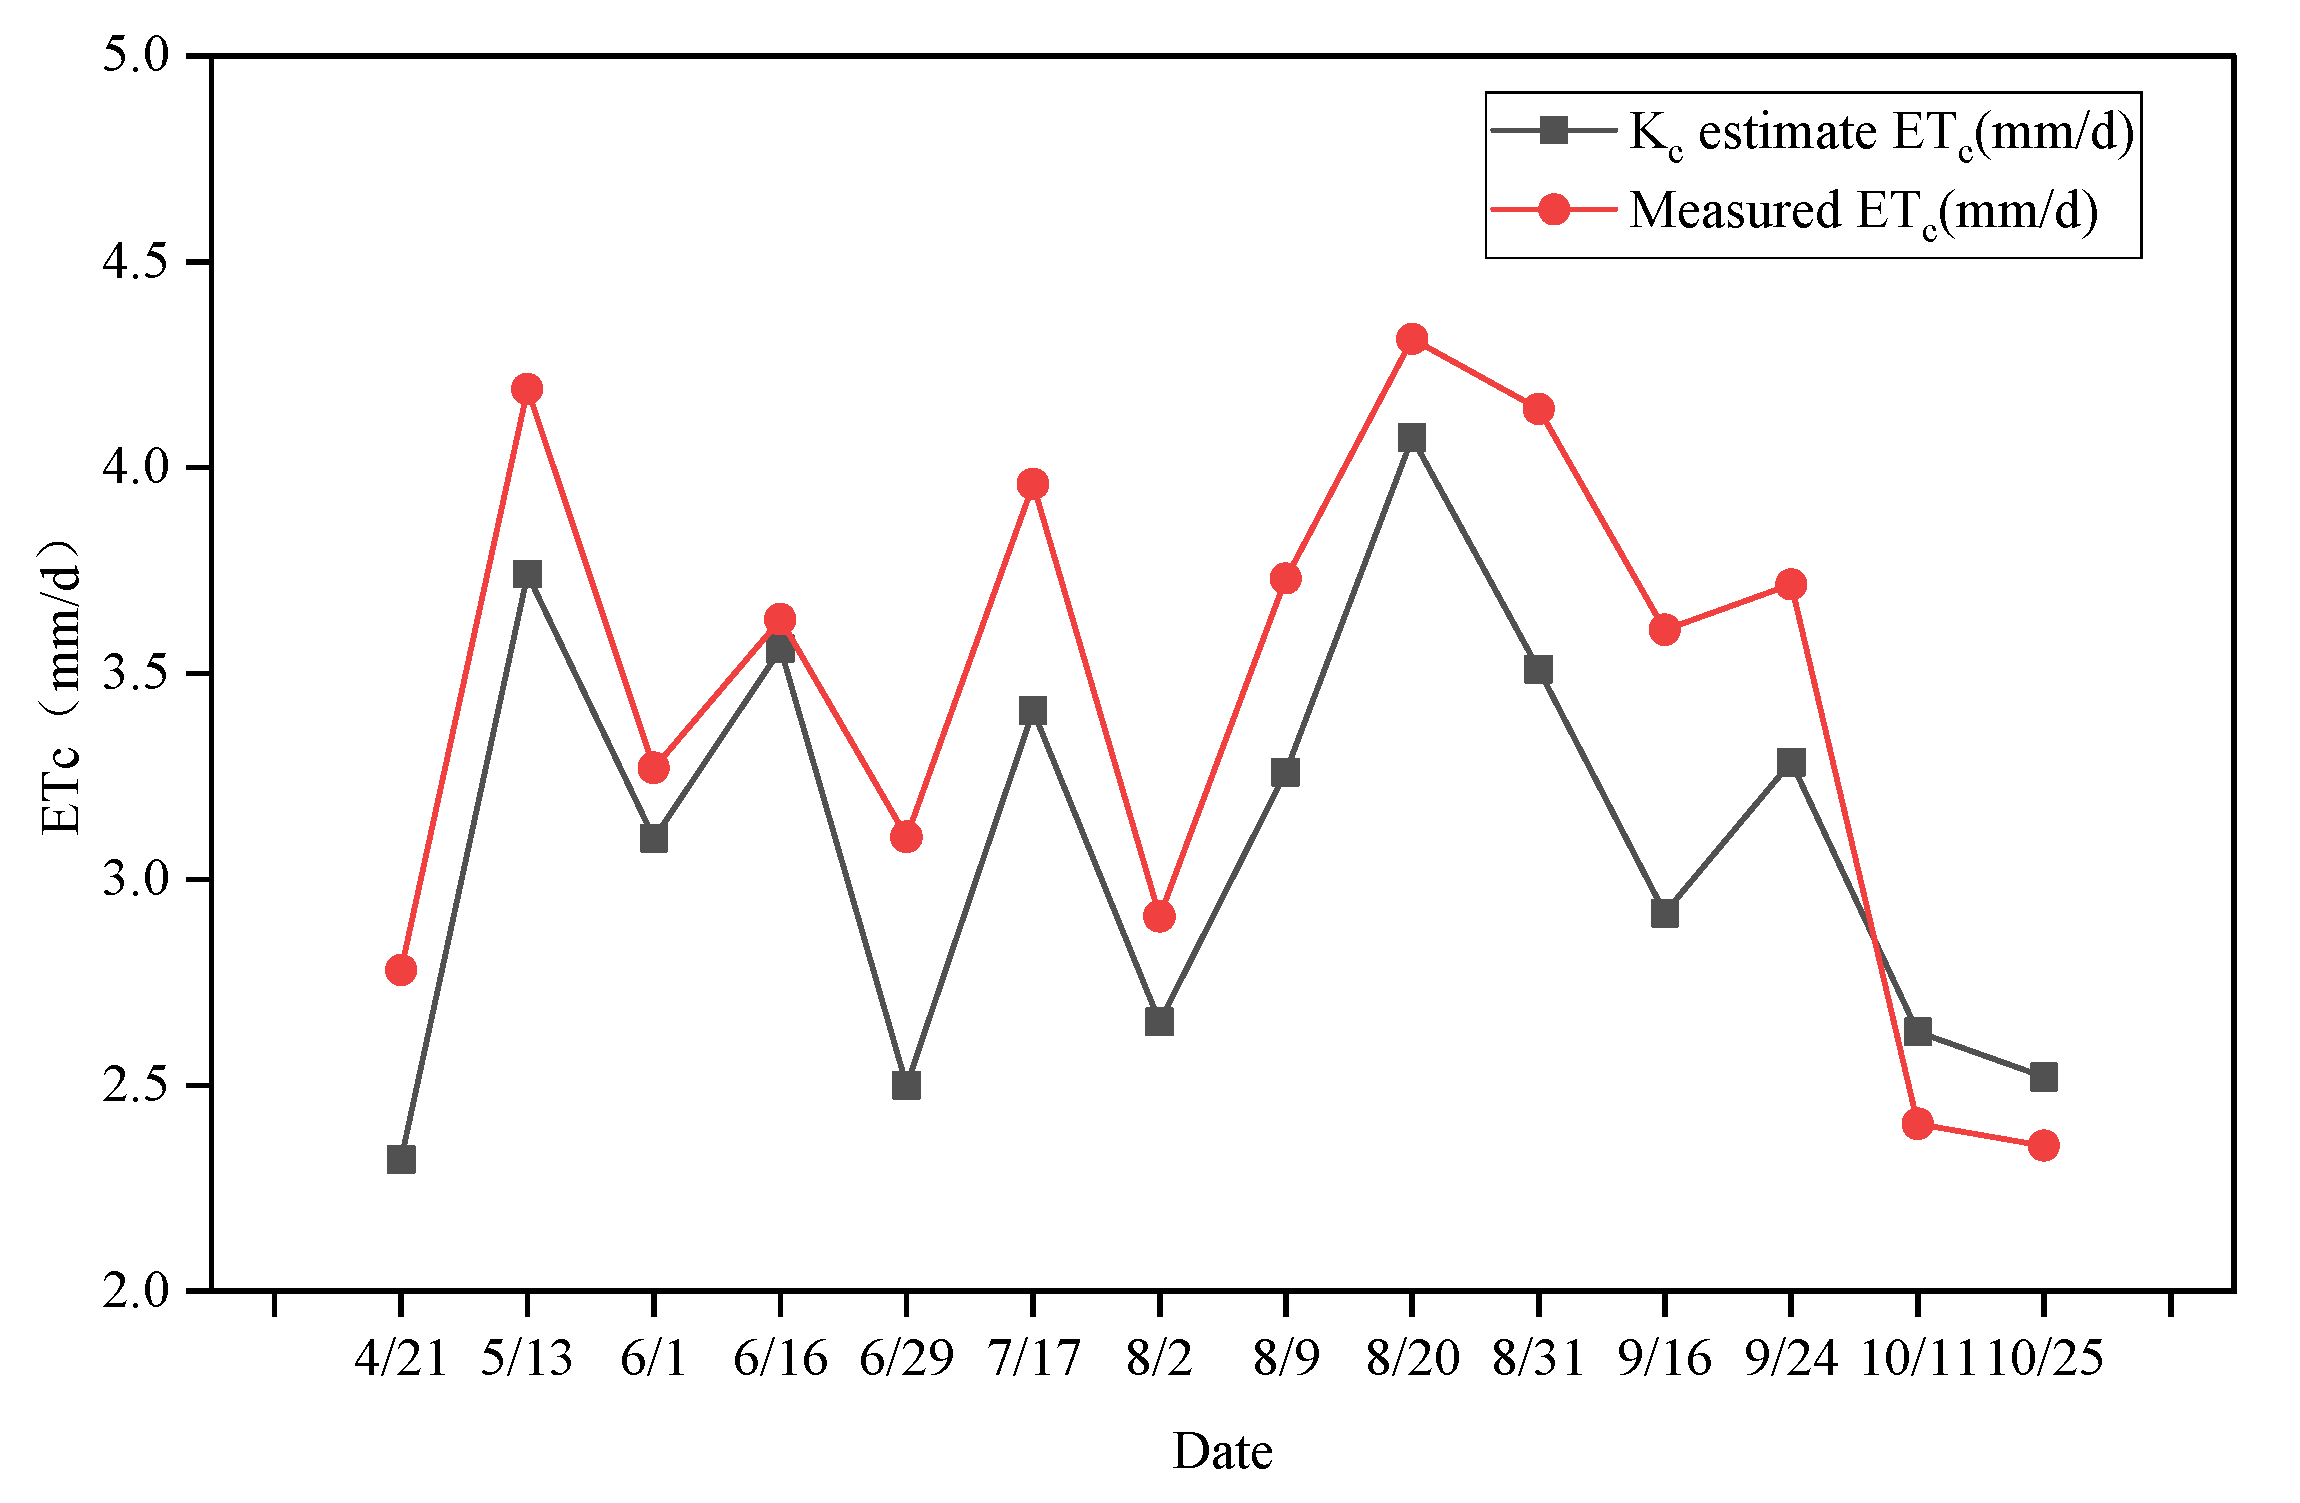
Combining spectral data collected by UAV multispectral remote sensing with simultaneously measured meteorological data, a single-crop coefficient model was constructed. Using sap flow meter measurements, the daily ETc of citrus was calculated for 14 trials during the experimental period, and the correlation between the two methods was compared to evaluate the estimation performance of the single-crop coefficient model.
Figure 10 shows the variation in citrus daily evapotranspiration calculated using the single-crop coefficient model and measured by the sap flow meter. Except for a few extreme values, the overall trends of daily
ETc calculated by the two methods are basically consistent. During the budding and flowering period, citrus grows slowly, vegetation coverage is low, crop transpiration is small, and soil evaporation accounts for a certain proportion of daily
ETc, with the
ETc estimated as 2.32 mm on 21 April. In the young fruit and fruit expansion period, canopy size increases, vegetation transpiration strengthens, and
ETc rises, reaching 3.74 mm on 13 May. During the color-change and sugar-accumulation period, leaves age and fall off, fruits mature, and
ETc decreases, reaching 2.63 mm on 11 October. Overall, the
ETc variation is consistent with citrus growth and development and is influenced by meteorological conditions. On 13 May, due to increased sunshine duration,
ETc was slightly higher than the average for that period; on 20 August, due to sustained high temperatures and irrigation of the orchard on 17 August, which increased soil moisture, soil evaporation intensified, contributing to higher total
ETc, and both soil evaporation and plant transpiration reached high values, with
ETc peaking at 4.07 mm. Conversely, on 29 June and 2 August, due to prior rainfall, lower temperatures, and reduced sunshine duration,
ETc was 2.50 mm and 2.65 mm, respectively, lower than the average level for the period.
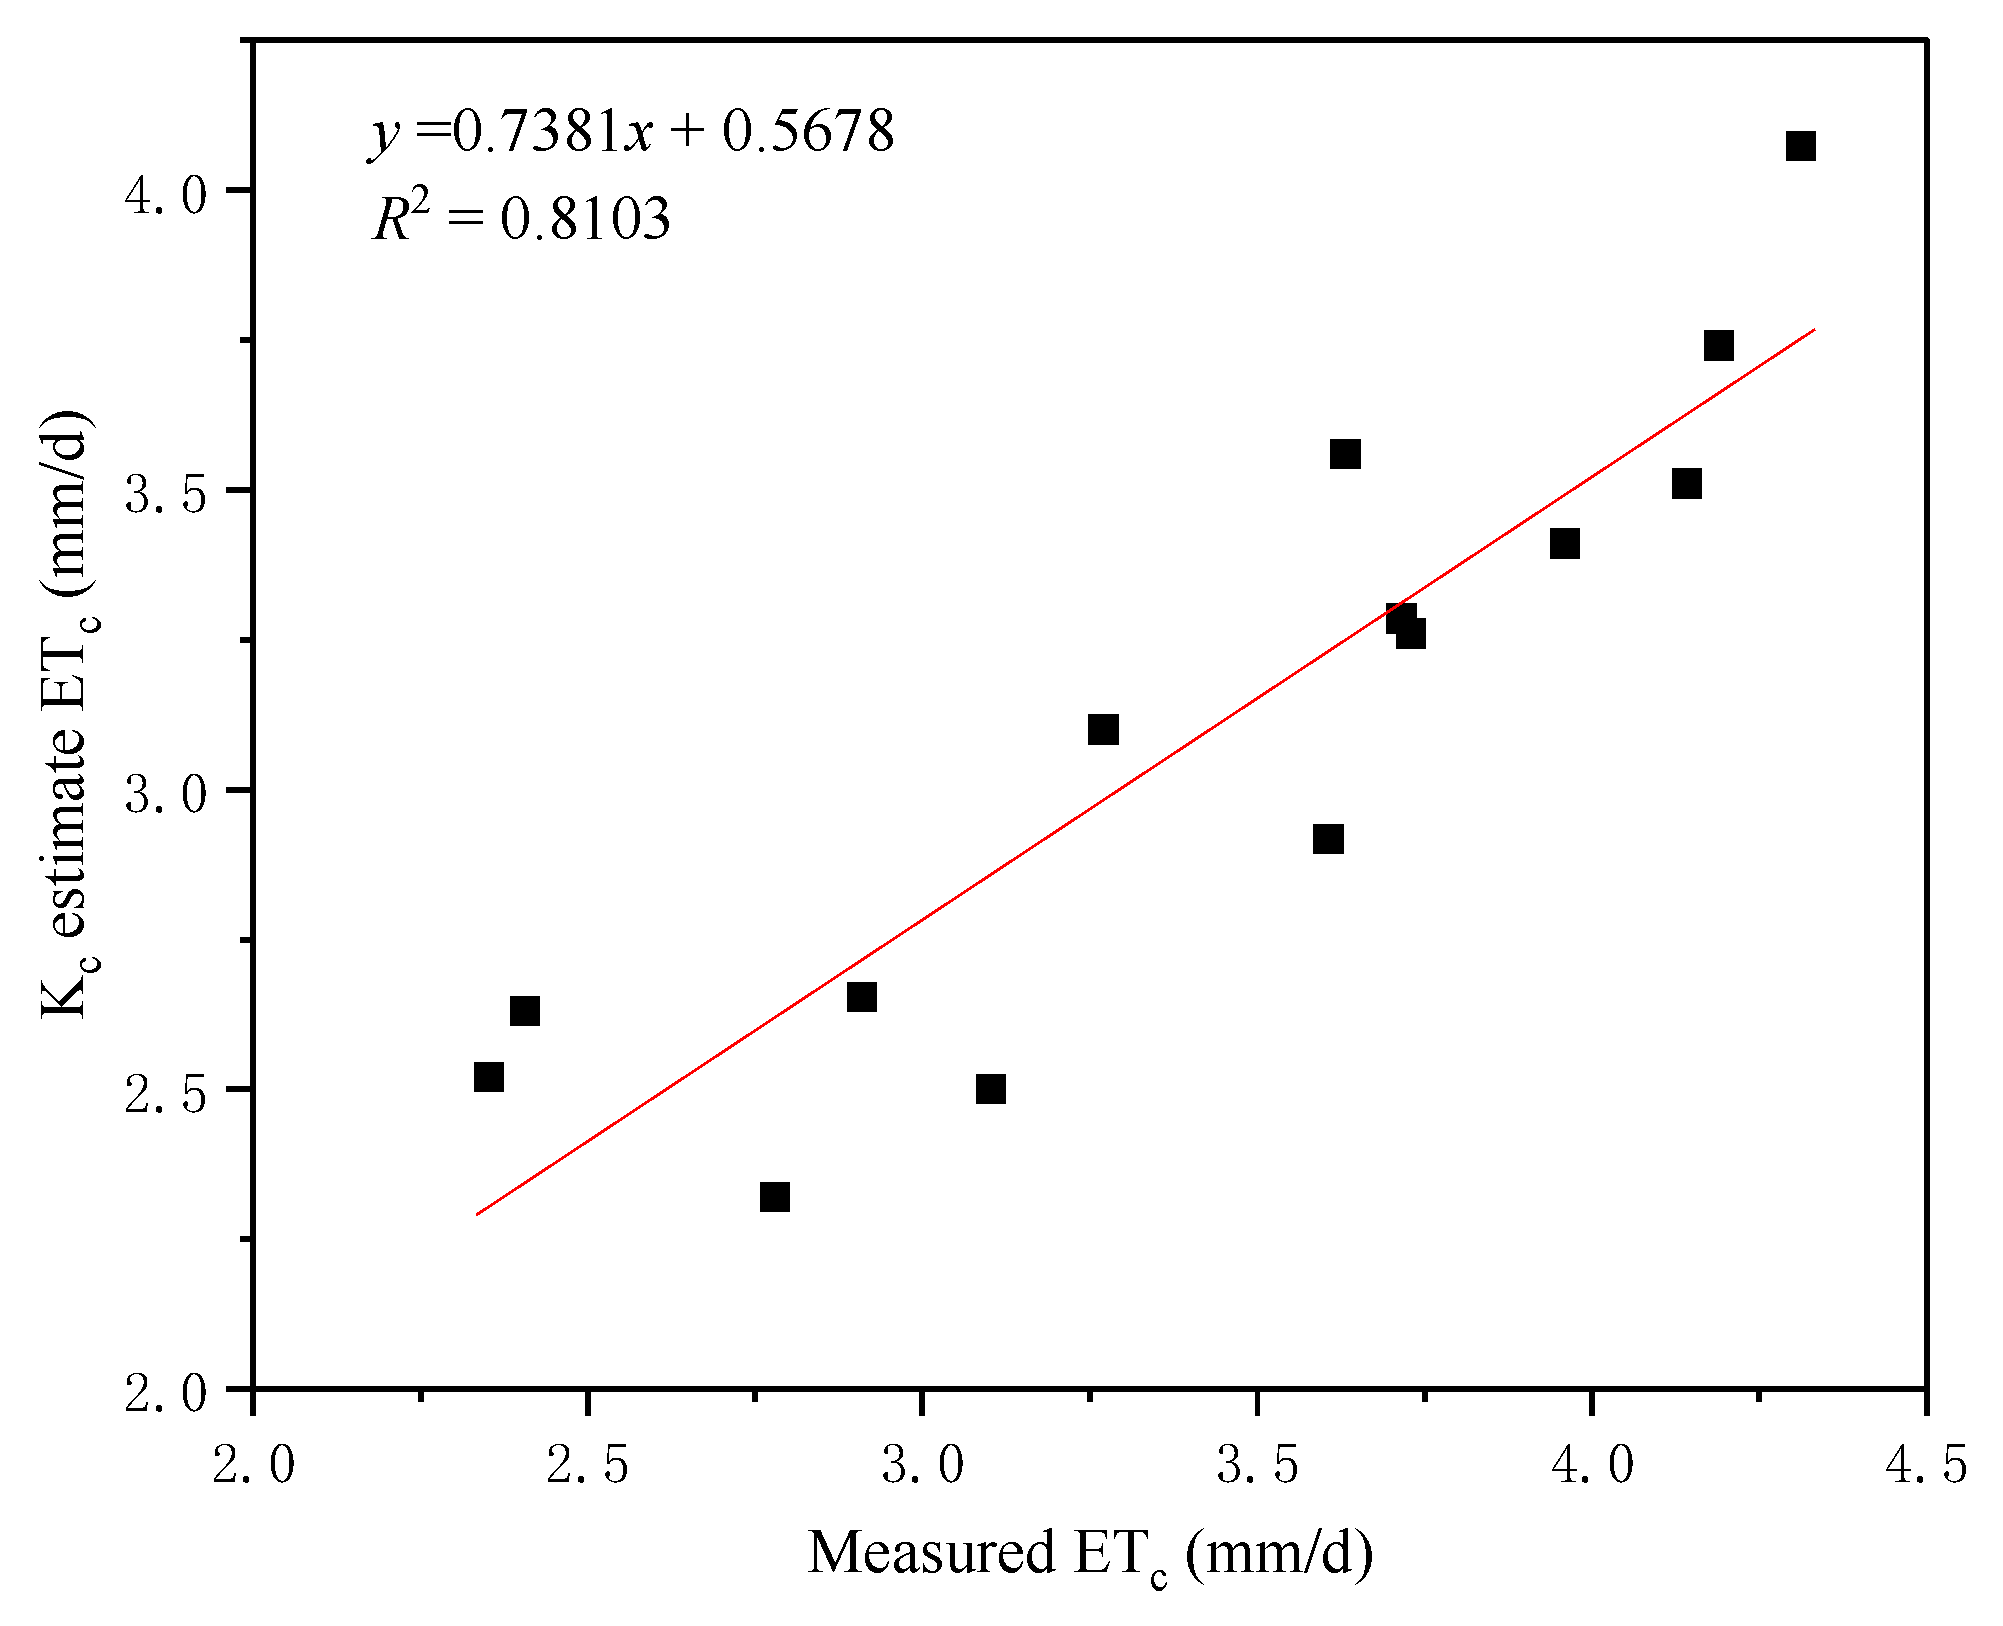
Figure 11 shows a univariate linear regression model established between the daily
ETc calculated using the single-crop coefficient and the sap flow meter measurements. The resulting coefficient of determination (R
2) is 0.8103, the root mean square error (RMSE) is 0.4306 mm/d, and the mean absolute error (MAE) is 0.3867 mm/d. The relationship is significantly linear at
p < 0.01, and the
ETc estimation accuracy reaches over 85%. The regression slope of 0.7381 indicates that the single-crop coefficient model tends to underestimate
ETc at high values. This underestimation is likely related to NDVI saturation at high canopy cover, where increases in leaf area or vegetation density produce minimal changes in NDVI, limiting its sensitivity to variations in canopy transpiration. Consequently, the model may slightly underestimate
ETc during periods of dense foliage.
3.5. Analysis of Factors Affecting Evapotranspiration Based on Single Crop Coefficients
Based on the single-crop coefficient model, the correlation between citrus
ETc and both meteorological and non-meteorological factors was analyzed, and the results are shown in
Table 4. The results indicate that net radiation is the key factor affecting citrus
ETc, showing a significant univariate quadratic nonlinear relationship (R
2 = 0.8014,
p < 0.01), while the effects of air temperature and sunshine duration are smaller compared to net radiation (R
2 = 0.3118,
p < 0.05; R
2 = 0.2688) [
64], and their correlations are slightly lower than the conclusions drawn from the S-I model. Wind speed shows an extremely low correlation with
ETc (R
2 = 0.044) (
Figure 12).
Sunshine duration (h), air temperature (°C), and net radiation (MJ/m
2) are significantly correlated at the
p < 0.05 level, indicating that an increase in net radiation leads to more solar energy being received at the surface and transferred to the air through conduction and convection processes, thereby raising temperatures, which is consistent with the expectation that longer sunshine duration is generally accompanied by higher temperatures [
65].
For non-meteorological factors, NDVI, chlorophyll content, canopy temperature, and leaf water content show low correlations with
ETc (R
2 = 0.2548, 0.2254, 0.2928, and 0.1126, respectively) (
Figure 13), suggesting that non-meteorological factors have limited direct influence on citrus
ETc. Among these, leaf water content differs somewhat from the conclusions of the S-I model, which may be due to multiple factors: measurement errors in leaf water content, and physiological differences in leaves at different growth stages, which could affect the relationship between leaf water content and evapotranspiration. To avoid large discrepancies in
ETc correlations caused by relying on a single model, model fusion can reduce the correlation errors associated with individual models, providing an important reference for precise prediction and management of citrus
ETc.
3.6. Model Parameter Optimization
To determine the weight coefficients α and β in the fusion model, this study performed parameter optimization across different citrus growth stages (young fruit stage, fruit expansion stage, and color-turning and sugar-accumulation stage). The specific steps are as follows:
Data Collection: UAV-based thermal infrared and multispectral remote sensing data were acquired, while meteorological variables such as air temperature and daily net radiation were simultaneously measured. This data collection formed the basis for model optimization, ensuring completeness and accuracy of the model inputs.
Model Estimation: Evapotranspiration (ETc1 and ETc2) was estimated separately using the thermal infrared S-I model and the multispectral single-crop coefficient model. These independent estimations provided the foundational data for subsequent parameter optimization.
Parameter Optimization: Using the least squares method, the estimated
ETc values from the two models were fitted to the sap flow measurements to optimize the weight coefficients
α and
β, identifying the optimal parameter combination. The optimization results are shown in
Table 5.
Table 5 shows that the optimized weight coefficient
β is generally higher than
α across growth stages, indicating that the multispectral single-crop coefficient model contributes more to the fusion model estimates. This dominance is likely because the multispectral data, such as NDVI, are more sensitive to changes in canopy coverage and vegetation growth, while the thermal infrared S-I model is more influenced by instantaneous canopy–air temperature differences, which can be affected by transient meteorological conditions and thus exhibit lower sensitivity during certain periods.
3.7. Fusion Model Validation
To verify the accuracy of the fusion model, this study compared the ETc estimated by the fusion model with the actual evapotranspiration measured by the sap flow system (ETc_actual) and analyzed the results across different citrus growth stages (young fruit stage, fruit expansion stage, and color-turning and sugar-accumulation stage). A total of 1 observation day was available, among which approximately 70% were used for calibration of the S-I model parameters and 30% were reserved for validation. Within the validation subset, a 70/30 split was further applied for training and testing the fusion model. However, as each phenological stage contained only about four valid observation dates, the conclusions drawn at the stage level should be interpreted with caution due to the limited sample size.
During the young fruit stage, citrus is in the early growth phase, with relatively low vegetation coverage and weak transpiration, while soil evaporation accounts for a larger proportion of total evapotranspiration. In the fruit expansion stage, the citrus canopy gradually enlarges, vegetation transpiration strengthens, and evapotranspiration reaches its annual peak. In the color-turning and sugar-accumulation stage, citrus leaves gradually turn yellow or fall off, fruits mature, and evapotranspiration decreases.
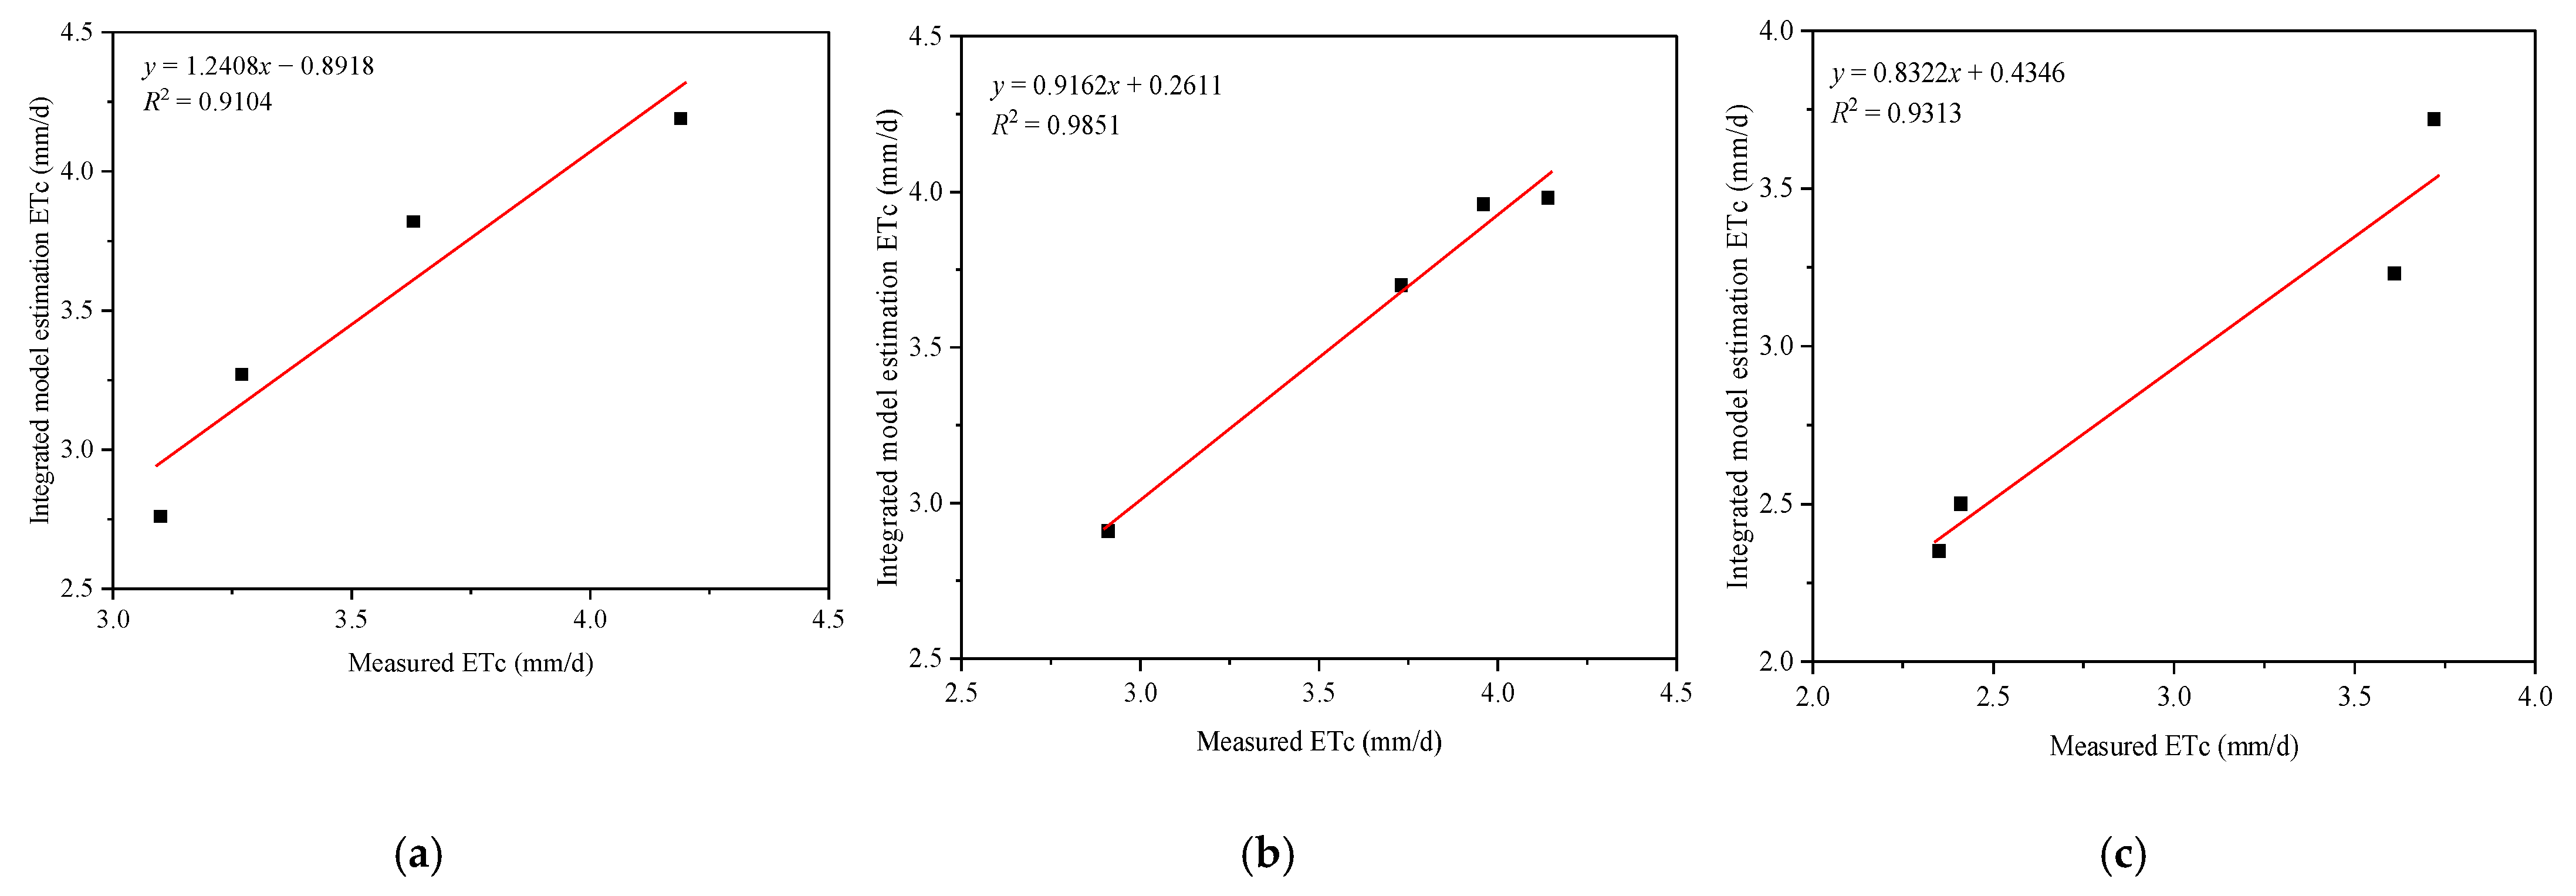
The validation results are as follows. As shown in
Figure 14a, during the young fruit stage, the fusion model’s estimates and measured values were largely consistent, with small errors. The mean absolute error (MAE) was 0.1325 mm/d, and the coefficient of determination (R
2) was 0.9104, indicating high estimation accuracy of the fusion model in this stage. The root mean square error (RMSE) was 0.1947 mm/d, further confirming the precise retrieval capability of the fusion model, demonstrating that it can accurately reflect citrus evapotranspiration changes during the young fruit stage.
As shown in
Figure 14b, during the fruit expansion stage, the fusion model’s estimates closely matched the measured values, with minimal errors. The MAE was 0.0475 mm/d, and R
2 reached 0.9851, indicating extremely high estimation accuracy. The RMSE was 0.0814 mm/d, further validating the model’s precision, showing that the fusion model can very accurately reflect citrus evapotranspiration changes during this stage.
As shown in
Figure 14c, during the color-turning and sugar-accumulation stage, the fusion model’s estimates were generally consistent with measured values, though errors were slightly higher than in the fruit expansion stage. The MAE was 0.1175 mm/d, and R
2 was 0.9313, indicating that the model’s estimation accuracy remained high. The RMSE was 0.1953 mm/d, showing that the fusion model provides reliable estimates in this stage and can reasonably capture changes in citrus evapotranspiration. Although the R
2 values are consistently high (above 0.91), the limited number of validation days (13–14) means that these results should be interpreted with caution, as they may overstate the model’s accuracy. Nonetheless, the consistency of the fusion model estimates with sap flow measurements across different growth stages, combined with error metrics (MAE and RMSE) at reasonable levels, suggests that the model is not simply overfitting but does capture the physiological processes of citrus evapotranspiration.
3.8. Model Accuracy Analysis
As shown in
Table 6, the S-I model has a coefficient of determination (R
2) of 0.8775, indicating that the model can reasonably fit the actual evapotranspiration. Its root mean square error (RMSE) is 0.6708 mm/d, and the mean absolute error (MAE) is 0.5589 mm/d. These relatively high error values suggest that, although the overall fit of the model is good, there are still certain deviations in the predictions, and the prediction accuracy needs further improvement.
The single-crop coefficient model has an R2 of 0.8103, slightly lower than that of the S-I model, indicating a relatively weaker fit to the evapotranspiration data. Its RMSE is 0.4306 mm/d, and its MAE is 0.3867 mm/d, both lower than those of the S-I model. This indicates that the single-crop coefficient model has an advantage in prediction accuracy and can more precisely estimate the target values.
The fusion model was analyzed according to different growth stages. During the young fruit stage, the fusion model achieved an R2 of 0.9104, showing strong fitting capability and a good reflection of evapotranspiration patterns at this stage. Its RMSE was only 0.1947 mm/d, and its MAE was as low as 0.0375 mm/d. The very low error metrics indicate high estimation accuracy, providing reliable scientific support for production management during the young fruit stage.
In the fruit expansion stage, the fusion model reached an R2 of 0.9851, indicating extremely precise evapotranspiration estimation. The RMSE was 0.0814 mm/d, and the MAE was 0.0475 mm/d, the lowest among all models, demonstrating that the fusion model can predict evapotranspiration in this stage with minimal error, offering critical guidance for precise management during fruit expansion.
During the color-turning and sugar-accumulation stage, the fusion model had an R2 of 0.9313, reflecting a high fitting performance. Its RMSE was 0.1952 mm/d, and its MAE was 0.0725 mm/d. Although slightly higher than in the young fruit and fruit expansion stages, the overall estimation accuracy remains high, indicating that the fusion model can reliably predict evapotranspiration and provide practical guidance for production decisions at this stage.
Overall, while the single-crop coefficient model has certain advantages in prediction accuracy, its overall fit is relatively weak. The S-I model fits the data well but shows lower prediction precision. The fusion model demonstrates high accuracy across all growth stages, particularly during the fruit expansion stage, where both fitting performance and predictive precision reach their peak, clearly outperforming both the S-I and single-crop coefficient models. By effectively integrating the strengths of thermal infrared and multispectral remote sensing, the fusion model enhances the precision and reliability of citrus evapotranspiration estimation and provides a novel approach for high-accuracy estimation of farmland evapotranspiration. In practical applications, models can be selected according to specific growth stages and requirements to optimize data prediction and production management decisions, fully leveraging the strengths of each model and improving the scientific and precise management of agricultural production.
