Article

Satellite-Derived Multi-Temporal Palm Trees and Urban Cover Changes to Understand Drivers of Changes in Agroecosystem in Al-Ahsa Oasis Using a Spectral Mixture Analysis (SMA) Model

by
Abdelrahim Salih
1,*,
Abdalhaleem Hassaballa
2 and
Abbas E. Rahma
2
1
Department of Geography, College of Arts, King Faisal University, P.O. Box 400, Al-Ahsa 31982, Saudi Arabia
2
Department of Environment & Natural Agricultural Resources, College of Agricultural and Food Sciences, King Faisal University, P.O. Box 400, Al-Ahsa 31982, Saudi Arabia
*
Author to whom correspondence should be addressed.
Agriculture 2025, 15(19), 2043; https://doi.org/10.3390/agriculture15192043
Submission received: 26 August 2025 / Revised: 26 September 2025 / Accepted: 28 September 2025 / Published: 29 September 2025
(This article belongs to the Section Artificial Intelligence and Digital Agriculture)

Abstract

Palm trees, referred to here as vegetation cover (VC), provide essential ecosystem services in an arid Oasis. However, because of socioeconomic transformation, the rapid urban expansion of major cities and villages at the expense of agricultural lands of the Al-Ahsa Oasis, Saudi Arabia, has placed enormous pressure on the palm-growing area and led to the loss of productive land. These challenges highlight the need for robust, integrative methods to assess their impact on the agroecosystem. Here, we analyze spatiotemporal fluctuations in vegetation cover and its effect on the agroecosystem to determine the potential influencing factors. Data from Landsat satellites, including TM (Thematic mapper of Landsat 5), ETM+ (Enhanced Thematic mapper plus of Landsat 7), and OIL (Landsat 8) and Sentinel-2A imageries were used for analysis, while GeoEye-1 satellite images as well as socioeconomic data were applied for result validation. Principal Component Analysis (PCA) was applied to extract pure endmembers, facilitating Spectral Mixture Analysis (SMA) for mapping vegetation and urban fractions. The spatiotemporal change patterns were analyzed using time- and space-oriented detection algorithms. Results indicated that vegetation fraction patterns differed significantly; pixels with high fraction values declined significantly from 1990 to 2020. The mean vegetation fraction value varied from 0.79 to 0.37. This indicates that a reduction in palm trees was quickly occurring at a decreasing rate of −14.24%. Results also suggest that vegetation fractions decreased significantly between 1990 and 2020, and this decrease had the greatest effect on the agroecosystem situation of the Oasis. We assessed urban sprawl, and our results indicated substantial variability in average urban fractions: 0.208%, 0.247%, 0.699%, and 0.807% in 1990, 2000, 2010, and 2020, respectively. Overall, the data revealed an association between changes in palm tree fractions and urban ones, supporting strategic vegetation and/or agricultural management to enhance the agroecosystem in an arid Oasis.

1. Introduction

Fractional vegetation cover (FVC) is a critical parameter for assessing vegetation status and plays a central role in quantifying vegetation dynamics within Earth system models. At the global scale, FVC products have been widely developed; however, most are available only at coarse spatial resolutions, limiting their ability to capture fine-scale patterns essential for detailed regional and local analyses of vegetation distribution and agroecosystem assessment. To address this, a variety of approaches have been employed to estimate FVC at finer resolutions, including empirical methods, pixel decomposition models, and physically based techniques.
Vegetation, especially date palm trees, in arid/semi-arid Oases is a fundamental surface cover in modeling local climate, weather, carbon dioxide, energy exchange, conserving soil and water, and evaluating agroecosystem changes, etc. [1,2,3,4]. Fractional vegetation cover (FVC) is one of the important parameters for describing surface vegetation, which plays a critical role in the study of regional and local ecosystems and/or agroecosystems. Research on the VC of arid Oases has provided important insights into their changes and the consequences of these changes on the environment in general. One key goal of vegetation research, especially in arid Oases, has been to identify the factors that drive its changes [5]. As a result, numerous researchers have recently prioritized the accurate mapping of FVC and their changes in arid Oases from different remotely sensed images and techniques. However, understanding how these processes alter the Oases agroecosystem in the arid and semiarid regions remains a major task [4,6,7].
Across the Al-Ahsa Oasis in eastern Saudi Arabia, the vegetation cover (VC)—dominated by date palms—forms a vital environmental asset, sustaining agroecosystems, supporting biodiversity, and providing essential livelihood and economic benefits for the local community. However, the Oasis is increasingly vulnerable to various environmental problems, particularly soil salinity, urban sprawl, and sand encroachment. The Al-Ahsa Oasis, recognized as one of the most ancient date palms (Phoenix dactylifera L.) Oases worldwide, has long been distinguished by its extensive palm plantations that provide a sustainable source of income for residents. However, several environmental drivers increasingly threaten this green cover. Urban sprawl, in particular, has emerged as a critical concern with adverse effects on sustainable agriculture [8,9,10]. Alongside anthropogenic pressures such as urban development, natural challenges, including desertification [11] and soil salinity, have also posed significant risks to the agroecosystem resources, especially the date palm plantations. Therefore, understanding how all these issues affect the vegetation of the Oasis and how these factors alter the agroecosystem is essential. Amid rapid urbanization and population growth, vegetation, particularly date palm plantations, plays a crucial role in sustaining balanced, long-term revenues for both the government and local farmers in the Al-Ahsa Oasis groves. However, little data on the effect of changing VC on the agroecosystem of this oasis exist, e.g., [5,9]. In contrast, extensive work was carried out to determine the impacts of land use/cover (LULC) and other factors on VC variation, e.g., [5,6,7,12]. For example, the exploitation of palm plantations as recreational areas has transformed such a sensitive agricultural area into an urban one [5]. Furthermore, in 2017, accelerated urbanization led to the loss of approximately 1270 ha of the Oasis’s vegetation cover (VC); additionally, nearly 10 km2 of VC, predominantly date palm plantations, was converted into bare land [9]. Subsequent investigations reported a direct link between the decline in VC and increasing soil salinity within the Oasis [12,13]. Using NDVI and the Soil Salinity Index (SI), it was further shown that soil salinity contributed to 6.31% of the VC reduction in Al-Ahsa Oasis between 1985 and 2013, highlighting the continued shrinkage of vegetation [13]. Another study, which used NDVI’s spatial patterns pertaining to irrigation practices and soil salinity mitigation, has found that variability in date palm plantations, based on NDVI values, was associated with variability in date palm tree growth, including its size, age, density, fertility of soil, and level of salinity [7]. In another study, settlement expansion has reduced the VC of the Oasis by 18% throughout the period from 1992 to 2022 [14]. These investigations together indicate that the VC of the Oasis is diminishing because of several elements, for example, soil salinity, as well as urban development.
Although soil salinity and sand encroachment affect VC in the Oasis, little is known about how changes in VC and urban features growth (Figure S1) impact agroecosystems of the oasis. The extent to which changes in the VC (e.g., palm trees (top layer) and seasonal cropland) and urban features growth alter the agroecosystems in this Oasis remains poorly understood. However, despite the fact that many anthropogenic activities, such as urban sprawl, have had a harmful impact on the VC in the Oasis, leading to fragmented natural spaces and reduced ecological resilience, most recent studies managed to assess the changes in the VC only, and limited studies have attempted to link VC change due to urban sprawl to agroecosystems change, especially in date palm planation, over an area, such as the Al-Ahsa Oasis. Hence, the main objective of this study was to investigate the relative effect of urban sprawl on vegetation cover dynamics and then on agroecosystems. This was intended to be achieved by utilizing the SMA model as a comprehensive tool to improve the accuracy of vegetation extraction from medium satellite imagery in order to meet the challenge of the mixed pixel problem and guarantee the high accuracy of VC and agroecosystems assessment. Hence, the work investigates the short- and long-term effects of VC changes on the agroecosystems of the Al-Ahsa Oasis. Specifically, we aimed to perform the following: (1) monitor changes in palm trees cover and urban sprawl during defined time frame; (2) assess the impact of urban sprawl on the Oasis’s palm trees and agroecosystems, and based on results obtained, potential driving forces of vegetation dynamics were discussed, as possible key processes controlling land cover alteration; (3) evaluate the recovery trajectory of VC the following years.
This work contributes to more informed perspectives on both present status and future possibilities of VC and better management, as well as conservation of vegetation in land conservation-prone areas. The results can guide policymakers and environmental planners to develop strategies to enhance VC management and inform broader agroecosystems protection initiatives.
The results from this study will provide critical insights into how the current status of the Oasis agroecosystem is related to VC change and land conversion, especially to urban. In addition, it will offer valuable data on the resilience of such an ecosystem and help refine models for predicting land conversion impacts on VC and agroecosystems in arid Oases in general.

2. Study Area and Materials

2.1. Study Area

This study was conducted in the Al-Ahsa Oasis, located in Saudi Arabia’s Eastern Province (25°20′–25°32′ N, and 49°30′–49°45′ E) (Figure 1). This Oasis is 45 km inland from the Arabian Gulf coast and 320 km east of Riyadh, the capital city of the Kingdom. According to Salih et al. [15], it is one of the largest date palm Oases in the region and the world, covering an approximate area of 8000 ha.
From a topographical and climatic point of view, the area exhibits a typical semi-arid climate, receiving <46 mm of annual rainfall, with summer temperatures frequently reaching 40–45 °C, while the Winter happens to be extremely cool and relatively dry (2–15 °C). The area has mild topographic variation, with elevations ranging between 130 and 160 m MSL and a slight west–east inclination [6]. About 660,788 inhabitants [16] live in the Oasis, mainly in two major cities, namely Hofuf and Al-Mubarraz. Within these cities, the Oasis’s residents have established recreational dwellings situated beneath date palm canopies. This type of anthropogenic activity has resulted in a reduction of vegetation cover, mainly date palm trees, and turned the Oasis land cover into a complex feature.
With approximately 40 distinct date palm cultivars occupying 92% of its cultivated area, the Al-Ahsa Oasis represents one of Saudi Arabia’s primary agronomic resources (around 20,000 ha) in the Arabian Peninsula [7,17], where around more than 8000 ha are occupied by date palm trees [12]. Thus, the food production in the Oasis is one of its economic drivers, which includes various agro-products [8]. However, this productive Oasis has been facing an alteration of its crop lands, turning them into a cultural and natural heritage landscape, resulting in new surface land cover features, including agricultural recreational areas surrounding the date palm trees. These new features of the land cover, defined in terms of the urban expansion component, have developed during the development stage between 1973 and 1994, coinciding with the rapid population development of the region [10], and because of this, landscape fragmentation, the resources, and the entire livelihood system became under serious threat.

2.2. Landsat Data

In this study, images from Landsat satellite, including TM (Thematic Mapper of Landsat 5), ETM+ (Enhanced Thematic Mapper plus of Landsat 7), and OLI (Landsat 8), were used to estimate the fractional vegetation cover (FVC) of palm trees in the study area and assess its changes and the effects of these changes on the agroecosystem during the period from 1990 to 2020. The images were obtained through the USGS Earth Explorer open-access geospatial portal (https://earthexplorer.usgs.gov/, accessed on 12 February 2025), United States Geological Survey (USGS) for the years 1990, 2000, 2010, and 2020. To guarantee that the effects of the atmosphere were at a minimum level on the images, all the images were acquired cloud-cover free, dated back within June and August months, to reduce the impact of scene variations and illumination conditions; they were Level 1 products (Table 1).

2.3. Reference Data

Ground measurements are irreplaceable for validating the accuracy of the obtained results of FVC and the urban fraction estimation approach. However, these measurements are not accessible and obtainable due to several reasons, including the cost and availability of optimal field data instruments. Therefore, in this study, data from Sentinel-2A and GeoEye-1 were used as references in order to validate the accuracy of the FVC and urban fraction estimate results. More details about these two datasets are provided below.

2.3.1. Sentinel-2A

Sentinel-2A is a Copernicus Earth Observation Satellite that takes optical-only images at fine spatial resolution from 10 to 60 m above land as well as coastal waters (Table 1). In this study, two Sentinel-2A images were acquired with minimal cloud coverage from the Copernicus Open Access Hub (https://dataspace.copernicus.eu/; accessed on 15 February 2025) for the years 2015 and 2020. The 2020 image was obtained as a Level-2A product (bottom-of-atmosphere reflectance), requiring no additional preprocessing, while the 2015 image was downloaded as Level-1C, necessitating further atmospheric correction. A key advantage of Sentinel-2 data is its high spatial resolution (10–20 m), superior to Landsat’s 30 m resolution, making it particularly suitable for validating the accuracy of model outputs.

2.3.2. GeoEye-1

High spatial resolution image from the GeoEye-1 observatory (with 1 m spatial resolution), freely accessible for viewing via Google Earth Pro software’s work environment version 7.3.6 (https://www.google.com/earth/index.html; accessed on 1 August 2025), captured on 10 February 2024, was used along with Sentinel-2A imagers as intended referencing process to evaluate the accuracy of the FVC and urban fraction estimation results.
High-resolution Sentinel-2A (10–20 m) and GeoEye-1 (1 m) images were employed to digitize testing samples across different locations, where 140 validation points were randomly digitized. Using visual interpretation and surface feature identification, these sharp images enabled accurate delineation of land cover types and selection of representative samples. The Sentinel-2A imagery (2015 and 2020 acquisitions) provided consistent temporal coverage, while the GeoEye-1 image (10 February 2024, via Google Earth Pro v 7.3.6) offered finer spatial detail to support validation. Together, these datasets ensured reliable sampling and improved the robustness of the accuracy assessment.

2.4. Socioeconomic and Productivity of Palm Trees Data

In order to evaluate the vegetation changes and their effect on the agroecosystem in the Oasis livelihood system, population data, utilized as a key driver of urban expansion, and date palm yields data were obtained from the Saudi General Authority for Statistics and Alkhaldi et al., respectively [16,18]. These data were analyzed to quantify the relationship between population growth and the spatial expansion of urban areas within the Oasis ecosystem and to investigate the impact of this on date palm productivity

3. Methods

3.1. Image Preprocessing

Landsat images were geometrically corrected and re-projected to UTM Zone 39N (WGS 84) to ensure spatial consistency across acquisition dates. Radiometric and atmospheric corrections were performed in QGIS using the Semi-Automatic Classification Plugin (SCP) [19] and its Dark Object Subtraction (DOS) tool [20], converting digital numbers to surface reflectance (0–1). The Landsat 2010 scene was additionally gap-filled using ENVI v4.8 in order to remove all pixels affected by the original data gaps in the primary scan line corrector failure or SLC-off scene. Sentinel-2A Level-1C imagery (2015) was atmospherically corrected to Level-2A with Sen2Cor v2.11 in ESA SNAP v9.0 to obtain images with bottom-of-atmosphere reflectance instead of Top-of-Atmosphere (TOA) reflectance images. To support FVC validation, spectral bands of Landsat images were resampled from 20 m to 10 m, followed by image enhancement and linear histogram stretching. Finally, subsets covering the study area (Figure 1) were extracted, and false-color composites were generated (Landsat: 5–4–3; Sentinel-2A: 8–4–3).

3.2. Selection of Endmembers (Training Data)

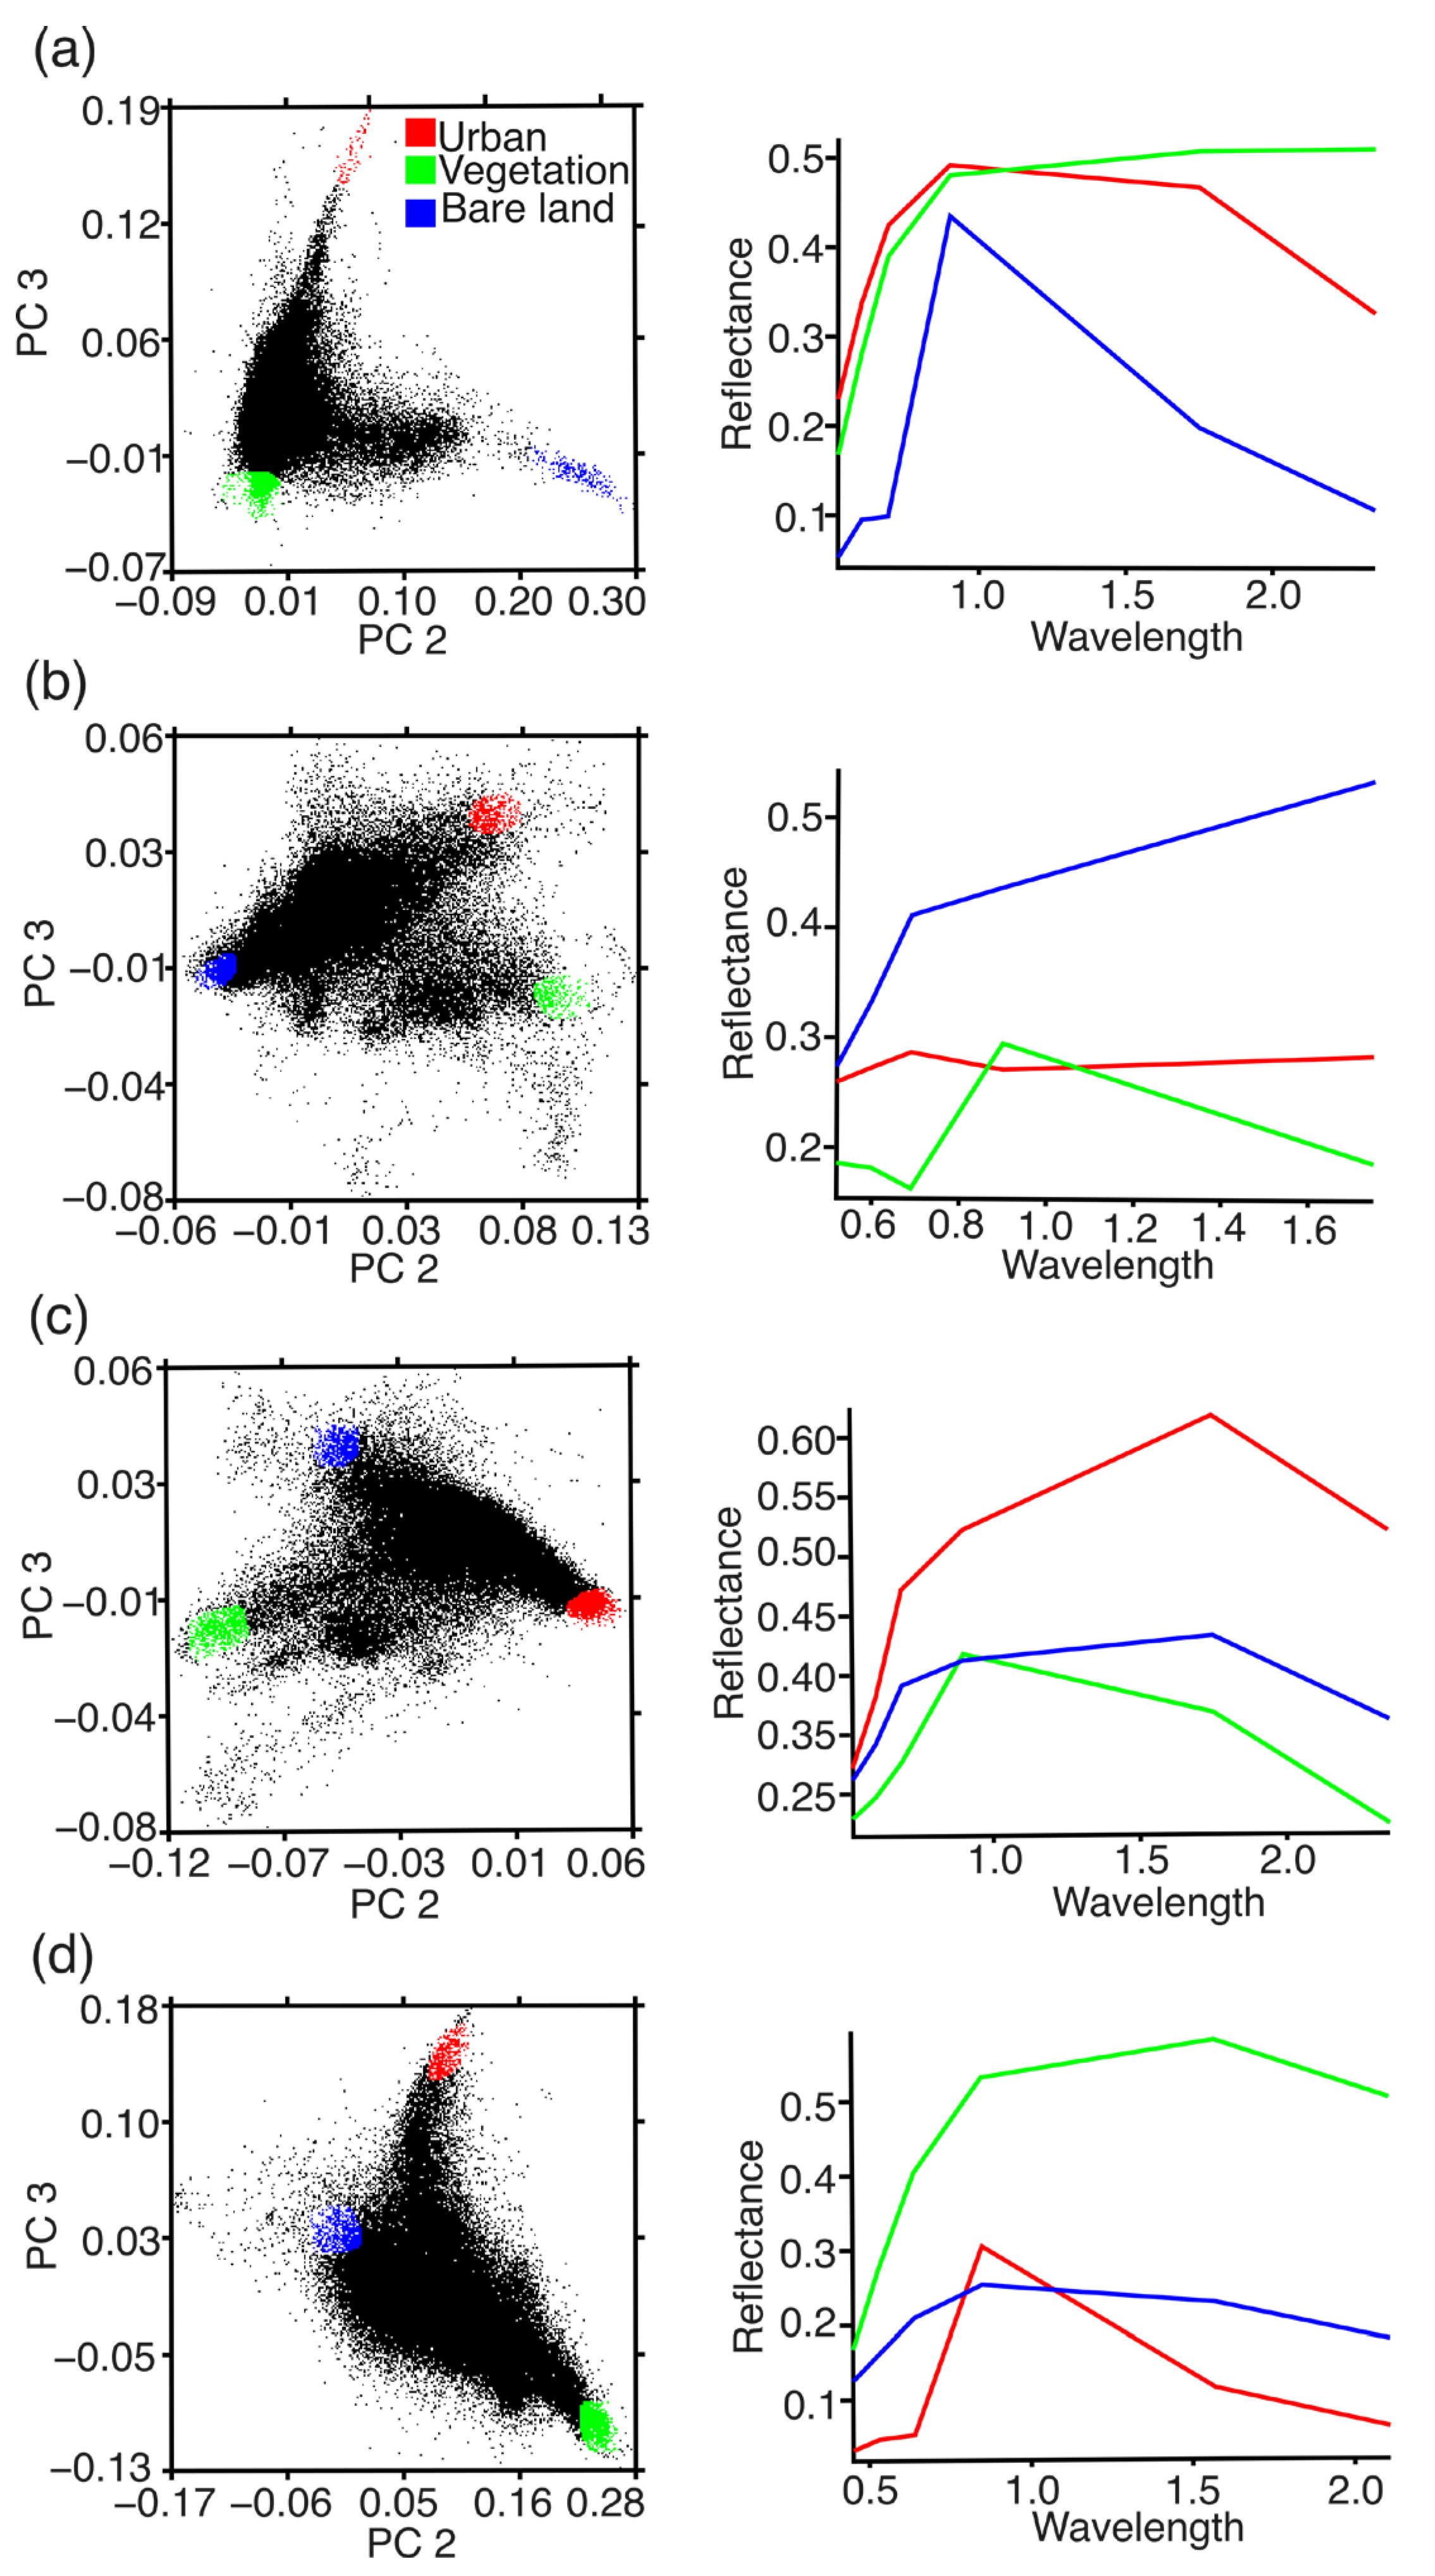
In remote sensing, a pure pixel in an Earth observation satellite image contains a reflectance signature of a single land cover type, known as an endmember fraction [8]. Here, to obtain endmembers’ spectra of three land cover components from all images, including barren lands and sand (BL), urban (UR), and vegetation (VC), the preprocessed images were first transformed into multiple surface components, applying the principal components analysis (PCA) technique of ENVI v 4.8 software in order to decrease the images’ dimensionality. Further transformation methods of image, such as minimum noise fraction (MNF), are also functional in this case [2]. Then, 1-3 orthogonal linear plots (scatter plots) were created from all images, utilizing the 1st, 2nd, and 3rd PC bands, where the vertex of the orthogonal plots was determined as pure endmember spectra (i.e., training data) after comparisons with the original images [21,22,23,24]. Thereafter, the extracted pure endmember spectra were used for generating the VC fractions, utilizing the SMA model of ENVI v 4.8 software, and constraining the sum of endmember fractions for each pixel to be one. A “sum to unity constraint” function was applied, as described below.

3.3. Building SMA Model for Mapping Oasis’s Palm Trees and Urban Fractions

A key limitation of medium-to-coarse resolution imagery (e.g., Landsat) is pixel spectral mixing, particularly pronounced in arid and semi-arid environments where heterogeneous surface features coexist within individual pixel. As an effective solution, the remote sensing community introduced the usage of the SMA model as a sophisticated image classification technique to map and assess land cover change [8,21,23,25]. Spectral Mixture Analysis (SMA) depicts image pixels as fractional spectra, decomposing them into a limited set of endmember spectra that represent distinct land cover components [25,26]. This technique is widely used in remote sensing to classify mixed land cover features, particularly in coarse-resolution satellite imagery, by unmixing pixel reflectance into fractional abundances. Therefore, it is a useful method to identify components that cover the Earth’s surface, especially in the arid/semi-arid areas such as vegetation, sand dunes/sheets, and urban features, which are always mixed with other objects that may reduce their mapping accuracy. The mathematical representation of the linear spectral mixture analysis (SMA) model is expressed in Equation (1) as follows:
R p λ = i = 1 n f i R i λ + ε λ
where R p ( λ ) represents the apparent surface reflectance of a pixel, f i is the weighting constant ( i = 1 n f i = 1 ), understood as a portion of the pixel made up of an endmember, i = 1 , 2 n R i ( λ ) represents the reflected spectrum of the endmember in an n-endmember model, and ε(λ) represents the variance among the real and exhibited reflectance [21].

3.4. Palm Trees Fractions Change Detection Analysis

To quantify and identify temporal and spatial changes or variation in vegetation fraction, three methods were followed: (a) The change in fraction layers or land cover components (image differencing technique), as identified by endmember fractions [27], in which a pixel-wise subtraction of fractional abundance images revealed distinct change patterns: unchanged pixels clustered around the distribution mean (Δ ≈ 0), while changed pixels exhibited bimodal distribution at both tails [13]. (b) The visual interpretation of vegetation fractions in different years [22,23], where qualitative changes among different dates were distinguished by constructing RGB color composites through showing endmember fractions of three different dates (e.g., 1990, 2000, and 2010) on blue, green, and red. In three-year color composite images, critical changes in fractions were highlighted by the most saturated colors, whereas less critical changes were depicted by less saturated colors, and no temporal changes in fractions cover were indicated by gray or white color, as previously described [27].
In this study, regarding the first approach, vegetation fraction difference images (∆VC) and urban fractions difference images (∆UR) were established for the three change periods, 1990–2000, 2000–2010, and 1990–2020, by subtracting fractional abundance values for each pixel between consecutive dates as follows:
Δ V G = V G t 1 V G t 2
The change results include positive values (change increase) and negative values (change decrease) in vegetation fractions and near zero values indicate no change in vegetation fractions among the two change dates, and (c) the dynamic degree model (SDD) was also used to analyze the annual rates of change of the endmember fractions (i.e., vegetation and urban) for certain defined periods, including 1990–2000, 2000–2010, 2010–2020, and then from 1990 to 2020. This model has been widely employed in land-use and land-cover (LULC) change analysis studies, e.g., [2,28], and it is computed as follows:
S D D =   A V t 2 A V t 1 A V t 1 × t 2 t 1 × 100
where AVt2 and AVt1 are the total area of vegetation and/or urban fractions for the beginning and the end years in the defined period, respectively.

3.5. Model Validation

To test the accuracy and validity of the SMA model, the RMS error (RMSE), NDVI, kappa coefficient, and overall accuracy were used as follows:
The accuracy of the applied model result, i.e., endmember fraction, was tested using an error image computed as follows:
R M S E =   1 n . i = 1 n ε i 2
where the model results can be considered accurate if fraction residuals or RMS errors have a low value, no value lower than 0, and/or larger than 1.
The endmember fractions estimation was validated based on Sentinel-2A data at Landsat resolution by aggregating the fractions at a coarser resolution of 30 m. After Sentinel-2A images were transformed into PC bands, the SMA model was applied on the transformed images, where 1-3 orthogonal linear plots (scatter plots) were created from years 2015 and 2020 images, utilizing the 1st, 2nd, and 3rd PC bands, where the vertex of the orthogonal plots were determined as pure endmembers spectra after comparing with the original images. Then, scatter plots were created to compare the fractions obtained from Landsat images with those obtained from Sentinel-2A images as reference data to validate their accuracy. The results obtained from Landsat images were considered accurate if the scatter plots had a linear trend, which suggests a high R2.
Model accuracy was assessed using overall accuracy and the kappa coefficient (KC) metrics. First, 140 validation points (70 from vegetated areas and 70 from non-vegetated surfaces, including urban, bare lands, and sand dunes) were randomly sampled. These points were georeferenced to match a high-resolution GeoEye-1 base map (accessed via Google Earth Pro; acquisition date: 10 February 2024) through careful superposition of endmember fractions. Subsequently, a confusion matrix was generated by comparing model outputs with the reference data. Finally, overall accuracy and kappa coefficient [18,29] were computed, with the KC calculated as follows [29]:
K C = n i = 1 r x i i i = 1 r x i + x i n 2 i = r r x i + x i
where r represents the total rows in the matrix, x_ii represents the total observations within row I and column i, x_(i+) and x_(i+) represent the marginal sums of row i and column i, respectively, and n2 represents the total number of observations.
Figure 2 is a flowchart that explains the overall methods followed in the study in order to measure the change in VC, besides its effect on the agroecosystem over the study area.

3.6. Key Drivers of Palm Trees Fraction Dynamics

This section examines the causal factors underlying VC decline and its agroecosystem impacts in the study area. Secondary datasets were included: (1) population statistics (1992–2016) from the General Authority for Statistics [16], and (2) urban fraction dynamics derived from our land cover analysis, utilizing the SMA model (in this research, urban fraction, was used to determine whether it was a major driver of palm tree fraction dynamics by assessing the detection of change between the vegetation fraction and urban fraction). Population trends were analyzed using RStudio v4.4.1, employing generalized additive models to characterize non-linear demographic changes.

4. Results

4.1. Endmember Spectra and the SMA Model

Based on 2D scatter plots (also called feature spaces), using the 1st three PCs (principal components) of the Landsat and Sentinel-2A (Figure 3), three pure endmembers for urban (UR), bare lands and/or sand (BL), and vegetation cover (VC) were visually identified and then manually digitized (Figure 3); however, only vegetation and urban covers were considered during analyses. We found that VC had strong reflectance in band 4 of Landsat images, indicating very weak reflectance spectra of VC in the other bands of the spectrum.

4.2. Palm Trees Fractions

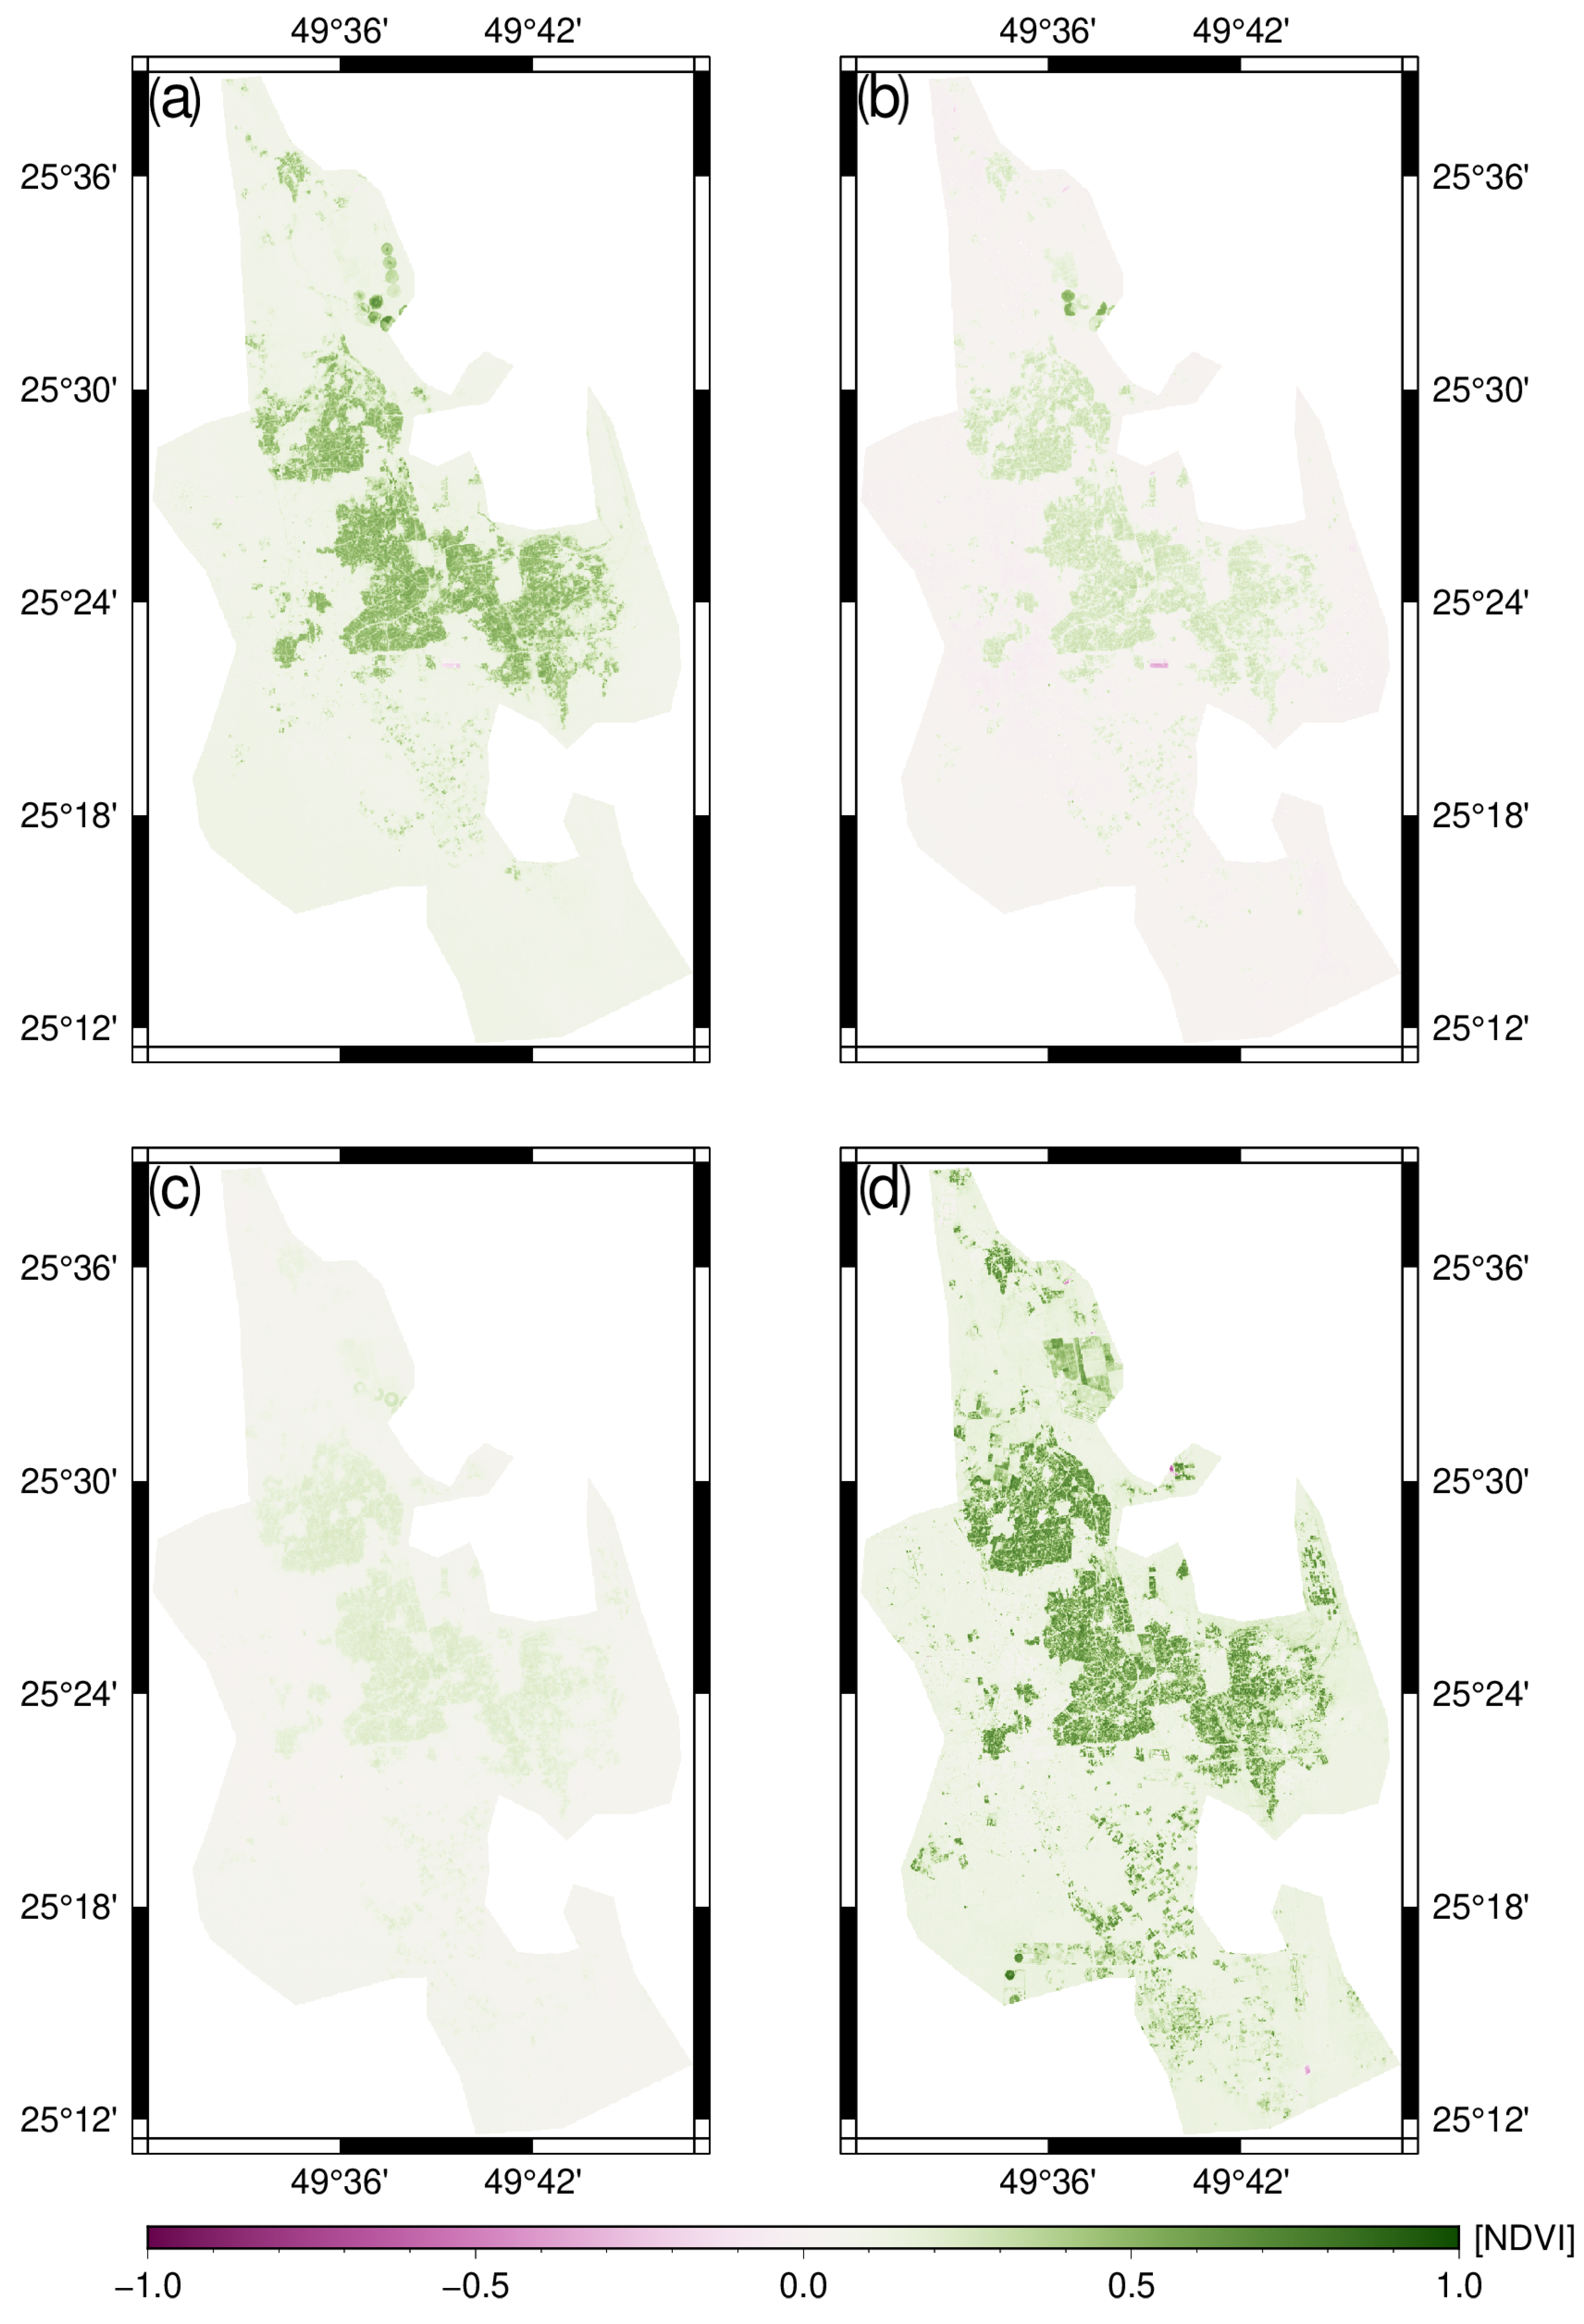
The spatial patterns of VC, using NDVI analysis, provided an overall picture of vegetation variation within the study area. The pattern of VC differed significantly in the study area throughout the identified period 1990–2020 (Figure 4). The visual interpretation of this figure explains that pixels with a high NDVI value had a substantial decline from 1990 to 2020 in the Oasis.
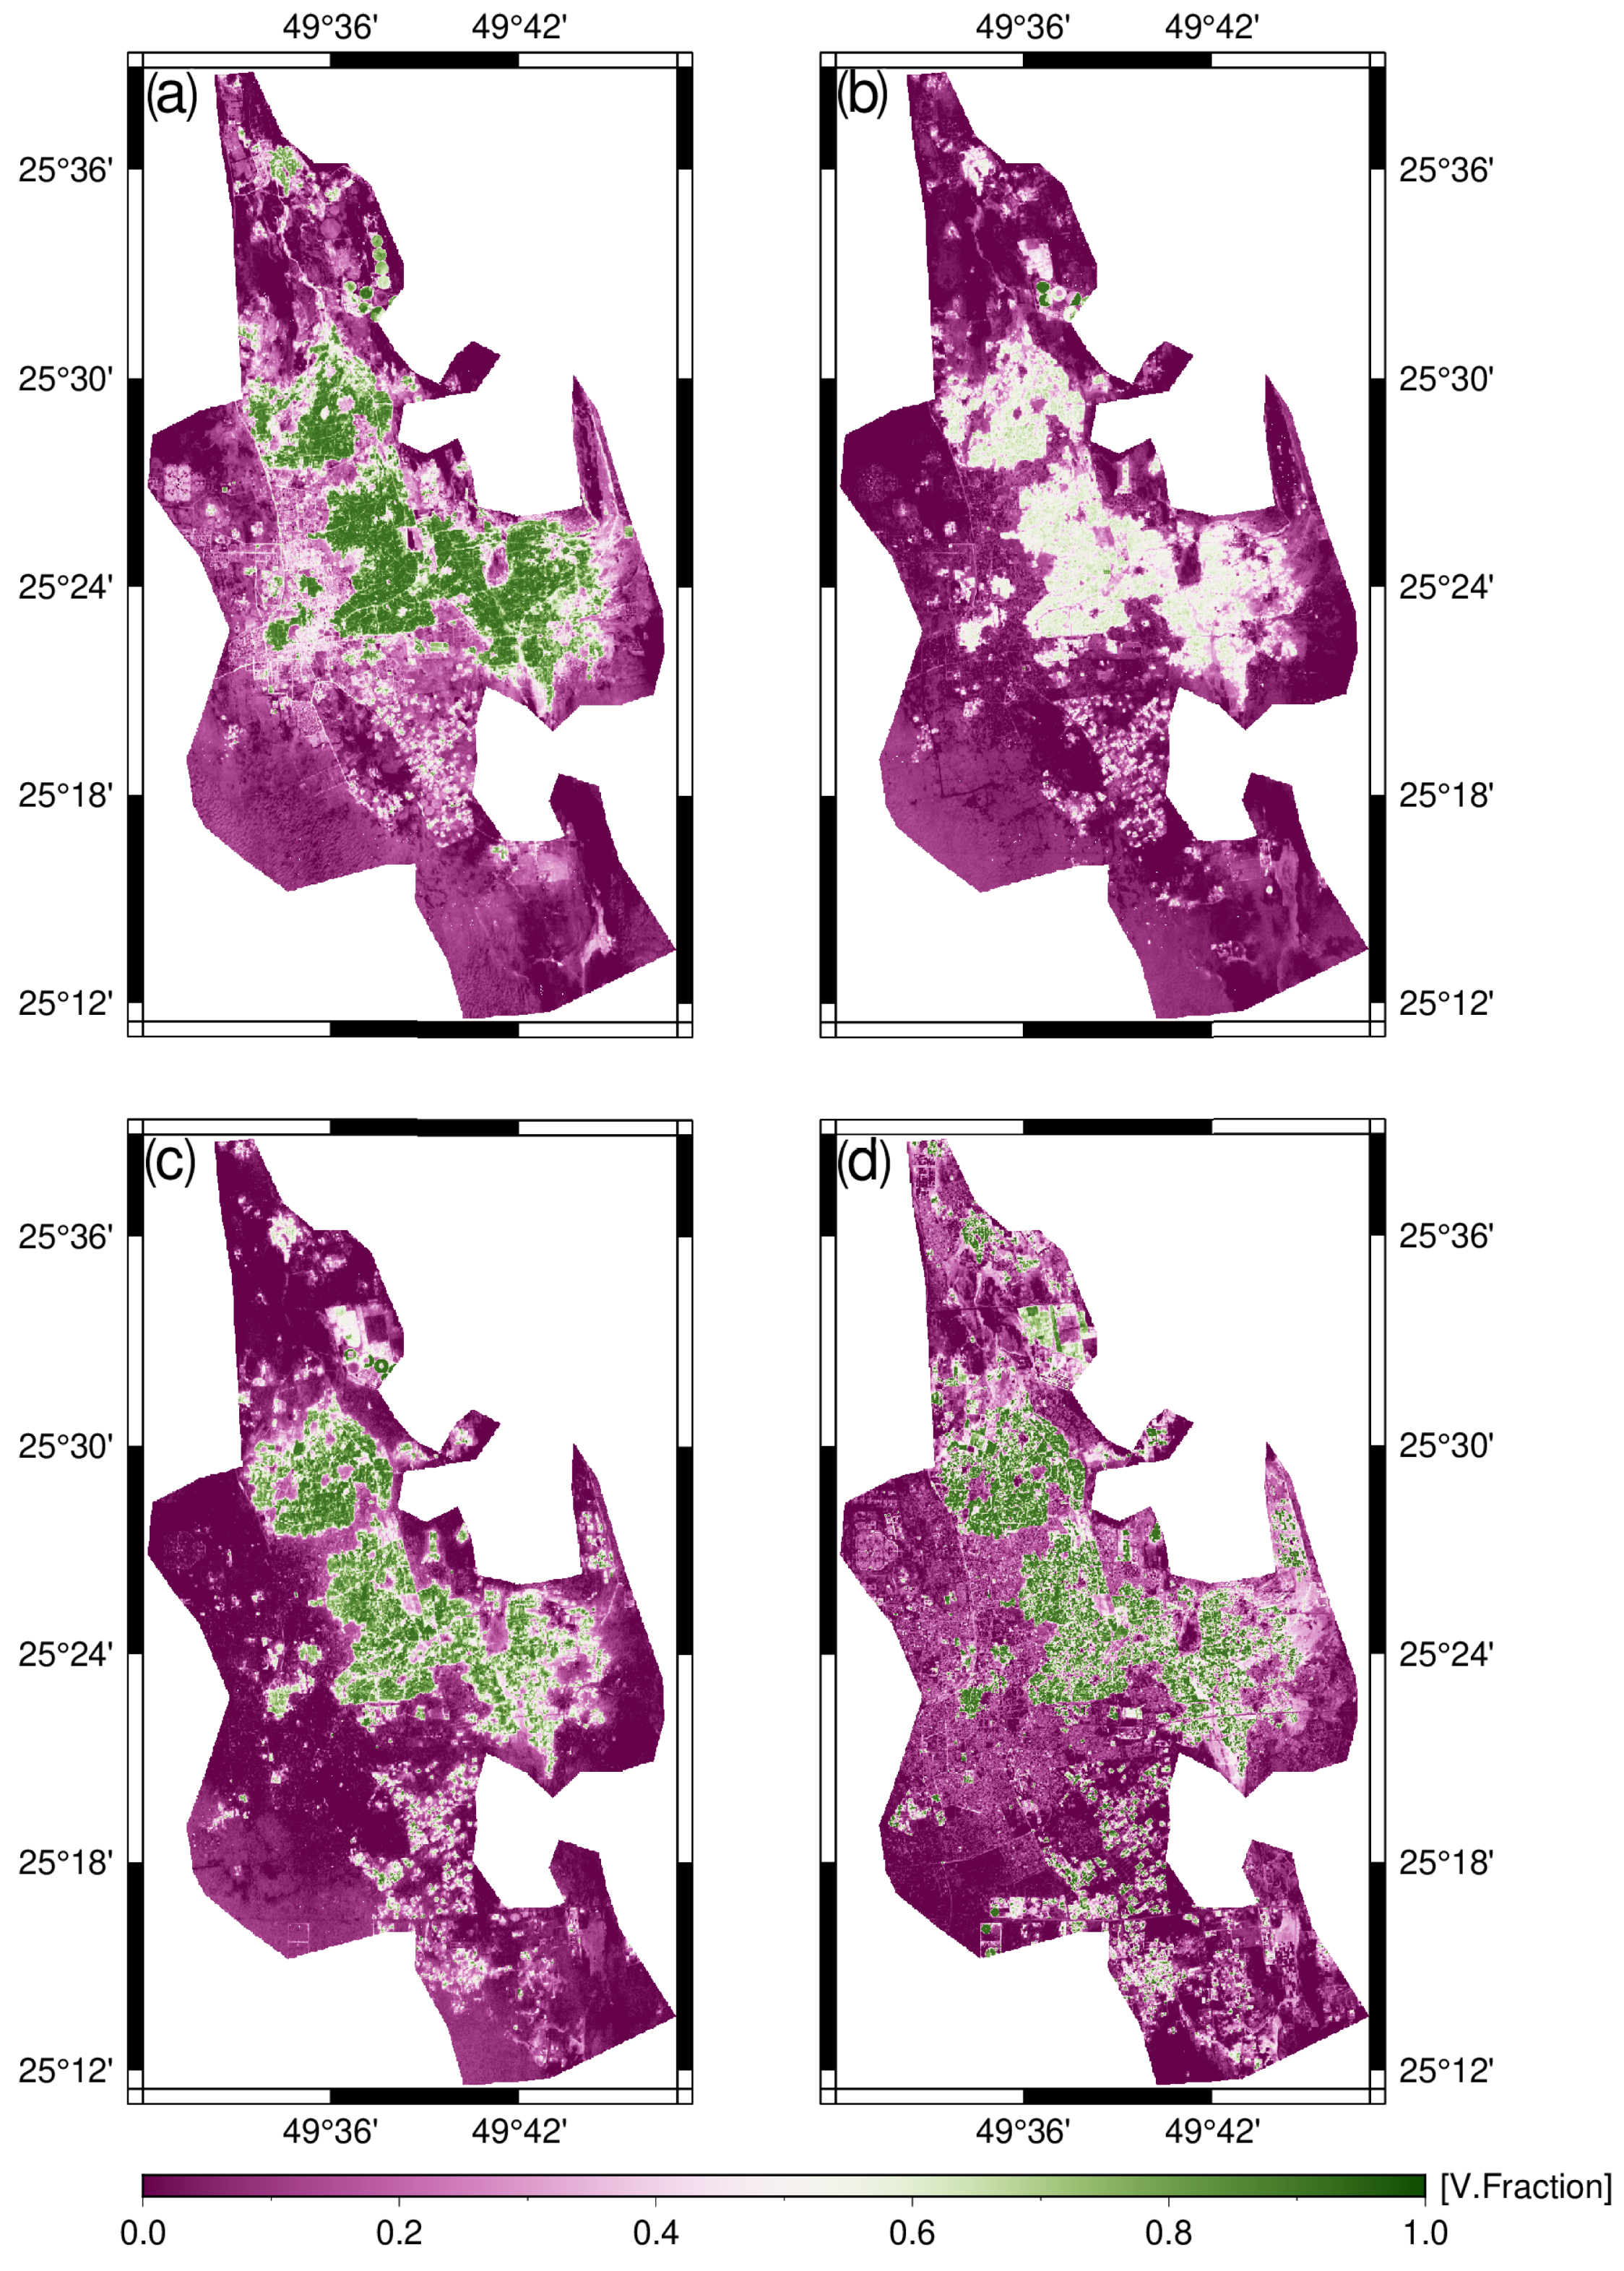
Figure 5 shows the final vegetation endmember fractions in the Oasis during the period from 1990 to 2020. The vegetation is signified by lighter pixels (which represent a high fraction), whereas other dark pixels represent “low fraction” of other surface cover entities such as urban, bare land, or sand dunes/sheets. During the period from 1990 to 2020, the vegetation fractions mean, supported with visual interpretation, varied from 0.797 to 0.366% (Figure 6a). In 1990, the vegetation fraction represented 0.797% of the total Oasis area; however, this proportion decreased to 0.740% in 2000, to 0.740% in 2010, to 0.609%, and to 0.366% in 2020 (Figure 6a). The decrease in vegetation fractions is primarily noticed in the north, central, and southern portions of the Oasis area. These results indicate that a reduction in VC happened instantly in the Oasis area at a decreasing amount (−14.24%) throughout the time from 1999 to 2020 (Table S1). The information given in Figure 6a suggested that vegetation fraction has decreased significantly between 1990 and 2020, and this decrease may have a potential effect on the agroecosystem of the area (more discussion about this point is provided in the Discussion section).

4.3. Comparisons and Change Detection of Palm Tree Fractions

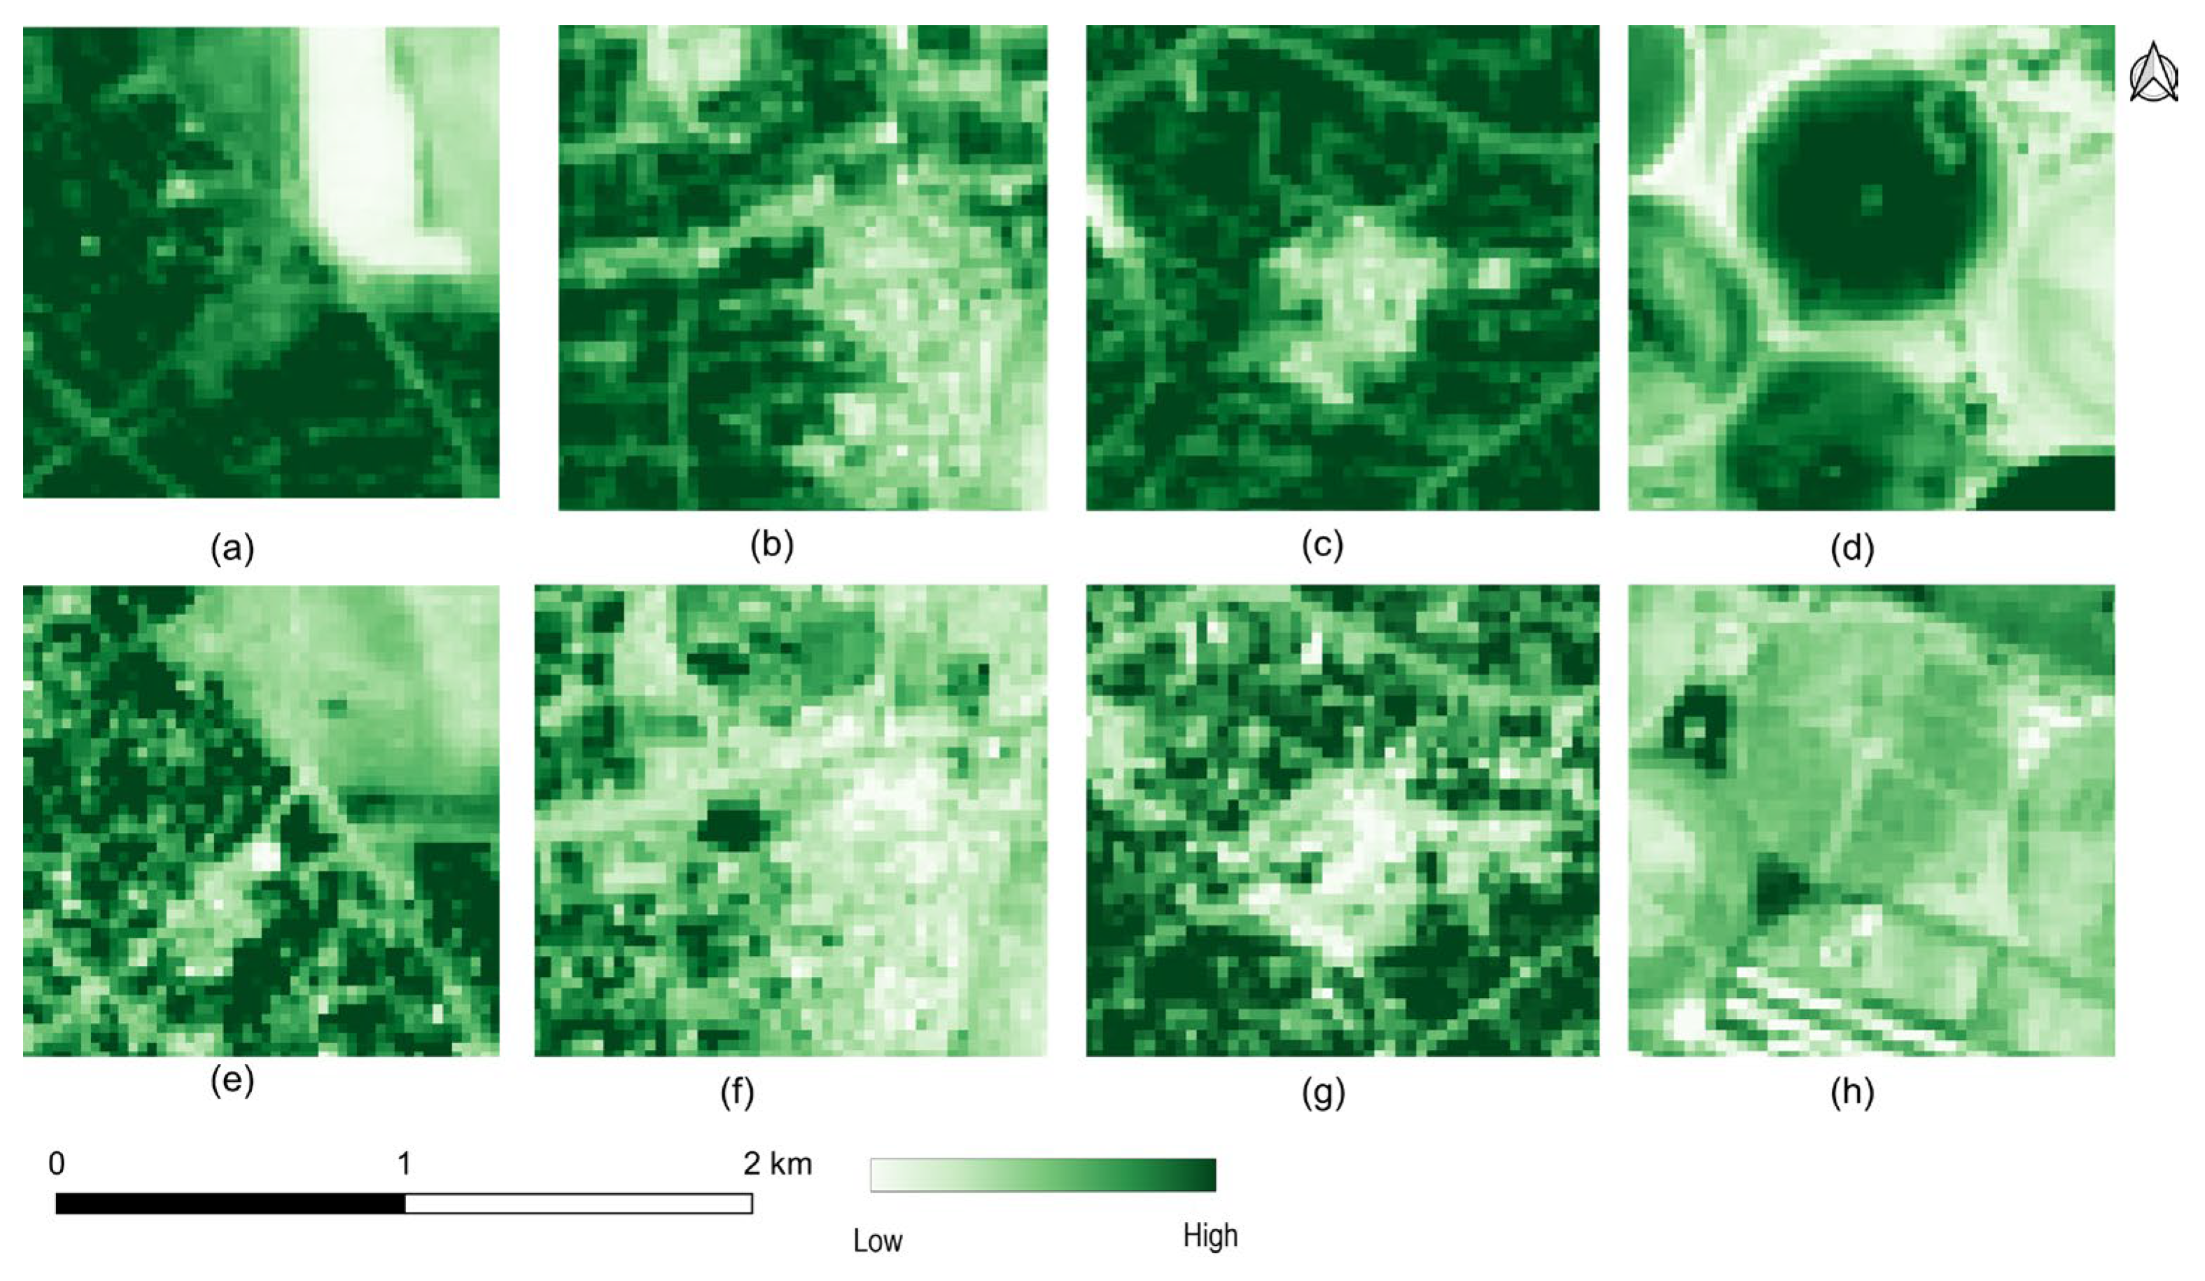
Comparison of vegetation fractions results is shown in Figure 7a–h for the change periods from 1990 to 2020. In images a–d, green pixels indicate vegetation fractions in 1990, while in e–h, brighter pixels represent the same locations in 2020, now devoid of vegetation—signifying a decline in vegetation cover. As illustrated in Figure 7a–h, vegetation loss in 2020 was most concentrated in the central and north portions of the Oasis. This reduction poses significant threats to the agroecosystem, as discussed in the upcoming section on driving forces.
As per the SDD results, the vegetation fractions of the Oasis decreased dramatically during the whole period from 1990 to 2020. For example, it has decreased by nearly a SDD of −4.62%, −9.66%, −14.77%, and by approximately −34.37%, between 1990 and 2000, 2000 and 2010, and 1990 and 2020, respectively. This suggests a noticeable annual decrease in vegetation cover.
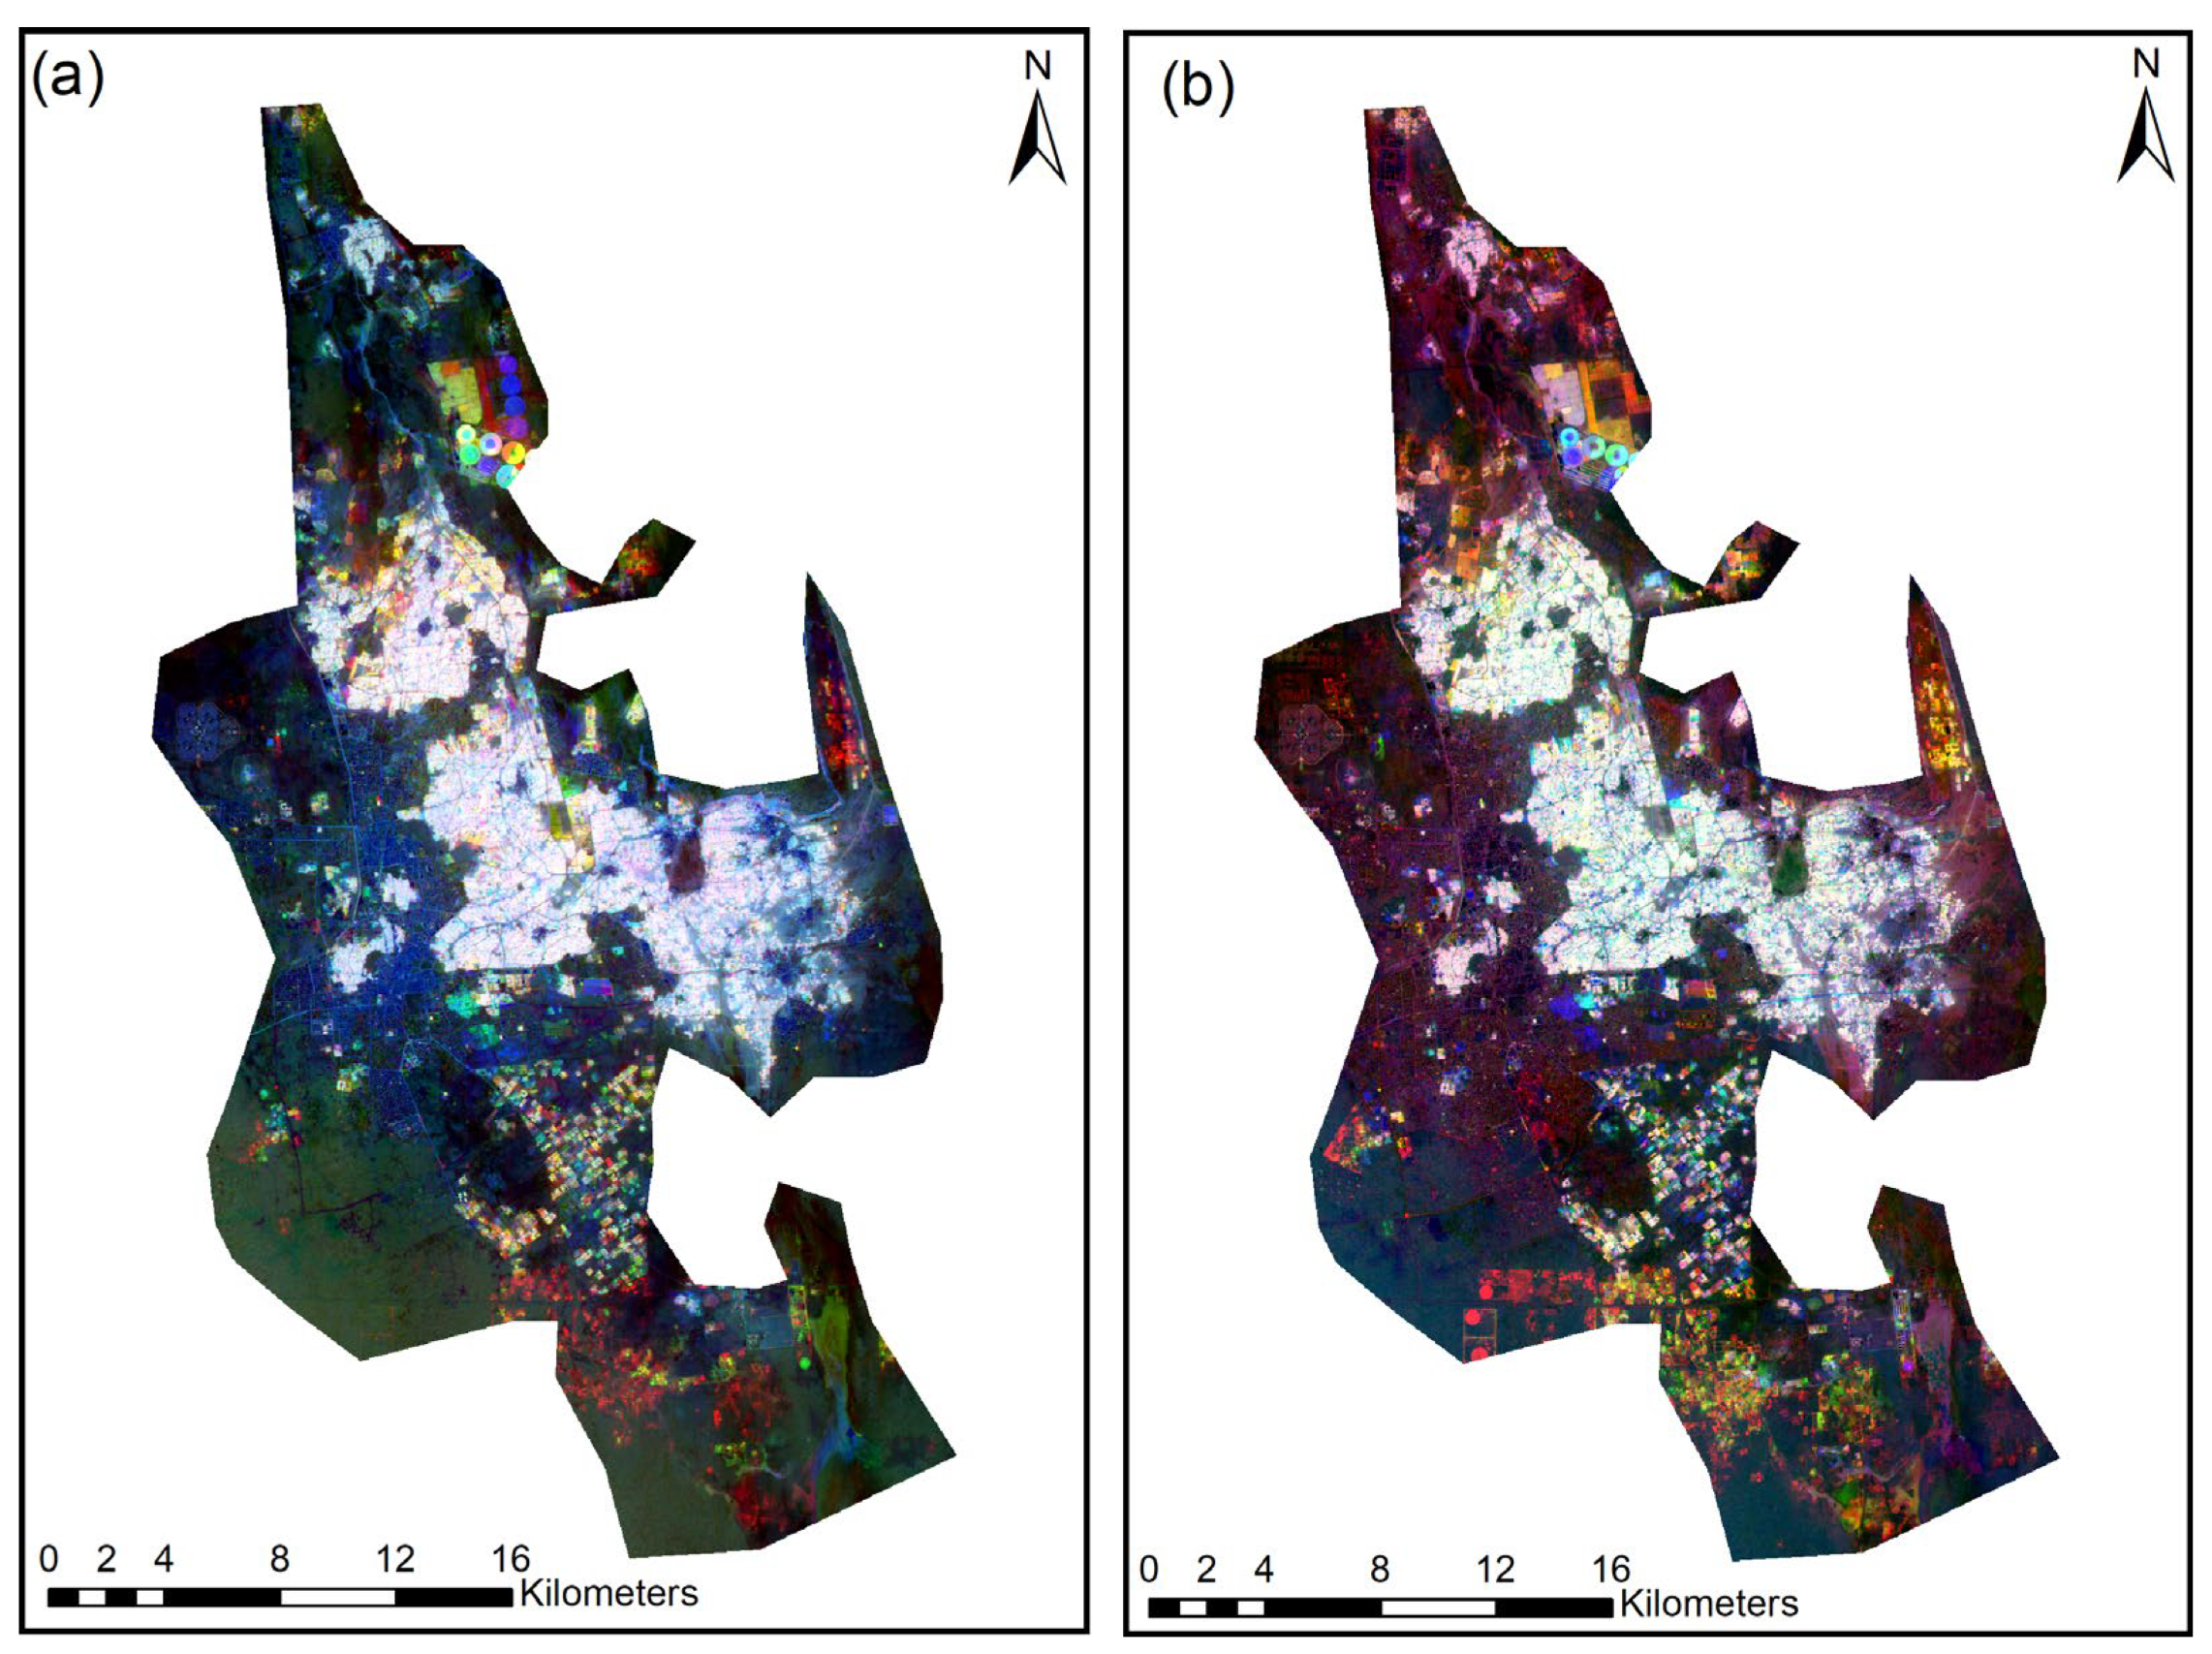
These spatiotemporal variations in vegetation fractions were visually confirmed by displaying vegetation fractions in each of the three periods as RGB additive color, where vegetation fraction mapped during 1990 was assigned as blue, during 2000 as green, and during 2010 as red (Figure 8a,b). It has been found that the major changes of vegetation occurred during the period of 1990 and 2000 to 2010 (areas characterized by the most saturated colors). For example, a reduction in vegetation fractions was observed in 2000 and 2010, indicated by saturated blue colors, especially in the northern part of the Oasis. However, although the reduction of vegetation fractions was prevailing in the Oasis, an increase in vegetation fractions, mostly new crop areas, in new locations during the years 2010 and 2020 was discovered, as indicated by saturated red color, especially in the southern parts of the Oasis.

4.4. SMA Model Performance

To validate the results obtained by applying the SMA model, three approaches were used, including SMA model residuals or RMS errors, product comparison, and overall accuracy and kappa coefficient. RMS errors of the SMA model fraction images (e.g., vegetation and urban fractions) during the study period have ranged from 0.035 to 0.051 (Table 2). A small “RMS” residual error indicates an extreme accuracy of the “SMA model” vegetation or built-up fraction extraction, particularly in the barren regions, as a slighter “RMS error” denotes “pure endmembers” and then precise fractions of the phenomenon under study. These small residual errors indicate that the SMA model has high performance when used to estimate land cover fractions, especially from satellite images with medium spatial resolution such as Landsat.
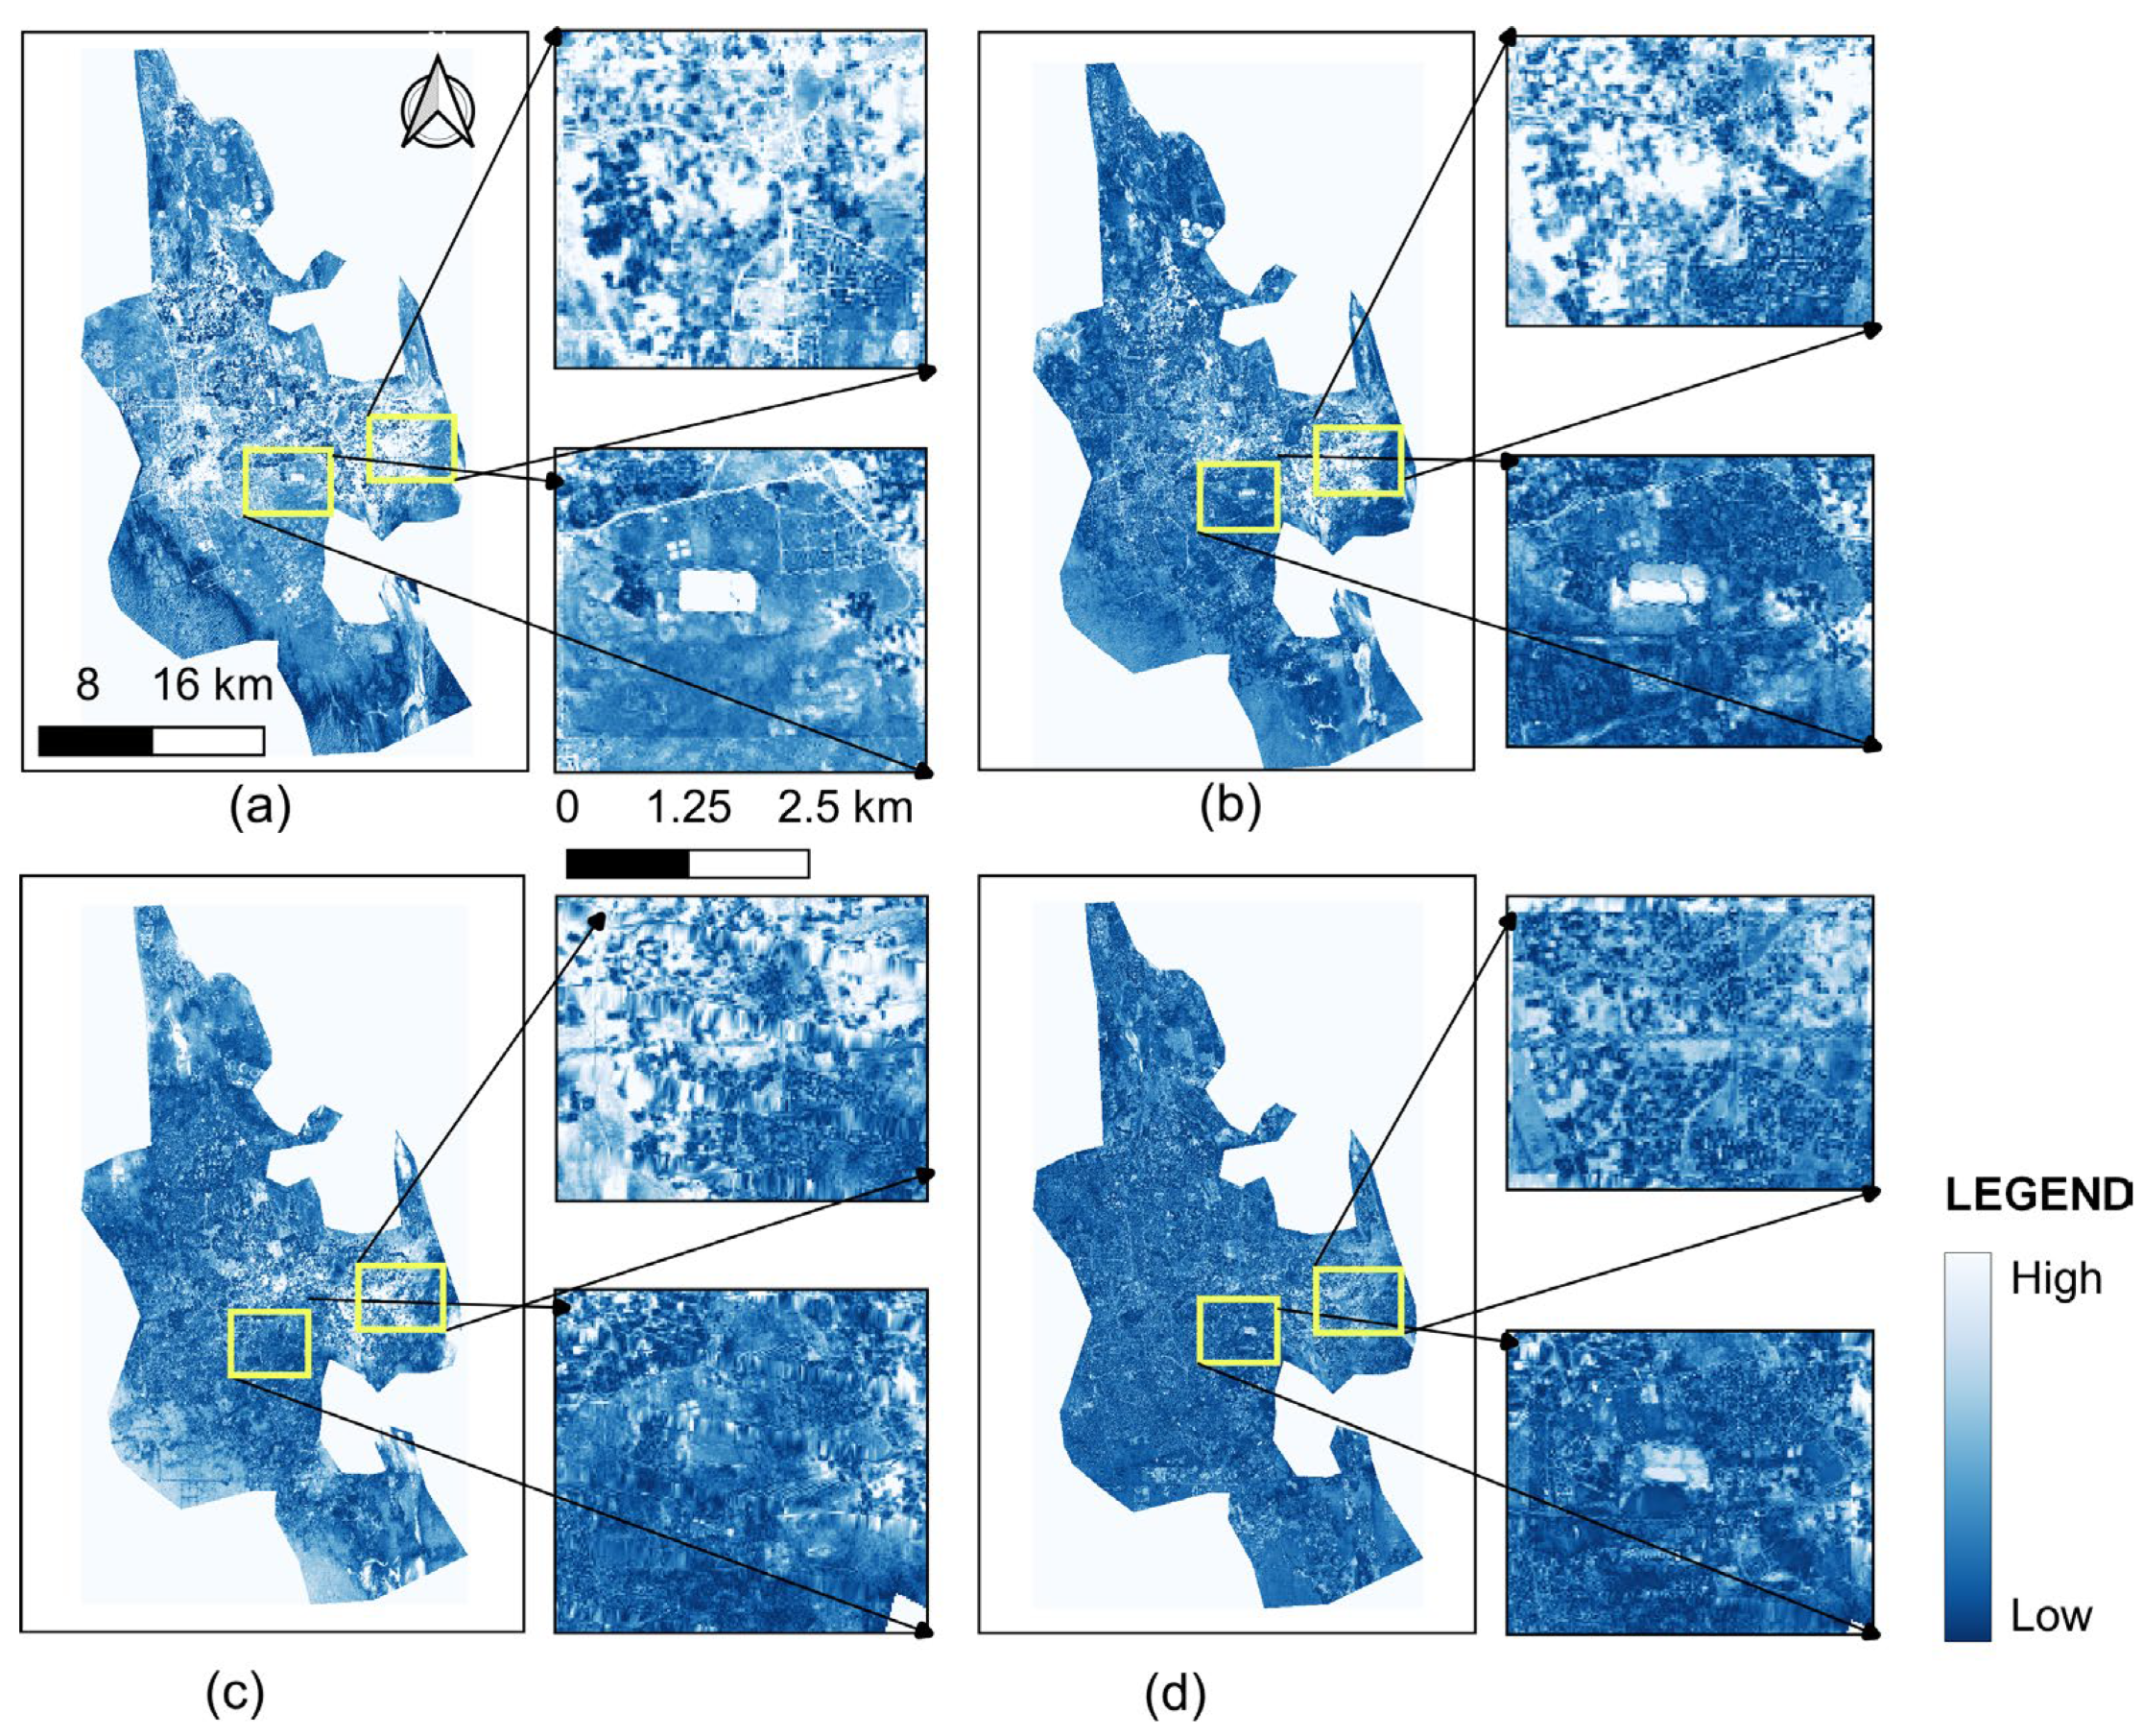
RMS high and low errors measurements of the SMA model (Figure 9 and Figure 10) revealed that the majority of residuals were found in areas covered with waterbodies and/or built-up structures enclosed by date palm trees, where the built-up fractions in these areas are categorized by high bright features, which have dissimilar spectral reflectance—different fractions. According to these results, it can be highlighted that in order to obtain land cover fractions, in this case vegetation and urban, with high accuracy using the SMA model, waterbody areas and bright cells should be screened out.
The overall accuracies of the SMA model used for evaluating and mapping vegetation and urban fractions varied significantly from 97.9% to 0.99% (Table 3). We found that errors related to the omission and commission metrics ranged from 97.3 to 100% for vegetation and from 97.22 to 100% for urban fractions (Table 3). This suggests a significant relationship between SMA model fractions, including vegetation and urban fractions, and the reference points. This process also demonstrates the benefit of the SMA model for such assessments, especially in arid and semiarid Oases which are characterized by uncertainly mixed features. In addition, the kappa coefficient has ranged between 0.86 and 0.94.

4.5. Driving Forces and Effects of Palm Trees Cover Change

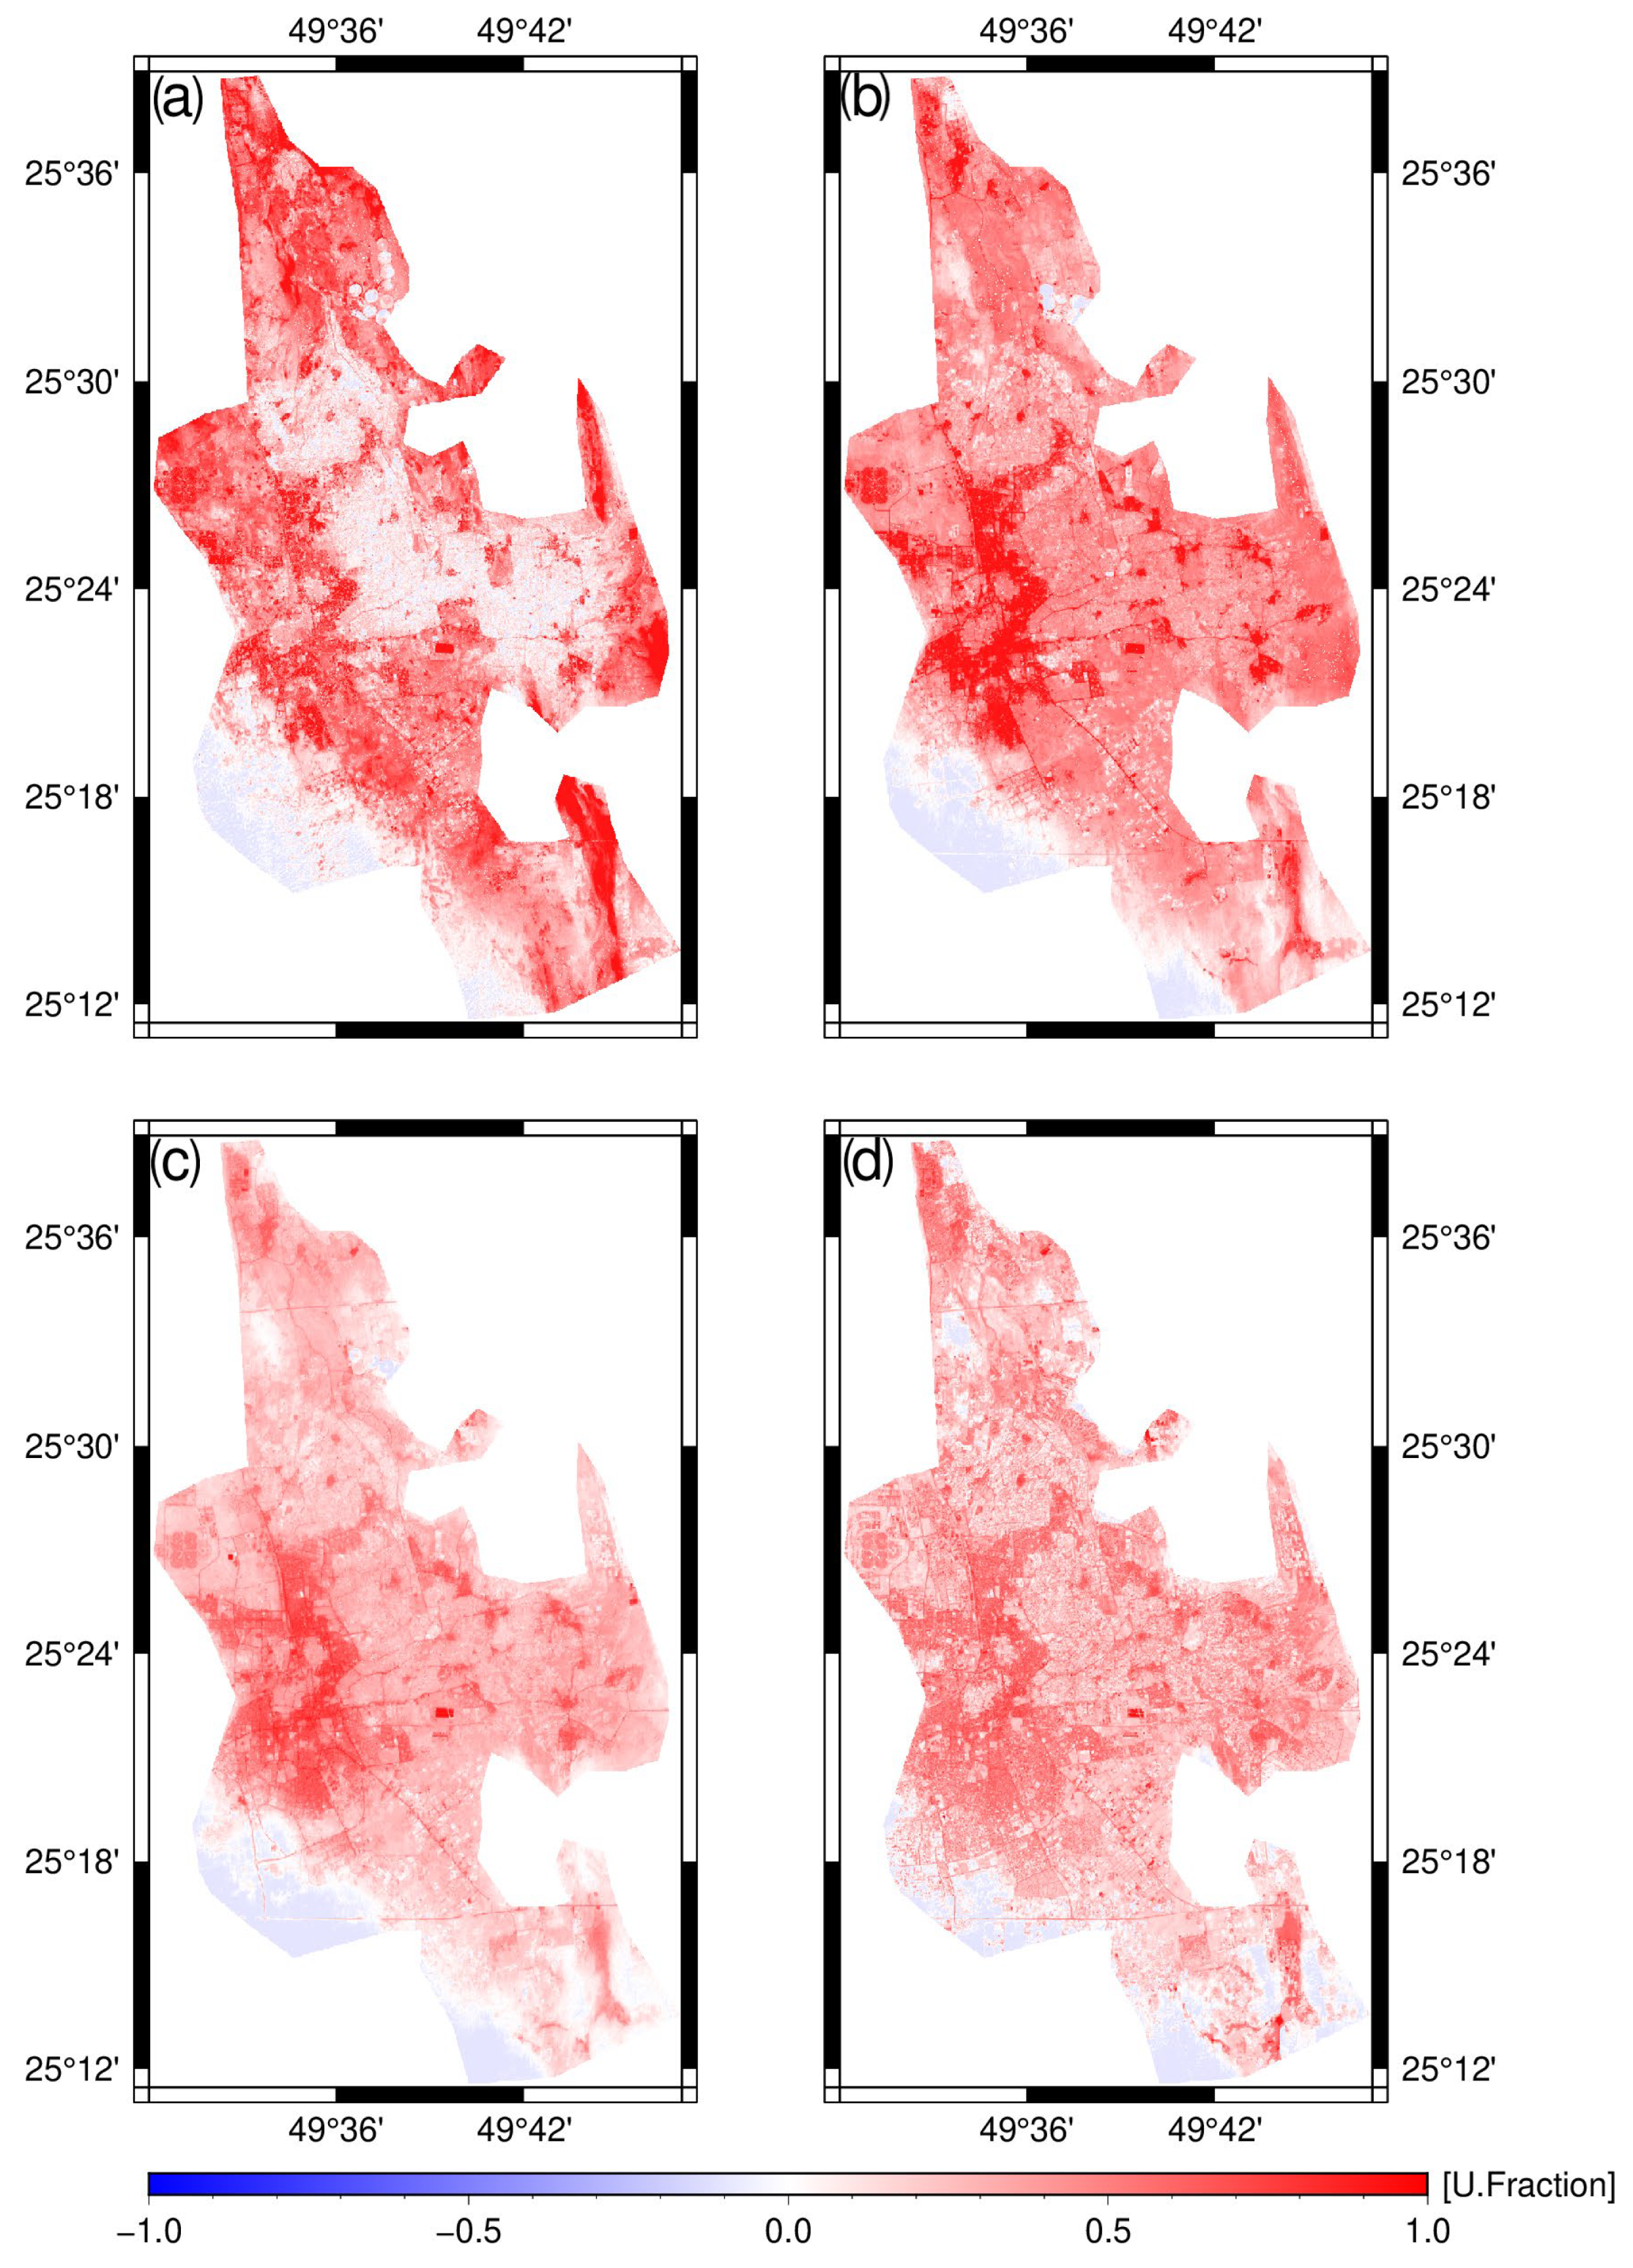
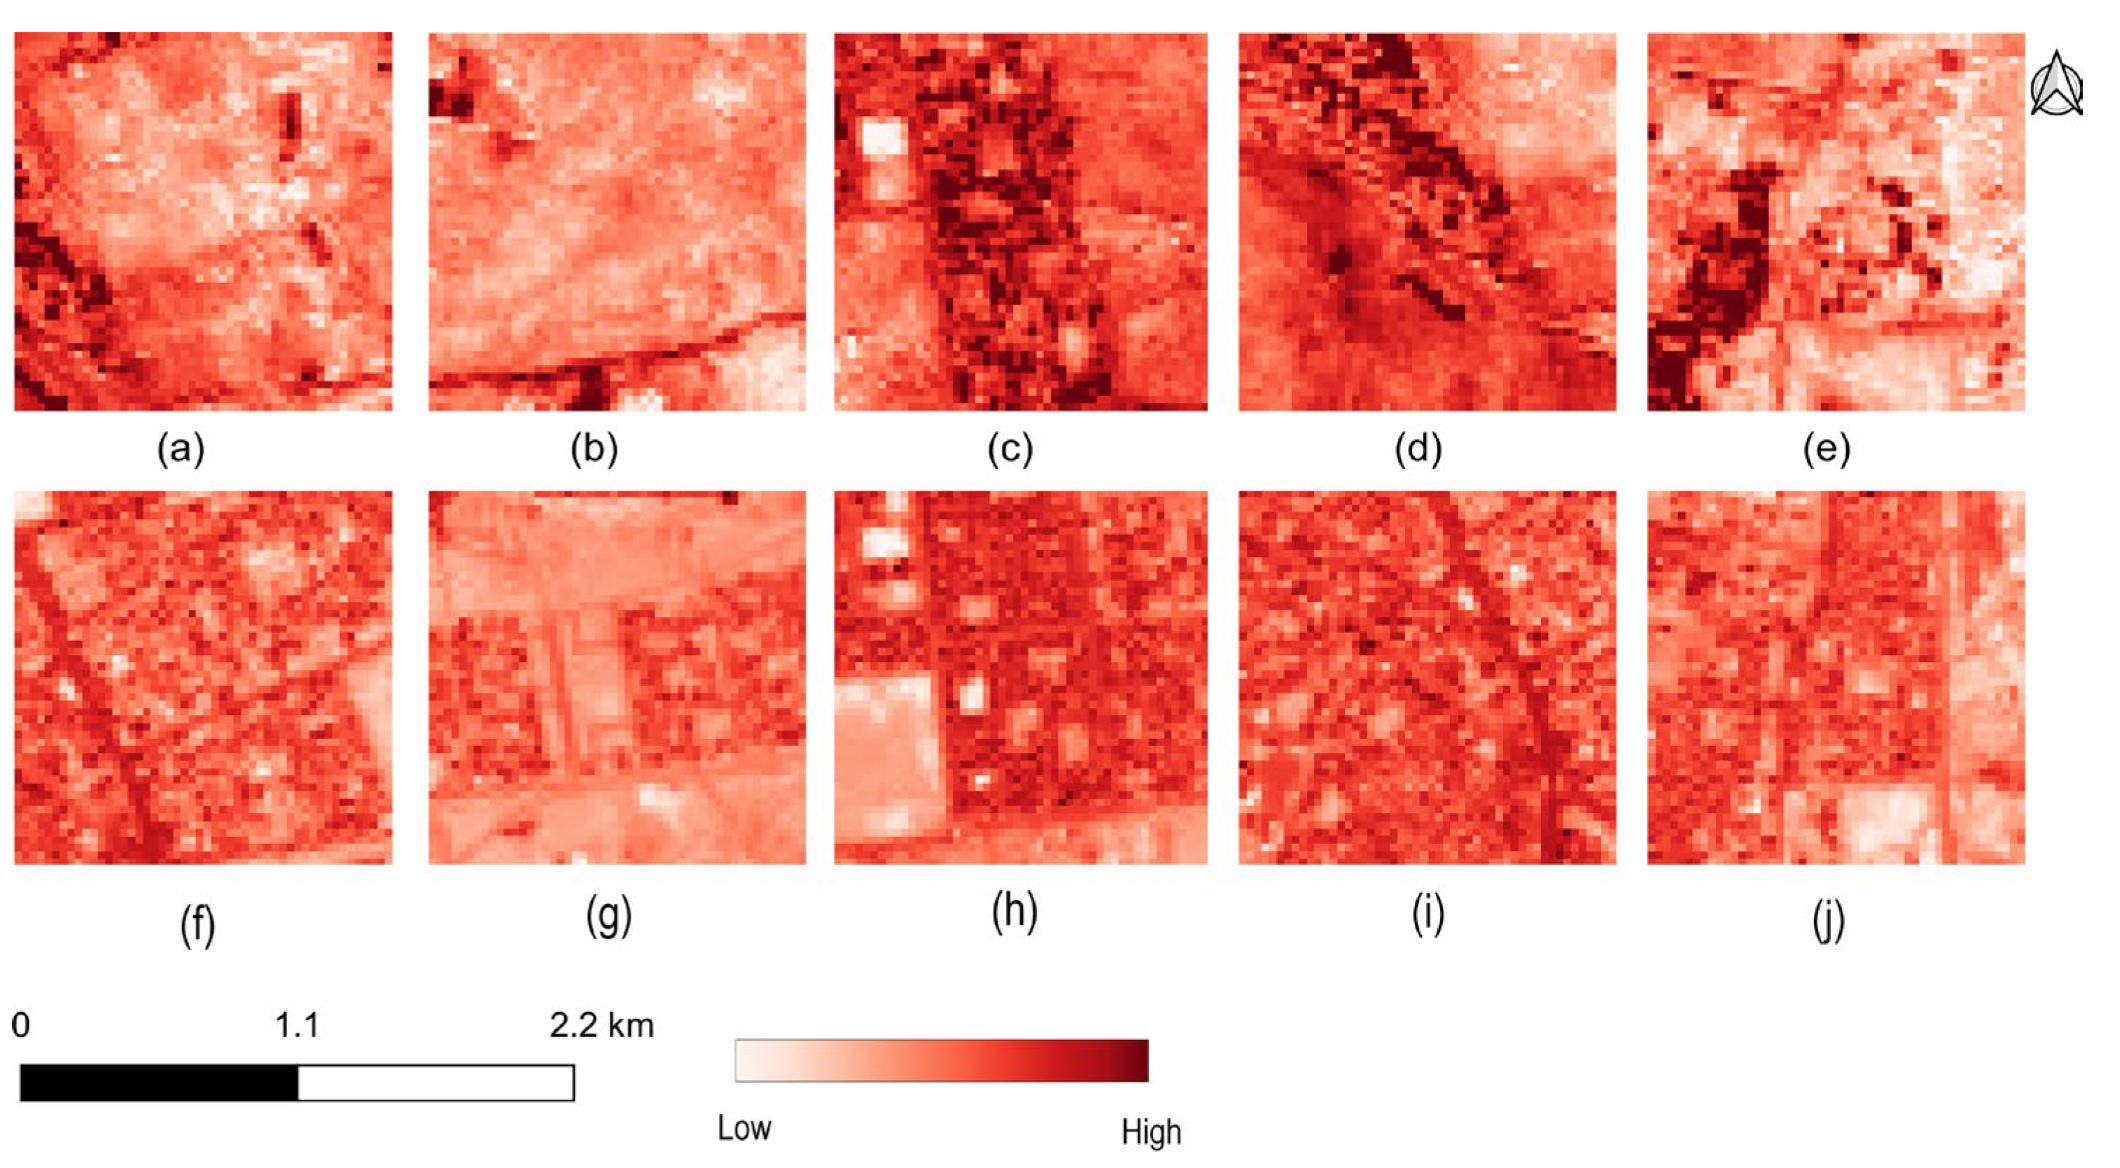
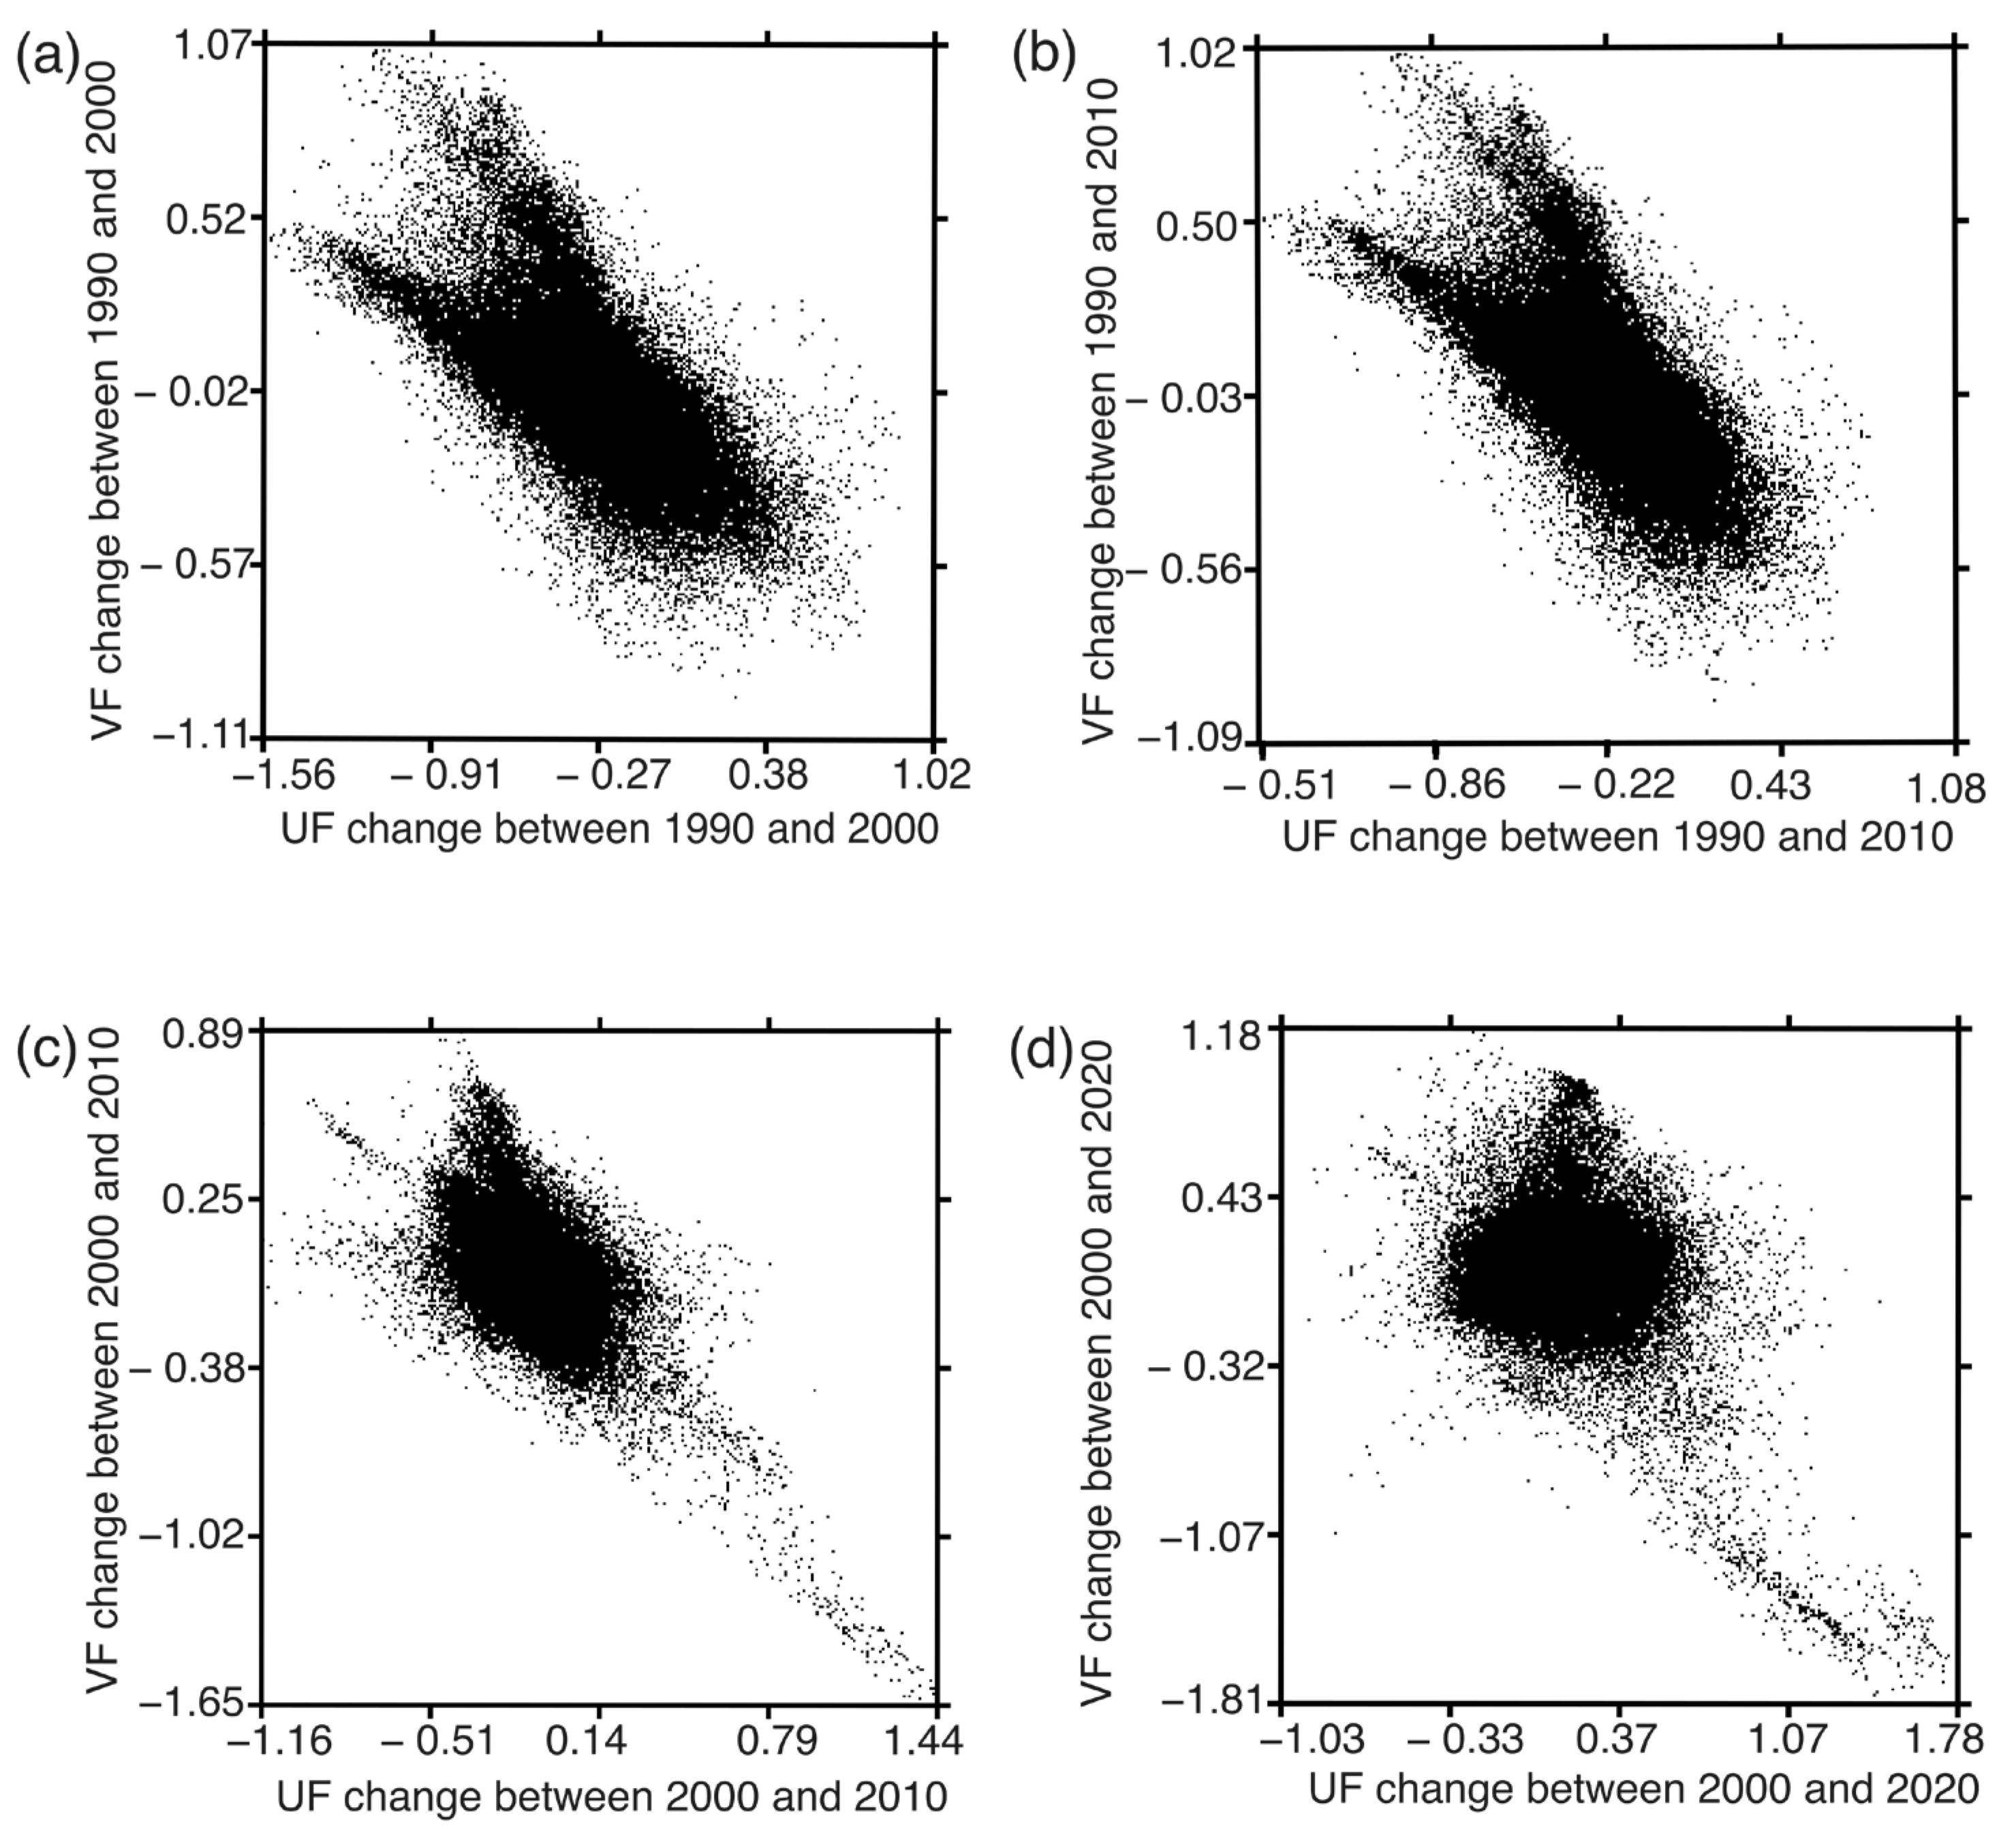
Due to anthropogenic activities and population growth in the Oasis, especially since oil discovery in 1938, the major driving force of vegetation fraction changes has been urban expansion. Urbanization has increased dramatically from 1990 to 2020 in the Oasis (Figure 6a and Figure 10). According to the results of the SMA model, the urban fraction was 0.208%, 0.247%, 0.699%, and 0.807% in 1990, 2000, 2010, and 2020, respectively (Figure 6a). Furthermore, we found that areas that were dominated by agriculture (e.g., date palm plantations and other types of seasonal crops) in the year 1990 have transformed into urban areas in 2020 (Figure 11). The bright pixels in Figure 11a–d represent areas originally occupied by vegetation fractions in 1990 that were subsequently converted into built-up land uses by 2020, as illustrated in Figure 11e–h. A visual assessment of Figure 12 further indicates that the most substantial transformations in the built-up fraction across the Oasis primarily occurred between 1990 and the period 2010–2020. Notably, urban expansion in 2020 was particularly pronounced, with development concentrated in three principal directions: the central zone, the northern sector, and the eastern periphery (Figure 10).
The data confirmed an association between changes in vegetation fractions and urban fractions from 1990 to 2020 (Figure 12). This significant correlation suggests that the reduction in vegetation cover resulted from the expansion of urban features over the Oasis during this period. Conversely, any increase in urban fractions has led to a decrease in vegetation (palm trees) fractions.
On the other hand, by analyzing population data, we found that the Oasis’ population has almost doubled between 1990 and 2020 (Table 4) with a variation peak in 2004 (28.9%). This growth in population could have positively boosted the expansion of the Oasis’s urban cover as one of the main driving forces.
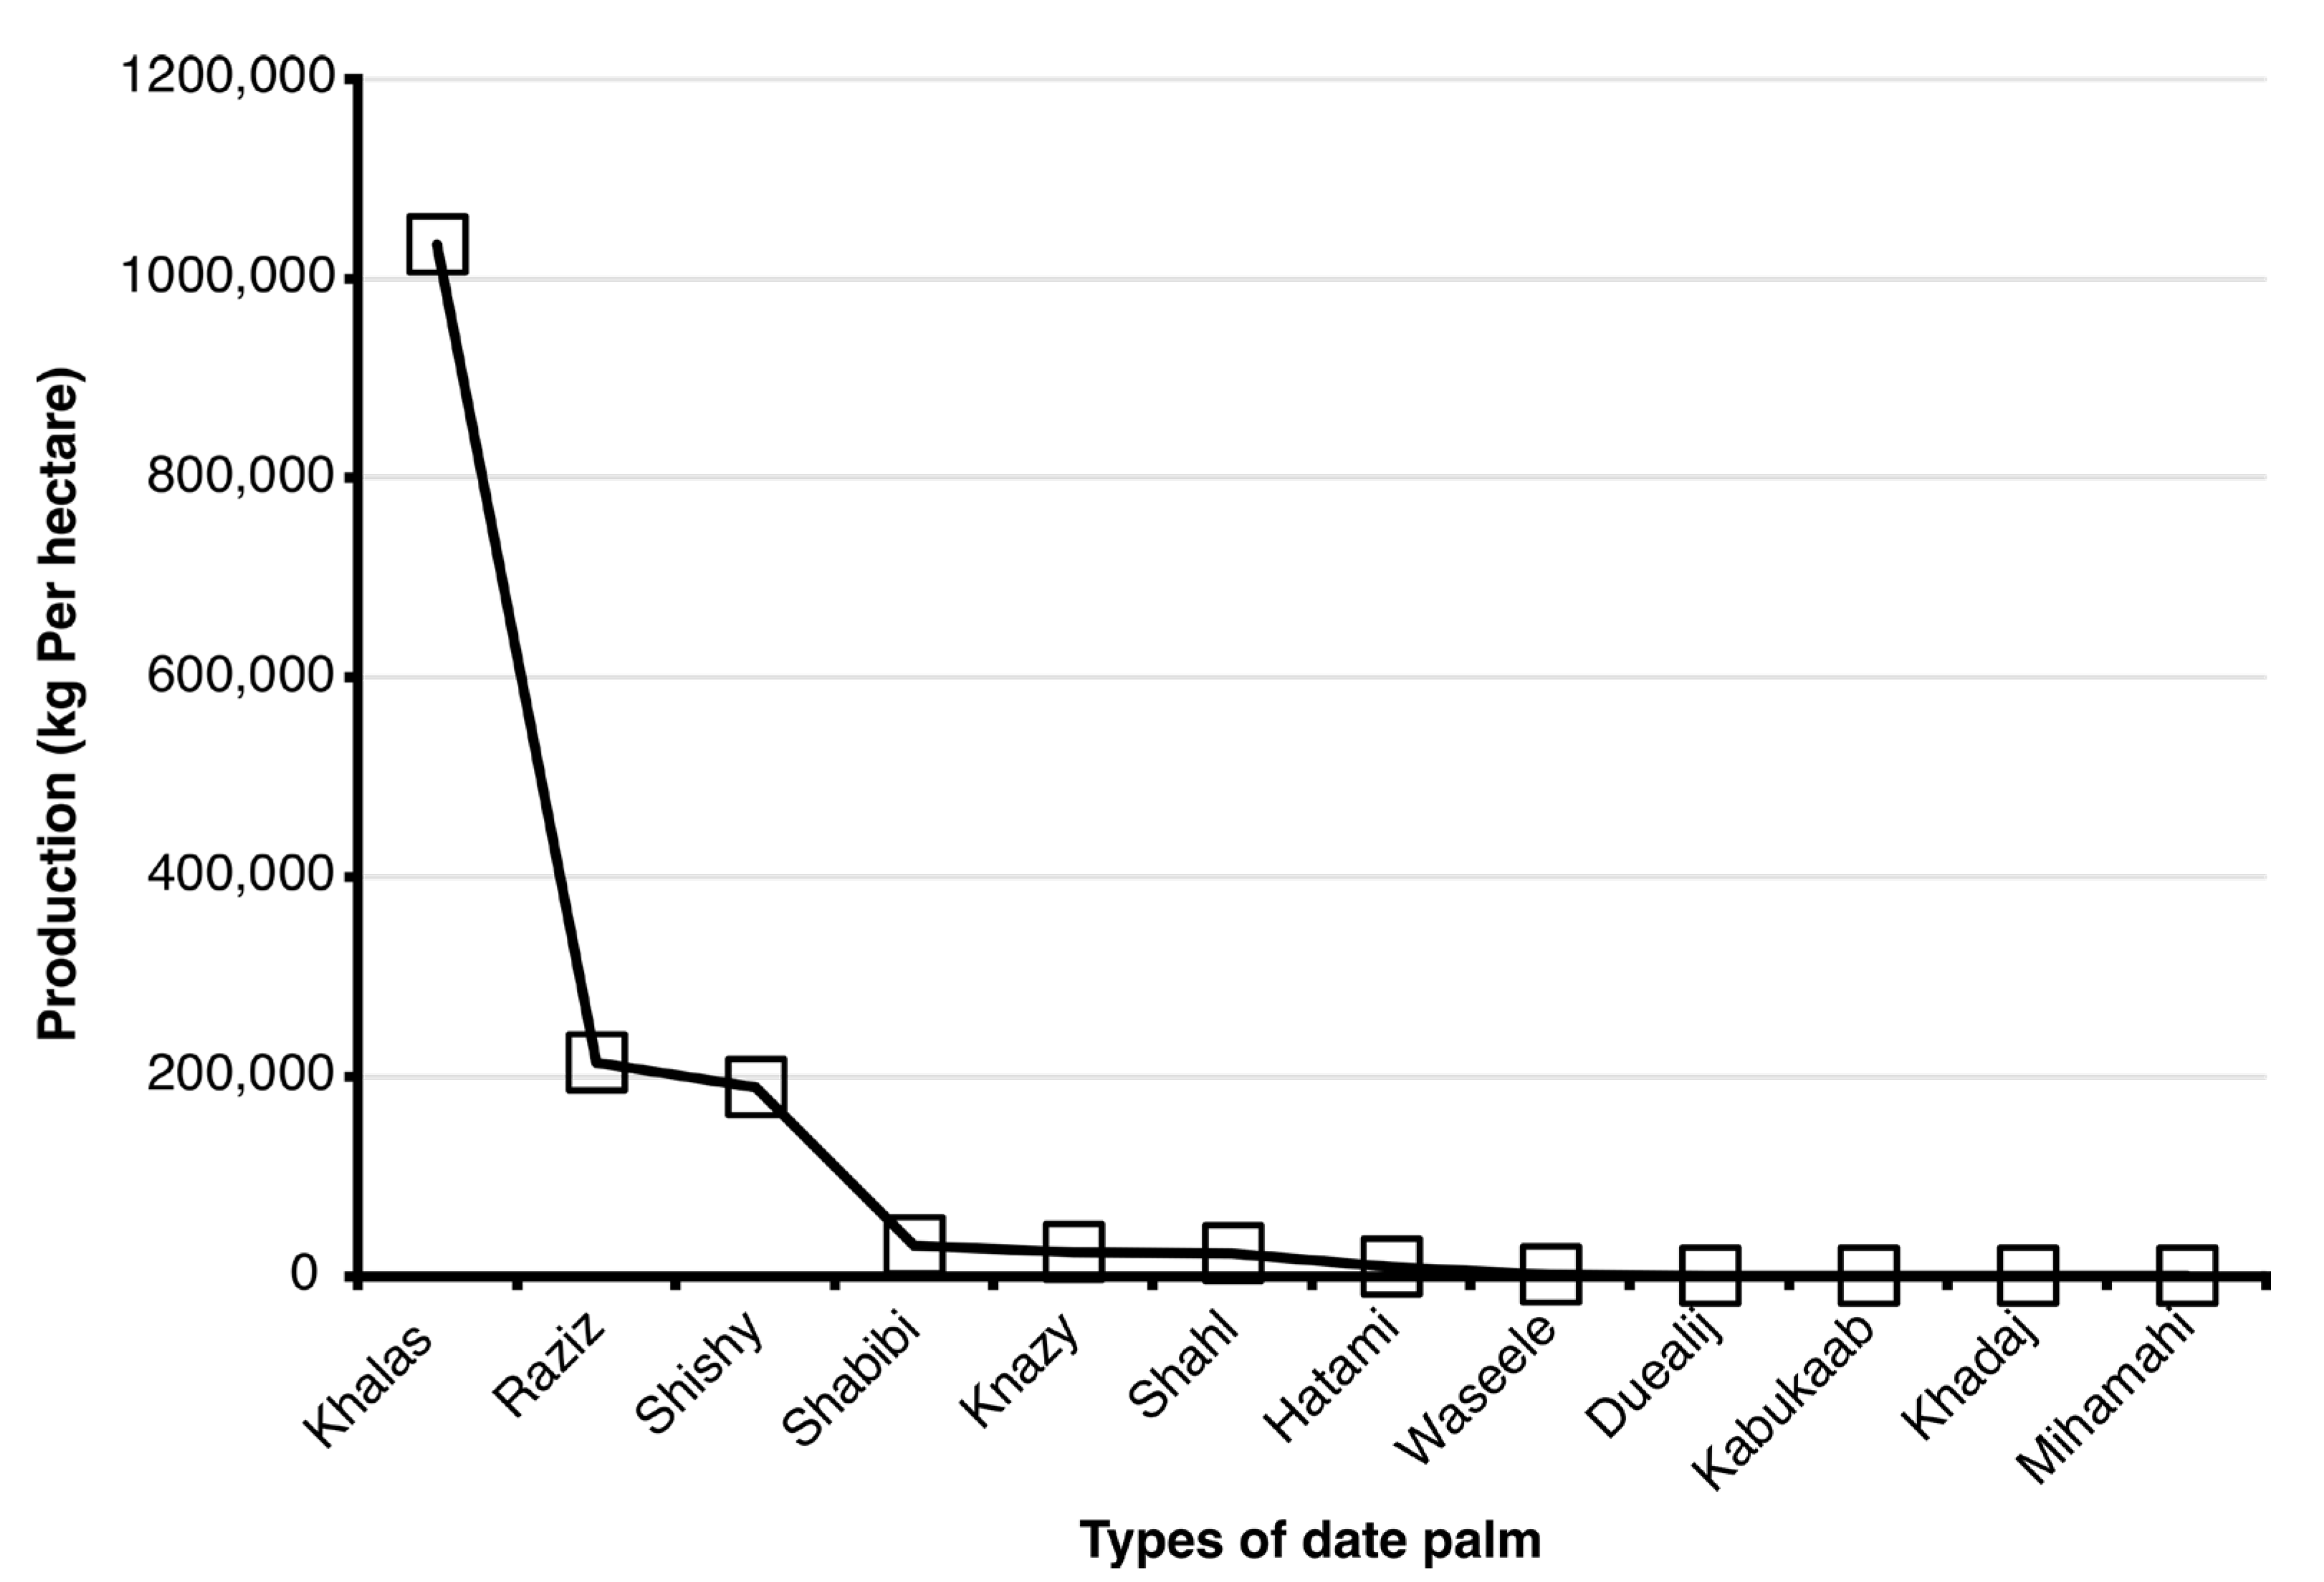
These results were used to evaluate the effects of changes in vegetation fractions on the agroecosystem situation of the Oasis, where we found that the date palm productivity (kg/ha) varied considerably based on the cultivars of date palm trees (Figure 13).
The only date palm cultivar that achieved high productivity was Khalas (10.33, 890 kg), while most of the other species (e.g., Dueailij and Kabukaab) had no substantial yields (at 0 kg/ha respectively) (Figure 13). The results suggest that a reduction in area covered with palm trees explains most of the variability in date palm yields.

5. Discussion

In the Al-Ahsa Oasis, the continuous expansion of urbanization and population growth has intensified reliance on vegetation cover—particularly palm plantations—which serve as the primary agricultural ecosystem sustaining local livelihoods. Prior work has documented the severity of soil salinity, sand encroachment, and human activities, such as rapid urbanization, in the changing and shrinking of the vegetation cover that is dominated by date palm trees and other agricultural crops. Almadini and Hassaballa; Allbed et al., and Aldakheel [7,9,13], for example, stated that the vegetation land cover of the Al-Ahsa Oasis reduced dramatically during the period of 1985–2020 due to soil salinity. More recently, Salih [8], using the SMA model, stated that urban development represented by urban fraction has increased significantly during the period between 1990 and 2020, suggesting that this quick enlargement in built-up areas is a key driver of the logging, in addition to further damages linked to the confined ecosystem in the Oasis. However, these studies have either been short-term studies, used traditional methods for extracting information about vegetation cover, or have not focused on the influence of vegetation land cover modifications on the agroecosystem of the Oasis. In the current study, the SMA model was used as a sophisticated technique to evaluate the alteration in vegetation land cover and its effect on the agroecosystem of the Al-Ahsa Oasis, and to assess its main driving forces, employing Landsat and Sentinel-2A images. Analysis revealed a consistent decline in vegetation cover: an average loss of 5.7% during 1990–2000, 13.1% in 2000–2010, 24.3% in 2010–2020, and a cumulative reduction of 43.1% over 1990–2020 (Figure 6a and Figure 7). These findings are consistent with earlier reports of a ~3% decline for 1985–2000, concentrated mainly in the northeastern and southern portions of the Oasis [13], as well as the documented reduction of approximately 10 km2 in 2019 [9].
The effect of urban sprawl on vegetation fractions in Al-Ahsa has been well-documented by previous studies [9,10,30], highlighting its role in environmental and socio-economic challenges. An understanding of this fast and uncontrolled development is essential for implementing sustainable development strategies in the Oasis area.
As urban sprawl advances, vegetation cover is steadily declining. Almadini and Hassaballa [9] observed initial flora development between 1985 and 1999, followed by a gradual decline, particularly within the Oasis, as urban expansion encroached on agricultural land. Intensified agricultural practices have also contributed to this transformation, reshaping the rural landscape into an urbanized environment. While urban growth is not the sole driver of environmental degradation, it remains a major contributing factor to ecosystem disruption in Al-Ahsa. Further, in a study by Meneses et al. [31], it has been confirmed that anthropogenic expansion and unsustainable practices significantly affect natural vegetation, water resources, and water quality, leading to ecosystem degradation. Additionally, these activities contribute indirectly to global climate change by altering carbon cycles, land cover, and hydrological processes, further intensifying environmental challenges.
This study highlighted the negative impact of vegetation loss on the agroecosystem, as evidenced by fluctuations in date palm productivity (Figure 13). Among various date palm species, the Khalas cultivar was the only one that maintained high yields (10.33, 890 kg/ha), while others, such as Dueailij and Kabukaab, exhibited yields approaching zero. This suggests that the decline in vegetation cover, particularly date palm groves, has considerably affected the Oasis’s agricultural system.
Similar trends have been observed elsewhere; Lamqadem et al. [2] reported high vegetation degradation rates in southeastern Morocco, with annual losses of ~3.2% among Oasis vegetation covers. Their findings indicated severe land degradation, with reductions of −2.08% (1990–2002), −4.84% (1990–2007), and −8% (2013–2017), underscoring the urgent need for sustainable land management strategies in fragile Oasis ecosystems.
Using GIS and conventional classification remote sensing techniques, Alqahtany [14] reported that the Al-Ahsa Oasis lost around 18% of its vegetation land cover between 1992 and 2022, suggesting that this decrease in vegetation ecosystem might greatly harm the environment of the Oasis.
However, not all studies report decreases in vegetation cover fraction. One study of Phoenix dactylifera grove in the Oasis using NDVI index, considering the spatiotemporal change of vegetation land cover regarding the sustainability of the Al-Ahsa Oasis resources, found a substantial improvement in the ecosystem of the Oasis between 1987 and 2021, where NDVI values ranged between 0.10 and 0.70, and they indicated that this improvement concentrated mainly in the northern and southern parts of the Oasis, especially during the period from 2002 to 2021 [5].
However, these improvements in vegetation land cover are represented by new seasonal crops scattered across the areas surrounding the Oasis. The analysis of driving forces may reflect the effect of human and ecological influences, such as urban development and soil salinity, on vegetation variation, which is discussed below. Further study conducted by Alqurashi and Kumar [30] quantified land cover (LULC) changes and analyzed the impact of built-up enlargement in the “Riyadh”, “Jeddah”, and “Makkah” using Landsat imagery from 1985, 2000, and 2014. The findings revealed significant LULC transformations, with a substantial increase in urban built-up areas, primarily replacing bare soil. The most notable urban expansion occurred between 1985 and 2000 and 2000 and 2014, highlighting the absence of effective master planning to contain development within urban boundaries. VC trends varied during the study timeframe. Seasonal vegetation analysis indicated that non-agricultural green parts fluctuated across seasons and years, suggesting that climatic conditions had a greater influence on vegetation dynamics than urban expansion during the observation period.
In fact, the current study findings provide compelling evidence for the long-term effect of anthropogenic activities, such as rapid urbanization, on the vegetation cover and agroecosystem of the Al-Ahsa Oasis and suggest that this approach appears to be effective in extracting information about land cover of arid and semiarid Oases from images of medium spatial resolution, which are characterized by a mixed features problem. However, some restrictions are worth noting. Though a forthright analysis was followed to assess the vegetation fractions as well as urban fraction changes, through employing the SMA model and pure endmembers, the current study indicates that vegetation fractions enclosed by further varieties of covers, such as waterbodies, may increase the mapping error. In addition, the SMA model yielded high performance results (93–100%), and based on this precision, fewer pixels were unclassified correctly. Thus, two clarifications are worth noting. First, the SMA model is a highly sensitive tool for tracing and mapping Earth surface features—such as vegetation and built-up fractions—by employing “pure endmembers” at the sub-pixel level, accounting for both spatial and spectral variability. Second, this strength also highlights certain confines in how SMA accuracy is commonly evaluated. The widely used confusion (error) matrix has been criticized by several researchers, e.g., [32,33,34], who recommend instead employing quantity disagreement and allocation disagreement measures for a more robust assessment of classified images.

5.1. Driving Forces of Palm Tree Alterations

5.1.1. Effect of Urban Stressors

One of the study objectives was to determine the main driving forces of vegetation fraction changes and/or variation in the Oasis. Hence, the effect of social activities, given in terms of rapid urban expansion, was evaluated using the SMA model, as it was considered a major driver of vegetation change, causing a fast decline of cultivated land and vegetation land cover, especially date palm, in the Oasis. It has been figured out that urban fractions have increased from (as an average) 20.1% in 1990, to 24.7% in 2000, then 69.9% in 2010, and finally 80.6% in 2020 (Figure 6b). Furthermore, using visual interpretation, it has been observed that this increase is allocated mainly over two parts, including the north and south (Figure 11). In a similar study, Salih [8] revealed that urban development was dominating near the north and south portions of the Oasis, where crop lands were dominant. Moreover, by examining Figure 11, an increase in urban fractions against palm trees was noticed between 2010 and 2020, especially in the northern part of the Oasis. This result is in accordance with previous findings of Salih [8] and those of Almadini and Hassaballa [9], who indicated that about 1270 hectares of vegetation cover during the period from 2013 to 2017 were cleared due to urban expansion. Other reasons for rapid urban expansion have been the discovery of oil and gas in 1938 and the development of the road network [10]. Here, a significant inverse relationship between the changes in urban and vegetation fractions existed (Figure 13), suggesting that any reduction in the area of vegetation cover was more likely to account for an increase in urban land cover. This result is supported by those of Hassaballa and Salih [35], where the relative influence of the vegetation on the rise of land surface temperature (LST) and/or urban heat island (UHI) has been linked directly to the shrinkage of vegetation cover and expansion of urban features. Moreover, the increase in the population of the Oasis (Table 4) during the period from 1990 to 2020 may have contributed to the recent urban expansion, and this increase has led to what is known as the “dark surface” [10], which may lead to a rise in sea surface temperature and the UHI index.
Vegetation can be affected by parent material and soil, as this can lead to poor conditions for vegetation growth, along with improper land management practices that damage vegetation [36].

5.1.2. Effect of Soil Salinity

Prior work has shown the consequences of soil salinity on vegetation changes, e.g., [7,12,13]. For example, significant negative linear relationships (p < 0.0001) were addressed amongst vegetation land cover change and soil salinity during the change periods, 1985–2000 and 2000–2013, suggesting a decline of area covered by agricultural lands and vegetation land cover in general when the salinity rate increases [13]. However, in another study, areas without vegetation had soils with high salinity (i.e., >16 dS/m) while areas with vegetation had soils with lower salinity [37]. The growth of vegetation and the sustainability of irrigated agriculture in the Oasis were studied using the natural vegetation index, salinity measurement, and a geostatistical analysis approach. Their results indicated that the health of vegetation is contingent primarily on the rate of soil salinity and the irrigation water quality, and that high salinity soils inhibit growth and lead to lower quality fruits [7].

5.2. Limitations of the Applied Model

Although our promising results, particularly those related to vegetation and urban fraction mapping, are valid and their accuracy is assessed using overall accuracy and kappa coefficient, the complexity of the geographic features in the study area and the limited resolution of the satellite imagery used (e.g., Landsat and Sentinel 2A) likely limit the selection of pure endmembers and then the SMA model’s performance, especially in areas covered by water bodies and/or sand dunes/sheets when mixed with urban features in one pixel. However, this limitation could be mitigated in the future by using high-resolution satellite imagery, applying masking techniques to remove all potential sources of error, such as areas covered by water bodies and/or sandy terrain, and investigating how these proposed procedures can increase model accuracy and reduce its ambiguity and/or uncertainty. This outlines the first direction for future work, along with a deeper understanding of the future status of the Oasis’s agroecosystem.

6. Conclusions

This study demonstrates that combining remote sensing data, including Landsat sensors (TM, ETM+, and OLI), GeoEye-1 and Sentinel 2A imagery with socio-economic data and date palm yields in a SMA model provides an inexpensive approach to monitor changes in palm trees cover and urban sprawl to investigate the possible driving forces of the multitemporal vegetation dynamics (mostly date palms) in Al-Ahsa Oasis, Eastern Province of Saudi Arabia, in order to understand the possible mechanisms of its agroecosystems dynamics. Taken together, our validation results indicate the applicability of the used model for assessing and mapping vegetation and urban dynamics in the arid and semiarid regions. Moreover, the results also indicated that vegetation cover has decreased rapidly between 1990 and 2020 because of urban development, which increased greatly during the study timeframe. A strong inverse correlation was found between the changes in vegetation fractions and the urban ones. This decrease in vegetation cover fractions, denoted by date palm (Phoenix dactylifera L.) plantations alteration, affects the agroecosystem of the Oasis, where the productivity (kg/ha) of some cultivars of date fruit substantially declined.
Although the results obtained from the proposed model would help provide the local society with additional up-to-date statistics on palm tree fraction dynamics that can be used to maintain the agroecosystem at this Oasis for future generations, future conservation and restoration efforts will require a thorough understanding of factors affecting transformations in agricultural lands and vegetation cover in general, and then the agroecosystem of the Oasis. In particular, a more comprehensive study of climate change, soil salinity, and human activities is required to decide how and under what conditions these parameters may differently affect vegetation diversity. Furthermore, further research is needed to focus on investigating the possibility of using high-resolution data in pure endmembers selection on such a complex ecosystem and to investigate whether this can increase the accuracy of the SMA model and its applications in mapping and evaluating vegetation and urban fractions.

Supplementary Materials

The following supporting information can be downloaded at: https://www.mdpi.com/article/10.3390/agriculture15192043/s1. Figure S1: Google images show how vegetation, especially palm trees, was affected by urban expansion during (a) 1990 and (b) 2020. The red circle indicates the prevalence of urban features in the center of the images, where urban expansion is more prevalent in 2020 than in 1990.; Table S1: Fraction values for vegetation and urban cover with change information.

Author Contributions

Conceptualization, A.S. and A.H.; methodology, A.S.; software, A.S.; validation, A.S., A.H. and A.E.R.; formal analysis, A.S.; investigation, A.H.; resources, A.S.; data curation, A.S.; writing—original draft preparation, A.S., A.H. and A.E.R.; writing—review and editing, A.S., A.H. and A.E.R.; visualization, A.S.; supervision, A.E.R.; project administration, A.S.; funding acquisition, A.S. All authors have read and agreed to the published version of the manuscript.

Funding

This work was supported by the Deanship of Scientific Research, Vice Presidency for Graduate Studies and Scientific Research, King Faisal University, Saudi Arabia [Grant No. KFU250207].

Institutional Review Board Statement

Not applicable.

Data Availability Statement

The raw data supporting the conclusions of this article will be made available by the authors on request.

Acknowledgments

The authors would like to thank King Faisal University for its continuous support and assistance, and the anonymous reviewers and editors whose comments and suggestions are greatly improve this manuscript.

Conflicts of Interest

The authors declare no conflicts of interest.

Abbreviations

The following abbreviations are used in this manuscript:
SMASpectral Mixture Analysis
NDVINormalized Difference Vegetation Index
PCAPrincipal Component Analysis
VCVegetation Cover
FVCFractional Vegetation Cover
BLBarren lands and Sand
URUrban
MNFMinimum Noise Fraction

References

  1. Song, D.-X.; Wang, Z.; He, T.; Wang, H.; Liang, S. Estimation and Validation of 30 m Fractional Vegetation Cover over China through Integrated Use of Landsat 8 and Gaofen 2 Data. Sci. Remote Sens. 2022, 6, 100058. [Google Scholar] [CrossRef]
  2. Lamqadem, A.A.; Afrasinei, G.M.; Saber, H. Analysis of Landsat-Derived Multitemporal Vegetation Cover to Understand Drivers of Oasis Agroecosystems Change. J. Appl. Remote Sens. 2019, 13, 014517. [Google Scholar] [CrossRef]
  3. Xie, Y.; Zhao, H.; Wang, G. Spatio-Temporal Changes in Oases in the Heihe River Basin of China: 1963–2013. Écoscience 2015, 22, 33–46. [Google Scholar] [CrossRef]
  4. Zhang, X.; Liao, C.; Li, J.; Sun, Q. Fractional Vegetation Cover Estimation in Arid and Semi-Arid Environments Using HJ-1 Satellite Hyperspectral Data. Int. J. Appl. Earth Obs. Geoinf. 2013, 21, 506–512. [Google Scholar] [CrossRef]
  5. Chouari, W. Assessment of Vegetation Cover Changes and the Contributing Factors in the Al-Ahsa Oasis Using Normalized Difference Vegetation Index (NDVI). Reg. Sustain. 2024, 5, 100111. [Google Scholar] [CrossRef]
  6. Salih, A. Classification and Mapping of Land Cover Types and Attributes in Al- Ahsaa Oasis, Eastern Region, Saudi Arabia Using Landsat-7 Data. J. Remote Sens. GIS 2018, 7, 228–234. [Google Scholar] [CrossRef]
  7. Aldakheel, Y.Y. Assessing NDVI Spatial Pattern as Related to Irrigation and Soil Salinity Management in Al-Hassa Oasis, Saudi Arabia. J. Indian Soc. Remote Sens. 2011, 39, 171–180. [Google Scholar] [CrossRef]
  8. Salih, A. Spectral Mixture Analysis (SMA) Model for Extracting Urban Fractions from Landsat and Sentinel-2A Images in the Al-Ahsa Oasis, Eastern Region of Saudi Arabia. Land 2023, 12, 1842. [Google Scholar] [CrossRef]
  9. Almadini, A.M.; Hassaballa, A.A. Depicting Changes in Land Surface Cover at Al-Hassa Oasis of Saudi Arabia Using Remote Sensing and GIS Techniques. PLoS ONE 2019, 14, e0221115. [Google Scholar] [CrossRef]
  10. Abdelatti, H.; Elhadary, Y.; Babiker, A.A. Nature and Trend of Urban Growth in Saudi Arabia: The Case of Al-Ahsa Province—Eastern Region. Resour. Environ. 2017, 7, 69–80. [Google Scholar]
  11. Salih, A.; Hassaballa, A.A.; Ganawa, E. Mapping Desertification Degree and Assessing Its Severity in Al-Ahsa Oasis, Saudi Arabia, Using Remote Sensing-Based Indicators. Arab. J. Geosci. 2021, 14, 192. [Google Scholar] [CrossRef]
  12. Allbed, A.; Kumar, L.; Aldakheel, Y.Y. Assessing Soil Salinity Using Soil Salinity and Vegetation Indices Derived from IKONOS High-Spatial Resolution Imageries: Applications in a Date Palm Dominated Region. Geoderma 2014, 230–231, 1–8. [Google Scholar] [CrossRef]
  13. Allbed, A.; Kumar, L.; Sinha, P. Soil Salinity and Vegetation Cover Change Detection from Multi-Temporal Remotely Sensed Imagery in Al Hassa Oasis in Saudi Arabia. Geocarto Int. 2018, 33, 830–846. [Google Scholar] [CrossRef]
  14. Alqahtany, A. GIS-Based Assessment of Land Use for Predicting Increase in Settlements in Al Ahsa Metropolitan Area, Saudi Arabia for the Year 2032. Alex. Eng. J. 2023, 62, 269–277. [Google Scholar] [CrossRef]
  15. Salih, A.A.M.; Ganawa, E.S.M.; Elfaig, A.H.I.; Hilmi, H.S.M. Integration of Geo-Spatial Techniques for Desertification Impact Assessment on Agricultural Lands in El-Qutaynah Area, Sudan. Int. J. Environ. Monit. Prot. 2017, 4, 6. [Google Scholar]
  16. General Authority for Statistics. Available online: https://www.stats.gov.sa (accessed on 25 February 2025).
  17. Elprince, A.M.; MakkP, Y.M.; AI-Barrak, S.; Tamim, M.T.; Irrigation, H. Use of Computer Graphics in Developing Density Maps for the Date Culture of Al- Hassa Oasis in Saudi Arabia. In Proceedings of the First Symposium on Date Palm Conference, AI-Hassa, Saudi Arabia, 23–25 March 1982. [Google Scholar]
  18. Alkhaldi, G.; Emam, A.; Mosbah, E. An Economic Study: Date Palm Farmers in Al Ahsa Oasis-Kingdom of Saudi Arabia. Univers. J. Agric. Res. 2022, 10, 794–803. [Google Scholar] [CrossRef]
  19. Congedo, L. Semi-Automatic Classification Plugin Documentation—Semi-Automatic Classification Plugin 8.3.0.2 Documentation. Available online: https://semiautomaticclassificationmanual.readthedocs.io/en/latest/ (accessed on 26 February 2025).
  20. Chavez, P.S. Image-Based Atmospheric Corrections—Revisited and Improved. Photogramm. Eng. Remote Sens. 1996, 62, 1025–1035. [Google Scholar]
  21. Dawelbait, M.; Dal Ferro, N.; Morari, F. Using Landsat Images and Spectral Mixture Analysis to Assess Drivers of 21-Year LULC Changes in Sudan. Land Degrad. Dev. 2017, 28, 116–127. [Google Scholar] [CrossRef]
  22. Dawelbait, M.; Morari, F. Monitoring Desertification in a Savannah Region in Sudan Using Landsat Images and Spectral Mixture Analysis. J. Arid Environ. 2012, 80, 45–55. [Google Scholar] [CrossRef]
  23. Khiry, M.A. Spectral Mixture Analysis for Monitoring and Mapping Desertification Processes in Semi-Arid Areas in North Kordofan State, Sudan. 2007. Available online: https://www.researchgate.net/publication/44230753_Spectral_Mixture_Analysis_for_Monitoring_and_Mapping_Desertification_Processes_in_Semi-arid_Areas_in_North_Kordofan_State_Sudan (accessed on 25 February 2025).
  24. Pan, J.; Li, T. Extracting Desertification from Landsat TM Imagery Based on Spectral Mixture Analysis and Albedo-Vegetation Feature Space. Nat. Hazards 2013, 68, 915–927. [Google Scholar] [CrossRef]
  25. Elmore, A.J.; Mustard, J.F.; Manning, S.J.; Lobell, D.B. Quantifying Vegetation Change in Semiarid Environments: Precision and Accuracy of Spectral Mixture Analysis and the Normalized Difference Vegetation Index. Remote Sens. Environ. 2000, 73, 87–102. [Google Scholar] [CrossRef]
  26. Adams, J.B.; Smith, M.O.; Johnson, P.E. Spectral Mixture Modeling: A New Analysis of Rock and Soil Types at the Viking Lander 1 Site. J. Geophys. Res. Solid Earth 1986, 91, 8098–8112. [Google Scholar] [CrossRef]
  27. Adams, J.B.; Sabol, D.E.; Kapos, V.; Almeida Filho, R.; Roberts, D.A.; Smith, M.O.; Gillespie, A.R. Classification of Multispectral Images Based on Fractions of Endmembers: Application to Land-Cover Change in the Brazilian Amazon. Remote Sens. Environ. 1995, 52, 137–154. [Google Scholar] [CrossRef]
  28. Xie, Y.; Bie, Q.; Lu, H.; He, L. Spatio-Temporal Changes of Oases in the Hexi Corridor over the Past 30 Years. Sustainability 2018, 10, 4489. [Google Scholar] [CrossRef]
  29. Monserud, R.A.; Leemans, R. Comparing Global Vegetation Maps with the Kappa Statistic. Ecol. Model. 1992, 62, 275–293. [Google Scholar] [CrossRef]
  30. Alqurashi, A.F.; Kumar, L. An Assessment of the Impact of Urbanization and Land Use Changes in the Fast-Growing Cities of Saudi Arabia. Geocarto Int. 2019, 34, 78–97. [Google Scholar] [CrossRef]
  31. Meneses, B.M.; Reis, R.; Vale, M.J.; Saraiva, R. Land Use and Land Cover Changes in Zêzere Watershed (Portugal)—Water Quality Implications. Sci. Total Environ. 2015, 527–528, 439–447. [Google Scholar] [CrossRef]
  32. Stehman, S.V.; Foody, G.M. Key Issues in Rigorous Accuracy Assessment of Land Cover Products. Remote Sens. Environ. 2019, 231, 111199. [Google Scholar] [CrossRef]
  33. Olofsson, P.; Foody, G.M.; Herold, M.; Stehman, S.V.; Woodcock, C.E.; Wulder, M.A. Good Practices for Estimating Area and Assessing Accuracy of Land Change. Remote Sens. Environ. 2014, 148, 42–57. [Google Scholar] [CrossRef]
  34. Pontius, R.G., Jr.; Millones, M. Death to Kappa: Birth of Quantity Disagreement and Allocation Disagreement for Accuracy Assessment. Int. J. Remote Sens. 2011, 32, 4407–4429. [Google Scholar] [CrossRef]
  35. Hassaballa, A.; Salih, A. A Spatio-Temporal Analysis of Heat Island Intensity Influenced by the Substantial Urban Growth between 1990 and 2020: A Case Study of Al-Ahsa Oasis, Eastern Saudi Arabia. Appl. Sci. 2023, 13, 2755. [Google Scholar] [CrossRef]
  36. Wang, Y.; Zhang, J.; Tong, S.; Guo, E. Monitoring the Trends of Aeolian Desertified Lands Based on Time-Series Remote Sensing Data in the Horqin Sandy Land, China. Catena 2017, 157, 286–298. [Google Scholar] [CrossRef]
  37. Allbed, A.; Kumar, L.; Sinha, P. Mapping and Modelling Spatial Variation in Soil Salinity in the Al Hassa Oasis Based on Remote Sensing Indicators and Regression Techniques. Remote Sens. 2014, 6, 1137–1157. [Google Scholar] [CrossRef]
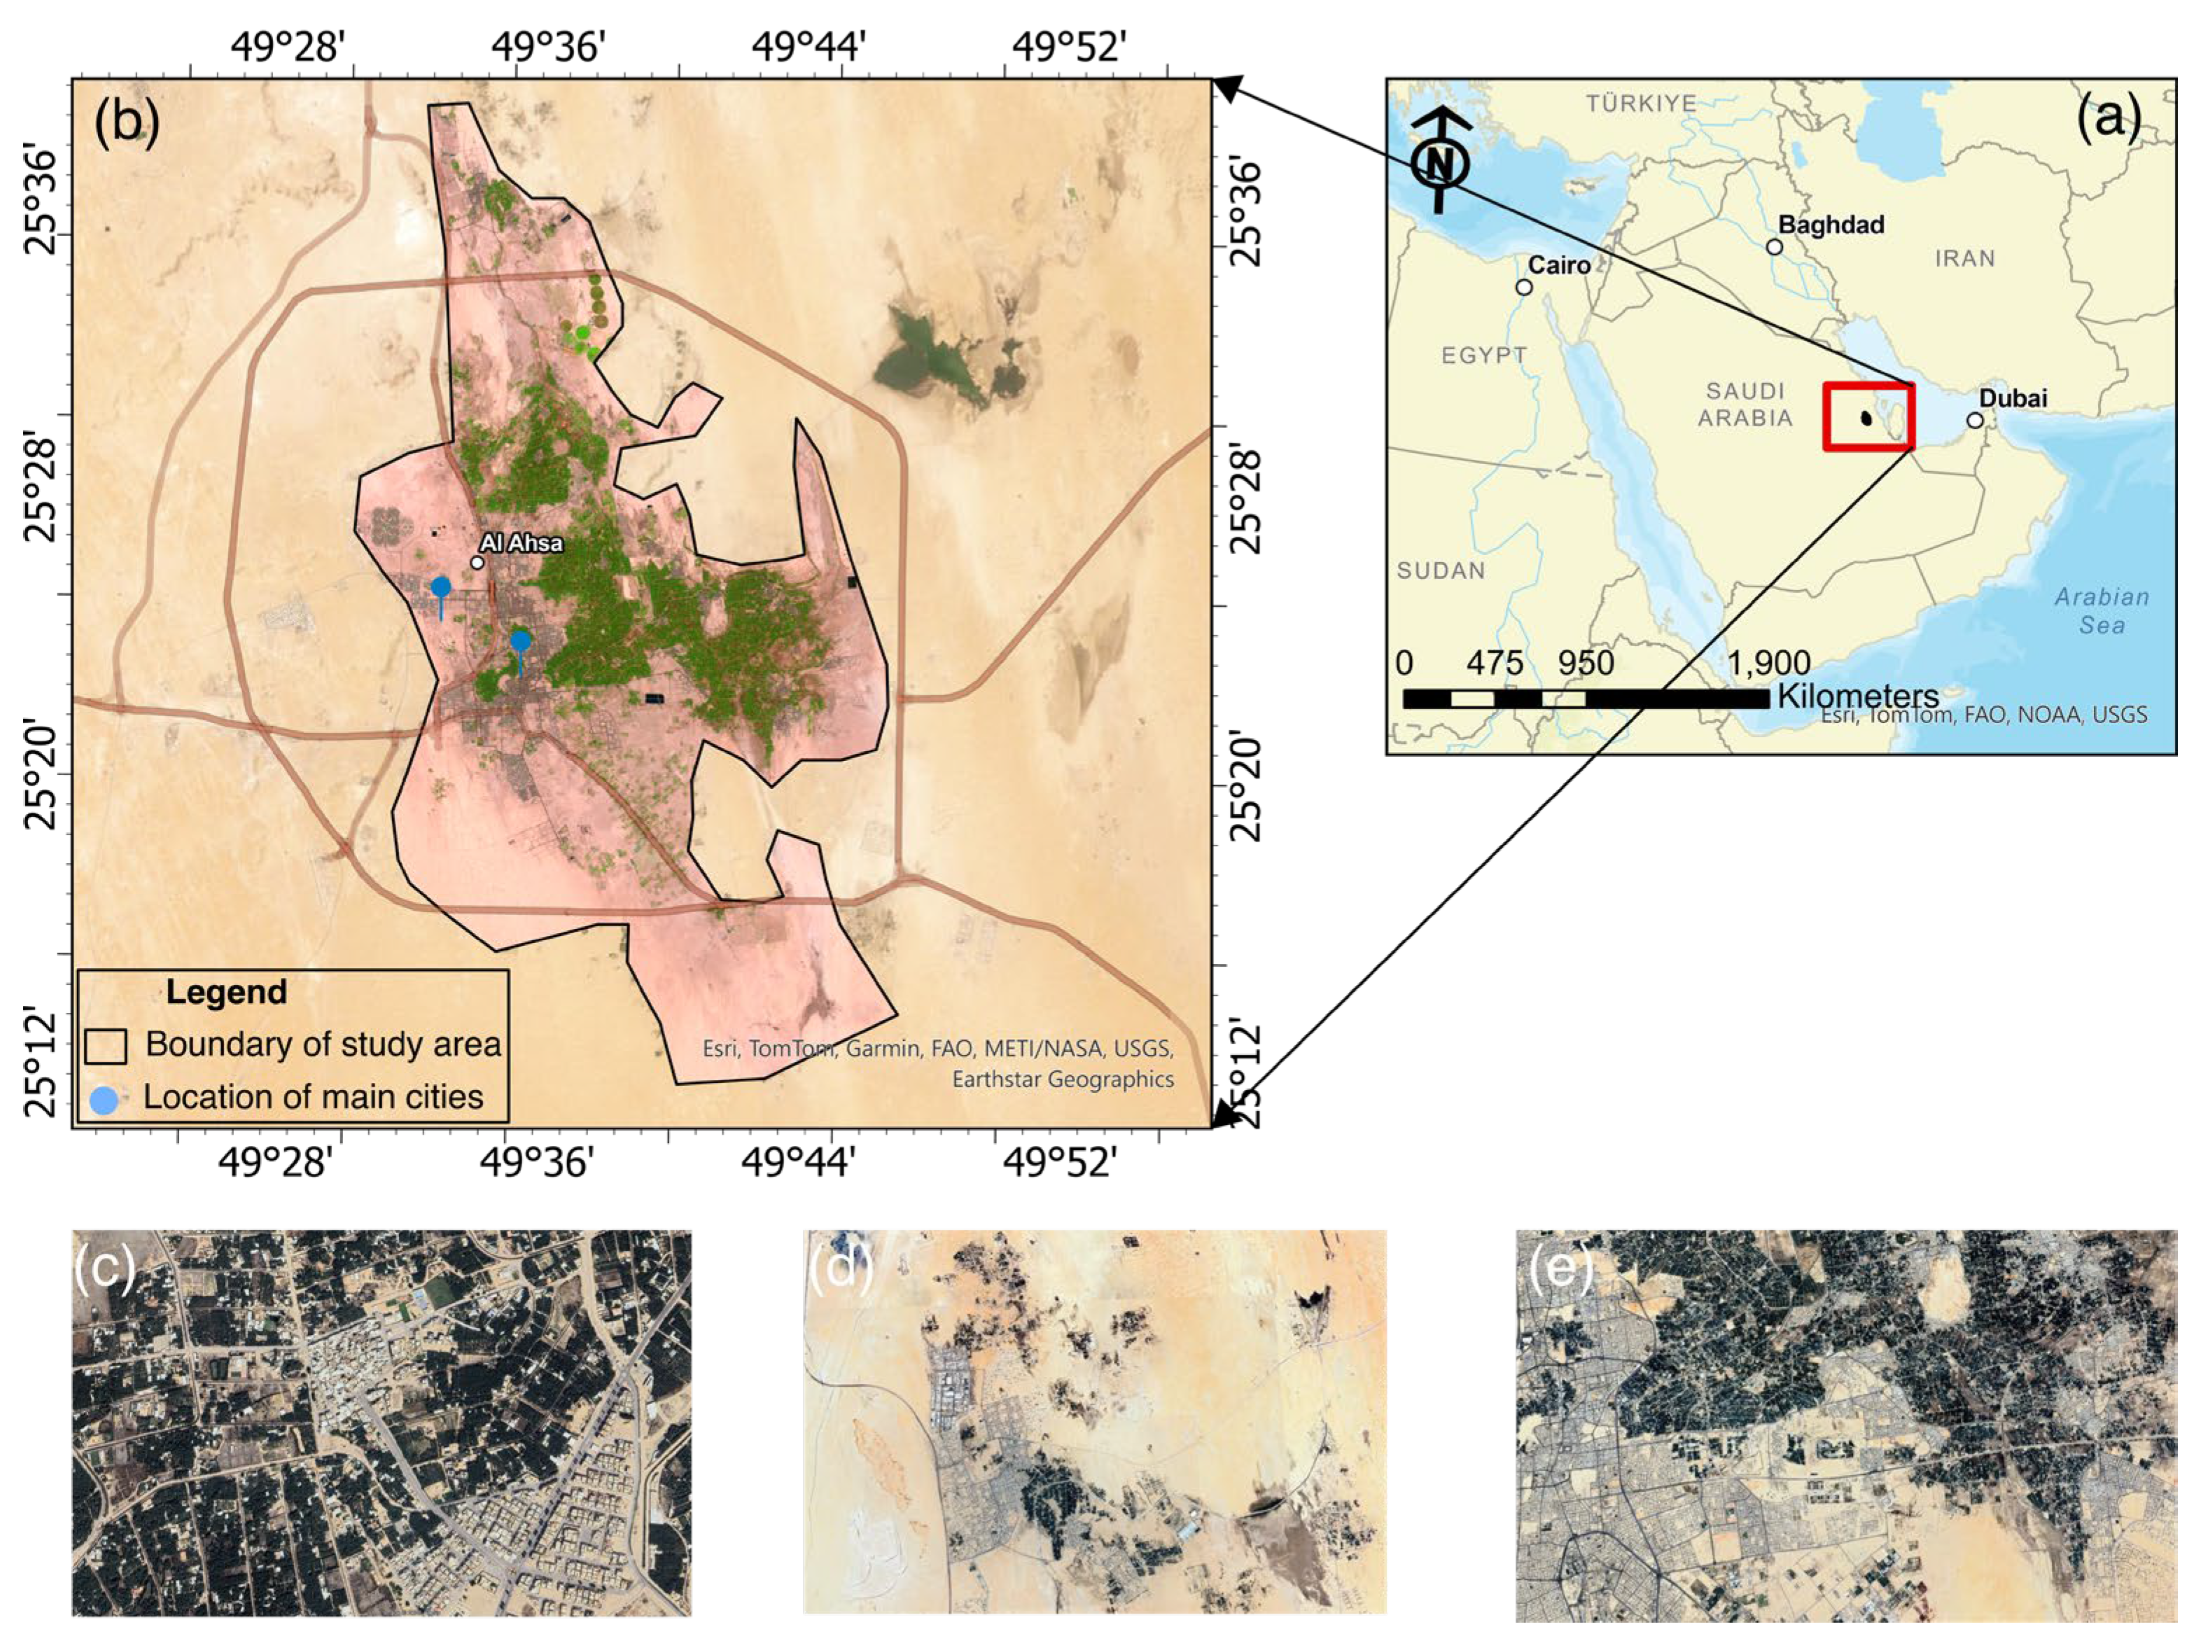
Figure 1. (a) Study area location in the eastern region of Saudi Arabia. (b) A 1990 Landsat TM (bands 4-3-2) false-color composite depicting land use/cover characteristics of Al-Ahsa Oasis. (ce) Aerial views show different parts of the oasis where urban development is occurring and affecting the extent of palm trees. Images by Google Earth Pro V 7.3.6; 21 December 2024.
Agriculture 15 02043 g001
Figure 2. Flowchart of the applied methodology framework for assessing the potential alterations of the Al-Ahsa Oasis agroecosystem.
Agriculture 15 02043 g002
Figure 3. Views of the linear plots used for the selection and extraction of endmembers are shown in (a) for TM1990, (b) for ETM+ 2000, (c) for 2010, and (d) for OLI 2020. The process was carried out using PC2 and PC3, along with their spectral signatures of the three endmembers selected for the purpose of this study. On the sub-figures on the right, the “x-axis” shows Landsat wavelength of TM, ETM+, and OLI bands (i.e., 1–5 and 7), while the three primary shades in the left subfigures indicate the spectral positions of the selected endmembers (training data), where the red color refers to the urban endmember (UR), the green color refers to vegetation endmember (VC) and the blue color refers to the bare land and/or sand endmember (BL).
Agriculture 15 02043 g003
Figure 4. Vegetation cover patterns from 1990 to 2020 using NDVI. (a) Vegetation cover during 1990, (b) vegetation cover during 2000, (c) vegetation cover during 2010, and (d) vegetation cover during 2020.
Agriculture 15 02043 g004
Figure 5. Vegetation fractions during the time period from (a)1990, (b) 2000, (c) 2010, and (d) 2020.
Agriculture 15 02043 g005
Figure 6. Area percentage of the (a) urban fractions and (b) vegetation fractions, calculated by using the SMA model as illustrated in Section 3.3 in the Method section, throughout the period from 1990 to 2020. A growth in built-up fractions and a decrease in vegetation fractions are observed during this period.
Agriculture 15 02043 g006
Figure 7. A comparison of the vegetation fractions variation and/or change during the period from 1990 (ad) to 2020 (eh). The dark green color represents a high vegetation fraction.
Agriculture 15 02043 g007
Figure 8. Endmember fraction maps in primary “RGB additive color mixing”, consisting of (a) blue (1990), green (2000), and red (2010) values, and (b) blue (2000), green (2010), and red (2020) values.
Agriculture 15 02043 g008
Figure 9. Illustrations of high and low SMA mapping errors of vegetation fractions over the study area. (a) RMS error in 1990, (b) 2000, (c) 2010, and (d) 2020. The “bright cells” denote an extreme error, whereas the “dark cells” denote a small error. The yellow frames indicate the location of the subfigures on the right of each main figure.
Agriculture 15 02043 g009
Figure 10. Urban fractions during the time period from (a) 1990, (b) 2000, (c) 2010, and (d) 2020.
Agriculture 15 02043 g010
Figure 11. A comparison between the urban fractions’ variations and/or changes during the period from 1990 (ae) to 2020 (fj). The dark red pixels indicate an increase in urban fraction, while the bright pixels show other land cover features (e.g., vegetation and bare soil or sand).
Agriculture 15 02043 g011
Figure 12. The correlation amongst urban fractions and vegetation fractions changes in: (a) 1990 to 2000, (b) 2000 to 2010, (c) 2010 to 2020, and (d) 1990 to 2020 change periods.
Agriculture 15 02043 g012
Figure 13. The impact of variations in vegetation fractions on the agroecosystem in the Oasis area. The only cultivar of Phoenix dactylifera that had high production was Khalas (10,33,890 kg/ha). Data for date palm yields (n = 17,693 palm trees) are from Alkhaldi et al. [18]. According to the data source [18], the data was collected and calculated during the 2020 field survey.
Agriculture 15 02043 g013
Table 1. The spatial and temporal characteristics of the used images.
Acquisition DateSensor/SourceSatelliteNo. of BandsSpatial Resolution (m)
15 July 1990TMLandsat 56 (optical), 1 (thermal)30 m (optical),
120 m (thermal)
2 July 2000ETM+Landsat 76 (optical), 2 (thermal)
14 July 2010ETM+Landsat 76 (optical), 2 (thermal)
17 July 2020OLI and TIRSLandsat 88 (optical), 2 (thermal)30 m (optical),
100 m (thermal)
10 February 2025Google Earth ProGeoEye-1RGB1 m
10 July 2015 and 19 July 2020MSISentinel 2A1 (coastal aerosol), 3 (red edge), and 7 (optical)10–60 m
Table 2. RMS residual errors for endmember fractions for endmember fractions images in the SMA model used.
TimesRMS Residual Value (%)
19900.048
20000.044
20100.051
20200.035
Table 3. SMA performance results for vegetation and built-up fractions extracted from Landsat imagery: PA (Producer’s accuracy), UA (user’s accuracy), and OA (overall accuracy).
1990200020102020
UA%PA%UA%PA%UA%PA%UA%PA%
Vegetation Fractions98.610098.697.297.2698.6197.30100
Urban fractions10098.610098.698.5997.2210097.22
Overall Accuracy (OA)0.9920.9790.9790.986
Table 4. Data on population growth and rates in the Oasis from 1992 to 2016. (Source: The General Authority for Statistics [16]).
YearPopulation TotalRate of Increase (%)
1992444,9700
2004572,90828.8
2010660,78814.8
2016768,00016.2
Disclaimer/Publisher’s Note: The statements, opinions and data contained in all publications are solely those of the individual author(s) and contributor(s) and not of MDPI and/or the editor(s). MDPI and/or the editor(s) disclaim responsibility for any injury to people or property resulting from any ideas, methods, instructions or products referred to in the content.