Article

SLW-YOLO: A Hybrid Soybean Parent Phenotypic Consistency Detection Model Based on Deep Learning

1
College of Engineering, Heilongjiang Bayi Agricultural University, Daqing 163319, China
2
Key Laboratory of Hybrid Soybean Breeding of the Ministry of Agriculture and Rural Affairs/Soybean Research Institute, Jilin Academy of Agricultural Sciences (Northeast Agricultural Research Center of China), Changchun 130033, China
*
Authors to whom correspondence should be addressed.
Agriculture 2025, 15(19), 2001; https://doi.org/10.3390/agriculture15192001
Submission received: 9 September 2025 / Revised: 19 September 2025 / Accepted: 22 September 2025 / Published: 25 September 2025
(This article belongs to the Section Artificial Intelligence and Digital Agriculture)

Abstract

During hybrid soybean seed production, the parents’ phenotypic consistency is assessed by breeders to ensure the purity of soybean seeds. Detection traits encompass the hypocotyl, leaf, pubescence, and flower. To achieve the detection of hybrid soybean parents’ phenotypic consistency in the field, a self-propelled image acquisition platform was used to obtain soybean plant image datasets. In this study, the Large Selective Kernel Network (LSKNet) attention mechanism module, the detection layer Small Network (SNet), dedicated to detecting small objects, and the Wise Intersection over Union v3 (WIoU v3) loss function were added into the YOLOv5s network to establish the hybrid soybean parent phenotypic consistency detection model SLW-YOLO. The SLW-YOLO achieved the following: F1 score: 92.3%; mAP: 94.8%; detection speed: 88.3 FPS; and model size: 45.1 MB. Compared to the YOLOv5s model, the SLW-YOLO model exhibited an improvement in F1 score by 6.1% and in mAP by 5.4%. There was a decrease in detection speed by 42.1 FPS, and an increase in model size by 31.4 MB. The parent phenotypic consistency detected by the SLW-YOLO model was 98.9%, consistent with manual evaluation. Therefore, this study demonstrates the potential of using deep learning technology to identify phenotypic consistency in the seed production of large-scale hybrid soybean varieties.

1. Introduction

The exploitation of soybean heterosis is a pivotal approach in enhancing soybean yield per unit area. Researchers at the China Jilin Academy of Agricultural Sciences cultivated ‘HybSoy 1’, which became the first hybrid soybean to receive approval worldwide. Compared with the control variety, this variety increased production by more than 20% and demonstrated advantages of strong disease resistance and excellent quality. The soybean cytoplasmic-nuclear male sterile line is used by breeders to breed soybean hybrids, but maintaining the seed purity of the soybean male sterile line is a significant challenge [1]. Soybean plants with different phenotypic traits were removed to improve the purity during the process of their growth. The phenotypic traits, including leaf shape, as well as the color of the hypocotyl, pubescence, and flower, are identified according to the “Code of practice of cytoplasmic-nuclear interaction male sterile line of hybrid soybean” [2]. Although identification could be done manually, the problem of low efficiency restricts the development of large-scale hybrid soybean breeding and hinders the utilization of soybean heterosis [3]. Therefore, it is very important to achieve the detection of hybrid soybean parents’ phenotypic consistency in the field.
As agricultural modernization progresses, the use of deep learning techniques for crop object detection in complex conditions is becoming more widespread [4]. When detecting hybrid soybean parents’ phenotypic consistency, small-sized traits such as the hypocotyl, pubescence, and flower are difficult to detect, whereas the larger leaf trait is relatively easy to detect. To satisfy the requirements for small-target detection, research progress in flower detection in agriculture was analyzed to serve as a reference for establishing a hybrid soybean parent phenotypic consistency detection model utilizing deep learning technology. Specifically, Wei et al. established a coffee flower detection model based on VggNet, achieving an F1 score of 0.80 and demonstrating good detection performance [5]. Coffee flowers are easier to identify due to their clustering above the plant canopy, whereas soybean flowers grow beneath the canopy. Jiang et al. constructed a model for identifying and tallying cotton flowers utilizing the Faster R-CNN framework, and the model R2 was 0.88 [6]. But cotton flowers are larger and easier to identify than soybean flowers. Zhang et al. established an improved YOLOv5 model to identify apple flowers of different sizes, achieving the mAPs of 83.94%, 97.42%, and 97.45% for small, medium, and large apple flowers, respectively [7]. Diverse image preprocessing techniques were applied to enrich the dataset, mitigating issues such as instability, non-convergence, and overfitting, especially when faced with limited sample sizes. The research proves that the same model has various detection results for objects of different sizes. Furthermore, when the image datasets are insufficient, data augmentation methods could be effectively employed to expand the datasets. Li et al. applied different YOLO models to detect kiwifruit flowers [8]. The mAP and detection speeds of the YOLOv4 model were 96.66% and 25.88 FPS, while those of the YOLOv3 model were 96.49% and 19.84 ms/frame. For the same image datasets, different models yielded varied detection outcomes. Gong et al. also carried out a study on kiwifruit flower detection, evaluating the performance of SSD, YOLOv4, and YOLOv5 models [9]. The YOLOv5 model exhibited superior detection capabilities, achieving an mAP of 89.90% and a detection speed of 26.44 FPS (NVIDIA GeForce RTX 3060Ti GPU, NVIDIA Corp., Santa Clara, CA, USA). Compared to the research by Li et al. [8], differences were observed in the detection results obtained by the two studies, and could be attributed to the utilization of distinct datasets and training platforms. Furthermore, based on the YOLOv5 model, Gong et al. [9] added the C3HB module and criss-cross attention mechanism (CCA), boosting its capacity for feature extraction and refining the detection accuracy for kiwifruit flowers. It is evident that changing the model’s architecture is one of the effective strategies for improving its detection performance. The above research shows that deep learning technology is widely used in agricultural flower detection, and has achieved good detection results.
Wang et al. introduced a refined model of YOLOv4 to detect pear flowers [10]. The YOLOv4’s foundational architecture was substituted with ShuffleNetv2, which incorporates the SENet (Squeeze-and-Excitation) module. The YOLO-PEFL model exhibited improvements over the YOLOv4 model, with an average accuracy boost of 1.76%, a 0.009 s faster detection time, and a model size reduction of 202.6 MB. Shang et al. established a detection model for apple flowers utilizing the YOLOv5s network [11]. The YOLOv5s Backbone architecture was substituted with ShuffleNetv2, while the Neck architecture’s Conv module was exchanged for the Ghost module. The improved model achieved an mAP of 91.80%, a detection speed of 86.21 FPS (NVIDIA GeForce RTX 3070Ti GPU, NVIDIA Corp., Santa Clara, CA, USA), and a model size of 0.61 MB. When compared to the YOLOv5s model, this new model showed a 2.4% drop in mAP, but a 54.66 FPS boost in detection speed and a 13.09 MB decrease in model size. For the purpose of achieving a faster detection speed, the authors did not opt for the highest precision model, thus showing the need to consider different detection metrics in selecting the optimal model. Zhao et al. proposed a CR-YOLOv5s model to recognize chrysanthemums [12]. The YOLOv5s model incorporated a coordinate attention module, enabling the network to focus on the target more effectively, leading to enhancements in detection precision and stability. The average accuracy of CR-YOLOv5s was 93.9%, which was higher than that of YOLOv5s by 4.5%. The incorporation of an attention mechanism module enhanced recognition accuracy in complex image backgrounds. Research by the aforementioned scholars indicates that the detection model could be improved by introducing an attention mechanism and altering the network structure for better detection performance.
For the study of soybean flower detection, Omura et al. built a soybean flower detection model based on SSD, achieving an F1 score of 0.646 in their study [13]. The feasibility of using deep learning technology for soybean flower detection had been demonstrated. Pratama et al. utilized the Cascade R-CNN framework to conduct detection research on soybean flowers and pods, achieving an average accuracy of 89.6% [14]. However, the amount of data used was substantial, with 12,659 original images for training and testing. Zhu et al. established a soybean flower and pod counting model using a Faster R-CNN network, resulting in a precision of 94.36% for flower detection and a speed of 17 FPS (NVIDIA Titan XP GPU, NVIDIA Corp., Santa Clara, CA, USA) [15]. While the model exhibited higher accuracy in detection, its detection speed was insufficient for real-time detection tasks. Yue et al. introduced the CBAM attention mechanism into YOLOv5’s network to detect the growth state of soybean flowers, and improved the initial detection anchor size [16]. The optimized model’s mAP was 93.5%, representing a 3.4% improvement over the YOLOv5 model. But the model’s detection speed, at 10.75 FPS (NVIDIA Tesla K40c, NVIDIA Corp., Santa Clara, CA, USA), was slow, which may be attributed to factors such as the specific platform and image size used by the authors. Liu et al. developed a model for identifying soybean flower color using YOLOv5 [17]. In this model, they utilized MobileNetv2 as the new Backbone network and integrated the ECANet attention mechanism. The improved model achieved an mAP of 96.13% and a processing speed of 79 FPS (Qualcomm Snapdragon 855 CPU, Qualcomm Incorporated, San Diego, CA, USA). In contrast to the YOLOv5 model, the detection speed was increased by 12 FPS, but the mAP was slightly decreased. Given that the flower target occupies a large proportion of the image and the image data quality is better, the model demonstrates high detection performance under these conditions. Zhao et al. constructed YOLOv8-VEW, a detection model specifically for soybean flowers and pods in the field, utilizing the YOLOv8n framework [18]. In their study, VanillaNet served as the Backbone network, the C2f model integrated the EMA attention mechanism, and the CIoU function was substituted by the WIoU loss function. The YOLOv8-VEW model surpassed the YOLOv8n model with an mAP of 96.9% and a detection speed of 90 FPS (NVIDIA GeForce RTX 4090 GPU, NVIDIA Corp., Santa Clara, CA, USA), marking improvements of 2.4% in mAP and 24 FPS in detection speed. Compared to Liu et al.’s [17] research, the flower targets exhibited a similarly large size, owing to the proximity of the image sensor to the target during data acquisition. Different models in soybean flower detection have been compared by most scholars, and the YOLO object detection model exhibited superior accuracy and quicker detection speed. Meanwhile, the YOLO model demonstrated good performance in multi-target detection, which could provide a reference for the detection of different hybrid soybean phenotypic traits.
To realize the detection of hybrid soybean parents’ phenotypic consistency in the field, soybean plants growing naturally in the field were taken as the research object, and soybean plant image datasets were obtained using a self-propelled image acquisition platform. The hybrid soybean parent phenotypic consistency detection model, SLW-YOLO, was established by adding the LSKNet attention mechanism module, the detection layer SNet, dedicated to detecting small objects, and the WIoU v3 loss function into the YOLOv5s network. This model enables the detection of hybrid soybean hypocotyl color at the seedling stage and leaf shape during the vegetative growth stage, as well as leaf morphology, pubescence color, and flower color during the full flowering stage. This study aimed to identify the hybrid soybean parents’ phenotypic consistency in the field using information technology, and to provide technical support for soybean breeders to carry out hybrid breeding.
The main achievements of this study include the following:
(1)
Based on the YOLOv5s network, the hybrid soybean parent phenotypic consistency detection model, SLW-YOLO, was proposed, which could be used to identify soybean phenotypic traits instead of using manual identification in the field.
(2)
A self-propelled image acquisition platform was designed for acquiring image data from different soybean growth stages in the field, which laid a foundation for the development of a hybrid soybean seed production field off-type plant-cutting robot in the future.

2. Materials and Methods

2.1. Test Site

The hybrid soybean seed production field was located in Gongzhuling City, Jilin Province, China (43°32′30″ N, 124°50′3″ E). The region has an average altitude of 184 m and its climate is characterized by a subtemperate continental monsoon zone. The average annual temperature is 5.60 °C, and the area receives an annual sunshine duration of approximately 2743 h. The frost-free period exceeds 140 d, with an average annual precipitation of 600 mm. The soil of the experimental field is well-fertilized, and the water resources are plentiful, making the conditions conducive to soybean growth. To collect abundant image data and satisfy the phenotypic consistency detection requirement of different soybean varieties, a total of 250 varieties were planted in the experiment. The practice code [2] requires that the cultivation conditions at the identification site should be similar to the production conditions. A single row planting method was employed, with a 0.65 m distance between adjacent rows, and each variety was planted in a 2.00 × 5.20 m plot.

2.2. Data Acquisition Equipment

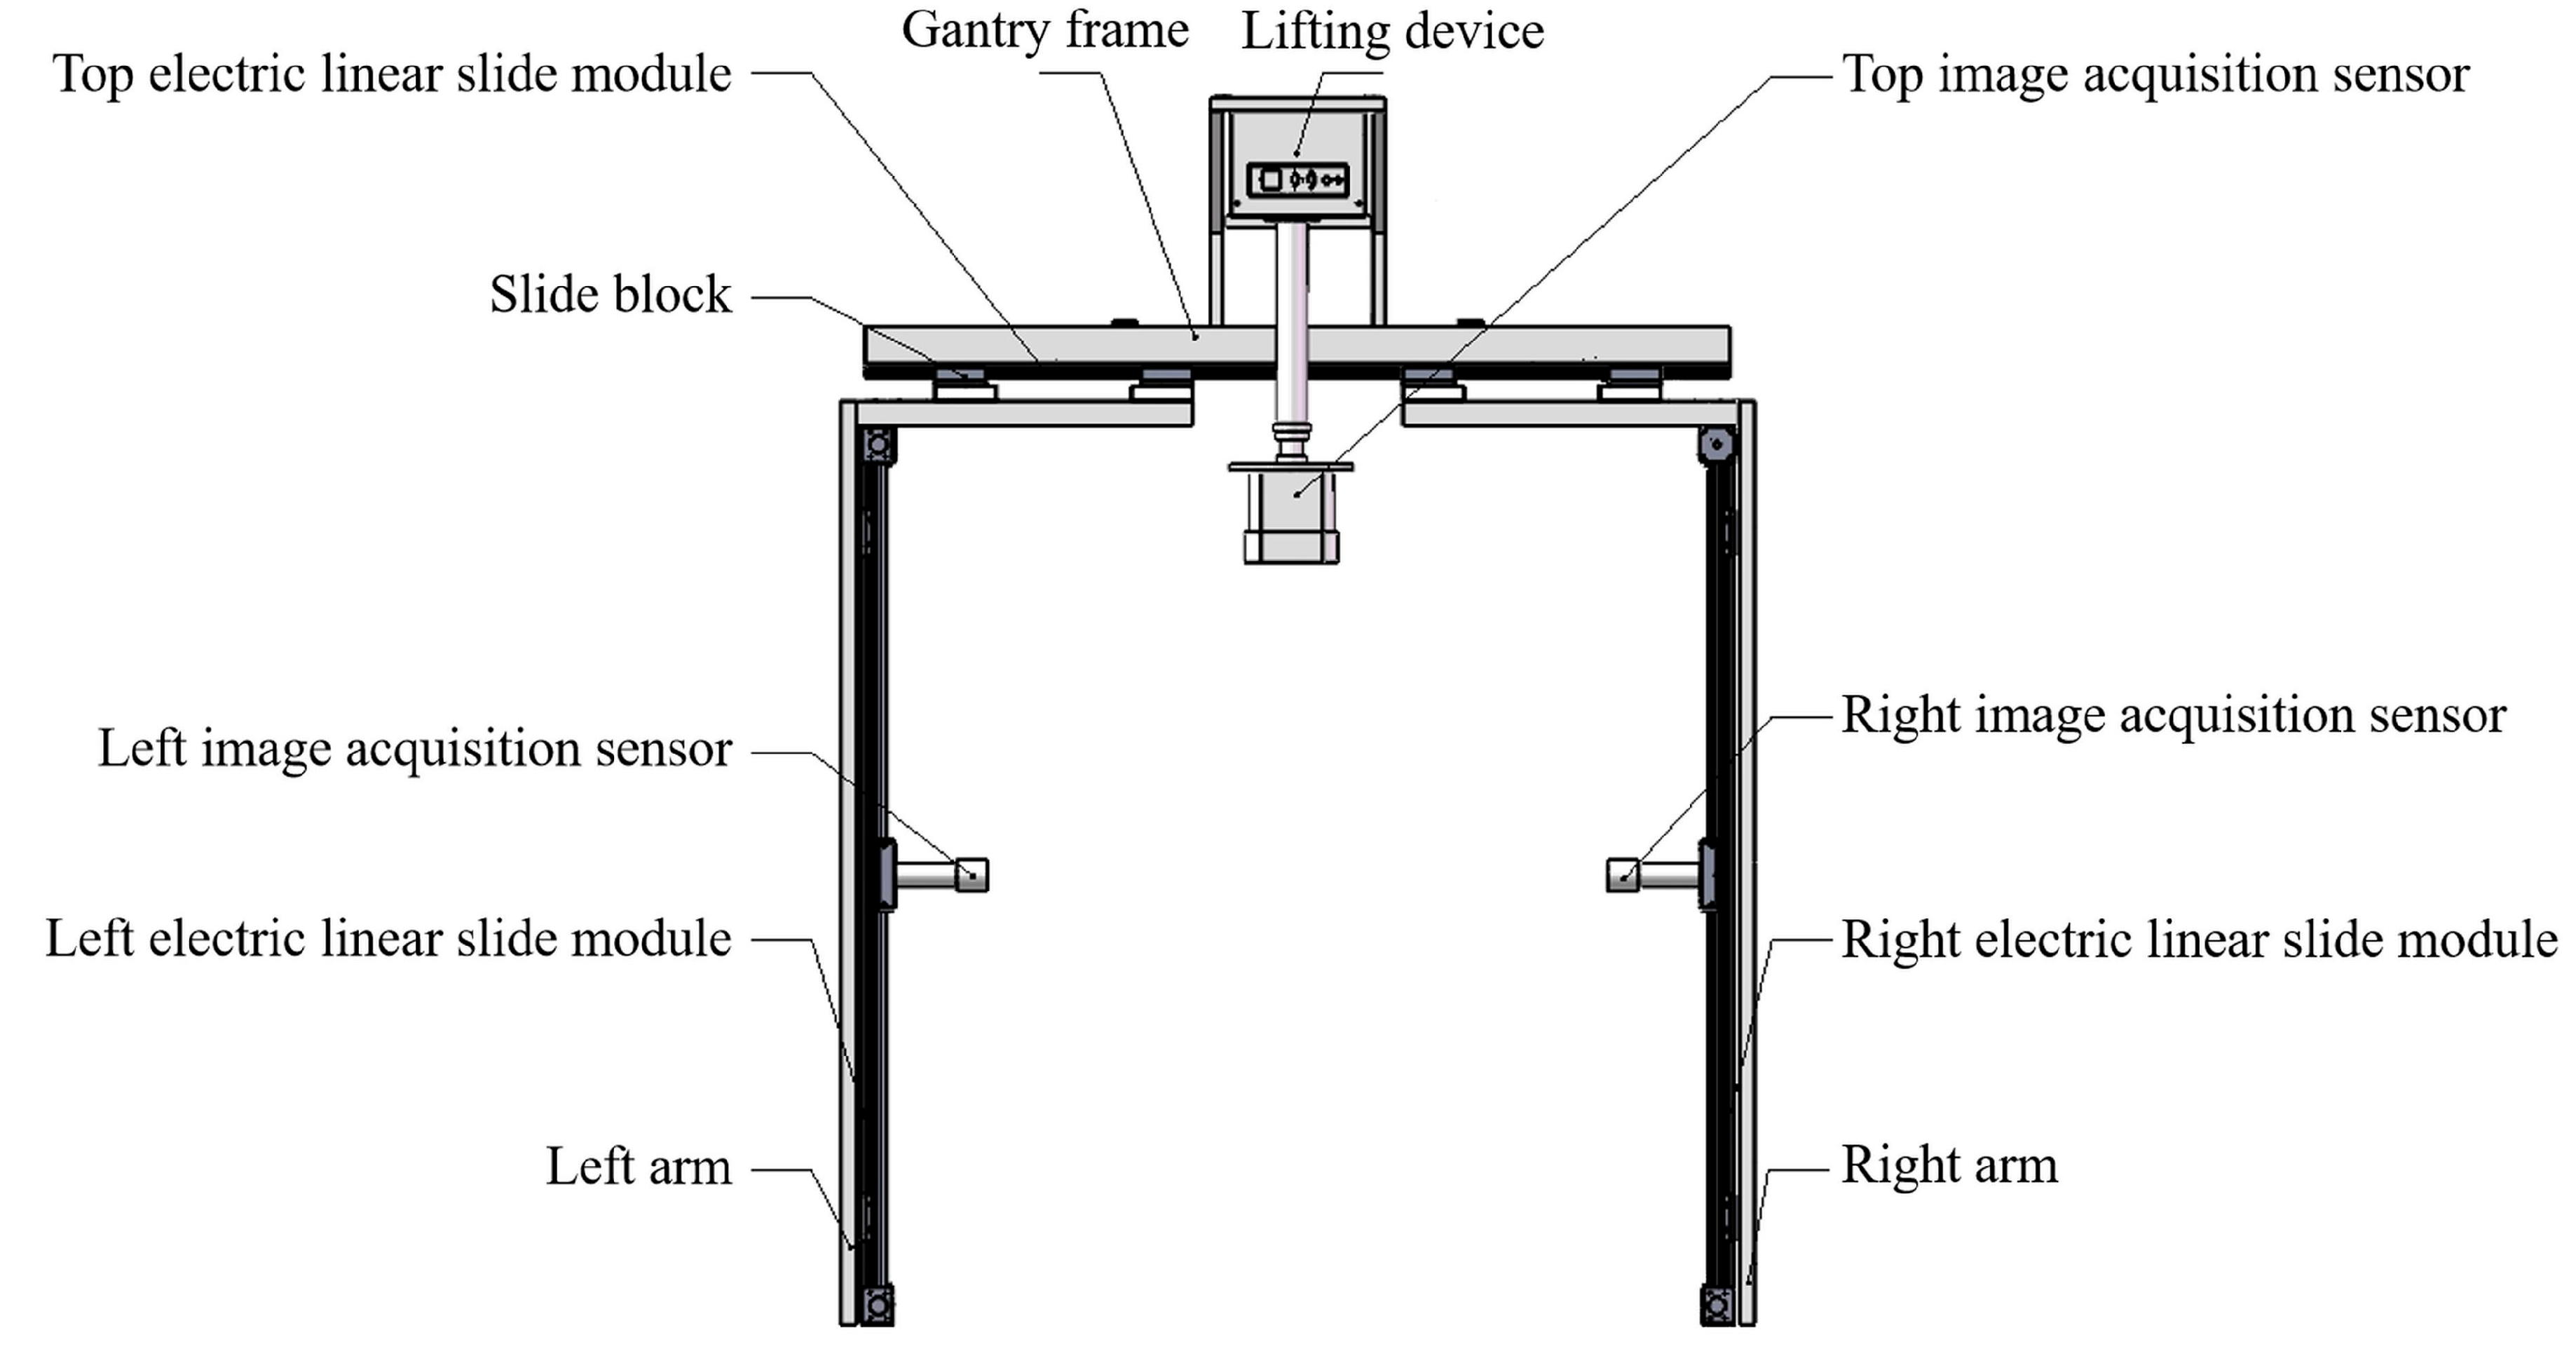
An Azure Kinect DK (Microsoft Corp., Redmond, WA, USA) sensor was installed on the self-propelled image acquisition platform to obtain image data, with a resolution of 1280 × 720 pixels (Figure 1). The platform was designed based on the actual cultivation mode of soybean breeding fields, the morphological characteristics of soybean plants, and the image acquisition requirements. Because the row spacing of the soybean plants was 0.65 m, the wheelbase of the platform was designed to be 1.30 m to ensure operational stability. Regarding the morphological characteristics of soybean growth, soybeans during full flowering could reach a height of 0.80 m [19]. To avoid damaging soybean plants, the platform height was designed to be 1.10 m above the ground, and the platform structure was of a gantry frame type. Image data should be captured from the soybean plant canopy and the areas below it at different growth stages to detect hypocotyls, leaves, pubescences, and flowers. Therefore, the position of the image acquisition sensor needs to be adjusted within the soybean growth area. Three electric linear slide modules (Chengdu Liandong Ruixin Technology Co., Ltd., Chengdu, China) were used to achieve horizontal and vertical movement of the sensor (Figure 2).

2.3. Dataset Construction

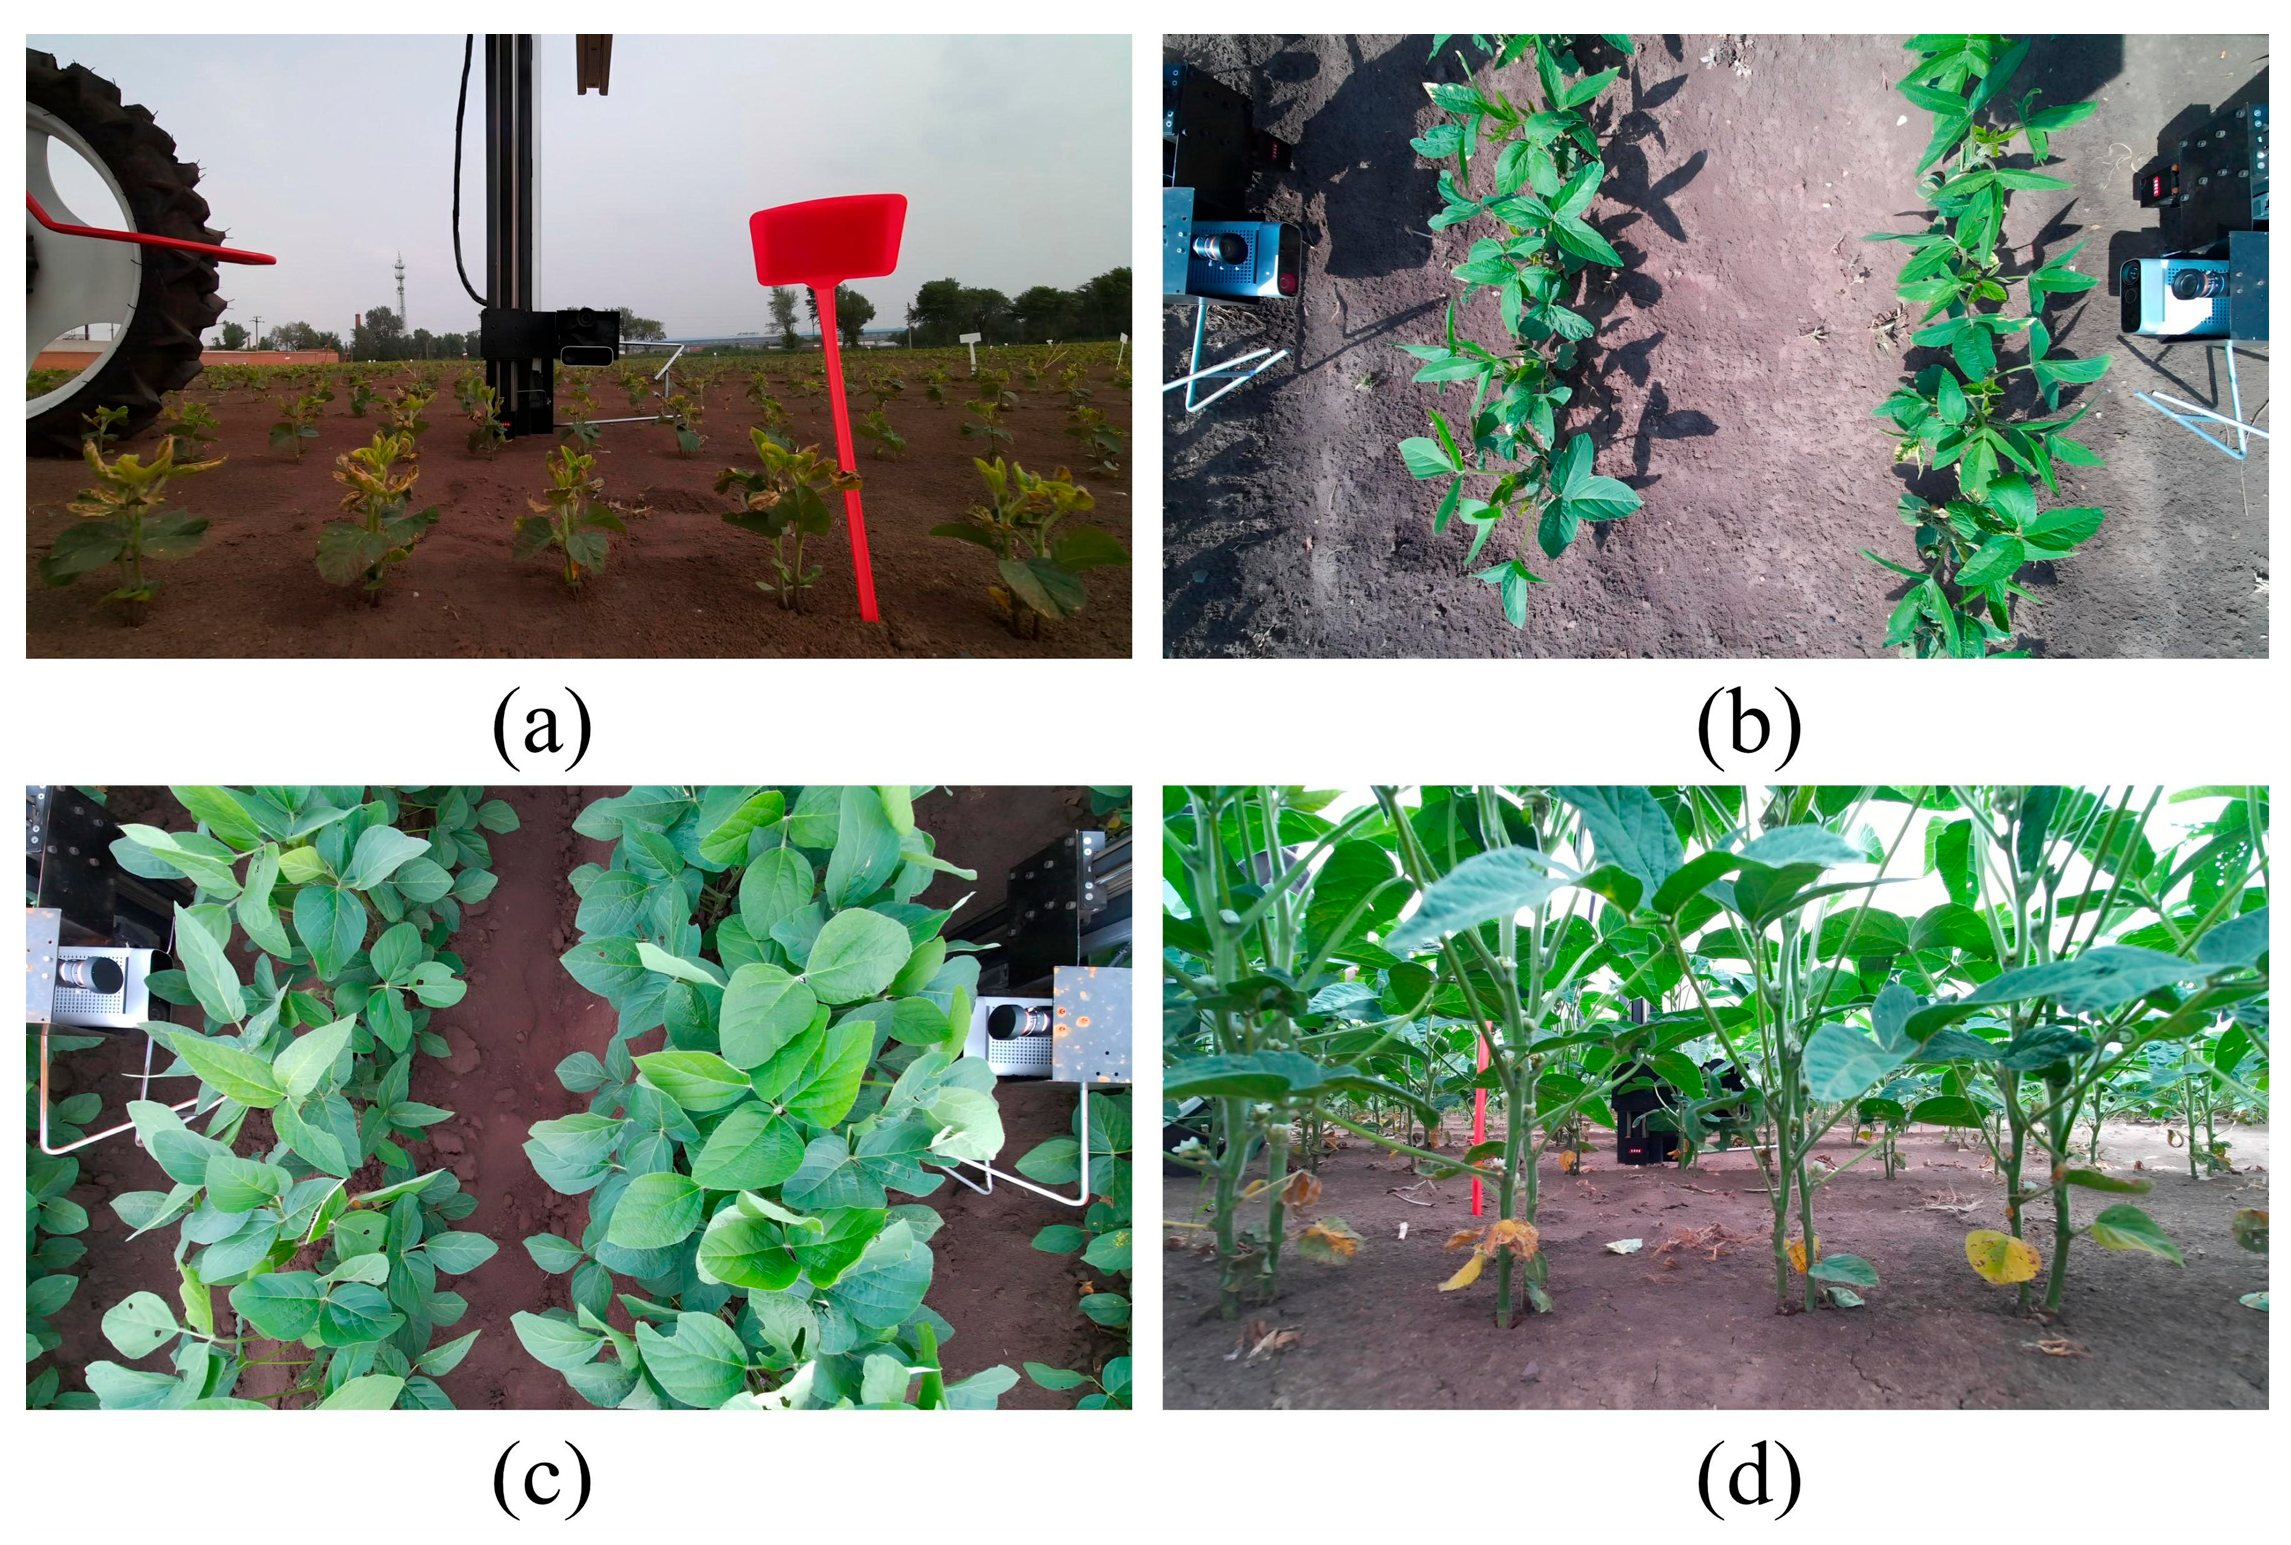
A total of 1500 hypocotyl images (the seedling stage) and 1500 leaf images (the vegetative growth stage), as well as 1500 pubescence images and 1500 flower images (the full flowering stage) were collected, with 4000 images (1000 per trait) selected for model training and the remaining 2000 images (500 per trait) allocated for model validation (Figure 3). Additionally, for model testing, 400 images (100 per trait, including off-type plants) were manually acquired during their respective growth stages. The hypocotyl trait was selected for phenotypic consistency assessment, because each soybean plant had only one hypocotyl structure, facilitating quantitative statistics.
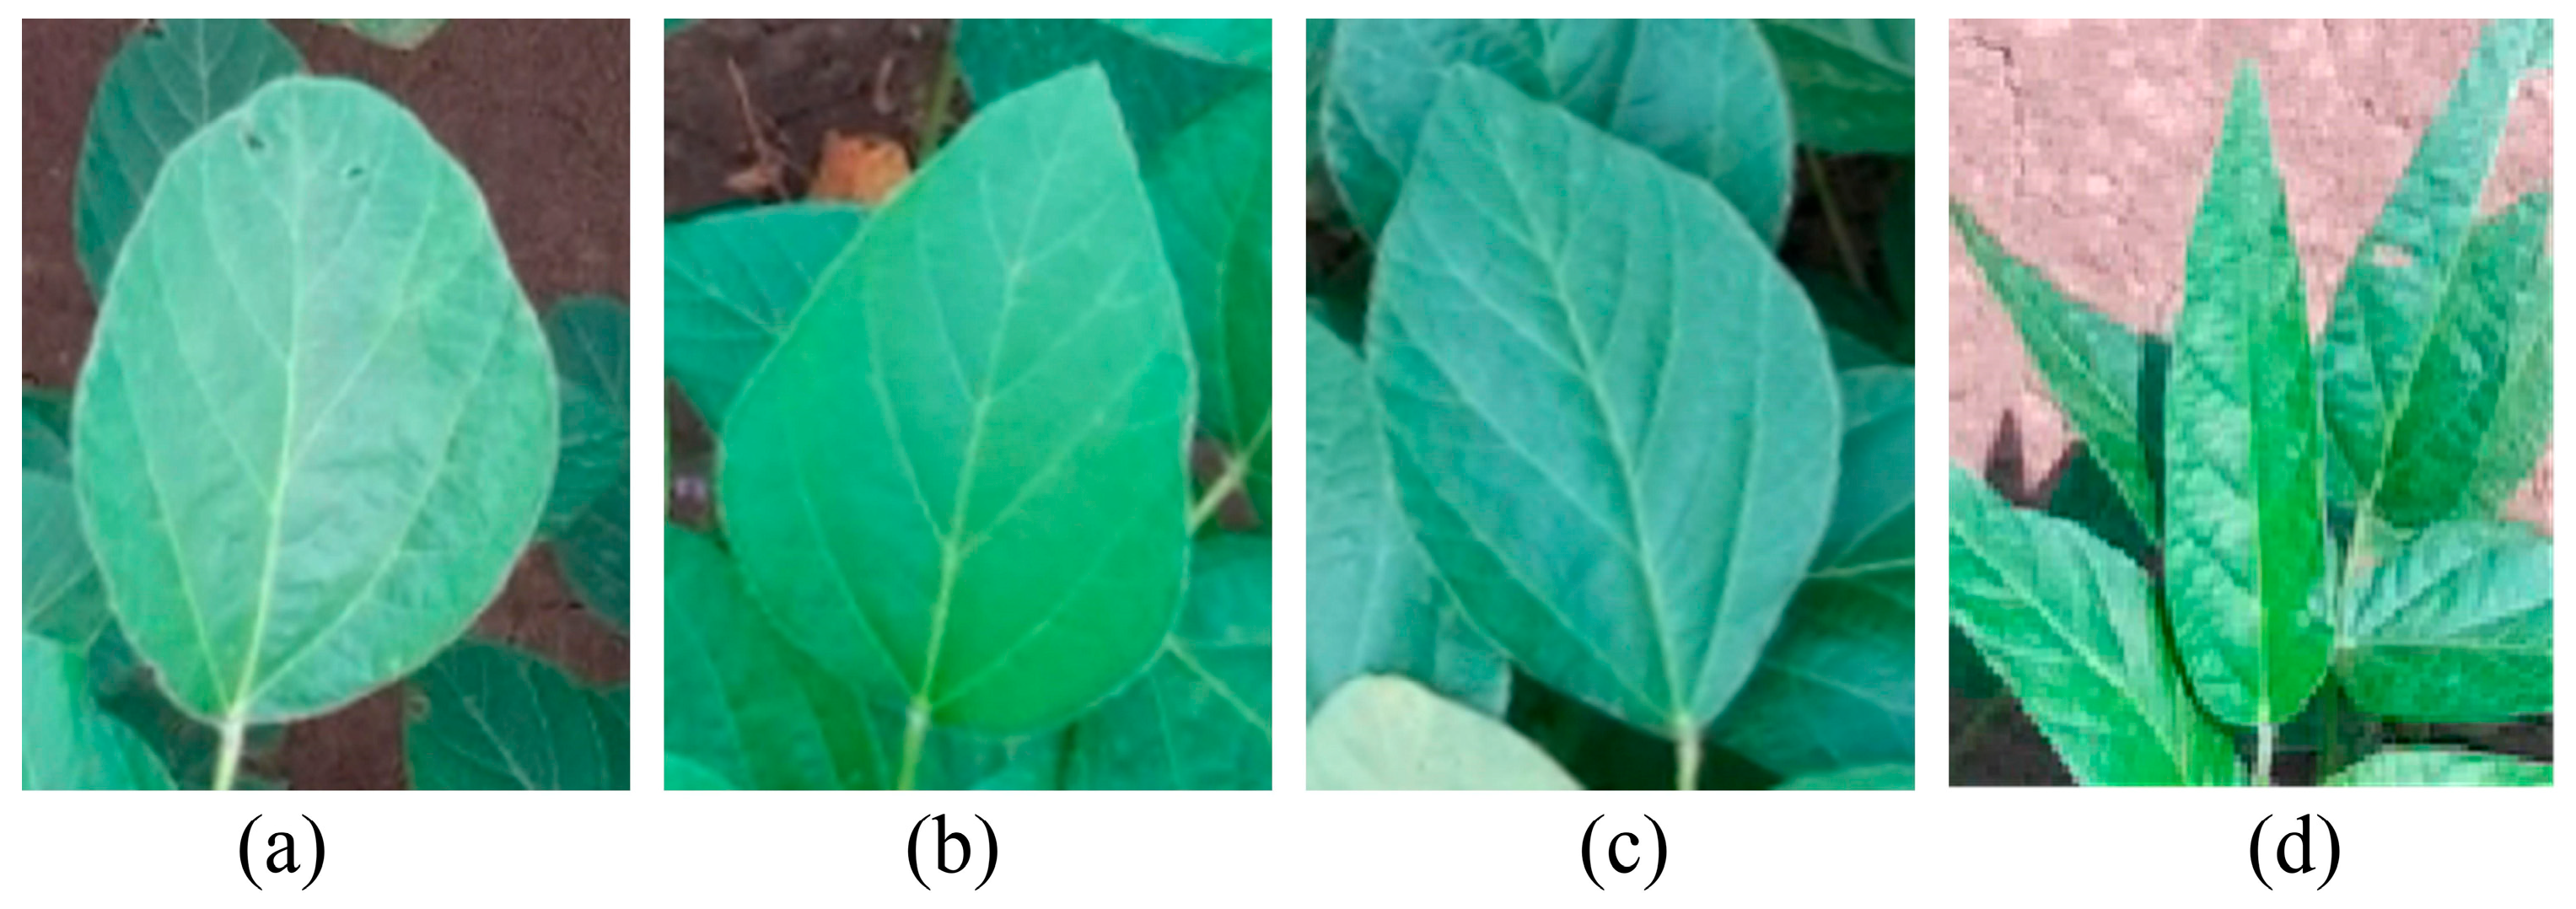
According to the requirements of phenotypic consistency identification, the hypocotyl was classified as purple or green; the leaf as circle or needle; the pubescence as brown or white; and the flower as purple or white [20]. Specifically, round, ovate-round, and elliptical leaves were defined as circle, and lanceolate leaves were defined as needle (Figure 4). The LabelImg 1.8.1 software was utilized to manually annotate the data samples based on the labeling rules to construct the datasets (Figure 5). The observation results for leaf morphology from different views may be misleading because of the varying leaf curvature. Therefore, in the process of leaf labeling, leaves parallel to the ground should be selected. Due to the limited view of the image data and the insufficient feature richness, the training set was augmented from 4000 to 8000 images using image geometry and pixel transformation methods. The augmented training set (8000 images) and validation set (2000 images) were maintained at an 8:2 ratio (Table 1).

2.4. Construction of SLW-YOLO Model

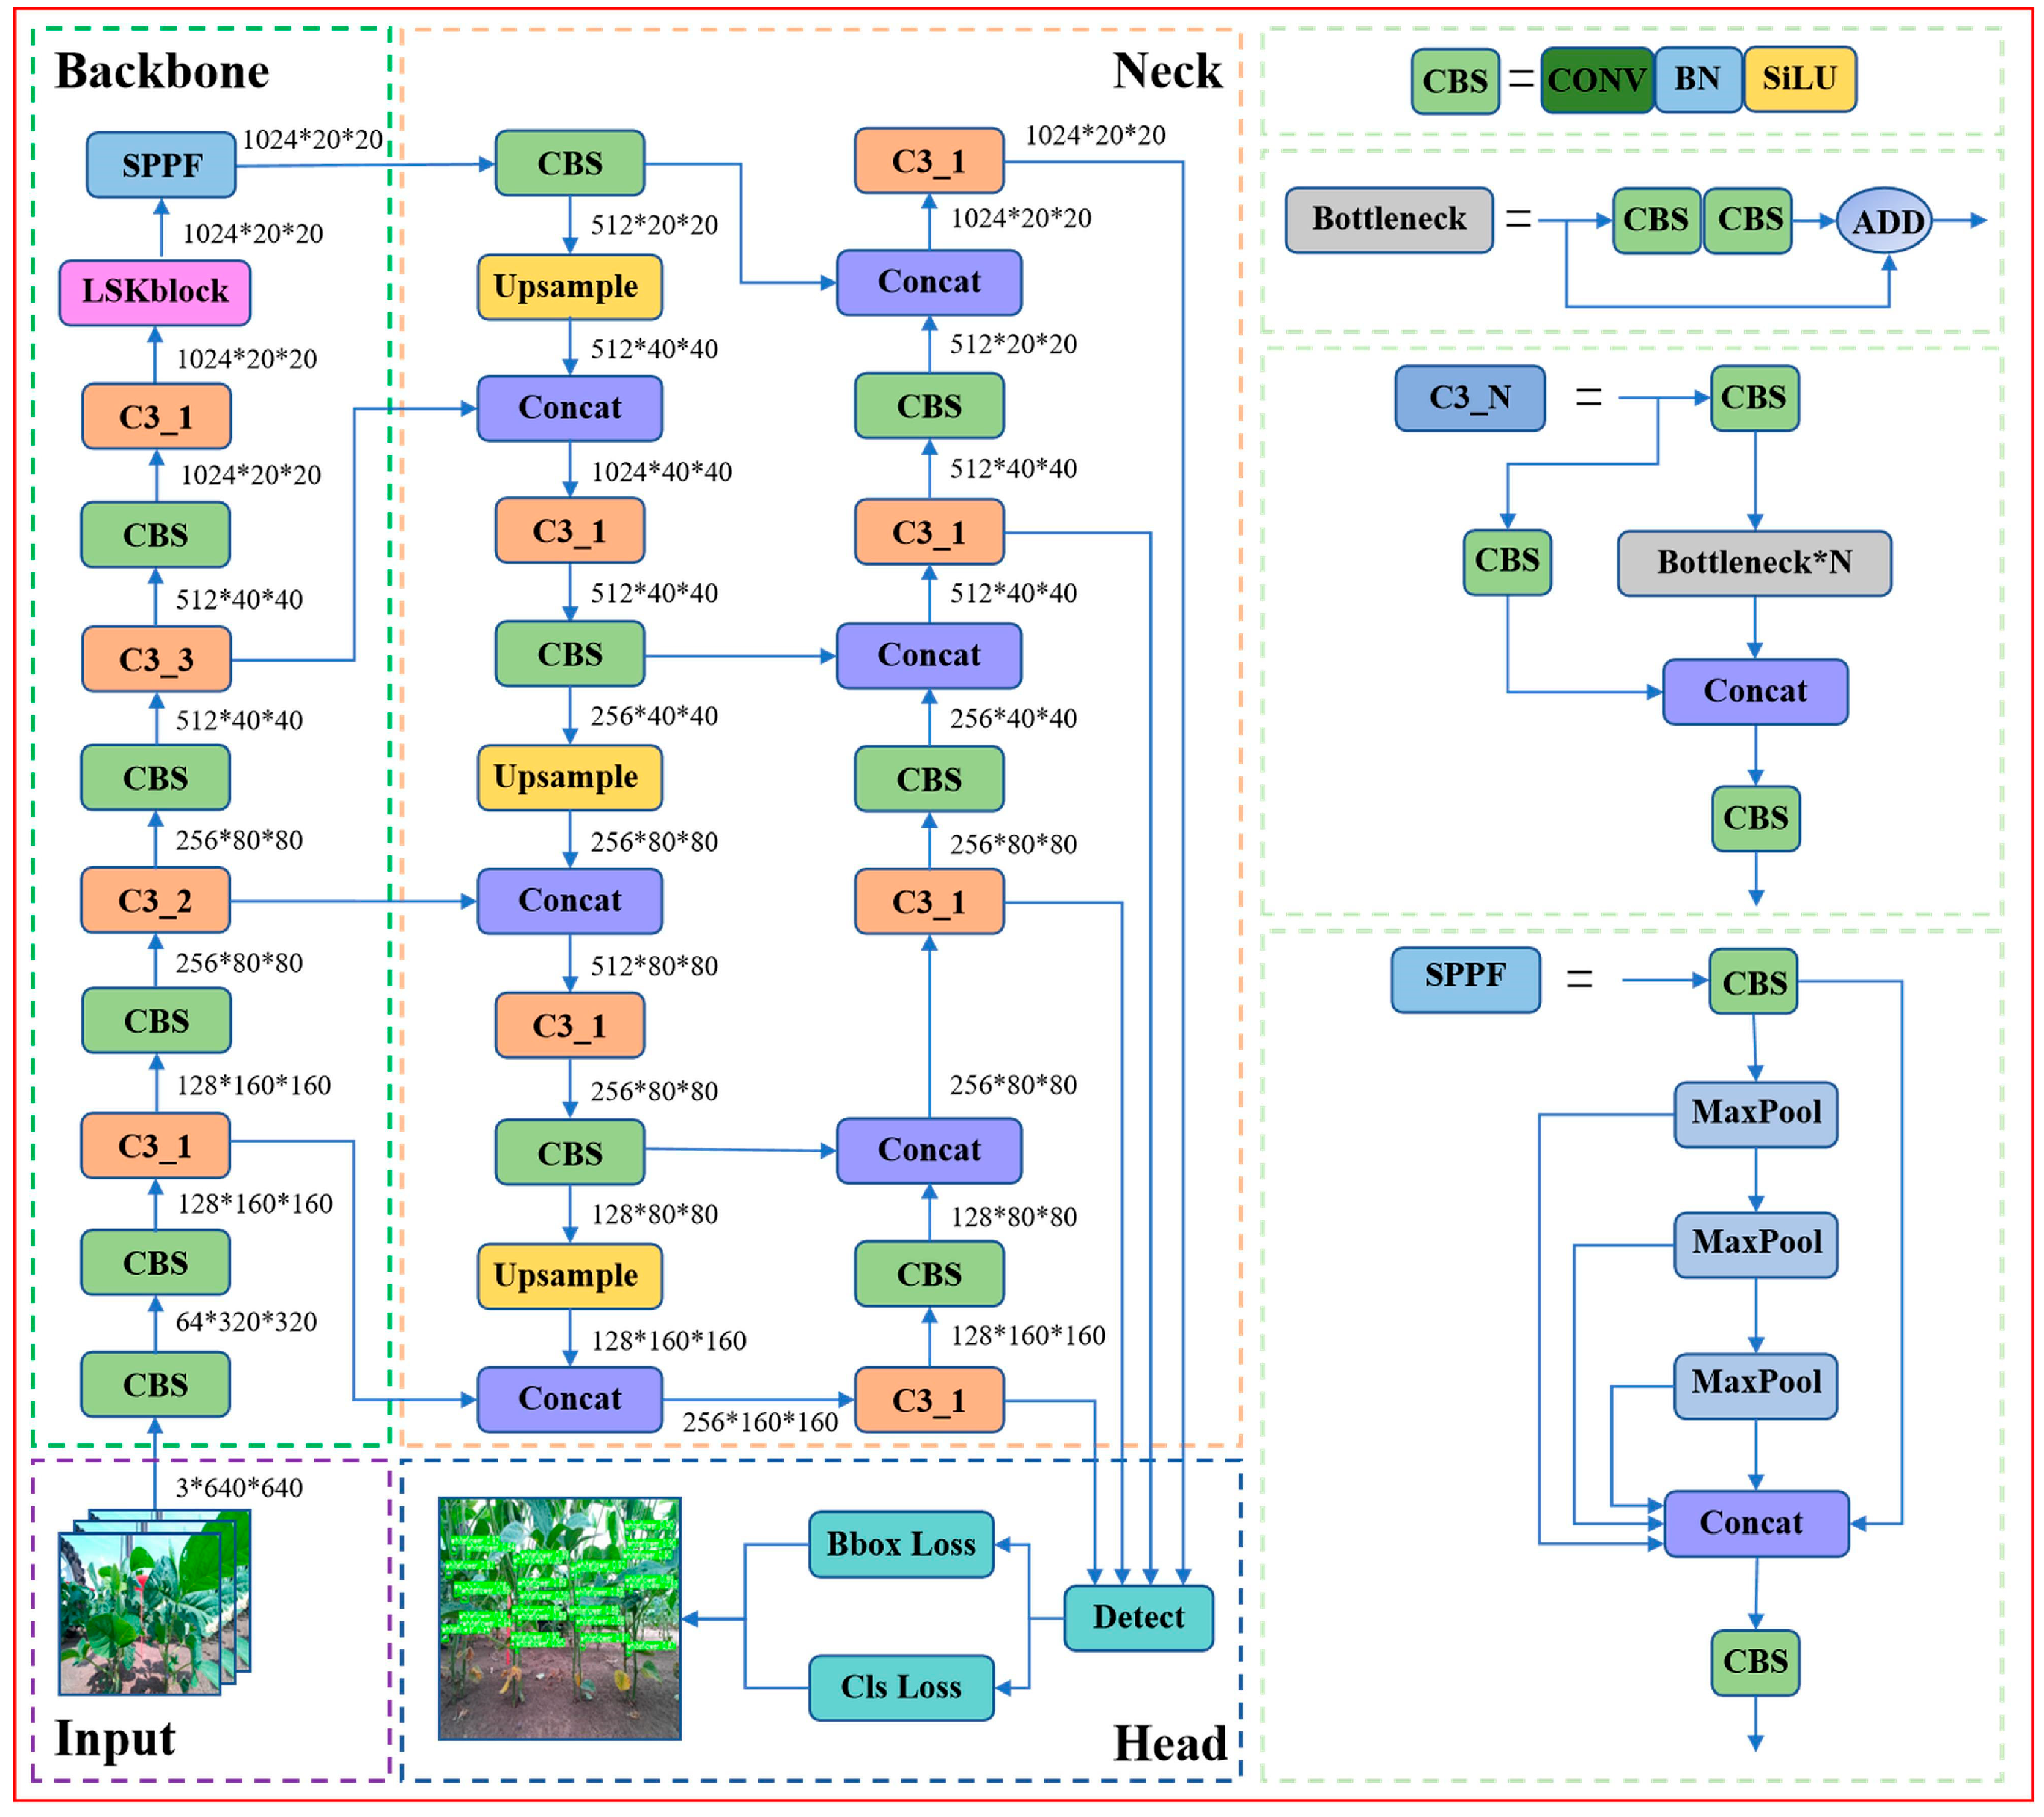
YOLO (You Only Look Once), as a typical single-stage target detection model, is widely used in real-time detection. The YOLOv5s model primarily comprises four parts: Input, Backbone, Neck, and Head layers. Images are preprocessed through the Input layer, and the Backbone layer extracts features of differing dimensions of objects from the processed data. The Neck layer is responsible for combining multi-scale feature maps from the Backbone layer. The Head layer combines the features from the Neck layer to produce bounding boxes and classify objects. The SLW-YOLO model was proposed on the basis of the YOLOv5s network to detect different parents of hybrid soybean phenotypic consistency (Figure 6). With the aim of being applied to hybrid soybean cutting robots in the future, the core idea of the improved algorithm was to enhance the positioning capability and detection accuracy, while ensuring that the network could detect targets. A detection layer SNet specifically dedicated to small objects was added. The LSKNet attention mechanism module was incorporated in the layer preceding the Spatial Pyramid Pooling—Fast (SPPF) module of the Backbone network. The Wise Intersection over Union v3 (WIoU v3) loss function was used to replace the Complete Intersection over Union (CIoU) loss function. These three modules were strategically integrated to form a synergistic solution: LSKNet enhances multi-scale feature extraction; SNet improves detection accuracy for critical small phenotypic features; and WIoU v3 increases localization robustness by adaptively reducing the influence of low-quality samples and complex background interference.

2.4.1. SNet Detection Layer

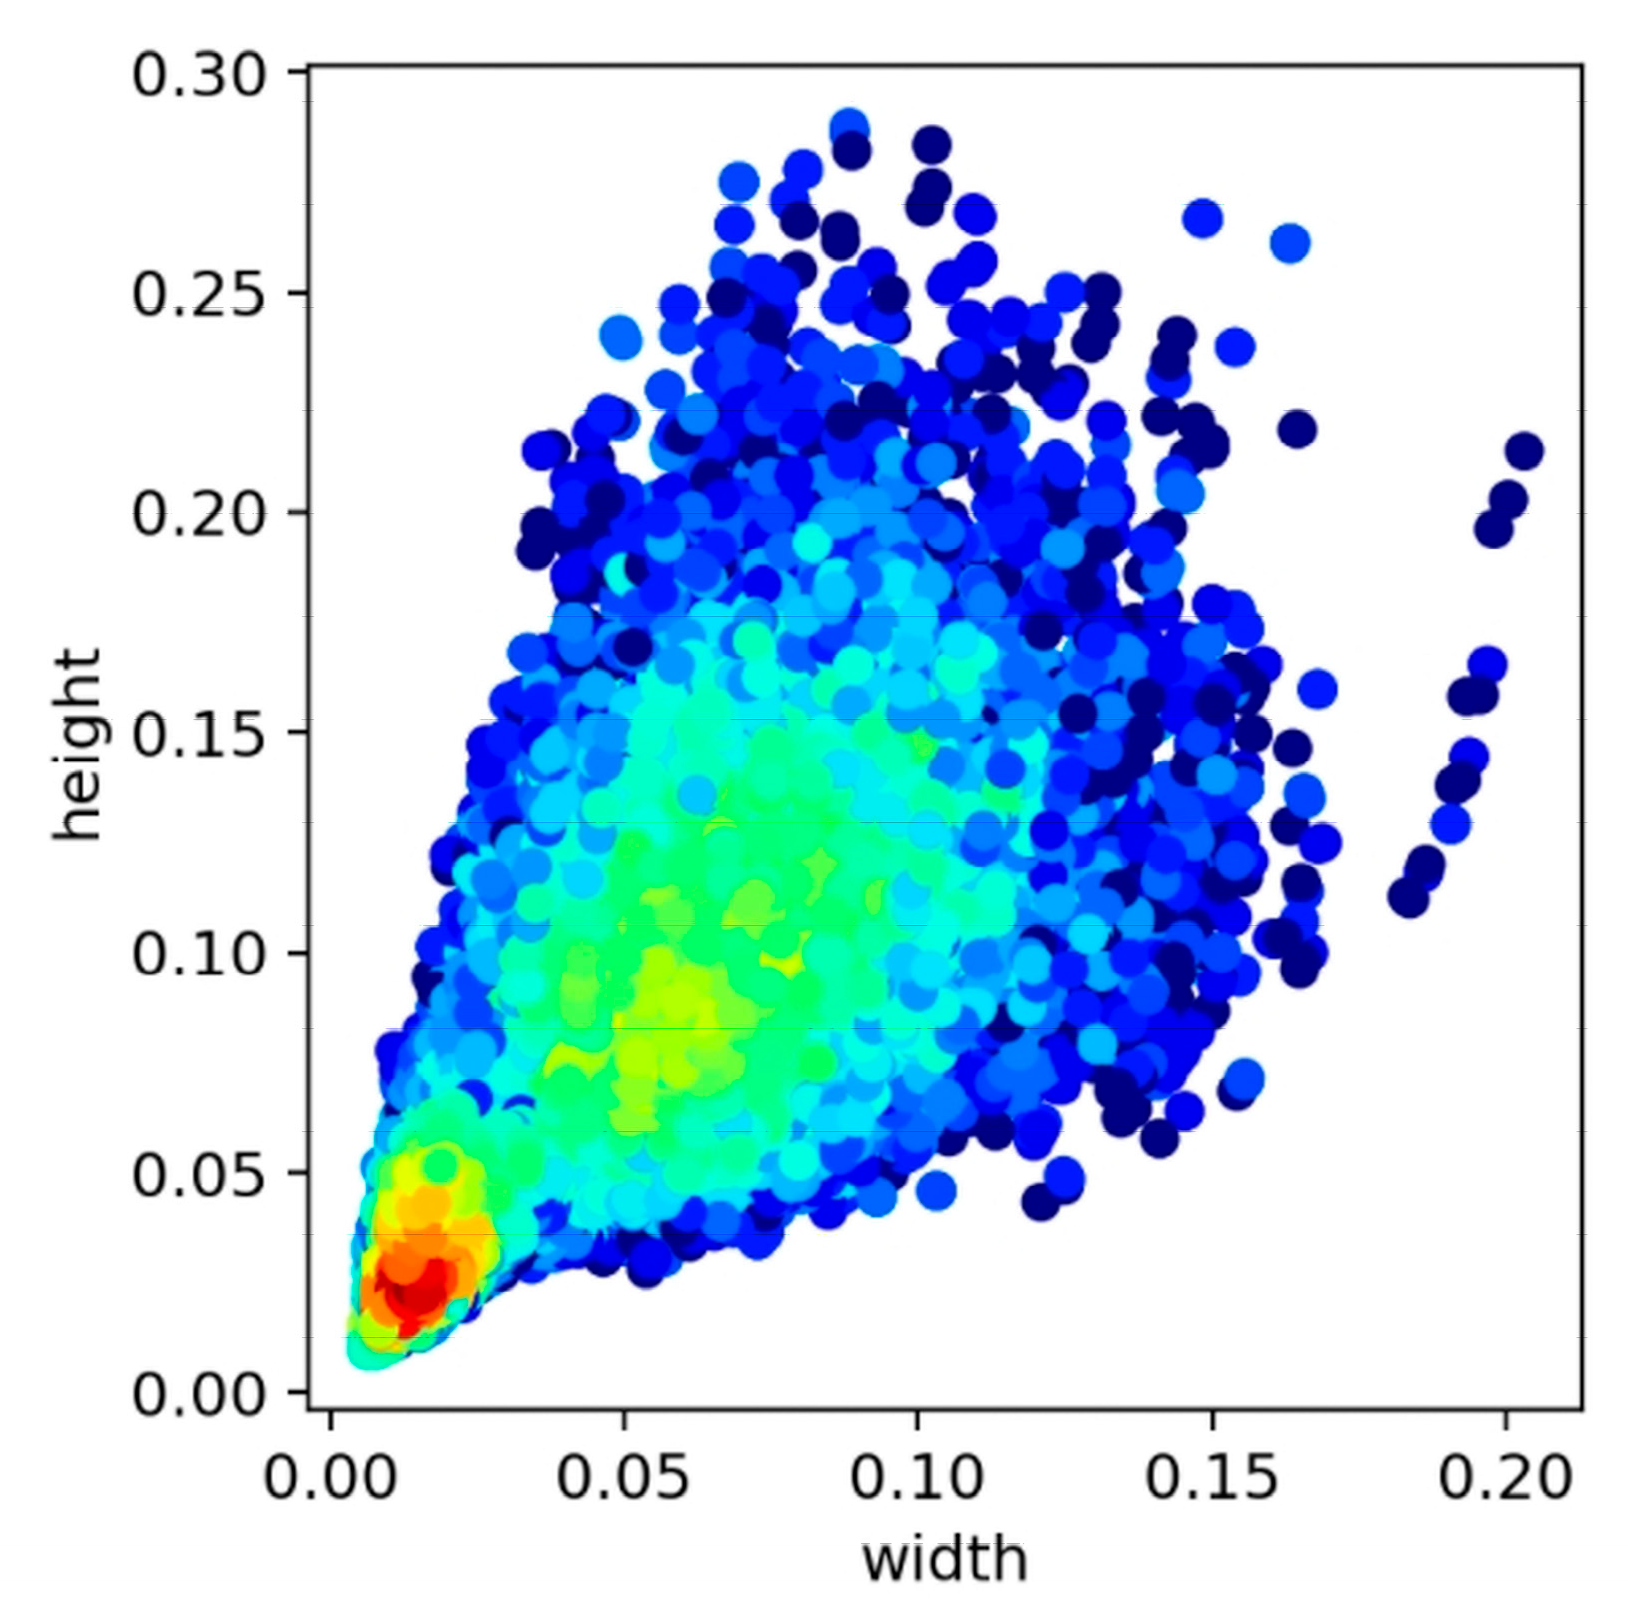
The scale distribution diagram of bounding boxes illustrates the ratio of the height to width of the object in the picture relative to the whole picture, and the dimensions of the bounding boxes have been normalized (Figure 7, where red indicates high proportion and blue indicates low proportion). Most of the objects in the images are smaller. The downsampling ratio of the YOLOv5s model is relatively large, which hinders deep feature maps from capturing features of small objects. Therefore, the YOLOv5s model is prone to errors and omissions in detecting small targets, particularly in complex backgrounds. To address this issue, a detection layer SNet dedicated to detecting small objects was added to the YOLOv5s model. A group of smaller-sized anchors [4, 5, 8, 10, 18, 22] were introduced to enhance the detection accuracy of small targets, based on their size distribution characteristics by K-means clustering. The Neck and Head networks of the model were improved, mainly by adding more feature fusion and detection layers. The Neck network of the YOLOv5s model lacked a 160 × 160 feature map, so it was generated through upsampling the 80 × 80 feature map. The 160 × 160 feature maps from the Neck and Backbone networks were fused, and subsequently predicted by the Head network.

2.4.2. LSKNet Attention Mechanism Module

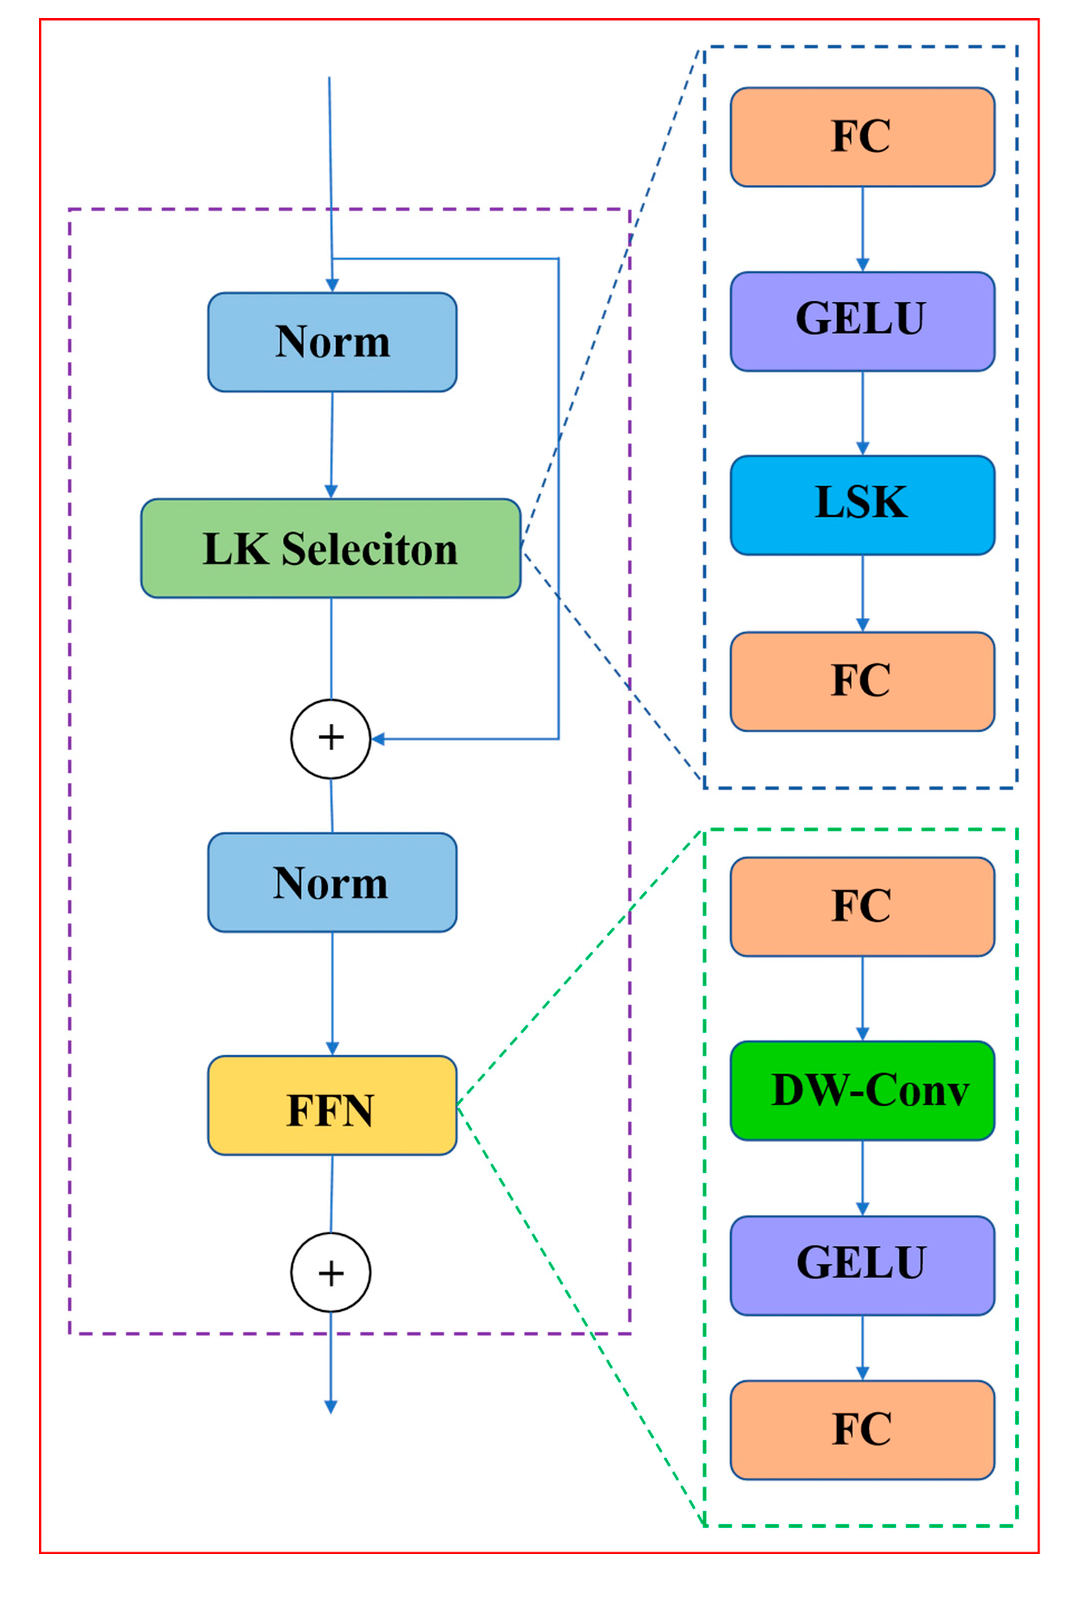
Because different types of detection objects have varied requirements for background information, the model needs to adapt and select different sizes of background areas. LSKNet [21], which dynamically adjusts its receptive field, could effectively process the relevant background information needed by different targets. The LSK Block, the basic module of LSKNet, includes Large Kernel Selection (LK Selection) and a Feed-forward Network (FFN), two sub-blocks (Figure 8). LK Selection dynamically adjusts the network’s receptive field, and the FFN improves channel mixing and feature refinement capabilities [22]. The LSK module, which consists of large kernel convolutions and spatial kernel selection, is integrated within the LK Selection model (Figure 9). Large kernel convolutions allow the model to gather diverse contextual features from various input segments. Meanwhile, spatial kernel selection boosts the network’s capacity to detect spatial connections [23].
The input features X are decomposed into a series of depth-wise convolutions using large kernel convolutions. To adjust the number of channels to match a same output dimension, the F 1 × 1 convolutions are used to obtain different nuclear features U ˜ i . The calculation is shown in Equations (1)–(3):
U 0 = X ,   U i + 1 = F i d w U i
  U ˜   i = F i 1 × 1 U i , for i in 1 , N
  U ˜   =   U ˜   1 ; ... ;   U ˜   i
where F i d w represents the depth-wise convolutions with kernel k i and dilation d i . The spatial feature descriptors S A are derived by applying maximum and average pooling operations on the feature maps produced by channel concatenations of different kernel convolutions. The spatial selection masks S A ~ are generated using the F 2 N convolution layer and sigmoid activation function. The spatial selection masks are used to weight the nuclear features, and the convolution layer F is used to produce the attention features S . The final output Y is yielded by element-wise multiplication of the attention features with the input features. The calculation is shown in Equations (4)–(8):
SA a v g = P a v g   U ˜   , SA m a x = P m a x   U ˜  
S A ~ = F 2 N SA a v g ; SA m a x
SA ~ i = σ SA ~ i
S = F i = 1 N SA ~ i   U ˜   i
Y = X S
where P a v g and P m a x are average and maximum pooling, SA m a x and SA a v g represent the spatial feature descriptors of maximum and average pooled, and σ is the sigmoid function.

2.4.3. Wise-IoU Loss Function

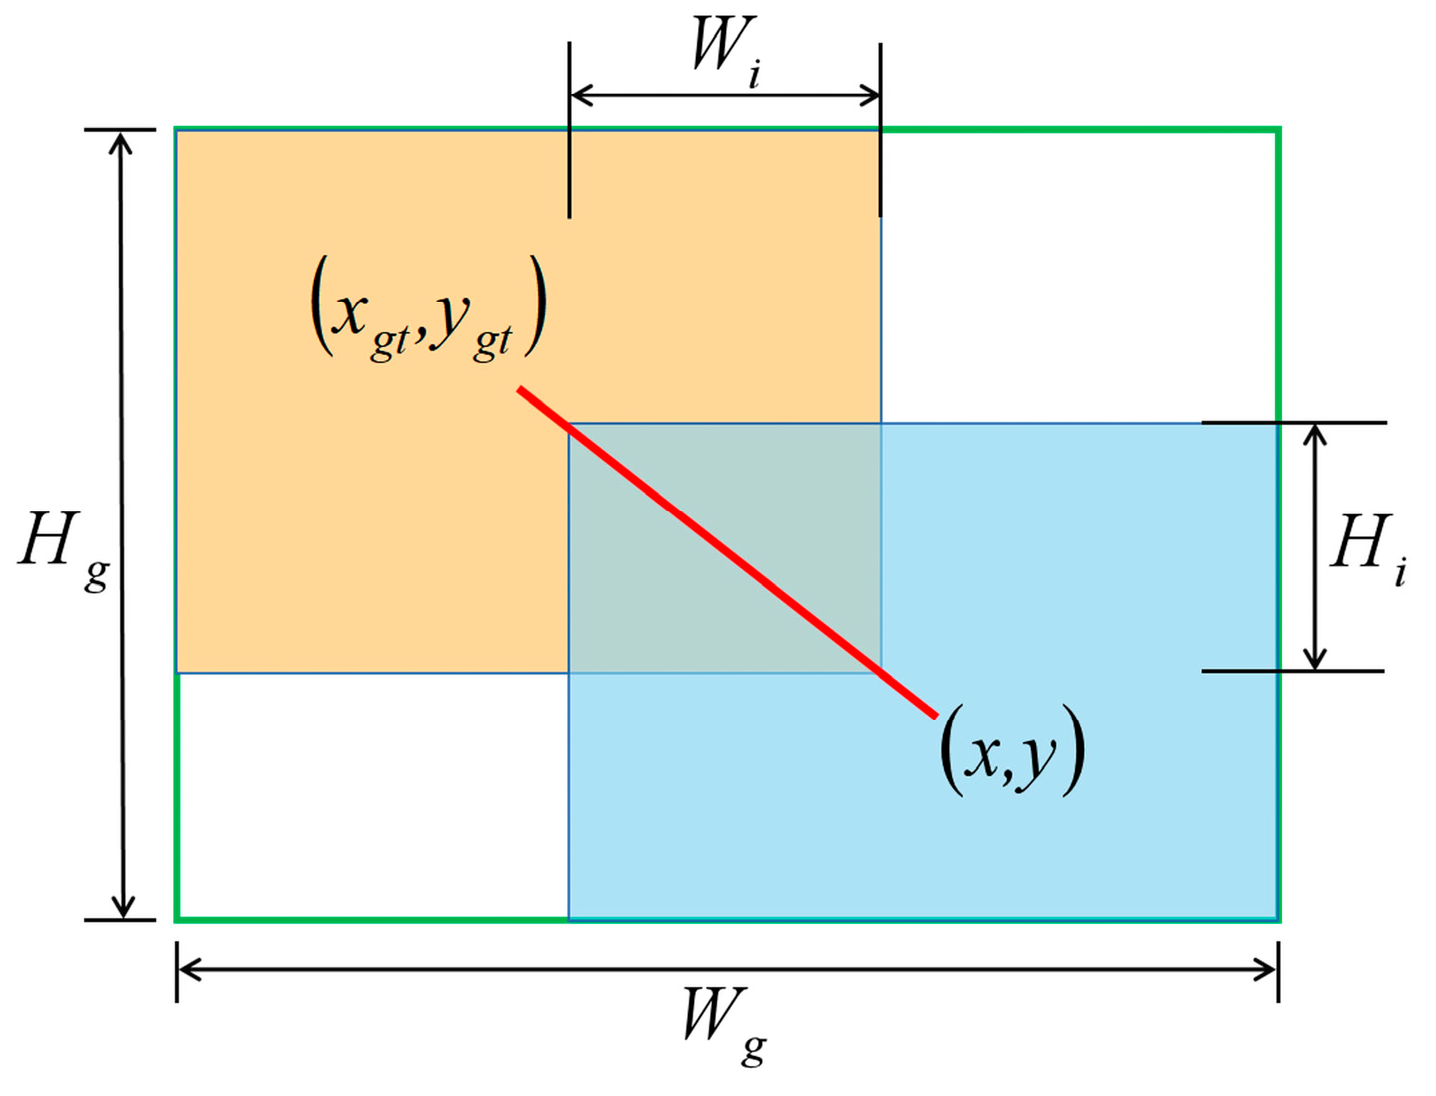
The loss function serves as an evaluation index to measure the difference between a model’s predictions and actual values, with YOLOv5s employing the CIoU loss function. The CIoU loss function performs well in object detection, but it employs a uniform loss calculation method for both high-quality and low-quality samples. Geometric indicators like aspect ratio and distance tend to impose a heavier penalty on low-quality samples, which may consequently harm the model’s generalization performance [24]. To address this issue, Tong et al. constructed a distance-based attention mechanism and derived WIoU v1 [25]. The calculation is shown in Equations (9)–(12):
L W I o U v 1 = R W I o U L I o U
R W I o U = e x p x x g t   2 + y y g t   2 W g 2 + H g 2
L I o U = 1 I o U = 1 W i H i S u
S u = w h + w g t h g t W i H i
where x , y are the central point coordinates of the prediction box; w , h are the width and height of the prediction box; x g t , y g t are the central point coordinates of the target box; w g t , h g t are the width and height of the target box; W g , H g are the width and height of the combination of the prediction box and target box; and W i , H i are the width and height of the intersection of the prediction box and target box (Figure 10).
Tong et al. [25] constructed a non-monotonic focusing coefficient γ using the outlier degree of the anchor box β , with the aim of alleviating the gradient penalty imposed on low-quality samples. Subsequently, they proposed the WIoU v3 loss function by applying this non-monotonic focusing coefficient γ to the WIoU v1. The calculation is shown in Equations (13)–(15):
β = L I o U L I o U ¯ 0 , +
γ = β δ α β δ
L W I o U v 3 = γ L W I o U v 1
where α and δ are hyperparameters, the non-monotonic focusing coefficient γ decreases high-quality samples’ influence and mitigates low-quality samples’ adverse gradients. The WIoU v3 loss function can dynamically adjust its attention to common-quality samples, which enhances the model’s generalization ability and performance. For these reasons, the WIoU v3 loss function is chosen instead of the CIoU loss function.

2.5. Image Test Platform

To develop a hybrid soybean parent phenotypic consistency detection model, a model training platform was established. The platform’s graphics card, processor, and random access memory were NVIDIA GeForce RTX 4090 (NVIDIA Corp., Santa Clara, CA, USA), Intel Core i9 13900K (Intel Corp., Santa Clara, CA, USA), and 128 GB. The software versions used for model training include PyTorch 1.13.1, Python 3.8.18, and CUDA 11.7. The training parameters were set to 300 epochs, 64 batch-size, 16 workers, and an image-size of 640 × 640. The hyperparameters learning rate, momentum, and weight decay were set to 0.01, 0.973, and 0.0005, respectively. For the WIoU v3 loss function, the hyperparameters α and δ were set to 1.9 and 3.
For inference benchmarking, all models were evaluated under standardized conditions: a single NVIDIA GeForce RTX 4090 GPU (NVIDIA Corp., Santa Clara, CA, USA), 640 × 640 input resolution, a batch size of 1, a confidence threshold of 0.25, and an NMS threshold of 0.45. FPS represents the mean ± standard deviation of five consecutive runs over 200 test images.

2.6. Evaluation Metrics

To evaluate the performance of the hybrid soybean parent phenotypic consistency detection model, the precision (P), recall (R), F1 score, mean of average precision (mAP), detection speed, and model size were used as evaluation metrics. The calculations of P, R, and F1 are shown in Equations (16)–(18):
P = T P T P + F P
R = T P T P + F N
F 1 = 2 P R P + R
where T P represents samples correctly predicted as positive, F P denotes negative samples incorrectly predicted as positive, and F N signifies positive samples incorrectly predicted as negative [26].
Average precision (AP) is a metric of the predictive performance for each category. The calculation is shown in Equation (19):
AP = 0 1 d r P r e c i s i o n × R e c a l l
where r represents the integral of the product of the recall rate and precision.
The mAP, which stands for the mean of average precisions for all detection categories, reflects the model’s overall performance. Specifically, mAP 50 represents the mean average precision at the IoU threshold of 0.5. The calculation is shown in Equation (20):
mAP = j = 1 S AP j S
where S denotes the number of all categories in this study, which is 8.
The detection speed, mainly serving as a measure of the model’s image processing capability, is often evaluated using frames per second (FPS). The calculation is shown in Equation (21):
F P S = F r a m e s T i m e
where F r a m e s indicates the total frames processed within a given time period, while T i m e indicates the duration of that period.

2.7. Hybrid Soybean Parents’ Phenotypic Consistency

To validate the model detection performance, models need to be used to identify hybrid soybean parents’ phenotypic consistency. According to the practice code [2], the calculation is shown in Equation (22):
C = Z T Z Z T × 100 %
where C represents hybrid soybean parents’ phenotypic consistency; Z T is the total number of soybean parent plants observed; and Z is the number of off-type soybean plants. The calculation is accurate to one decimal place.

3. Results and Analysis

3.1. Model Comparison and Ablation Test

3.1.1. Comparative Test of YOLO Model

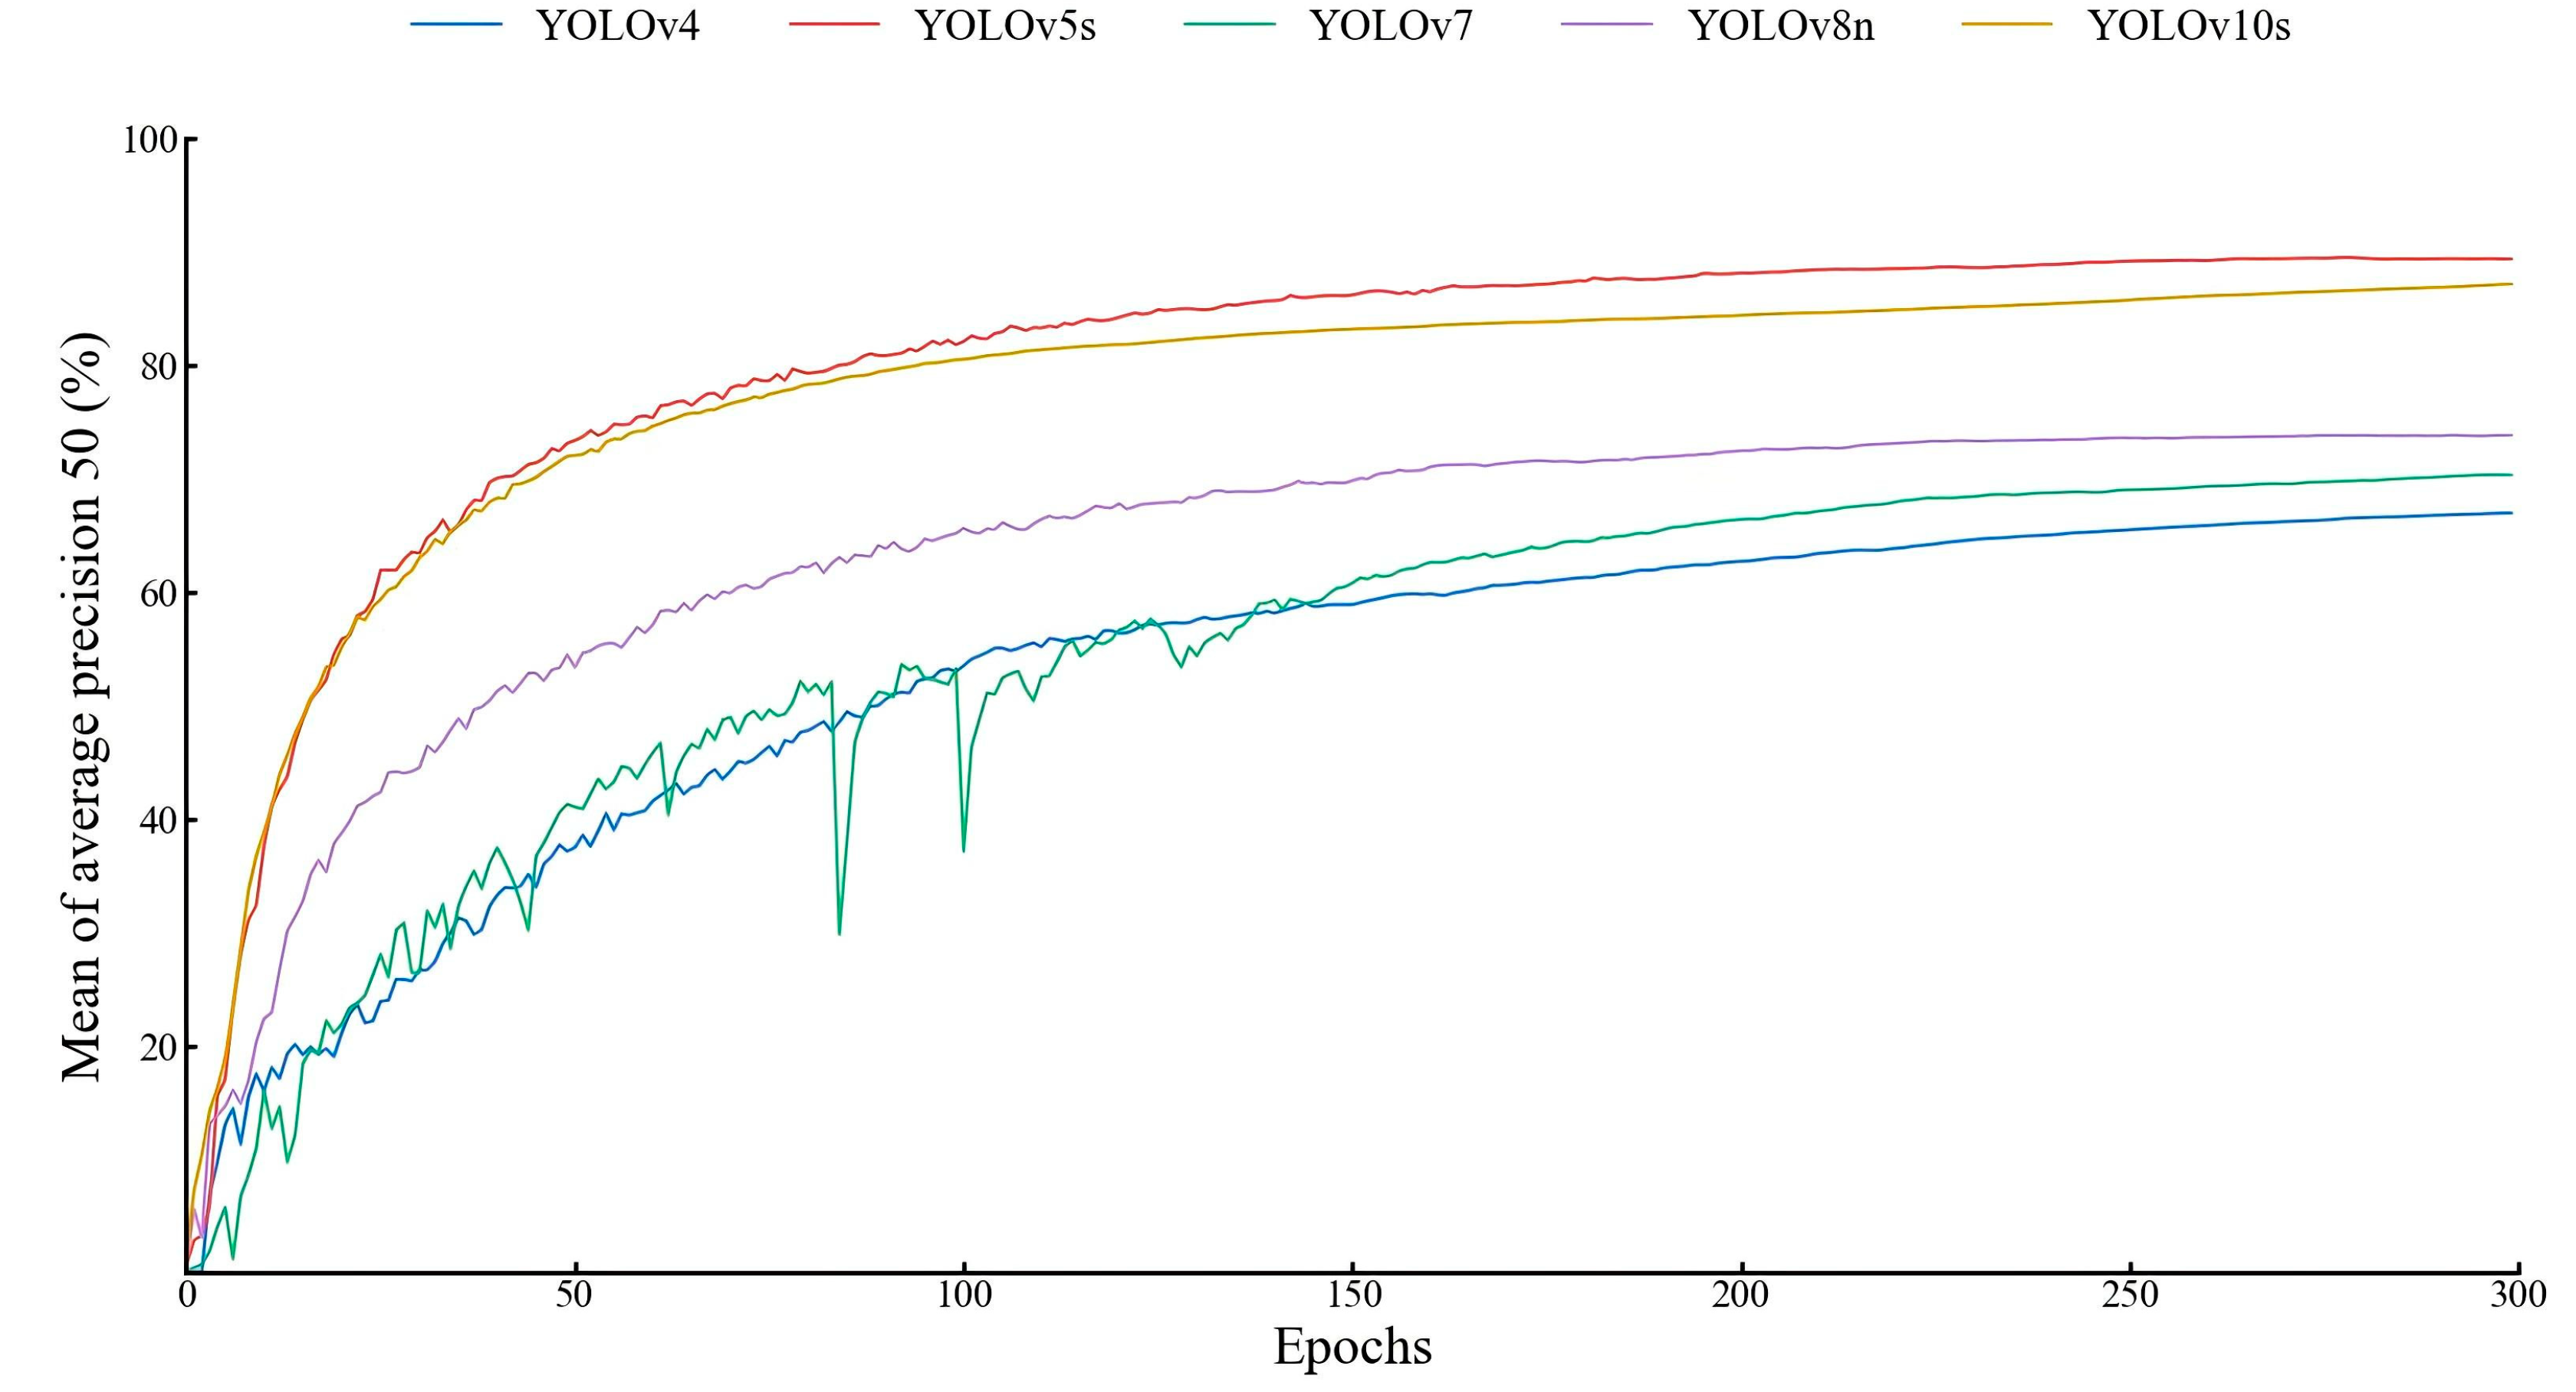
The detection results of the comparative tests conducted using YOLO series target detection algorithms are presented in Table 2. The YOLOv5s model performs significantly better than other models in terms of P, F1, and mAP. It is noteworthy that, despite the YOLOv5s model having an R value 6.4% lower than the YOLOv4 model, the YOLOv4 model’s comprehensive performance is the worst among the models considered. Additionally, while the YOLOv5s model size is 7.73 MB larger than the YOLOv8n model, the YOLOv8n model’s overall performance is not as good as that of the YOLOv5s model. According to Figure 11, although the mAP of the YOLOv5s model fluctuates slightly compared with the YOLOv10s model in the early stage of training, after 200 rounds of training, it becomes stable and superior to the YOLOv10s model. Through comparative analysis, the YOLOv5s model has the best detection performance. It is selected as the basic model, and different improvement methods are adopted to improve the detection effect of the model.

3.1.2. Comparative Test of Attention Mechanism

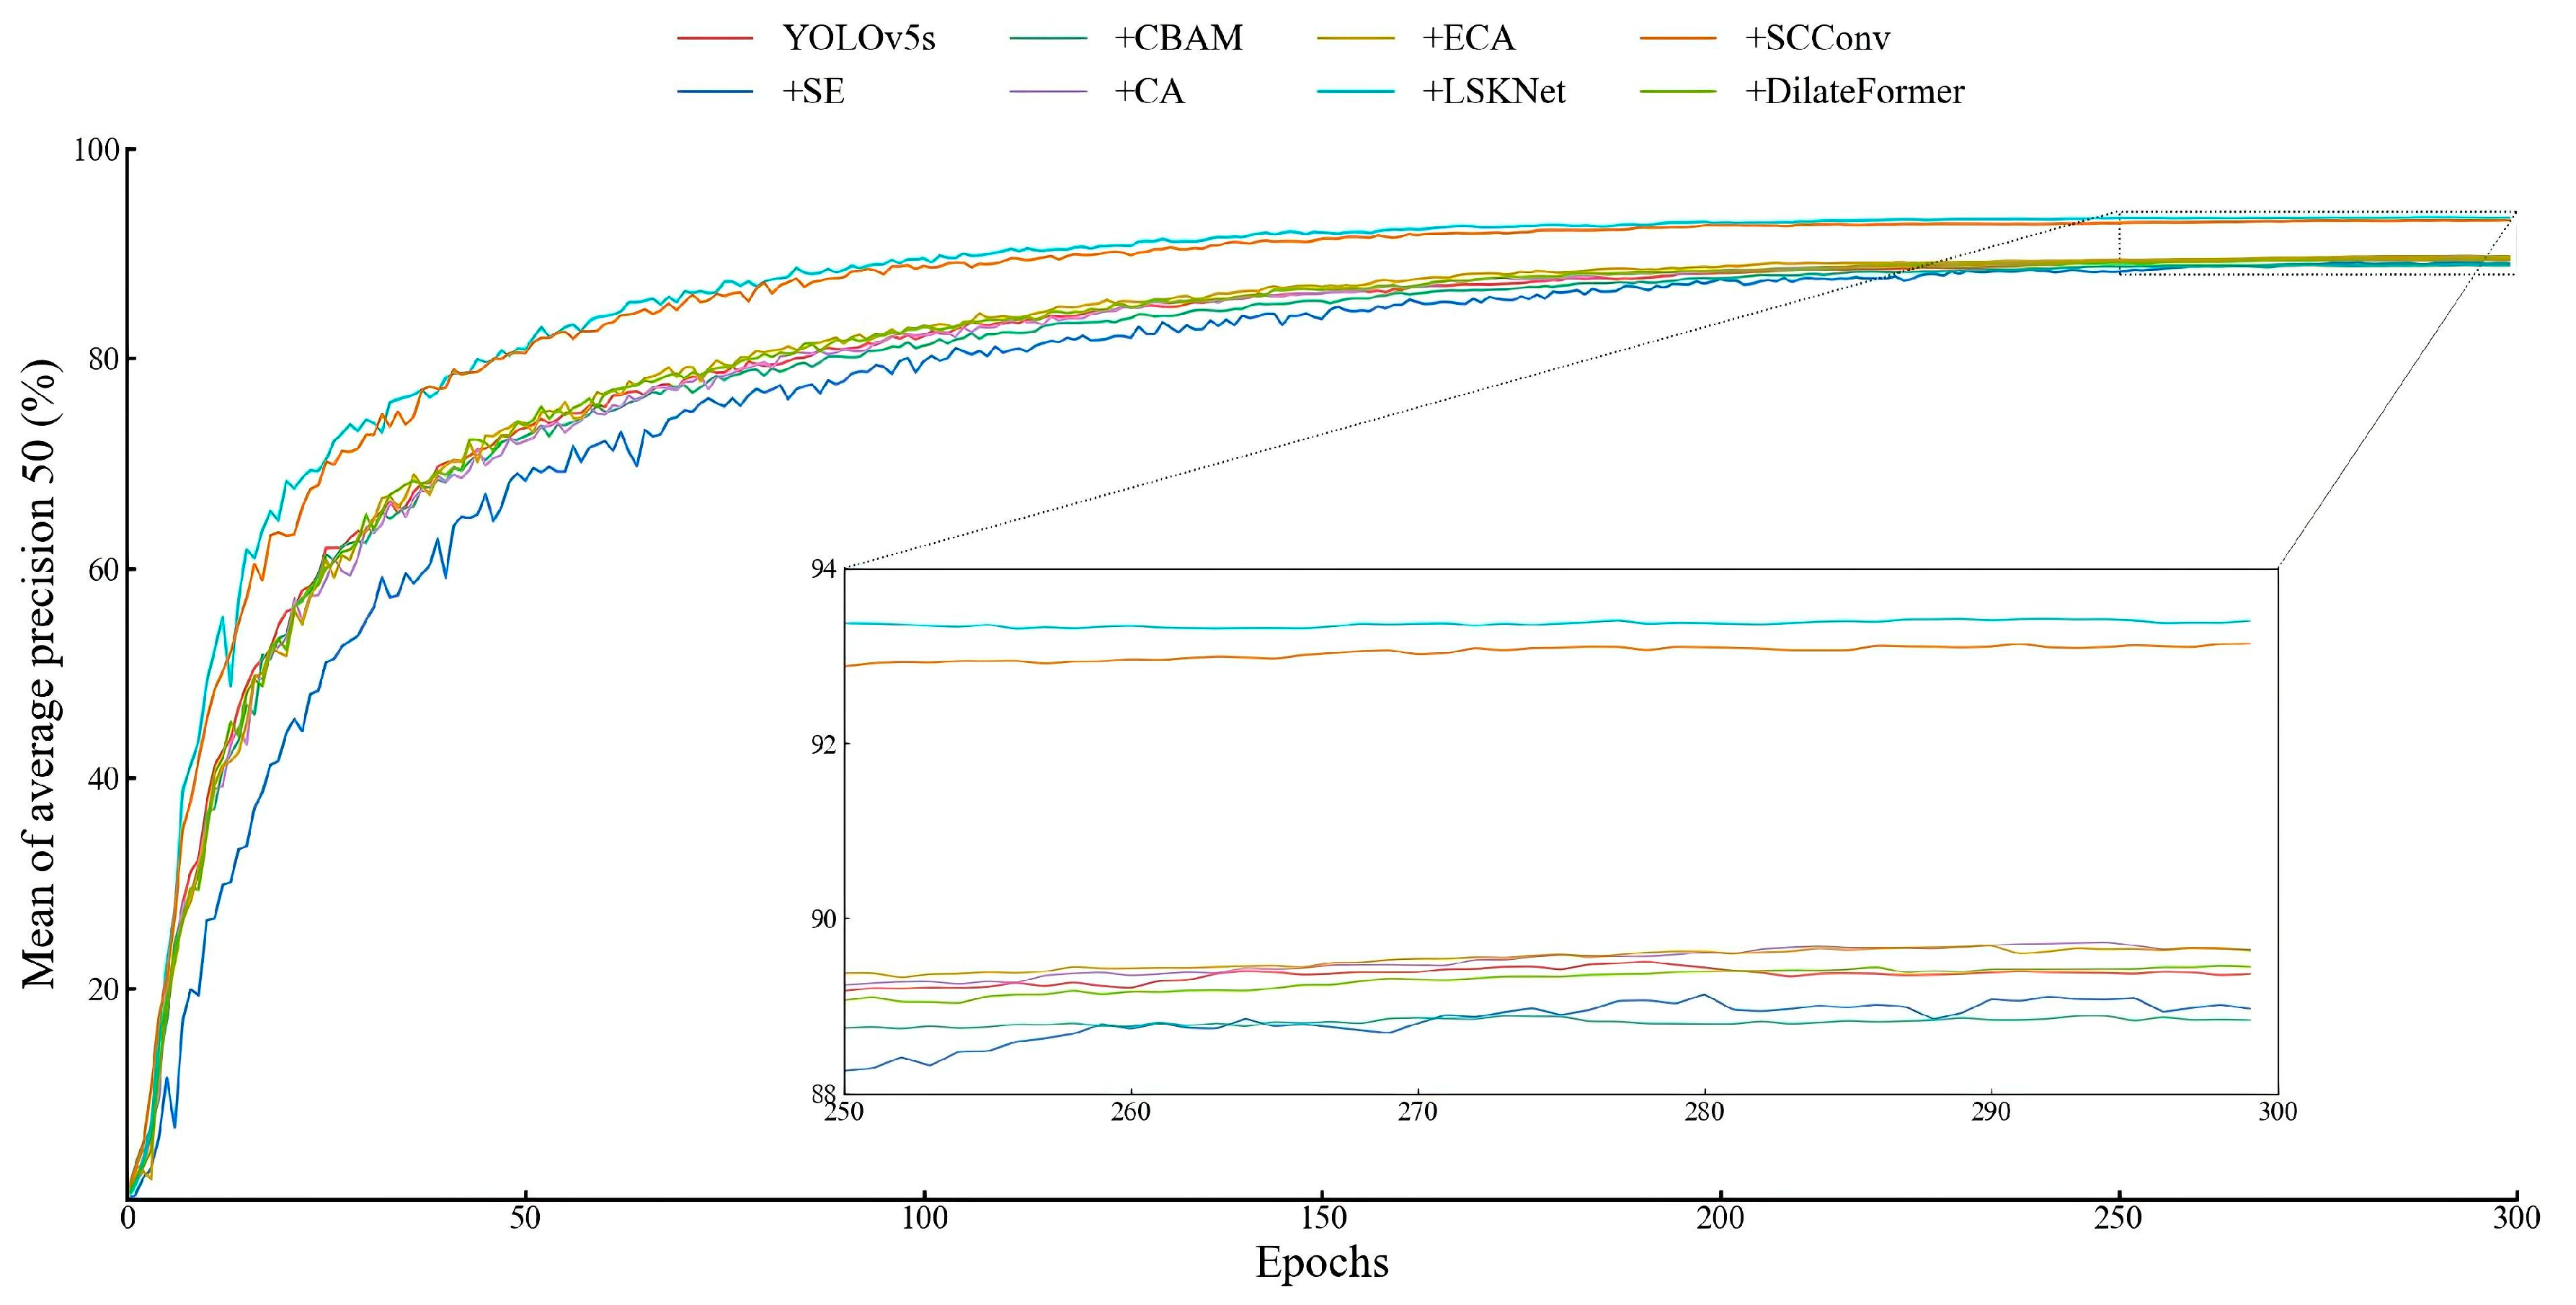
Within the YOLOv5s model Backbone, various attention mechanism modules were added into the front layer of the SPPF layer, and the detection results are presented in Table 3. The LSKNet attention mechanism demonstrated significant enhancements in the four evaluation indexes: P, R, F1, and mAP, with improvements of 2.5%, 5.7%, 4.2%, and 4.0%, compared to the YOLOv5s model. This was achieved with a slightly reduced detection speed and was accompanied by a 43.2 MB increase in model size. There are minimal discrepancies in detection performance between the LSKNet and SCConv attention mechanisms. However, the LSKNet attention mechanisms perform marginally better in most metrics, except for p value. Figure 12 demonstrates that the LSKNet attention mechanism exhibits better stability during the late training period compared to other models. In addition, only the LSKNet and SCConv attention mechanisms outperform the YOLOv5s models, while the remaining attention mechanism modules showed no significant improvement.

3.1.3. Comparative Test of Network Structure

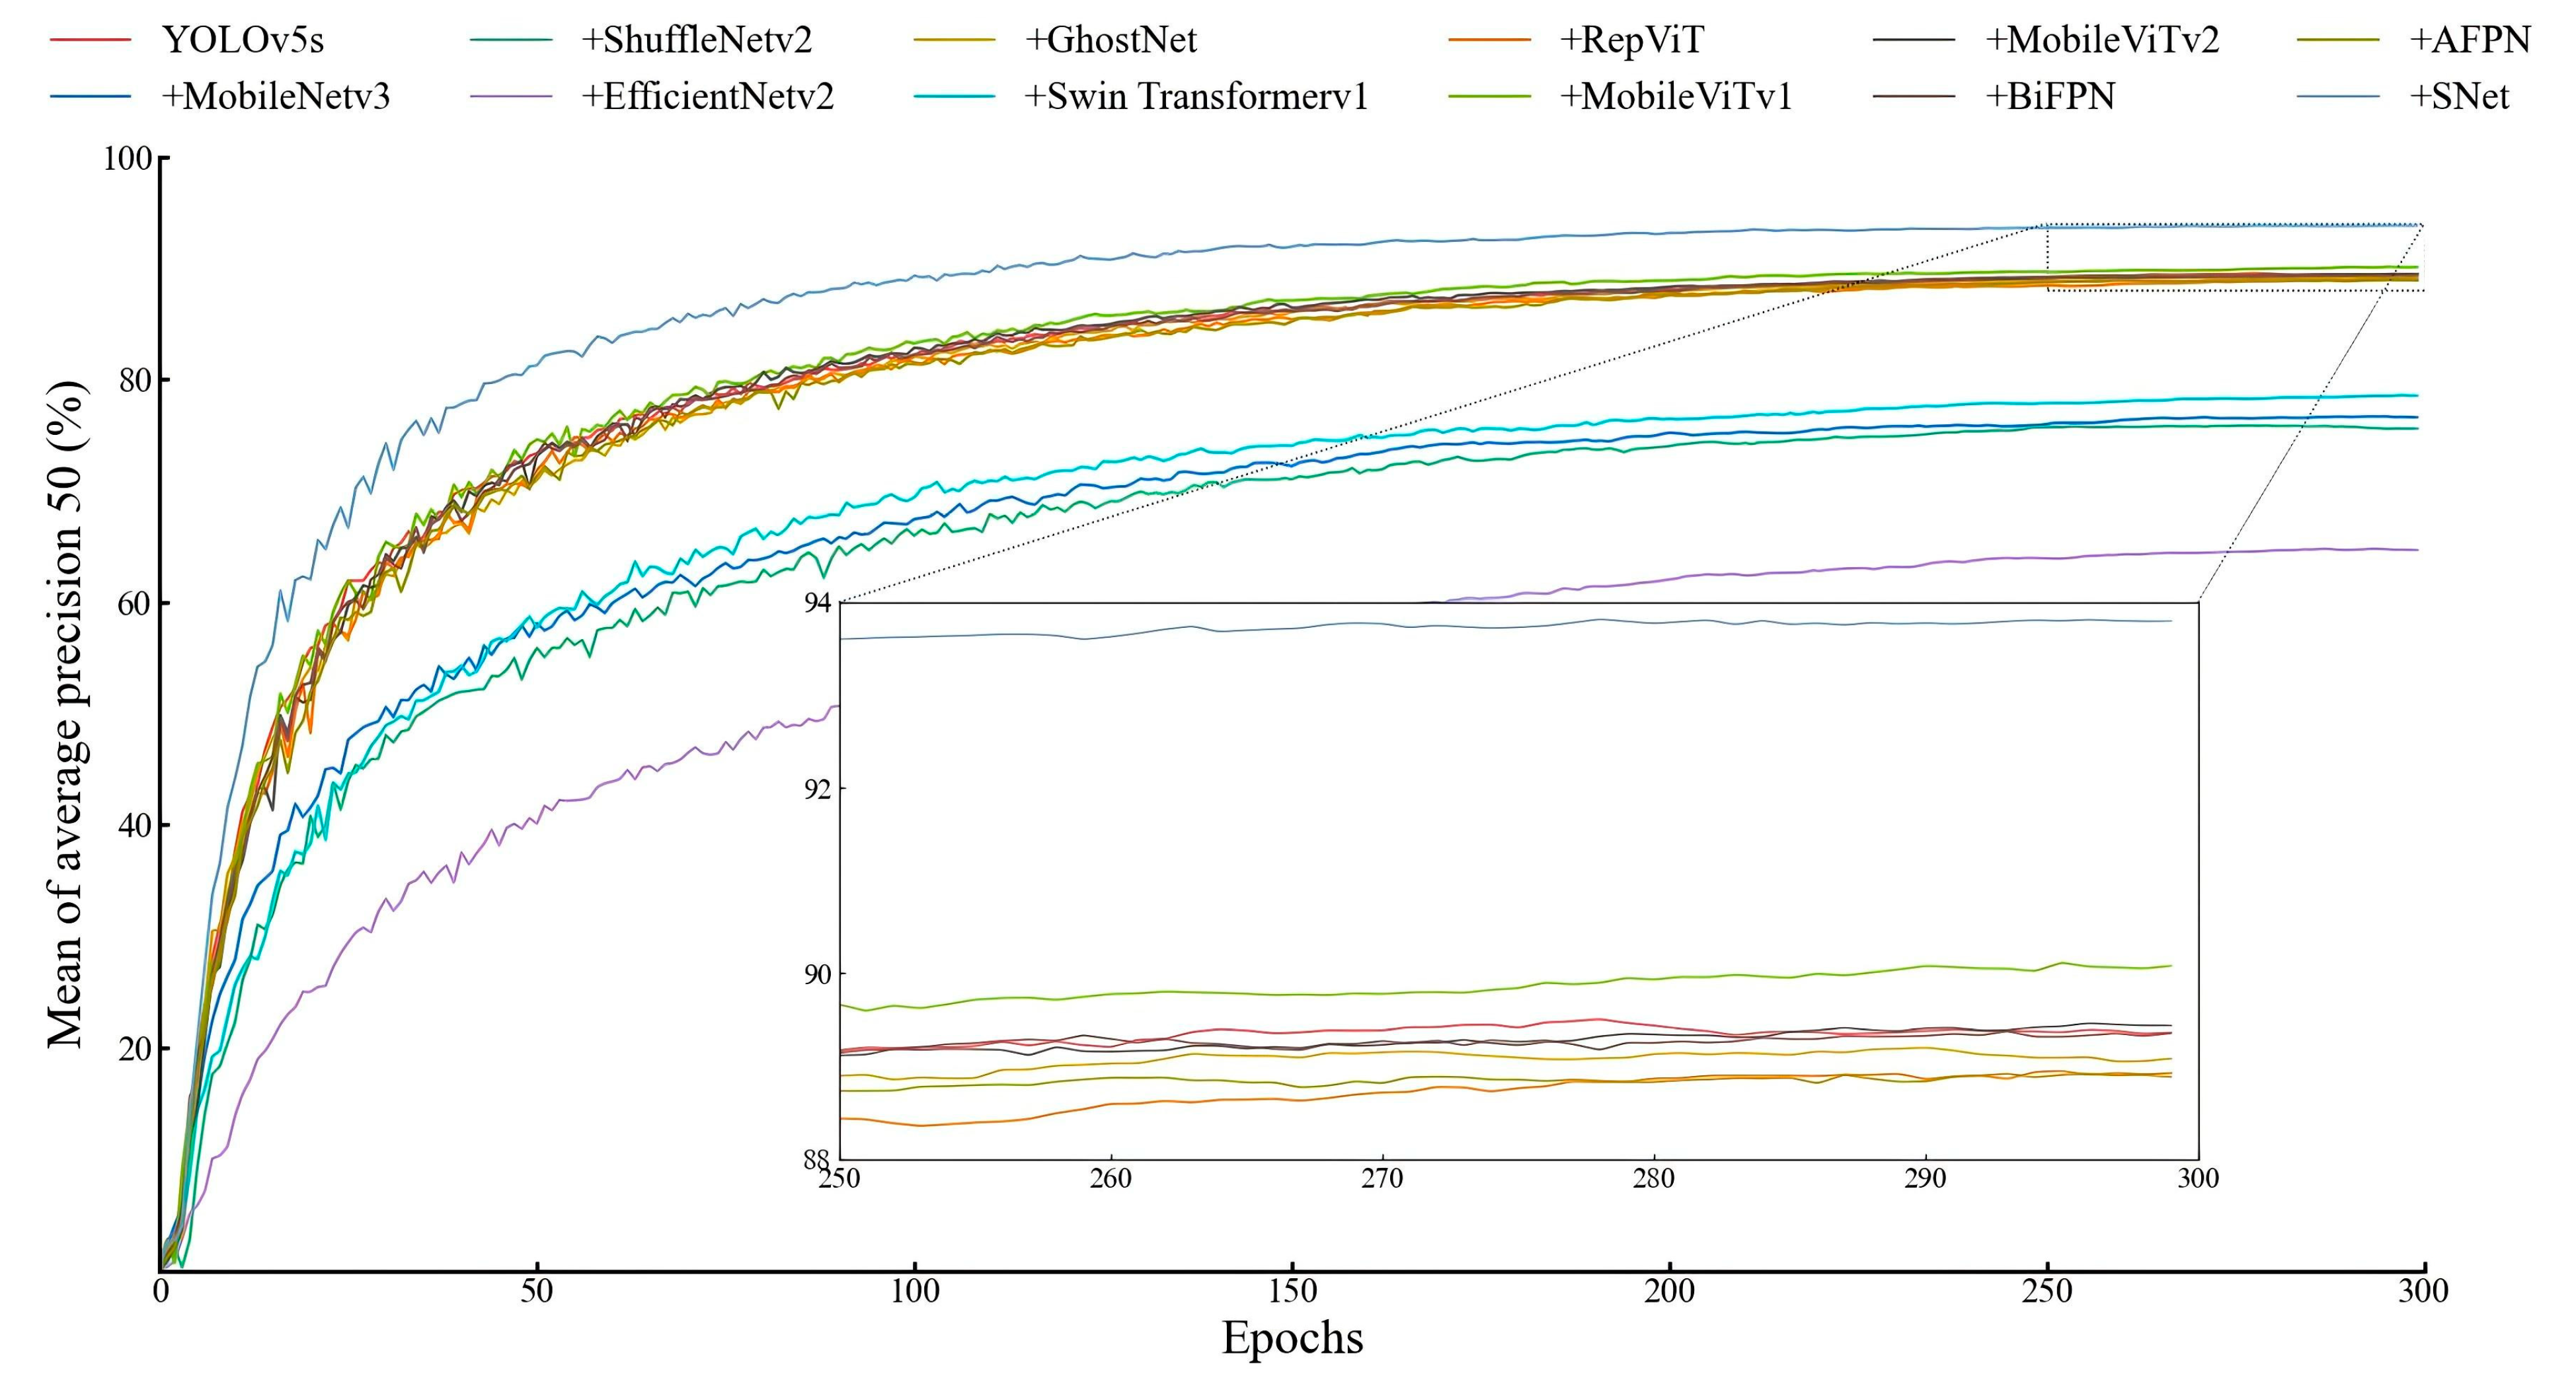
Different network structures have been used to improve the YOLOv5s model, and the test results are shown in Table 4. The small-target detection layer, SNet, significantly improves the model, with a 3.9% increase in precision, 5.8% in recall, 5.0% in F1 Score, and 4.4% in mAP, compared to the YOLOv5s model. Due to the increase in the number of model layers, the SNet model becomes more intricate, resulting in more parameters and a longer inference time. Consequently, the detection speed of the SNet model is 36.6 FPS slower than that of the YOLOv5s model; its model size exceeds that of YOLOv5s by 27.8 MB. Figure 13 demonstrates that in the late training period, the mAP of SNet and MobileViTv1 exhibits less fluctuation than that of other models. Notably, SNet shows significant improvement compared with MobileViTv1. Moreover, most of the models are similar in performance to the YOLOv5s model, while a few models perform worse than the YOLOv5s model.

3.1.4. Comparative Test of Loss Function

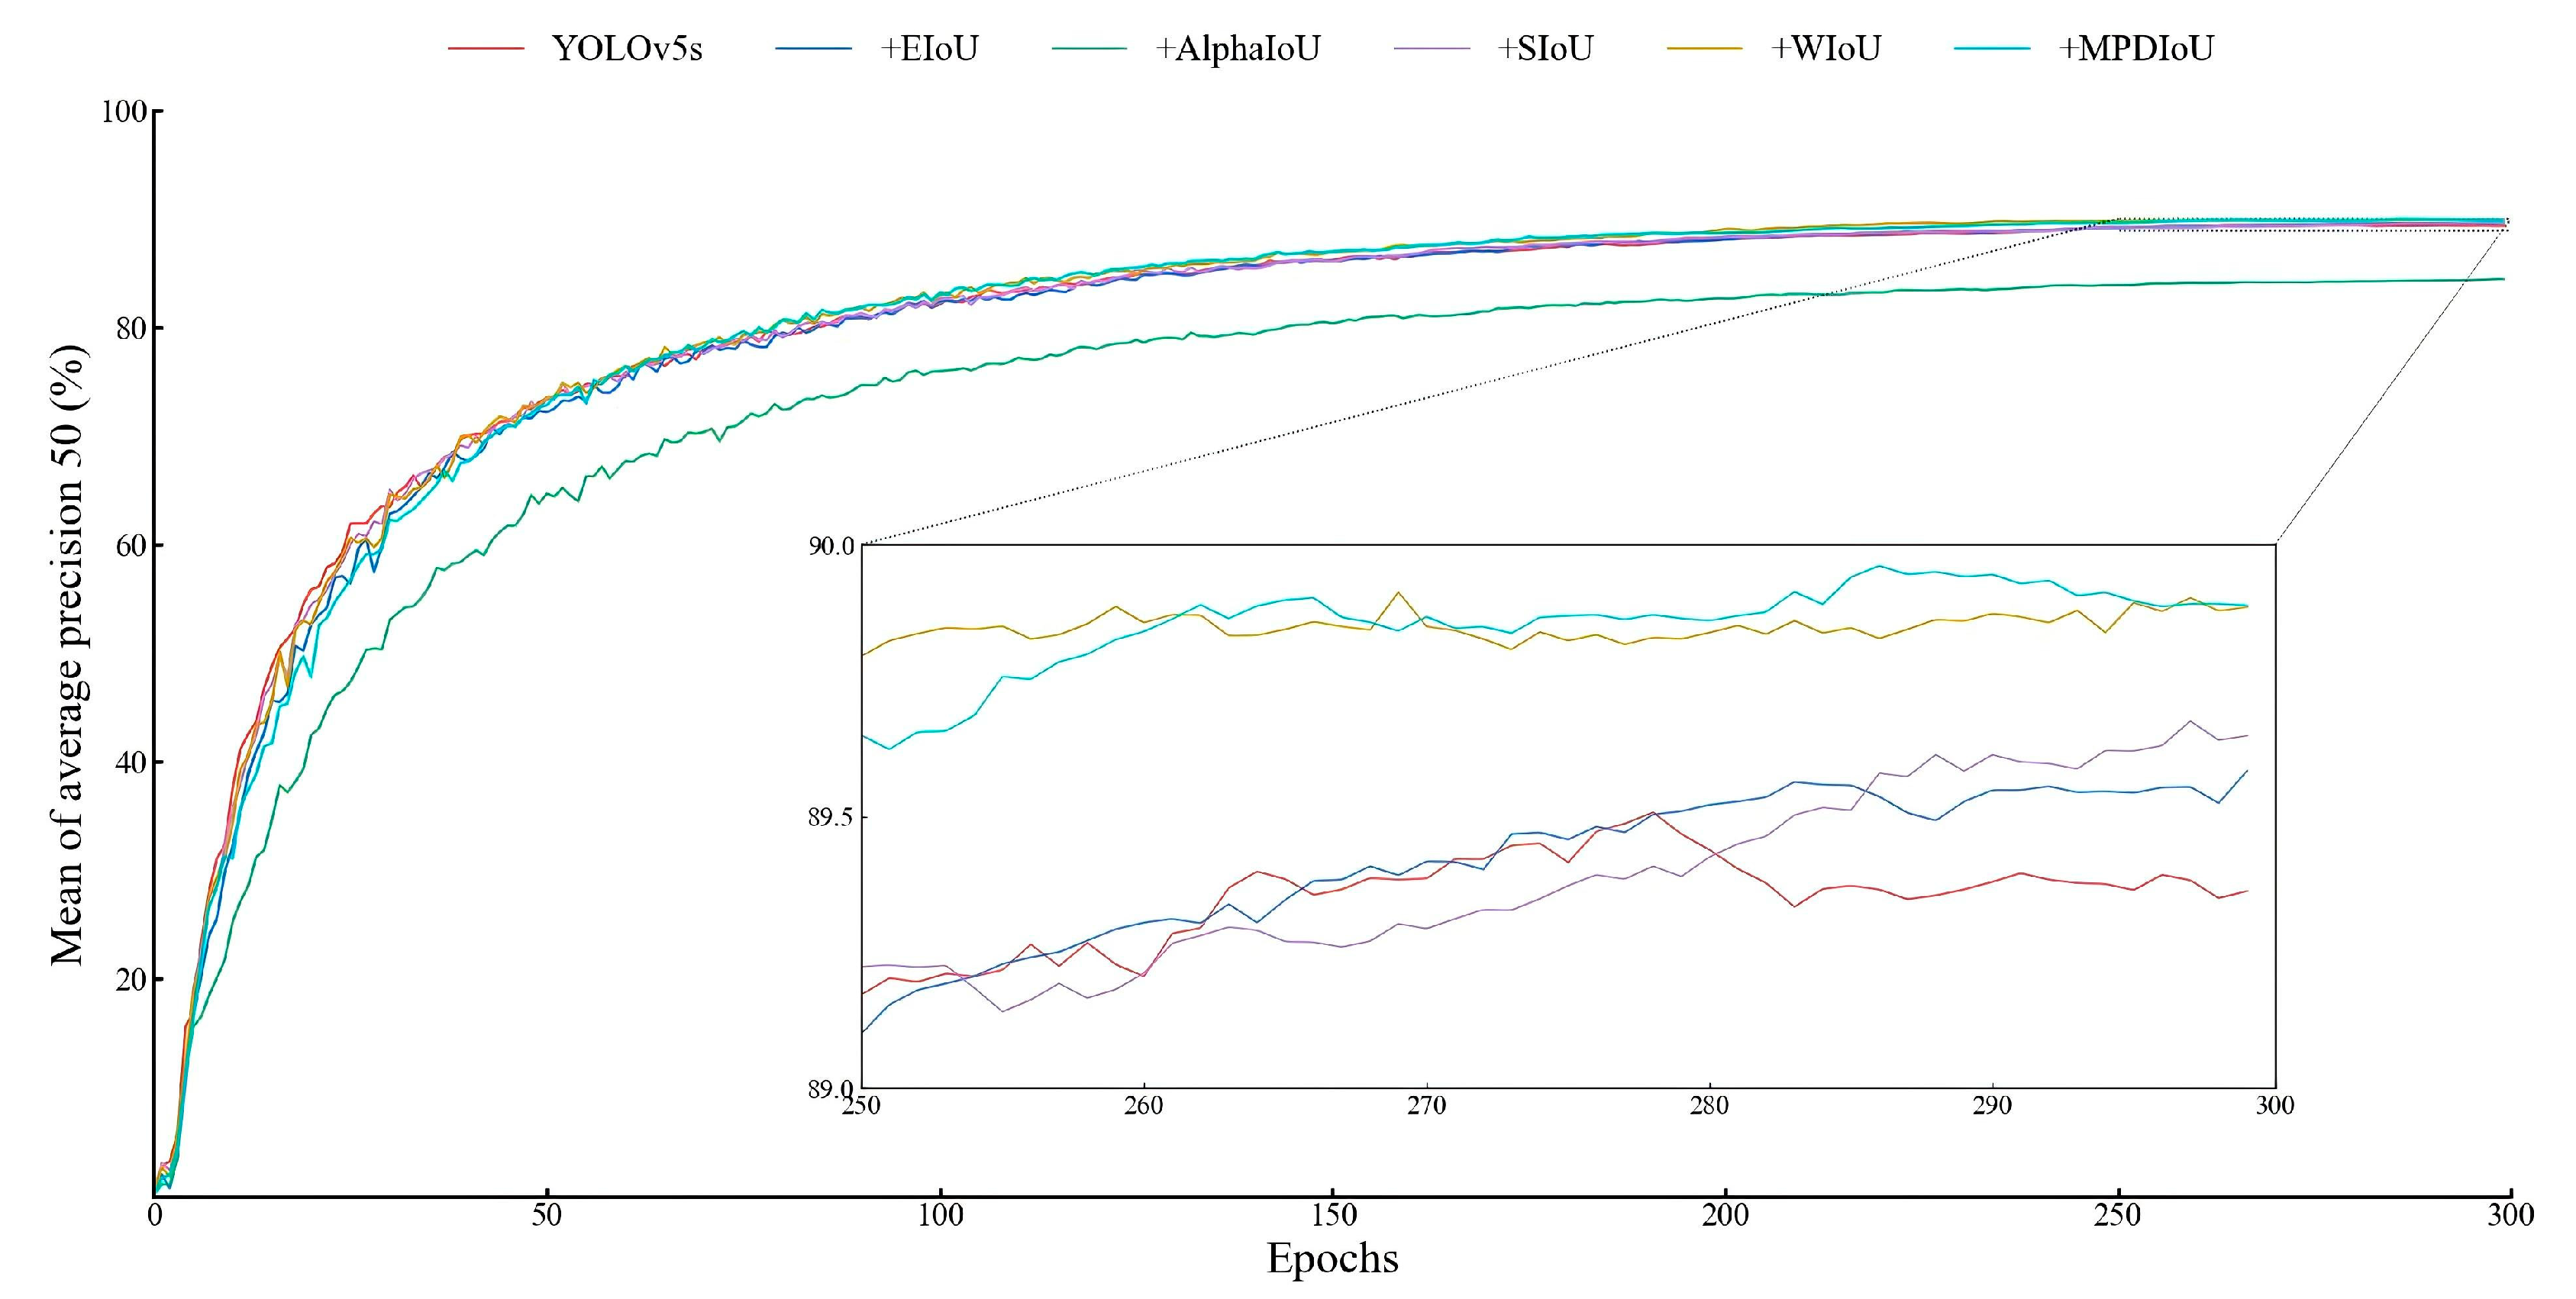
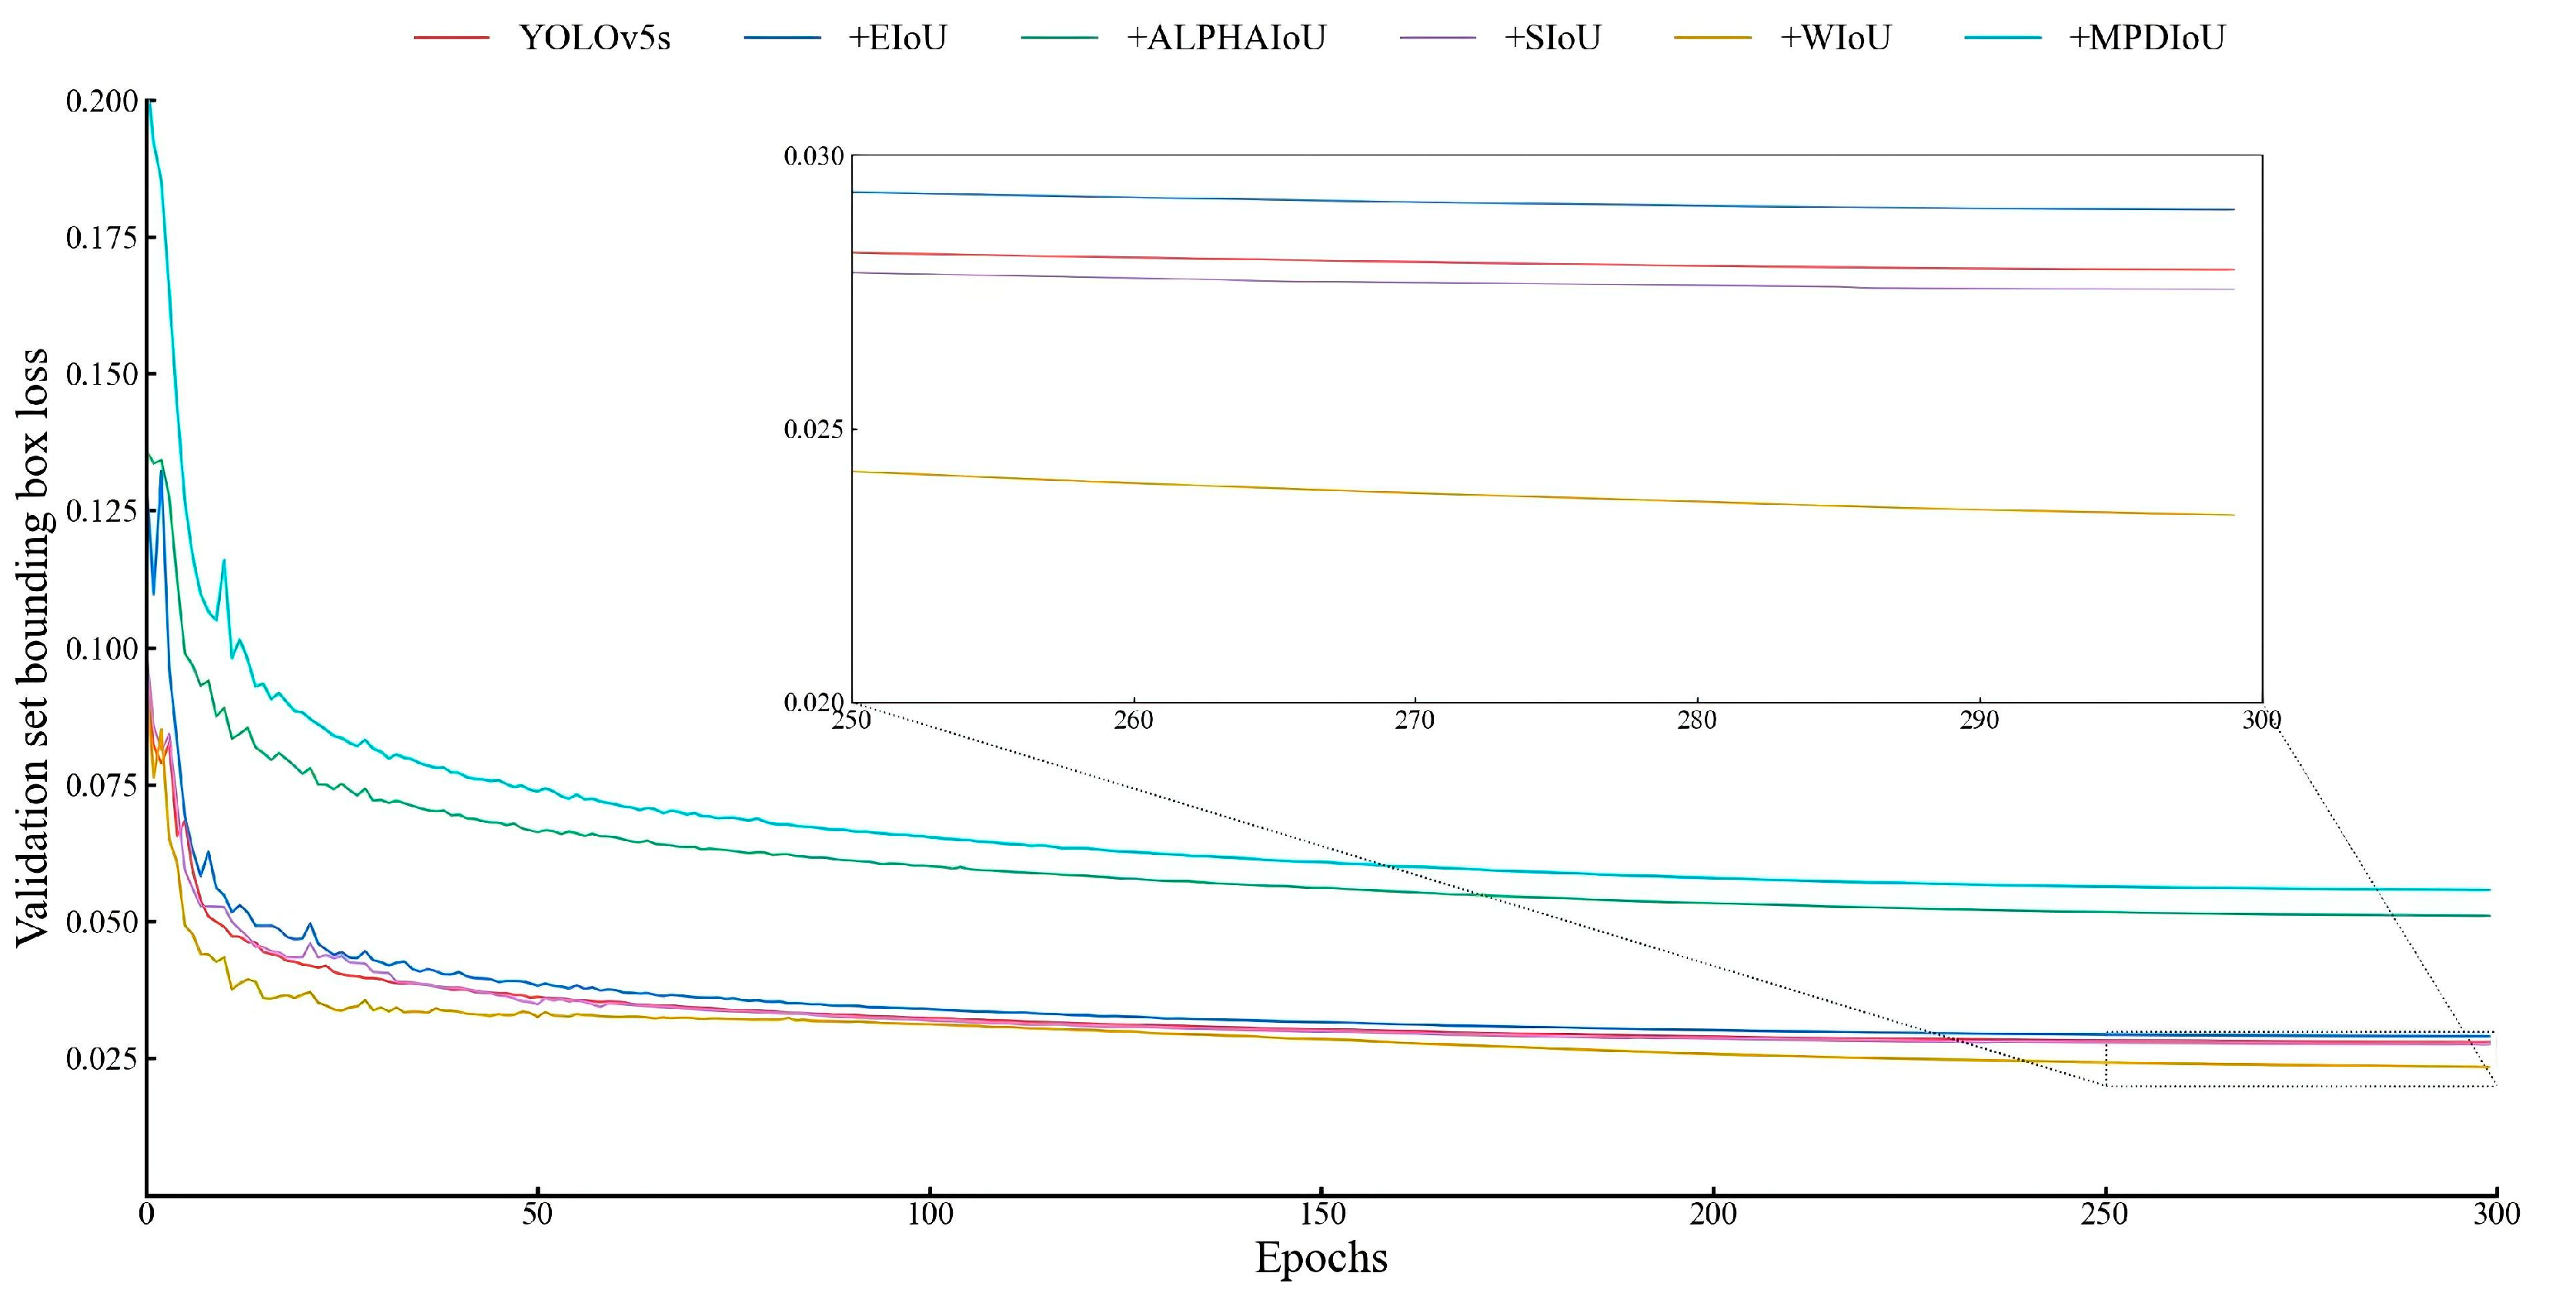
Five loss functions were used to improve the YOLOv5s model, and the test results are shown in Table 5. Except for the AlphaIoU loss function, the comparison chart of mAP values reveals that the detection performance of the other loss functions is similar, demonstrating no significant improvement (Figure 14). Compared with the WIoU v3 loss function, MPDIoU offers better detection performance, albeit with more pronounced fluctuations of mAP. To evaluate the influence of different loss functions on the accuracy of the model’s bounding box predictions, a bounding box loss change curve for the verification set was drawn (Figure 15). Compared with other models, the bounding box loss of the WIoU v3 loss function is the smallest and remains stable. Comprehensive comparative analysis shows that the WIoU v3 loss function has the best detection performance.

3.1.5. Ablation Test

Through a comparative analysis of network structure, attention mechanism module, and loss function, the LSKNet attention mechanism, small-target detection layer, and WIoU v3 loss function were selected as the improvement strategies. To identify the optimal improved configuration, an ablation test was conducted, with the tested combinations shown in Table 6 and the experimental results presented in Table 7. The SLW-YOLO model demonstrated the best detection performance, achieving a P, R, F1, and mAP of 94.0%, 90.6%, 92.3%, and 94.8%, respectively. These values are significantly higher, by 4.6%, 7.3%, 6.1%, and 5.4%, compared to the YOLOv5s model. The SLW-YOLO model detection speed is 88.3 FPS, which is 42.1 FPS lower than the YOLOv5s model. The model size is 45.1 MB, which is 31.4 MB larger than the YOLOv5s model. Although the model size increased notably, the detection speed still meets real-time detection requirements. The mAP comparison curves of different ablation test combinations show that the improved combination outperforms the YOLOv5s model (Figure 16). During the late stages of training, there are no significant differences in the mAP fluctuations of all models, indicating that the improved combination has good convergence.

3.2. Heat Map Analysis

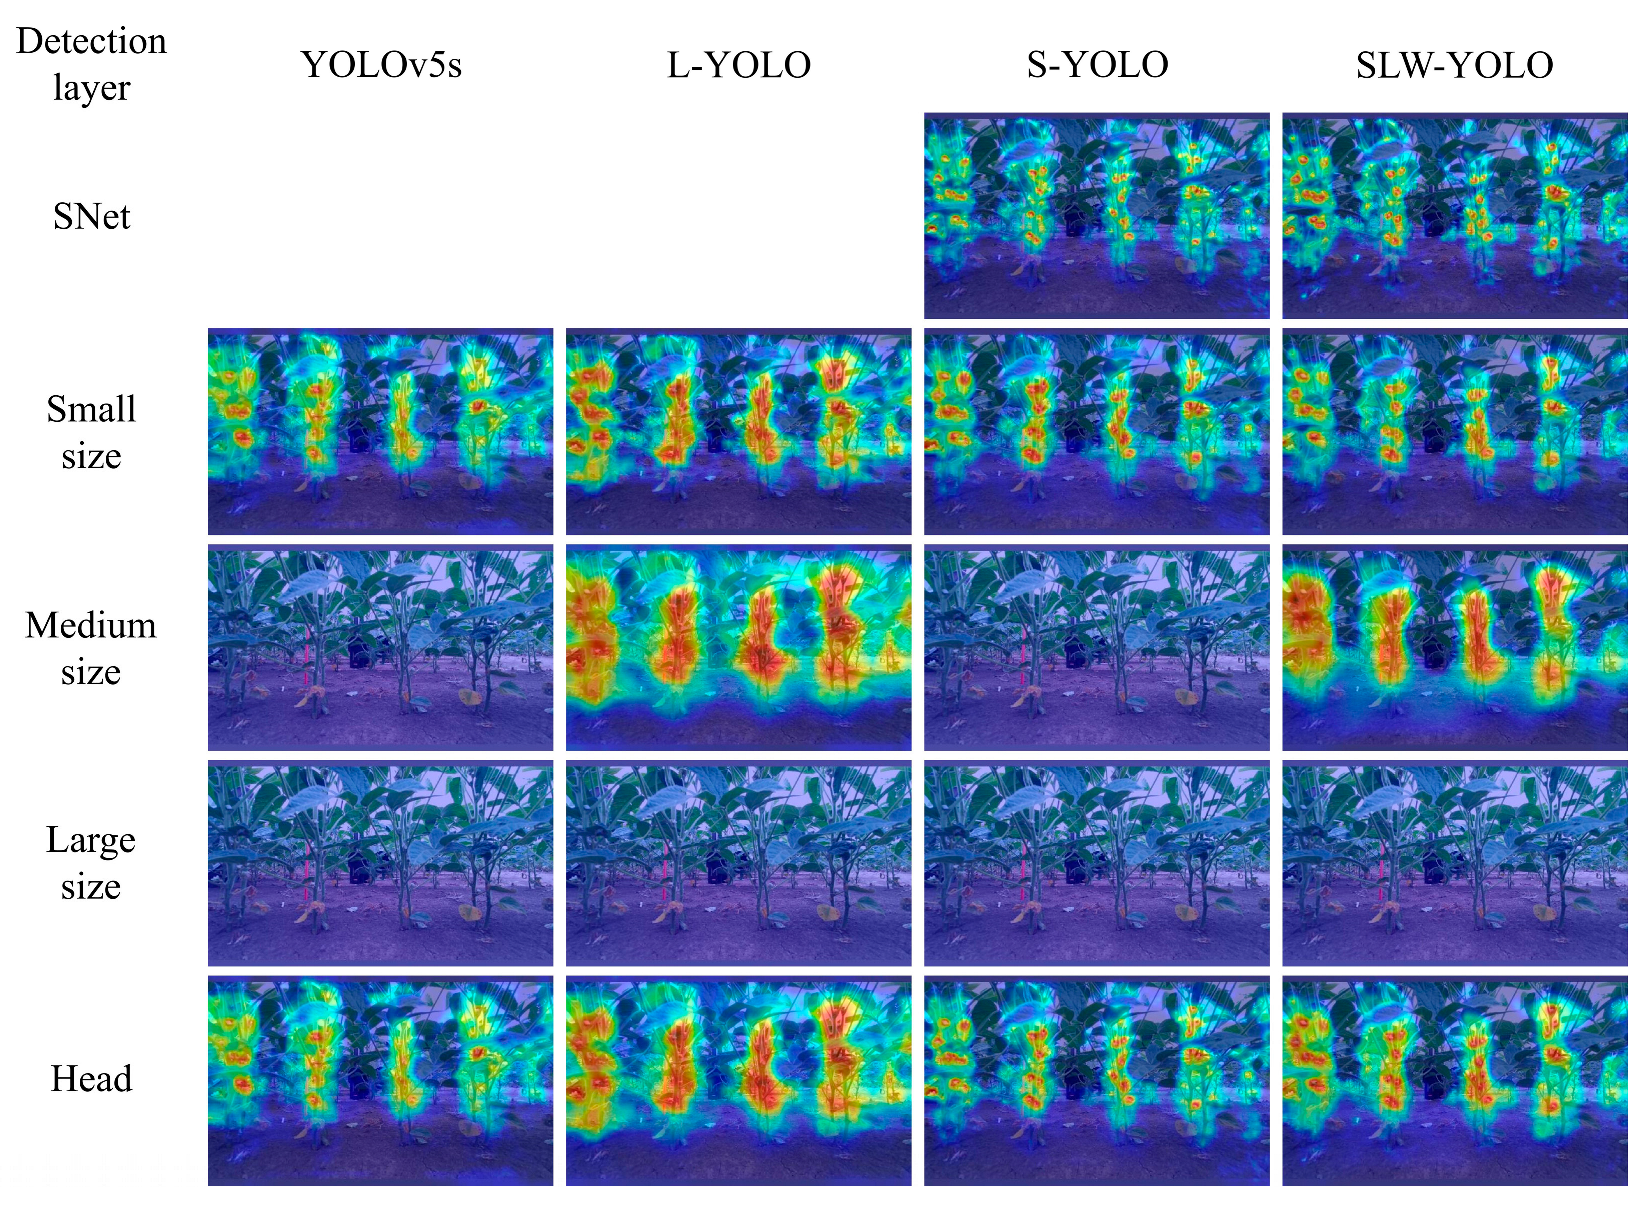
A heat map is a useful tool for visualizing neural network performance and attention distribution [27]. Figure 17 displays the flower detection heat map for various improved methods, illustrating the distribution of attention during the detection process. The heat map indicates that the YOLOv5s model fails to focus on the flower region in the medium-size detection layer. In contrast, the L-YOLO model, incorporating LSKNet attention mechanisms, enables the network to focus on the flower region at that layer. When comparing the S-YOLO and YOLOv5s models, it becomes evident that incorporating the SNet detection layer into the model enables it to focus more on small targets, resulting in a red highlighted area that tightly surrounds the flower target area. When comparing the S-YOLO and SLW-YOLO models, it is observed that the LSKNet attention mechanism contributes significantly to the SLW-YOLO model, leading to the medium-size detection layer of the latter focusing on the flower region. Meanwhile, from the comparison of heat maps between the L-YOLO and SLW-YOLO models, it is evident that the SNet detection layer enhances the focus of the LSKNet attention mechanism on small-target detection.
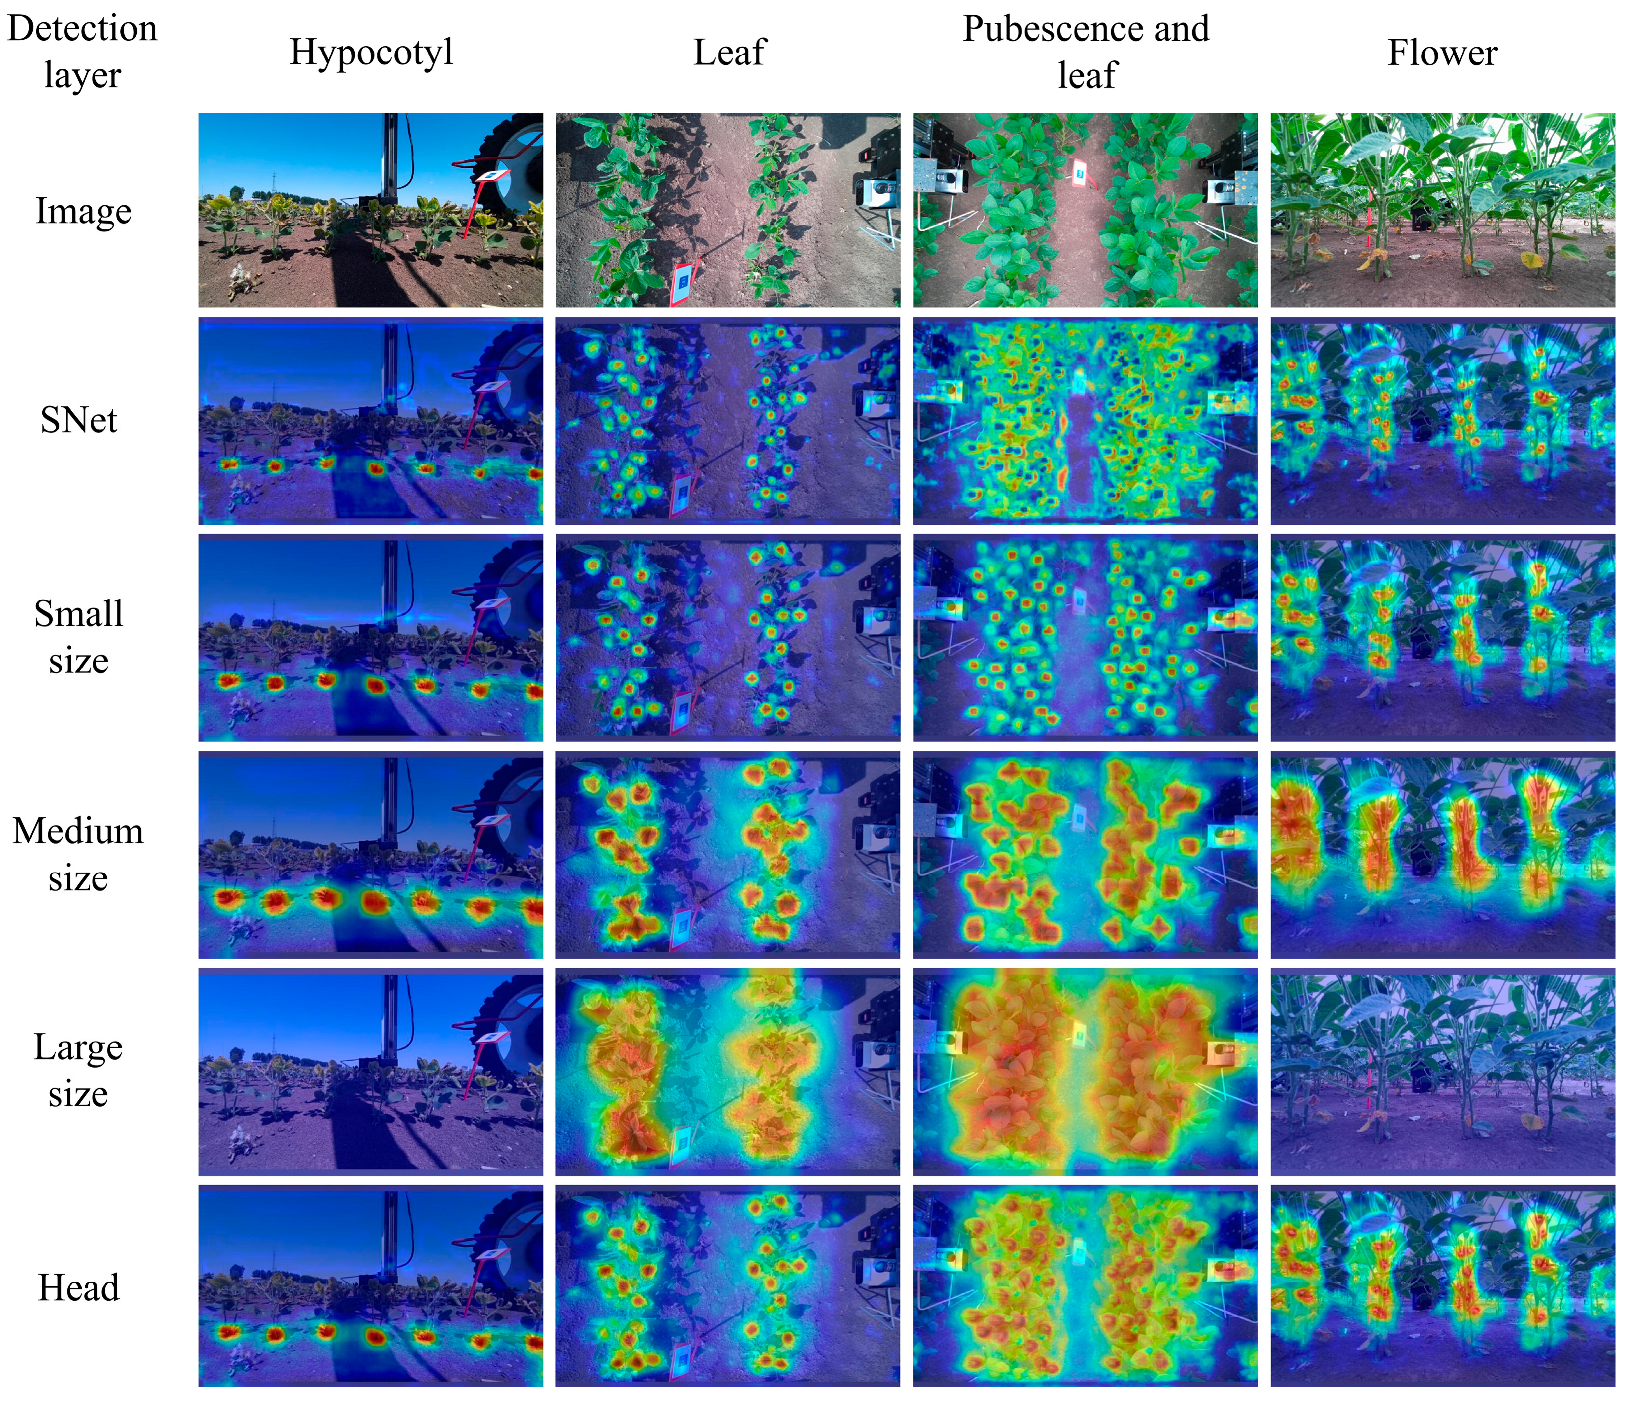
The heat maps, generated by the multi-size detection layer of the SLW-YOLO model when applied to different objects, are presented in Figure 18. Through the heat map, it is observed that the highlighted area in the SNet detection layer tightly encompasses the target regions of the hypocotyls, pubescences, and flowers, demonstrating a high coincidence with the actual target location. The highlighted area in the small-size detection layer also encompasses the target region of the hypocotyls, pubescences, and flowers, but it extends beyond the actual boundaries of the target, covering a larger area. In the medium-size detection layer, more focus was placed on soybean leaves during the vegetative growth stage, whereas less attention was devoted to those at the full flowering stage. The large-size detection layer can detect leaves well during the full flowering stage; however, it cannot effectively detect hypocotyls and flowers. Experiments show that different detection layers of the model exhibit varying degrees of attention to targets of different sizes, and adding SNet to the model enhances its ability to focus on smaller targets.

3.3. Model Performance Verification

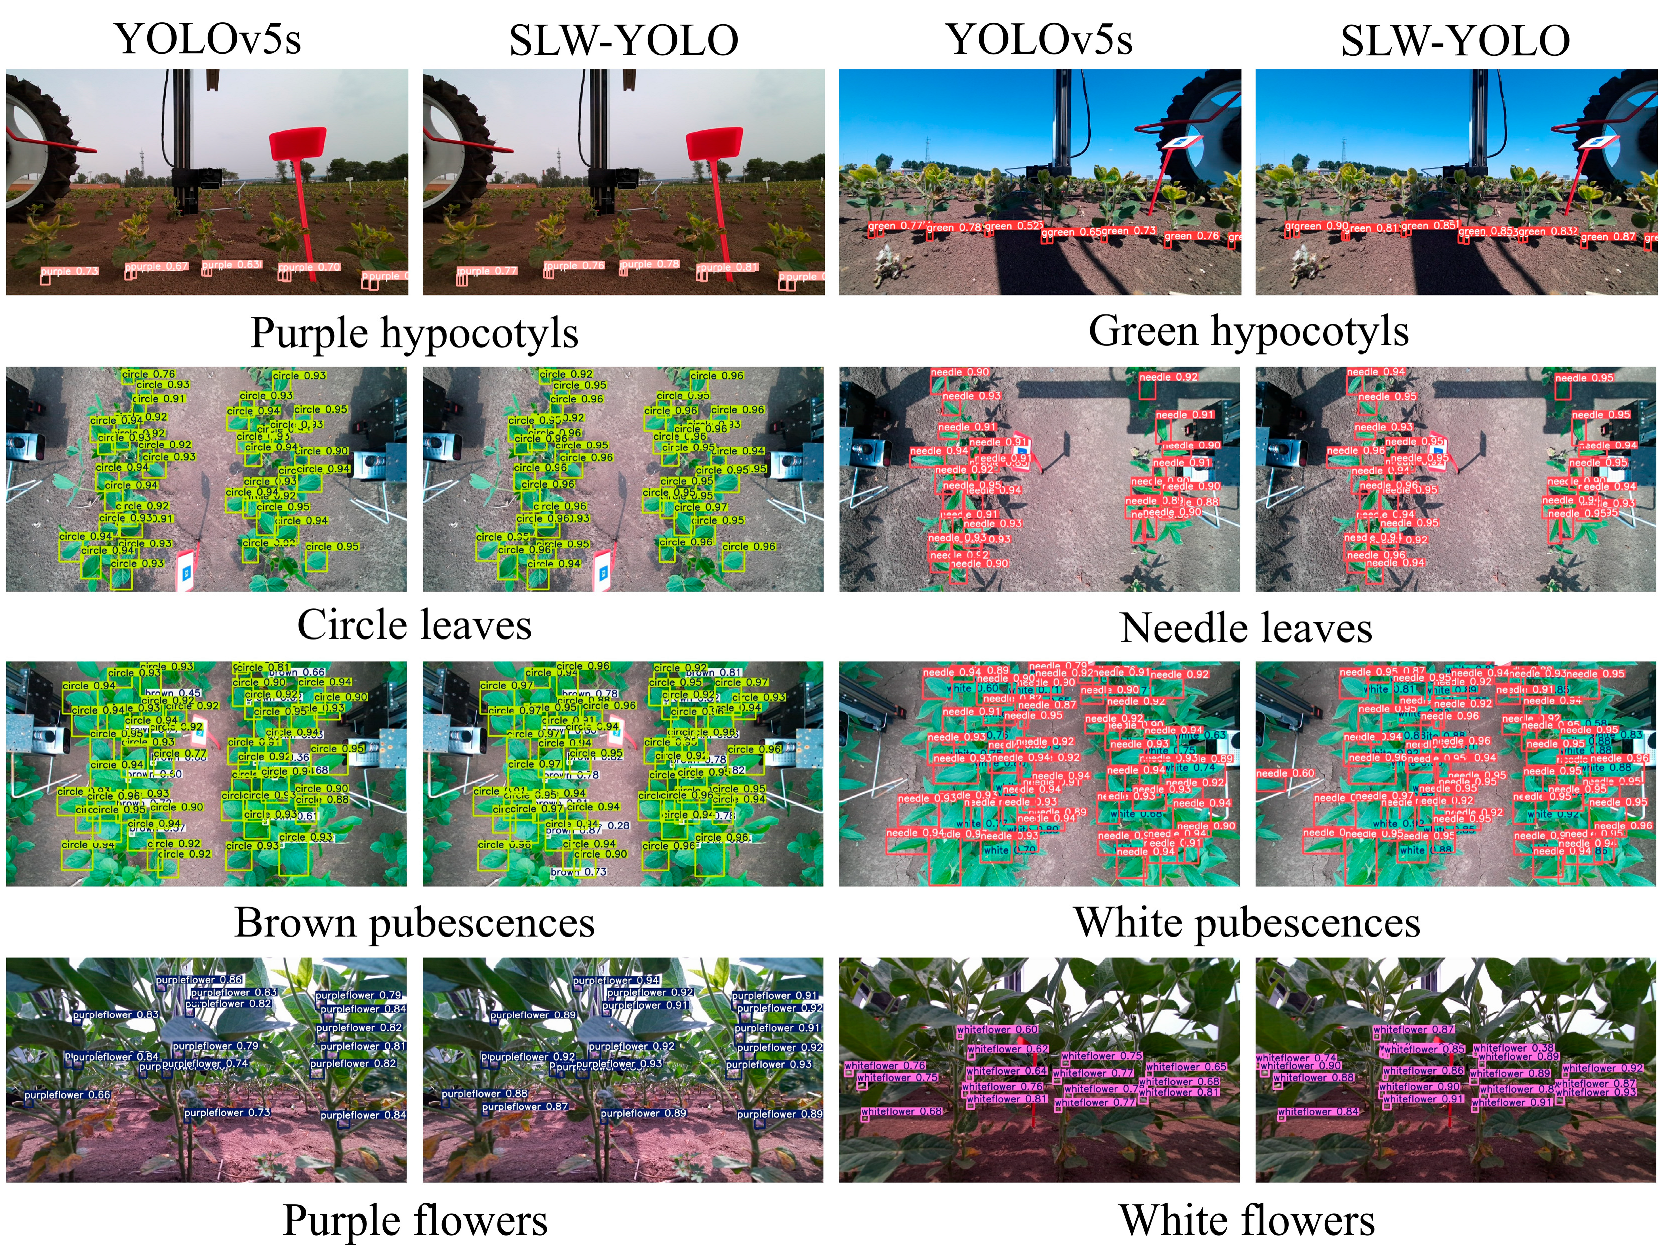
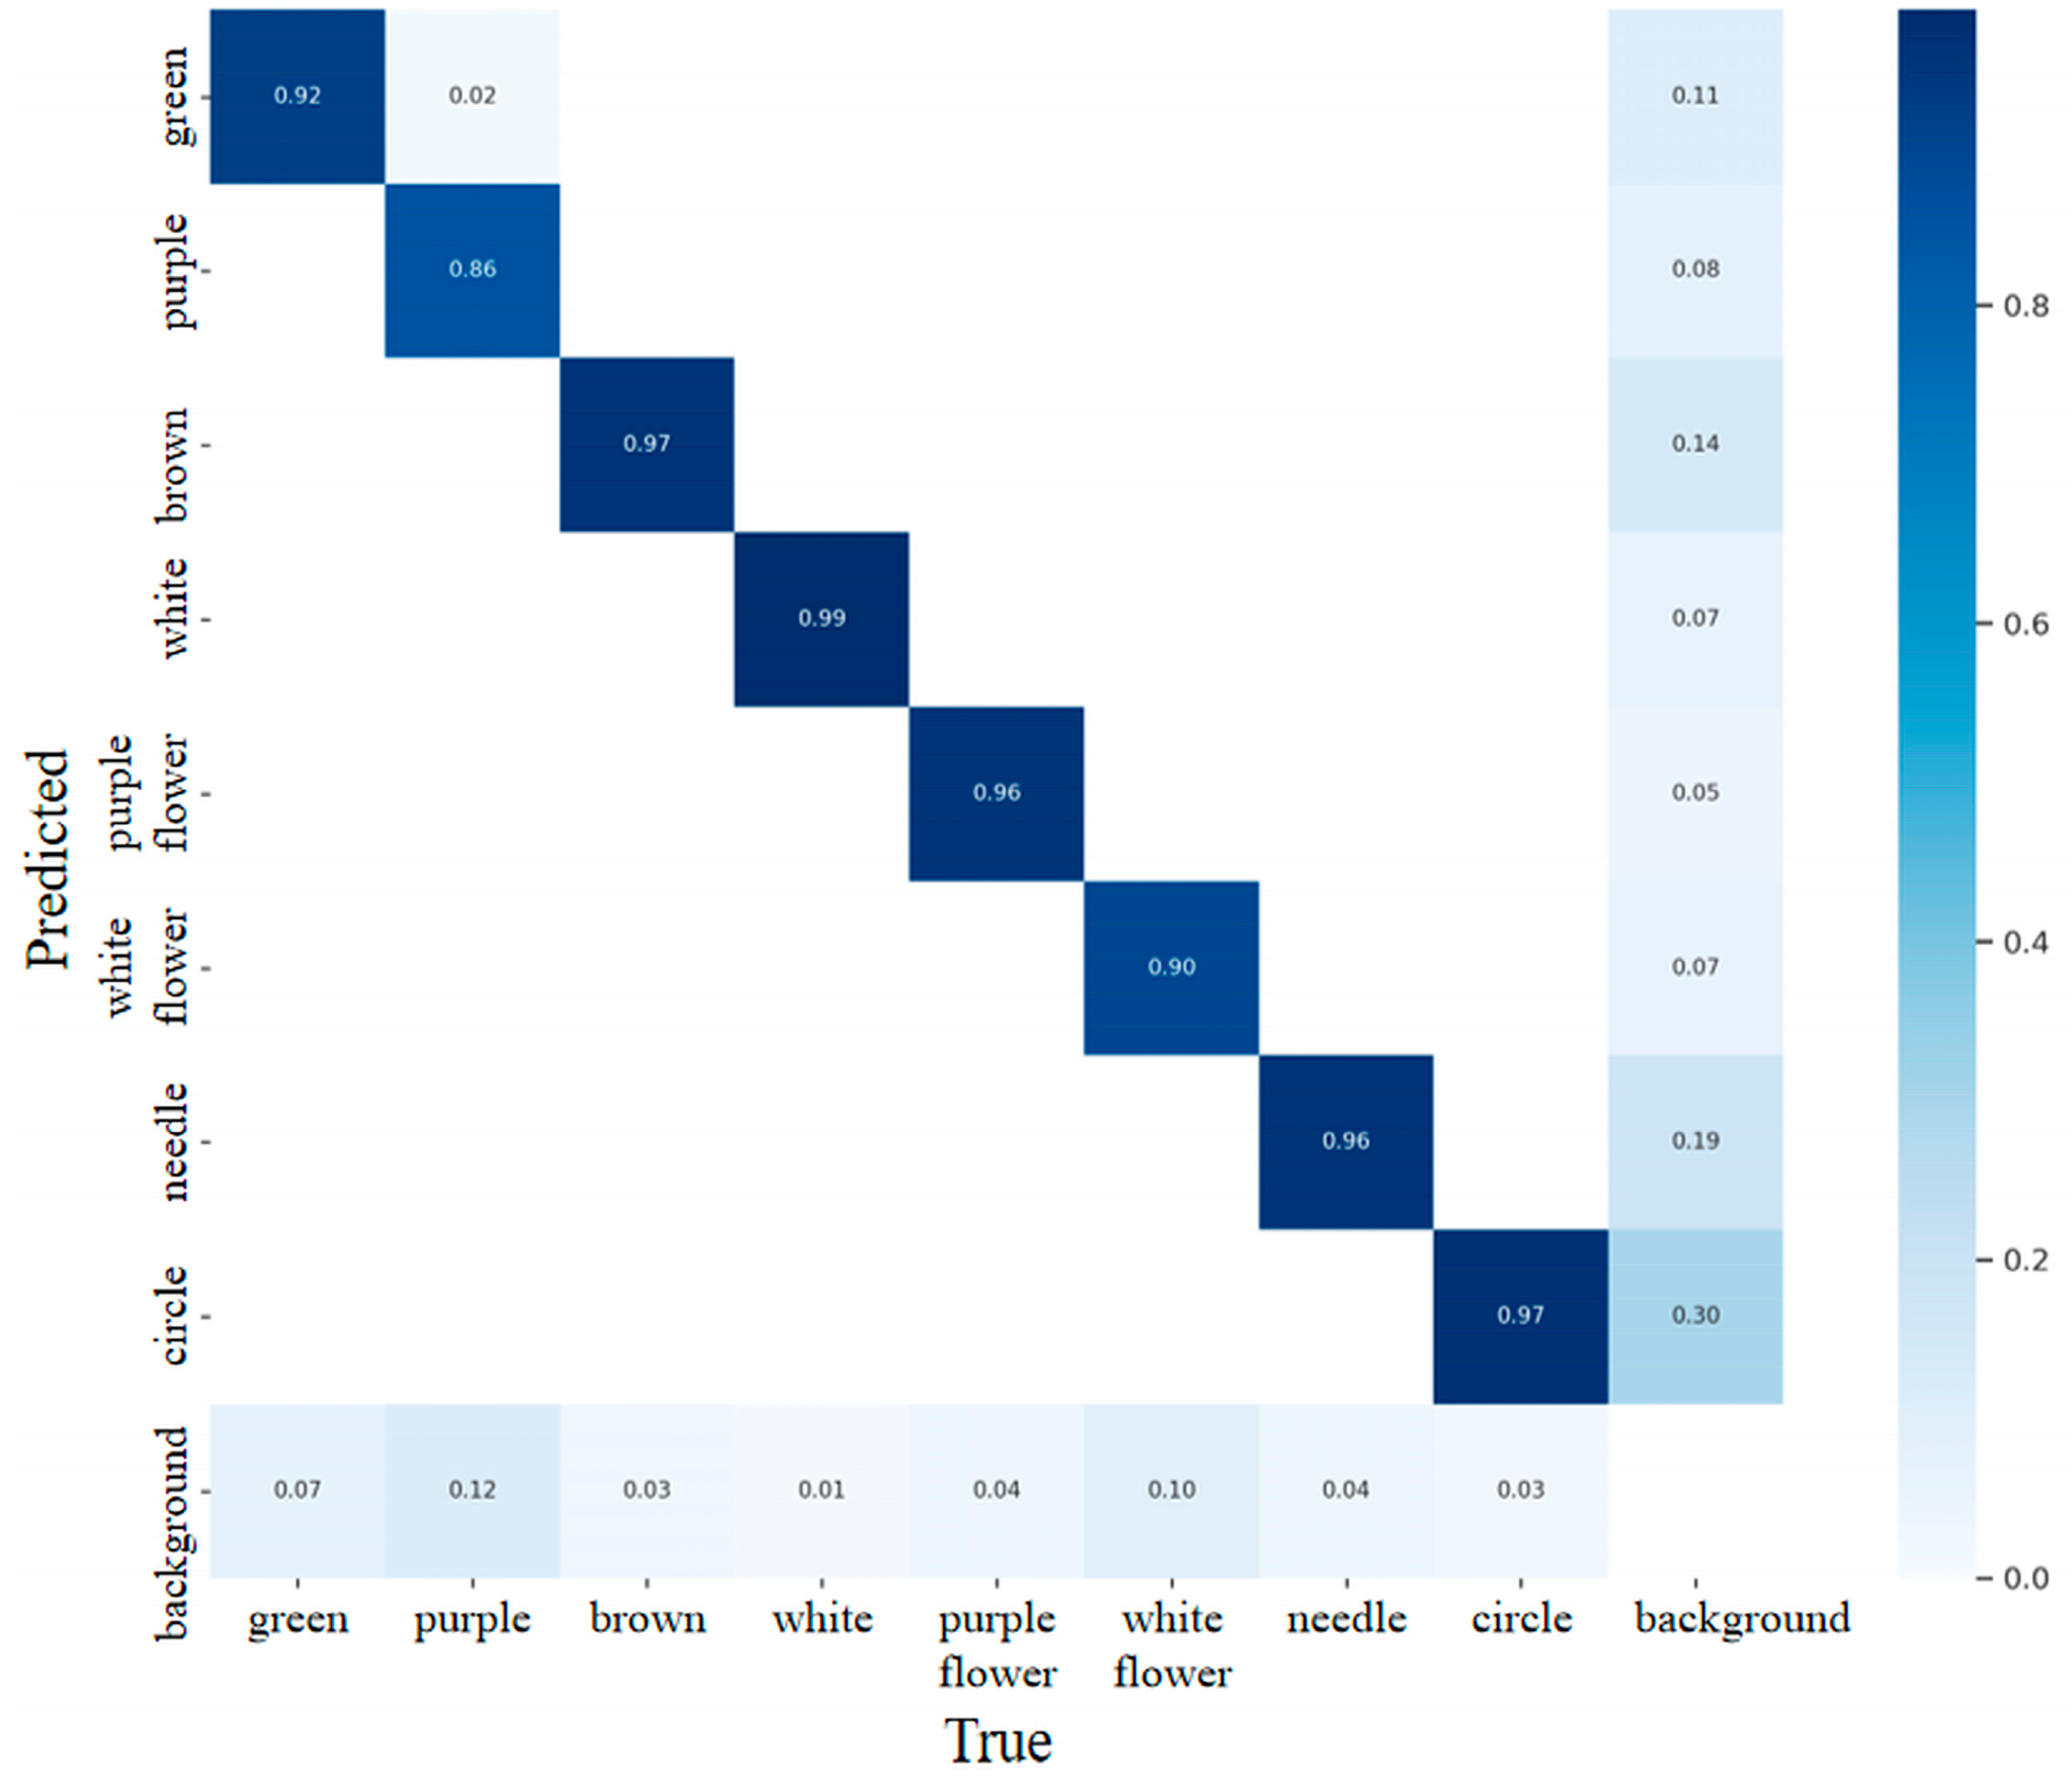
To verify the performance of the SLW-YOLO model, it was applied to detect test datasets, and the results are presented in Figure 19 and Table 8. The SLW-YOLO model exhibits high accuracy in detecting soybean leaf shapes and the colors of hypocotyl, pubescence, and flower, achieving a high confidence score. The confusion matrix of the SLW-YOLO model (Figure 20) indicates high recognition performance, with precision exceeding 90% for seven traits: white pubescence (0.99), brown pubescence (0.97), circle leaf (0.97), needle leaf (0.96), purple flower (0.96), green hypocotyl (0.92), and white flower (0.90). However, the purple hypocotyl trait exhibited reduced precision (0.86), primarily due to its near-ground position and soil-like coloration, both of which hinder visual identification.
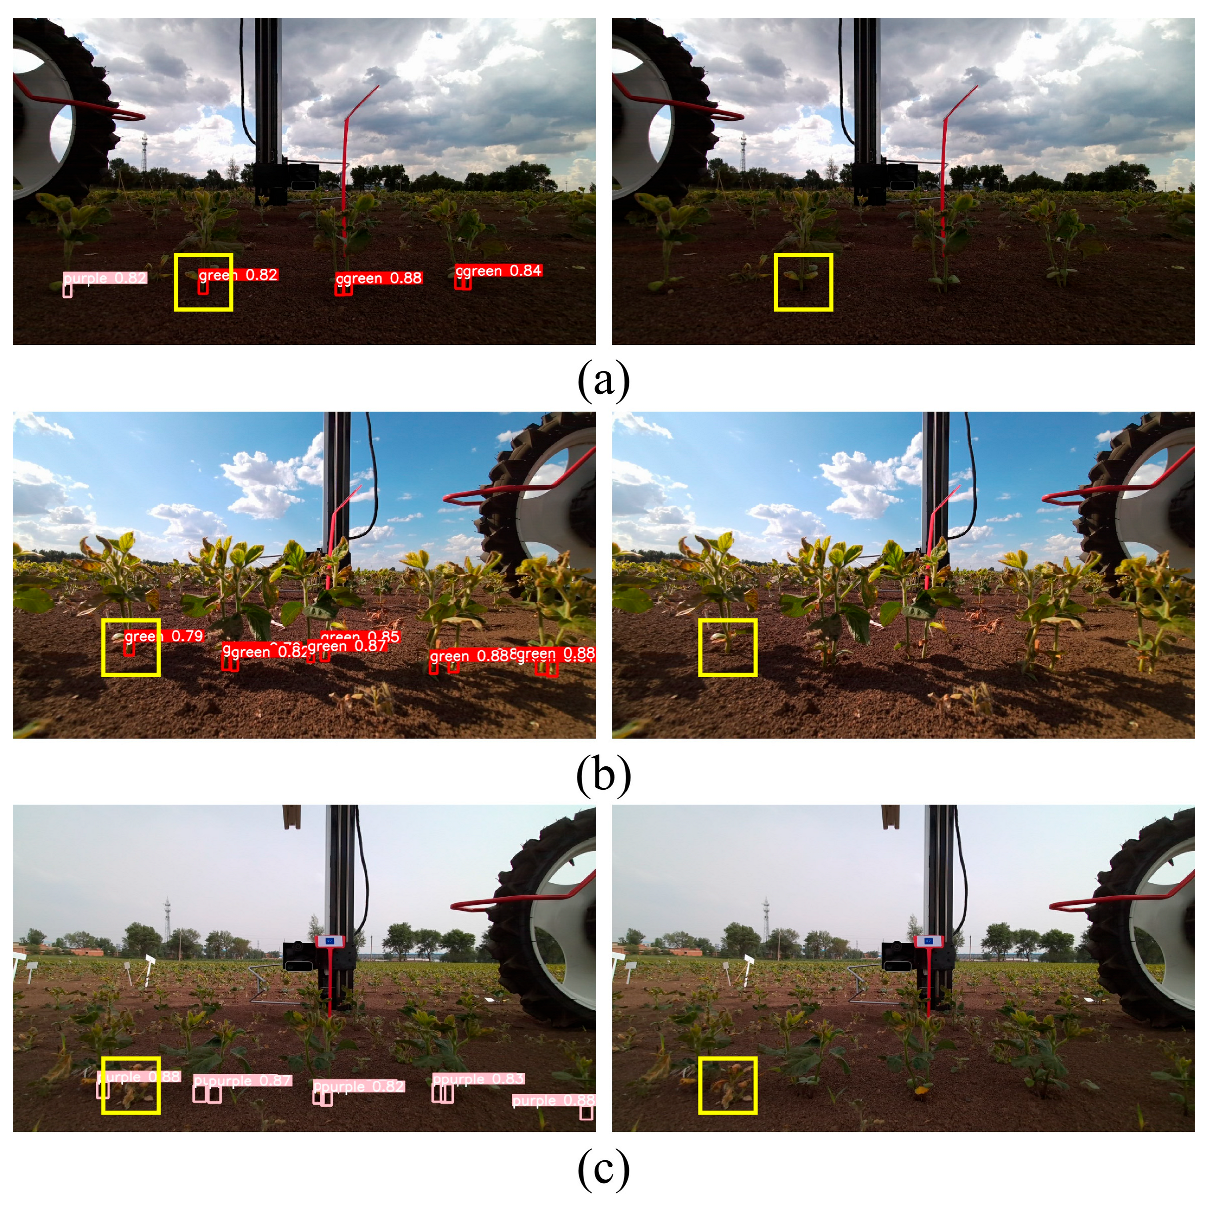
Regarding the hypocotyl trait, the model has missed detections. In comparison with the YOLOv5s model, the SLW-YOLO model has been observed to reduce the number of missed detections, and its confidence score has increased. Several factors contribute to these missed detections, including the following: firstly, two similar hypocotyls may cross each other; secondly, the hypocotyls may be blocked by soil clods or weeds; and thirdly, the close distance between the hypocotyls and the soil surface may make it difficult to obtain effective information (Figure 21). To mitigate these challenges, three strategies are proposed: positioning cameras at optimized elevation angles to distinguish overlapping specimens, employing dual-camera arrays to overcome occlusion limitations, and mounting optical bandpass filters to enhance glare resistance during field imaging. Complementary to these imaging strategies, pre-emergent herbicide application during the seedling phase can reduce background complexity.
In leaf shape detection, missed detections of leaf shapes occur during the vegetative growth period. There are two possible reasons for the missed detections. Firstly, complete leaves parallel to the ground were selected during the labeling process, resulting in a relatively limited observation angle and morphological features. Secondly, during the vegetative growth stage, there is little difference in leaf shape between circle and needle leaves, causing mislabeling or the omission of labels during labeling. However, the soybean leaf shape in the full flowering stage differs significantly and is accurately identifiable. In the detection of pubescence color, the model demonstrates good performance in detecting four categories: circle leaves, needle leaves, brown pubescences, and white pubescences. In flower color detection, the model also demonstrates the ability to differentiate between white and purple flowers.
Compared with the YOLOv5s model, the confidence score of the SLW-YOLO model for the hypocotyl, pubescence, and the flower is greatly improved, while the confidence score of leaves is not significantly improved, which further proves that adding the SNet detection layer can focus the model more on smaller targets. Through comprehensive analysis, the SLW-YOLO model can effectively identify different targets in the complex field environment and can be utilized for phenotypic consistency detection.
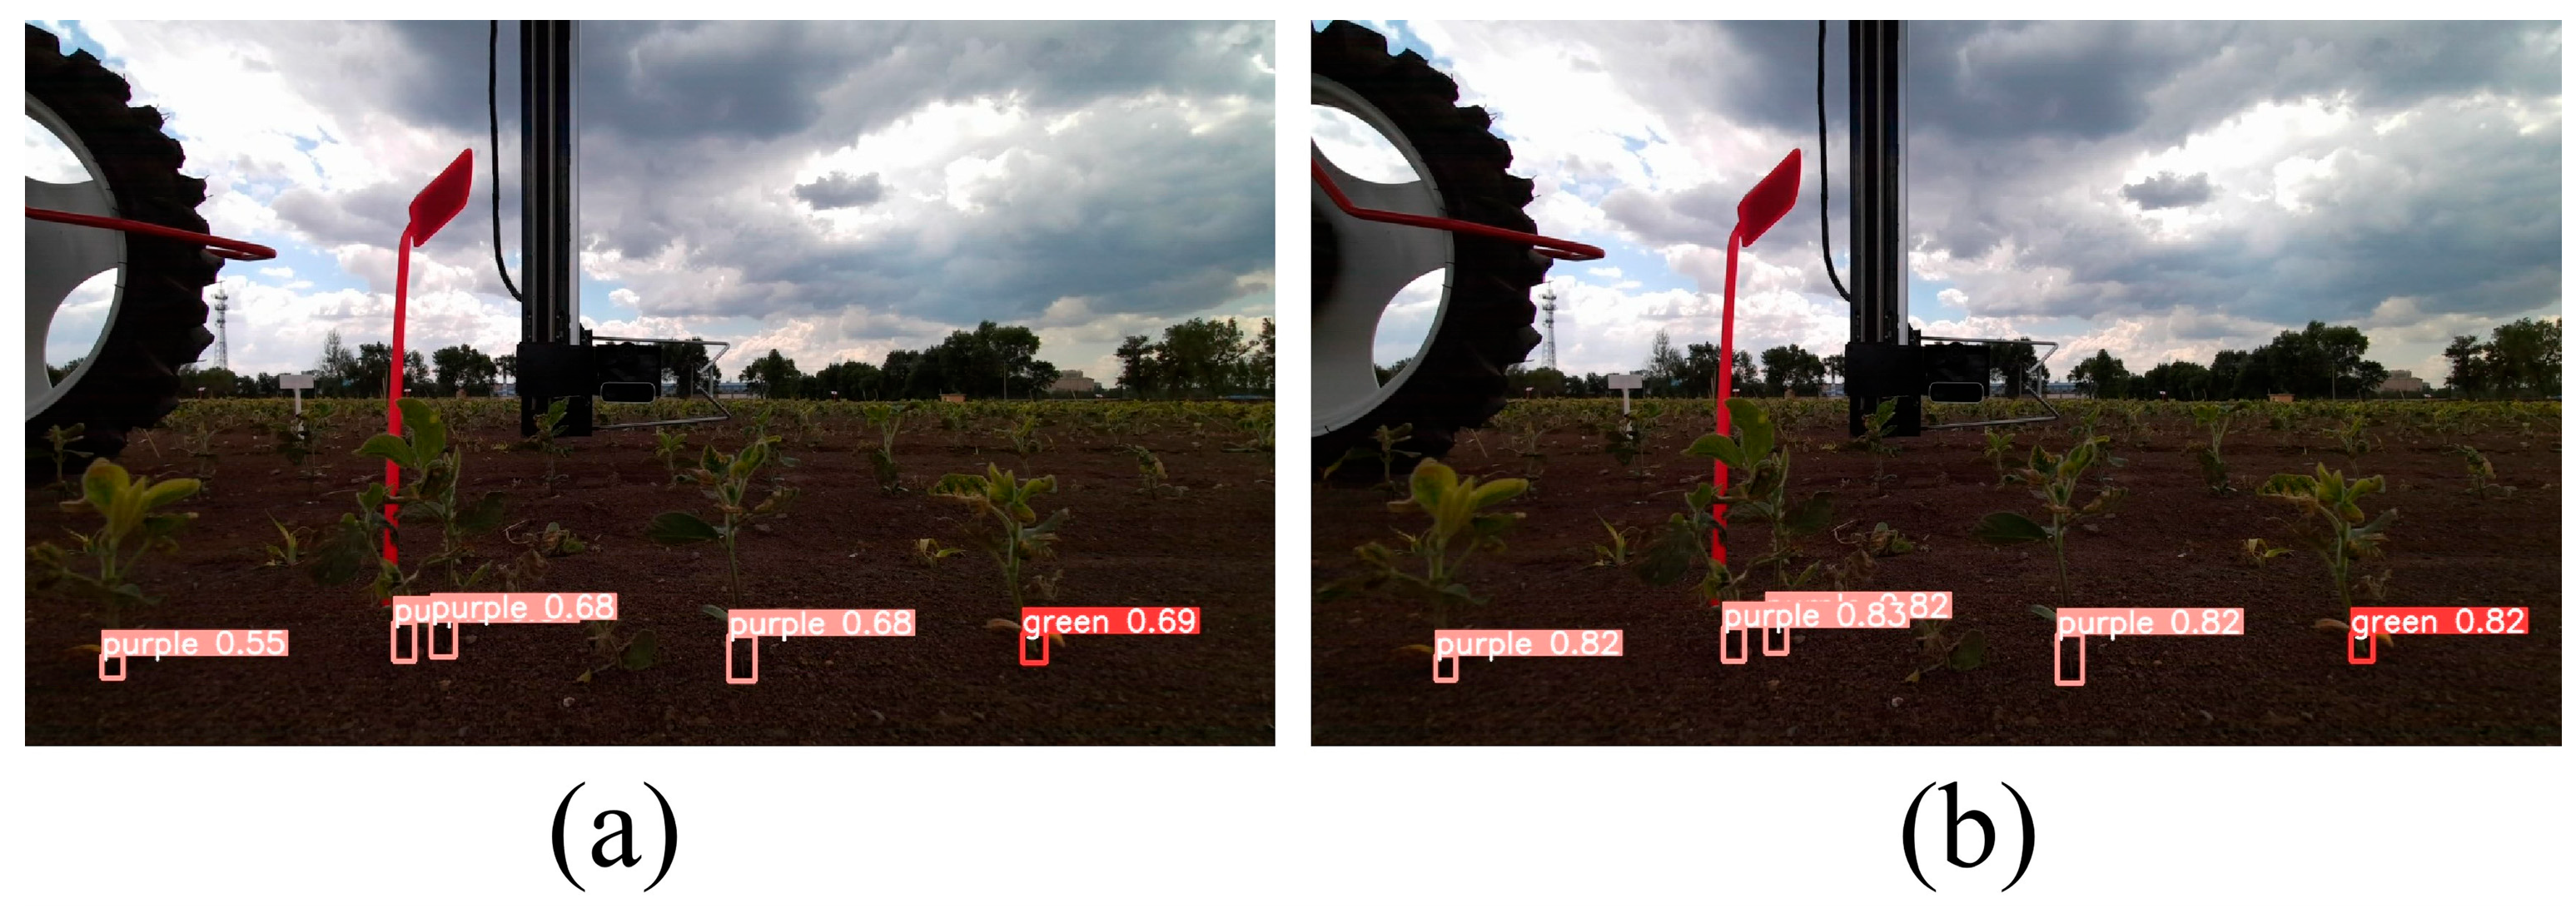
SLW-YOLO and YOLOv5s models were used to detect 100 images of purple hypocotyls, and the detection results were compared and analyzed with manually recorded data. The detection results are presented in Figure 22 and Table 9. The hybrid soybean parents’ phenotypic consistency was calculated using Formula (22). The result of manual recording was 98.9%. Similarly, the phenotypic consistency achieved by YOLOv5s and SLW-YOLO models was also 98.9%. Table 9 shows that the SLW-YOLO model detected more samples than the YOLOv5s model. Although both models’ phenotypic consistency results matched the manual records, the sample count by both models fell short of the manual tally, suggesting the existence of missed detections. This omission is acceptable because leaf shape, pubescence color, and flower color will also be detected in the subsequent growth process of soybeans for phenotypic consistency detection. Therefore, the SLW-YOLO model can meet the requirements for field-based identification of hybrid soybean parents’ phenotypic consistency. The practice code [5] requires that the phenotypic consistency be greater than 99.0%. Therefore, it is necessary to develop hybrid soybean off-type plant-cutting robots that can perform cutting operations once the parents with different phenotypic traits are identified in the process of phenotypic consistency detection. These robots will ensure that the phenotypic consistency of the parents in the seed production field is maintained above 99.0%, meeting the requirements of applications.

4. Discussion

Phenotypic consistency detection in male sterile lines of hybrid soybeans is a crucial step in hybrid soybean seed production and application. A phenotypic consistency detection model for hybrid soybeans, named SLW-YOLO, was established using deep learning technology. Specifically, this model can detect the hypocotyl color at the seedling stage and leaf shape at the vegetative growth stage, as well as leaf shape, pubescence color, and flower color at the full flowering stage. For target detection tasks involving smaller hypocotyls, pubescences, and flowers, the deep feature maps in the YOLOv5s model may result in the detail loss of small-target features because of multiple downsampling operations [28]. The small-target detection layer has fewer downsampling operations, thereby enabling smaller targets to possess higher resolution on the feature map and consequently retaining more details. Therefore, the SNet detection layer, leveraging convolutional neural network technology, is incorporated within the YOLOv5s model, allowing for a deeper extraction of image details by the model.
To enable the model to concentrate on important information while discounting irrelevant information, incorporating an attention mechanism serves as an effective strategy. In the task of phenotypic consistency detection of hybrid soybean parents, the size and shape of the target are uncertain. Traditional convolutional neural networks employ a fixed convolution kernel size, thereby facilitating network design, but they lack the capability to adapt to varying-scale input features. The size of the convolution kernel dictates the size of its receptive field, and a fixed receptive field substantially limits the understanding and analysis of the input features. LSKNet allows for dynamically adjusting the size of the convolution kernel according to the input via a spatial selection mechanism, thereby enabling the model to dynamically adjust the receptive field of each target to more effectively capture its features. Simultaneously, LSKNet demonstrates robust performance in handling targets with spatial variations, and it can more effectively adapt to the variations in different scenarios and objects, thereby enhancing its practical application performance. Hence, the LSKNet attention module is added into the layer preceding the YOLOv5s Backbone network’s SPPF module to boost the detection accuracy.
As the test data are collected in the field, they are subject to varying lighting conditions such as bright light, poor lighting, cloudy days, and evening environments, resulting in a higher proportion of low-quality data. Utilizing low-quality training data may lead the YOLOv5s model to learn inaccurate or misleading features, introduce errors in the recognition process, and impair the model’s recognition accuracy. The WIoU v3 loss function mitigates the adverse effects of low-quality samples on model performance by assigning a lesser penalty to these samples. This enables the model to focus more on learning from high-quality samples. Furthermore, the gradient gain is dynamically adjusted by the WIoU v3 loss function according to the anchor box quality, assigning a smaller gain to high-quality anchor boxes while allocating a higher gain to lower-quality ones. This gradient distribution strategy helps the model focus more on the bounding boxes that need to be optimized, thus improving the object localization accuracy. This approach enables the hybrid soybean cutting robot to better meet the requirements of off-type plant cutting.
Despite SLW-YOLO’s robust performance, this study acknowledges two key limitations: leaf curvature and imaging angle variations significantly impact leaf shape detection accuracy due to projective distortion in 2D imaging systems, which should be addressed through three-dimensional reconstruction technology; furthermore, future implementation requires integrating the model with field-deployable cutting robots to enable the autonomous identification, localization, and removal of off-type plants, establishing a complete phenotypic-to-execution pipeline for hybrid soybean seed production.

5. Conclusions

This study introduces a new method for detecting hybrid soybean parents’ phenotypic consistency in the field. Specifically, a hybrid soybean parent phenotypic consistency detection model, SLW-YOLO, is developed utilizing deep learning technology. The primary conclusions of this study are as follows:
(1)
A hybrid soybean parent phenotypic consistency detection model, SLW-YOLO, was established based on the YOLOv5s network. The model achieved the following: F1 score: 92.3%; mAP: 94.8%; detection speed: 88.3 FPS; and model size: 45.1 MB. Compared to the YOLOv5s model, SLW-YOLO showed improvements in F1 score by 6.1% and mAP by 5.4%, while the detection speed decreased by 42.1 FPS and the model size increased by 31.4 MB.
(2)
To obtain field soybean plant image datasets, a self-propelled image acquisition platform was designed, which is suitable for field hybrid soybean cultivation mode.
(3)
The SLW-YOLO model is capable of completing the task of phenotypic consistency detection of hybrid soybean parents in a complicated field environment, accelerating seed production, improving the efficiency of phenotypic consistency detection, and thereby providing technical support for breeding experts to engage in soybean hybrid breeding and large-scale seed production.

Author Contributions

Conceptualization, C.Y.; Data curation, C.Y., J.L., and W.S.; Formal analysis, C.Y. and J.L.; Funding acquisition, W.Z.; Investigation, C.Y., J.L., and Z.G.; Methodology, C.Y. and Z.G.; Resources, C.Z.; Software, C.Y.; Supervision, W.S., L.Q., W.Z., and C.Z.; Validation, C.Y. and L.Q.; Writing—original draft, C.Y.; Writing—review and editing, W.Z. and C.Z. All authors have read and agreed to the published version of the manuscript.

Funding

This study was funded in part by the earmarked Fund for China Agriculture Research System (CARS-04-PS32), in part by the Heilongjiang Bayi Agricultural University Research Initiation Programme for Scholars and Imported Talents (XYB202306), and in part by the Guiding Science and Technology Plan Project in Daqing City (ZD-2024-24).

Institutional Review Board Statement

This research does not require ethical approval.

Data Availability Statement

The data presented in this study are available on request from the corresponding author. The data are not publicly available due to ongoing research utilizing the same dataset for future publications.

Conflicts of Interest

The authors declare that they have no known competing financial interests or personal relationships that could have appeared to influence the work reported in this paper.

References

  1. Gai, J.; Ding, D.; Cui, Z.; Qiu, J. Development and performance of the cytoplasmic-nuclear male sterile line NJCMS1A of soybean. Sci. Agric. Sin. 1999, 32, 23–27. (In Chinese) [Google Scholar]
  2. Zhang, C.; Zhao, L.; Peng, B.; Zhang, J.; Yan, H.; Zhang, W.; Lin, C.; Wang, P.; Ding, X. DB22/T 3177-2020; Code of Practice of Cytoplasmic-Nuclear Interaction Male Sterile Line of Hybrid Soybean. Jilin Provincial Market Supervision and Administration Bureau: Changchun, China, 2020. (In Chinese) [Google Scholar]
  3. Li, J.; Nadeem, M.; Sun, G.; Wang, X.; Qiu, L. Male sterility in soybean: Occurrence, molecular basis and utilization. Plant Breed. 2019, 138, 659–676. [Google Scholar] [CrossRef]
  4. Sun, H.; Li, S.; Li, M.; Liu, H.; Qiao, L.; Zhang, Y. Research progress of image sensing and deep learning in agriculture. Trans. Chin. Soc. Agric. Mach. 2020, 51, 1–17. (In Chinese) [Google Scholar] [CrossRef]
  5. Wei, P.; Jiang, T.; Peng, H.; Jin, H.; Sun, H.; Chai, D.; Huang, J. Coffee flower identification using binarization algorithm based on convolutional neural network for digital images. Plant Phenomics 2020, 2020, 6323965. [Google Scholar] [CrossRef]
  6. Jiang, Y.; Li, C.; Xu, R.; Sun, S.; Robertson, J.S.; Paterson, A.H. DeepFlower: A deep learning-based approach to characterize flowering patterns of cotton plants in the field. Plant Methods 2020, 16, 156. [Google Scholar] [CrossRef]
  7. Zhang, Y.; He, S.; Wa, S.; Zong, Z.; Liu, Y. Using generative module and pruning inference for the fast and accurate detection of apple flower in natural environments. Information 2021, 12, 495. [Google Scholar] [CrossRef]
  8. Li, G.; Suo, R.; Zhao, G.; Gao, C.; Fu, L.; Shi, F.; Dhupia, J.; Li, R.; Cui, Y. Real-time detection of kiwifruit flower and bud simultaneously in orchard using YOLOv4 for robotic pollination. Comput. Electron. Agric. 2022, 193, 106641. [Google Scholar] [CrossRef]
  9. Gong, W.; Yang, Z.; Li, K.; Hao, W.; He, Z.; Ding, X.; Cui, Y. Detecting kiwi flowers in natural environments using an improved YOLOv5s. Trans. Chin. Soc. Agric. Eng. 2023, 39, 177–185. (In Chinese) [Google Scholar] [CrossRef]
  10. Wang, C.; Wang, Y.; Liu, S.; Lin, G.; He, P.; Zhang, Z.; Zhou, Y. Study on pear flowers detection performance of YOLO-PEFL model trained with synthetic target images. Front. Plant Sci. 2022, 13, 911473. [Google Scholar] [CrossRef]
  11. Shang, Y.; Xu, X.; Jiao, Y.; Wang, Z.; Hua, Z.; Song, H. Using lightweight deep learning algorithm for real-time detection of apple flowers in natural environments. Comput. Electron. Agric. 2023, 207, 107765. [Google Scholar] [CrossRef]
  12. Zhao, W.; Wu, D.; Zheng, X. Detection of chrysanthemums inflorescence based on improved CR-YOLOv5s algorithm. Sensors 2023, 23, 4234. [Google Scholar] [CrossRef]
  13. Omura, K.; Yahata, S.; Ozawa, S.; Ohkawa, T.; Chonan, Y.; Tsuji, H.; Murakami, N. An image sensing method to capture soybean growth state for smart agriculture using single shot multibox detector. In Proceedings of the 2018 IEEE International Conference on Systems, Man, and Cybernetics, Miyazaki, Japan, 7–10 October 2018; pp. 1693–1698. [Google Scholar] [CrossRef]
  14. Pratama, M.T.; Kim, S.; Ozawa, S.; Ohkawa, T.; Chona, Y.; Tsuji, H.; Murakami, N. Deep learning-based object detection for crop monitoring in soybean fields. In Proceedings of the 2020 International Joint Conference on Neural Networks, Glasgow, UK, 19–24 July 2020; pp. 1–7. [Google Scholar] [CrossRef]
  15. Zhu, R.; Wang, X.; Yan, Z.; Qiao, Y.; Tian, H.; Hu, Z.; Zhang, Z.; Li, Y.; Zhao, H.; Xin, D.; et al. Exploring soybean flower and pod variation patterns during reproductive period based on fusion deep learning. Front. Plant Sci. 2022, 13, 922030. [Google Scholar] [CrossRef]
  16. Yue, Y.; Zhang, W. Detection and Counting Model of Soybean at the Flowering and Podding Stage in the Field Based on Improved YOLOv5. Agriculture 2025, 15, 528. [Google Scholar] [CrossRef]
  17. Liu, L.; Liang, J.; Wang, J.; Hu, P.; Wan, L.; Zheng, Q. An improved YOLOv5-based approach to soybean phenotype information perception. Comput. Electr. Eng. 2023, 106, 108582. [Google Scholar] [CrossRef]
  18. Zhao, K.; Li, J.; Shi, W.; Qi, L.; Yu, C.; Zhang, W. Field-based soybean flower and pod detection using an improved YOLOv8-VEW method. Agriculture 2024, 14, 1423. [Google Scholar] [CrossRef]
  19. Lin, M.S.; Nelson, R.L. Relationship between plant height and flowering date in determinate soybean. Crop Sci. 1988, 28, 27–30. [Google Scholar] [CrossRef]
  20. Sun, Y.; Zhao, L.; Zhang, W.; Zhang, C. Research Progress on Utilization of Soybean Heterosis. Soybean Sci. Technol. 2021, 6, 26–35. (In Chinese) [Google Scholar]
  21. Li, Y.; Hou, Q.; Zheng, Z.; Cheng, M.M.; Yang, J.; Li, X. Large selective kernel network for remote sensing object detection. In Proceedings of the IEEE/CVF International Conference on Computer Vision, Paris, France, 1–6 October 2023. [Google Scholar]
  22. Wang, J.; Tan, D.; Sui, L.; Guo, J.; Wang, R. Wolfberry recognition and picking-point localization technology in natural environments based on improved Yolov8n-Pose-LBD. Comput. Electron. Agric. 2024, 227, 109551. [Google Scholar] [CrossRef]
  23. Yu, C.; Li, J.; Shi, W.; Qi, L.; Guan, Z.; Zhang, W.; Zhang, C. Color detection model of hybrid soybean hypocotyl based on an improved YOLOv7 object detection model. J. China Agric. Univ. 2024, 29, 11–22. (In Chinese) [Google Scholar] [CrossRef]
  24. Xiao, D.; Wang, H.; Liu, Y.; Li, W.; Li, H. DHSW-YOLO: A duck flock daily behavior recognition model adaptable to bright and dark conditions. Comput. Electron. Agric. 2024, 225, 109281. [Google Scholar] [CrossRef]
  25. Tong, Z.; Chen, Y.; Xu, Z.; Yu, R. Wise-IoU: Bounding box regression loss with dynamic focusing mechanism. arXiv 2023. [Google Scholar] [CrossRef]
  26. Du, X.; Cheng, H.; Ma, Z.; Lu, W.; Wang, M.; Meng, Z.; Jiang, C.; Hong, F. DSW-YOLO: A detection method for ground-planted strawberry fruits under different occlusion levels. Comput. Electron. Agric. 2023, 214, 108304. [Google Scholar] [CrossRef]
  27. Chen, X.; Liu, T.; Han, K.; Jin, X.; Wang, J.; Kong, X.; Yu, J. TSP-yolo-based deep learning method for monitoring cabbage seedling emergence. Eur. J. Agron. 2024, 157, 127191. [Google Scholar] [CrossRef]
  28. Zhou, J.; Su, T.; Li, K.; Dai, J. Small Target-YOLOv5: Enhancing the Algorithm for Small Object Detection in Drone Aerial Imagery Based on YOLOv5. Sensors 2023, 24, 134. [Google Scholar] [CrossRef] [PubMed]
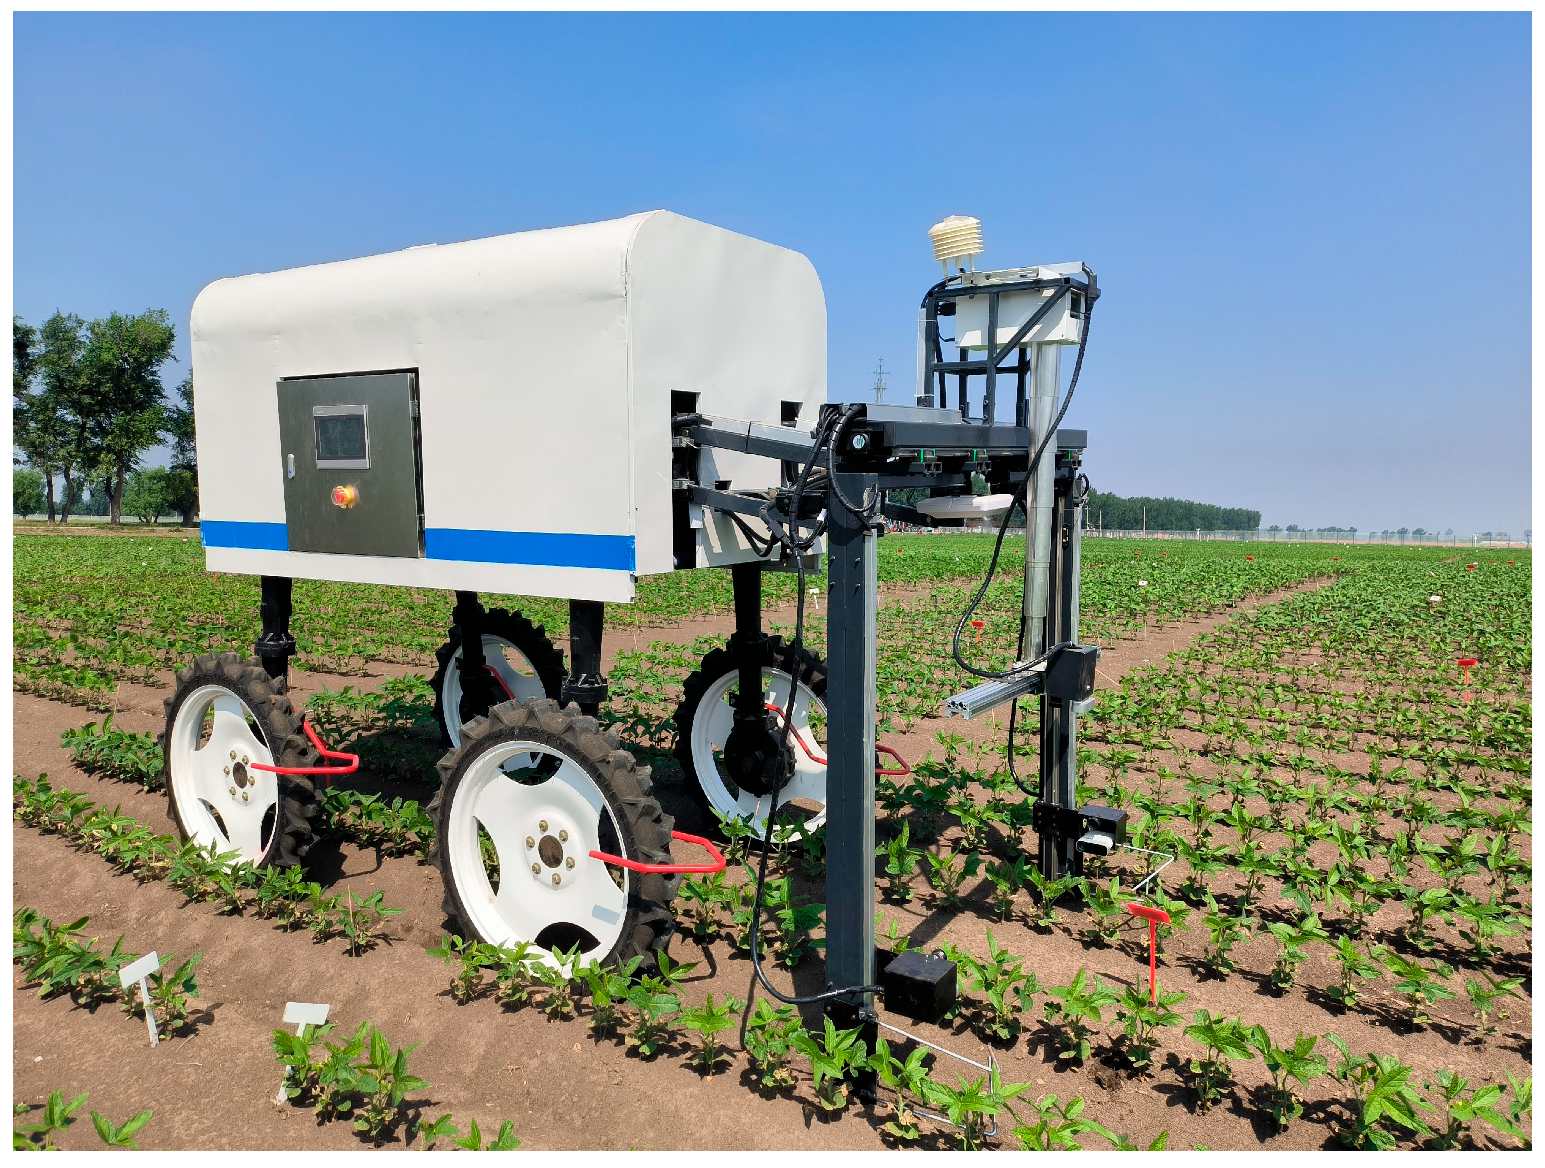
Figure 1. Self-propelled image acquisition platform.
Agriculture 15 02001 g001
Figure 2. Platform structure diagram.
Agriculture 15 02001 g002
Figure 3. Raw images. (a) Hypocotyl image. (b) Leaf image. (c) Pubescence image. (d) Flower image.
Agriculture 15 02001 g003
Figure 4. Soybean leaf shape. (a) Round leaf. (b) Ovate-round leaf. (c) Elliptical leaf. (d) Lanceolate leaf.
Agriculture 15 02001 g004
Figure 5. Labeling rules. (a) Hypocotyl. (b) Leaf. (c) Pubescence. (d) Flower.
Agriculture 15 02001 g005
Figure 6. Network structure of SLW-YOLO model.
Agriculture 15 02001 g006
Figure 7. Scale distribution diagram of bounding boxes.
Agriculture 15 02001 g007
Figure 8. LSK Block network structure.
Agriculture 15 02001 g008
Figure 9. LSK model network structure.
Agriculture 15 02001 g009
Figure 10. Diagram of the bounding box regression.
Agriculture 15 02001 g010
Figure 11. The mAP curve of different YOLO models.
Agriculture 15 02001 g011
Figure 12. The mAP curve of different attention mechanisms.
Agriculture 15 02001 g012
Figure 13. The mAP curve of different network structures.
Agriculture 15 02001 g013
Figure 14. The mAP curve of different loss functions.
Agriculture 15 02001 g014
Figure 15. Loss comparison curve of validation set bounding box regression.
Agriculture 15 02001 g015
Figure 16. The mAP curve of ablation test.
Agriculture 15 02001 g016
Figure 17. Flower detection heat map with different improved methods.
Agriculture 15 02001 g017
Figure 18. Multi-size detection layer heat maps of SLW-YOLO model for various objects.
Agriculture 15 02001 g018
Figure 19. Detection results of different indicators.
Agriculture 15 02001 g019
Figure 20. The confusion matrix of the SLW-YOLO model.
Agriculture 15 02001 g020
Figure 21. Example of missed detection. (a) Occlusion. (b) Cross-over. (c) Near-ground background clutter.
Agriculture 15 02001 g021
Figure 22. Detection results. (a) Yolov5s. (b) SLW-YOLO.
Agriculture 15 02001 g022
Table 1. The division of datasets.
Image TagTraining SetValidation SetTest Set
Hypocotyl2000500100
Leaf2000500100
Pubescence2000500100
Flower2000500100
Table 2. Test results of different YOLO models.
ModelPrecision (%)Recall (%)F1 Score (%)mAP50 (%)Detection Speed (FPS)Model Size
(MB)
YOLOv446.489.761.267.022.6 ± 2.9491.0
YOLOv5s89.483.386.289.4130.4 ± 9.413.7
YOLOv769.766.368.070.319.3 ± 1.971.3
YOLOv8n74.568.471.373.8211.1 ± 5.16.0
YOLOv10s87.179.683.287.2209.3 ± 5.615.7
Note: All competing models trained with aligned epochs and core hyperparameters. Inference benchmark conditions: single NVIDIA RTX 4090 GPU, 640 × 640 input, batch size = 1, conf-thres = 0.25, and NMS = 0.45. FPS: mean ± std of five consecutive runs (200 test images). These same conditions apply to all subsequent results.
Table 3. Test results of different attention mechanisms.
ModelPrecision (%)Recall (%)F1 Score (%)mAP50 (%)Detection Speed (FPS)Model Size
(MB)
YOLOv5s89.483.386.289.4130.4 ± 9.413.7
+SE89.182.385.689.0129.5 ± 2.313.7
+CBAM89.082.585.688.9124.7 ± 5.913.7
+CA89.783.586.589.6126.8 ± 6.313.7
+ECA89.583.786.589.7131.3 ± 2.613.7
+LSKNet91.989.090.493.4123.4 ± 5.356.9
+SCConv92.188.390.293.0113.5 ± 2.758.7
+DilateFormer89.383.686.489.4118.5 ± 2.316.0
Abbreviations: SE, Squeeze-and-Extraction Attention; CBAM, Convolutional Block Attention Module; CA, Coordinate Attention; ECA, Efficient Channel Attention; LSKNet, Large Separable Kernel Network; SCConv, Spatial and Channel Reconstruction Convolution; and DilateFormer, Multi-Scale Dilated Transformer.
Table 4. Test results of different network structures.
ModelPrecision (%)Recall (%)F1 Score (%)mAP50 (%)Detection Speed (FPS)Model Size
(MB)
YOLOv5s89.483.386.289.4130.4 ± 9.413.7
+MobileNetV379.871.375.376.880.0 ± 4.610.0
+ShuffleNetV278.770.774.575.792.8 ± 3.87.6
+EfficientNetv273.261.566.864.780.4 ± 3.510.9
+GhostNet90.683.878.189.180.1 ± 4.443.1
+Swin TransformerV179.773.076.278.4105.8 ± 9.96.7
+RepViT89.182.585.788.9119.8 ± 5.016.2
+MobileViTv189.883.786.690.1123.2 ± 7.616.7
+MobileViTv289.483.786.589.4123.0 ± 4.814.4
+BiFPN89.083.386.189.2123.6 ± 8.414.0
+AFPN89.083.386.189.093.1 ± 3.114.8
+SNet93.389.191.293.893.8 ± 5.141.5
Table 5. Test results of different loss functions.
ModelPrecision (%)Recall (%)F1 Score (%)mAP50 (%)Detection Speed (FPS)Model Size
(MB)
YOLOv5s89.483.386.289.4130.4 ± 9.413.7
+EIoU90.183.186.589.6127.7 ± 4.013.7
+AlphaIoU85.278.081.484.5129.5 ± 2.213.7
+SIoU89.283.586.389.5130.7 ± 5.913.7
+WIoU v389.484.086.689.9124.9 ± 3.213.7
+MPDIoU89.683.686.589.9128.1 ± 4.313.7
Abbreviations: EIoU, Efficient Intersection over Union; AlphaIoU, Alpha Intersection over Union; SIoU, Structured Intersection over Union; WIoU v3, Wise Intersection over Union v3; and MPDIoU, Minimum Point Distance based Intersection over Union.
Table 6. Ablation test combinations.
ModelLSKNetSNetWIoU v3
LW-YOLO
SL-YOLO
SW-YOLO
SLW-YOLO
Note: ‘√’ indicates training with this model.
Table 7. Results of ablation test.
ModelPrecision (%)Recall (%)F1 Score (%)mAP50 (%)Detection Speed (FPS)Model Size
(MB)
YOLOv5s89.483.386.289.4130.4 ± 9.413.7
LW-YOLO93.289.291.293.8120.3 ± 2.756.9
SL-YOLO93.789.891.794.184.7 ± 3.445.1
SW-YOLO93.190.591.894.692.6 ± 3.841.5
SLW-YOLO94.090.692.394.888.3 ± 6.745.1
Table 8. Detection performance across phenotypic traits.
Phenotypic TraitPrecision (%)Recall (%)F1 Score (%)AP50 (%)
Green hypocotyl0.9030.8780.8900.918
Purple hypocotyl0.8950.7650.8250.860
Needle leaf0.9470.9410.9440.971
Circle leaf0.9540.9660.8600.984
Brown pubescence0.9430.9320.9370.964
White pubescence0.9590.9660.9630.985
Purple flower0.9720.9210.9460.971
White flower0.9520.8770.9130.928
Table 9. Detection results of hybrid soybean parents’ phenotypic consistency.
Detection MethodNumber of Observed Parent Samples (Plant)Number of Observed Off-Type Samples (Plant)Phenotypic Consistency (%)
Manual record567798.9%
YOLOv5s554698.9%
SLW-YOLO560698.9%
Disclaimer/Publisher’s Note: The statements, opinions and data contained in all publications are solely those of the individual author(s) and contributor(s) and not of MDPI and/or the editor(s). MDPI and/or the editor(s) disclaim responsibility for any injury to people or property resulting from any ideas, methods, instructions or products referred to in the content.