Article

Design and Experiment of Drying Equipment for Alfalfa Bales

1
Intelligent Equipment for the Whole Process of Forage Feed Production, Inner Mongolia Autonomous Region Engineering Research Center, Hohhot 010018, China
2
School of Mechanical and Electrical Engineering, Inner Mongolia Agricultural University, Hohhot 010018, China
*
Author to whom correspondence should be addressed.
Agriculture 2025, 15(19), 2000; https://doi.org/10.3390/agriculture15192000
Submission received: 9 August 2025 / Revised: 13 September 2025 / Accepted: 22 September 2025 / Published: 24 September 2025
(This article belongs to the Section Agricultural Technology)

Abstract

Inefficient drying of alfalfa round bales causes significant nutrient loss (up to 50%) and quality degradation due primarily to uneven drying in existing processing methods. To address this challenge requiring dedicated equipment and optimized processes, this study developed a specialized hot-air drying test bench (CGT-1). A coupled heat and mass transfer model was established, and 3D dynamic simulations of temperature, humidity, and wind speed distributions within bales were performed using COMSOL multiphysics to evaluate drying inhomogeneity. Single-factor experiments and multi-factor response surface methodology (RSM) based on Box–Behnken design were employed to investigate the effects of hot air temperature (50–65 °C), wind speed (2–5 m/s), and air duct opening diameter (400–600 mm) on moisture content, drying rate, and energy consumption. Results demonstrated that larger duct diameters (600 mm) and higher wind speeds (5 m/s) significantly enhanced field uniformity. RSM optimization identified optimal parameters: temperature at 65 °C, wind speed of 5 m/s, and duct diameter of 600 mm, achieving a drying time of 119.2 min and a drying rate of 0.62 kg/(kg·min). Validation experiments confirmed the model’s accuracy. These findings provide a solid theoretical foundation and technical support for designing and optimizing alfalfa round-bale drying equipment. Future work should explore segmented drying strategies to enhance energy efficiency.

1. Introduction

Drying processes in the processing of agricultural products have been used since ancient times, ranging from drying plant products to, for example, drying fish and other animal-derived products [1]. Extensive research has been directed toward understanding and optimizing the drying processes through advanced modeling, innovative technologies, and energy-efficient designs. Li Mengqing et al. [2], developed a three-dimensional model for intermittent infrared-hot air drying of jujube, demonstrating that tempering intervals significantly improve moisture distribution. Chen Pinglu [3] employed a CFD-DEM (v2022) framework to model in-process rice pre-drying, effectively utilizing residual heat from combine harvesters. Cheng Wenqing [4] combined digital image correlation with numerical simulations to analyze drying-induced cracking in clay, emphasizing the role of boundary constraints. Zhang Xinwei [5] established a deep-bed drying model for corn that integrated wall heat and moisture exchange, while Yan Yan [6] identified the hierarchical influence of operating parameters on tissue drying. Li Bin [7] applied porous media theory to optimize thermal uniformity and drying efficiency in deep-bed rice drying. Further contributions include Dincer Akal [8]’s analysis of pressurized convective drying for cotton bobbins and Seongmin Park [9]’s investigation into pore-scale regulation of drying kinetics. Dalmo Paim de Oliveira [10] proposed a first-principles model integrating fundamental transport equations, and Faeez Ahmad [11] developed a non-equilibrium continuum model to describe mass transfer in porous media. Technological advances such as electrohydrodynamic-assisted drying (Meng Zhaofeng [12]) and stepwise humidity control (Zhang Weipeng [13]) have enhanced drying efficiency and product quality. Feng Chuanghua [14] and Chen Pengxiao [15] further contributed species-specific drying kinetics for rue and wheat, respectively. In the context of industrial and agricultural drying, Sun Dongliang [16] optimized baffle configurations to improve drying homogeneity, and Franz D. Roman [17] emphasized airflow distribution in round-bale dryers. Du Jianqiang [18] experimentally examined the effects of density and drying parameters on alfalfa bales, whereas Sandra Weller [19] developed a non-destructive quality assessment method for weed propagules. Paul A Beck [20] and Benedičič Janez [21] investigated supplemental feeding strategies and condensing dryers for forage applications. Recently, Gao Xinyu [22] introduced a solar-assisted heat pump (SASHP) drying system for alfalfa bales and optimized key parameters using response surface methodology. Friso Dario [23] developed a control-oriented model for rotary drum dryers to achieve precise moisture regulation. Collectively, these diverse investigations reflect the growing recognition of agricultural drying as a complex, multifactorial process demanding integrated, system-level solutions. Despite these considerable advancements, current research efforts remain fragmented between purely empirical testing and isolated numerical investigations. This fragmentation has resulted in a notable absence of comprehensive multiphysics frameworks capable of addressing the interconnected challenges of non-uniform drying and excessive energy consumption in high-density alfalfa bales. Most existing studies exhibit a predominant focus on either theoretical modeling without adequate experimental validation or practical testing without sufficient mechanistic understanding. The critical limitation impedes the development of efficient, scalable drying solutions specifically tailored to the unique material characteristics of densely packed forage, ultimately constraining progress toward sustainable forage production systems. To address this research gap, we hypothesize that an integrated methodology combining three-dimensional multiphysics simulation with response surface methodology optimization can effectively identify operational parameters that simultaneously minimize drying time, improve uniformity, and reduce energy consumption. The specific objectives of this study are (1) to develop a coupled heat and mass transfer model based on the porous media theory for simulating drying dynamics in alfalfa bales; (2) to design and construct a precision test bench (CGT-1) (Inner Mongolia Huayu Agricultural Machinery Co., Ltd., Baotou City, China) enabling exact control of critical parameters; and (3) to determine optimal parameter combinations through integrated single-factor and response surface methodology experiments. This work establishes a validated simulation–experimental framework for the design and optimization of industrial-scale forage drying systems, contributing to more sustainable and efficient forage production through advanced process understanding and control.

2. Overall Structure and Working Principle

2.1. Overall Structure

The CGT-1 test bench is composed of components such as electric heaters, frames, and centrifugal fans, as shown in Figure 1.
The frame comprises baffles, an electric push rod, guide rails, and upper and lower bases. The electric push rod extends to move the upper base vertically along the guide rails, compressing the upper surface of the round bale. During operation, the centrifugal fan and electric heater deliver hot air through the upper and lower ventilation ducts into the round bale, facilitating drying.

2.2. Working Principle

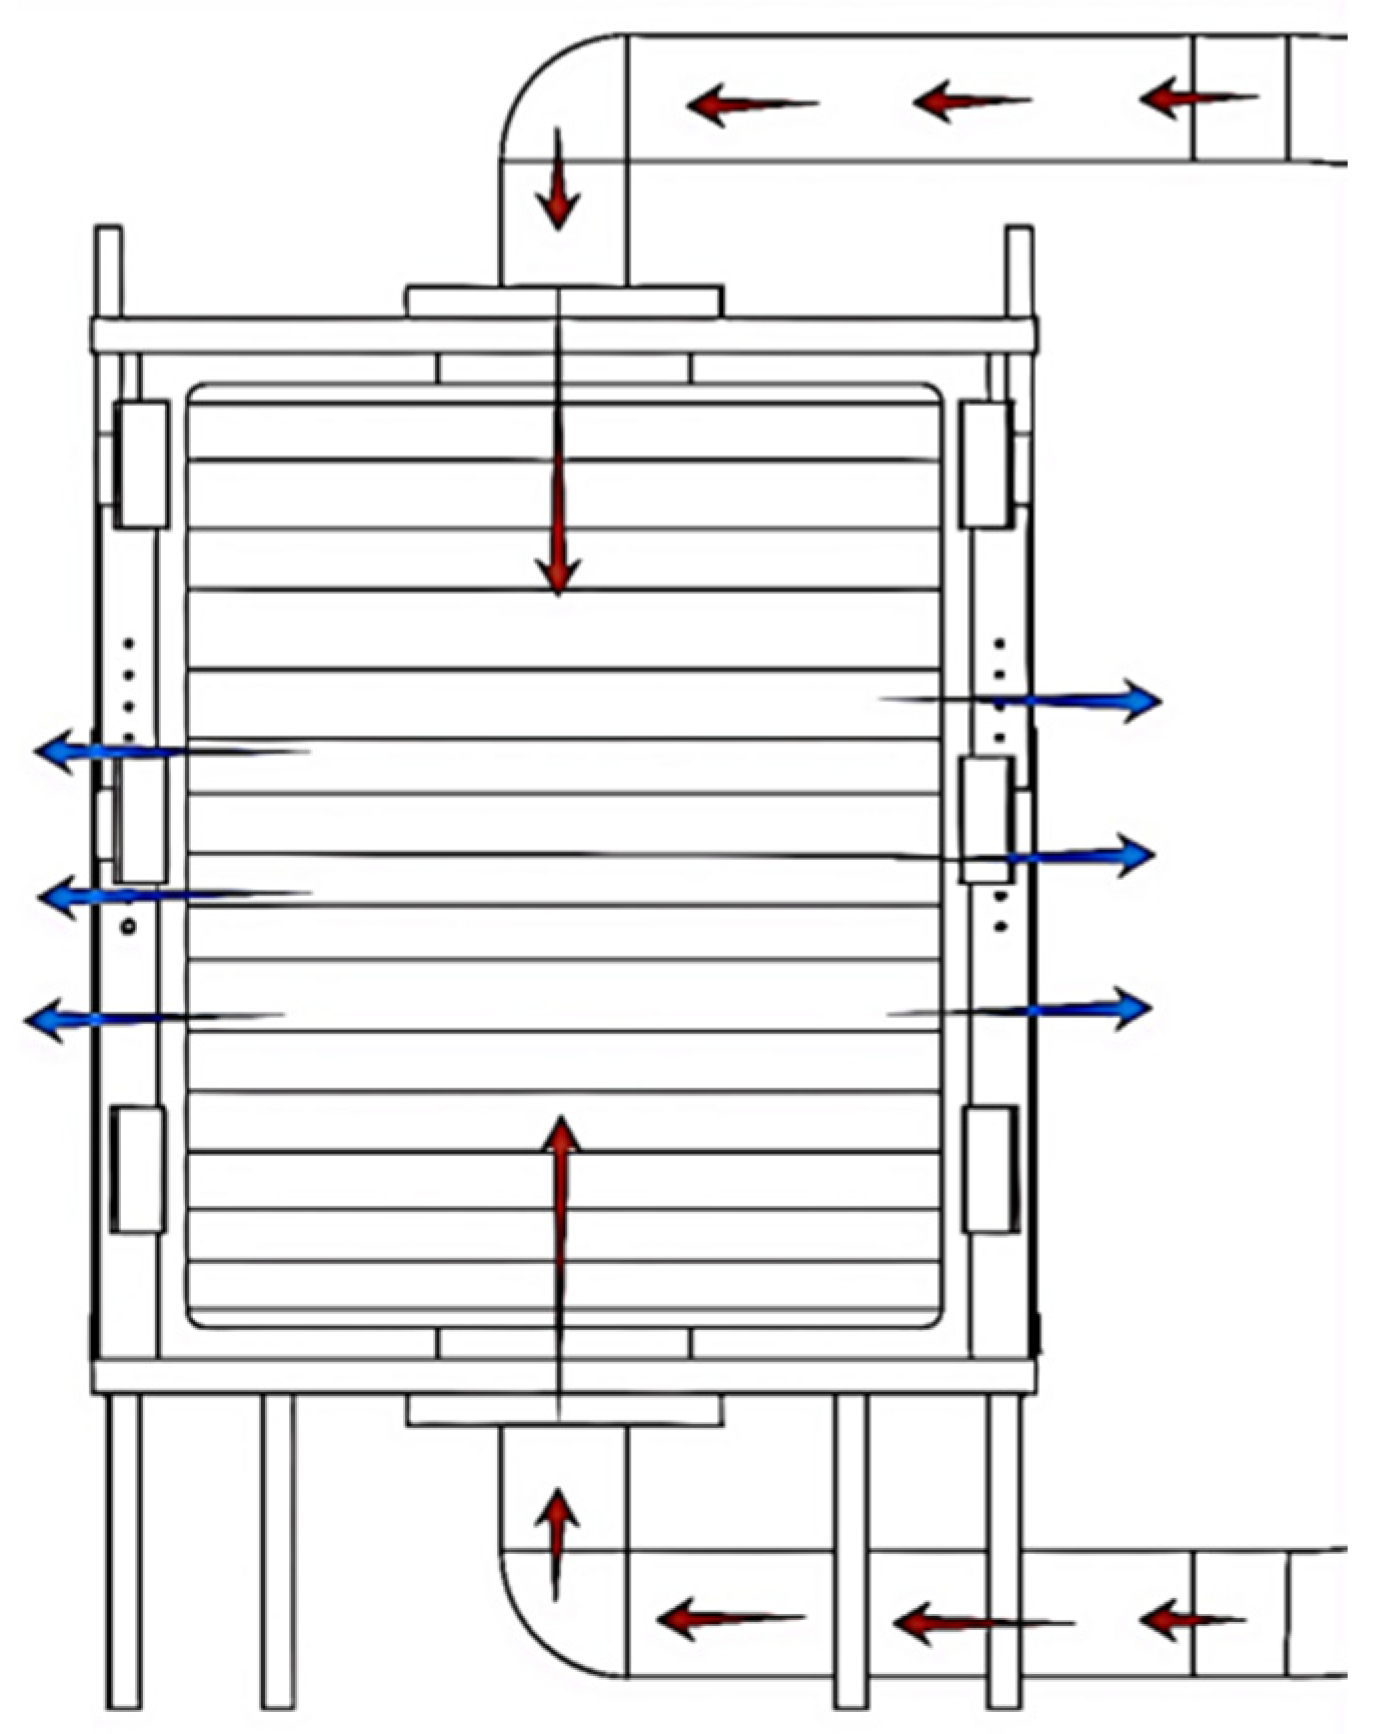
The drying process for round bales on the test bench consists of four stages: feeding, hot-air preparation, drying, and unloading. A forklift places the round bale onto the test bench. The electric push rod is then activated to securely seal the upper and lower air outlets. Upon activation, the high-pressure fan delivers air to the electric heater. The heater then elevates the air temperature to the preset test value, while sensors monitor and maintain thermal stability in real time. Heated high-pressure hot air enters the round-bale interior through the upper and lower inlets. Moisture is discharged through the bale gaps, achieving the drying effect. Upon reaching the target moisture content, the hot air supply terminates. The main technical parameters of the CGT-1 round-bale drying test bench are shown in Table 1. The schematic diagram of the drying of the bale is shown in Figure 2.

3. Simulation Analysis of Drying Process of Alfalfa Round Grass Bale

3.1. Mathematical Model Establishment and Boundary Condition Setting

The Reynolds averaged Navier–Stokes (RANS) method was used to simulate and predict the airflow organization characteristics in the bales and to study the physical field distribution during the drying process [24]. The governing equations are as follows [25,26,27]:
The continuity equation:
u x + v y + w z = 0
where x, y, and z are coordinate components in rectangular coordinates; and u, v, and w are time-averaged velocities in the x, y, and z directions, respectively, m / s .
The momentum equation:
p = u t + u u x + v u y + w u z = μ 2 u x 2 + 2 u y 2 + 2 u z 2 p x + ρ g x
p = v t + u v x + v v y + w v z = μ 2 v x 2 + 2 v y 2 + 2 v z 2 p y + ρ g y
p = w t + u w x + v w y + w w z = μ 2 w x 2 + 2 w y 2 + 2 w z 2 p w + ρ g w  
where x, y, and z are coordinate components in rectangular coordinates; u, v, and w are time-averaged velocities in the x, y, and z directions, respectively, m / s ; ρ is density, k g / m 3 ; t is time, s; p is used to define the static pressure of flow, N / m 2 ; and g is the vector of gravitational acceleration, m / s 2 .
The turbulent kinetic energy equation:
    ρ k t + ρ u i k x i = k μ + ρ c μ k 2 ε k x j x j + μ i u i x j u i x j + u j x i ρ ε
where k represents the turbulent kinetic energy dissipation rate, m 2 / s 3 ; u is the velocity, m/s; ε is the volume fraction; ρ is density, k g / m 3 ; and t is time, s.
The turbulent kinetic energy dissipation rate equation:
ρ ε t + ρ u i ε x i = k μ + ρ c μ k 2 ε ε x j x j + c 1 ε k μ i u i x j u i x j + u j x i c 2 ρ c 2 k
where x, y, and z are coordinate components in rectangular coordinates; u, v, and w are time-averaged velocities in the x, y, and z directions, respectively, m / s ; ρ is density, k g / m 3 ; t is time, s; c represents specific heat capacity; k represents turbulent kinetic energy dissipation rate, m 2 s 3 ;   a n d   ε is the volume fraction.
Heat transfer in porous media can be described by combining the conservation of energy principle with Fourier’s law of heat conduction. If the porous medium is isotropic and homogeneous, the governing heat transfer equation is given by
ρ · c p · T t = · λ · T + · ρ f · c p , f · u · T + x i ϵ · ρ f · c p , f · u i · T
where ρ is the density of the porous medium; c p is the specific heat capacity of the porous medium; T is the temperature field; t is time; λ is the thermal conductivity of the porous medium; is the porosity of the porous medium; ρ f is the density of the fluid; c p , f is the specific heat capacity of the fluid; u is the velocity field of the fluid; and ϵ is the volume fraction of the fluid in the porous medium.
Mass transfer in porous media can be described by the law of mass conservation combined with Fick’s law of diffusion. Assuming that the porous medium is isotropic and physically homogeneous, the mass transfer equation is as follows [28]:
ϵ · C t = · D e · C · ϵ · u · C
where ε is the porosity of the porous medium; C is the concentration of the substance in the fluid; t is time; De is the effective diffusion coefficient; and u is the velocity field of the fluid.
Porous medium model is used to describe the model, and the parameters of the model are determined by reference to the relevant literature and test methods [29]. This ensures the reliability and accuracy of the simulation, as shown in Table 2 [30].
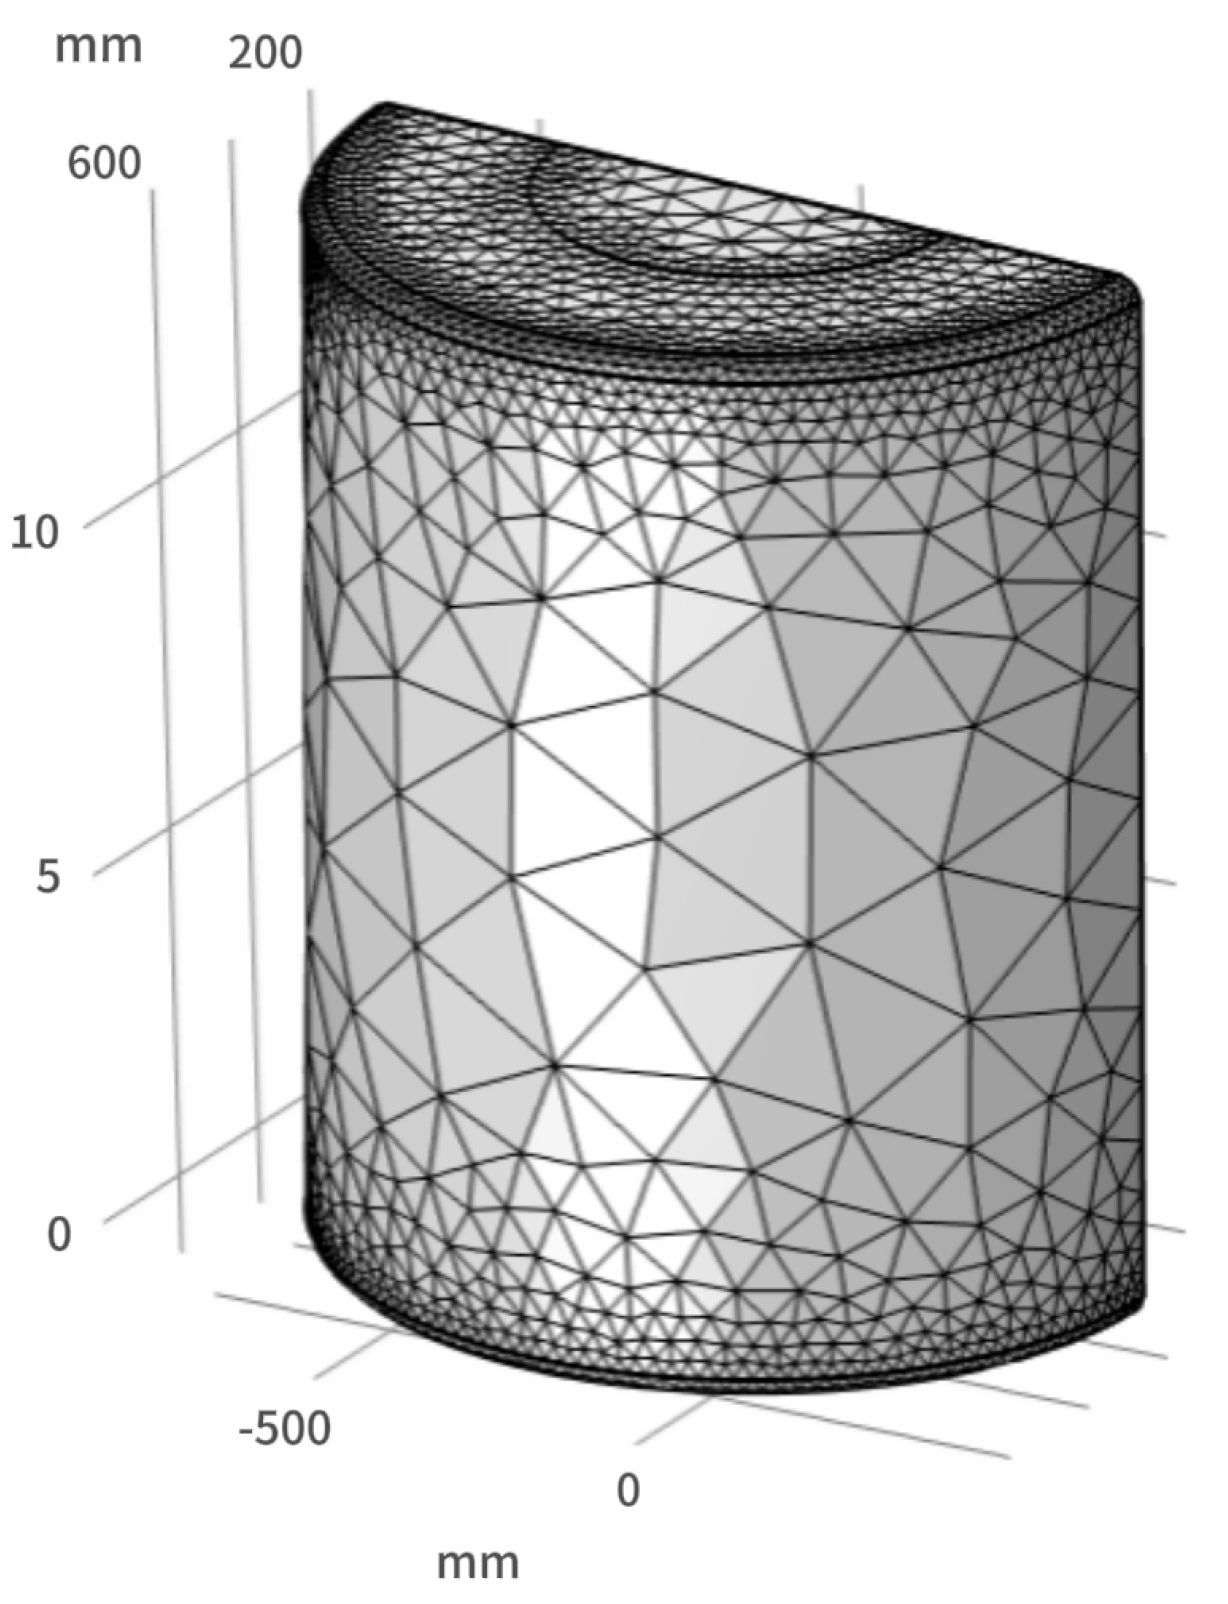
The results show that grid density is positively correlated with computational accuracy, but with the increase in grid refinement, the computational scale will increase exponentially, and the number of degrees of freedom of the system will also increase significantly [31]. The reliability of the model can be guaranteed [32] when the mesh element mass is greater than 0.3. Based on the above research, this grid division adopts a multi-level grid sequence generation method based on physical field characteristics to construct a grid topology structure with gradient characteristics and uses the unit skewness coefficient as a quantitative evaluation indicator for unit quality. The final grid division results are as follows: the number of cells of the round bale model is 126,512, the total number of cells is 145,761, and the average cell mass reaches 0.5071. The specific grid division is shown in Figure 3.

3.2. Simulation Analysis

3.2.1. Wind Speed Field Simulation Analysis

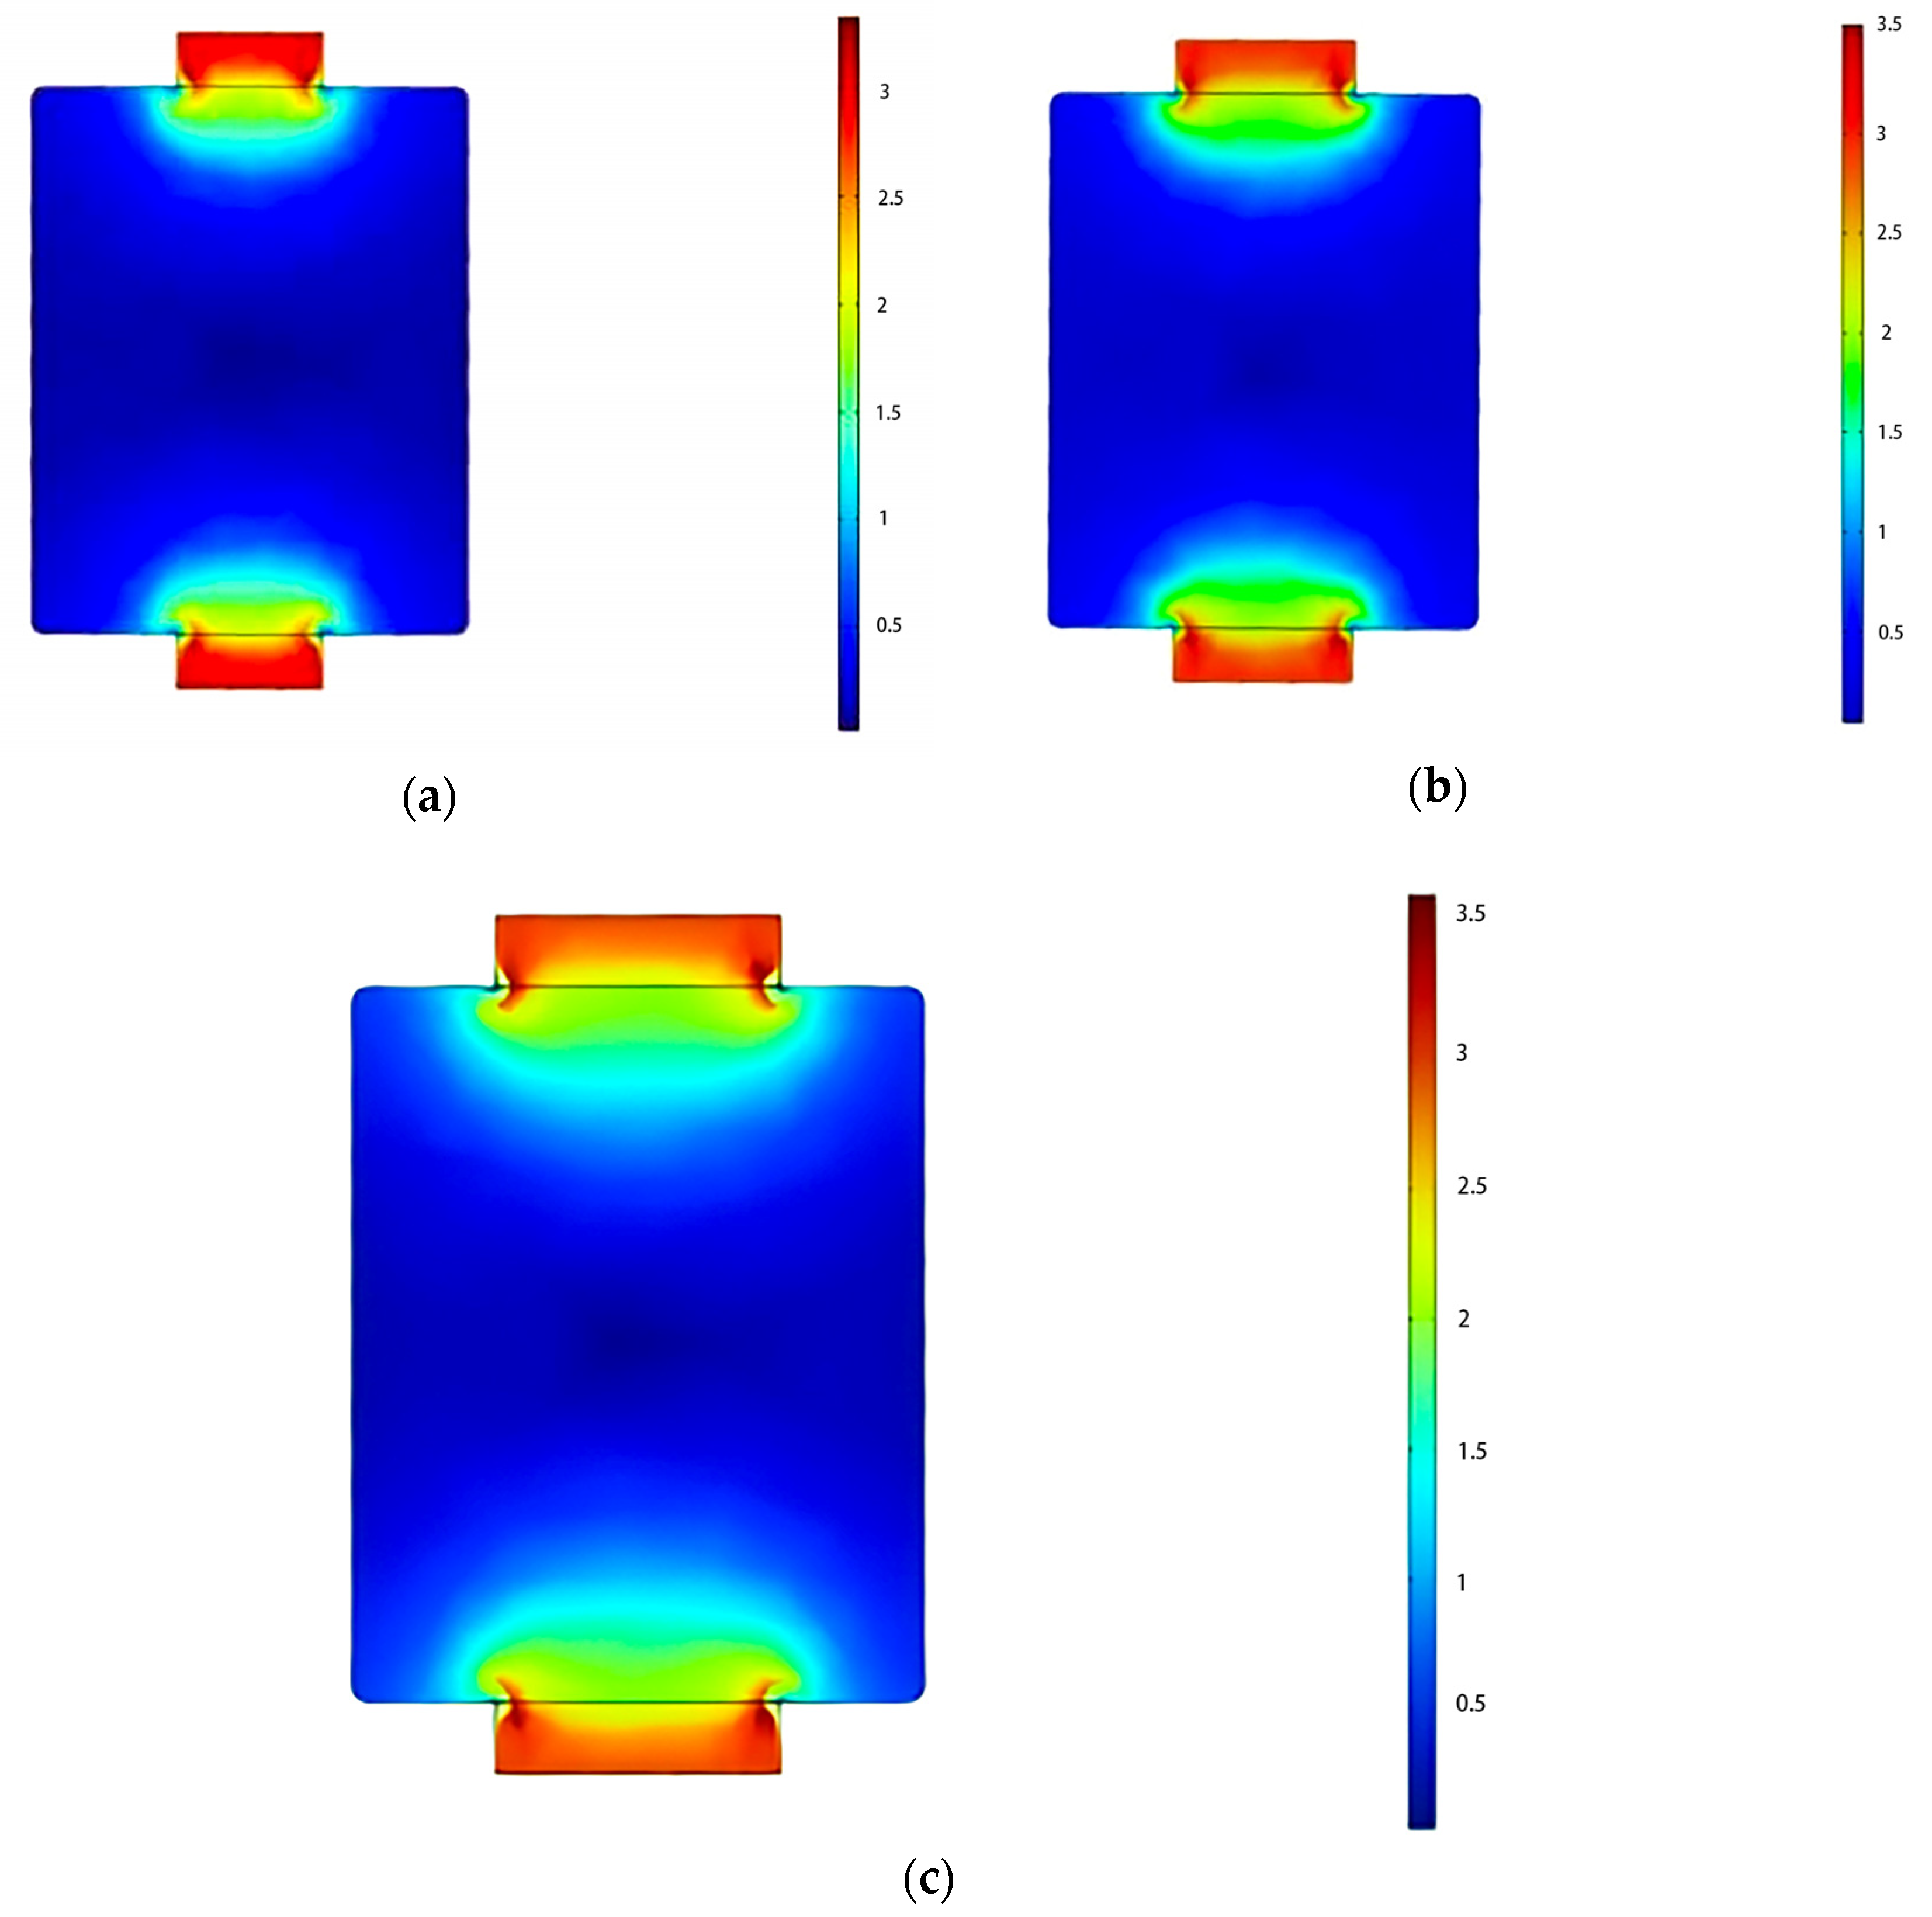
Under inlet conditions of 50 °C and 3 m/s wind speed, we simulated three duct configurations (Schemes A–C) using COMSOL Multiphysics 6.3: Scheme A (400 mm diameter), Scheme B (500 mm), and Scheme C (600 mm). Table 3 details the single-factor wind speed field experimental design, while Figure 4 presents the internal velocity distribution cloud map of the round bale.
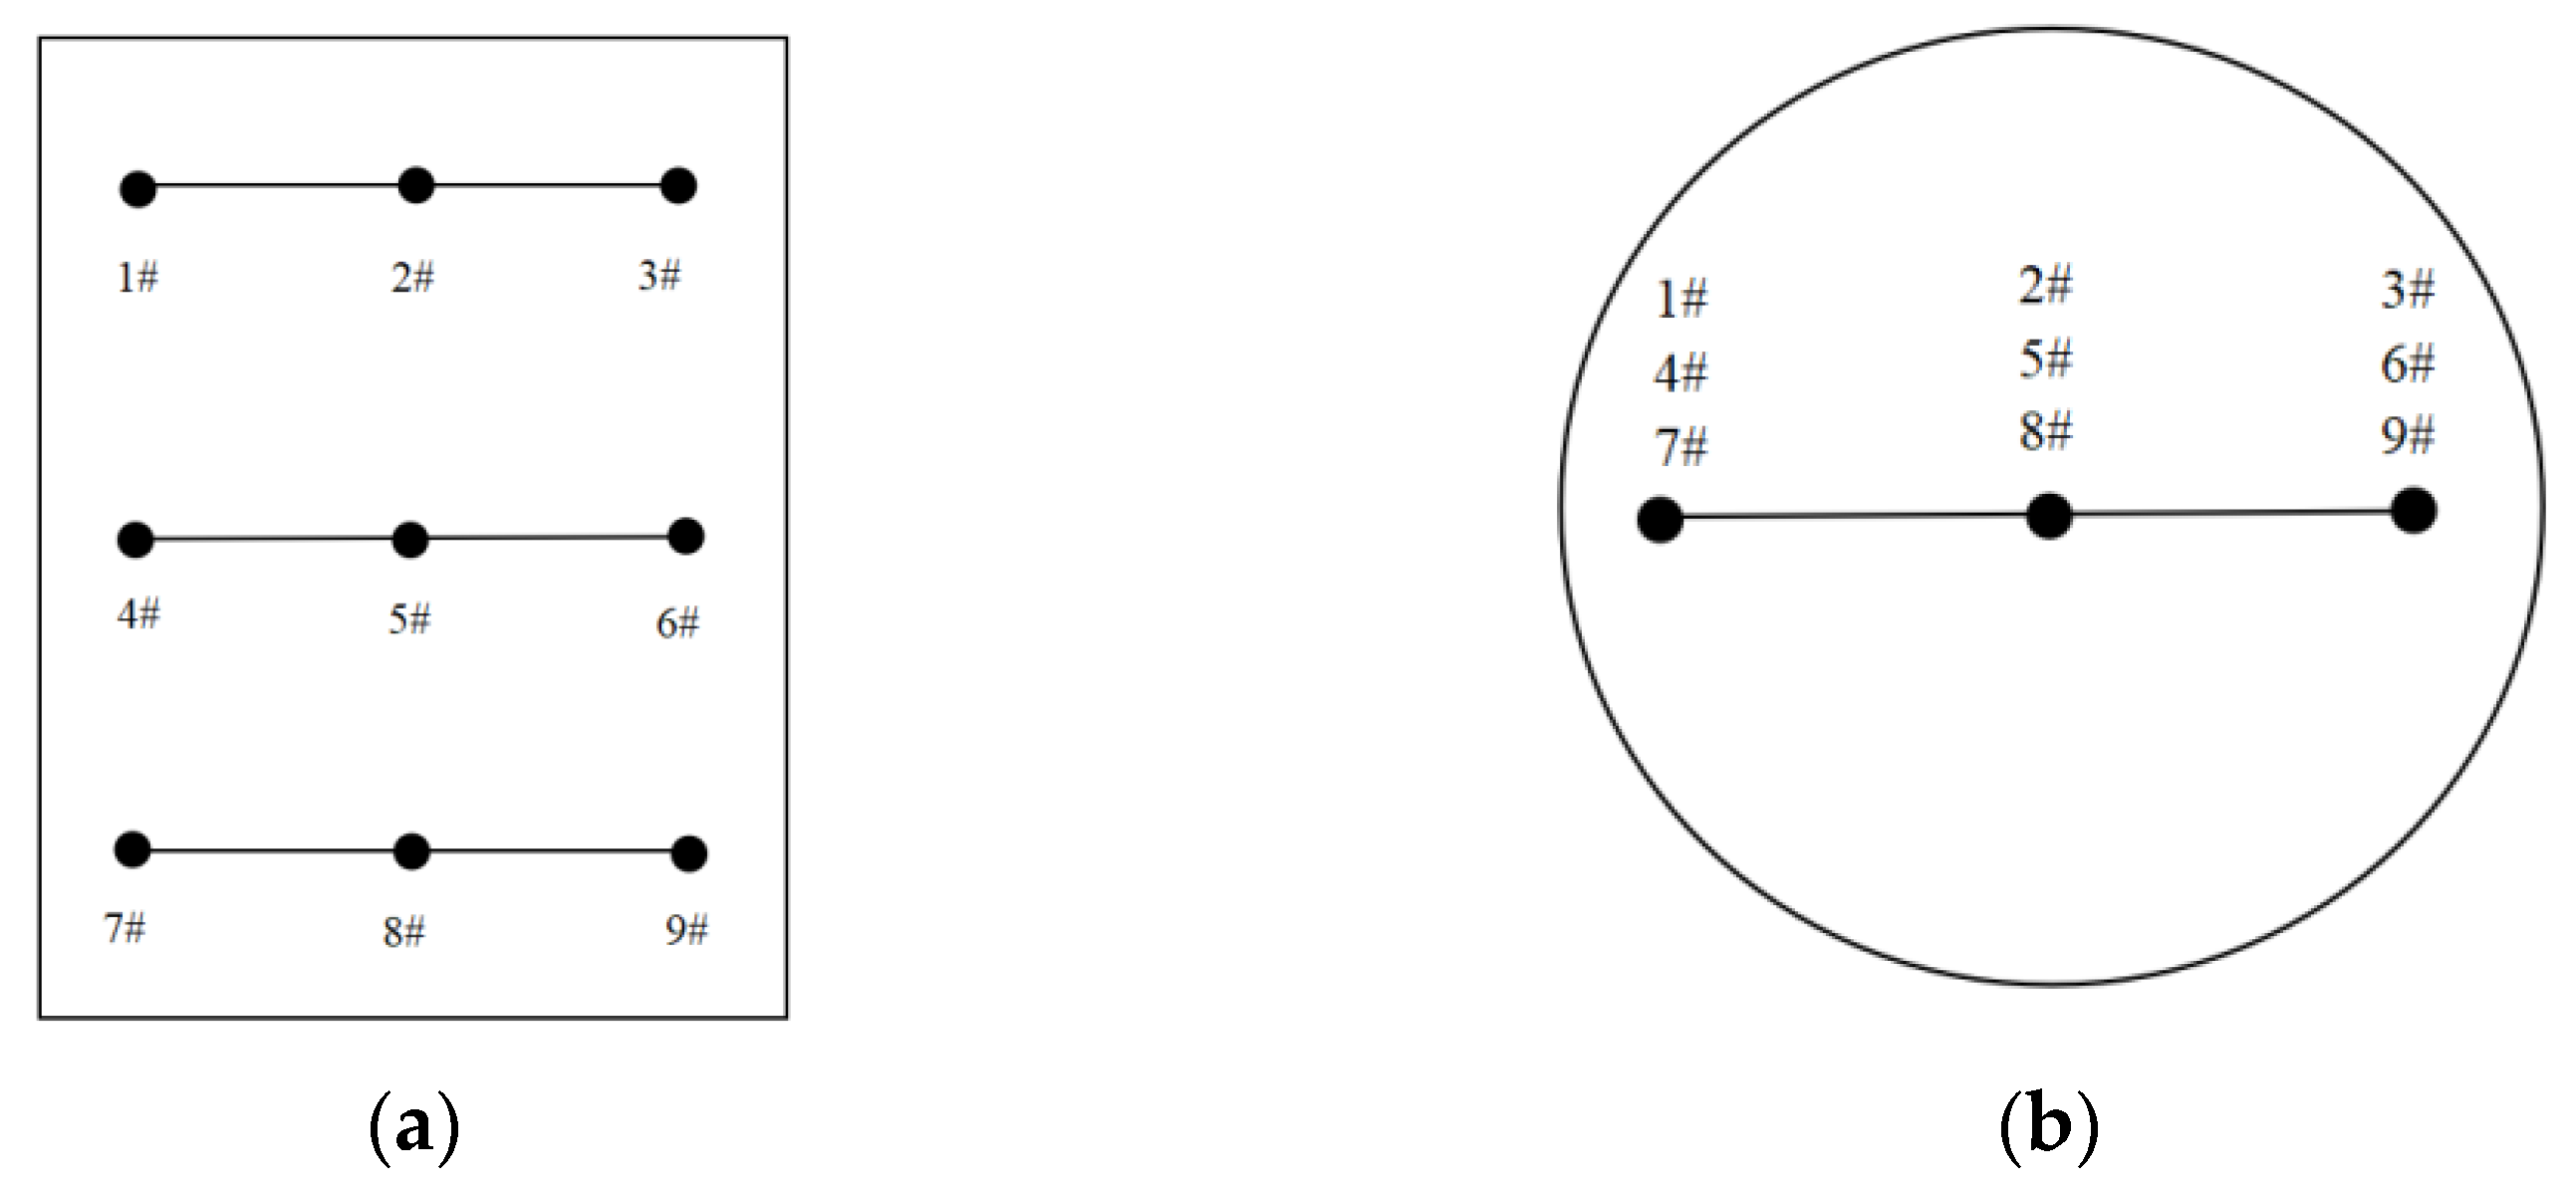
Velocity cloud maps for duct openings of 400, 500, and 600 mm were analyzed at the bale’s central Y- and Z-axis sections. At 400 mm diameter, the inlet region exhibited a steep velocity gradient where air velocity rapidly exceeded 3 m/s, forming a localized high-speed zone. Internal velocity gradually decreased due to wall resistance and structural effects, resulting in an uneven distribution. Low central velocity indicated significant energy dissipation. When increased to 500 mm, inlet velocity rose substantially, expanding the high-speed zone while promoting more uniform internal distribution. This enhanced flow field stability demonstrates that larger openings facilitate balanced airflow, reduce localized high-speed regions, smooth flow, and minimize energy losses. At 600 mm, the optimized velocity field showed stable, low-fluctuation flow at inlet/outlet regions with markedly reduced high-speed concentration. This uniformity improves heat exchange efficiency, reduces eddy current losses from velocity irregularities, and enhances drying uniformity/efficiency. The Y- and Z-axis velocities were subsequently calculated using Equations (7) and (8), with measurement points shown in Figure 5.
Measurement points 1–3 constitute the first layer, points 4–6 the second layer, and points 7–9 the third layer. Duct opening diameters of 400 mm (Scheme A), 500 mm (Scheme B), and 600 mm (Scheme C) were evaluated. Table 4 presents wind speed values at each measurement point for these configurations. Table 5 summarizes the wind speed non-uniformity coefficients for each layer in the Y-Z plane.
Significant variations in wind speed non-uniformity coefficients occur in central regions distal to the air inlet across different duct opening configurations. As indicated in Table 5, Scheme A (400 mm diameter) exhibits the highest non-uniformity at approximately 60%. Calculations reveal that at 600 mm openings (Scheme C), wind speed non-uniformity decreases to 28.9%. This corresponds to reduced non-uniformity across all layers and more uniform wind field distribution. These findings align with the earlier cloud diagram analysis (Figure 5).

3.2.2. Temperature Field Simulation Analysis

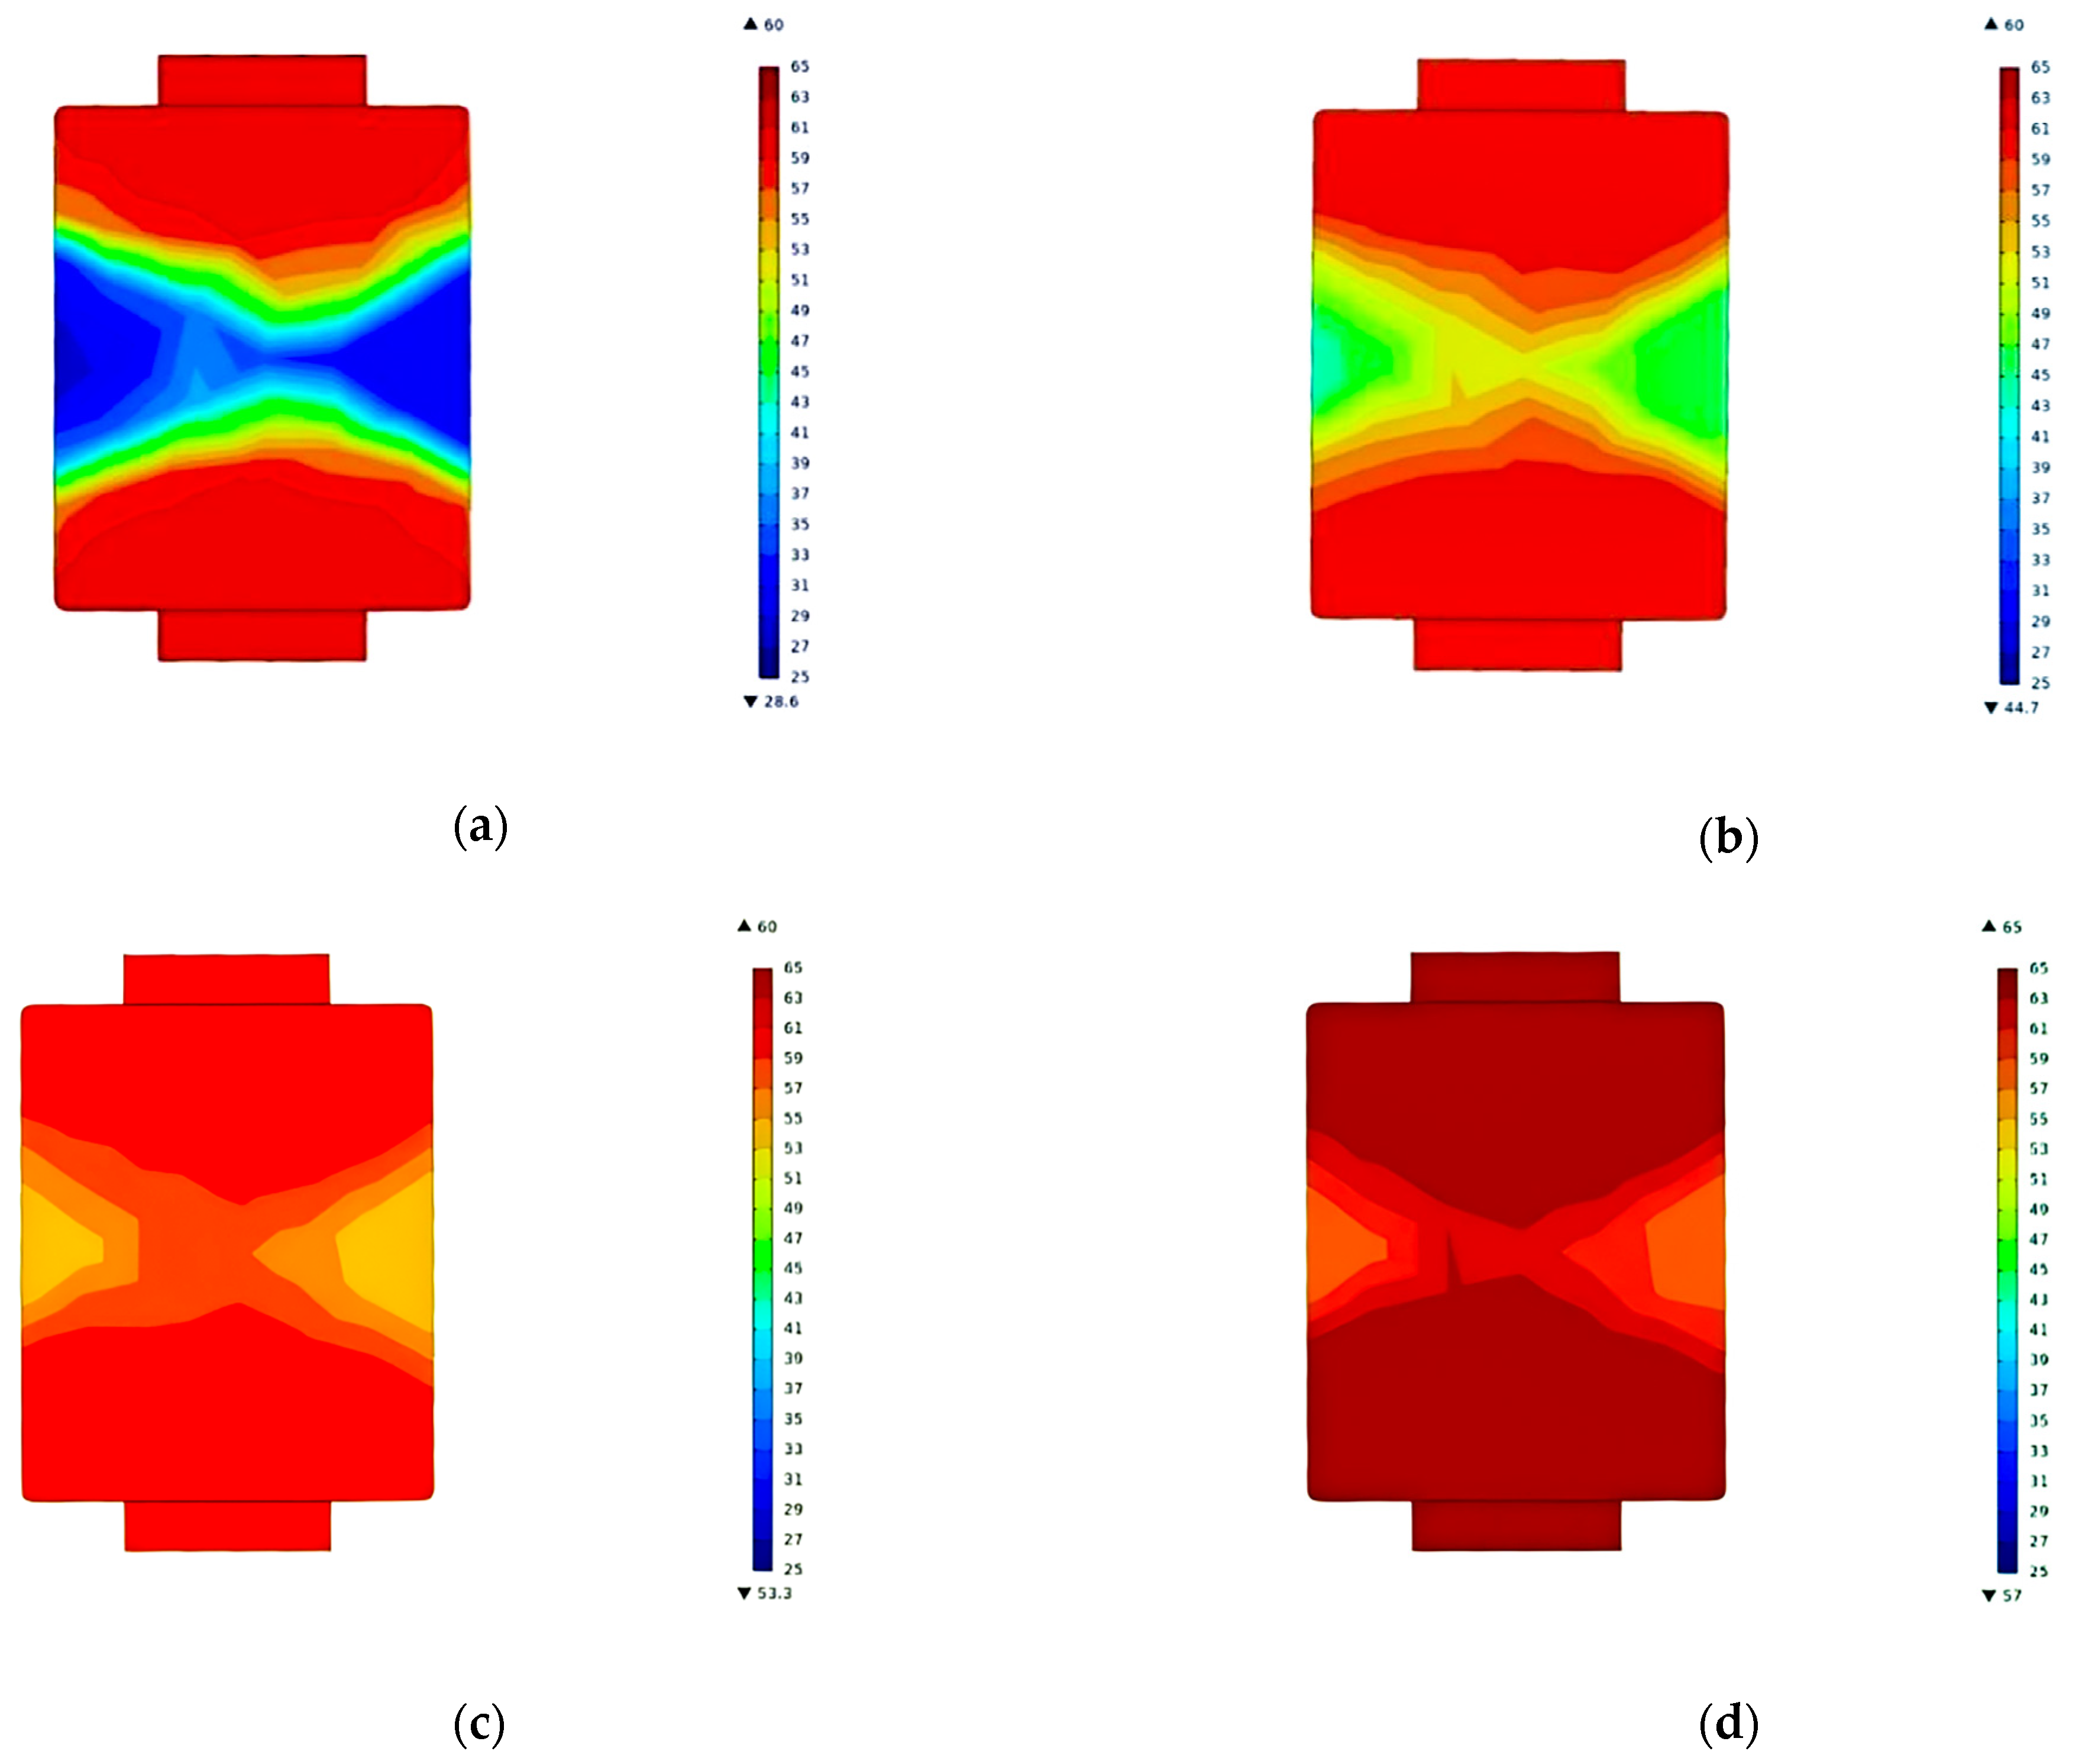
Building on wind speed field simulations, Scheme C (600 mm duct diameter) was selected for subsequent temperature field analysis. Four wind speed conditions (A–D) were established: see Table 6 for experimental parameters. Figure 6 presents temperature distributions, while Table 7 quantifies non-uniformity coefficients. Table 6 shows the temperature field single-factor test design table.
Figure 6 demonstrates the wind speed’s significant influence on the drying process: At 2 m/s, outlet center temperatures rose significantly with rapid moisture evaporation. However, weak airflow in peripheral regions caused lower temperatures, severe thermal non-uniformity, and reduced drying efficiency. At 3 m/s, overall humidity decreased with significant central reduction, confirming the wind speed’s positive drying effect. Despite persistent high edge humidity, temperature non-uniformity started diminishing. At 4 m/s, center and edge humidity further decreased with intensified humidity gradients. Enhanced airflow promoted more complete moisture evaporation, while humidity differentials narrowed and temperature uniformity improved. At 5 m/s, temperature fields achieved optimal uniformity (minimum non-uniformity coefficient: 5.8%), with elevated center temperatures confirming that high wind speeds dramatically accelerate drying while effectively reducing non-uniformity and enhancing final product quality.

3.2.3. Humidity Field Simulation Analysis

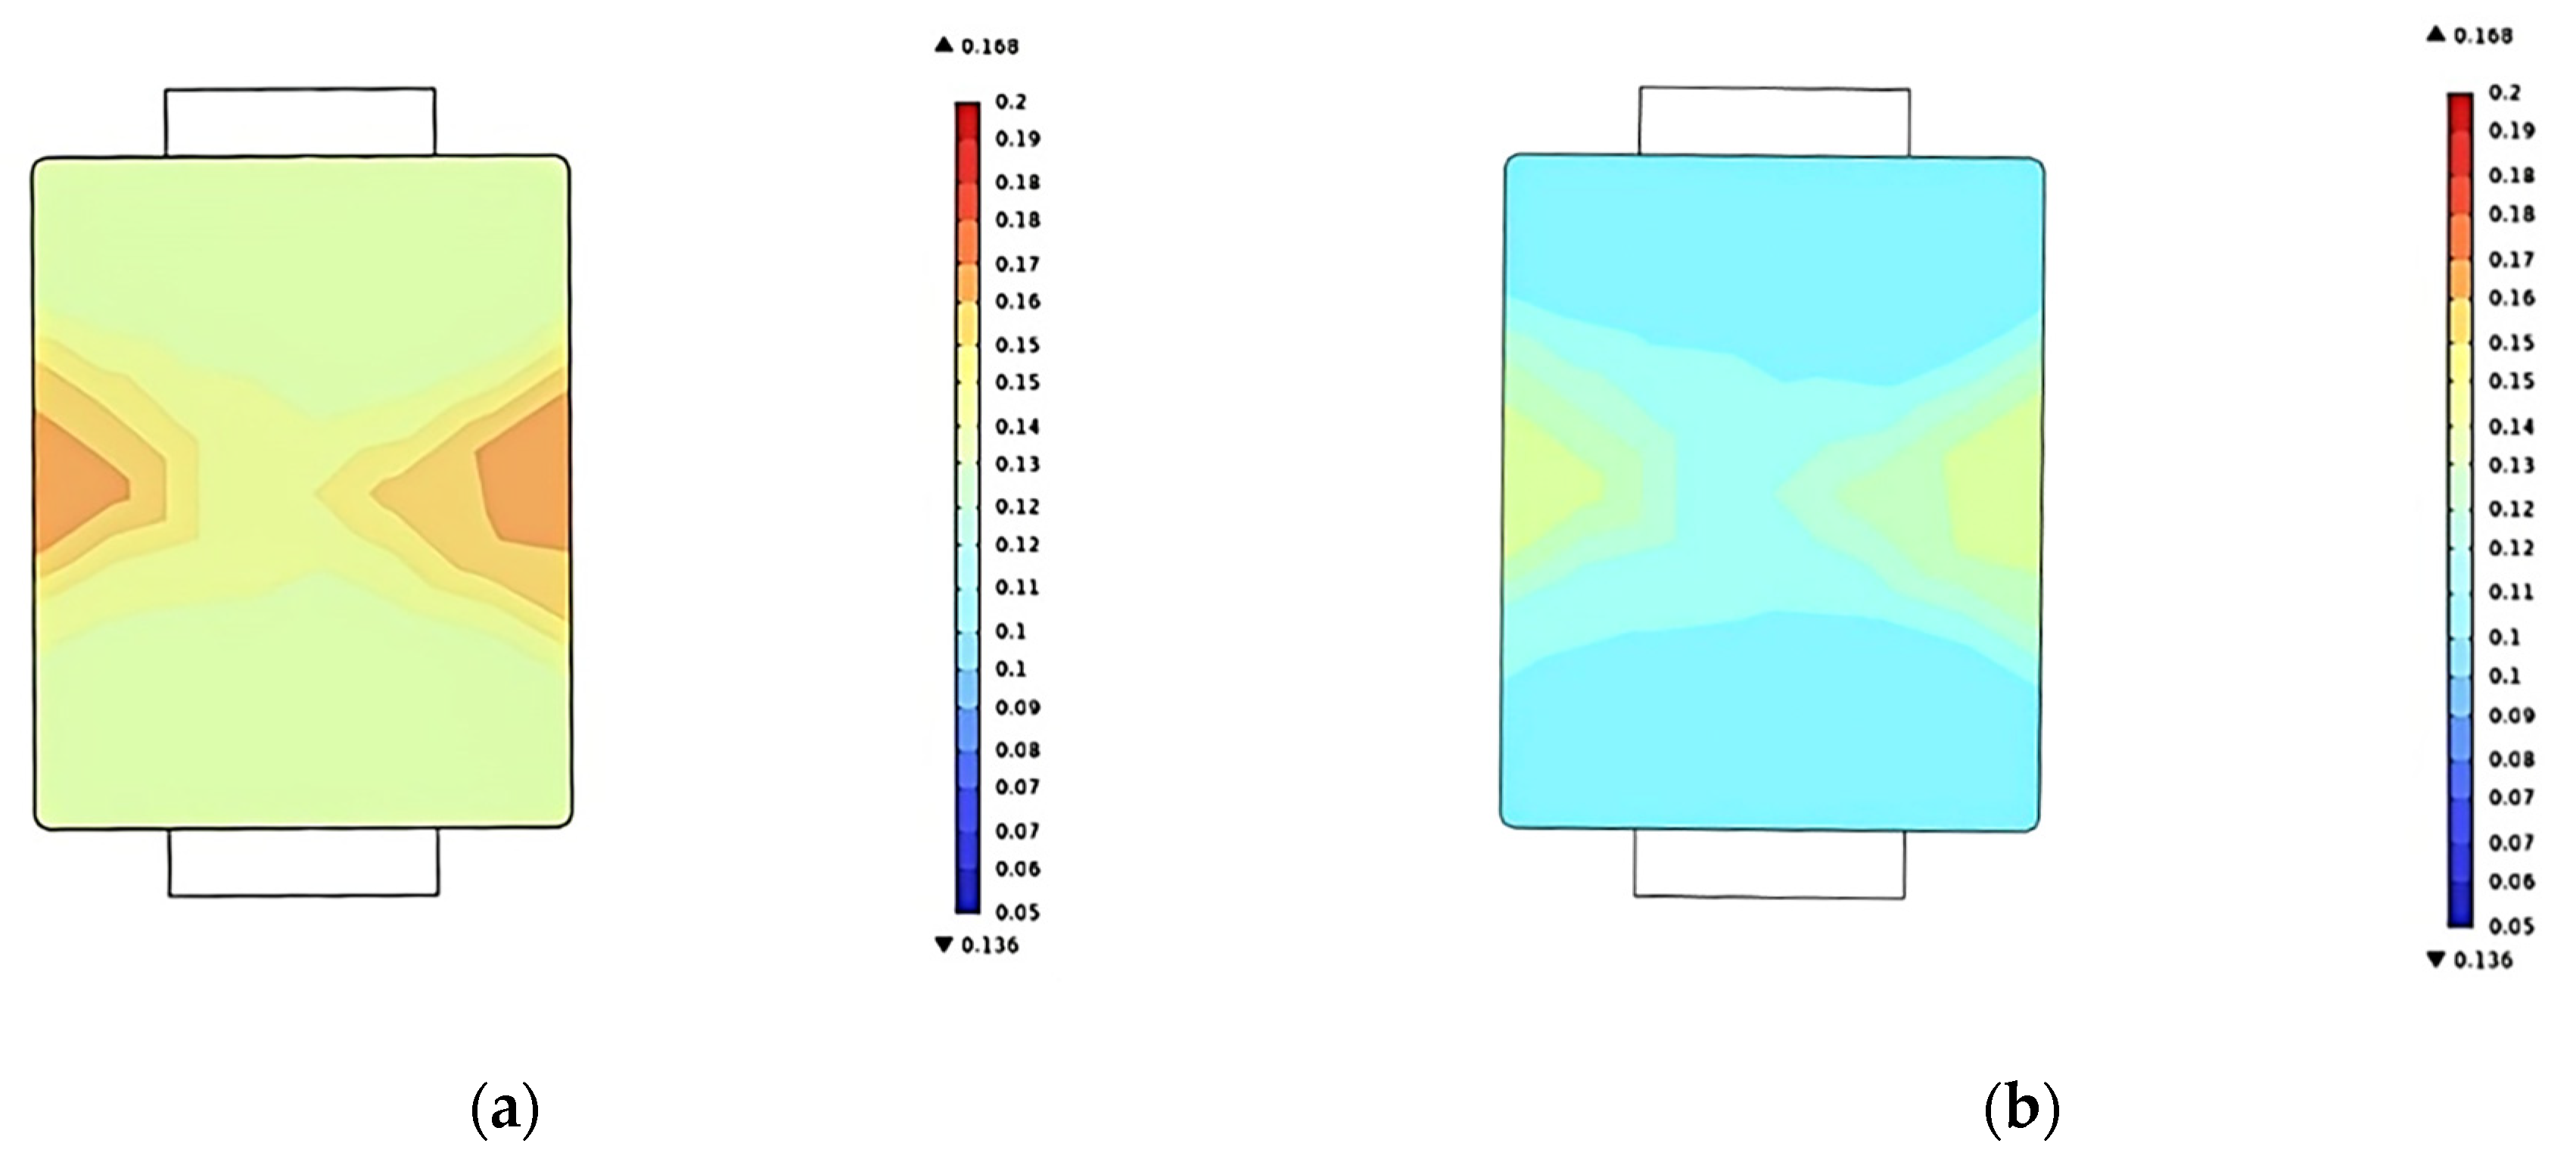
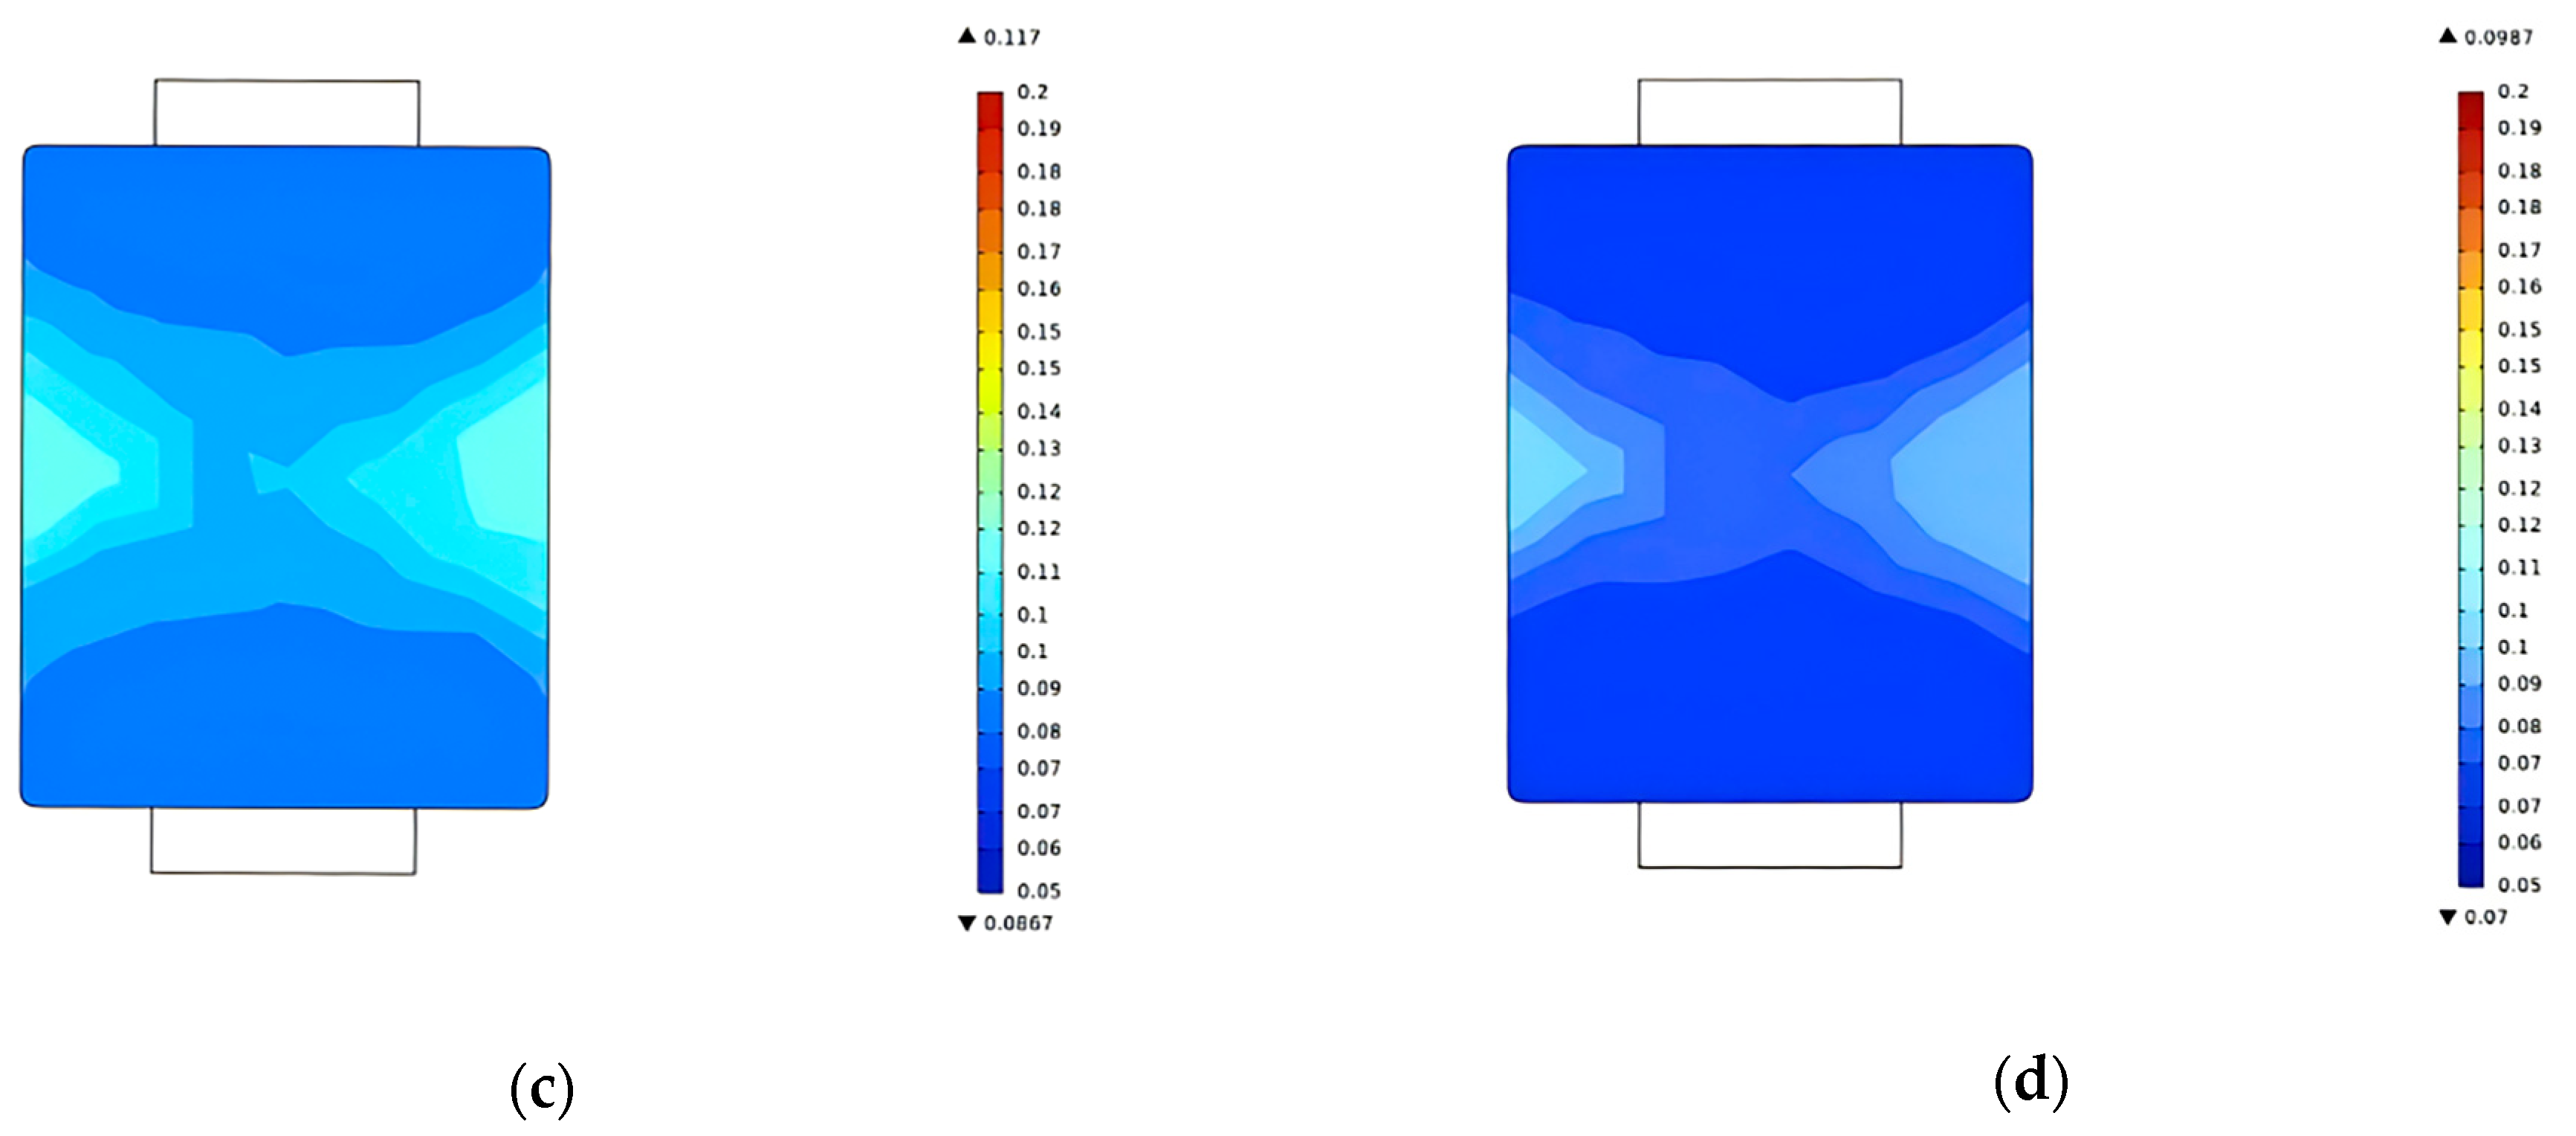
With fixed parameters (600 mm duct opening, 5 m/s wind speed), humidity distributions are presented in Figure 7. Four temperature conditions were evaluated: 50 °C (A), 55 °C (B), 60 °C (C), and 65 °C (D). Table 8 details the experimental design. Table 9 quantifies humidity non-uniformity coefficients per layer in the Y-Z plane.
Figure 7 illustrates temperature effects on forage moisture distribution: At 50 °C, regular moisture patterns emerge with minimal values near duct openings due to efficient hot air contact and rapid evaporation, whereas central and peripheral regions exhibit higher moisture from inadequate airflow and slower evaporation. Progressing to 55 °C, overall moisture decreases significantly, especially near duct openings. However, peripheral moisture remains elevated relative to duct areas, increasing distribution non-uniformity. At 60 °C, moisture in central and wall-adjacent regions continue declining, while center-inlet moisture differentials narrow, indicating enhanced evaporation and moisture diffusion at elevated temperatures. At 65 °C, moisture distribution uniformity improves substantially. Despite persistent moisture minima near inlets and higher values in wall-adjacent/central zones, the overall moisture gradient minimizes. This demonstrates that temperature elevation simultaneously accelerates drying and effectively reduces process non-uniformity, ultimately enhancing forage drying quality.
Table 9 demonstrates that increasing temperature reduces humidity field non-uniformity, enhancing forage drying uniformity. At 50 °C, significant non-uniformity occurs, resulting in poor drying uniformity with localized over-drying and under-drying zones. At 65 °C, despite residual non-uniformity, overall uniformity reaches optimal levels evidenced by a 3.9% humidity non-uniformity coefficient.

3.3. Results Analysis

Analysis of temperature, humidity, and wind speed field uniformity yields the following conclusions: (1) Duct opening diameter significantly influences wind speed field distribution. Larger diameters enhance wind field stability and uniformity, promoting uniform airflow and energy transfer within the bale interior. (2) Higher wind speeds increase round bale drying efficiency enhancing central evaporation and improving temperature field uniformity, though over-drying risks require mitigation. (3) Near inlets, elevated temperatures and strong drying capacities accelerate drying rates, whereas central regions exhibit reduced temperatures, diminished drying capacities, and slower drying rates. Consequently, humidity field non-uniformity causes uneven drying rates, compromising overall drying uniformity.

4. Materials and Methods

4.1. Test Methods

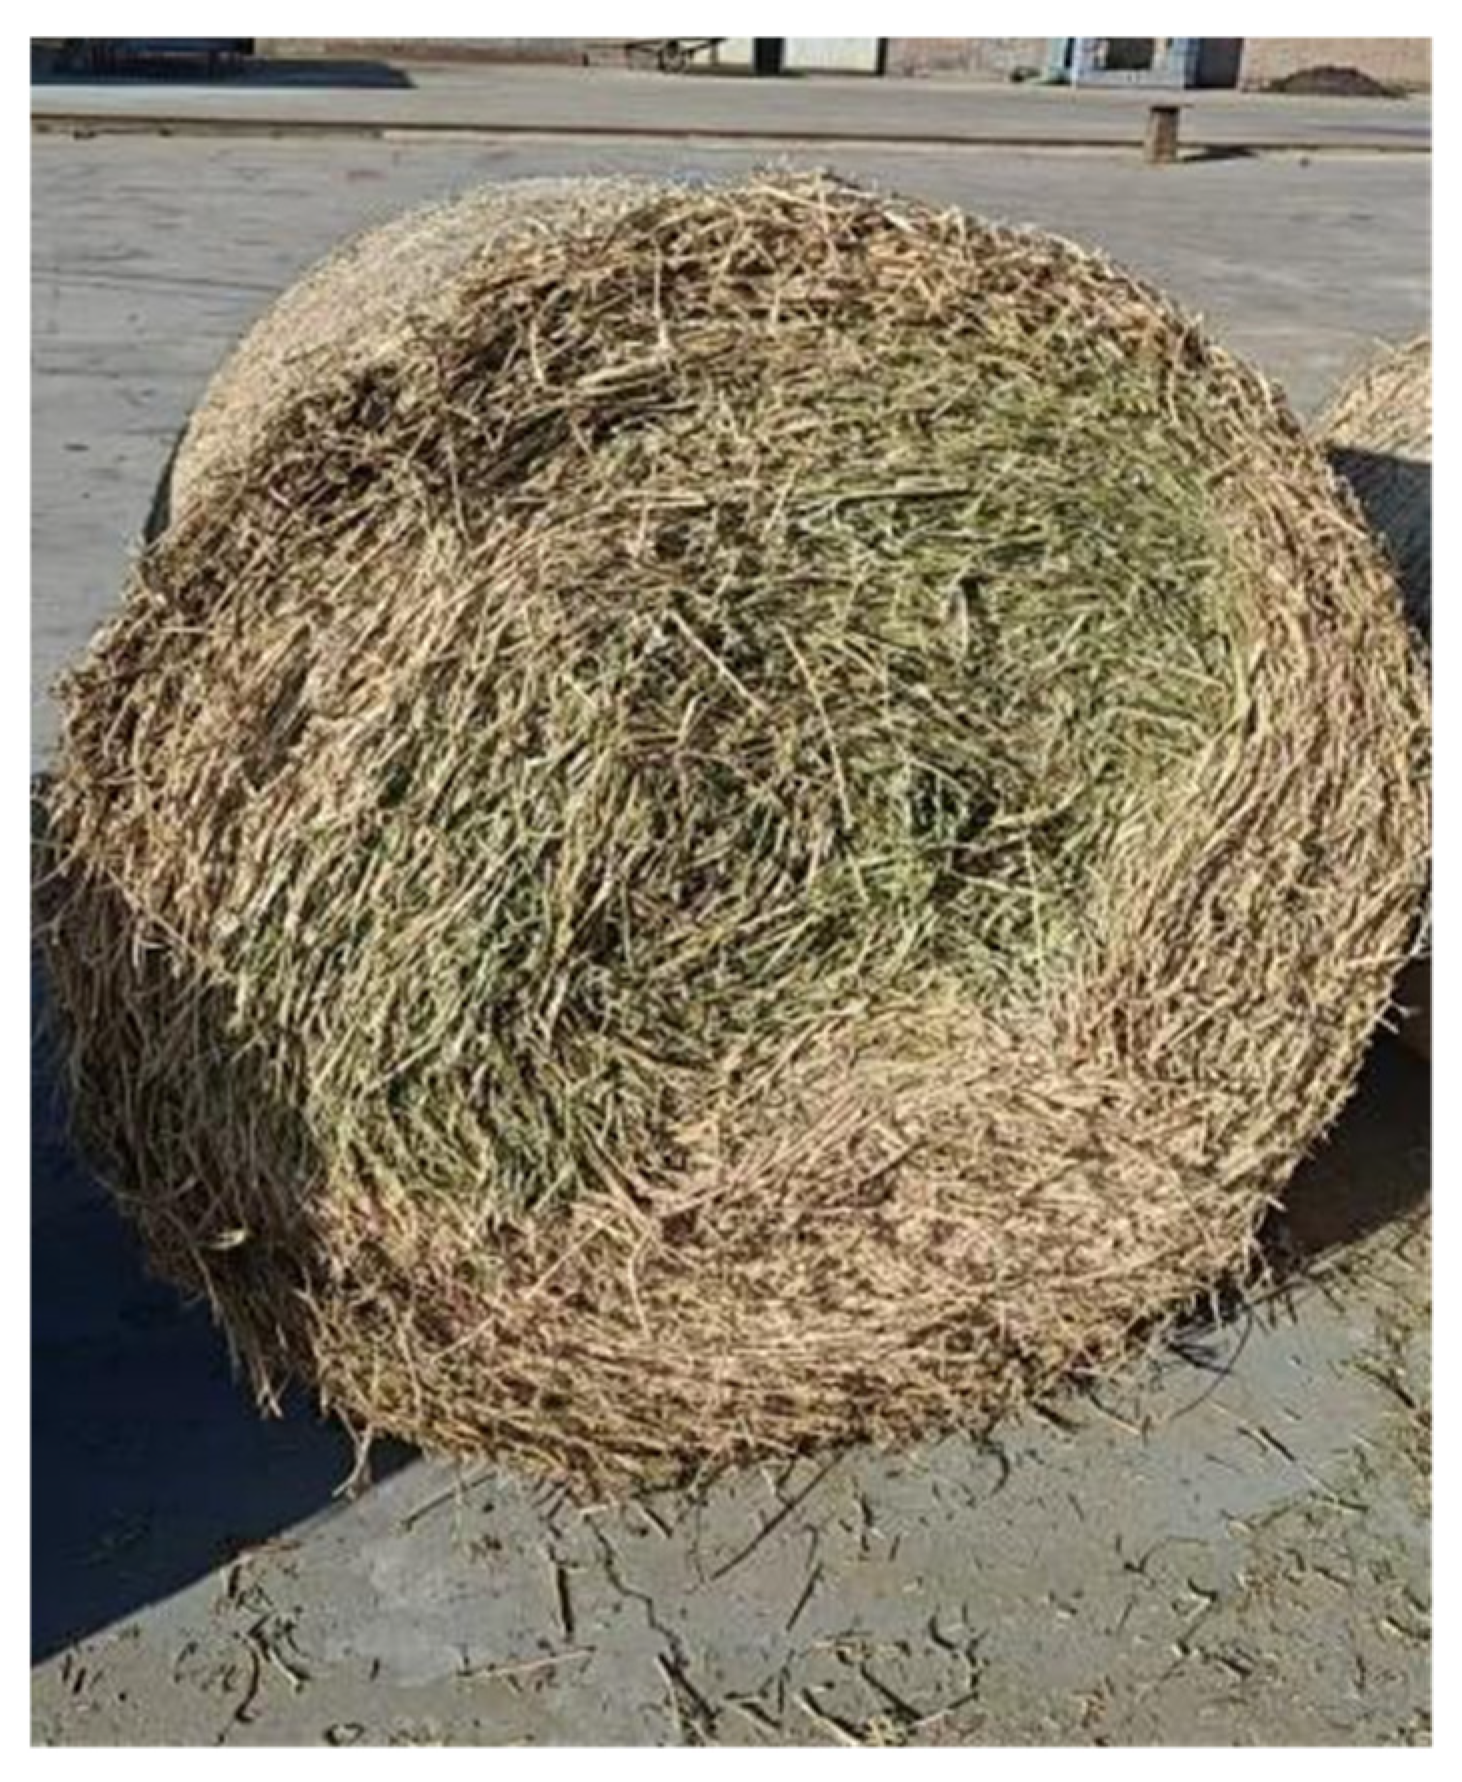
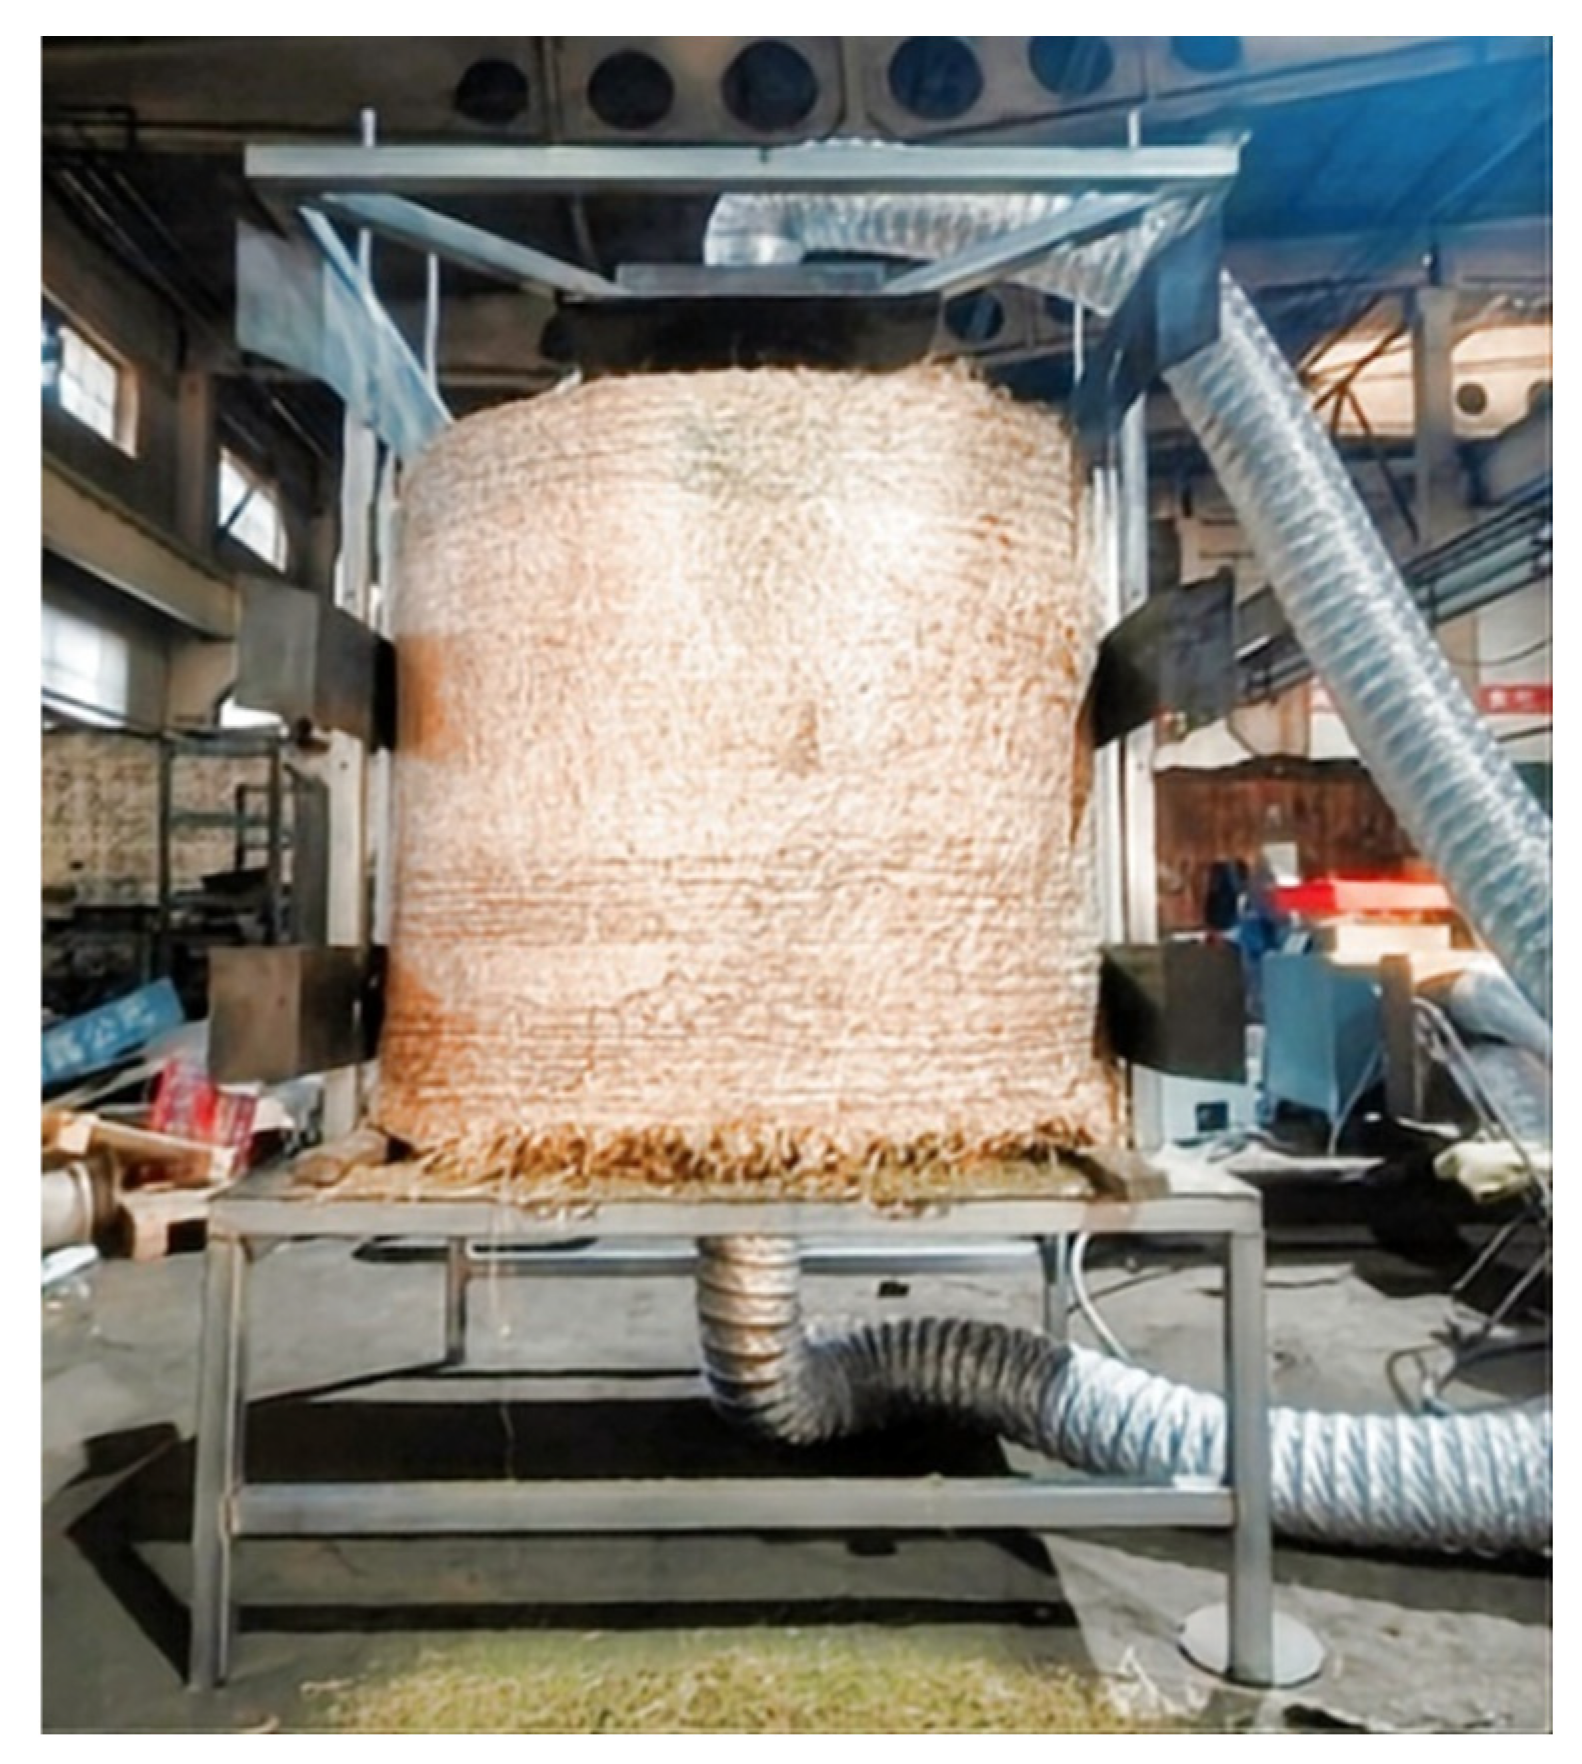
Cylindrical alfalfa bales served as the research objects. The preparation involved field-mowed alfalfa naturally dried to ~40% wet-basis moisture content, followed by baling equipment processing to form test specimens. During the experiment, internal samples of the hay bales were collected using a stratified sampling method. Mass changes before and after drying were measured using a constant-temperature drying oven maintained at 105 ± 2 °C, enabling the calculation of initial and final wet-basis moisture content. Drying was terminated when the wet-basis moisture content reached 17%. The initial mass (m0), dynamic mass (mt), and dry matter mass (mg) were continuously recorded to determine key drying indicators, including the real-time wet-basis moisture content, drying rate (DR), specific moisture extraction rate (SMER), and moisture ratio (MR). The oven-drying method served as the reference for moisture detection, with simultaneous data calibration performed to ensure accuracy. An intelligent monitoring system enabled precise control of experimental parameters: thermal environment data (temperature and wind speed fields) were collected in real time via high-precision temperature/humidity sensors (±0.5 °C) and anemometers (±0.1 m/s). All experimental groups were conducted in triplicate, and average values were used for analysis. Figure 8 shows representative bales, while Figure 9 illustrates the drying process. Key parameters—hot air temperature, velocity, and duct opening diameter—were evaluated through single-factor tests and orthogonal multi-factor experiments. This identified primary/secondary factors influencing alfalfa round bale drying rates, providing parameter foundations for equipment optimization and further research. Optimal process parameters were selected based on experimental data and energy consumption, establishing data benchmarks for subsequent equipment upgrades.

4.2. Effect of Experimental Factors on Drying Characteristics of Round Bale

4.2.1. Effect of Hot Air Temperature on Drying Characteristics of Round Bale

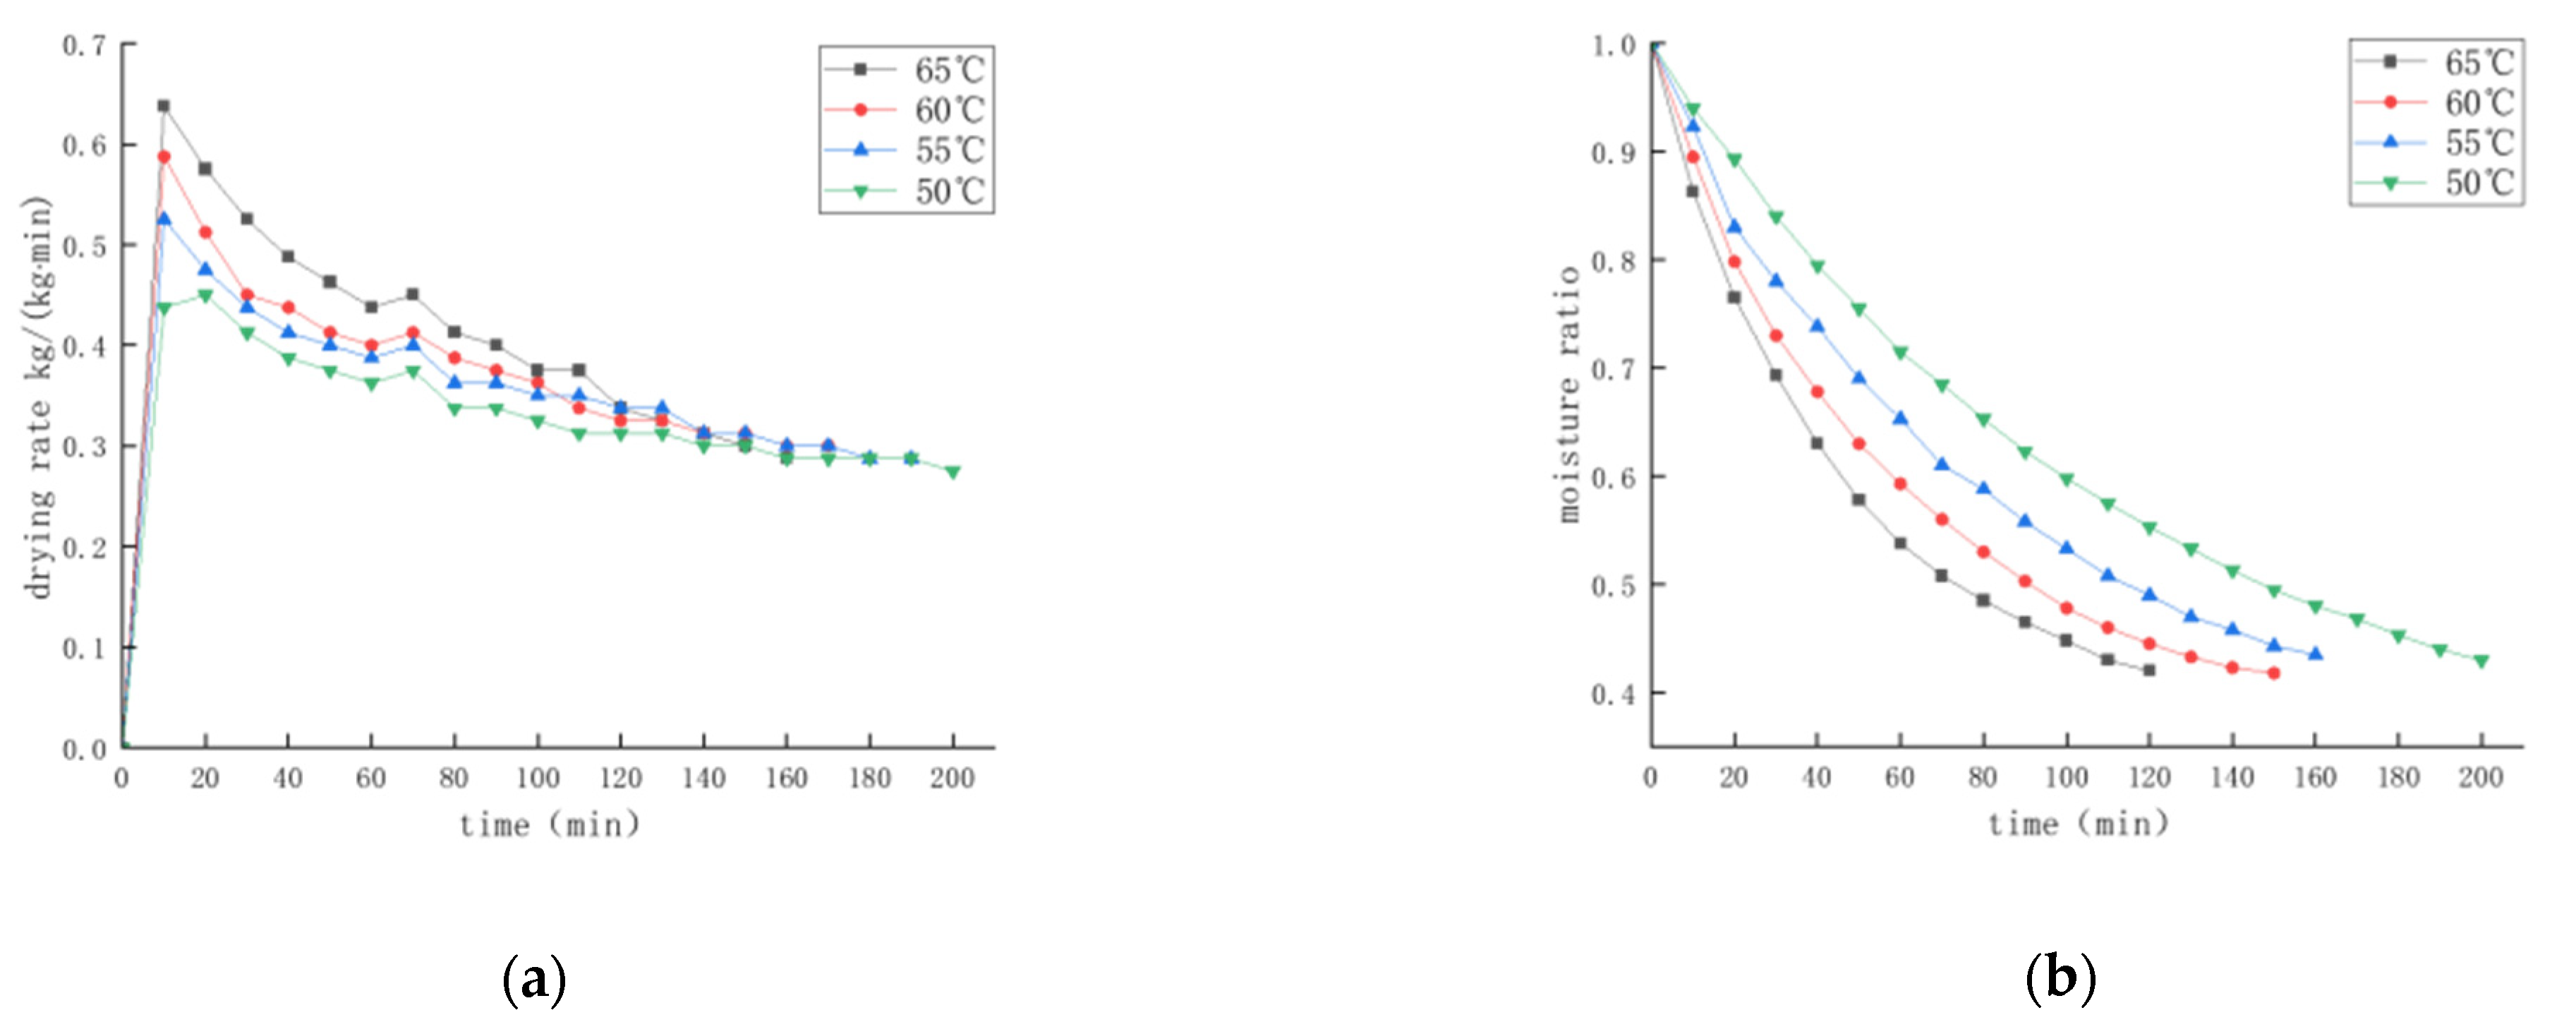
Alfalfa round bale drying characteristics were evaluated at a constant air velocity (3 m/s) and duct opening diameter (500 mm). Four temperature levels were tested: 50 °C, 55 °C, 60 °C, and 65 °C. Key metrics included the moisture ratio, drying rate, and moisture content. Figure 10 presents drying curves across temperature conditions. Table 10 summarizes system SMER values.
Experiments confirmed temperature’s positive effect on drying efficiency. Comparative analysis revealed an inverse relationship between energy consumption and moisture content: as temperature increased from 50 °C to 65 °C, system energy consumption increased linearly while SMER values exhibited a decreasing trend.
Data analysis revealed a drying efficiency bottleneck during later stages under continuous high-temperature operation. Higher temperatures do not necessarily yield better drying outcomes for alfalfa bales. During mid-to-late drying phases, excessively high temperatures provide diminishing returns.

4.2.2. Effect of Hot Air Speed on Drying Characteristics of Round Bales

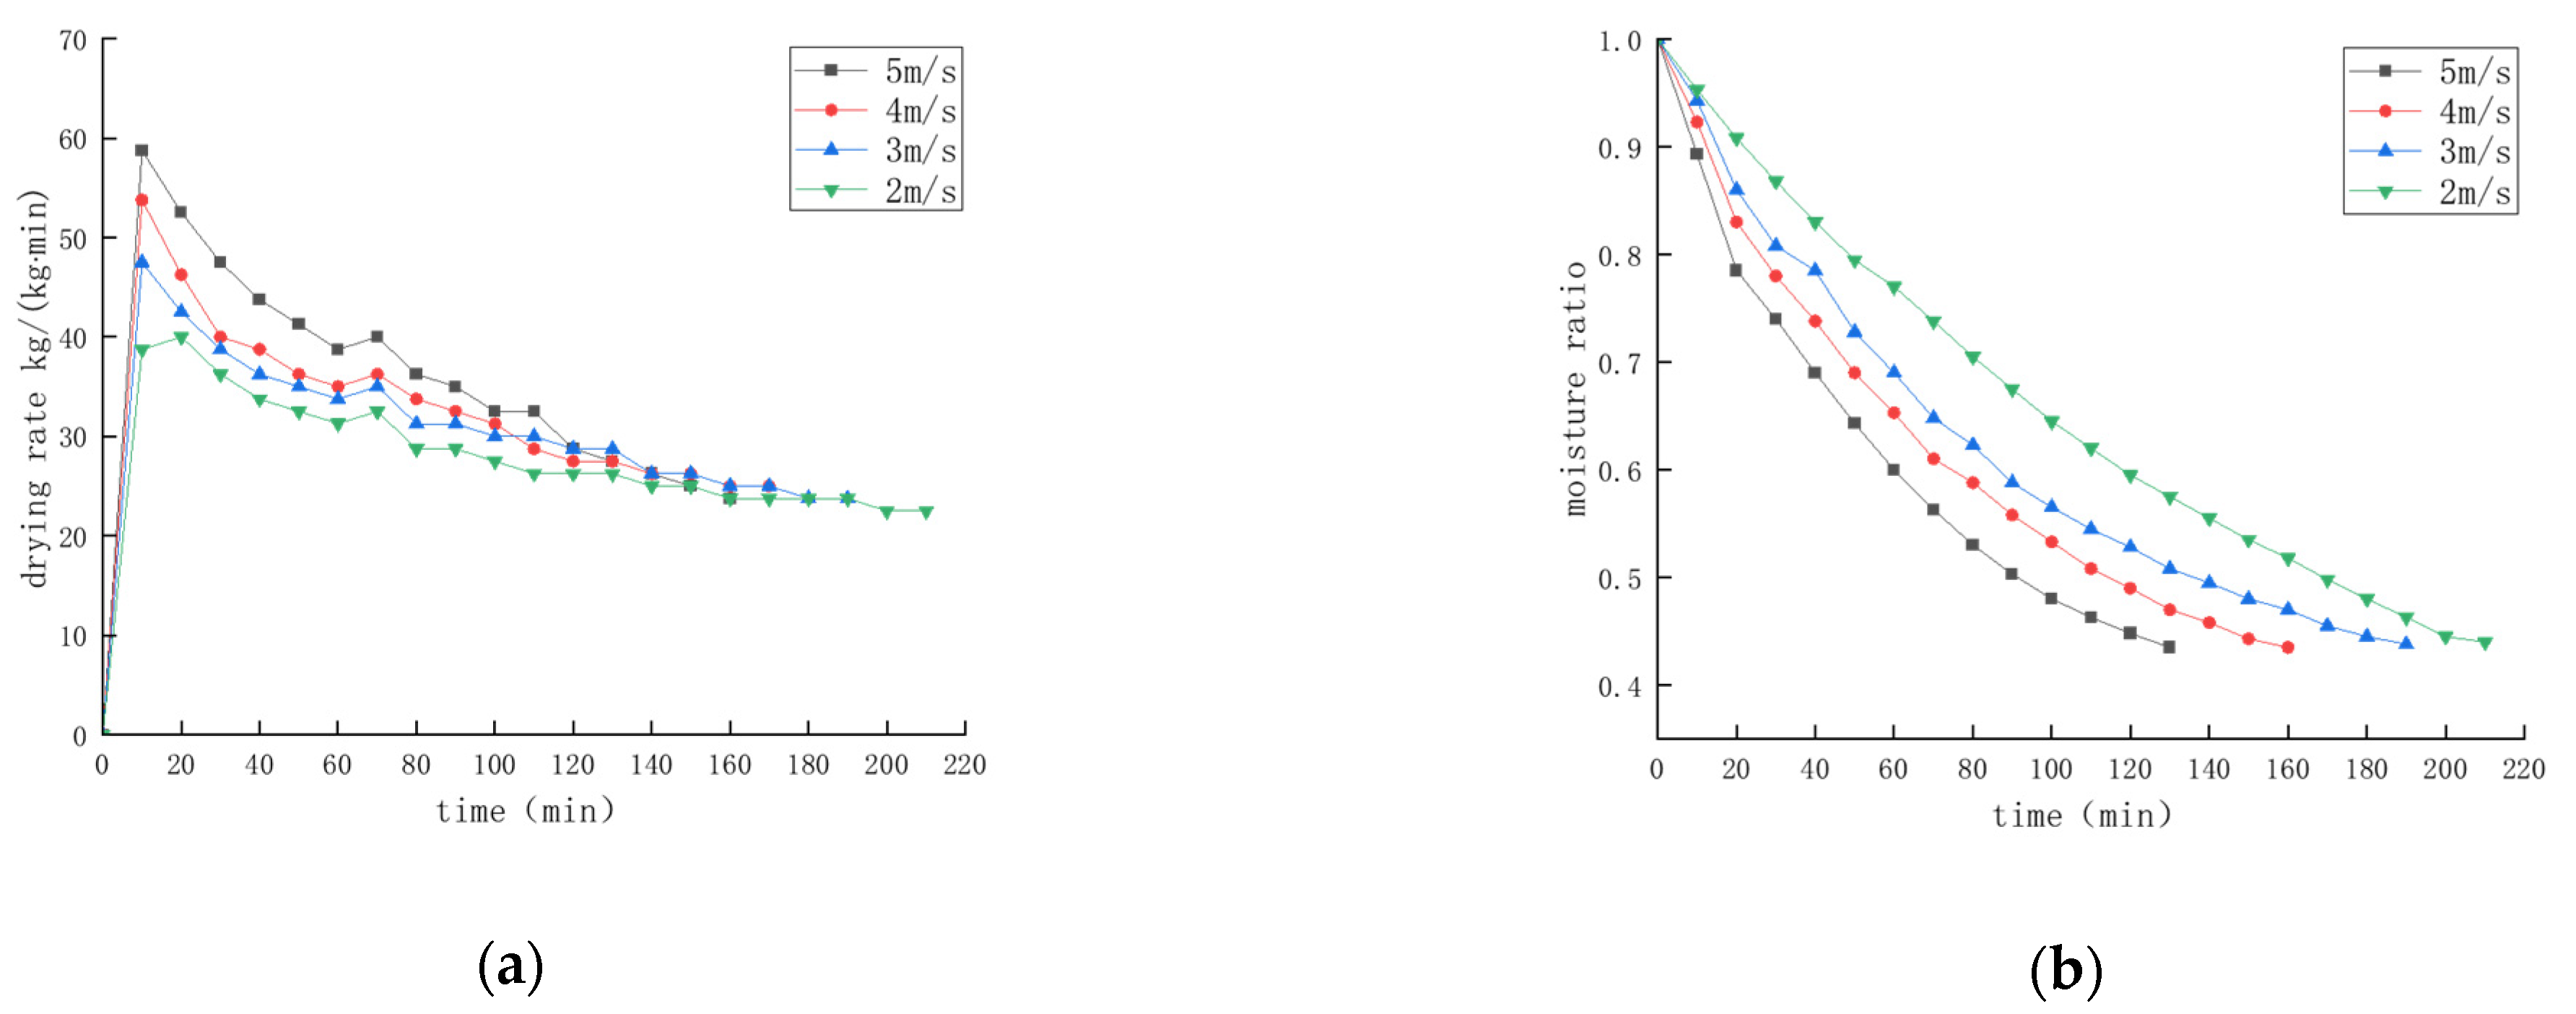
At fixed conditions (60 °C air temperature, 500 mm duct diameter), tests measured drying kinetics to target wet-basis moisture content at air velocities of 2, 3, 4, and 5 m/s. Figure 11 presents the drying curves across velocity conditions. Table 11 summarizes the corresponding SMER values.
Comparative analysis reveals that increased air velocity significantly alters system energy consumption patterns. As velocity increased from 2 to 5 m/s, system energy consumption decreased, while SMER (dehumidification efficiency per unit energy) increased. Although higher velocities accelerate evaporation near ducts, rapid moisture loss may cause leaf crimping and crust formation. These physical changes hinder mid-drying moisture migration and vaporization, thereby diminishing the benefits of high-velocity continuous drying.

4.2.3. Effect of Air Duct Opening Diameter on Drying Characteristics of Round Bale

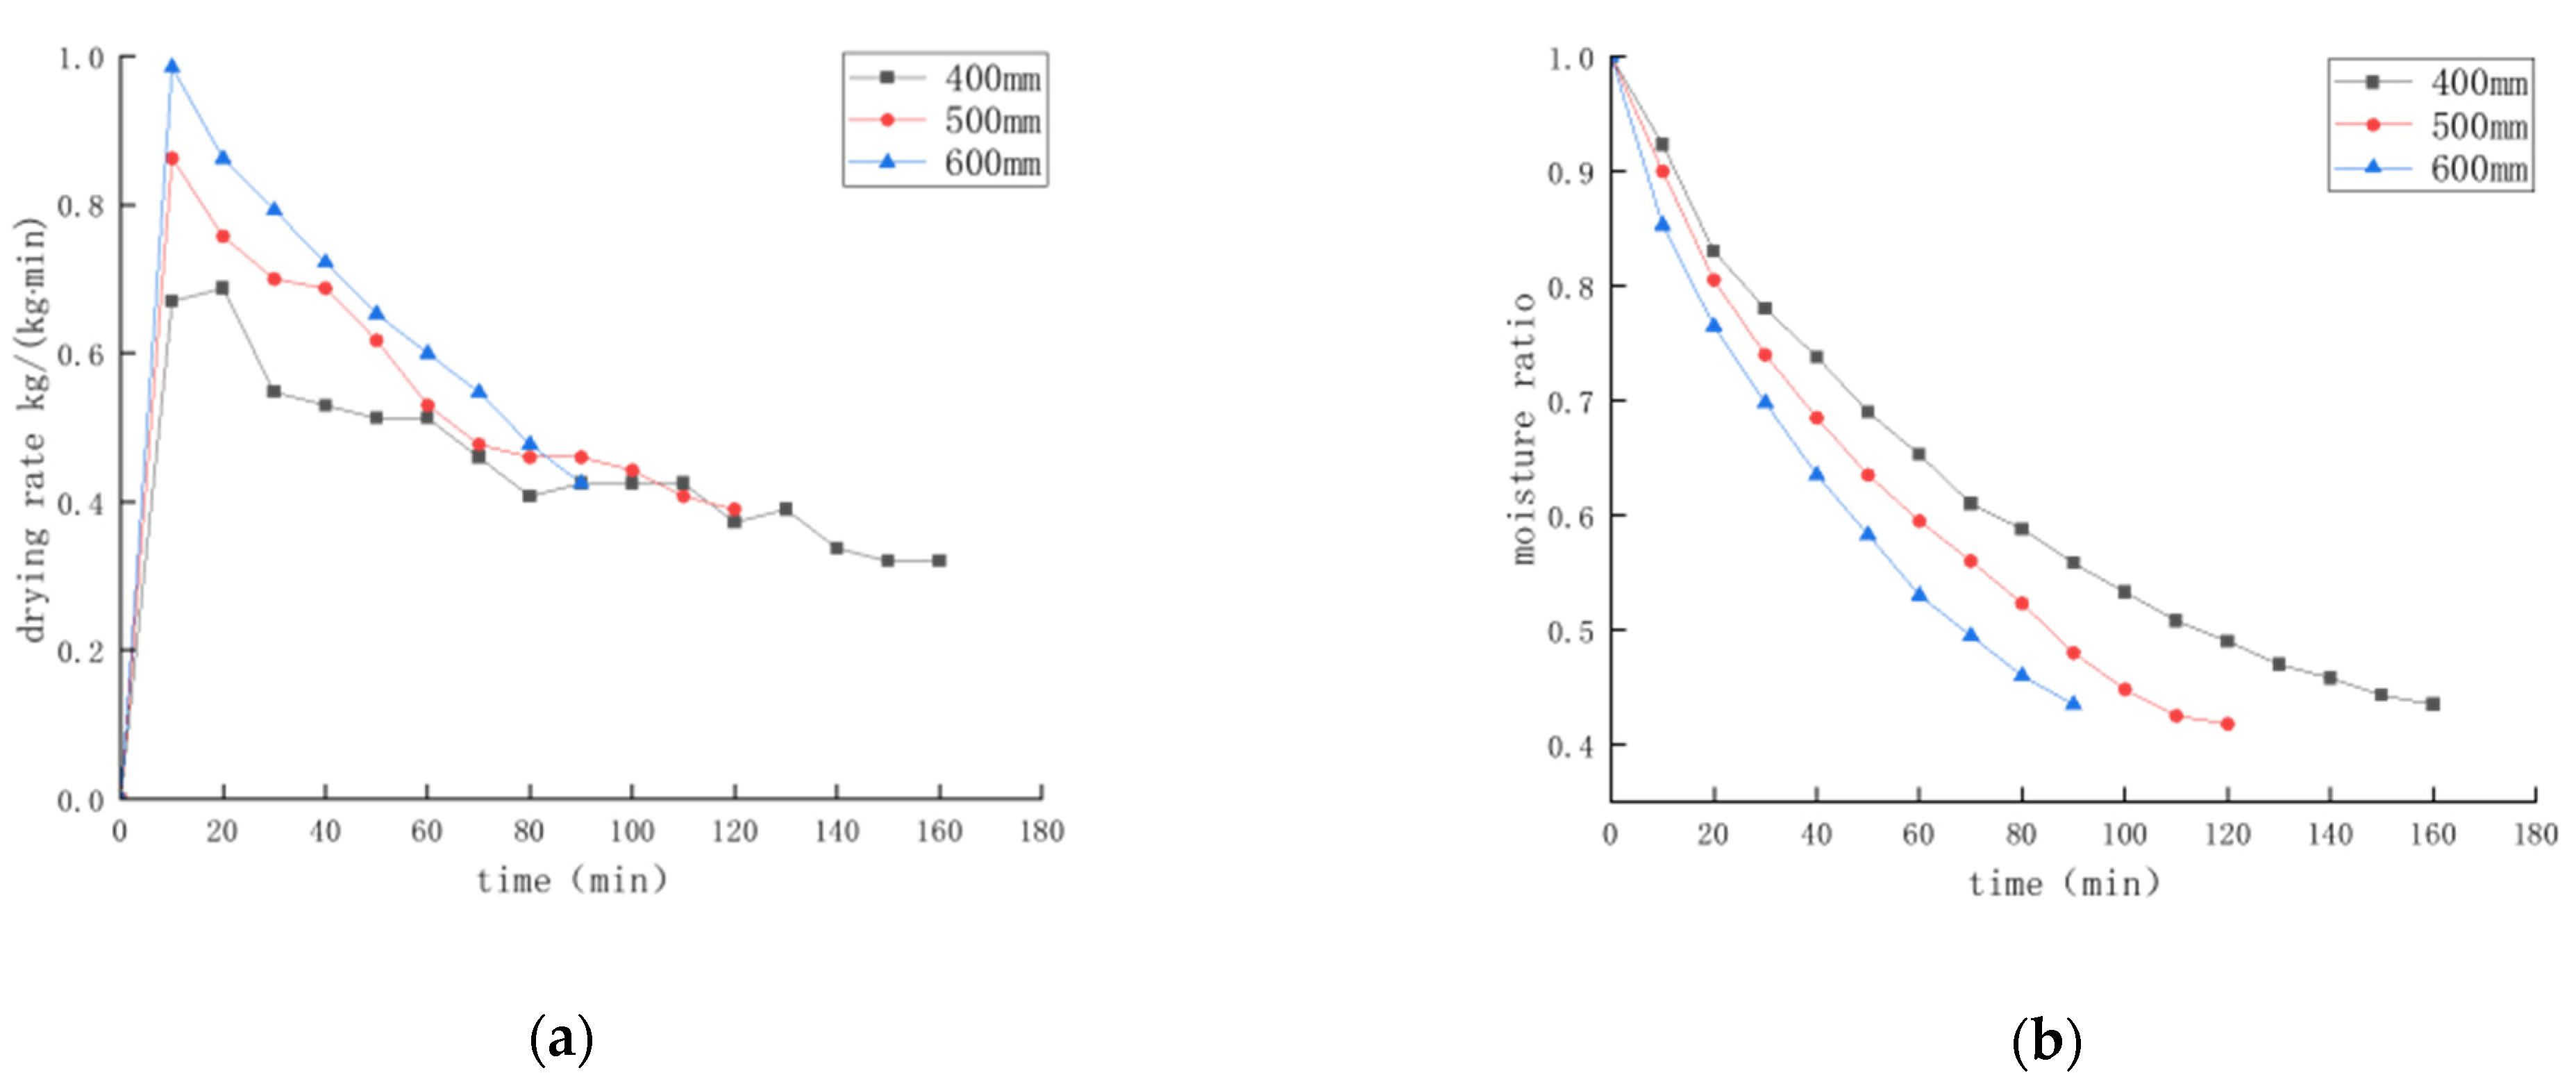
At fixed parameters (60 °C air temperature, 3 m/s air velocity), experiments measured drying to target wet-basis moisture content at duct diameters of 400, 500, and 600 mm. Figure 12 illustrates drying curves across duct diameters, while Table 12 presents corresponding SMER values.
Experiments confirmed the positive effect of duct diameter on drying efficiency. Comparative analysis reveals an inverse relationship between energy consumption and moisture content: as duct diameter increased from 400 to 600 mm, system energy consumption decreased progressively while SMER values increased. Duct diameter modifications significantly influence both energy consumption patterns and dehumidification efficiency. Moderate diameter enlargement enhances airflow uniformity, thereby improving drying efficiency and energy utilization.

4.3. Response Surface Testing and Analysis

4.3.1. Response Surface Test Design Scheme

The quadratic orthogonal regression Box–Behnken experimental design was employed to systematically investigate the influence of key parameters on drying performance during the hot-air drying process. The quadratic orthogonal regression Box–Behnken experimental design was employed to systematically investigate the influence of key parameters on drying performance during the hot-air drying process. This method efficiently evaluates the interactions among three factors at different levels—hot-air temperature (X1), hot-air velocity (X2), and air duct opening diameter (X3)—reducing the number of experiments while improving efficiency. The relationship between factors and response variables was described by fitting a quadratic polynomial model, the significance of which was verified using analysis of variance (ANOVA). Drying time and drying rate served as the primary evaluation indices in the experimental design to optimize drying process parameters, enhance drying efficiency, and reduce energy consumption. The experimental design levels are presented in Table 13.

4.3.2. Establishment and Analysis of Regression Equation

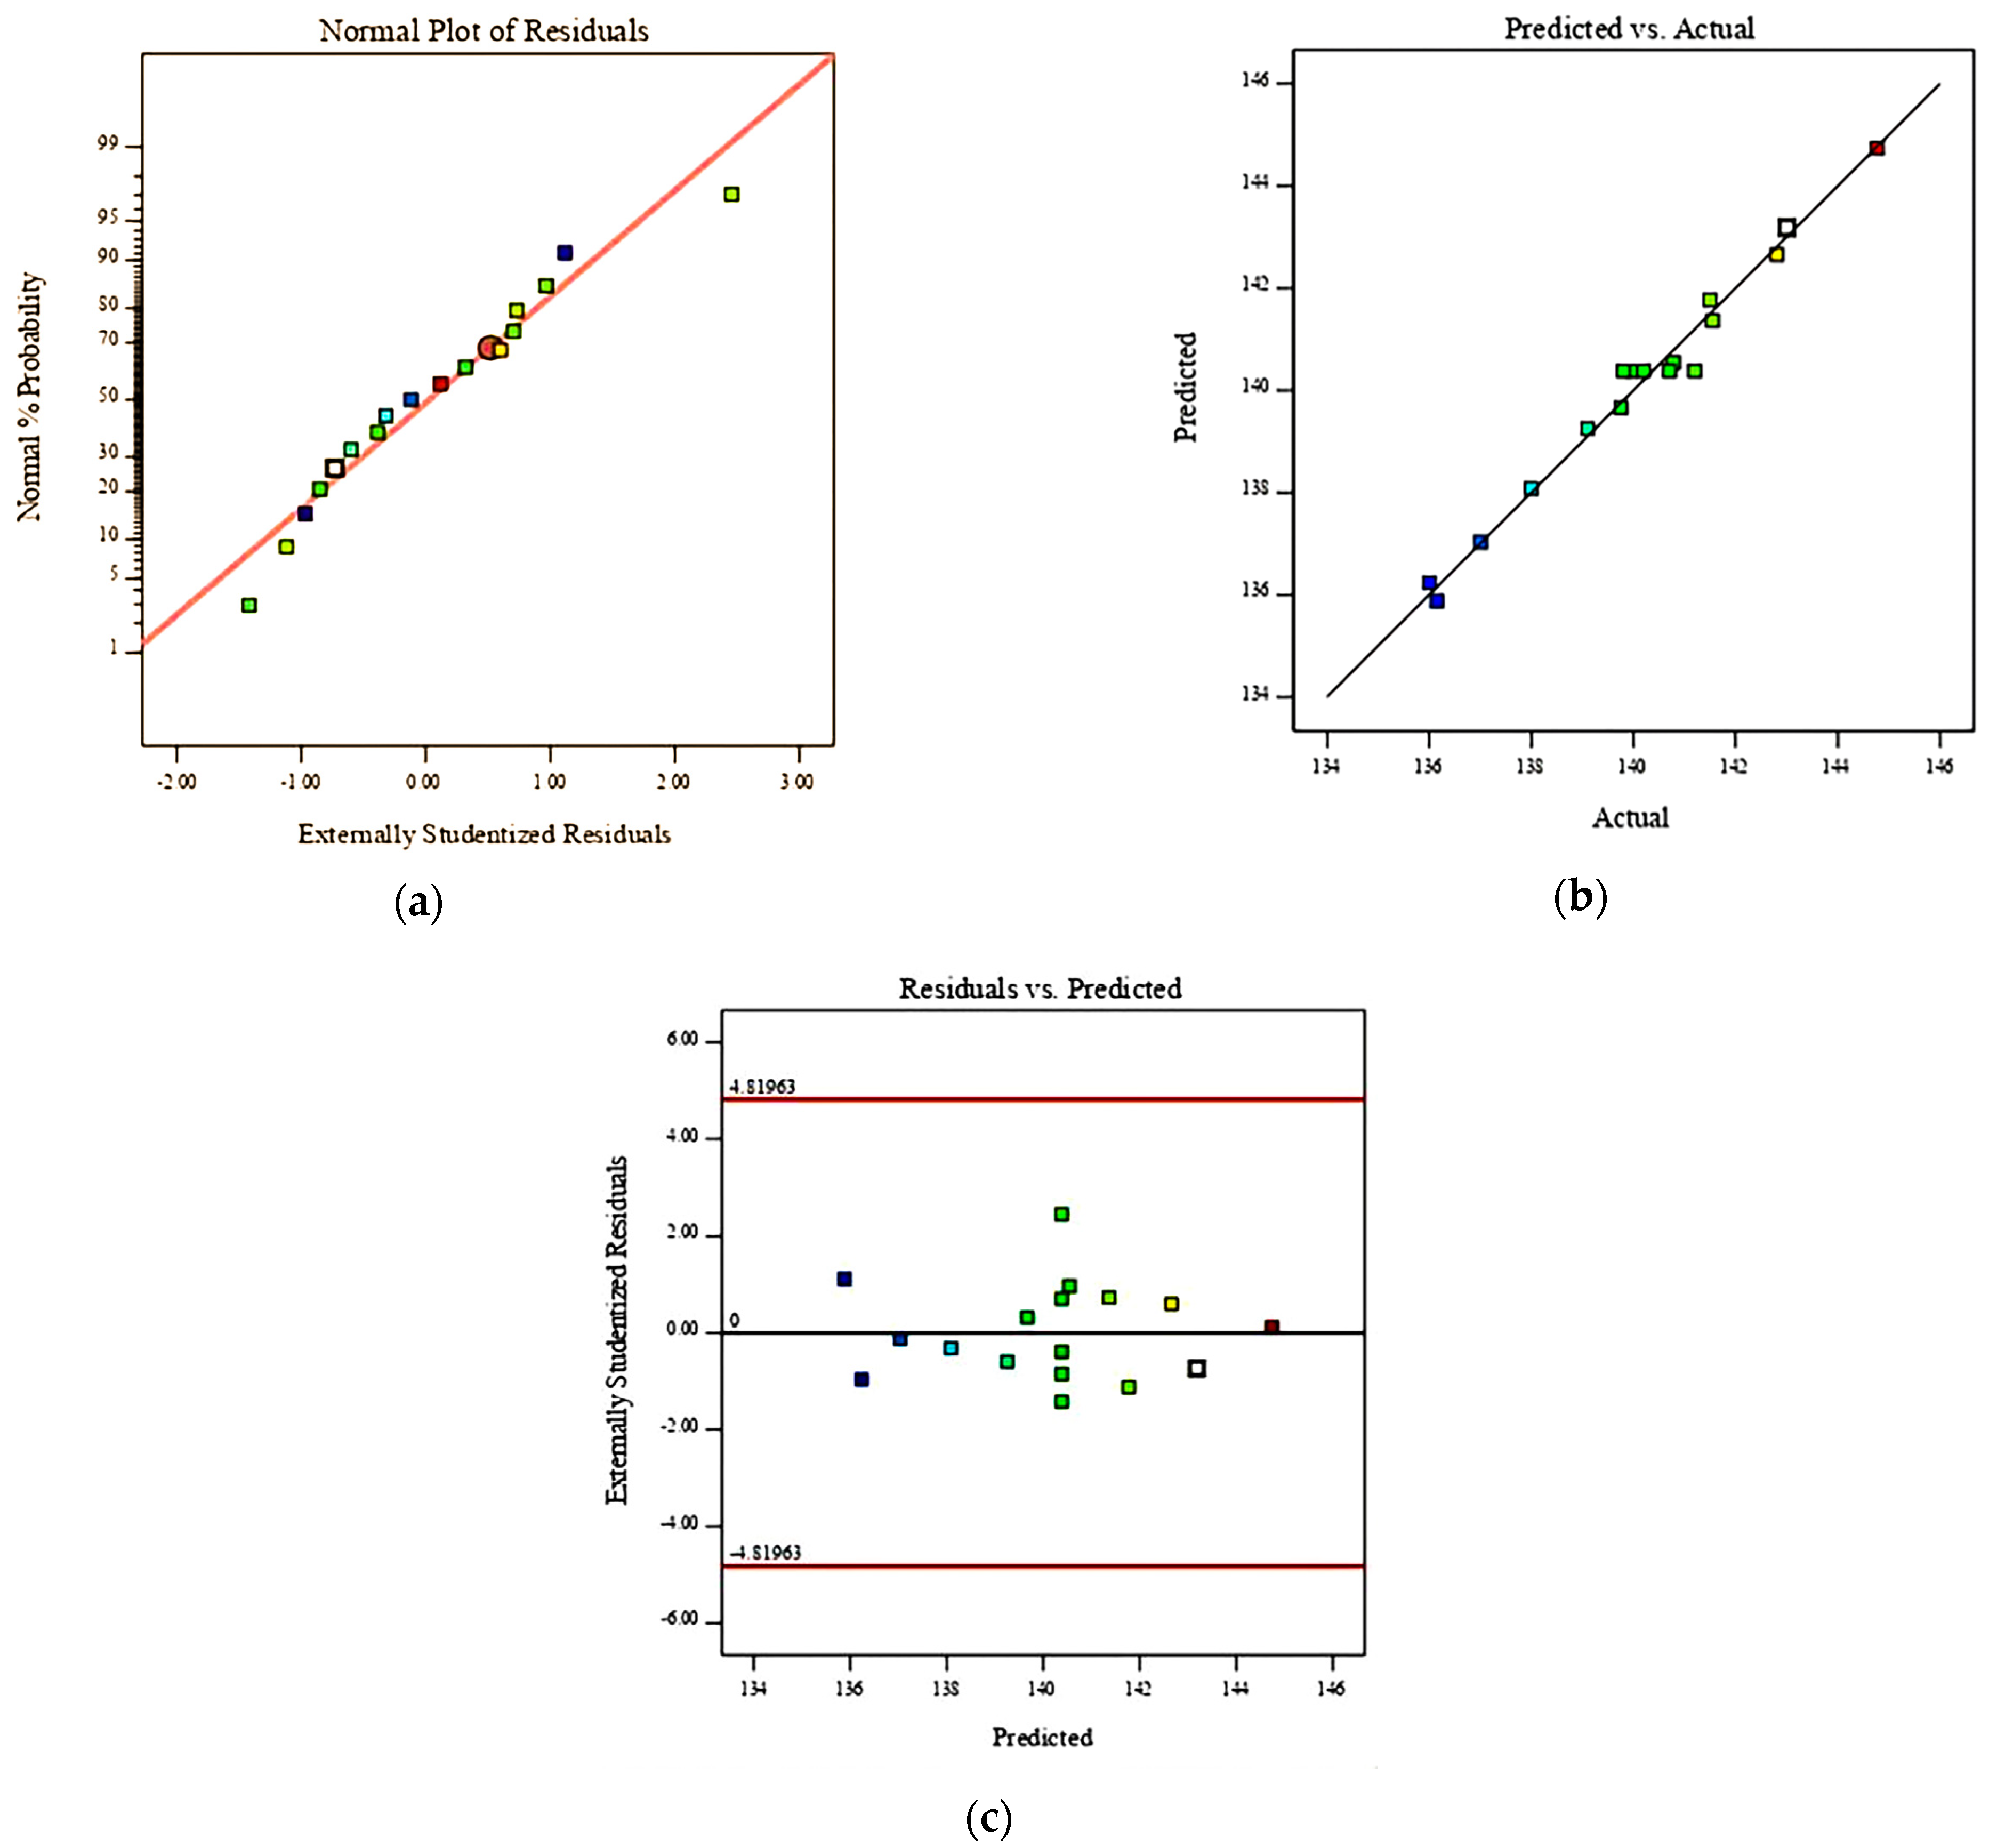
A regression model for drying time was established. As shown in Table 14, the model was highly significant (p < 0.01), while the lack-of-fit term was not significant (p > 0.05). This indicates that the regression model fits the data well and is suitable for analyzing the factors influencing drying time. The coefficient of determination (R2 = 0.9816) indicates that 98.16% of the variation in drying time is explained by the model. The order of influence of the factors on drying time was hot-air temperature (X1) > hot-air velocity (X2) > air duct opening diameter (X3). Among the model terms, X1, X2, and the interaction X1 × 3 were highly significant (p < 0.01), whereas X3 and the interactions X1X2 and X2X3 were significant (p < 0.05). The quadratic terms (X12, X22, X32) were not significant and were therefore excluded from the model. The resulting equation relating drying time to the process parameters is
Y1 = 140.38 − 1.53X1 − 2.32X2 − 0.621X3 − 1.94X1X3 − 1.06X2X3
where Y1 is drying time, min; X1 is hot-air temperature, °C; X2 is hot-air velocity, m/s; and X3 is the air duct opening diameter, mm. The analysis of variance (ANOVA) for the drying time regression model is presented in Table 14.
Based on the experimental data, the relative influence of each factor on drying rate was determined by the magnitude of the F values, with the order of significance (from highest to lowest) being hot-air temperature > hot-air velocity > air duct opening diameter.
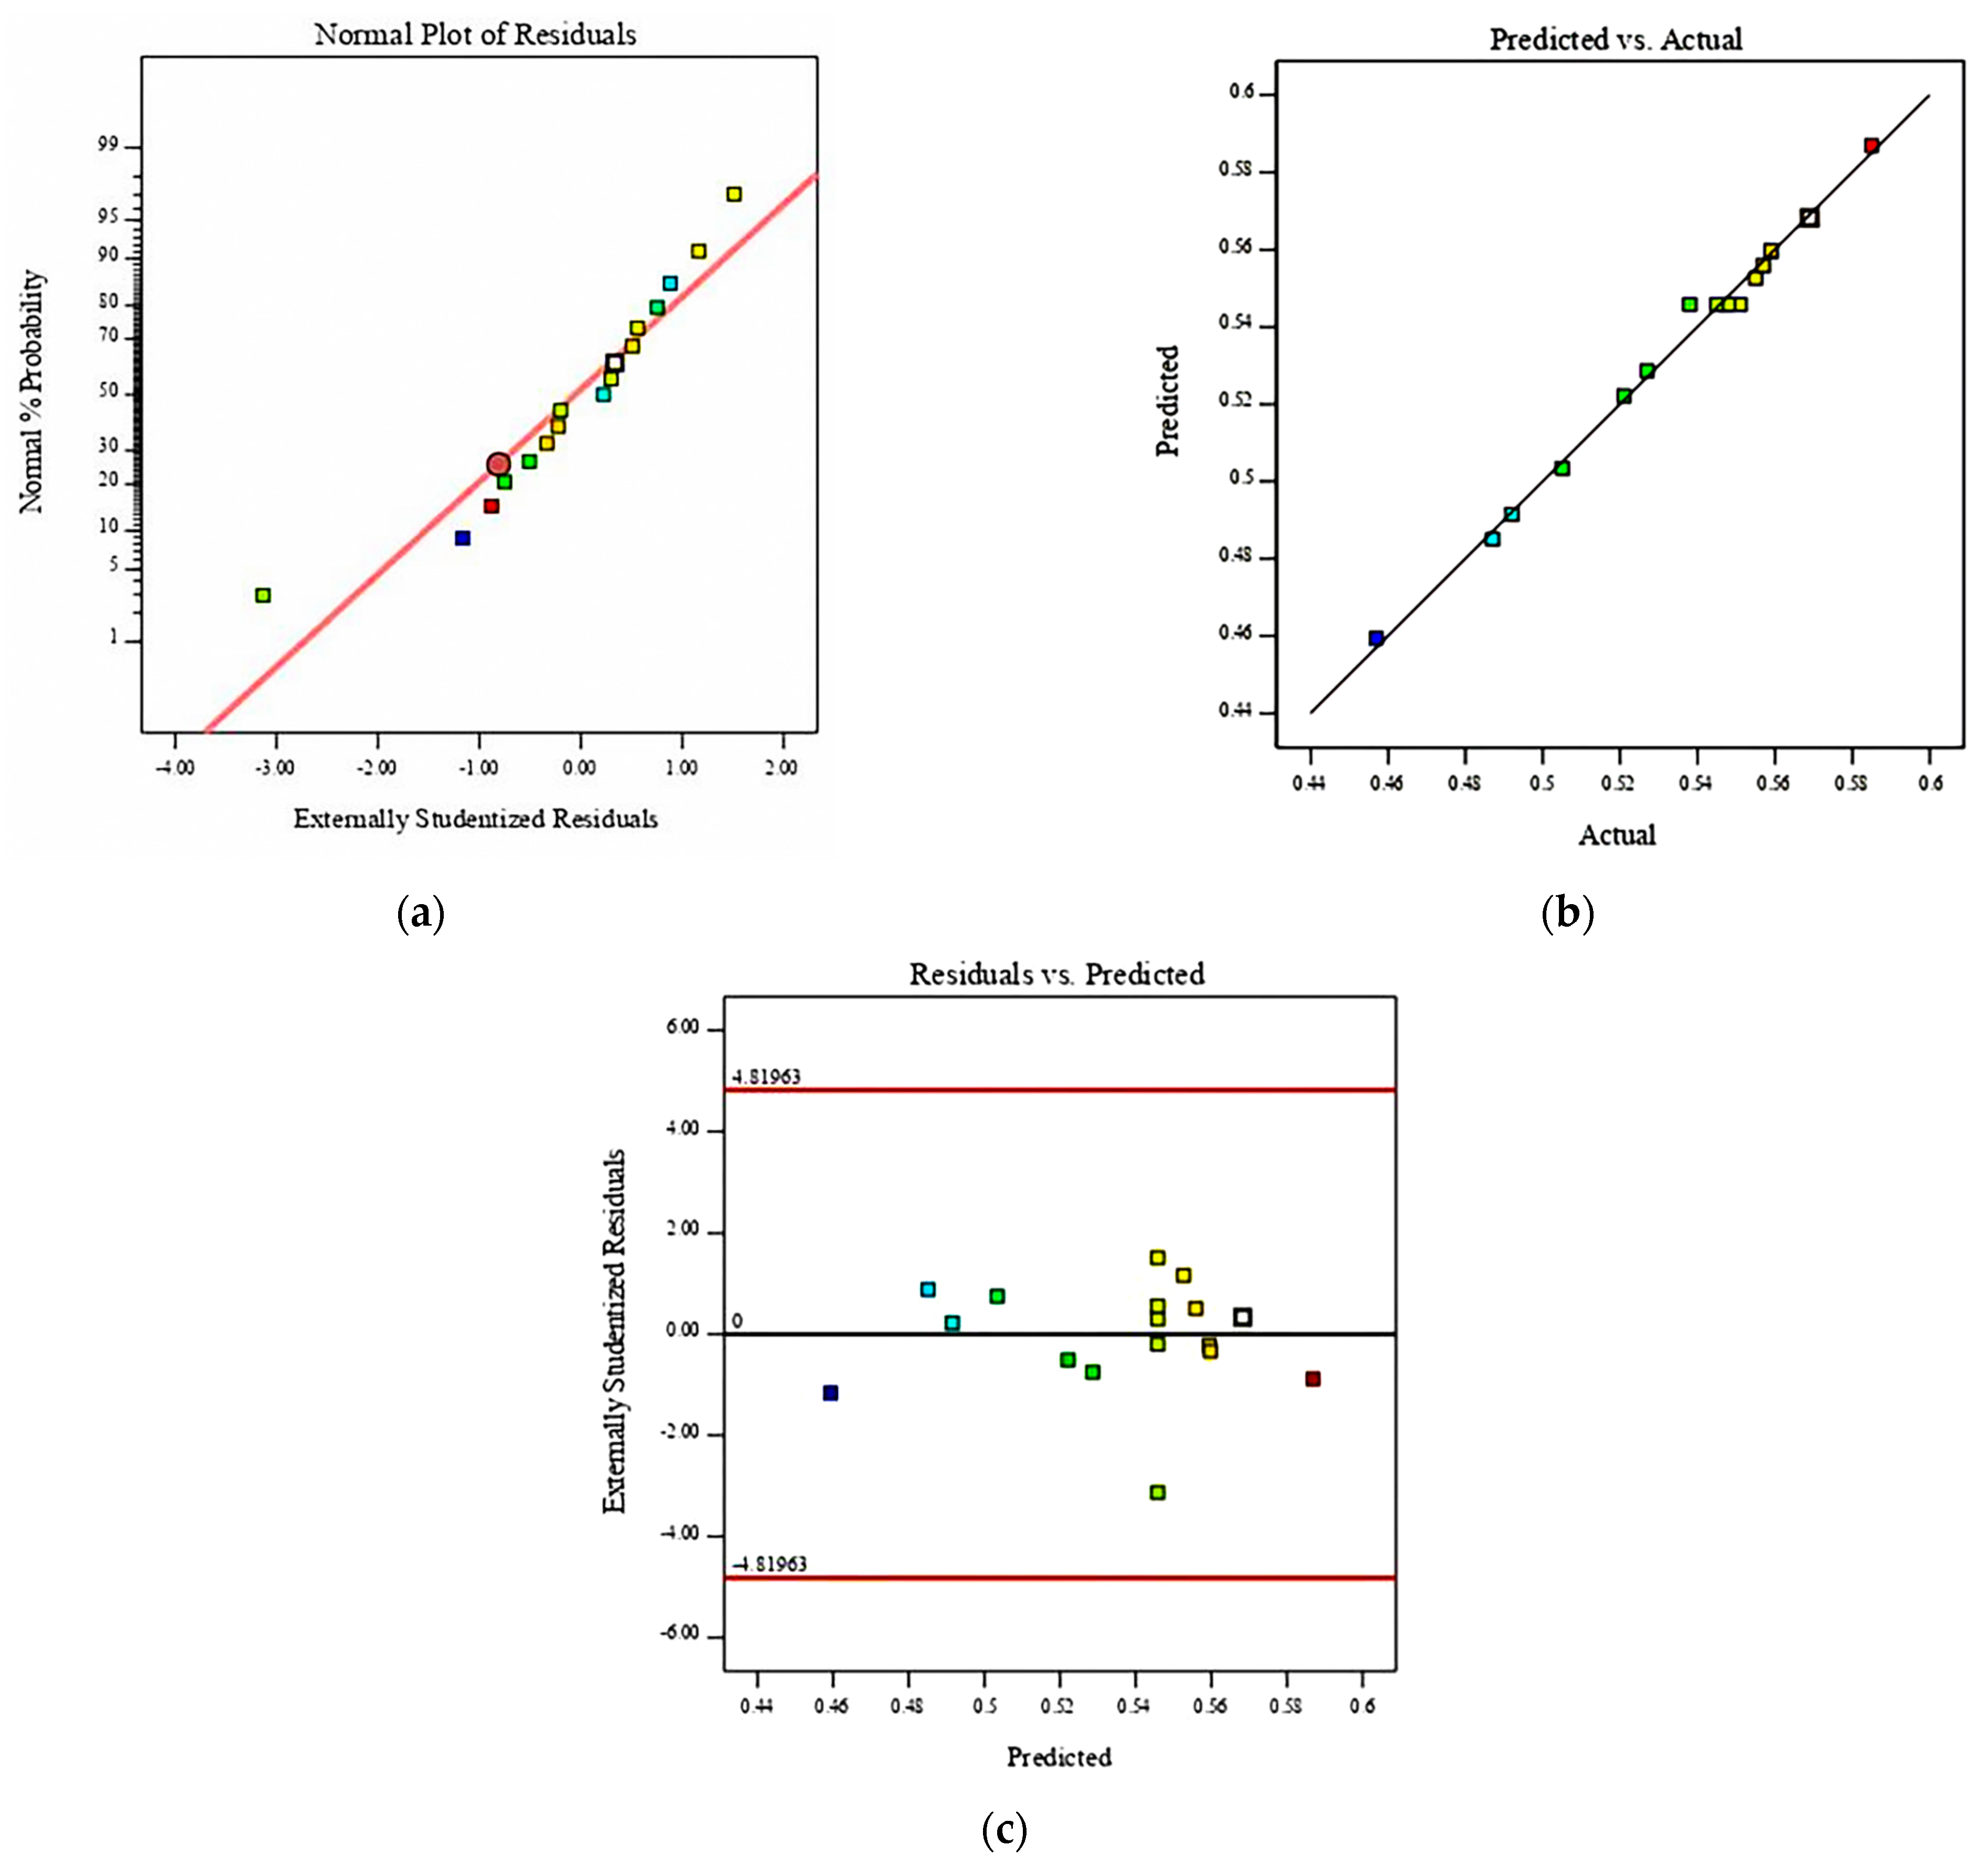
Figure 13a displays a normal probability plot of residuals, where data points approximately follow a straight-line distribution, indicating normally distributed residuals. Figure 13b compares actual observed values with model-predicted values, showing a strong alignment that validates the model’s excellent fit to experimental data. Figure 13c illustrates the relationship between residuals and predicted values, revealing randomly scattered data points without systematic patterns or trend deviations. This confirms the model’s stable predictive capability across different intervals and further verifies its reliability and generalizability. Collectively, these analyses demonstrate that the model accurately describes moisture transfer physics during round-bale drying and provides a reliable theoretical foundation for subsequent process optimization and mechanistic studies. (2) The drying rate regression model was highly significant (p < 0.01) with a non-significant lack-of-fit (p > 0.05), confirming excellent model adequacy for analyzing drying rate determinants. The coefficient of determination (R2 = 0.9931) indicates that 99.31% of drying rate variability is explained by the model. Factor-significance ranking was hot-air temperature (X1) > hot-air velocity (X2) > air duct opening diameter (X3). Extremely significant terms (p < 0.0001) included X1, X2, X3, and X1X3; significant terms (p < 0.05) were X32, X1X2, X2X3, and X22, while X12 was non-significant and excluded. The optimized drying rate equation is
Y2 = 0.5458 − 0.0191X1 − 0.0317X2 − 0.0149X3 + 0.01X1X2 − 0.0193X1X3 − 0.0165X2X3 − 0.021X22 − 0.0023X32
where Y2 is drying rate, kg/kg·min; X1 is hot-air temperature, °C; X2 is hot-air velocity, m/s; and X3 is air duct opening diameter, mm. The ANOVA results for this regression model are presented in Table 15.
Based on experimental data, the relative influence of factors was determined by F value magnitudes significance ranking as follows: hot-air temperature > hot-air velocity > air duct opening diameter.
Figure 14a presents a normal probability plot of residuals, where data points approximately align along a straight line, indicating normally distributed residuals. Figure 14b demonstrates a strong agreement between measured and predicted values, confirming the model’s high predictive accuracy for actual drying processes. Figure 14c shows the residuals versus predicted values plot, revealing no systematic patterns and demonstrating a stable model performance across prediction intervals. Collectively, these results confirm that the model accurately describes moisture transfer dynamics during round-bale drying and aligns closely with the observed physical phenomena.

4.4. Interactive Response Surface Analysis and Optimal Process Parameter Verification

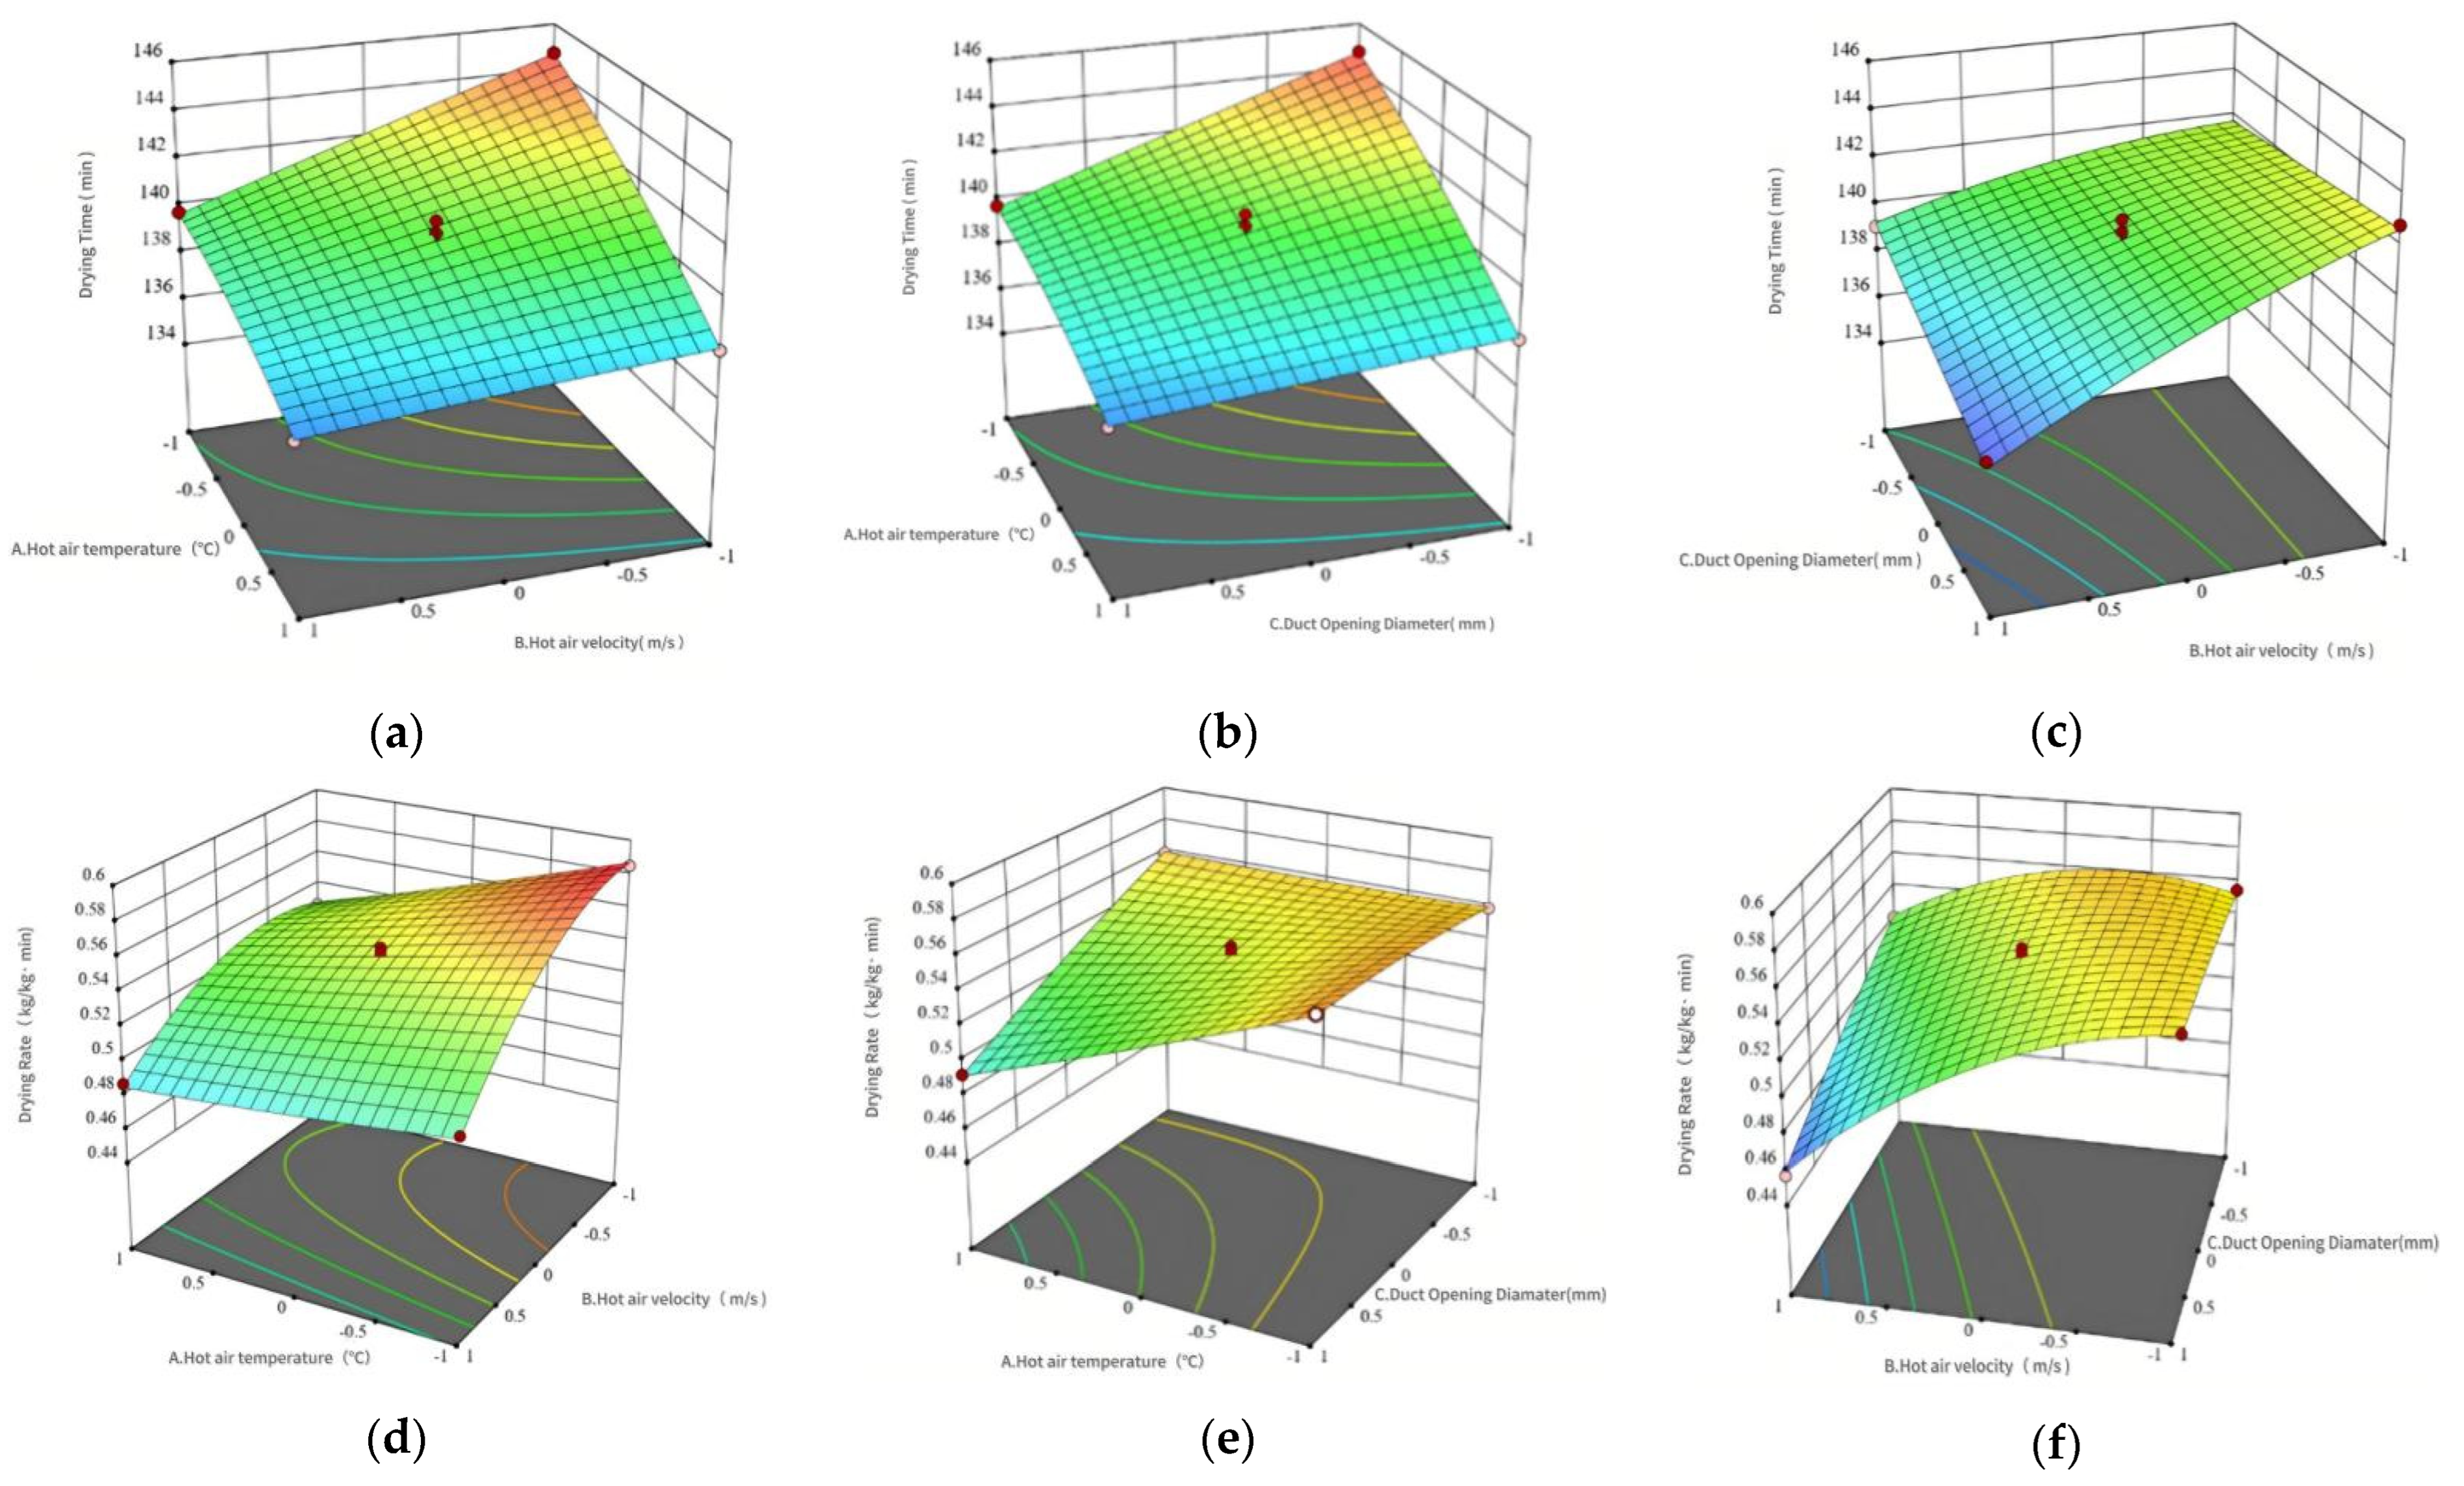
A response surface analysis of the Box–Behnken experimental design revealed in-depth influence patterns of parameters on drying time. Figure 15 illustrates interactions between air temperature, velocity, duct diameter, and drying time.
Figure 15a indicates that at low air velocities, increasing temperature steadily reduces drying time at a constant rate; this temperature effect remains consistent at high velocities. Furthermore, higher velocities reduce drying time across all temperatures.
Figure 15b demonstrates that at lower temperatures, larger duct diameters shorten drying time; conversely, smaller diameters require higher temperatures to reduce drying time. This occurs because hot air rapidly heats materials, while duct diameter primarily governs the hot air–bale contact area. Enlarged diameters increase airflow volume, effectively reducing time to target moisture content.
Figure 15c reveals that at small duct diameters, increasing air velocity marginally reduces drying time, whereas at larger diameters, velocity increases substantially accelerate drying. Thus, larger duct diameters reduce drying time more effectively at equivalent velocities.
Figure 15d demonstrates that at lower temperatures, drying rate increases steadily with velocity, while at higher temperatures, rate increases to an optimal velocity before declining. Higher velocities enhance high-temperature air influx and moisture removal, increasing bale heat storage and accelerating evaporation. For any velocity, drying rate exhibits a temperature-dependent maximum—initially rising then falling with temperature increase. Temperature elevation accelerates bale heating and drying, while insufficient temperatures reduce rates and prolong drying cycles.
Figure 15e analysis indicates that across low and high temperature ranges, drying rate increases with duct diameter enlargement. Similarly, across small and large diameters, drying rate increases with temperature elevation. Temperature exerts a strong influence on drying rate, with optimal values occurring within these parameter spaces.
Figure 15f reveals that at both low and high air velocities, drying rate increases with duct diameter enlargement. while across duct sizes, drying rate increases with velocity enhancement exhibiting optimal values within these operating conditions.
Response surface optimization identified optimal drying conditions that minimize drying time and maximize efficiency while holistically considering energy consumption. These parameters are presented in Table 16. At 65 °C, 5 m/s air velocity, and 600 mm duct diameter, drying time measured 119.2 min with a drying rate of 0.62 kg/(kg·min). Validation testing applied these parameters, with comparative tests at 65 °C, 4 m/s, and 500 mm, yielding average values of a 122 min drying time and a 0.61 kg/(kg·min) drying rate from triplicate tests. The minimal deviation (Δtime = 2.8 min, Δrate = 0.01 kg/(kg·min)) confirms an excellent model fit.

5. Discussion

This study demonstrates that the optimization of hot-air temperature, velocity, and duct diameter significantly enhances both the uniformity and efficiency of the drying process for alfalfa round bales. According to the multiphysics simulations, a duct diameter of 600 mm combined with an air velocity of 5 m/s achieved optimal uniformity in temperature, humidity, and airflow distributions, as reflected by the low non-uniformity coefficients of 5.8%, 3.9%, and 28.9%, respectively. These improvements directly address the persistent challenge of non-uniform drying in conventional forage processing, which is known to contribute to nutrient degradation and inefficient energy use [1].
The response surface methodology identified a set of optimal parameters—65 °C, 5 m/s, and 600 mm—under which the drying time was shortened to 119.2 min with a drying rate of 0.62 kg/(kg·min). The high predictability of the models (R2 > 0.98) and the close agreement between the simulation and experimental results affirm the reliability of the optimization framework. The significant role of duct diameter in promoting airflow uniformity is consistent with the findings of Roman and Hensel [10], highlighting the influence of dryer geometry on homogeneous drying in porous biomaterials. Furthermore, the observed trade-off between higher drying temperatures and increased energy consumption aligns with trends documented in other agricultural drying systems [2].
These results offer a viable and efficient parameter configuration for industrial-scale forage drying operations, effectively balancing processing speed and energy consumption. Future studies should consider investigating adaptive or multi-stage drying protocols to further improve efficiency, particularly during the falling-rate period of the drying process.

6. Conclusions

This study designed and fabricated a dedicated drying test bench (CGT-1) for alfalfa round bales, integrating a high-pressure fan, controllable heating system, and intelligent control to enable precise process parameter regulation. Multiphysics simulations (COMSOL) validated the equipment design, revealing the mechanisms underlying inhomogeneous temperature, humidity, and airflow distributions within the bales. These simulations demonstrated that increasing the air duct opening to 600 mm significantly enhanced airflow uniformity, reducing wind speed non-uniformity to 28.9%. Subsequent experimental optimization established optimal drying parameters: a 65 °C hot-air temperature, 5 m/s air velocity, and 600 mm duct diameter. Under these conditions, drying time was minimized to 119.2 min with a drying rate of 0.62 kg/(kg·min). While elevated temperatures and air velocities improved drying efficiency, balancing energy consumption against potential impacts on material integrity was necessary. Response surface methodology confirmed the robustness of the optimal parameters, with validation tests indicating minimal deviations (Δtime = 2.8 min; Δrate = 0.01 kg/(kg·min)). The system achieved enhanced energy efficiency, demonstrating significant potential for industrial-scale implementation. These findings establish a crucial theoretical and technical foundation for optimizing round-bale drying equipment to enhance uniformity and reduce energy consumption. Future investigations should prioritize structural modifications of the existing hybrid electric–solar drying system, particularly through the substitution of the upper air duct with modular needle-type air injection assemblies, to facilitate customized and efficient drying processes for agricultural bales of varying geometries and sizes.

Author Contributions

Conceptualization, J.D., Z.S. and Z.C.; methodology, J.D. and Z.C.; soft- ware, J.D. and Z.S.; validation, Z.S., Z.C. and J.D.; formal analysis, Z.S. and Z.C.; investigation, Z.S.; resources, Z.S.; data curation, J.D., Z.S. and Z.C.; writing—original draft preparation, J.D.; writing—review and editing, Z.S. and Z.C.; visualization, J.D.; supervision, Z.C.; project administration, Z.C.; funding acquisition, J.D. All authors have read and agreed to the published version of the manuscript.

Funding

This work was financially supported by the Natural Science Foundation of the Inner Mongolia Autonomous Region (2025LHMS05034).

Data Availability Statement

The original contributions presented in this study are included in the article. Further inquiries can be directed at the corresponding authors.

Conflicts of Interest

The authors declare no conflict of interest.

References

  1. Nguyen, M.H.; Nguyen, T.L. The Influence of Drying Mode on the Drying Time of Anchovy Fish in a Hybrid Infrared-Convective Dryer: Drying Time Correlation and Taguchi Analysis. Appl. Eng. Lett. 2023, 8, 167–174. [Google Scholar] [CrossRef]
  2. Li, M.; Geng, Z.; Zhang, X.; Yang, X.; Zhang, Q. Establishment and application of a simulation model for infrared radiation combined with hot air intermittent drying of jujube slices. LWT 2025, 215, 117280. [Google Scholar] [CrossRef]
  3. Chen, P.; Xiong, Z.; Xu, J.; Liu, M. Simulation and parameter optimization of high moisture rice drying on combine harvester before threshing. Comput. Electron. Agric. 2023, 215, 108451. [Google Scholar] [CrossRef]
  4. Cheng, W.; Bian, H.; Shi, H.; Xun, F. Experimental and numerical modelling of desiccation shrinkage process of kaolin clays. Sci. Rep. 2025, 15, 20905. [Google Scholar] [CrossRef]
  5. Zhang, X.; Wang, L.; Yi, K.; Chen, J. Characterization of temperature, moisture and stress distribution in corn drying process based on numerical simulation. J. Food Meas. Charact. 2025, 19, 6179–6191. [Google Scholar] [CrossRef]
  6. Yan, Y.; Wang, W.; Pan, Z.; Yang, Z.; Li, J.; Yao, Z.; Qi, Y. Drying characteristics and numerical simulation of tissue paper. Nord. Pulp Pap. Res. J. 2025, 40, 345–356. [Google Scholar] [CrossRef]
  7. Li, B.; Feng, S.; He, Q.; Zhu, Y.; Hu, Z.; Jiang, Y.; Su, L. Numerical simulation of rice drying process in a deep bed under an angular air duct. J. Food Process Eng. 2023, 46, e14438. [Google Scholar] [CrossRef]
  8. Akal, D.; Kahveci, K.; Akyol, U.; Cihan, A. Drying kinetics of cotton based yarn bobbins in a pressurized hot-air convective dryer. Proc. Inst. Mech. Eng. Part E J. Process Mech. Eng. 2017, 231, 294–308. [Google Scholar] [CrossRef]
  9. Park, S.; Kim, W. Improving drying performance of porous media by controlling surface pore size in convective drying. Int. J. Multiph. Flow 2025, 191, 105301. [Google Scholar] [CrossRef]
  10. Oliveira, D.P.D.; Coradi, P.C.; Leal, M.M.; Dolianitis, B.M.; Zabot, G.L.; Lopes, A.M. Drying and Storing Grains and Cereals: A Flow Approach in Porous Media and Applications. Food Rev. Int. 2025, 41, 1013–1049. [Google Scholar] [CrossRef]
  11. Ahmad, F.; Talbi, M.; Prat, M.; Tsotsas, E.; Kharaghani, A. Non-local equilibrium continuum modeling of partially saturated drying porous media: Comparison with pore network simulations. Chem. Eng. Sci. 2020, 228, 115957. [Google Scholar] [CrossRef]
  12. Meng, Z.; Cui, X.; Liu, Y.; Du, C.; Hu, R.; Wang, S.; Wang, F. Effect of electrohydrodynamics on hot air drying characteristics of fruits and vegetables. Sustain. Energy Technol. Assess. 2022, 53, 102716. [Google Scholar] [CrossRef]
  13. Zhang, W.P.; Yang, X.H.; Mujumdar, A.; Ju, H.Y.; Xiao, H.W. The influence mechanism and control strategy of relative humidity on hot air drying of fruits and vegetables: A review. Dry. Technol. 2022, 40, 2217–2234. [Google Scholar] [CrossRef]
  14. Feng, C.; Guo, H.; Xu, M.; Zhou, Y.; Lai, H.; Yan, Z.; Zhou, L.; Hu, J.; Li, J.; Xiong, Y. Effects of Hot Air Drying and Vacuum Drying on Thin-Layer Drying Kinetics and Quality Changes of Essential Oil of the Fruits of Evodia rutaecarpa (Juss.) Benth. J. Essent. Oil Bear. Plants 2022, 25, 910–923. [Google Scholar] [CrossRef]
  15. Chen, P.; Fan, M.; Zhu, W.; Liu, Y.; Jiang, M.; Wang, Y.; Wang, X. Numerical simulation of hot air drying of wheat grain piles based on CFD-DEM and experimental research. Dry. Technol. 2024, 42, 199–211. [Google Scholar] [CrossRef]
  16. Sun, D.; Hu, R.; Wang, P.; Yu, B. Integrated simulation method construction and process optimization for hot air drying of shiitake mushrooms. LWT 2024, 206, 116577. [Google Scholar] [CrossRef]
  17. Román, F.D.; Hensel, O. Numerical simulations and experimental measurements on the distribution of air and drying of round hay bales. Biosyst. Eng. 2014, 122, 1–15. [Google Scholar] [CrossRef]
  18. Du, J.; Liu, C. Experimental Study on Drying Characteristics of Alfalfa Hay Bales Using Hot Air Convection. Appl. Sci. 2025, 15, 3921. [Google Scholar] [CrossRef]
  19. Weller, S.; Florentine, S.; Sillitoe, J.; Grech, C.; McLaren, D.; Chauhan, B.S.; Li, M. Detecting the Seeds of Nassella neesiana in Large Round Hay Bales, by Means of Non-Destructive Core Sampling. PLoS ONE 2017, 10, e0137343. [Google Scholar] [CrossRef] [PubMed]
  20. Beck, A.P.; Beck, R.M.; Hubbell, D.; Hess, T.; Foote, A.P.; Gadberry, S.; Kegley, B.B. 234 Can We Use Moderate Quality Round Bale Bermudagrass Silage to Stretch Wheat pasture? J. Anim. Sci. 2023, 101, 160–161. [Google Scholar] [CrossRef]
  21. Janez, B. An Analysis of the Process of Drying Fresh Bales. Teh. Vjesn. 2019, 26, 1714–1719. [Google Scholar] [CrossRef]
  22. Gao, X.; Xuan, C.; Tang, Z.; Hong, B.; Ma, Y.; Qian, S. A dynamic drying process: Mathematical modeling and energy consumption optimization of alfalfa bales using hot air drying. Renew. Energy 2025, 246, 122961. [Google Scholar] [CrossRef]
  23. Dario, F. Mathematical Modelling of Rotary Drum Dryers for Alfalfa Drying Process Control. Inventions 2023, 8, 11. [Google Scholar] [CrossRef]
  24. Romano, G.; Nagle, M.; Müller, J. Two-parameter Lorentzian distribution for monitoring physical parameters of golden colored fruits during drying by application of laser light in the Vis/NIR spectrum. Innov. Food Sci. Emerg. Technol. 2016, 33, 498–505. [Google Scholar] [CrossRef]
  25. Lukas, E.; Ilon, J. A mass, momentum, and energy conservative dynamical low-rank scheme for the Vlasov equation. J. Comput. Phys. 2021, 443, 110495. [Google Scholar] [CrossRef]
  26. Hajiketabi, M.; Abbasbandy, S. A Fictitious Time Lie-Group Integrator for the Brinkman–Forchheimer Momentum Equation Modeling Flow of Fully Developed Forced Convection. Comput. Math. Math. Phys. 2022, 62, 1527–1538. [Google Scholar] [CrossRef]
  27. Kamruzzaman, M. Modified transport equation for the turbulent kinetic energy dissipation of the grid turbulence in the transition period of decay. J. Braz. Soc. Mech. Sci. Eng. 2021, 43, 78. [Google Scholar] [CrossRef]
  28. Juncu, G.; Nicola, A.; Popa, C.; Stroila, E. Preconditioned Conjugate Gradient and Multigrid Methods for Numerical Solution of Multicomponent Mass Transfer Equations I. Diffusion-Reaction Equations. Numer. Heat Transf. Part A Appl. 2014, 66, 1268–1296. [Google Scholar] [CrossRef]
  29. Serhat, S.T.; Erdoğan, K.; Hailu, A.F.; Karacabey, E. A novel drying system—Simultaneous use of ohmic heating with convectional air drying: System design and detailed examination using CFD. Innov. Food Sci. Emerg. Technol. 2021, 72, 102727. [Google Scholar] [CrossRef]
  30. Khan, I.H.; Batuwatta-Gamage, C.P.; Karim, M.A.; Gu, Y. Fundamental Understanding of Heat and Mass Transfer Processes for Physics-Informed Machine Learning-Based Drying Modelling. Energies 2022, 15, 9347. [Google Scholar] [CrossRef]
  31. Su, L.; Yang, X.; Wang, Q.; Qin, X.; Zhou, B.; Shan, Y. Functional Extremum Solution and Parameter Estimation for One-Dimensional Vertical Infiltration using the Brooks–Corey Model. Soil Sci. Soc. Am. J. 2018, 82, 1319–1332. [Google Scholar] [CrossRef]
  32. Wang, N.; Yu, J.; Tahmasebi, A.; Han, Y.; Lucas, J.; Wall, T.; Jiang, Y. Experimental Study on Microwave Pyrolysis of an Indonesian Low-Rank Coal. Energy Fuels 2013, 28, 254–263. [Google Scholar] [CrossRef]
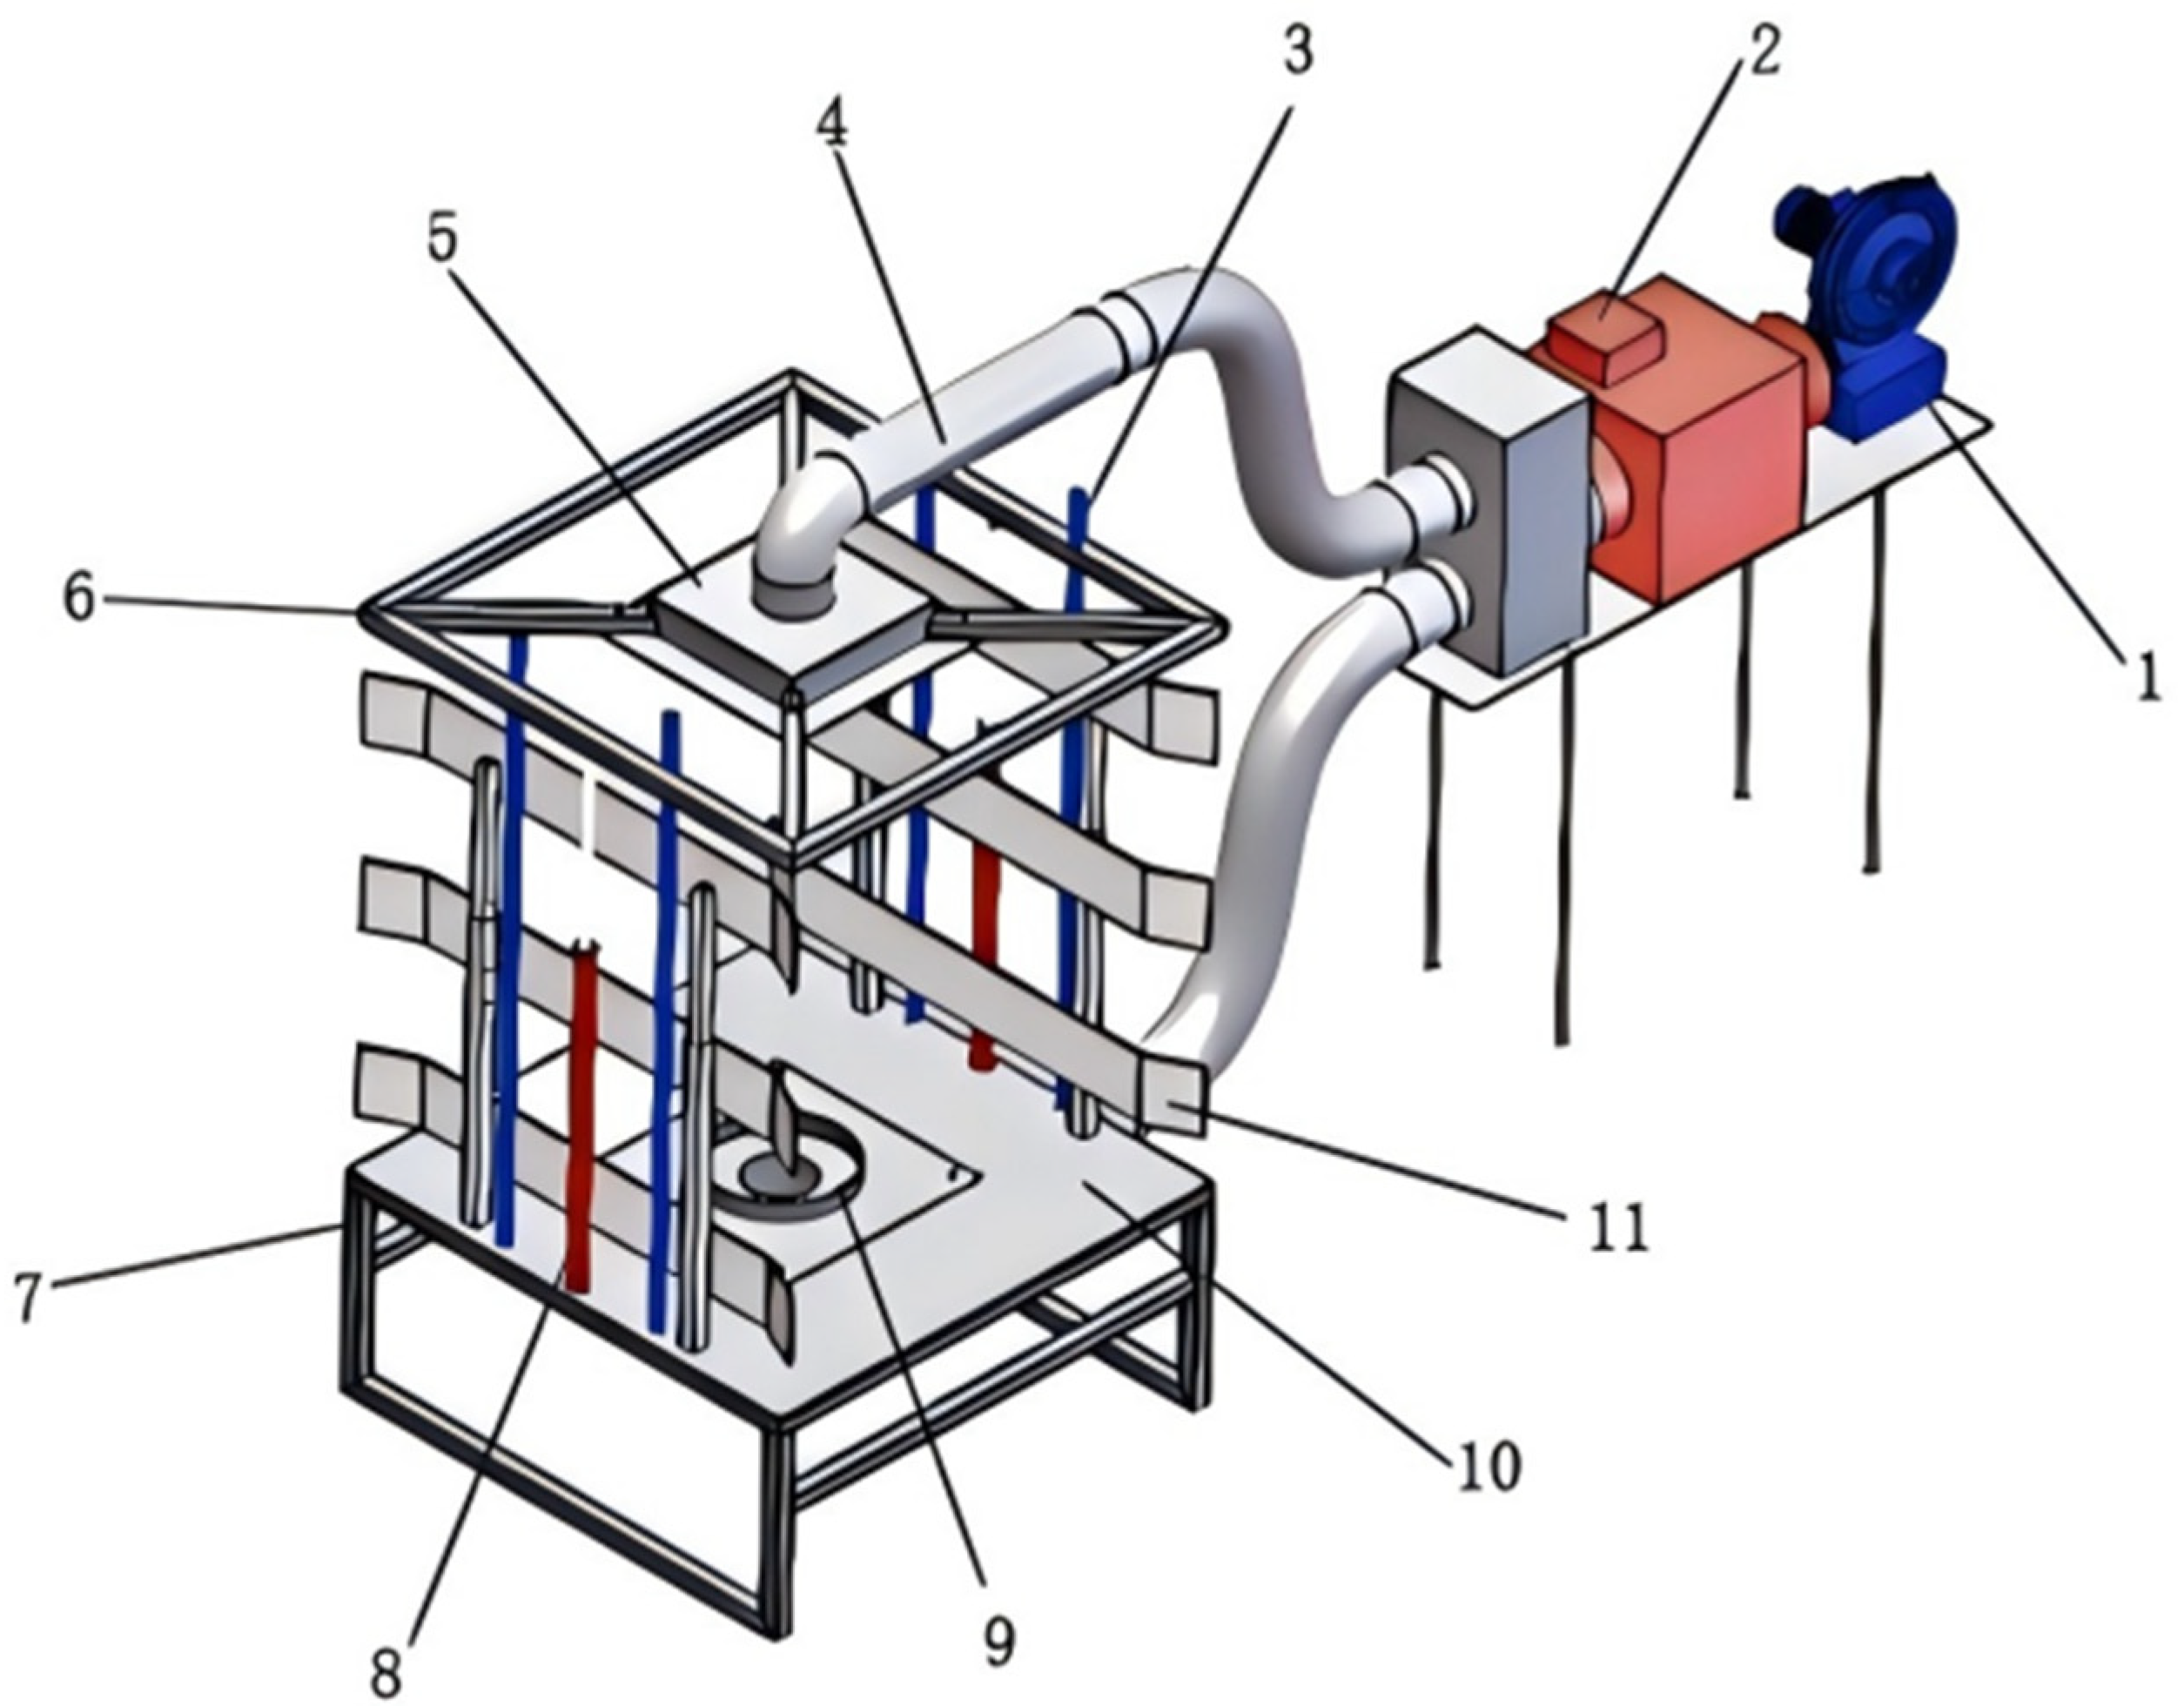
Figure 1. CGT-1 round-bale drying test bench (Note: 1. Centrifugal fan; 2. electric heater; 3. guide rail; 4. ventilation duct, 5. air duct cover, 6. upper base; 7. lower base; 8. electric push rod; 9. air duct opening; 10. lower base baffle; and 11. baffle).
Agriculture 15 02000 g001
Figure 2. Schematic diagram of bale drying.
Agriculture 15 02000 g002
Figure 3. Mesh division of round bale.
Agriculture 15 02000 g003
Figure 4. Cloud diagram of the air velocity distribution of different air duct opening diameters in the Y-Z section. (a) Diameter 400 mm; (b) diameter 500 mm; and (c) diameter 600 mm.
Agriculture 15 02000 g004
Figure 5. Location and number of circular bundle inspection points. (a) Position of inspection points on front surface of round bale; (b) round bale top view inspection point position.
Agriculture 15 02000 g005
Figure 6. Temperature distribution nephogram of Y-Z section with different hot wind speeds: (a) 2 m/s; (b) 3 m/s; (c) 4 m/s; and (d) 5 m/s.
Agriculture 15 02000 g006
Figure 7. Cloud map of temperature and humidity distribution of different hot air in the Y-Z section. (a) Hot air temperature of 50 °C; (b) Hot air temperature of 55 °C; (c) Hot air temperature of 60 °C; (d) Hot air temperature of 65 °C.
Agriculture 15 02000 g007aAgriculture 15 02000 g007b
Figure 8. Physical drawing of round straw bale.
Agriculture 15 02000 g008
Figure 9. Drying process diagram of round bales.
Agriculture 15 02000 g009
Figure 10. Drying characteristic curve of round bales at different hot air temperatures. (a) Drying rate curve at different hot air temperatures; (b) moisture ratio curve at different hot air temperatures.
Agriculture 15 02000 g010
Figure 11. Drying characteristic curve of round bales under different hot wind speeds. (a) Drying rate curve under different hot air velocities; (b) curve diagram of moisture ratio under different hot wind speeds.
Agriculture 15 02000 g011
Figure 12. Drying characteristic curves of round bales with different air duct opening diameters. (a) Drying rate curves for different duct opening diameters; (b) curve diagram of moisture ratio under different duct opening diameters.
Agriculture 15 02000 g012
Figure 13. Drying time analysis diagram. (a) Probability plot of normal distribution of residuals; (b) actual vs. forecasts; and (c) residual prediction plot.
Agriculture 15 02000 g013
Figure 14. Drying rate analysis diagram. (a) Probability plot of normal distribution of residuals; (b) actual vs. forecasts; and (c) residual prediction plot.
Agriculture 15 02000 g014
Figure 15. Response surface diagram of parameters to drying time of round bales under the hot-air drying process. (a) Interaction between hot-air temperature and hot-air velocity; (b) interaction between hot-air temperature and duct opening diameter; (c) interaction between hot wind velocity and duct opening diameter; (d) interaction between hot-air temperature and hot-air velocity; (e) interaction between hot-air temperature and duct opening diameter; and (f) interaction between hot wind velocity and duct opening diameter.
Agriculture 15 02000 g015
Table 1. Main operating parameters of round-bale drying test rig.
Serial NumberProjectUnitTechnical Index
1power conditioningV/Hz380/50
2heating powerkW75.5
3temperature range°C20–100
4diameter of air duct openingmm400–600
5wind speed adjustmentm/s1–6
6temperature sensor accuracy°C±0.5 °C
Table 2. Parameter setting of alfalfa porous medium.
ParameterNumerical Value
porosity/%39.22%
permeability / m 2 1 × 10 14
heat   conductivity   coefficient / W · m · K 1 0.571
density / k g · m 3 150
heat   capacity   at   constant   pressure / J · k g · K 1 840
Table 3. Single-factor test design table for wind speed field.
Experimental FactorsTest Index
Hot Blast Temperature (°C)Hot Wind
Speed (m/s)
Diameter of Air Duct Opening (mm)Coefficient of Wind Speed
Non-Uniformity
50340040.7%
50035.4%
60028.9%
Table 4. Wind speed values of each detection point with different air duct opening diameters.
Check PointScheme A (m/s)Scheme B (m/s)Scheme C (m/s)
1#1.51.31.7
2#1.92.12.3
3#1.41.31.6
4#0.50.80.9
5#0.70.90.9
6#0.60.50.7
7#1.41.21.6
8#2.02.22.4
9#1.31.51.6
Table 5. The uneven coefficient of wind speed of each layer in the Y-Z section.
Coefficient of Wind Speed Non-Uniformity in Each LayerScheme A (%)Scheme B (%)Scheme C (%)
First layer wind speed non-uniformity coefficient31.127.925.2
Second layer wind speed non-uniformity coefficient58.349.438.0
Third layer wind speed non-uniformity coefficient32.728.823.5
Table 6. Experimental design of the single-factor tests on temperature.
Experimental FactorsTest Index
Hot Blast Temperature (°C)Hot Wind Speed (m/s)Diameter of Air Duct Opening (mm)Coefficient of Temperature Heterogeneity
50260048.03%
326.33%
411.5%
55.77%
Table 7. Temperature uneven coefficients of each layer in Y-Z section.
Coefficient of Heterogeneity of Each LayerScheme A (%)Scheme B (%)Scheme C (%)Scheme D (%)
Coefficient of first-layer temperature non-uniformity27.718.05.62.1
Coefficient of temperature non-uniformity in the second layer80.141.120.711.5
Coefficient of third-layer temperature non-uniformity36.319.98.23.7
Table 8. Experimental design of the single-factor tests on humidity levels.
Experimental FactorsTest Index
Hot Blast Temperature (°C)Hot Wind
Speed
(m/s)
Diameter of Air Duct Opening (mm)Wet Velocity Non-uniformity
Coefficient
50260048.03%
326.33%
411.5%
55.77%
Table 9. Humidity inhomogeneity coefficients of each layer in the Y-Z section.
Coefficient of Heterogeneity for Each LayerScheme A (%)Scheme B (%)Scheme C (%)Scheme D (%)
Coefficient of humidity non-uniformity in the first layer13.911.39.93.9
Coefficient of moisture non-uniformity in the second layer25.228.113.75.2
Coefficient of moisture non-uniformity in the third layer20.619.614.64.6
Table 10. System SMER values under different hot air temperatures.
Hot Blast Temperature (%)Dehumidification Capacity (kg)Energy Consumption Value (kW·h)SMER Value (kg/kW·h)
5074.8440.801.83
5574.8445.001.66
6074.8456.001.34
6574.8471.001.05
Table 11. System SMER values at different hot air speeds.
Hot Wind Speed (m/s)Dehumidification Capacity (kg)Energy Consumption Value (kW·h)SMER Value (kg/kW·h)
274.8448.51.54
374.8444.01.70
474.8439.51.90
574.8433.52.23
Table 12. System SMER values under different air duct opening diameters.
Diameter of Air Duct Opening (mm)Dehumidification Capacity (kg)Energy Consumption Value (kW·h)SMER Value (kg/kW·h)
40074.8472.51.03
50074.8450.01.50
60074.8438.51.94
Table 13. Box–Behnken Design Experimental Results.
Test NumberFactor LevelEvaluation Indicators
Hot Wind SpeedHot Air TemperatureAir Duct Opening DiameterDrying Time (min)Drying Speed (m/s)
1−1−10144.770.585
21−10139.750.527
3−1101380.505
41101370.487
5−10−1140.780.559
610−1141.550.559
7−1011430.569
81011360.492
90−1−1141.50.555
1001−1139.10.521
110−11142.810.557
12011136.150.457
130001400.551
14000140.70.547
15000139.80.548
16000140.20.538
17000141.20.545
Table 14. Variance and significance test of the regression equation of drying time.
Source of MutationSquare SumDegree of FreedomMean SquareF Valuep Value
Model89.6240499.95822641.56746<0.0001 ***
X143.15205143.15205180.1245<0.0001 ***
X218.75781118.7578178.29854<0.0001 ***
X33.08761313.08761312.888260.0088 **
X1X24.040114.040116.864120.0045 **
X2X34.536914.536918.937850.0033 **
X1X315.09323115.0932363.00188<0.0001 ***
X120.93505910.9350593.9031080.088752 (ns)
X220.0034810.003480.0145270.907451 (ns)
X320.0014810.001480.0061790.939546 (ns)
Residual1.67697570.239568
Lack of Fit0.38897530.1296580.4026660.759591 (ns)
Pure Error1.28840.322
Sum91.3010116
Note: *** indicates extremely significant (p < 0.0001); ** indicates highly significant (0.0001 < p < 0.01); “ns” indicates no significant difference.
Table 15. Variance and significance test of drying rate regression equation.
Source of MutationSquare SumDegree of FreedomMean SquareF Valuep Value
Model0.01764290.00196111.9643<0.0001 ***
X10.00806510.008065460.6406<0.0001 ***
X20.00292610.002926167.1389<0.0001 ***
X30.0017710.00177101.1087<0.0001 ***
X1X20.000410.000422.847820.0020 **
X2X30.00108910.00108962.20318<0.0001 ***
X1X30.00148210.00148284.66544<0.0001 ***
X120.00186110.001861106.31470.566938 (ns)
X226.32 × 10−616.32 × 10−60.360905<0.0001 ***
X322.18 × 10−512.18 × 10−51.2447550.0030 **
Residual0.00012371.75 × 10−5
Lack of Fit2.78 × 10−539.25 × 10−60.3902950.767219 (ns)
Pure Error9.48 × 10−542.37 × 10⁻⁵
sum0.01776416
Note: *** Very significant (p < 0.0001); ** highly significant (0.0001 ≤ p < 0.01); “ns” indicates no significant difference.
Table 16. Optimal process parameters and verification.
Hot Blast Temperature (°C)Hot Wind Speed (m/s)Diameter of Air Duct Opening (mm)Drying Time (min)Dry Rate (kg/kg·min)
Optimize parameters605600119.30.62
Test verification6056001220.61
Disclaimer/Publisher’s Note: The statements, opinions and data contained in all publications are solely those of the individual author(s) and contributor(s) and not of MDPI and/or the editor(s). MDPI and/or the editor(s) disclaim responsibility for any injury to people or property resulting from any ideas, methods, instructions or products referred to in the content.