Abstract
Due to the complexity of impurity removal from the residual film, there is currently no better impurity removal equipment. To improve the screening performance of the residual film mixture, the vibrating screen was designed. In this paper, the key factors A, B, C, and D were identified through mechanical analysis of the mixture (where they represented the screen aperture diameter, vibration amplitude, vibration frequency, and screen mesh inclination angle, respectively). The soil screen rate (Y1) and screening loss rate (Y2) were evaluated. And the optimal ranges for these factors were determined by single-factor experiments. Based on the EDEM, the discrete element model was established to simulate the interaction between residual film and soil. And the motion characteristics of the residual film mixture were analyzed within the screen body through a combination of simulation and bench tests. The vibrating screen’s structural parameters were optimized using Box-Behnken experiments. The most suitable combination of settings was as shown below: A = 6.5 mm, B = 25 mm, C = 3.8 Hz, and D = 4°. Following the optimization of these parameters, the screening performance was optimized. Results of bench tests showed that the soil screening rate was 80.33% and the screening loss rate was 19.31%. This study was expected to offer theoretical and simulation-based methods for optimizing the parameters of residual film-soil vibrating screening devices.
1. Introduction
Notwithstanding the considerable economic advantages engendered by the plastic film mulching technology, this approach has harmful ecological consequences [1,2,3,4,5]. To reduce residual film pollution, many institutes in China have developed recovery machines to collect and package the residual film left on farmland, such as universities, research institutes, and companies. Residual film recycling machines have been widely researched. However, according to the field survey, it was found that the collected film was often either piled up on farmland or incinerated, which brought great pollution [6,7,8]. Currently, there are few economically viable residual film-soil separation devices on the market. The residual film collected by machines contains a substantial amount of soil. A large amount of labor is needed to separate the residual film from the soil. However, this method is economically unfeasible, leading to most residual film being discarded or incinerated [9]. Therefore, it is urgent to develop an efficient residual film-soil separation device to process collected film and reduce pollution.
At present, research on residual film-soil separation technology focuses on two main aspects: the collection of residual film using recovery machines and the recycling of residual film resources. To reduce the soil content in the residual film, Fang et al. [10] established a discrete element simulation model of plastic film residue and soil. The movement of plastic film residue and soil materials was analyzed, and the parameters of the film recovery devices were optimized. Achieved a residual film impurity separation rate of 96.6%. Cao et al. [11] analyzed the motion trajectory of the hook teeth and calculated the movement principle of residual film collection and transportation. Through optimizing the parameters of the hook teeth and chain rake, the residual film pickup rate and residual film soil content were achieved at 88.27% and 9.96%, respectively. Due to high impurity content in the residual film during operation, material transport is often interrupted. Gao et al. [12] designed a soil removal mechanism and conveyor for a tooth-type recovery machine. Through response surface analysis, they identified the key factors influencing the soil content of residual film. They also explored further optimizations for the recovery machine, such as installing vibration chains and fans. And the residual film recovery rate of 90.15% and a soil content of 5.86% were achieved. Although the studies above optimized residual film recovery machines to separate some soil, the collected residual film still contained significant soil [13,14]. To achieve efficient residual film-soil separation, related researchers have explored plenty of methods to optimize the relevant technologies and equipment, such as water washing [15,16], electrostatic separation [17,18], air classification [19,20], and vibrating screen separation [21,22]. Yang et al. [23] designed a fan-shaped combination screen to separate residual film from peanut straw based on their suspension characteristics. And they obtained the effect rules of structural parameters on peanut straw removal and screening loss rates, achieving an experimental removal rate of 91.24% and a loss rate of 8.51%. Gu et al. [24] studied the material properties of peanut straw and optimized the fan-shaped screen for separating residual film and peanut straw, reaching a residual film removal rate of 92.71% with a loss rate of 8.19%. However, due to significant differences in residual film and soil materials, they are not suitable for separating film and soil. In terms of film impurity separation technology, Xie et al. [25] designed a drum air classifier for separating residual film and impurities with an airflow field during movement inside the drum. By optimizing parameters, the residual film impurity rate and fragmented film content rate were reduced to 8.96% and 1.52%, respectively. Zhou et al. [26] optimized the separation equipment to reduce impurity content by analyzing the internal structure of the roller and the movement characteristics of the residual film. The results were as follows: the soil removal rate was 92.48%, and the film leakage rate was 1.90%. Peng et al. [27,28] addressed fluctuations in the movement of residual film within the drum by optimizing the position and size of the screen openings, getting a film impurity rate of 10.60% and an impurity film content rate of 0.133%. Although drum-type screening devices were cost-effective, residual film often tangled with impurities, and prolonged operation can cause clogging of the screen mesh, significantly affecting screening quality [29]. He et al. [30] introduced a method for separating water using the buoyancy difference between the residual film and impurities. Residual film may be carried away with the water, causing secondary environmental pollution. Xie et al. [31] designed a counter-current hook-pull device, optimizing it through experiments. And they reduced high energy consumption and water usage in existing water-washing residual film and impurity separation devices. The results showed a residual membrane separation rate of 88.72% and a residual membrane cleanliness of 92.35%. Zhang et al. [32] leveraged the disparity in suspension characteristics between residual film and cotton. They proposed an airflow separation method and substantiated its theoretical underpinnings through validation. Guo et al. [33,34] designed an electrostatic separation device and studied the effect of device parameters on separation efficiency. The residual film separation rate reached 91.7%. However, in dusty environments, the electrostatic method failed to effectively separate residual film [35]. Zhang et al. [36] studied the motion of flake-shaped plastics on a vibration table and verified the theory of plastic vibration screening. Numerous studies on vibration-based screening methods, such as rice harvesting and sowing, have also been conducted [37,38,39]. In summary, despite many studies having been conducted on residual film separation, there are few efficient and reliable separation devices currently available because of the complex properties of residual film material.
Few studies have applied the vibration method to residual film-soil separation. The research goal is to utilize vibratory screening for separating residual film from soil. To achieve residual film-soil separation, a vibration screening method was proposed based on the material properties of residual film and soil. In this study, the vibration screening model was constructed with EDEM for residual film and soil separation. The vibratory separation mechanism of mixtures was investigated by analyzing the motion patterns of the screen body and the residual film-soil mixture. And the bench test was conducted to verify the simulation results. This study was expected to improve the vibration screening performance of residual films and soil materials and promote the comprehensive utilization of residual film resources.
2. Materials and Methods
2.1. Structure of the Vibrating Screen
To separate the residual film and soil, the vibrating screen was designed, as shown in Figure 1. It mainly consists of a frame, motor, crank, connecting rod, suspension rod, belt drive system, and screen body. During operation, the motor drives the vibrating screen to move through the crank. The crank connects to the screen body through the connecting rod, and the screen body is suspended from the frame by the suspension rod. The rotational motion of the crank is converted into the reciprocating linear motion of the screen body through the connecting rods. The residual film-soil mixture is thrown upward while moving forward within the screen body. Soil particles move across the screen mesh and flow downward to the lower discharge port, while the residual film on the screen mesh exits through the upper discharge port.

Figure 1.
Vibrating screen structure. 1. Frame, 2. Suspension rod (adjustable), 3. Screen discharge plate, 4. Motor, 5. Belt drive system, 6. Drive shaft, 7. Crank, 8. Connecting rod (adjustable), 9. Front material guard plate of the screen body, 10. Screen mesh, 11. Side material guard plates, 12. Upper discharge port, and 13. Lower discharge port.
To address material buildup and blockages, preliminary experiments were conducted using various screen types (Figure 2). The results revealed that square-hole and diamond-shaped screens frequently experienced film jamming due to their right-angled apertures, leading to material buildup (Figure 2a,b). When perforated screens with oval holes were used, the elongated apertures often caused residual film to become lodged within the holes, resulting in screen clogging (Figure 2c). Circular perforated screens demonstrated optimal performance during screening (Figure 2d). Through comparison, it was confirmed that perforated screens with round holes were most suitable for separating residual film from soil. The overall size is 1500 mm × 500 mm, the mesh thickness is 0.5 mm, and the material is 201 stainless steel. The screen body consists of the mesh, front, and side material guard plates, upper discharge port, and lower discharge port. Based on the structure and parameters of the screen body, a model was established using SolidWorks 2020 and then exported in STL format for storage.

Figure 2.
Different types of screen mesh. (a) Mesh screens with diamond-shaped holes, (b) Perforated screens with square holes, (c) Perforated screens with oval holes, and (d) Perforated screens with round holes.
2.2. Analysis of the Movement of the Screen Body and Materials
When a mixture of residual film and soil was fed on the screen body, the movement mechanism of the screen body was as illustrated in Figure 3. The residual film and soil interact with the screen mesh, and soil particles fall through the openings. Studying the relative motion between the sieve body and the residual film-soil mixture is key to achieving effective separation. Figure 4 illustrates the force analysis of materials on the screen. It showed the movement trajectory of the material on the screen body.
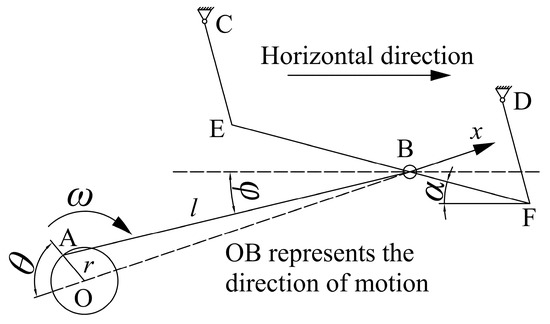
Figure 3.
The movement mechanism of the screen body. (CE and DF are suspension rods; EF is the screen surface; OA is the crank; AB is the connecting rod; α is the angle between the screen surface and the horizontal direction.)
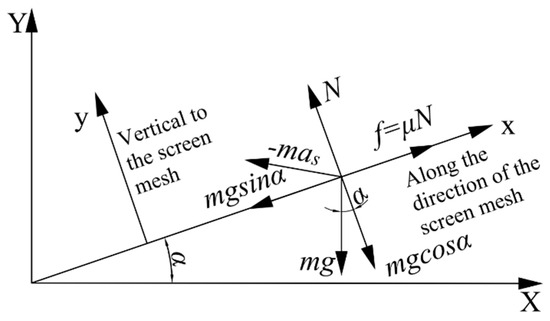
Figure 4.
The force analysis of materials on the screen.
The movement of material within the screen body is categorized into forward, backward, and upward motion, which was at a certain angle relative to the screen mesh. The motion analysis is to identify key structural factors affecting screening performance. Therefore, the influence of air is not considered this time. The movement analysis process is outlined below:
(1) The following can be derived from the screen body motion schematic diagram:
When , and :
Due to the small r/l ratio:
The derivative with respect to displacement yields the following:
The acceleration equation for the screen body was obtained as follows:
where: is the crank radius (m); is the connecting rod length (m); is the screen mesh inclination angle (°); is the crank rotational angular velocity (rad·s−1); is the crank rotational angle (rad); is the angle between the connecting rod and the horizontal line (rad); is the displacement of the screen body (m), with the equilibrium position as the origin; is the velocity of the screen body (m·s−1); is the acceleration of the screen body (m·s−2).
(2) A conclusion can be drawn from the force analysis on the material of the screen mesh. Material inertial force was as follows:
Table 1 shows the sliding direction of the material inside the screen body when the screen angle is α.

Table 1.
Force analysis of materials inside the screen body.
The component projected onto the screen mesh was as follows:
The critical conditions for materials to move forward and backward along the screen mesh were as follows:
Forward sliding:
Reverse sliding:
The material’s acceleration along the screen mesh was as follows:
Since the screen mesh has no vertical motion:
Substituting N, it was obtained:
The instantaneous acceleration equation for the material was obtained as follows:
Then, the displacement equation of the material relative to the screen mesh was as follows:
where: is the mass of material particle (kg); is the coefficient of frictional resistance; is the gravitational acceleration (m·s−2); is the frictional force (N); is the projection component of the screen acceleration onto the screen mesh. (m·s−2); a is the accelerative component of the material relative to the ground projected onto the screen mesh. (m·s−2); is the velocity of the material parallel to the screen mesh (m·s−1); is the displacement of the material on the mesh of the screen (m); is a symbolic function used to determine the force of friction.
Motion analysis indicated that the movement of residual film and soil depends on two aspects. For statistics, the gravitational force on the screen mesh was balanced by the friction. For dynamics, the periodic acceleration of the screen body drove the relative motion of the material. Motion analysis identified the crank radius , crank angular velocity , and screen mesh inclination angle as key factors influencing screening performance. The vibration amplitude was adjusted by the crank radius primarily, and the vibration frequency was adjusted by the crank angular velocity. Therefore, the vibration amplitude and frequency were set directly when the simulation test was conducted in EDEM.
2.3. Establishment of a Residual Film-Soil Simulation Model
The mixture of residual film-soil was collected by the 4JMLQ210 residual film recovery machine, as illustrated in Figure 5. Because soil moisture content is low at this stage, adhesion between the soil and film is negligible. Simulation experiments were conducted to analyze the motion of the mixture within the screening, which was to determine the key factors affecting separation. Due to experimental constraints, the entanglement of residual films was not considered. Since the residual film is extremely thin, it needs a large number of particles modeled according to its actual thickness, which would significantly increase the calculation time. To reduce computational load and improve efficiency, the diameter of the residual film particles was increased by a factor of 4 using geometric similarity, and the density was adjusted to 1·k−3 of the original value. According to these methods, while maintaining consistent quality, the error in particle kinetic behavior caused by changes in moment of inertia can be controlled within a reasonable range [40]. The simulation model was validated using a residual film area of 85 cm2. The results verified dynamic behavior (Table 2). Suspension velocity is a critical parameter for materials during screening and conveying. The primary purpose of measuring the suspension velocity of residual film is to verify that particle movement remains stable without significant deviation after diameter enlargement. The calculation formula is given by (18) and (19), and the measurement test is illustrated in Figure 6. The suspension velocity error was 5%, meeting the physical similarity requirements for the screening process [41,42,43]. The spherical particles were used for filling in EDEM, and the final simulation model is illustrated in Figure 7. The particle diameter of the soil model is 0.8 mm, while the adjusted residual film particle diameter is 0.0256 mm.
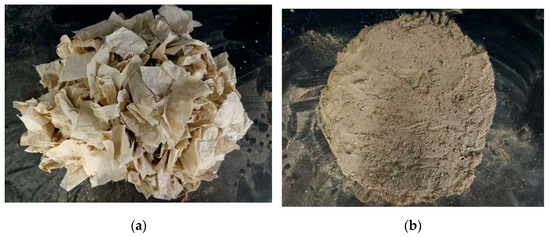
Figure 5.
Residual film and soil. (a) Residual film; (b) Soil.

Table 2.
Error analysis of suspension velocity and collision recovery coefficient.
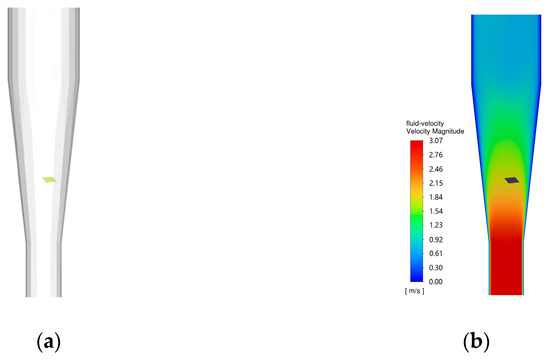
Figure 6.
DEM-CFD simulation experiment measurement of residual film model suspension velocity. (a) Residual film suspension position; (b) Velocity nephogram of flow field.
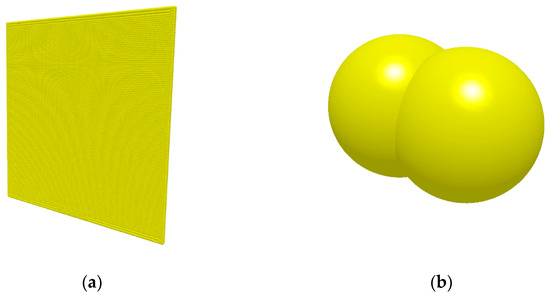
Figure 7.
Residual film-soil simulation model. (a) Residual film model; (b) Soil discrete model.
Suspension Velocity Measurement Formula:
where, is the air resistance coefficient; is the residual film area (m2); is the residual film suspension velocity (m·s−1); is the air density (kg·m−3); is the residual film density (kg·m−3); is the residual film volume (m3); is the Gravity acceleration, taken as 9.81 (m·s−2).
Equations (20) to (26) were the formulas for the equivalent mass and moment of inertia of the residual film after the diameter of the filling particles increased.
where, is the initial mass of the material particles (kg); is the initial diameter of the particles. (mm); is the initial density of the particle (kg·m−3); is the initial rotational inertia of the particle (kg·m−2); is the material particle quality after enlargement (kg); is the diameter of the particle after enlargement (mm); is the density of the particle after enlargement (kg·m−3); is the rotational inertia of the particle after enlargement (kg·m−2); is the enlargement factor.
2.4. Determination of Basic Parameters for EDEM Simulation
(1) Poisson’s ratio describes the ratio of lateral to longitudinal deformation in a material under uniaxial stress. A DN-5KN electronic universal material testing machine was used for the stretching tests. The residual film was cut into rectangular pieces. The size was 100 mm × 200 mm, and the average value was calculated through five repeated tests. In this experiment, Poisson’s ratio was calculated using Equation (27), and the value was 0.39 for the residual film. The results were presented in Table 3.
where is the lateral deformation (mm); is the longitudinal deformation (mm).

Table 3.
Calculation of the average residual film Poisson’s ratio.
(2) Figure 8 shows the tensile test of the residual film. The force applied to the residual film and its deformation were recorded during testing. The shear modulus can be calculated using Equations (28) to (30), and the value was 8.9 × 10⁶ Pa.
where is the shear modulus (MPa); is the Young’s modulus (MPa); is the Poisson’s ratio; is the tensile stress (MPa); is the maximum load by the material (N); is the initial area of the cross section of the material (mm2).
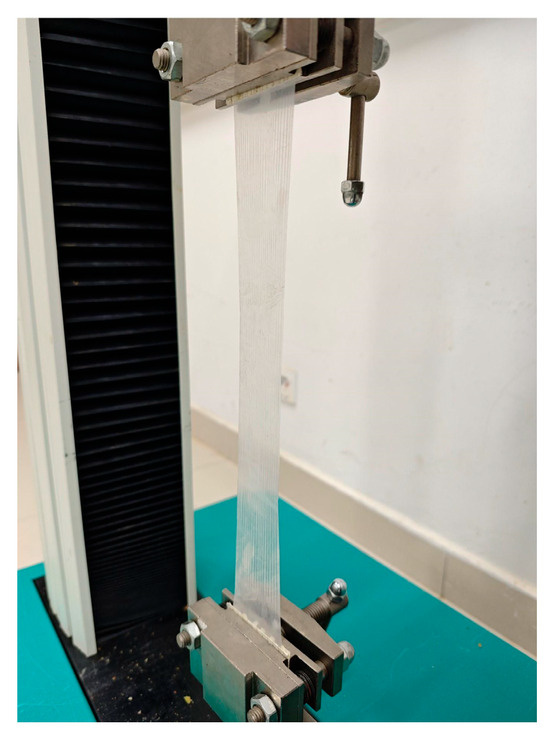
Figure 8.
Residual film tensile test.
(3) As illustrated in Figure 9, the static friction coefficient was calculated via the tilted plane test among the residual film, soil, and stainless steel. The calculated values were 0.42 and 0.45, respectively. The static angle of the material was measured using both simulation and physical experiments (Figure 10). The error was 2.82%, indicating that the simulated material accurately represented the actual material state.
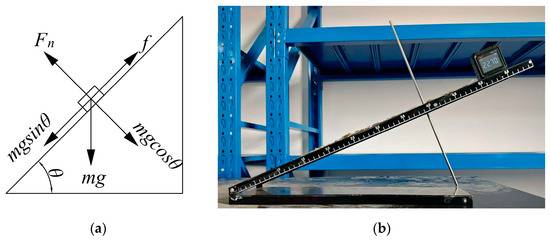
Figure 9.
Determination of static friction coefficient using the tilted plane test. (a) Tilted plane test for the static friction coefficient; (b) Experiment for determining the static friction coefficient.
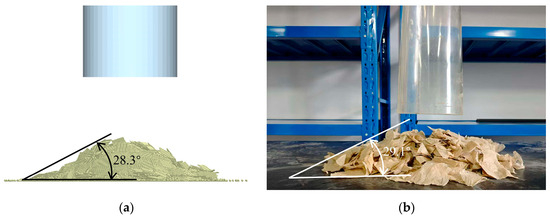
Figure 10.
Film-soil material accumulation angle test. (a) Simulation test to calculate the static angle of materials; (b) Physical test to determine the static angle of materials.
2.5. Construction of the Vibrating Screen Model
The three-dimensional models (STL format) of the screen body and residual film-soil material were imported into EDEM. And the material properties and contact parameters accordingly were set. The relevant parameters were derived from existing literature and experimental studies [44]. The material property parameters were listed in Table 4, and the contact parameters were listed in Table 5.

Table 4.
Material properties parameters.

Table 5.
Material contact parameters.
A particle factory was established 150 mm above the screen mesh with dimensions of 300 mm × 400 mm. Based on experimental statistics, it was determined that the mass ratio of residual film and soil in the mixture was 3:5. This ratio was used for the generation of particles, ensuring that the particle formation time did not exceed 1 s and the total mass was 1.5 kg. In the EDEM 2022 software simulation, there is a lack of adhesive force between residual membrane particles and soil particles; the Hertz–Mindlin contact model is applied between particles and between particles and components. The initial velocity of the material particles along the Z-axis was set to −0.1 m·s−1. Residual film and soil aggregate boxes were also established to evaluate the screening performance under varying parameters, as shown in Figure 11.
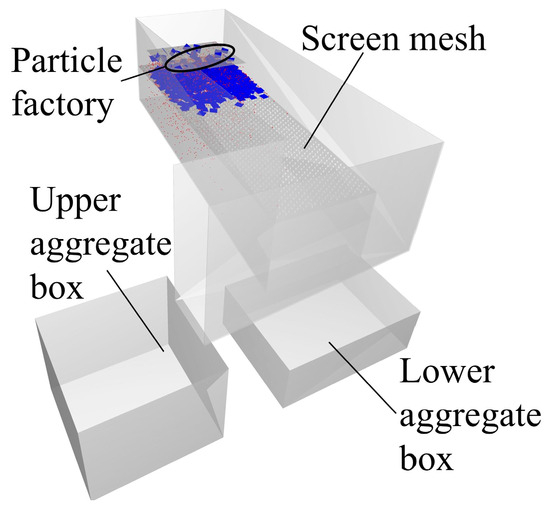
Figure 11.
Simulation model of film-soil material screening.
2.6. Vibration Screening Test Design
2.6.1. Single Factor Experiments
To further investigate the effect of vibrating screen structural parameters on the separation performance, soil screen passing rate (Y1) and screening loss rate (Y2) were chosen as evaluation indicators. Five factors—screen aperture diameter (A), vibration amplitude (B), vibration frequency (C), screen mesh inclination angle (D), and residual film area (E) were selected to design single-factor experiments. Statistical analysis indicated that the diameter distribution of soil particles ranges from 1 to 2 mm (particles smaller than 1 mm are excluded). According to the national standard [45], the screen mesh aperture must be greater than 3 mm. Industry standard [46] specifies that the vibration amplitude should not exceed 35 mm when screening sheet-like plastics. Preliminary tests revealed that when the vibration frequency (B) was below 3 Hz, material accumulation occurred, and when the vibration frequency was above 8 Hz, material was ejected from the screen mesh. Hence, the vibration frequency was set between 3 and 8 Hz. National standard [47] recommends that the inclination angle of the vibrating screen for screening sheet-like plastics is between 2° and 7°. Literature [48] indicated that the optimal screening performance occurred when the residual film area (E) was less than 90 cm2. Therefore, the parameter ranges for the above five factors were: A = 3 to 13 mm, B = 15 to 35 mm, C = 3 to 8 Hz, D = 2 to 7°, E = 10 to 85 cm2. Single-factor experiments were conducted to determine the optimal parameter intervals.
where is the total mass of soil before screening (kg); is the total mass of soil in the lower aggregate box after screening (kg); is the total mass of material of residual film and soil before screening (kg); is the mass of material of residual film and soil ejected from the screen body during screening (kg); is the mass of material of residual film and soil that has not been completely screened out in the screen body; includes the mass of soil entering the screen upper aggregate box and the mass of residual film entering the screen lower aggregate box (kg).
2.6.2. Numerical Simulation Test
The structural parameters of vibrating screens used in grain screening can be found in agricultural machinery manuals. However, no specific parameters are selected for screening residual film and soil. To determine the optimal parameters for separating residual film and soil, numerical simulations were conducted with EDEM software using the specified values. In EDEM, a Sinusoidal Translation Kinematic was added to the screen body. And the vibration frequency and amplitude were adjusted by configuring the values for Frequency and Displacement Magnitude. The fixed time step was set as 3.29 × 10⁻⁶, and the cell size was 2.5 R min. The simulation time was set to 20 s, and the data recording interval was 0.1 s.
After the simulation experiment, the results were analyzed using the Analyst module. The analysis showed that the vibrating screen’s motion caused the material to move forward and backward on the screen mesh, with forward movement exceeding backward movement. The vibrating screen carried materials forward overall. As the residual film-soil material moves, soil particles are separated through the screen holes. Figure 12 illustrates the screening process of residual film-soil material. To analyze screening performance under various parameter combinations, a Grid Bin Group was created in the Selection module (Figure 13). The area inside ③, and outside ① and ② borders, counts the material detached from the vibrating screen; the area within ② counts the separated material, and the area within ① counts the material remaining on the screen.

Figure 12.
Diagram of residual film-soil material screening process. (a) Material generation; (b) Material transport; (c) Material separation.
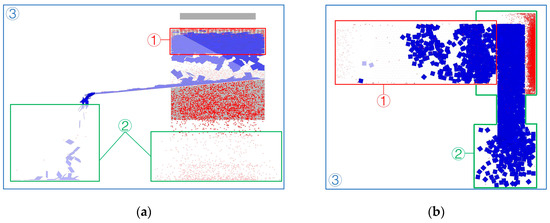
Figure 13.
Statistical region division diagram. (a) Simulation test left view; (b) Simulation test top view.
3. Results
3.1. Effect of Single Factors on Residual Film-Soil Separation
3.1.1. Screen Aperture Diameter
When the residual film area was 25 cm2, the screen mesh inclination was 4°, the vibration frequency was 4 Hz, and the vibration amplitude was 25 mm, the effect of the screen mesh aperture on the separation performance of residual film and soil was illustrated in Figure 14a. As the screen mesh aperture increased and the soil screening rate initially increased, then decreased, while the screening loss rate first decreased and then increased. It was because as the screen mesh aperture increases, residual film particles collided within the screen body. It made it easier for the soil particles to fall into the screen apertures, thus increasing the soil screening rate. However, as the aperture diameter continues to increase, the mesh density decreases, which reduces the soil screening rate. Additionally, larger apertures reduced the physical contact between residual film and the screen mesh, facilitating smoother material movement toward the discharge port, which decreased the screening loss rate. Based on these observations, the optimal screen mesh aperture range for further experimentation was determined to be between 5 mm and 9 mm.
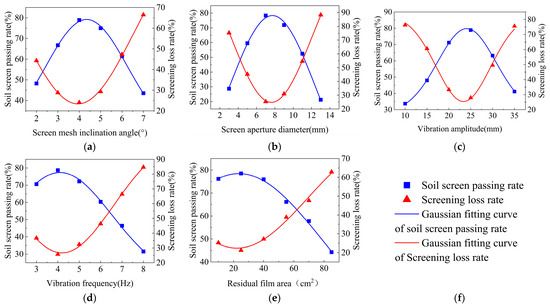
Figure 14.
Analysis of changes in screening performance in single-factor experiments. (a) Single-factor test of screen mesh inclination angle; (b) Single-factor test of screen aperture diameter; (c) Single-factor test of vibration amplitude; (d) Single-factor test of vibration frequency; (e) Single-factor test of residual film area; (f) Legend.
3.1.2. Vibration Amplitude
Under constant structural parameters, the effect of vibration amplitude on the separation performance was illustrated in Figure 14b. As the vibration amplitude increased, the screening rate initially increased, then decreased, while the screening loss rate followed a similar trend, first decreasing and then increasing. Analysis showed that with smaller vibration amplitudes, the residual film and soil particles moved more slowly. It led to material accumulation and a lower screening efficiency, causing a higher loss rate. As the vibration amplitude increased, the collision frequency of the particles increased. This made the material form more distinct layers, which improved the screening efficiency and reduced the loss rate. However, when the vibration amplitude became too large, the material moved toward the discharge port more quickly, with greater vertical displacement. This led to a reduction in the frequency of collisions between soil particles, which, in turn, decreased the screening efficiency. Furthermore, a portion of the material of residual film and soil was ejected from the screen body, thus increasing the loss rate. Based on this analysis, a vibration amplitude range of 20 mm to 30 mm was selected for subsequent experiments.
3.1.3. Vibration Frequency
Under constant structural parameters, the effect of vibration frequency on residual film and soil screening performance was illustrated in Figure 14c. As the vibration frequency increased, the soil screening efficiency initially increased, then decreased, while the screening loss rate followed a similar trend, first decreasing and then increasing. Analysis indicated that with increased vibration frequency, the collision frequency between the residue film, soil particles, and the screen body also increased. This led to a higher probability of soil particles falling into the screen apertures, thus improving the screening efficiency. At the same time, the increase in vibration frequency accelerated the movement of the material, shortening its residence time on the screen mesh and thereby reducing the screening loss rate. However, when the vibration frequency became too high, the passage of soil particles through the screen significantly decreased, causing the screening loss rate to increase. Based on these findings, a vibration frequency range of 3 to 5 Hz was selected for subsequent experiments.
3.1.4. Screen Mesh Inclination Angle
Under constant structural parameters, the effect of screen mesh inclination angle on residual film and soil screening performance was illustrated in Figure 14d. As the screen mesh inclination angle increased, the soil screen passing rate initially rose and then fell, while the screening loss rate followed the opposite trend, first decreasing and then increasing. As the screen inclination angle increases, the soil screen passing rate first increases and then decreases, while the screening loss first decreases and then increases. Analysis showed that as the screen inclination angle gradually increased, the vertical force acting on the material of residual film and soil decreased, and the resistance experienced by the material also decreased. Under the action of the vibrating screen, the material was more easily stratified, resulting in better screening performance. When the screen mesh inclination angle reached the critical value and continued to increase, the velocity of the material along the screen mesh also increased, reducing the frequency of collisions within the screen body. As a result, the screening performance gradually decreased. Based on these findings, a screen mesh inclination angle range of 3 to 5° was selected for the subsequent experiments.
3.1.5. Residual Film Area
Under constant structural parameters, the effect of residual film area on residual film and soil screening performance was illustrated in Figure 14e. As the residual film area increased, the soil screen passing rate initially increased and then decreased, while the screening loss first rose and then fell. Analysis showed that the residual film, as a sheet-like material, had a large contact area with the screen mesh, causing some screen openings to become blocked. This reduced the number of screen openings available for soil, and as the residual film area increased, the blocking effect intensified, further obstructing soil passage and decreasing soil screen passing rate. As the residual film area increased, material resistance also increased, further reducing the material’s flowability on the screen mesh. This hindered material from moving smoothly to the end of the screen, leading to an increased loss rate. Through testing, it was found that the screening performance was best when the residual film area was around 25 cm2. However, in actual work, the residual film area is irregular and can only be controlled within a specific range. Therefore, in subsequent simulations, the residual film area was uniformly set to 25 cm2 to achieve the best screening effect.
In single-factor experiments and subsequent simulation experiments, the residual film area is uniformly set to a specific value for the following purposes: (1) To determine the ideal residual film area value through experimentation and to validate the feasibility of the vibration method for separating residual film and obtain the optimal soil screening rate (Y1) and screening loss rate (Y2); (2) To provide a reference for practical applications, ensuring residual film area is controlled within an optimal range when using mechanical equipment for film fragmentation.
Based on the analysis of single-factor experiment results and considering the practical application of vibrating screens in production, a four-factor, three-level combination experiment was conducted using Design-Expert 13. Table 6 lists the optimal value ranges for each factor.

Table 6.
Values of different factors in the Box–Behnken experiment.
3.2. Analysis of Response Surface Experiment Results
3.2.1. Box–Behnken Test and Results Analysis
Depending on the selected factor levels, extensive time calculations are required to conduct a comprehensive experiment. To simplify the process, the Box-Behnken experimental design method was used to design the experiment, as listed in Table 7, which reflected the effects of different factors on the screening performance. According to the simulation experiments, the following ranges for performance metrics were obtained: the soil screen passing rate was from 26.58% to 72.12%, while the screening loss rate ranged from 18.88% to 80.42%.

Table 7.
Box–Behnken test and results.
3.2.2. Regression Model and Significance Analysis
Based on the experimental results, an analysis of variance (ANOVA) was conducted. After excluding non-significant items, the regression models for soil screen passing rate (Y1) and screening loss rate (Y2) were obtained as Equations (33) and (34), respectively. The results of the ANOVA were presented in Table 8 and Table 9.

Table 8.
Variance analysis of soil screen passing rate.

Table 9.
Variance analysis of screening loss rate.
The analysis revealed that the P-value of the quadratic regression model was smaller than 0.0001 for soil screen passing rate and screening loss rate, demonstrating that the model was highly significant. The model error term with a p-value > 0.005 indicated that the experimental error was minimal. The fitted quadratic regression equation accurately represented the relationship between the soil screen passing rate, screening loss rate, and factors such as screening mesh inclination angle (A), vibration frequency (B), screen mesh size (C), and vibration amplitude (D). The established regression model can effectively predict a range of experimental outcomes. Vibration frequency, vibration amplitude, and screen mesh inclination angle have an extremely significant impact on soil screen passing rate. The order of influence of these factors on soil screen passing rate was as follows: vibration frequency, vibration amplitude, screen inclination angle, and screen mesh size. The screening loss rate was also significantly affected by vibration frequency, vibration amplitude, and screen mesh inclination angle. The order of influence of these factors on screening loss rate was as follows: vibration frequency, vibration amplitude, screen mesh inclination angle, and screen aperture diameter.
3.2.3. Parameter Interaction Effects
Based on the analysis above, response surface plots were generated to visually demonstrate the interactive effects of various factors on the evaluation criteria. Figure 15a illustrates the response surface plot depicting the interactive effects of vibration frequency and amplitude on soil screen passing rate. From the plot, it was evident that, under the combined influence of vibration frequency and amplitude, vibration frequency had a greater impact on soil screen passing rate than amplitude. Figure 16a displayed the response surface plots illustrating the interaction effects of vibration frequency and amplitude on screening loss rate. This plot clearly showed that, under the combined influence of vibration frequency and amplitude, vibration frequency exerted a greater effect on screening loss rate than amplitude.

Figure 15.
Parameter interaction analysis of soil screen passing rate. (a) Vibration amplitude and vibration frequency; (b) Vibration amplitude and screen mesh inclination angle; (c) Vibration frequency and screen mesh inclination angle.

Figure 16.
Parameter interaction analysis of screening loss rate. (a) Vibration frequency and vibration amplitude; (b) Vibration amplitude and screen mesh inclination angle; (c) Vibration frequency and screen mesh inclination angle.
Figure 15b illustrates the response surface plot depicting the interactive effects of vibration frequency and screen mesh inclination angle on soil screen passing rate. This clearly indicated that, under the combined influence of vibration frequency and screen mesh inclination angle, vibration frequency had a more significant effect on soil screen passing rate than the screen mesh inclination angle. Figure 16b displayed the response surface plots illustrating the interaction effects of vibration frequency and screen mesh inclination angle on screening loss rate. This clearly showed that, under the combined influence of vibration frequency and screen mesh inclination angle, vibration frequency had a significantly greater effect on screening loss rate than the screen mesh inclination angle.
Figure 15c illustrates the response surface plot depicting the interactive effects of vibration amplitude and screen mesh inclination angle on soil screen passing rate. This indicated that, under the combined influence of vibration amplitude and screen mesh inclination angle, vibration amplitude had a significantly greater effect on soil screen passing rate than the screen mesh inclination angle. Figure 16c displayed the response surface plot illustrating the interactive effects of vibration amplitude and screen mesh inclination angle on screening loss rate. This clearly showed that, under the combined influence of vibration amplitude and screen mesh inclination angle, vibration amplitude had a significantly greater effect on screening loss rate than the screen mesh inclination angle.
3.3. Parameter Optimization and Experimental Verification
3.3.1. Parameter Optimization
Building on the above analysis, the regression model was optimized using Design-Expert 13 software to further enhance the vibrating screening performance. The optimal parameter combination derived from the optimization was as follows: screen aperture diameter was 6.66 mm, vibration amplitude was 24.646 mm, vibration frequency was 3.825 Hz, and screen mesh inclination angle was 4.012°. Calculations indicated that, under this parameter combination, the soil screen passing rate was 82.331%, while the screening loss rate was 18.448%. The final screen aperture diameter selected based on the manufacturing precision of the screen mesh factory is 6.5 mm. Due to the inability to precisely achieve the transmission ratio with the belt drive, the vibration amplitude was ultimately set to 25 mm, and the vibration frequency was 3.8 Hz through multiple adjustments of the motor speed and the crank-connecting rod mechanism. The screen mesh inclination angle was selected as 4 degrees by rounding to the nearest integer.
3.3.2. Bench Test Validation
The vibration screening test rig was set up in the residual film recovery laboratory at Jiangsu University, and verification tests were conducted to determine the optimal parameter combinations. The test bench was illustrated in Figure 17a. The test materials were collected from the 67th Brigade Farm in Kokdala City, Xinjiang, and the residual film recovery machine model was 4JMLQ210. After adjusting the test bench parameters, five repeated tests were conducted. The soil screen passing rate and screening loss rate were then calculated using the average values. The verification results were illustrated in Figure 17b. Under this parameter combination, the average screen passing rate was 80.33%, and the average screening loss rate was 19.31%. The errors were 2.43% and 4.69% compared to the predicted values, respectively.
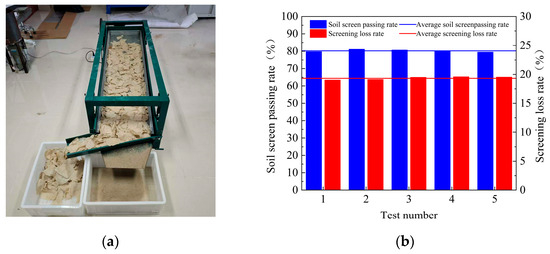
Figure 17.
Physical test rig and results analysis. (a) Physical bench test; (b) Test results.
4. Discussion
The soil content in the residual film mixture collected by the recovery machine is too high, making it difficult to effectively separate the residual film and soil. Previous studies suggested optimizing the residual film recovery machine to reduce soil content further, but the results were unsatisfactory. By referencing existing vibrating screen separation technology and analyzing the movement patterns of residual film and soil within the screen body, simulations were conducted to analyze the separation of residual film-soil materials, and actual experiments were carried out to validate the results. The content of this study was expected to provide practical reference value for the separation of residual film and soil.
Analysis of previous studies indicates that the drum screening method achieves a residual film separation rate of 89.4% to 92.48%, but may experience residual film entanglement and screen aperture blockage during operation. The water washing method can achieve a separation rate of 88.72%, but it consumes large amounts of water and carries a high risk of secondary pollution. Electrostatic separation achieves a residual film separation rate of 91.7%, yet its operation is complex and prone to failure in high-dust environments. The screen passing rate for the vibrating screen method is 80.33%. Although this result is lower than other separation methods, the vibrating screen method offers the advantage of avoiding issues such as residual film entanglement and screen aperture blockage during operation. Furthermore, the vibrating screen features a simple structure and more reliable performance [49].
To reduce computational complexity, the particle diameter of the residual film model was enlarged. Although its error was validated through angle of repose tests, existing modeling techniques cannot accurately capture the lightweight and flexible characteristics of the residual film. Therefore, further research is required to establish a simulation model for residual film [50]. Although this experiment validated the feasibility of residual film and soil vibration screening, it only examined the separation efficiency of a single-layer vibrating screen. The separation efficiency of multi-layer or composite screens for residual film and soil has not been verified yet [51,52,53]. The separation efficiency of single-layer vibrating screens remains insufficient, but they represent only the beginning of this line of research. Future research should focus on developing multi-layer vibrating screens and integrating or combining other cleaning methods with vibration techniques to further enhance membrane-soil separation performance, thereby promoting the utilization of residual membrane resources.
5. Conclusions
In this study, the vibration screen was designed to improve the separation performance of residual film and soil. The discrete element model was established by the material’s characteristics and contact parameters. Through experiments, the influence of vibration screen parameters on the separation performance was clarified. The main work of this article is as follows:
(1) Experimental Measurements and Simulation Model: Characteristic and contact parameters for the materials were experimentally determined. Single-factor experiments were conducted to identify optimal parameter ranges: screen aperture diameter (5 to 9 mm), vibration amplitude (20 to 30 mm), vibration frequency (3 to 5 Hz), and screen mesh inclination angle (3 to 5°).
(2) Response Surface Experiments and Optimization: Mathematical models for soil screen passing rate and screening loss rate were established based on the four key parameters. The optimal parameter combination was identified as screen aperture diameter was 6.5 mm, vibration amplitude was 25 mm, vibration frequency was 3.8 Hz, and screen inclination angle was 4°. The analysis revealed the order of influence of these factors on soil screen passing rate and screening loss rate. Through verification, it was found that these factors have interactive effects on soil screen passing rate and screening loss rate.
(3) Bench Test Verification: Under the optimal parameter combination, the average soil screen passing rate was 80.33%, and the average screening loss rate was 19.31%. The errors between the test rig and the simulation test results were within a reasonable range, verifying the accuracy of the test results. The findings were expected to provide practical reference for the separation of residual film and soil utilizing vibration screening technology.
Author Contributions
Conceptualization, Y.L. and X.W.; methodology, Y.L., X.W. and J.B.; software, Y.L. and J.B.; validation, Y.L., X.W. and J.B.; formal analysis, J.B., X.W. and Y.L.; investigation, X.W., J.B. and Y.L.; resources, X.W.; data curation, Y.L. and J.B.; writing—original draft preparation, Y.L.; writing—review and editing, X.W. and J.B.; visualization, Y.L.; supervision, J.B.; project administration, X.W.; funding acquisition, X.W. All authors have read and agreed to the published version of the manuscript.
Funding
This study was supported by the National Key R&D Program of China (No. 2022YFD2002403), Talent Development Fund of Shihezi University in 2025- "Group Team" Aid Xinjiang Team (No. CZ002562), the Ministry of Industry and Information Technology’s Residual Film Recycling Machine Project (No. zk20230359), and the Priority Academic Program Development of Jiangsu Higher Education Institutions (No. PAPD-2023).
Data Availability Statement
All data utilized in this work are accessible. Citations provided throughout the text identify the sources of referenced data.
Conflicts of Interest
The authors declare no competing interests. The references included are relevant to the content presented.
References
- Iqbal, B.; Zhao, T.; Yin, W.; Zhao, X.; Xie, Q.; Khan, K.Y.; Zhao, X.; Nazar, M.; Li, G.; Du, D. Impacts of Soil Microplastics on Crops: A Review. Appl. Soil Ecol. 2023, 181, 104680. [Google Scholar] [CrossRef]
- Lakhiar, I.A.; Yan, H.; Zhang, J.; Wang, G.; Deng, S.; Bao, R.; Zhang, C.; Syed, T.N.; Wang, B.; Zhou, R.; et al. Plastic Pollution in Agriculture as a Threat to Food Security, the Ecosystem, and the Environment: An Overview. Agronomy 2024, 14, 548. [Google Scholar] [CrossRef]
- Khan, I.; Tariq, M.; Alabbosh, K.F.; Rehman, A.; Jalal, A.; Khan, A.A.; Farooq, M.; Li, G.; Iqbal, B.; Ahmad, N.; et al. Soil Microplastics: Impacts on Greenhouse Gasses Emissions, Carbon Cycling, Microbial Diversity, and Soil Characteristics. Appl. Soil Ecol. 2024, 197, 105343. [Google Scholar] [CrossRef]
- Chen, Y.F.; Chen, H.; Dai, Y.T.; Xiao, J.L.; Qiu, F.X.; Zhang, T. Honeycomb porous regenerated cellulose aerogel films with enhanced thermal dissipation for agricultural mulch application. Food Bioprod. Process. 2024, 147, 418–427. [Google Scholar] [CrossRef]
- Chen, Y.F.; Dai, Y.T.; Zhu, Y.; Xue, S.L.; Qiu, F.X.; Zhang, T. Transparent cellulose acetate/polyvinylidene difluoride films with heat dissipation for agricultural mulch application. Ind. Crops Prod. 2025, 224, 120302. [Google Scholar] [CrossRef]
- Payanthoth, N.S.; Mut, N.N.N.; Samanta, P.; Li, G.L.; Jung, J.H. A review of biodegradation and formation of biodegradable microplastics in soil and freshwater environments. Appl. Biol. Chem. 2024, 67, 110. [Google Scholar] [CrossRef]
- Cao, J.; Gao, X.; Cheng, Z.; Song, X.; Cai, Y.; Siddique, K.H.M.; Zhao, X.; Li, C. 1The Harm of Residual Plastic Film and Its Accumulation Driving Factors in Northwest China. Environ. Pollut. 2023, 318, 120910. [Google Scholar] [CrossRef]
- Xia, H.; Shen, J.; Riaz, M.; Ran, F.; Cheng, T.; Wang, X.; Dong, Q.; Zu, C.; Liu, B.; Babar, S.; et al. Effects of Agricultural Plastic Films on Crop Growth and Soil Health in Tobacco Fields: A Comparative Study. Appl. Soil Ecol. 2025, 206, 105795. [Google Scholar] [CrossRef]
- Bulati, A.; Zhan, L.; Xu, Z.; Yang, K. Obtaining the Value of Waste Polyethylene Mulch Film Through Pretreatment and Recycling Technology in China. Waste Manag. 2025, 197, 35–49. [Google Scholar] [CrossRef] [PubMed]
- Fang, W.; Wang, X.; Han, D.; Zang, N.; Chen, X.; Ohiemi, I.E. Parameter Optimization and Disturbance Analysis of the Film Picking Device of the Chain-Type Plough Layer Residual Film Recovery Machine Based on DEM-MBD Coupling. Comput. Electron. Agric. 2024, 222, 109041. [Google Scholar] [CrossRef]
- Cao, S.; Xie, J.; Wang, H.; Yang, Y.; Zhang, Y.; Zhou, J.; Wu, S. Design and Operating Parameters Optimization of the Hook-and-Tooth Chain Rail Type Residual Film Picking Device. Agriculture 2022, 12, 1717. [Google Scholar] [CrossRef]
- Gao, Z.; Zhang, X.; Zhang, J.; Wang, Y.; Li, J.; Shen, S.; Dong, W.; Wang, X. Design and Experiment of the Belt-Tooth Residual Film Recovery Machine. Agriculture 2025, 15, 1422. [Google Scholar] [CrossRef]
- Jiang, D.; Yan, L.; Chen, X.; Mo, Y.; Yang, J. Design and Experiment of Nail Tooth Picking Up Device for Strip Type Residual Film Recycling and Baling Machine. Int. J. Agric. Biol. Eng. 2023, 16, 85–96. [Google Scholar] [CrossRef]
- Zhang, Z.; Li, J.; Wang, X.; Zhao, Y.; Xue, S.; Su, Z.; Liang, J. Design and Test of 1SMB-3600A Type Fragmented Mulch Film Collector for Sowing Layer Soil. Soil Tillage Res. 2023, 225, 105555. [Google Scholar] [CrossRef]
- Hu, B.; Serranti, S.; Fraunholcz, N.; Di Maio, F.; Bonifazi, G. Recycling-Oriented Characterization of Polyolefin Packaging Waste. Waste Manag. 2013, 33, 574–584. [Google Scholar] [CrossRef]
- Meneses Quelal, W.O.; Velazquez-Marti, B.; Ferrer Gisbert, A. Separation of Virgin Plastic Polymers and Post-Consumer Mixed Plastic Waste by Sinking-Flotation Technique. Environ. Sci. Pollut. Res. 2022, 29, 1364–1374. [Google Scholar] [CrossRef]
- Lyskawinski, W.; Baranski, M.; Jedryczka, C.; Mikolajewicz, J.; Regulski, R.; Rybarczyk, D.; Sedziak, D. Analysis of Triboelectrostatic Separation Process of Mixed Poly(ethylene terephthalate) and High-Density Polyethylene. Energies 2022, 15, 19. [Google Scholar] [CrossRef]
- Rodrigues, B.M.; Saron, C. Electrostatic Separation of Polymer Waste by Tribocharging System Based on Friction With PVC. Int. J. Environ. Sci. Technol. 2022, 19, 1293–1300. [Google Scholar] [CrossRef]
- Chen, X.; Xi, F.; Geng, Y.; Fujita, T. The Potential Environmental Gains From Recycling Waste Plastics: Simulation of Transferring Recycling and Recovery Technologies to Shenyang, China. Waste Manag. 2011, 31, 168–179. [Google Scholar] [CrossRef]
- Malcolm Richard, G.; Mario, M.; Javier, T.; Susana, T. Optimization of the Recovery of Plastics for Recycling by Density Media Separation Cyclones. Resour. Conserv. Recycl. 2011, 55, 472–482. [Google Scholar] [CrossRef]
- Yang, X.; Zhao, H. Optimum Design of Movement Parameters for Soft Plastic Vibration Sorting Machine’s Screen. In Proceedings of the International Conference on Manufacturing Science and Technology (ICMST 2011), Singapore, 16–18 September 2011; pp. 2875–2879. [Google Scholar]
- Zhu, C.; Chen, B.; Li, J.; Liu, Y.; Yang, L.; Wang, W.; Zhang, H. Design and Testing of the Peanut Pod Cleaning Device. Processes 2023, 11, 106. [Google Scholar] [CrossRef]
- Yang, M.; Zhang, Y.; Zhang, C.; Gu, F.; Yu, Z.; Hu, Z. Design and Experiment of Fan-sieve Combined Peanut Film-Seedling Separating Device Based on Shredding and Separating. Trans. Chin. Soc. Agric. Mach. 2020, 51, 112–121. [Google Scholar]
- Gu, F.; Yang, M.; Hu, Z.; Zhang, Y.; Zhang, C.; Wang, S. Experiment and Optimization of High-Efficiency Mechanical Separation of Peanut Seedlings and Residual Film Based on Suspension Velocity. Trans. Asabe 2021, 64, 1381–1389. [Google Scholar] [CrossRef]
- Xie, J.; Li, Y.; Liu, Y.; Zhang, J.; Du, Y.; Shi, X. Design and Test of Segmented Drum Pneumatically Assisted Potosia brevitarsis Larva Residul Film Mixture Separation Device. Trans. Chin. Soc. Agric. Mach. 2024, 55, 329–341, 428. [Google Scholar]
- Zhou, P.; Chen, X.; Meng, H.; Liang, R.; Zhang, B.; Kan, Z. Design and Experiment of Trommel with Function of Separating Soil from Residual Film Mixture. J. Jilin University. Eng. Technol. Ed. 2023, 53, 2718–2731. [Google Scholar]
- Peng, Q.; Li, C.; Kang, J.; Shi, G. Research and Experiments on a Separation Mechanism for Film-Impurity Aggregates Using a Pneumatic Cylinder Sieve. Trans. Asabe 2020, 63, 1361–1370. [Google Scholar] [CrossRef]
- Peng, Q.; Li, C.; Kang, J.; Shi, G.; Zhang, H. Improved Design and Test on Pneumatic Cylinder Sieve Film Hybrid Separator. Trans. Chin. Soc. Agric. Mach. 2020, 51, 126–135. [Google Scholar]
- Kang, J.; Xie, C.; Peng, Q.; Wang, N.; Wang, X.; Zhang, Y. Analysis of Feed Inlet and Optimal Feeding Amount of Waste Ground Film Impurity Removal Equipment. Appl. Sci. 2023, 13, 9905. [Google Scholar] [CrossRef]
- He, H.; Hu, B.; Pan, F.; Luo, X.; Guo, M.; Xie, Y.; Chen, X. Effects and Experiment on Settlement and Aggregation Behavior of Plastic Film and Cotton Stalk Under the Action of Disturbing Water by the Impeller. Trans. Chin. Soc. Agric. Eng. 2021, 37, 86–95. [Google Scholar]
- Xie, J.; Liu, W.; Cao, S.; Huang, W.; Zhang, J.; Li, Y.; Meng, Q. Design and Test of Countercurrent Hook-Type Residual Film Mixture Cleaning and Separation Device. Trans. Chin. Soc. Agric. Mach. 2025, 56, 397–408. [Google Scholar]
- Zhang, B.; Wang, X.; Liang, R.; Li, J.; Li, Y.; Kan, Z.; Meng, H. Enhancing Resource Utilization: A Novel Method for Effective Separation of Residual Film and Impurities in Cotton Fields. J. Environ. Manag. 2024, 359, 121065. [Google Scholar] [CrossRef]
- Guo, S.; Kan, Z.; Zhang, R.; Guo, W.; An, H.; Cong, T. Separation Test of Electrostatic Separating Device for Machine-Harvested Seed Cotton and Plastic Film Residue. Trans. CSAE 2011, 27, 6–10. [Google Scholar]
- Guo, W.; Kan, Z.; Zhang, R.; Guo, S.; An, H.; Cong, T. Analysis of Material Character Based on Mesh Roller-Type Cotton and Film Remnant Separator. Trans. CSAE 2011, 27, 1–5. [Google Scholar]
- Li, Y.; Zhao, C.; Yan, C.; Mao, L.; Liu, Q.; Li, Z.; He, W. Effects of Agricultural Plastic Film Residues on Transportation and Distribution of Water and Nitrate in Soil. Chemosphere 2020, 242, 125131. [Google Scholar] [CrossRef] [PubMed]
- Zhang, Z.; Zhang, Q.; Xie, S.; Mao, W.; Wang, T.; Wu, H.; Li, X.; Yang, X. Study on Coupling Vibration Sorting Parameters of Waste Plastic Film and Experimental Verification. Environ. Technol. Innov. 2023, 31, 103188. [Google Scholar] [CrossRef]
- Liang, Z.W.; Xu, L.Z.; De Baerdemaeker, J.; Li, Y.M.; Saeys, W. Optimisation of a multi-duct cleaning device for rice combine harvesters utilising CFD and experiments. Biosyst. Eng. 2020, 190, 25–40. [Google Scholar] [CrossRef]
- Xu, L.Z.; Li, Y.; Chai, X.Y.; Wang, G.M.; Liang, Z.W.; Li, Y.M.; Li, B.J. Numerical simulation of gas-solid two-phase flow to predict the cleaning performance of rice combine harvesters. Biosyst. Eng. 2020, 190, 11–24. [Google Scholar] [CrossRef]
- Zhang, Z.; Chen, J.; Li, Y.; Guan, Z.; Liao, C.; Qiao, X. Design and Experiment on the Air-Blowing and Vibrating Supply Seed Tray for Precision Seeders. Int. J. Agric. Biol. Eng. 2022, 15, 115–121. [Google Scholar] [CrossRef]
- Ferellec, J.F.; McDowell, G.R. A method to model realistic particle shape and inertia in DEM. Granul. Matter 2010, 12, 459–467. [Google Scholar] [CrossRef]
- Yang, Q.Z.; Shi, L.; Shi, A.P.; He, M.S.; Zhao, X.Q.; Zhang, L.; Addy, M. Determination of key soil characteristic parameters using angle of repose and direct shear stress test. Int. J. Agric. Biol. Eng. 2023, 16, 143–150. [Google Scholar] [CrossRef]
- Mei, F.; Li, B.; Xu, Z.; Li, X.; Zhu, X. Discrete Element Modeling of Straw Bale: An Innovative Approach to Simulate the Compression Mechanics of Fiber-Based Materials. Comput. Electron. Agric. 2025, 231, 110002. [Google Scholar] [CrossRef]
- Yan, D.; Yu, J.; Wang, Y.; Zhou, L.; Sun, K.; Tian, Y. A Review of the Application of Discrete Element Method in Agricultural Engineering: A Case Study of Soybean. Processes 2022, 10, 1305. [Google Scholar] [CrossRef]
- Kang, J.; Xie, C.; Wang, X.; Chen, Y.; Wang, C.; Peng, Q. Design and Test of Screen Hole Clearing Device for Trommel Sieve Type Membrane Miscellaneous Wind Separator. Trans. Chin. Soc. Agric. Mach. 2022, 53, 91–98. [Google Scholar]
- GB/T 50145-2007; Engineering Classification Standards for Soil. Institute, NHR: Nanjing, China, 2007; p. 38.
- JB/T 4042-2008; Vibrating Screen. Test Methods. Anshan Heavy Duty Mining Machinery Co.: Liaoning, China, 2018.
- GB/T 12620-2008; Long Round Holes, Long Square Holes and Round Hole Sieve Plates. Hunan Ujiang Machinery Screening Co.: Yiyang City, China, 2008; p. 16.
- Kang, J.; Zhang, H.; Zhang, G.; Du, H.; Peng, Q.; Song, Y. Aerodynamic Characteristics of Residual Film Materials and Test of Membrane Separation Device. J. Chin. Agric. Mech. 2020, 41, 167–172. [Google Scholar] [CrossRef]
- Long, H.; Huang, C.; Li, D. Dynamic analysis of beam structure of linear vibrating screen. Aip Adv. 2024, 14, 015101. [Google Scholar] [CrossRef]
- Guo, W.; He, X.; Wang, L.; Zhao, P.; Hu, C.; Hou, S.; Wang, X. Development of a comb tooth loosening and pneumatic stripping plough layer residual film recovery machine. Trans. Chin. Soc. Agric. Eng. 2020, 36, 1–10. [Google Scholar]
- Li, Y.; Zhao, P.; Mo, L.; Ren, T.; Zhang, M. Numerical simulation of particle screening efficiency of large multi-layer vibrating screen based on discrete element method. Proc. Inst. Mech. Eng. Part E-J. Process Mech. Eng. 2022, 236, 565–574. [Google Scholar] [CrossRef]
- Yang, H.; Ma, X. Research on the screening mechanisms of composite vibrating screens based on discrete elements. PLoS ONE 2023, 18, 0293205. [Google Scholar] [CrossRef]
- Yang, H.; Ma, X. Discrete element simulation study on the screening effect of composite vibrating screen for coal particles. Int. J. Coal Prep. Util. 2025, 45, 1–19. [Google Scholar] [CrossRef]
Disclaimer/Publisher’s Note: The statements, opinions and data contained in all publications are solely those of the individual author(s) and contributor(s) and not of MDPI and/or the editor(s). MDPI and/or the editor(s) disclaim responsibility for any injury to people or property resulting from any ideas, methods, instructions or products referred to in the content. |
© 2025 by the authors. Licensee MDPI, Basel, Switzerland. This article is an open access article distributed under the terms and conditions of the Creative Commons Attribution (CC BY) license (https://creativecommons.org/licenses/by/4.0/).