Article

RFA-YOLOv8: A Robust Tea Bud Detection Model with Adaptive Illumination Enhancement for Complex Orchard Environments

School of Mechanical Engineering, Jiangsu University, Zhenjiang 212013, China
*
Author to whom correspondence should be addressed.
Agriculture 2025, 15(18), 1982; https://doi.org/10.3390/agriculture15181982
Submission received: 17 August 2025 / Revised: 17 September 2025 / Accepted: 18 September 2025 / Published: 19 September 2025
(This article belongs to the Section Artificial Intelligence and Digital Agriculture)

Abstract

Accurate detection of tea shoots in natural environments is crucial for facilitating intelligent tea picking, field management, and automated harvesting. However, the detection performance of existing methods in complex scenes remains limited due to factors such as the small size, high density, severe overlap, and the similarity in color between tea shoots and the background. Consequently, this paper proposes an improved target detection algorithm, RFA-YOLOv8, based on YOLOv8, which aims to enhance the detection accuracy and robustness of tea shoots in natural environments. First, a self-constructed dataset containing images of tea shoots under various lighting conditions is created for model training and evaluation. Second, the multi-scale feature extraction capability of the model is enhanced by introducing RFCAConv along with the optimized SPPFCSPC module, while the spatial perception ability is improved by integrating the RFAConv module. Finally, the EIoU loss function is employed instead of CIoU to optimize the accuracy of the bounding box positioning. The experimental results demonstrate that the improved model achieves 84.1% and 58.7% in mAP@0.5 and mAP@0.5:0.95, respectively, which represent increases of 3.6% and 5.5% over the original YOLOv8. Robustness is evaluated under strong, moderate, and dim lighting conditions, yielding improvements of 6.3% and 7.1%. In dim lighting, mAP@0.5 and mAP@0.5:0.95 improve by 6.3% and 7.1%, respectively. The findings of this research provide an effective solution for the high-precision detection of tea shoots in complex lighting environments and offer theoretical and technical support for the development of smart tea gardens and automated picking.

1. Introduction

With the increasing emphasis on healthy consumption, the demand for high-quality tea continues to increase, driving tea production and plucking practices toward greater refinement and efficiency [1]. Standardized plucking of premium raw materials is essential for ensuring tea quality. Typically, either single buds or a bud with one leaf are harvested [2,3]. Tea production areas are primarily located in hilly and mountainous regions with steep terrain. Plucking methods are generally classified into hand-picking and amechanized picking. Hand-picking remains the most common method but is constrained by low efficiency, high cost, and labor shortages due to seasonal constraints [4].
Although mechanized plucking equipment has improved significantly, most machines still adopt a uniform approach, which often results in damage or breakage of tea leaves [5]. In addition, tea farmers usually count buds manually, a process that is inefficient and time-consuming. Automated bud counting can not only increase productivity but also provide reliable estimates of tea yield [6]. Detecting high-quality tea shoots remains challenging due to variations in type, orientation, size, shading, and lighting conditions. Consequently, accurate detection in complex environments has emerged as a major research focus. Recent studies have investigated deep learning methods to address these challenges, including lightweight architectures, attention mechanisms, multi-scale fusion, and enhanced loss functions.
By integrating deep learning algorithms, intelligent tea-picking robots can recognize and classify tea leaves with higher precision, thereby improving both picking accuracy and picking efficiency [7,8]. In contrast, traditional machine learning approaches depend on manually designed features such as leaf shape, color, and texture, which are subsequently used for detection and segmentation [9,10]. The Regional Convolutional Neural Network (R-CNN) [11] was the first model applied to object recognition, followed by extensions such as Fast R-CNN [12] and Faster RCNN [13]. You Only Look Once (YOLO) [14,15,16,17,18,19,20,21] and SSD [22], and many other optimized algorithms, have been applied in agriculture, demonstrating high accuracy and robustness in applications such as pest and disease detection, weed identification, and crop yield prediction. The Ghost-YOLOv5 algorithm [23] incorporates lightweight GhostConv operations to reduce model complexity. It further integrates a BAM attention mechanism and a multi-scale weighted feature fusion module to enhance detection accuracy. Yang et al. [24] proposed an improved tea shoot detection method based on YOLOv8n. In their approach, the FasterNet model replaced the original YOLOv8n backbone, a global attention mechanism (GAM) was added at the end of the backbone, and a context-guided (CG) module was integrated into the Neck. This design enhanced feature extraction and increased the recognition accuracy of tea shoots, achieving an average accuracy of 94.3%.
Although optimized deep learning models achieve high accuracy in tea shoot detection under laboratory settings, maintaining consistent performance in complex, unstructured field environments remains challenging. In practical harvesting scenarios, detection is often affected by natural agricultural conditions [25]. These problems persist in both current research and actual recognition processes, as illustrated in Figure 1. Tea shoots and mature leaves belong to different growth stages of the same plant, and their high similarity in color and texture often results in misclassification [26]. Second, the scale of tea shoots varies depending on growth stage and camera distance. Small or distant shoots are easily overlooked, rendering single-scale detection methods inadequate [27]. Third, field images are captured under highly variable lighting conditions, and the background often contains soil, weeds, dead leaves, and branches. These factors impose higher requirements on the robustness and generalization ability of the model.
To address these challenges, we propose a high-precision tea shoot detection method based on the YOLOv8 framework, termed RFA-YOLOv8.
The main contributions of this paper are as follows:
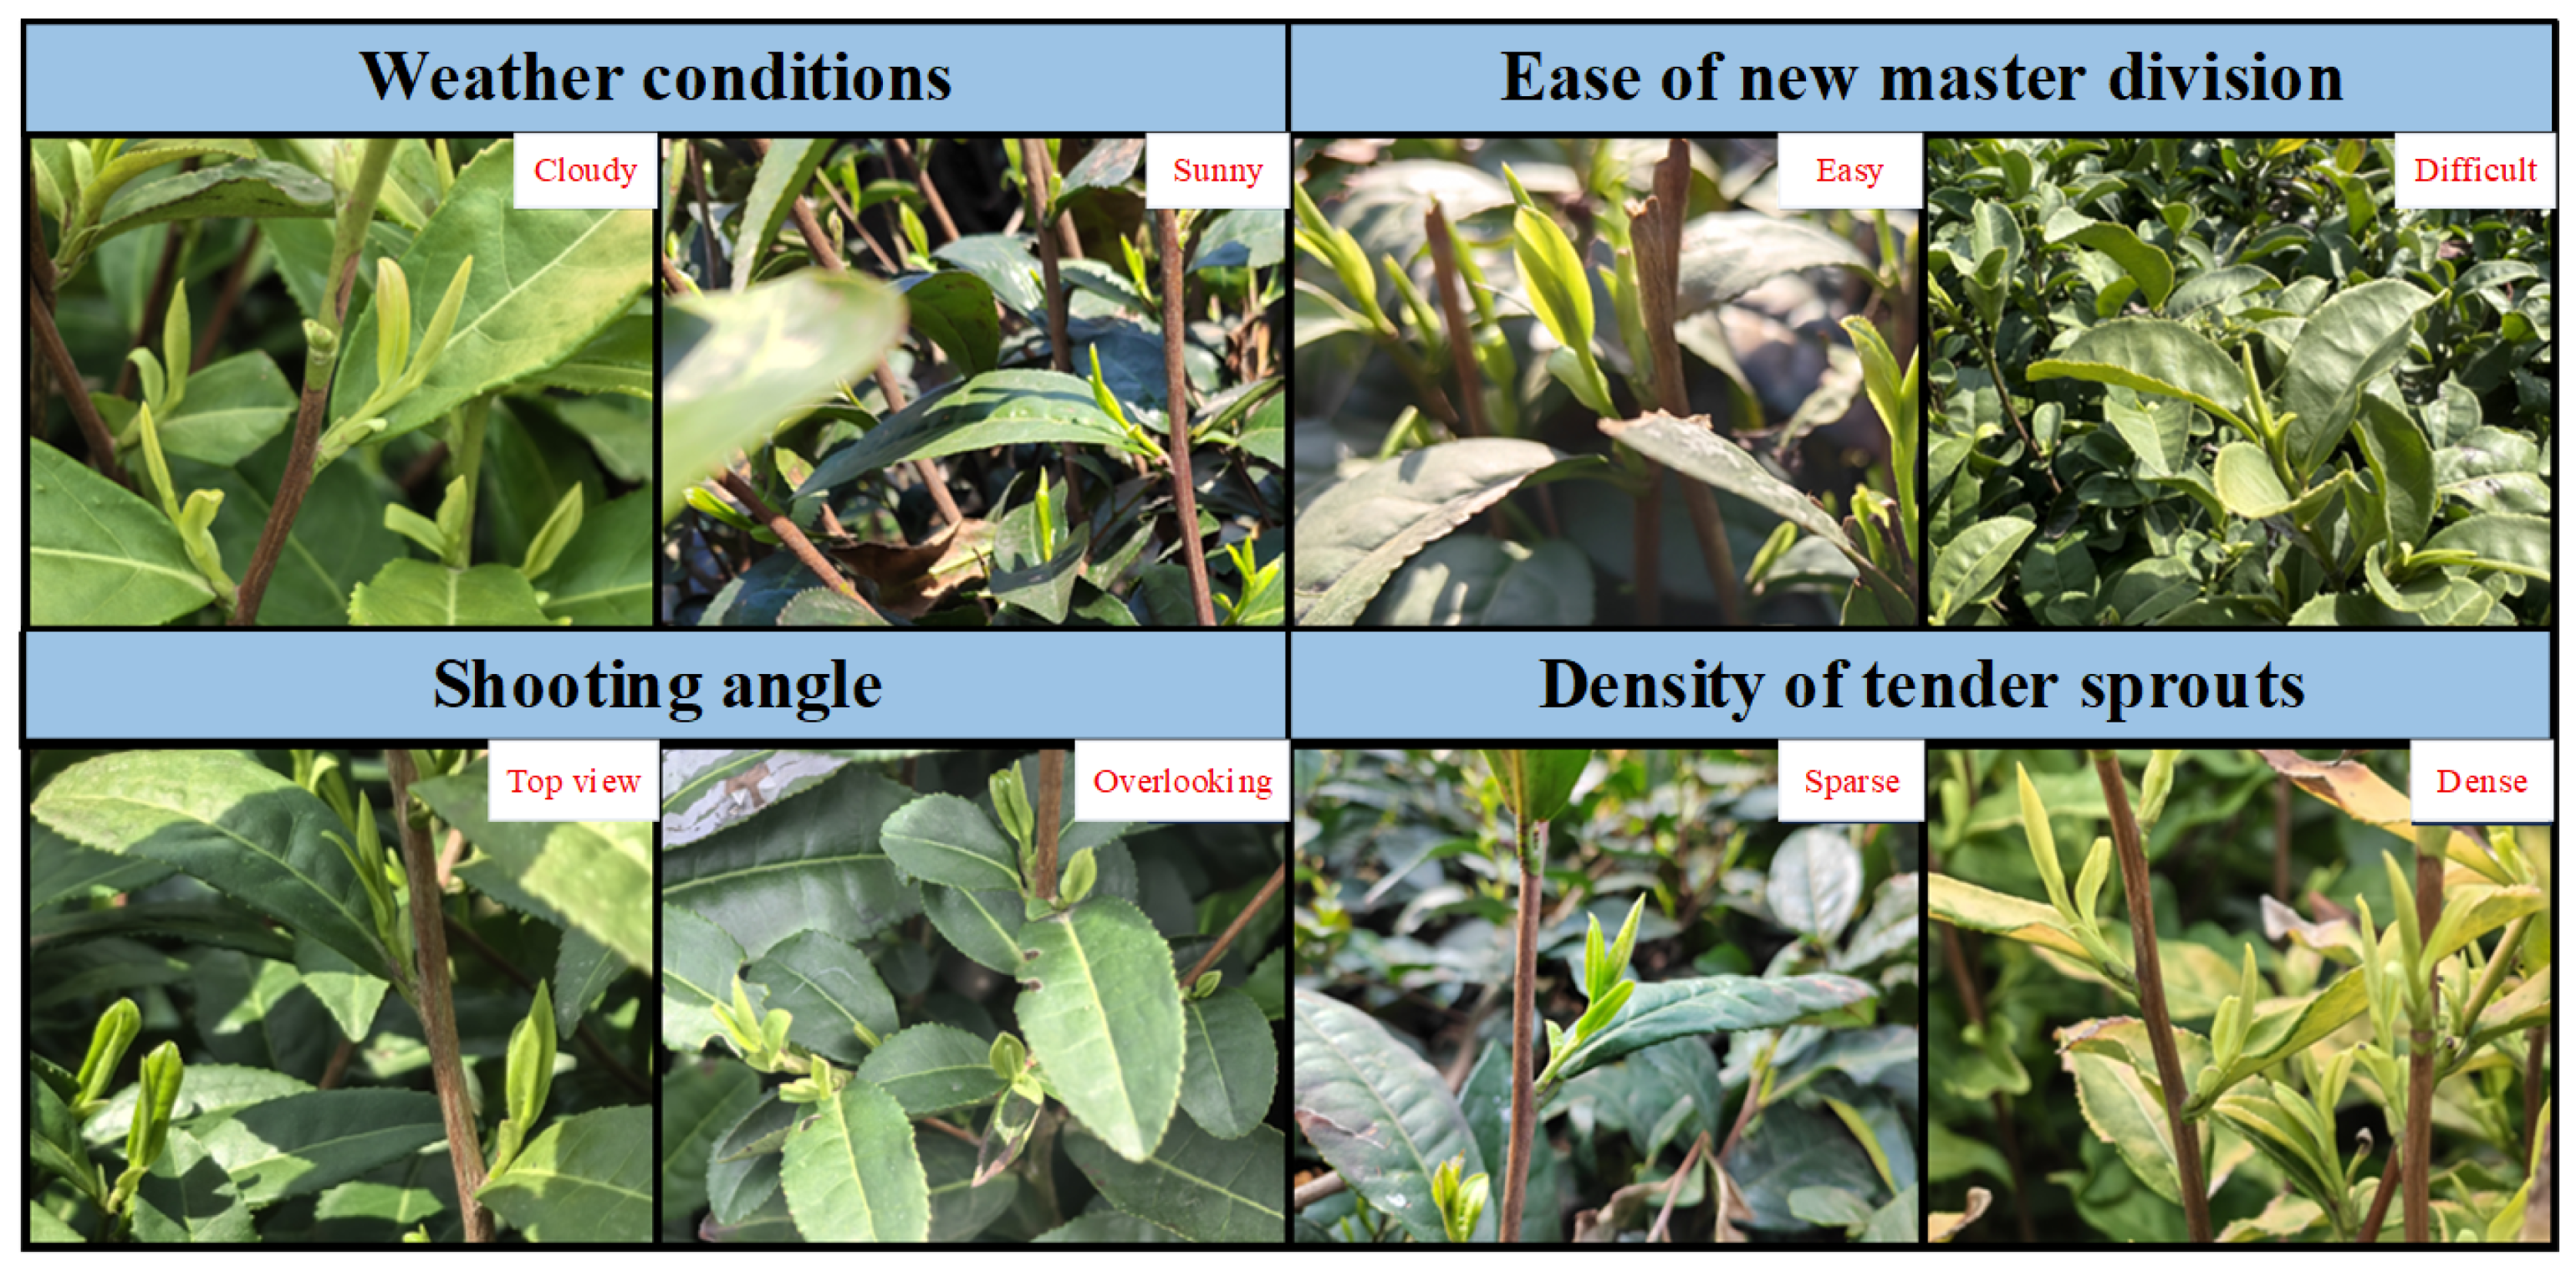
(1) To address the complexity and variability of tea garden environments, we constructed a tea shoot dataset encompassing diverse natural conditions. This dataset includes images captured under different weather and lighting conditions, from multiple shooting angles, and across various tea garden scenarios. It provides a solid foundation for enhancing the model’s generalization ability in real-world environments.
(2) Based on the YOLOv8 framework, we introduce several innovations. The RFCAConv module reduces missed detections of tea shoots. The RFAConv module enhances localization accuracy. In addition, an improved loss function further strengthens detection performance. Together, these strategies improve accuracy from three perspectives: feature extraction, spatial localization, and target optimization.
(3) The RFA-YOLOv8 model demonstrates strong generalization and robustness in complex tea garden environments. Extensive validation shows that it can accurately identify tea shoots despite interference from mature leaves and low-light conditions. It also achieves stable detection under dim illumination and precise localization in the presence of partial occlusion. These results highlight the model’s improved accuracy and reliability in tea shoot recognition under natural environmental conditions.
The rest of the paper is structured as follows: Section 2 summarizes and analyzes the related work, Section 3 describes the proposed method in detail, Section 4 presents the experimental results, and Section 5 summarizes the experimental results and proposes future research.

2. Related Works

In recent years, deep learning-based target detection has developed rapidly, providing a valuable reference for tea shoot detection. Tea shoot visual recognition is a core technology in intelligent picking robots for high-quality tea [28]. Current tea shoot detection methods are generally built on a generalized target detection framework, which can be divided into two categories: two-stage methods and one-stage methods. The former relies mainly on two-stage target detection frameworks, including SPP-Net [29], Fast R-CNN [12], Faster R-CNN [13], Mask R-CNN [30], and Cascade R-CNN [31]. The latter consists of single-stage frameworks, including the YOLO family [14,15,16,17,18,19,20,21], RetinaNet [32], and FCOS [33]. Compared with CNN-based models, Transformer-based detection frameworks provide stronger global feature extraction and parallel computation capabilities. They capture larger receptive fields, extract more detailed information, and achieve better contextual semantic fusion. Representative models include DETR [34], RT-DETR [35], CNN-Transformer hybrid architectures [33,36,37,38,39,40,41]. Early tea shoot detection algorithms were dominated by basic networks such as YOLO and VGG-16, which were combined with traditional image preprocessing to enhance model robustness [42].
Sun et al. [43] were the first to apply deep learning-based object detection to the identification of tea shoots. They combined an ultra-green feature with Otsu thresholding during preprocessing. Their experiments demonstrated that deep learning detectors outperform traditional methods in recognizing tea shoots against complex backgrounds. Yang H et al. [44] proposed an improved YOLOv3-based tea shoot recognition algorithm, which optimizes the network structure using the principle of image pyramid, making the method highly accurate and robust for detecting tea shoots under different poses and occlusions. Yu L et al. [45] introduced SS-YOLOX, which enhances feature extraction with a Squeeze-and-Excitation (SE) attention module and adopts Soft-NMS to further improve recognition accuracy. Wang M et al. [46] proposed Tea-YOLOv5s, a YOLOv5s variant that integrates Atrous Spatial Pyramid Pooling (ASPP) for multi-scale feature extraction, a Bi-directional Feature Pyramid Network (BiFPN) for feature fusion, and a Convolutional Block Attention Module (CBAM). On the tea-shoots dataset, these additions increased the model’s average precision and recall by 4.0 and 0.5 percentage points, respectively, compared with the original YOLOv5s. Gui J et al. [47] proposed YOLO-Tea, which incorporates a Multi-scale Convolutional Attention Module (MCBAM), applies K-means combined with a genetic algorithm to optimize anchor parameters, and employs the EIoU loss and Soft-NMS. These modifications substantially improved detection performance; the final model achieved an average accuracy of 95.2%. Gao et al. [48] developed a YOLOX-Nano-based tea shoot detector incorporating a CSPDarkNet backbone. They reduced computation using depthwise-separable convolutions and integrated CBAM into the feature pyramid to model cross-channel correlations and enhance deep feature propagation. The model reached an average accuracy of 85.6%. Chen Yiyong et al. [49] proposed a multi-species tea shoot detection model named RT-DETR-Tea for unstructured environments. This Transformer-based RT-DETR-Tea model enabled accurate identification of multiple tea shoot varieties in the natural environments, achieving an average accuracy of 79.7% in the final experiments.
Current innovations in deep learning-based tea shoot detection focus on multi-scale perception, optimization of attention mechanisms, and lightweight algorithm design [50,51]. However, several limitations persist. For example, models such as SS-YOLOX and Tea-YOLOv5s rely on a single attention mechanism (SE or CBAM). This design limits the ability to distinguish texture transitions between young shoots and old leaves, leading to a false detection rate of 12.6%. The dynamic chunking correction method proposed in 2023 depends on a fixed shooting distance; when the distance varies, accuracy drops to 79%. YOLO-Tea introduces MCBAM multiscale attention but lacks a mechanism to suppress negative background samples, resulting in a weed false detection rate of 17.3%. The latest AD-YOLOX-Nano prioritizes lightweight design at the expense of multiscale capability, achieving only 51.3% accuracy on low-pixel targets. In addition to these model-specific issues, several general challenges remain. The strong visual similarity between young and mature leaves leads to frequent misclassification in both traditional color-thresholding methods and deep learning models. Small tea shoots are often missed. Most training datasets are collected from a single tea plantation, limiting generalization and causing sharp accuracy drops in cross-species testing. Furthermore, robustness under complex lighting and background interference remains insufficient.
As a single-stage detector, YOLO has inherent advantages in real-time performance and lightweight design [51], whereas Transformers achieve higher accuracy but incur substantial computational costs, making them less suitable for deployment on edge devices. AD-YOLOX-Nano achieves 85.6% accuracy on embedded devices with a latency below 50 ms. By comparison, the equally lightweight RT-DETR-Tea achieves only 79.7% accuracy. This performance gap suggests that YOLO retains greater potential for optimization in resource-constrained tea-picking robots. To address key challenges—including distinguishing new from old leaves, reducing missed detections of small tea shoots, and ensuring robust recognition in real growing environments—this study adopts YOLOv8 as the baseline framework. On this basis, we propose a fast and accurate detection method called RFA-YOLOv8.

3. Proposed Methods

3.1. Overall Model Structure of RFA-YOLOv8

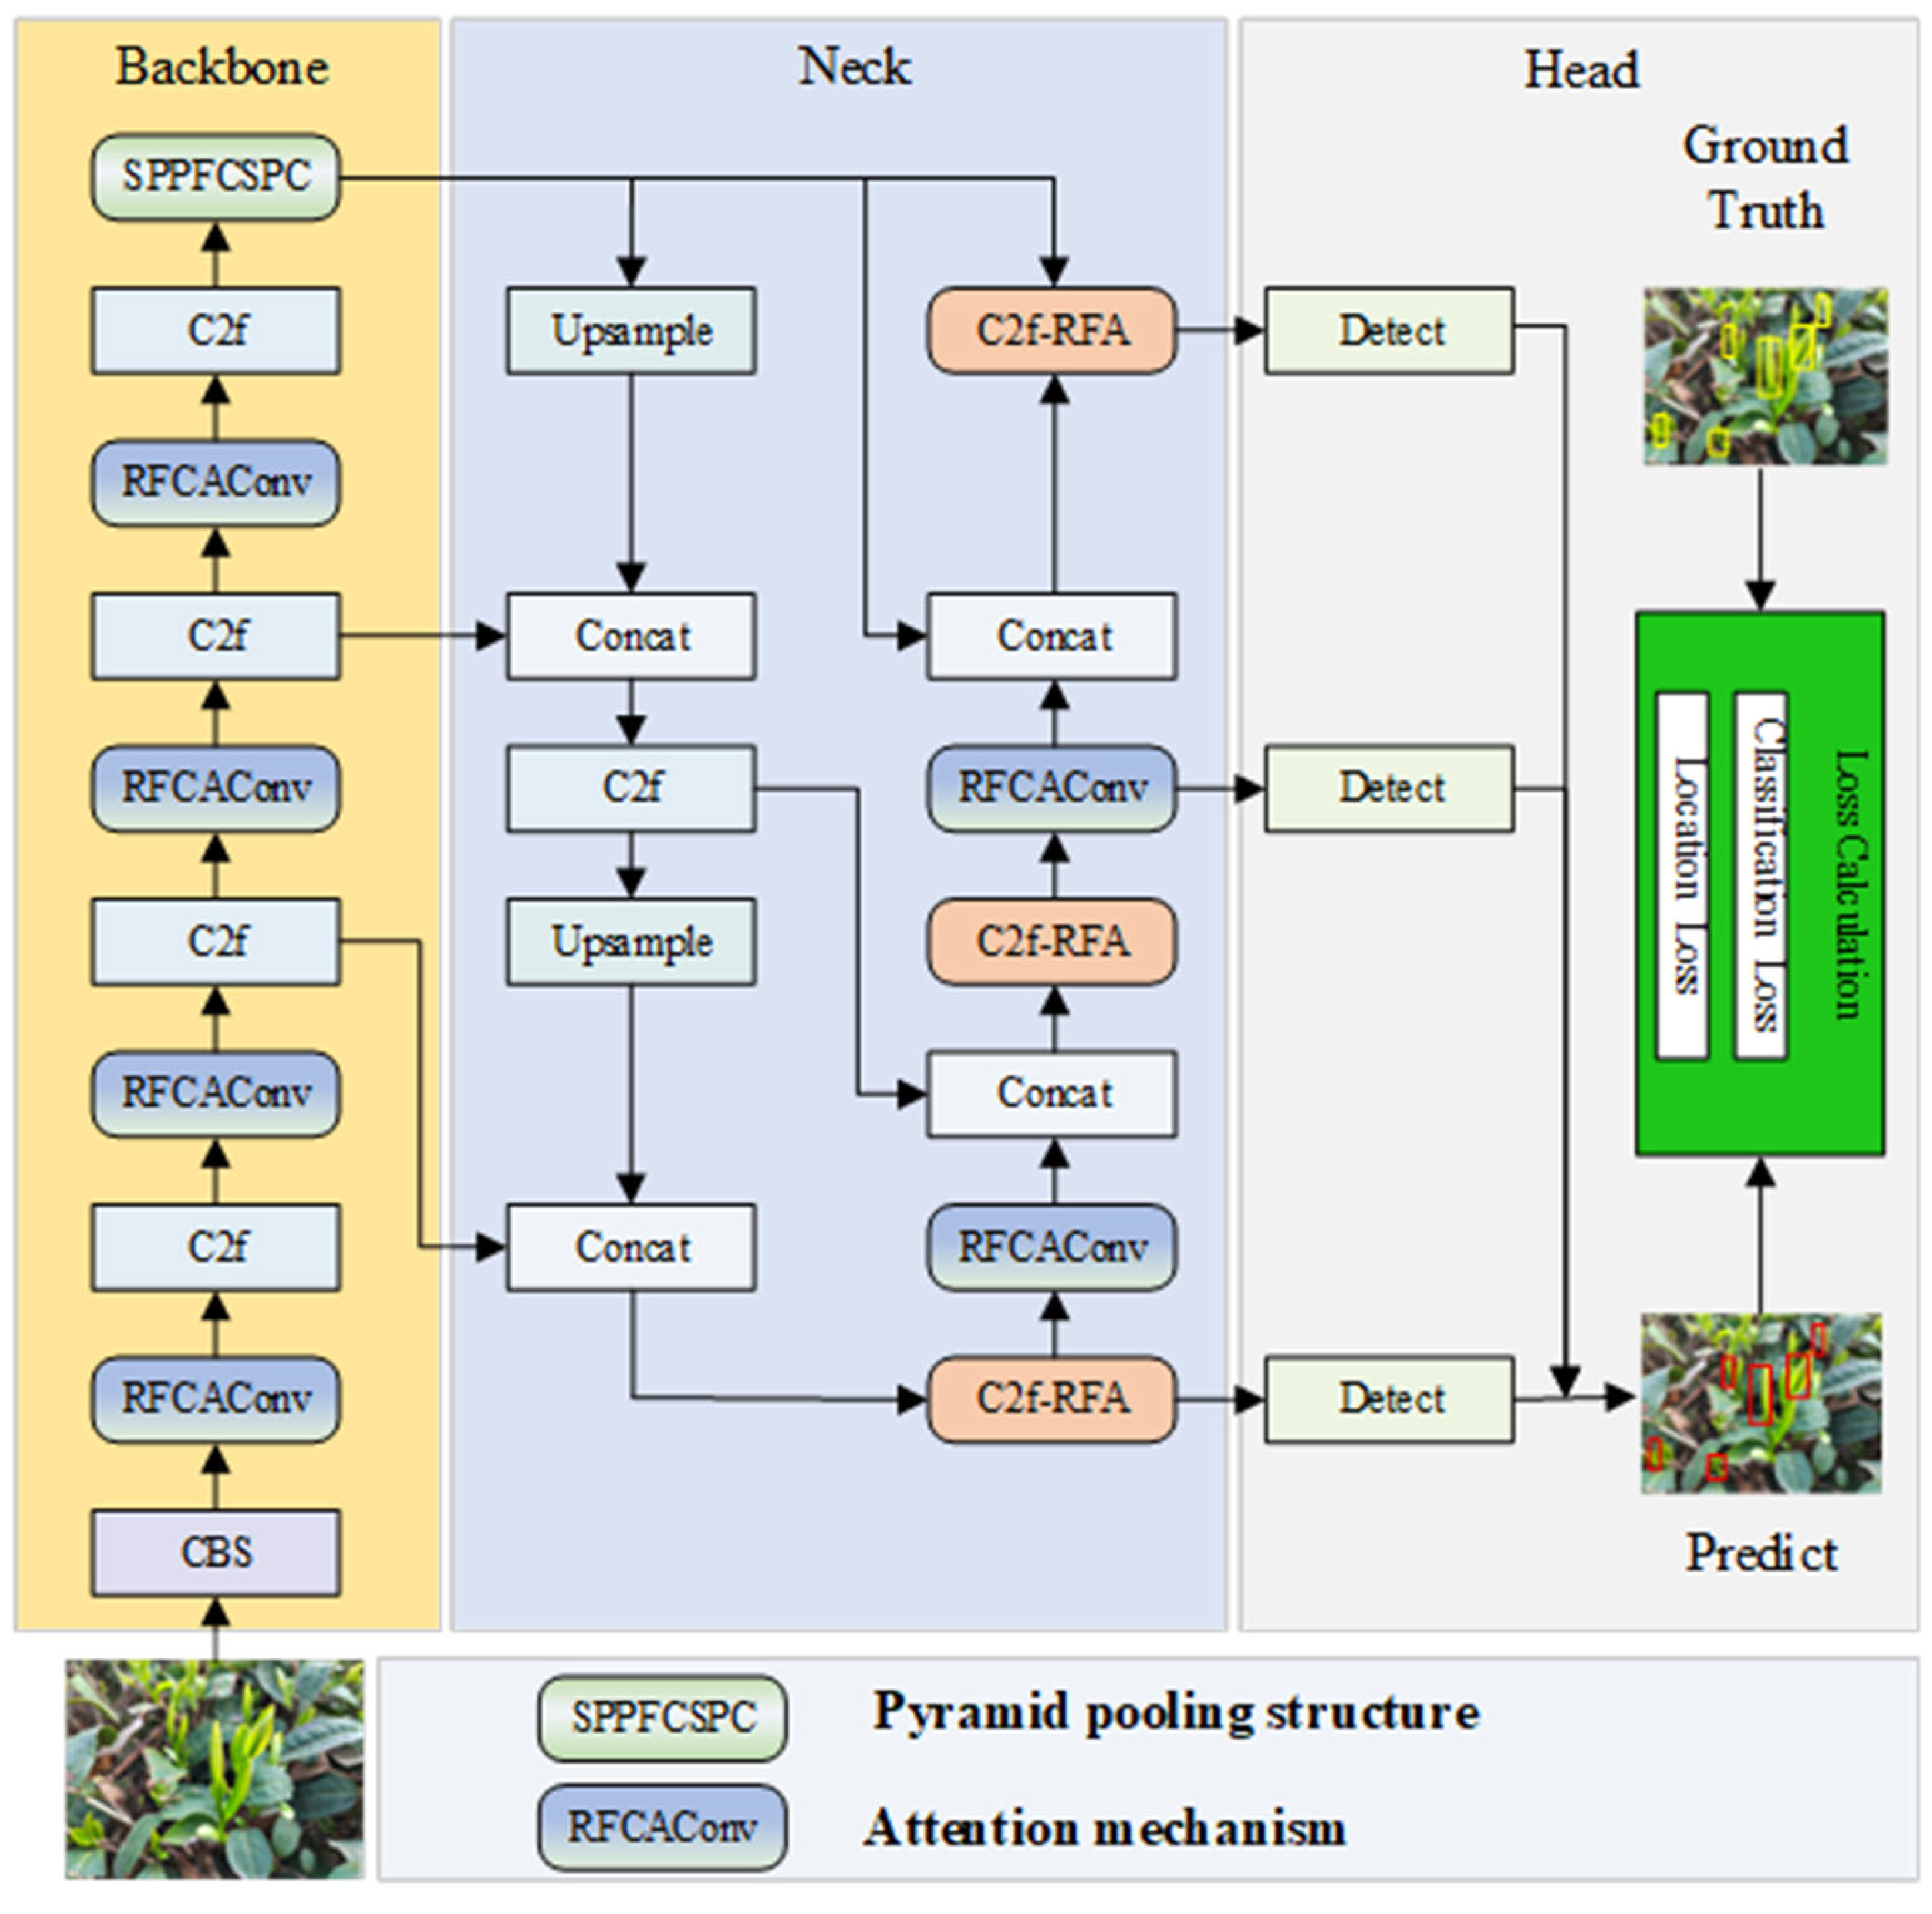
The overall architecture of RFA-YOLOv8 is illustrated in Figure 2. The architecture consists of three main components: the backbone feature extraction network, the neck feature fusion network, and the detection head. The backbone feature extraction network follows a structure similar to the CSPDarknet structure. The feature extraction capability of the network is enhanced by introducing the RFCAConv attention mechanism [52], which replaces the standard Conv module in YOLOv8 while retaining the same kernel size and channel dimensions, but incorporates grouped convolution and coordinate attention. The SPPFCSPC pyramid pooling structure is employed to improve the model’s detection accuracy for small targets; the neck feature fusion network adopts the PAN network structure, which combines the detailed location information from shallow features with high-level semantic information from deep features by integrating representations from multiple layers. This design enables effective detection of targets at different scales. Secondly, the original C2f bottleneck was modified into the C2f-RFA structure by replacing the second standard convolution layer with an RFAConv, thereby embedding receptive field attention into the feature aggregation process. The detection head adopts a decoupled head, responsible for decoding extracted features and predicting both category and location information of the output tea shoots. Finally, comparative experiments are conducted on the self-constructed dataset to verify the effectiveness and advancement of the proposed method.

3.2. RFCAConv Module

In this study, we propose an improved RFA-YOLOv8 feature extraction network. This design not only improves accuracy and enables the capture of richer feature details but also enhances robustness, allowing the network to handle complex scenes more effectively. The backbone’s feature extraction ability is further strengthened by replacing the standard convolutional downsampling with the RFCAConv module [52]. In addition, the SPPFCSPC structure replaces the original SPPF module, thereby enhancing multi-scale feature extraction and improving the model’s ability to perceive targets at different scales.

3.2.1. Parameter-Free Attention Module

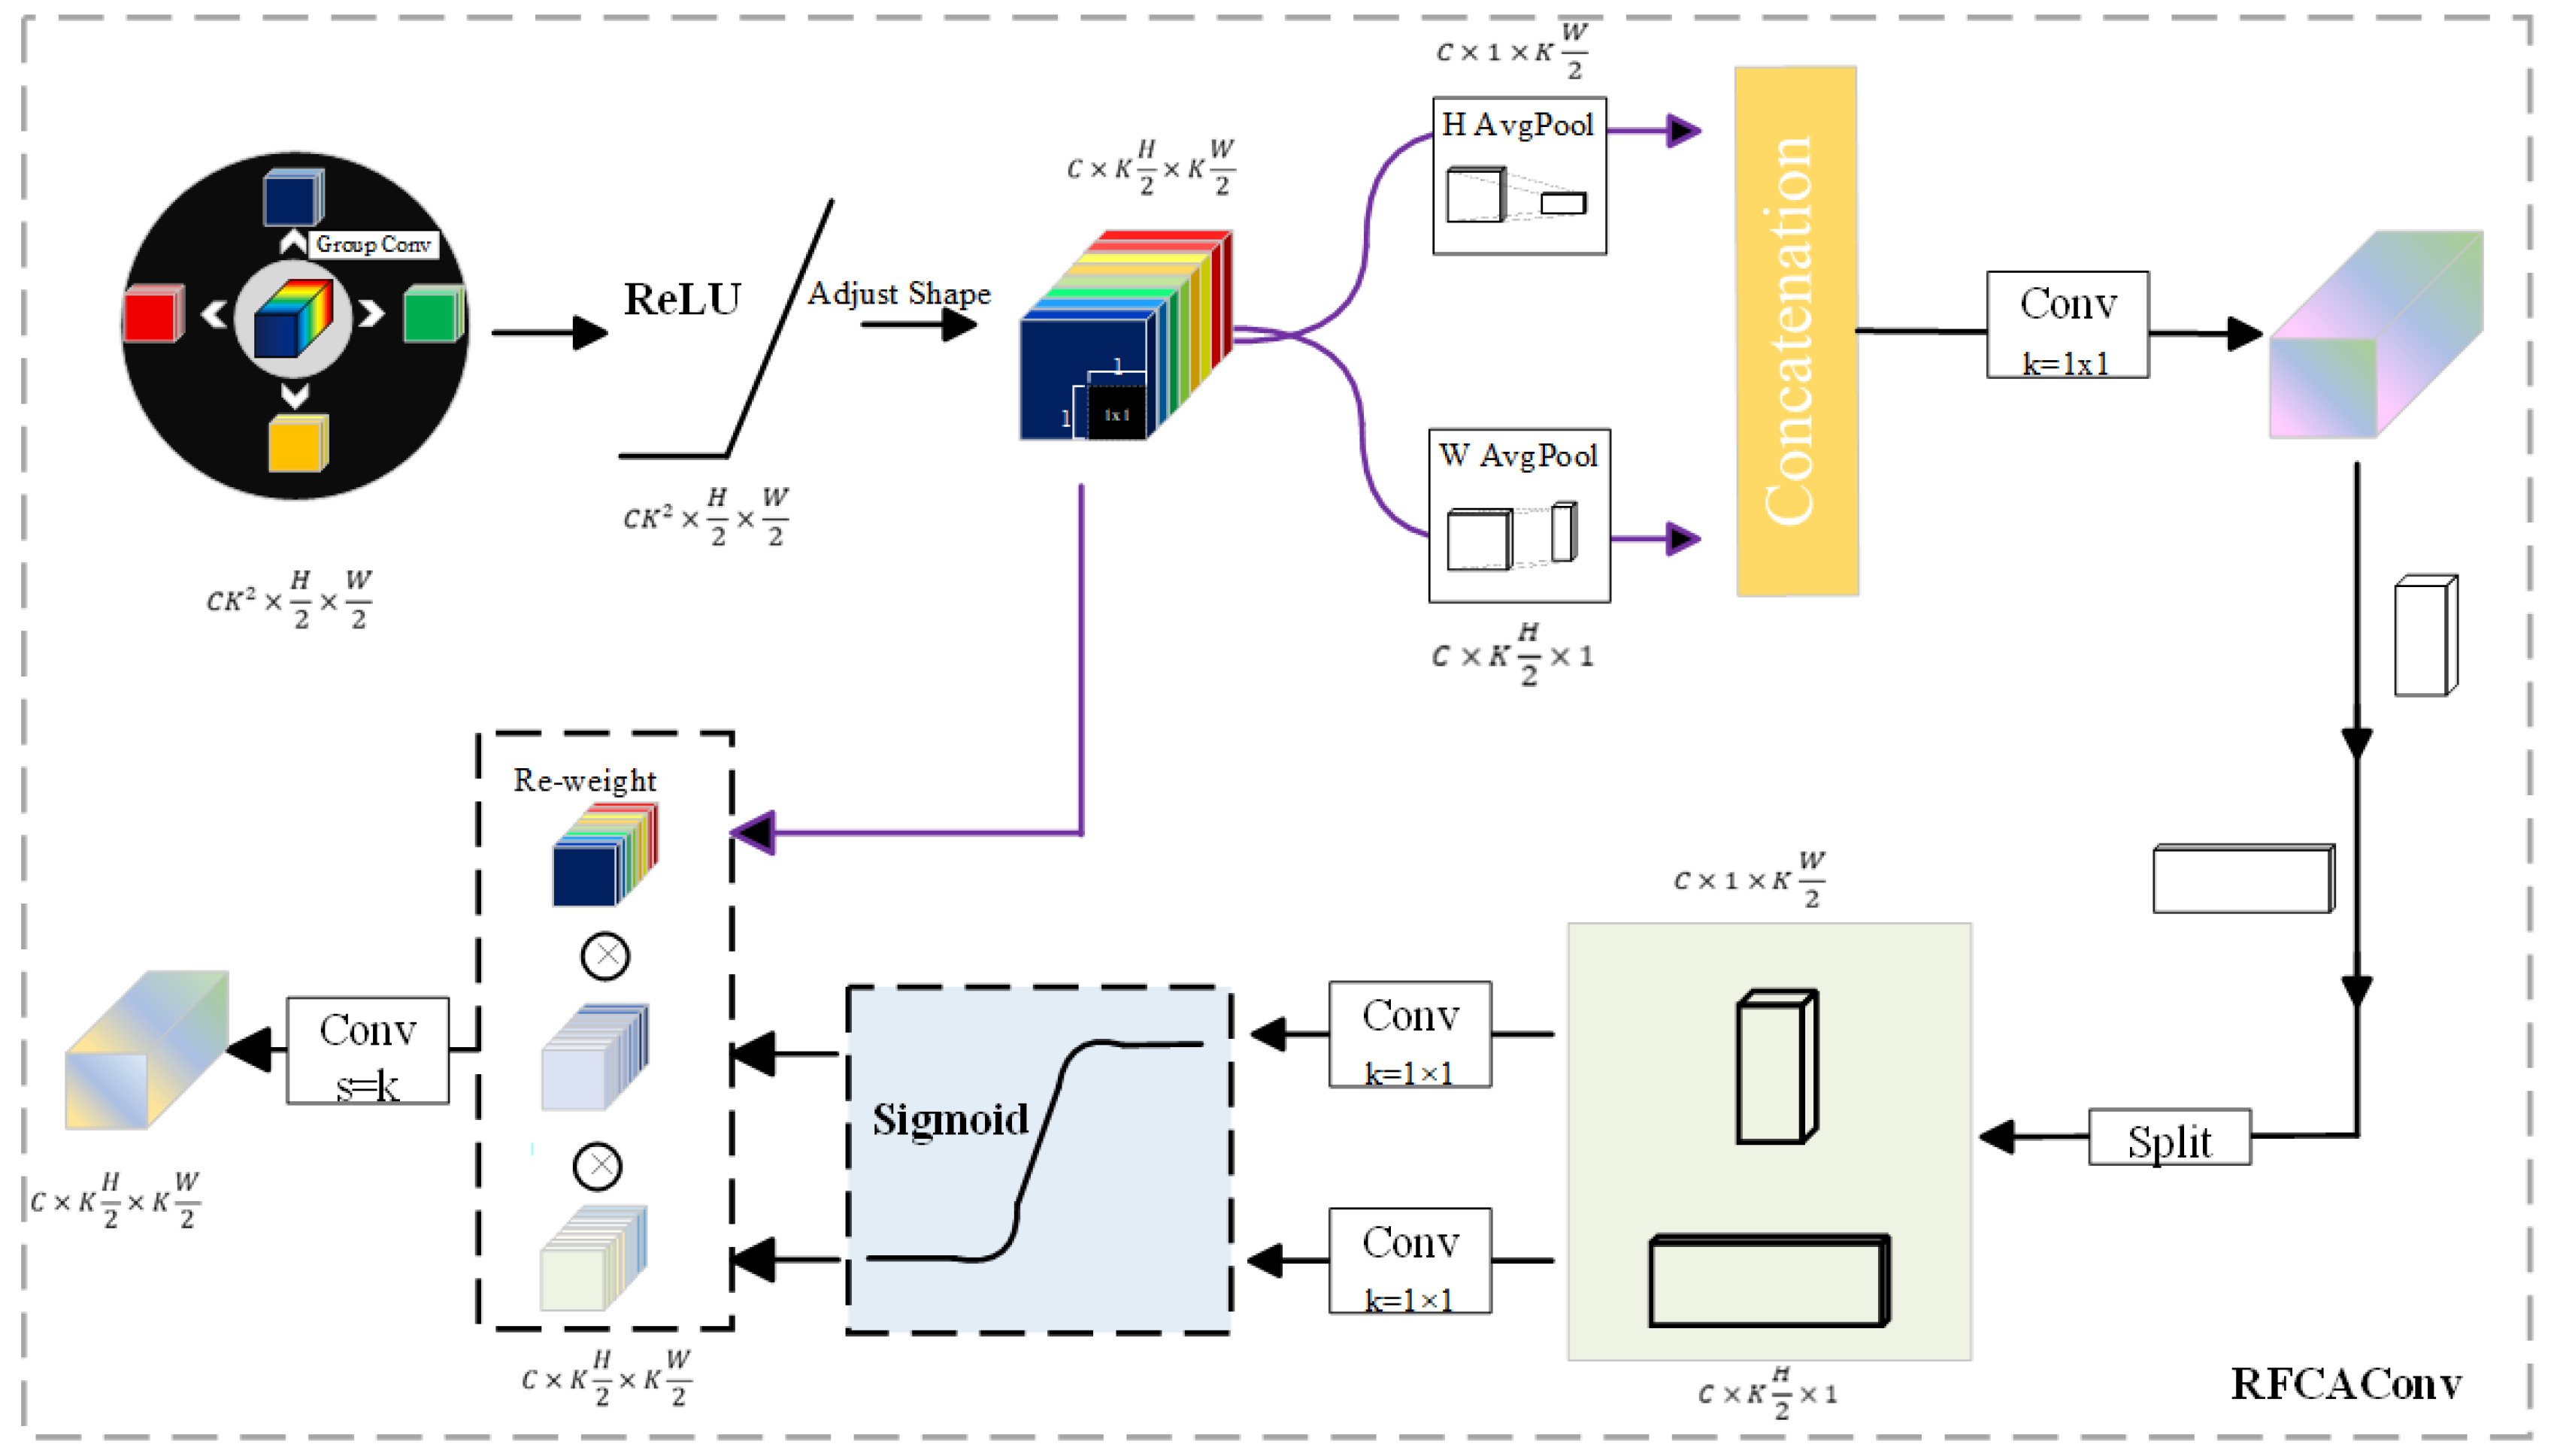
To address the issue that the convolutional downsampling process may cause the loss of detailed information in tea shoots, thereby reducing the accuracy of detection tasks requiring precise localization. In this study, the RFCAConv module is introduced to replace the convolutional downsampling, enabling feature attention weighting without parameter sharing. This design enhances the perception of feature importance at different locations, allowing the model to focus on key areas, suppress redundant background information, and improve feature extraction capability. The structure of the module is illustrated in Figure 3.
First, the channel dimension is upsampled, while the width and height dimensions are downsampled through group convolution, followed by batch normalization and activation. The number of channels in the feature map is adjusted to match the input feature map via parameter rearrangement, resulting in width and height dimensions of k/2 times the original, and k is the kernel size of the group convolution.
Subsequently, this feature map is fed into the CA (Coordinate attention) attention module [53]. As shown, to avoid compressing all spatial information into the channel dimension and to enable long-range spatial interaction with precise location information, the global average pooling is decomposed into horizontal and vertical directions, as computed in the following equation:
z c h h = 1 W 0 i W x c ( h ,   i ) ,   z c w w = 1 H 0 j H x c ( j ,   w )
where W and H denote the width and height of the input feature map z c h h represents the mean value of all elements in row h on the cth channel, and z c h h represents the mean value of all elements in column w on the cth channel.
Immediately after that, z h and z w represent the channel dimensions. Channel degradation and activation operations are performed after 1 × 1 convolutional layers, as calculated as in the equation below:
f = δ ( C 1 × 1 z h , z w )
where f is the output feature, δ is the activation function, and C 1 × 1 denotes the 1 × 1 convolution operation.
Along the spatial dimension, the feature f is again divided into f h and f w , each upscaled using a 1 × 1 convolution and combined with the sigmoid activation function to obtain the final attention vectors g h and g w , as shown in the equation below.
g h = σ ( C h 1 × 1 f h ) , g w = σ ( C w 1 × 1 f w )
Subsequently, the attention weights g h and g w  are multiplied channel-by-channel with the input feature map as shown in Equation (4). In addition, because the CA attention mechanism includes channel attention similar to the SE attention mechanism, RFCAConv also implements channel-wise attention weighting of the feature map.
f c i , j = x c ( i , j ) × g c h ( i ) × g c w ( j )
Finally, the RFCAConv attention module, with no overlapping regions and no parameter sharing, is realized by passing the CA-weighted feature maps into a convolutional layer with kernel size of k × k and stride k as well, as shown in the equation.
X = C o n v ( M A C A d j u s t ( R e L U ( N o r m ( g ( X ) ) ) ) )
where g is a grouped convolution with kernel size k × k and stride 2, Norm denotes normalization, X is the input feature, A d j u s t represents parameter rearrangement to modify the shape of the feature map, M A C is the weight parameter of the CA attention mechanism, and Conv denotes a convolutional layer with kernel size k × k and stride k.

3.2.2. SPPFCSPC Module

To address the problem of scale variation—where small tea shoots are often missed—we adopt the SPPFCSPC module [53], which combines the SPPF module and the CSPNet modules to reduce gradient redundancy, improve gradient flow, and enhance the model’s capacity for multi-scale feature extraction.
The SPPF is a multi-scale feature extraction module in the original YOLOv8. Its serial pooling structure avoids redundant computation while capturing multi-scale information. However, each pooling step discards pixel-level details, and successive pooling operations may over-compress fine-grained features. This compression may eliminate information critical for detecting small targets, thereby reducing accuracy in small-tea-shoot detection [54].
Therefore, this study adopts the SPPFCSPC module, which integrates a CSP structure into the SPPF module, as shown in Figure 4. On top of the original structure, a 3 × 3 convolutional layer is added at both the front and back ends to enhance feature extraction capability, while cross-stage feature interactions are introduced through a branch [55]. This design preserves more fine-grained details and improves multi-scale feature representation, thereby enhancing the detection of small targets.

3.3. C2f-RFA Module

Feature fusion networks enhance the adaptability of detection algorithms in complex scenes by integrating features across different layers [54]. In this study, we adopt a PAN structure, which extends the classical FPN by enabling bidirectional cross-layer information flow. Specifically, PAN provides a top-down path for semantic enhancement and a bottom-up path for detail compensation, which together strengthen multi-scale feature representation. This bidirectional establishes a dynamic balance between geometric details and semantic discriminative properties, significantly enhancing the model’s robustness in detecting multi-scale targets.
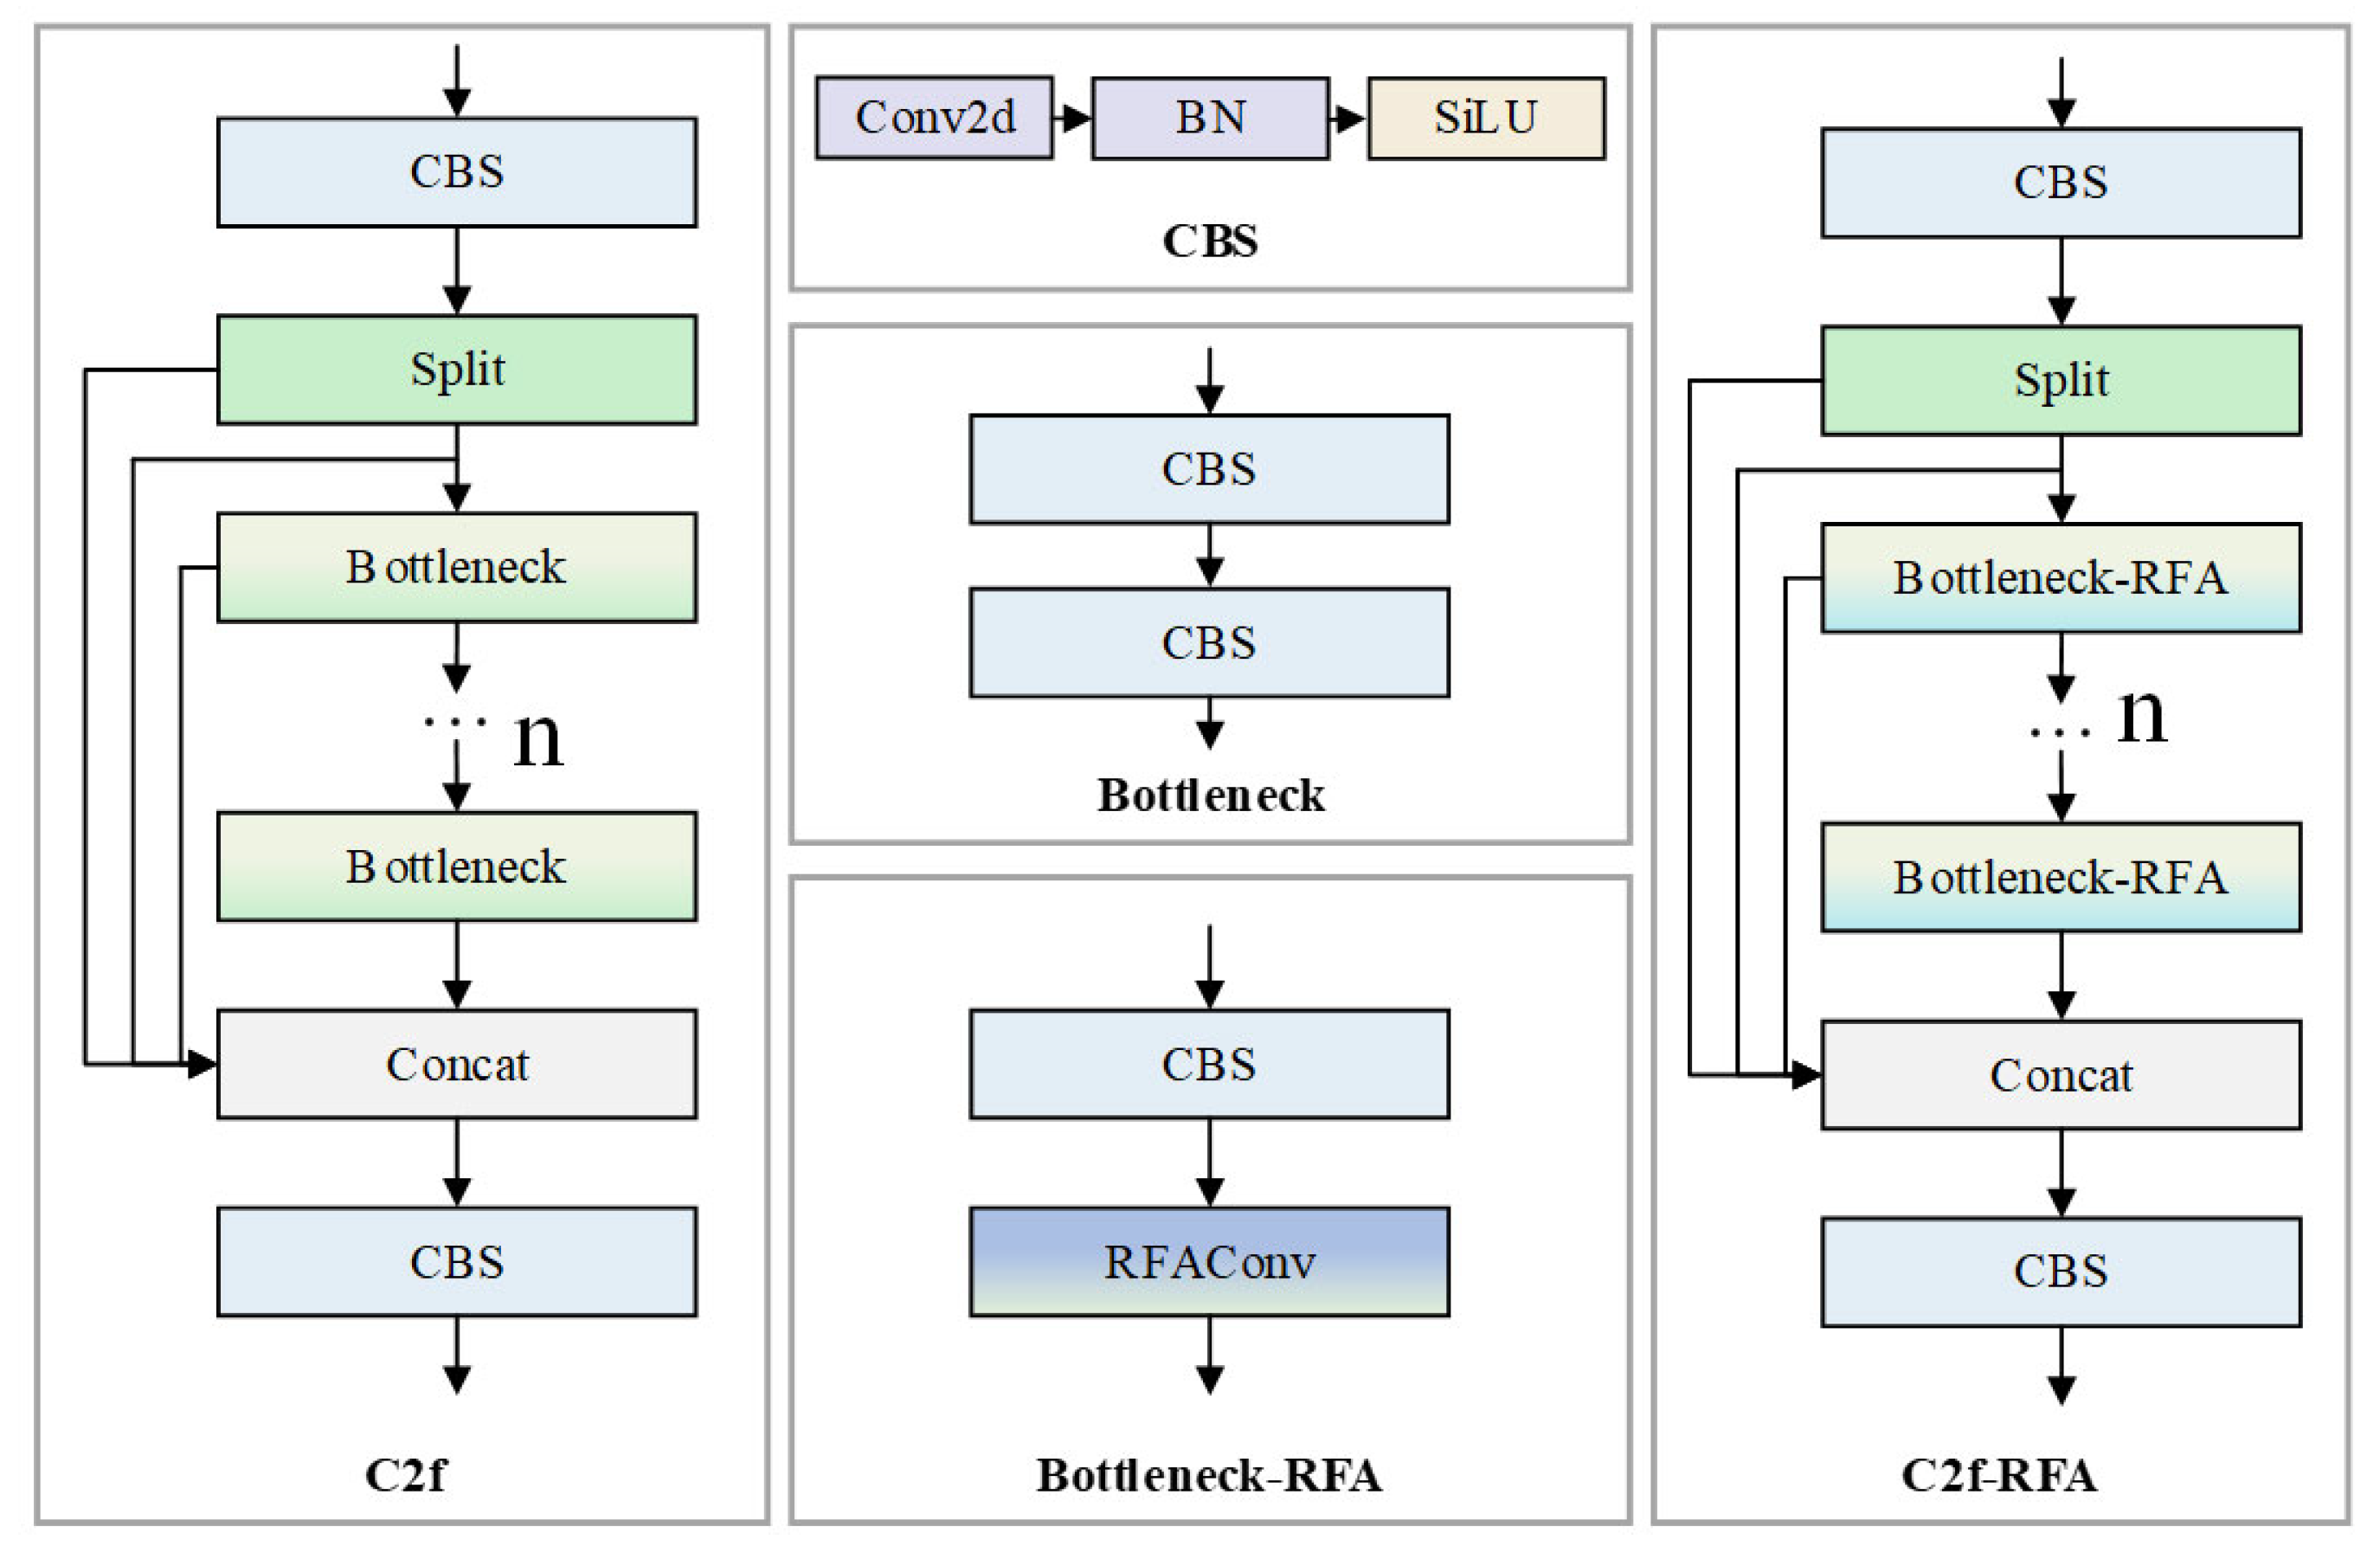
In the model’s neck feature fusion network, the original design employs the C2f module as the input for the three output layers of the detection head. This module is designed to improve information flow and gradient transfer efficiency by splitting the input features into multiple paths and performing feature extraction and fusion in separate branches (as illustrated in the left panel of Figure 5). However, the Bottleneck structure at the core of the module is designed in the neck network without jump connections, effectively stacking multiple 3 × 3 convolutional layers in succession. This design suffers from a critical drawback: parameter sharing across successive convolutions reduces spatial position sensitivity, which degrades the detection head’s classification and localization accuracy.
To incorporate receptive-field attention and suppress redundant information, we replace the latter standard convolution in the Bottleneck with RFAConv, forming the C2f-RFA module, as shown in Figure 5. This design leverages receptive-field attention to further suppress redundancy and enhance the model’s feature representation ability.
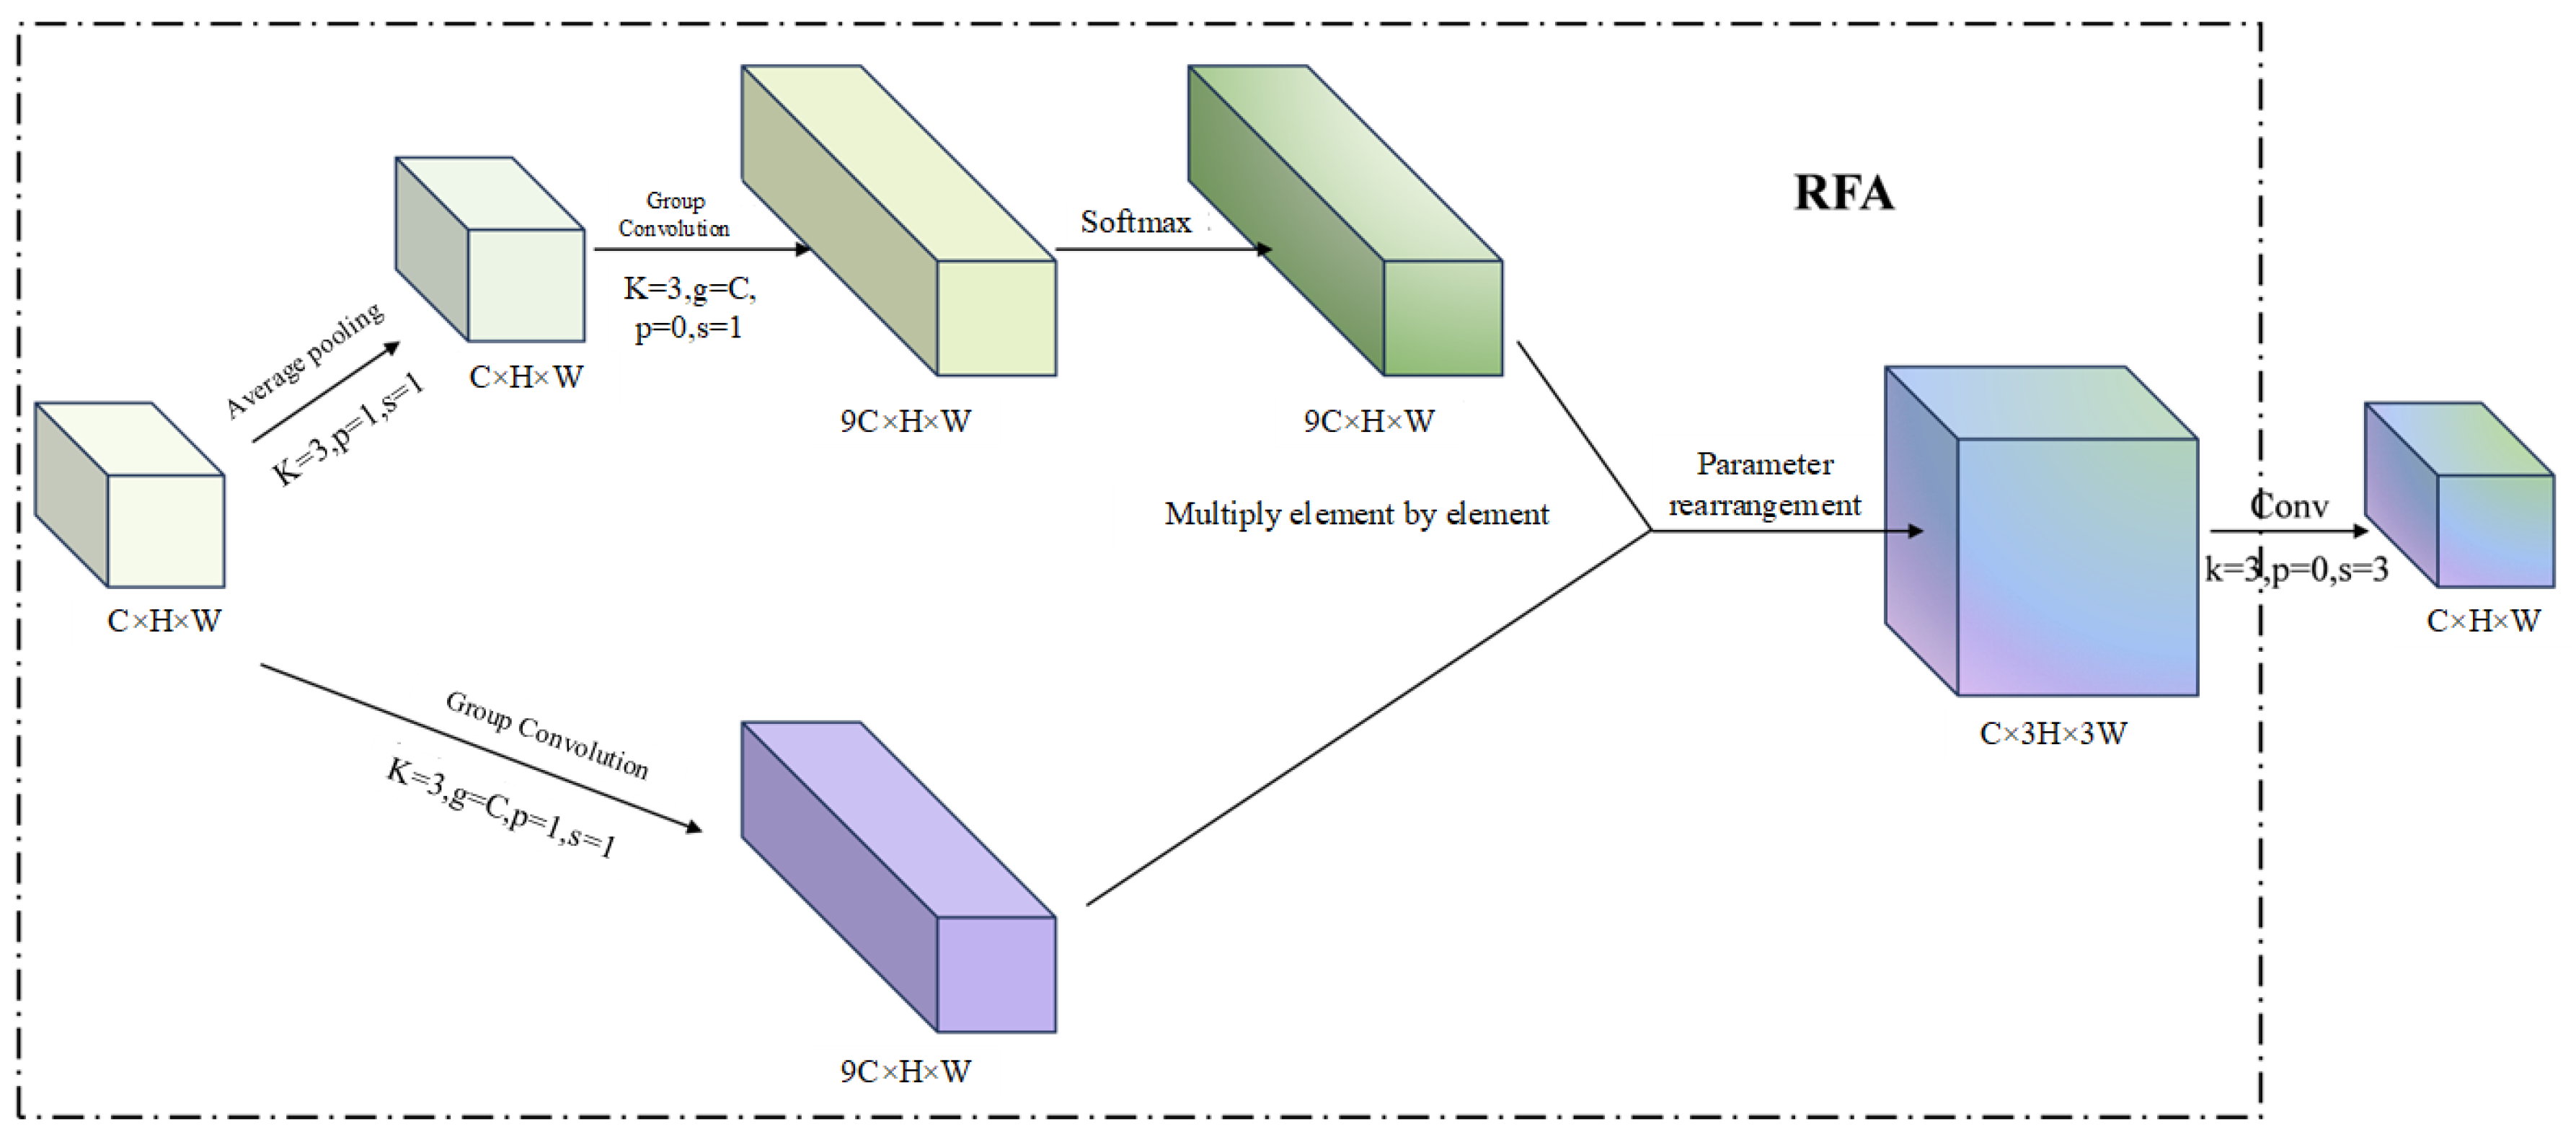
Specifically, the RFCAConv module enhances features through a dual-branch design. Spatial attention weights are computed along the spatial dimension and normalized with Softmax, amplifying important positions while suppressing background responses. The resulting attention map is replicated to match the feature map’s channel dimension and applied via element-wise multiplication for attention weighting. Inter-group information exchange is enabled by adjusting tensor dimensions and rearranging channels, preventing group isolation caused by grouped convolution. Spatial attention is further refined through global average pooling, which reduces redundant information. Spatial-position insensitivity, caused by shared convolutional kernels, is addressed by partitioning non-overlapping receptive fields. Integrating this module enables the network to capture finer details and refine feature representations, thereby providing more accurate semantic and spatial cues for subsequent detection head predictions.
To further clarify the design, the detailed structure of the RFAConv module is illustrated in Figure 6. The module adopts a dual-branch mechanism: one branch generates spatial attention weights via Softmax normalization, which are expanded to match the number of input channels and applied through element-wise multiplication; the other branch facilitates inter-group information flow by adjusting dimensions and rearranging channels, thereby mitigating the isolation problem inherent in group convolution. Global average pooling is applied to suppress redundant information, while non-overlapping receptive field partitioning mitigates the spatial insensitivity issue inherent in standard convolution kernels. Through this design, RFAConv enhances the network’s capacity to capture fine-grained details and yields more accurate semantic and spatial representations for subsequent detection tasks.

3.4. Decoupled Detection Head with EIoU Loss Function

3.4.1. Decoupling Detection Heads

Traditional detection models often employ coupled heads, where a shared set of convolutional layers is used for both classification and regression. However, this design can cause task conflicts because classification and regression have different optimization objectives. To address this issue, we adopt a decoupled detection head. In this structure, two independent sub-networks are used: one for classification and the other for bounding box regression, as illustrated in Figure 7. By separating the tasks, the classification branch focuses solely on semantic discrimination, while the regression branch emphasizes precise localization. This separation improves both classification accuracy and bounding box precision, with particularly significant gains in small-target detection. Furthermore, the decoupled head design enhances the model’s adaptability across different datasets, reduces overfitting, and improves generalization performance.

3.4.2. EIoU Loss Function

In this study, the optimization analysis is conducted for the bounding box regression loss function in the target detection model. In the YOLOv8 benchmark model, the original framework employs CIoU as the regression loss function. CIoU is an improved loss function derived from DIoU. Although DIoU improves convergence efficiency by introducing a center point distance constraint, it considers only the geometric center distance and overlapping region, while neglecting the width and height of the bounding box. To address this limitation, CIoU introduces the aspect ratio parameter as an independent penalty factor in the penalty term and defines the aspect ratio loss term as follows:
L a s p e c t = 4 π 2 ( a r c t a n w g t h g t a r c t a n w h ) 2
This mechanism enhances the regression speed and accuracy of the bounding box, enabling the width-to-height ratio of the predicted box quickly approach that of the real box. However, when the predicted box has the same aspect ratio as the real frame, the penalty term of Equation (6) degenerates to zero. This results in a wide-height gradient coupling problem, where the gradients of the wide and height parameters during backpropagation constrain each other, reducing the efficiency of parameter updates.
To address the above theoretical shortcomings, this study adopts EIoU as an alternative. The core innovation of EIoU is to decouple the aspect ratio parameter and directly regress to the width and height of the bounding box rather than the width-to-height ratio. The EIoU loss function consists of three components: the L_IoU overlap loss, the L_dis centroidal distance loss, and the L_asp width-to-height loss:
I o U = A a r e a B a r e a A a r e a B a r e a L E I o U = L I o U + L d i s + L a s p = 1 I o U + ρ 2 b , b g t w c 2 + h c 2 + ρ 2 w , w g t w c 2 + ρ 2 h , h g t h c 2
where A a r e a denotes the area of the prediction box and B a r e a the area of the target box; b and b g t  are the centers of the prediction box and the target box; w, w g t are the widths of the prediction box and the target box; h, h g t are the heights of the prediction box and the target box; ρ denotes the Euclidean distance between the two is computed; and w c , h c cover the widths and heights of the smallest outer rectangle boxes of the target box and the prediction box.
This decoupling design eliminates gradient coupling between width and height parameters. It also maintains effective constraints under arbitrary aspect ratios, enabling faster convergence and more accurate bounding box localization.
To further validate the theoretical advantages of EIoU, Figure 8 shows the training convergence curves of bounding box regression loss for both CIoU and EIoU. It is evident that optimization with EIoU achieves a more rapid decline in loss values during the early training phase, indicating improved convergence efficiency. This improvement can be primarily attributed to the decoupling of width and height parameters, which resolves the gradient coupling problem inherent in CIoU. Furthermore, EIoU consistently maintains lower loss values throughout training, demonstrating superior capability in capturing the geometric properties of ground-truth bounding boxes.
The enhanced stability of EIoU mitigates oscillations in regression accuracy that occur in CIoU when predicted and ground-truth boxes have similar aspect ratios. This stability enables the model to consistently refine bounding box localization, ultimately improving detection precision in complex scenarios such as varying illumination and partial occlusion of tea buds. These findings demonstrate that EIoU not only offers a more theoretically robust formulation but also provides practical advantages in enhancing the robustness and accuracy of the proposed detection model.

4. Experiments

4.1. Datasets and Evaluation Metrics

Currently, there are many large public datasets in the field of target detection, such as Pascal VOC and COCO, which have significantly contributed to the advancement and innovation of target detection technologies. However, these public datasets do not contain images or categories of tea shoots, and no publicly available dataset exists for tea shoot detection. Therefore, constructing a tea shoot detection dataset in natural scenes is the primary prerequisite for developing a high-precision tea shoot detection model.
The tea shoot image data used in this study were captured in standardized tea gardens in Nanjing and Yangzhou, and all belonging to the Longjing 43 cultivar. Longjing 43 is a nationally registered elite cultivar that is widely cultivated in Zhejiang and other regions, and therefore exhibits strong industrial representativeness. Moreover, its phenotypic traits (small bud size, dense distribution, and high color similarity to background leaves) directly correspond to the challenges of small object detection, high density, and color similarity, making it both a reasonable and challenging choice for this research. The image acquisition time spanned from early March to late May 2025. HUAWEI Mate 60 Pro(Huawei Technologies Co., Ltd., Shenzhen, China), Canon EOS M200 (Canon Inc., Tokyo, Japan), and iPhone 13 Pro (Apple Inc., Cupertino, CA, USA) were employed to capture 1892 images in different tea gardens, taking into account the growing environment of tea shoots and the application scenarios of intelligent picking equipment. Through data cleansing, the images that are blurred, heavily occluded, and without tea shoot targets due to jitter, angle, and other factors during the shooting process were removed. Finally, 1667 high-quality tea shoot images were retained for subsequent dataset production and algorithm model training and validation. The images of tea shoots in various natural environments are presented in Figure 9.
Data annotation is the process of identifying the target box location and category information according to the original image using specialized software to output the corresponding label files, which is a key step in the production of a dataset, and the quality of annotation directly affects the training and learning of the model, as well as the testing and evaluation. In this study, LabelImg version 1.8.6 software was used to manually annotate the selected 1667 images to ensure the label quality of the dataset. Since the standard of famous tea picking is mainly based on one bud and one leaf, in order to adapt to the actual demand, this study used one bud and one leaf as the main research object to be labeled, and the name of the label category is TEA.
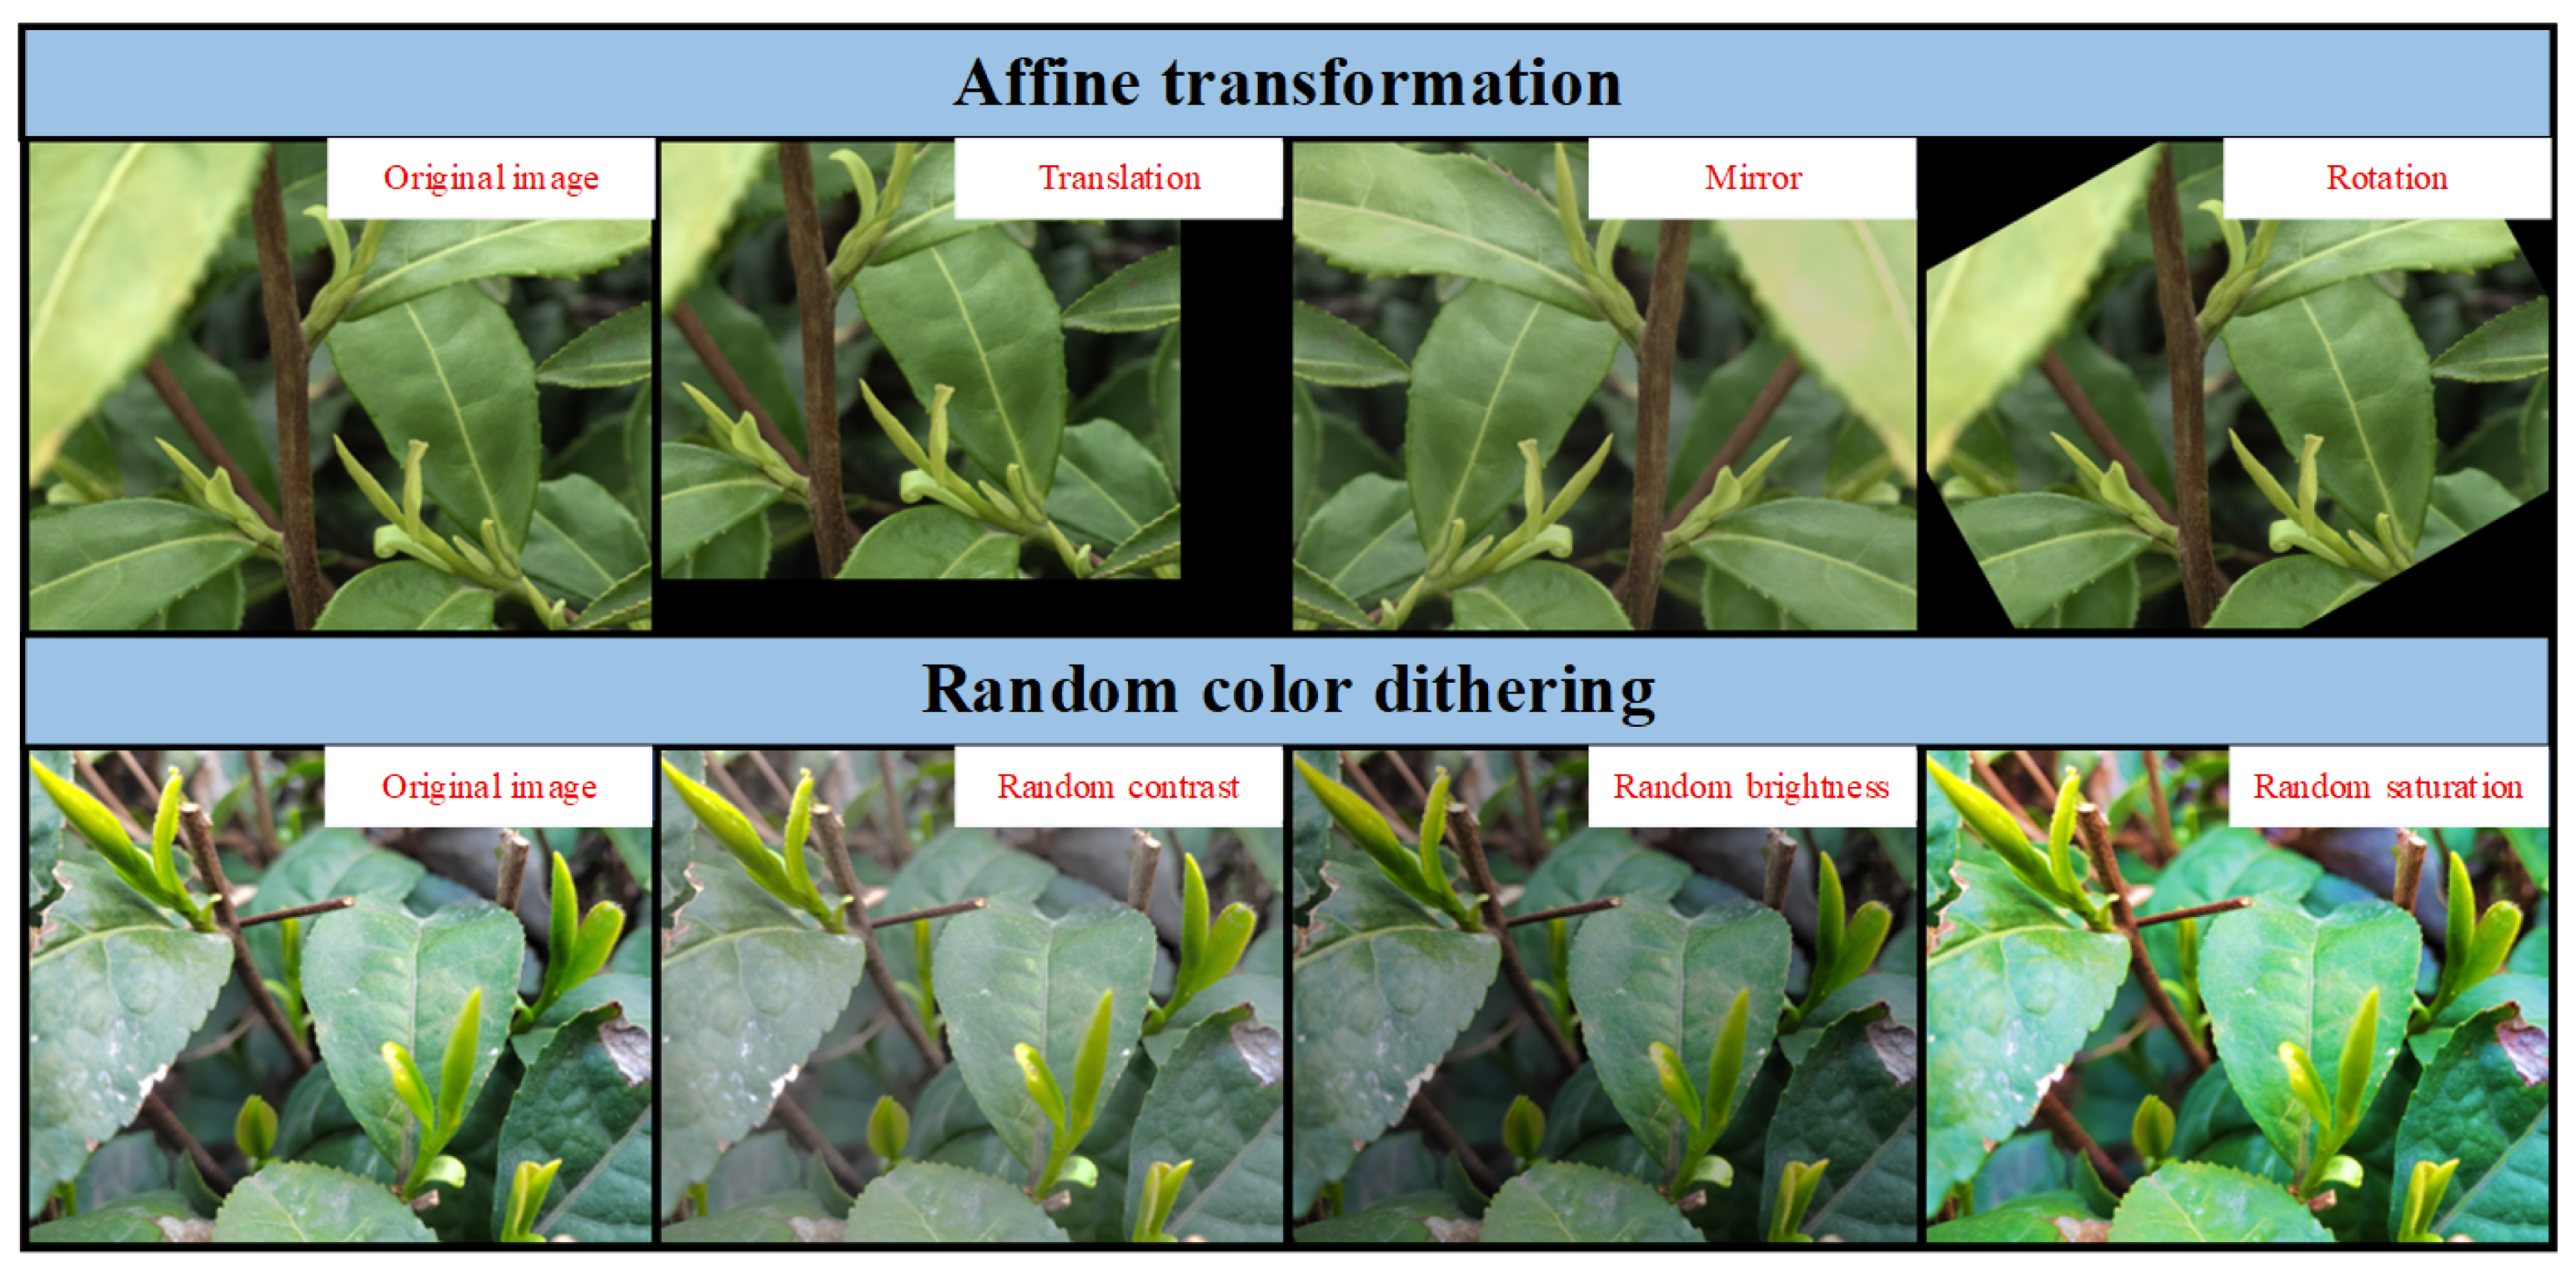
The complexity of the tea garden environment further increases the difficulty of collecting the dataset; different tea garden sites, shooting angles, and lighting conditions, and other factors will have a certain impact on the training results of the model, and the collected image data often fail to cover all the variations in the actual scene. Therefore, data enhancement techniques have become a common means to solve this problem. Different shooting angles and lighting conditions were simulated by affine transformation and color transformation, thus expanding the dataset so that the model can learn more useful features. This method can effectively prevent overfitting during model training and also improve the robustness of the model so that it can maintain a stable detection performance in the actual complex environment. As shown in Figure 10, the dataset was first divided into training, validation, and testing sets according to an 8:1:1 ratio. Data augmentation methods such as panning, rotating, and random color dithering were then applied only to the training set, expanding it by approximately six times, resulting in a total of 9665 labeled training images. This ensures that the validation and testing sets remain independent and free from data leakage.
In order to evaluate the performance of a target detection model, several aspects such as detection accuracy, detection speed, computational efficiency, and model complexity must be considered. In this study, Precision (P), Recall (R), mean Average Precision (mAP), Parameters, FLOPs, and FPS were used as the reference indicators to evaluate the improved model. Among them, the precision P, recall R, and mean average precision value mAP were calculated as shown in Equations (8) and (9):
P = T P T P + F P × 100 % , R = T P T P + F N × 100 %
m A P = i = 1 N 0 1 p R d R N × 100 %

4.2. Experimental Environment and Training Parameter Settings

In this study, to ensure the objectivity of the algorithm performance evaluation, the experimental training parameters were strictly standardized. The input image data were uniformly standardized to 640 × 640 pixels, and the model size was set to m. The optimizer was configured to use the stochastic gradient descent algorithm (SGD) with an initial learning rate of 0.01 and a cyclic learning rate of 0.01, for a total of 300 training epochs. The Experimental environment and configuration are presented in Table 1.

4.3. Ablation Experiment

First, we evaluated the impact of data augmentation methods on detection accuracy. The original tea shoot dataset and the enhanced dataset were separately used for model training and validation, and the experimental results are presented in Table 2.
Comparative analysis of the experimental data shows that the tea shoot dataset with data augmentation significantly contributes to improving model performance. As shown in Table 2, the detection model trained on the enhanced dataset achieved improvements of mAP@0.5 by 0.8% and mAP@0.5:0.95 by 1.1%. The combined augmentation strategy of stochastic affine transformation and color dithering effectively enriches the spatial distribution of morphological and phenological features in the tea shoot dataset. This enrichment allows the model to acquire more robust feature representations during training [55,56].
To further verify the impact of each improvement strategy on the detection effect, the YOLOv8m model trained with the data-enhanced dataset was used as the baseline, and the experimental results are presented in Table 3, where Model A, Model B, Model C and Model D are the results of the RFCAConv Module, SPPFCSPC module, C2f-RFA module, and EIoU mechanism are introduced to the base model.
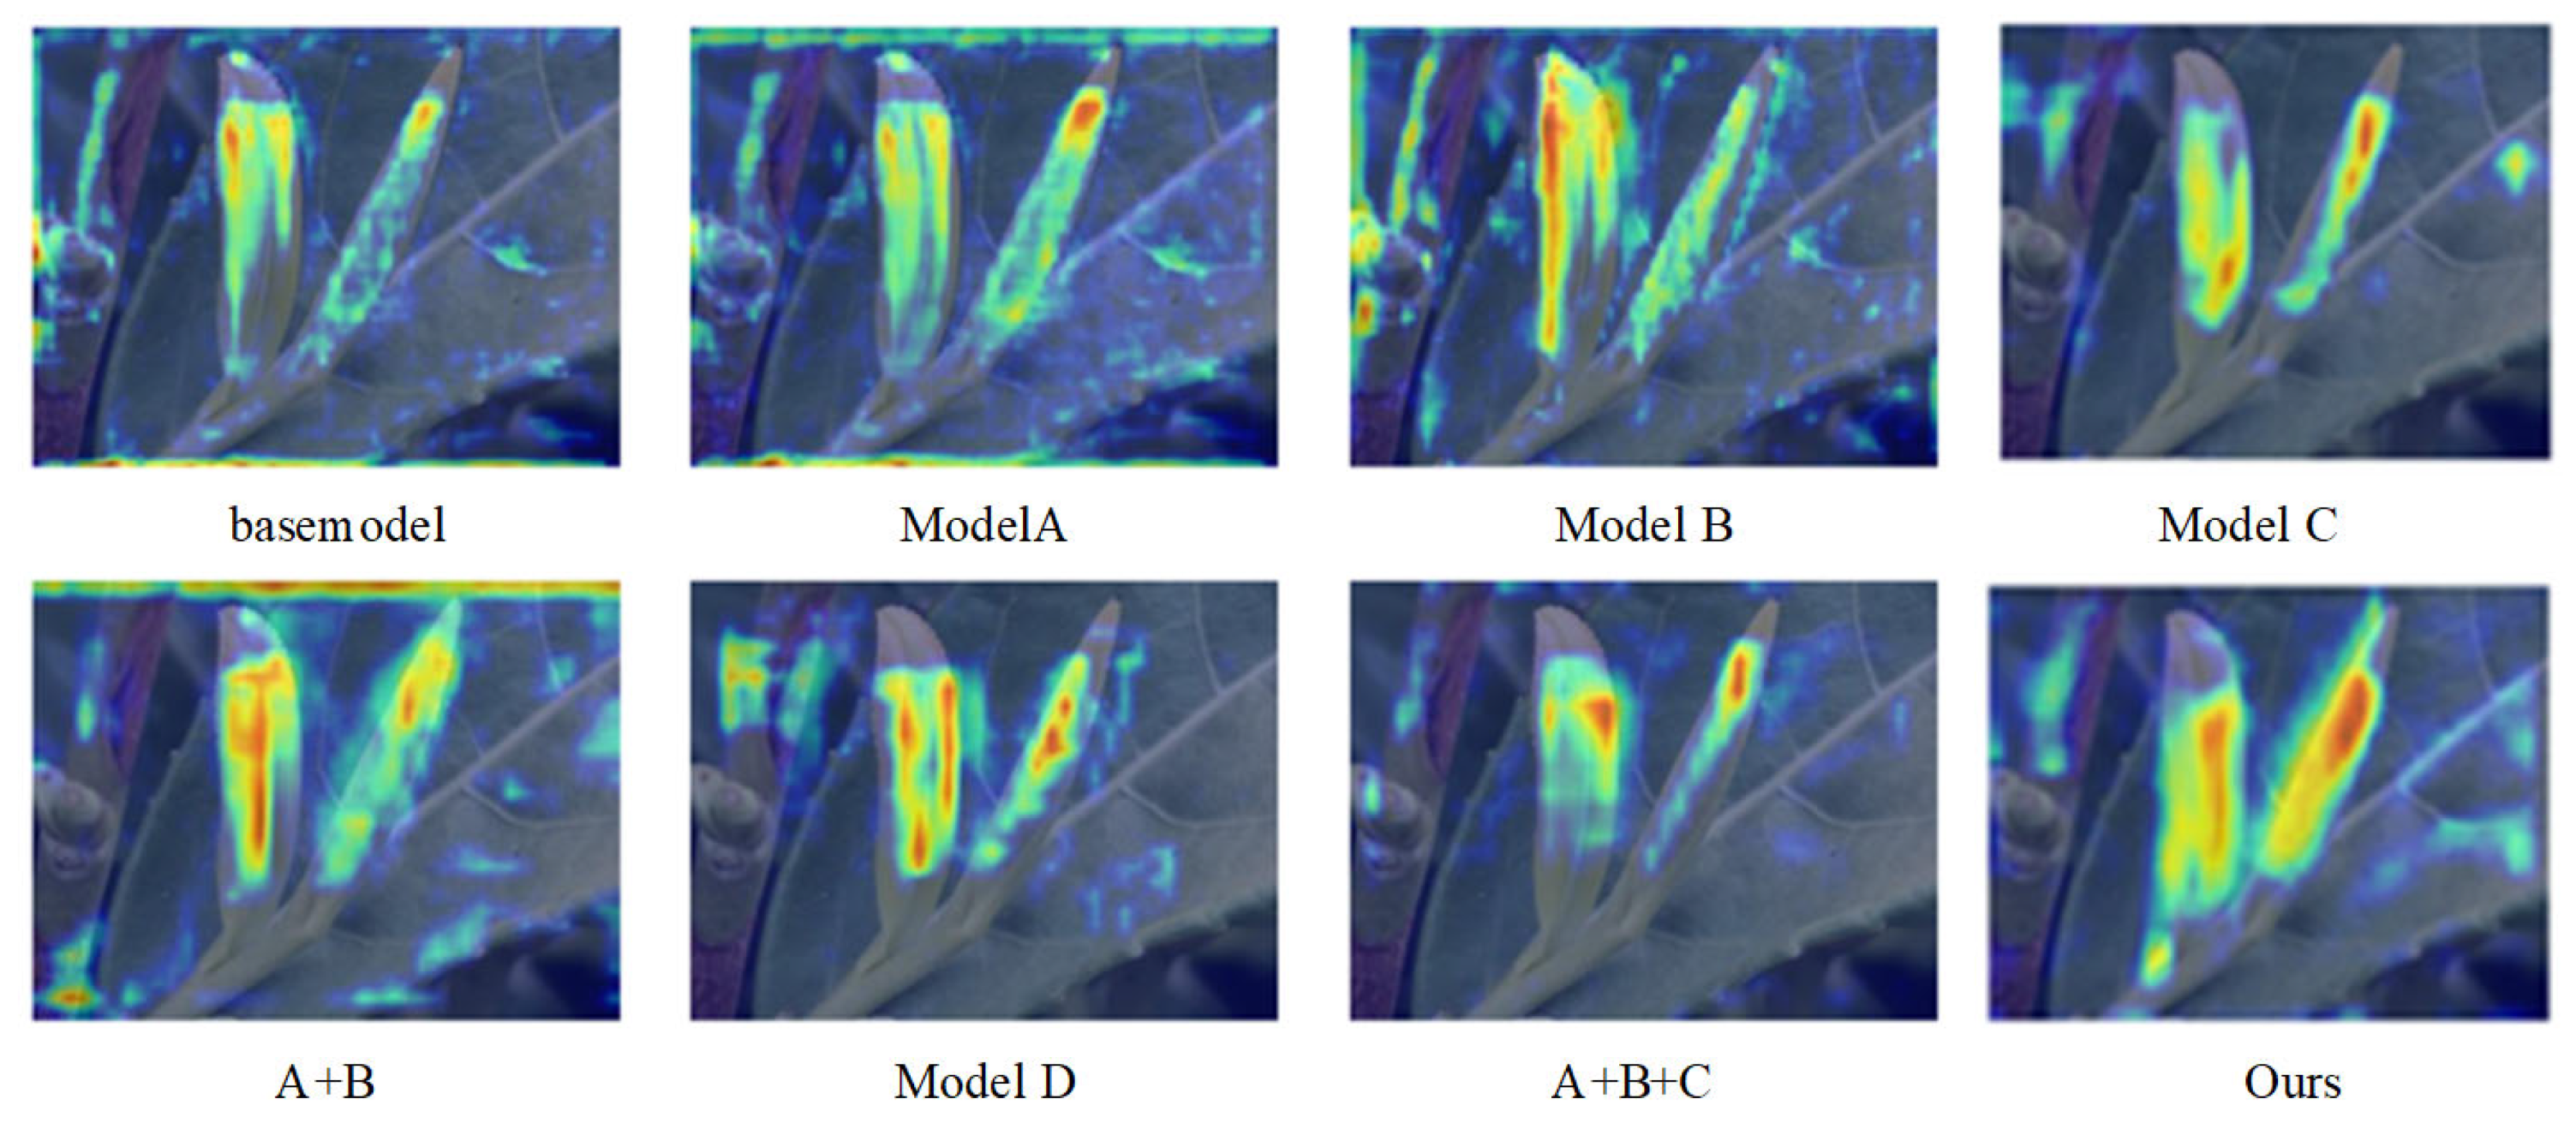
As can be seen from Table 3, by introducing the RFCAConv Attention Convolution module, the model improved 1.4% and 1.2% in precision P and recall R, respectively, compared with the base model, which effectively enhances the ability of the feature extraction network, and 1.2% and 2.4% in mAP@0.5 and mAP@0.5:0.95, respectively, corresponding to the heat map visualization The results are shown in Figure 11 (Model A); the SPPFCSPC module further enhanced multi-scale feature extraction, improved small target detection, and increased recall by 2.5% compared with the baseline (Figure 11, Model B); the C2f-RFA module substantially enhanced spatial sensitivity, improving precision by 3.9% compared with the baseline. Although semantic feature expression was slightly reduced, overall performance increased by 0.4% in mAP@0.5 and 1.3% in mAP@0.5:0.95 (Figure 11, Model C). The corresponding heatmap visualization results are shown in Figure 11 (Model C); The EIoU loss, by decoupling width and height regression, improved precision and recall by 2.4% and 0.6%, respectively, and increased mAP@0.5 and mAP@0.5:0.95 by 0.8% and 2.4% (Figure 11, Model D); the above four sets of experimental data, which independently tested the effect of each module, collectively verify the effectiveness of each improvement module in enhancing the model performance.
To further evaluate the effect of conventional lightweight strategies, we replaced the standard convolution in YOLOv8m with Depthwise Convolution (DWConv) and Ghost Convolution (GhostConv). As shown in Table 4, both approaches reduce parameters and FLOPs considerably, with DWConv achieving the most significant reduction (−24% Params, −76% FLOPs). However, this reduction comes at the cost of accuracy and stability: DWConv reduced mAP@0.5 by 2.1% and reduces inference speed to 28.8 FPS, indicating poor operator efficiency. GhostConv slightly improved inference speed (86.2 FPS vs. 68.5 FPS for the baseline) but still suffered a 2.9% drop in mAP@0.5 and only marginal gains in mAP@0.5:0.95.
By contrast, the proposed RFA-YOLOv8 sacrifices some efficiency (42.4 FPS) but achieved a substantial performance improvement, with +3.6% mAP@0.5 and +5.5% mAP@0.5:0.95 over the baseline. These results demonstrated that while conventional lightweight approaches are effective in reducing model complexity, they fail to maintain high detection accuracy in challenging scenarios. In comparison, our method achieved a more favorable trade-off between accuracy and efficiency, highlighting the importance of structural innovation rather than lightweight design alone in tea shoot detection.
To evaluate the impact of strategy fusion, further experimental validation was conducted. First, the multi-scale feature extraction network was enhanced by introducing the RFCAConv and SPPFCSPC modules. This modification significantly improved detection performance, with gains of 1.9% in mAP@0.5 and 2.7% in mAP@0.5:0.95, demonstrating the stronger feature extraction capability of the improved network.
Building on this, the C2f-RFA module was applied to the three output layers of the feature fusion network. Experimental results showed that, when combined with the improved feature extraction network, this module compensated for the reduction in semantic representation observed when used alone. As a result, overall accuracy was substantially improved, raising the model’s mAP@0.5 to 83.5%.
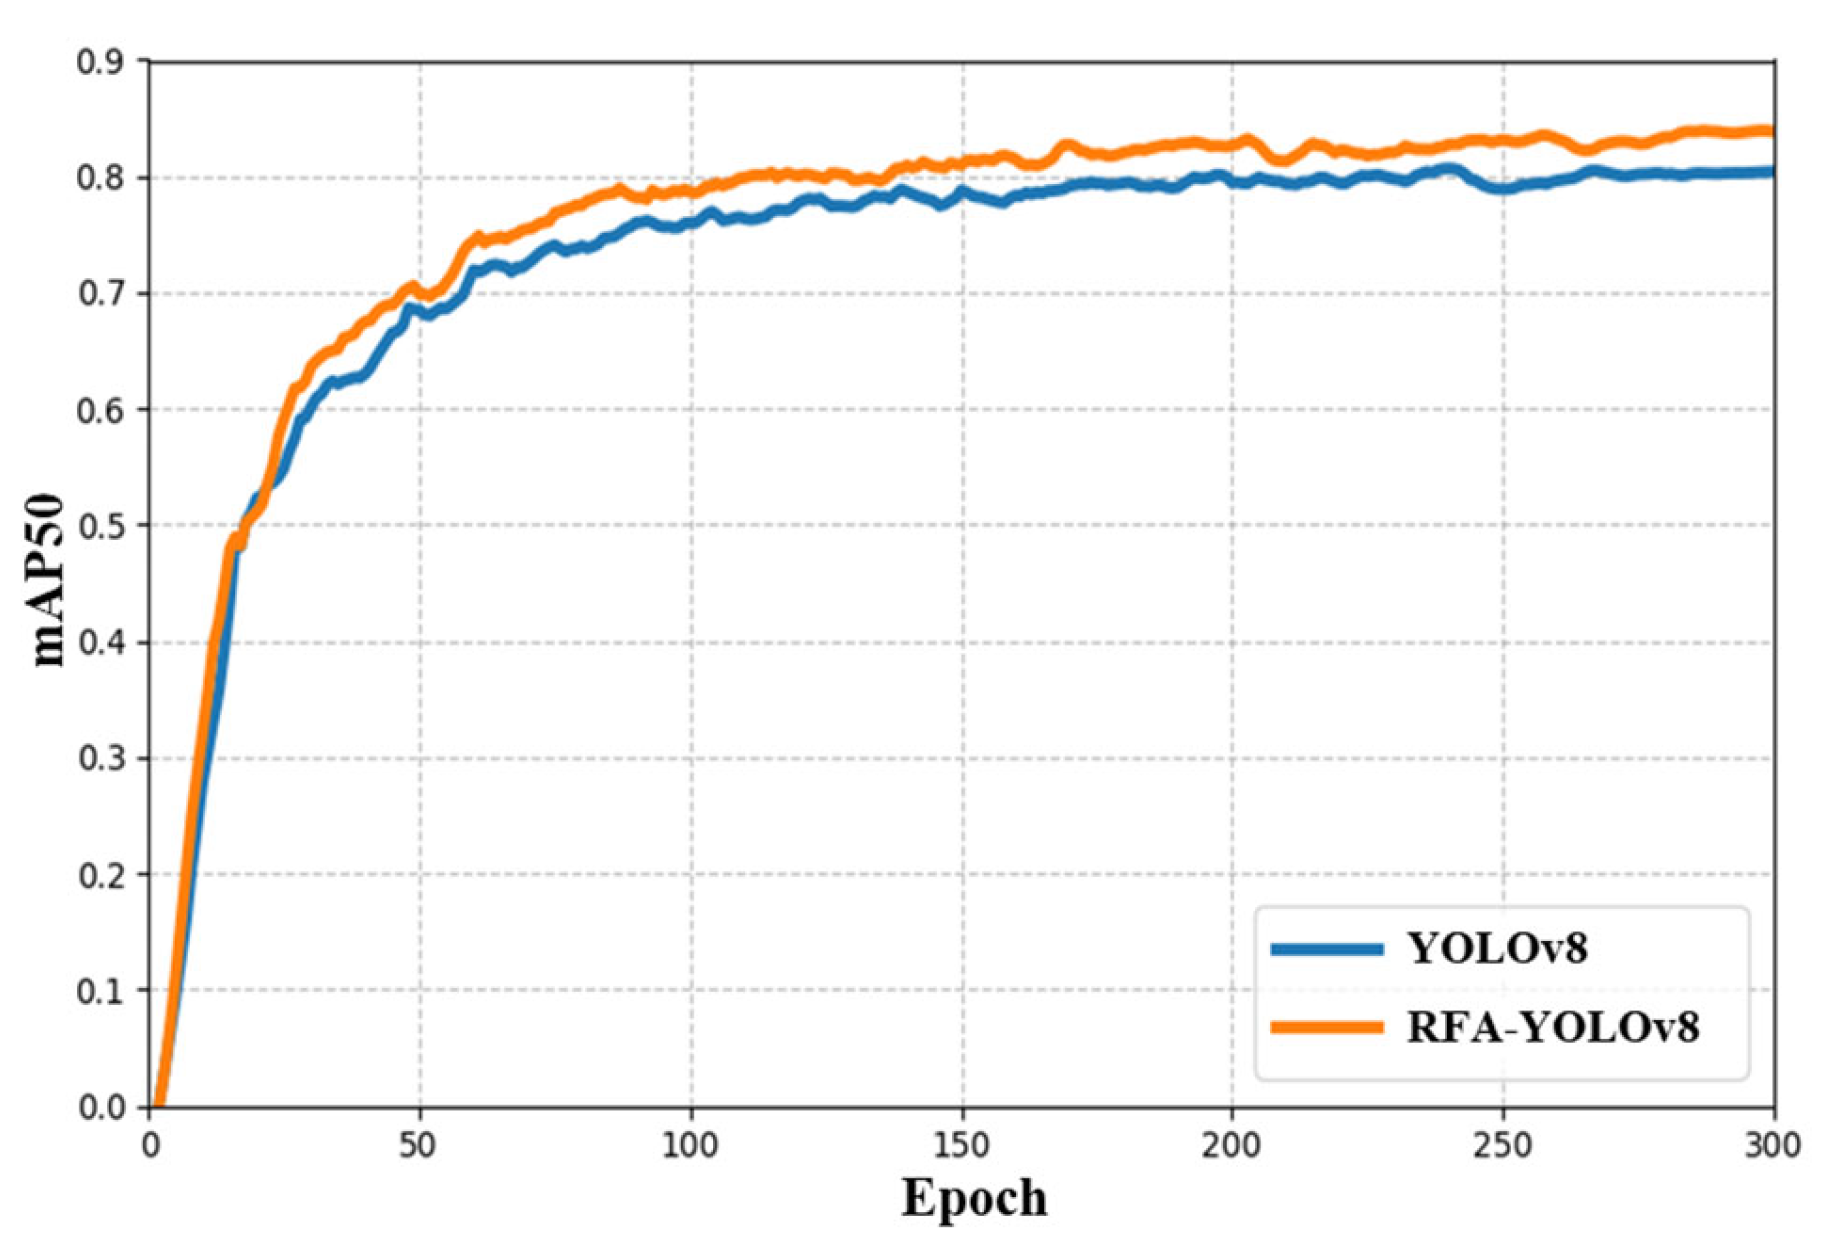
The final model, RFA-YOLOv8, integrates all four improvement strategies and was trained alongside the original YOLOv8 under identical experimental settings [57]. Figure 10 illustrates the mAP@0.5 curves of both models on the validation set. The proposed RFA-YOLOv8 consistently outperformed the baseline, with accuracy differences emerging after the 30th epoch and becoming increasingly pronounced thereafter. Ultimately, RFA-YOLOv8 achieved improvements of 4.8% in precision, 2.6% in recall, and 3.6% and 5.5% in mAP@0.5 and mAP@0.5:0.95, respectively.
As shown in Figure 12, improvements across multiple indicators and heatmap analyses reveal that the strategy not only enhanced quantitative performance but also produced explainable positive changes in feature responses and optimization behavior. The final heat map of the improved model in this study demonstrates more concentrated, intense, and accurate feature activation of the target region, as well as more precise encoding of spatial location information. It further confirms the effectiveness of each module in improving the final detection accuracy of the model.

4.4. Comparative Experiments

4.4.1. Comparative Experiments with Other Methods

To further validate and illustrate the state-of-the-art of the proposed target detection method for tea shoots, a variety of target detection models with excellent performance on public datasets were selected for comparative experiments in this study, specifically RT-DETR [58], SSD [22], and YOLOv5 (m) [14], YOLOv6 (m) [15], YOLOv7 [16], YOLOv8 [21], YOLOv9 (m) [17], YOLOv10 (m) [18], YOLOv11 (m) [19], and YOLOv12 (m) [20], and other target detection models. All models were trained on the training set of the constructed target detection dataset of tea shoots in natural scenes and evaluated on the test set, with results reported in Table 5.
As shown in Table 5, we compared the proposed RFA-YOLOv8 model with the mainstream YOLO series model on the self-built tea shoot dataset. The experimental results show that RFA-YOLOv8 achieves the highest detection accuracy for tea shoots, which is significantly better than other comparison models. Specifically, RFA-YOLOv8 achieved gains of 4.7% and 1.1% on mAP@0.5 and mAP@0.5:0.95, respectively, compared to YOLOv12 (m). Compared with the widely used YOLOv8 (m), RFA-YOLOv8 improved by 3.6% and 5.5% in mAP@0.5 and mAP@0.5:0.95, respectively.
Among all the models compared, including YOLOv5 (m), YOLOv6 (m), YOLOv7, YOLOv9 (m), YOLOv10 (m), YOLOv11 (m), SSD-ResNet50, and RT-DETR-ResNet50, RFA-YOLOv8 achieved the highest scores for mAP@0.5 and mAP@0.5:0.95. These experimental results clearly demonstrate the advantages of the RFA-YOLOv8 model in the detection of tea shoots.
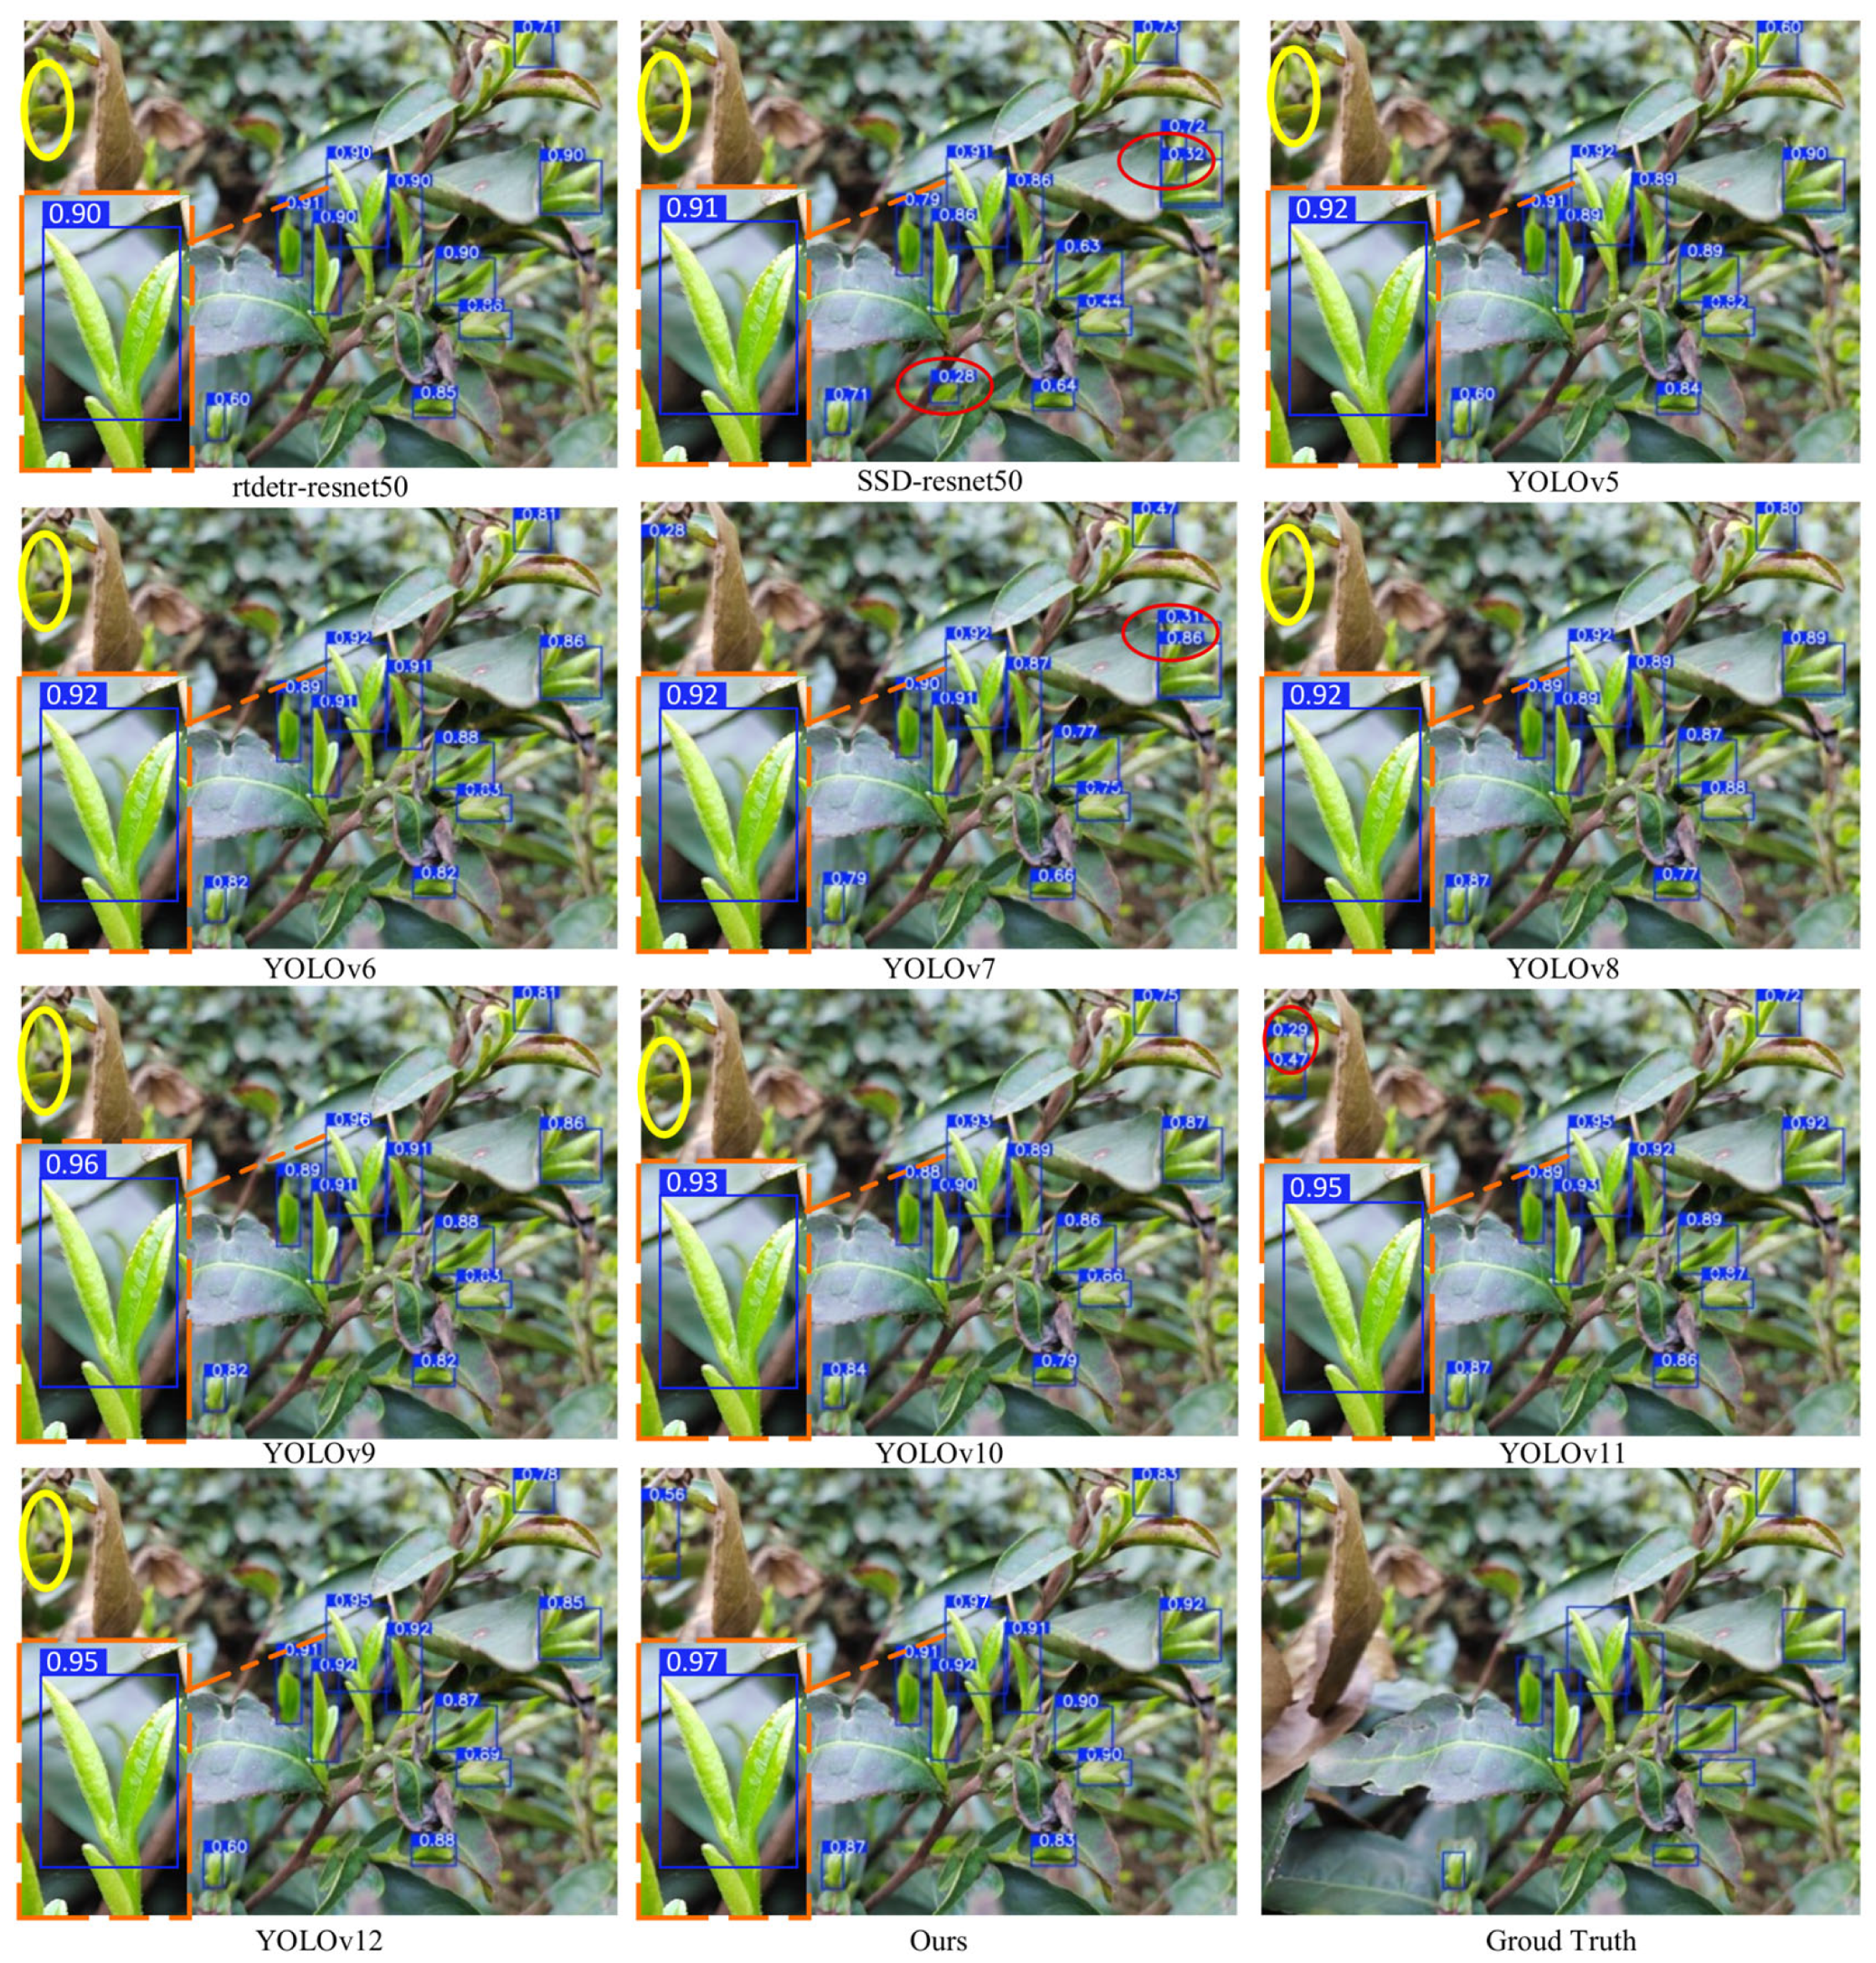
To further illustrate the superiority of the proposed method compared to other models, the detection results of each model are visualized, as shown in Figure 13, where yellow ellipses indicate the missed tea shoot targets, and red ellipses indicate the misidentified tea shoot targets. The proposed improved RFA-YOLOv8 model accurately detects all tea shoot targets with higher localization accuracy and confidence. For small targets of tea shoots, other models have frequently miss or misidentify targets, while the proposed detection method can still reliably detect multiple small targets, demonstrating that the model has a stronger multi-scale feature extraction capability.

4.4.2. Validation Experiments for Robustness

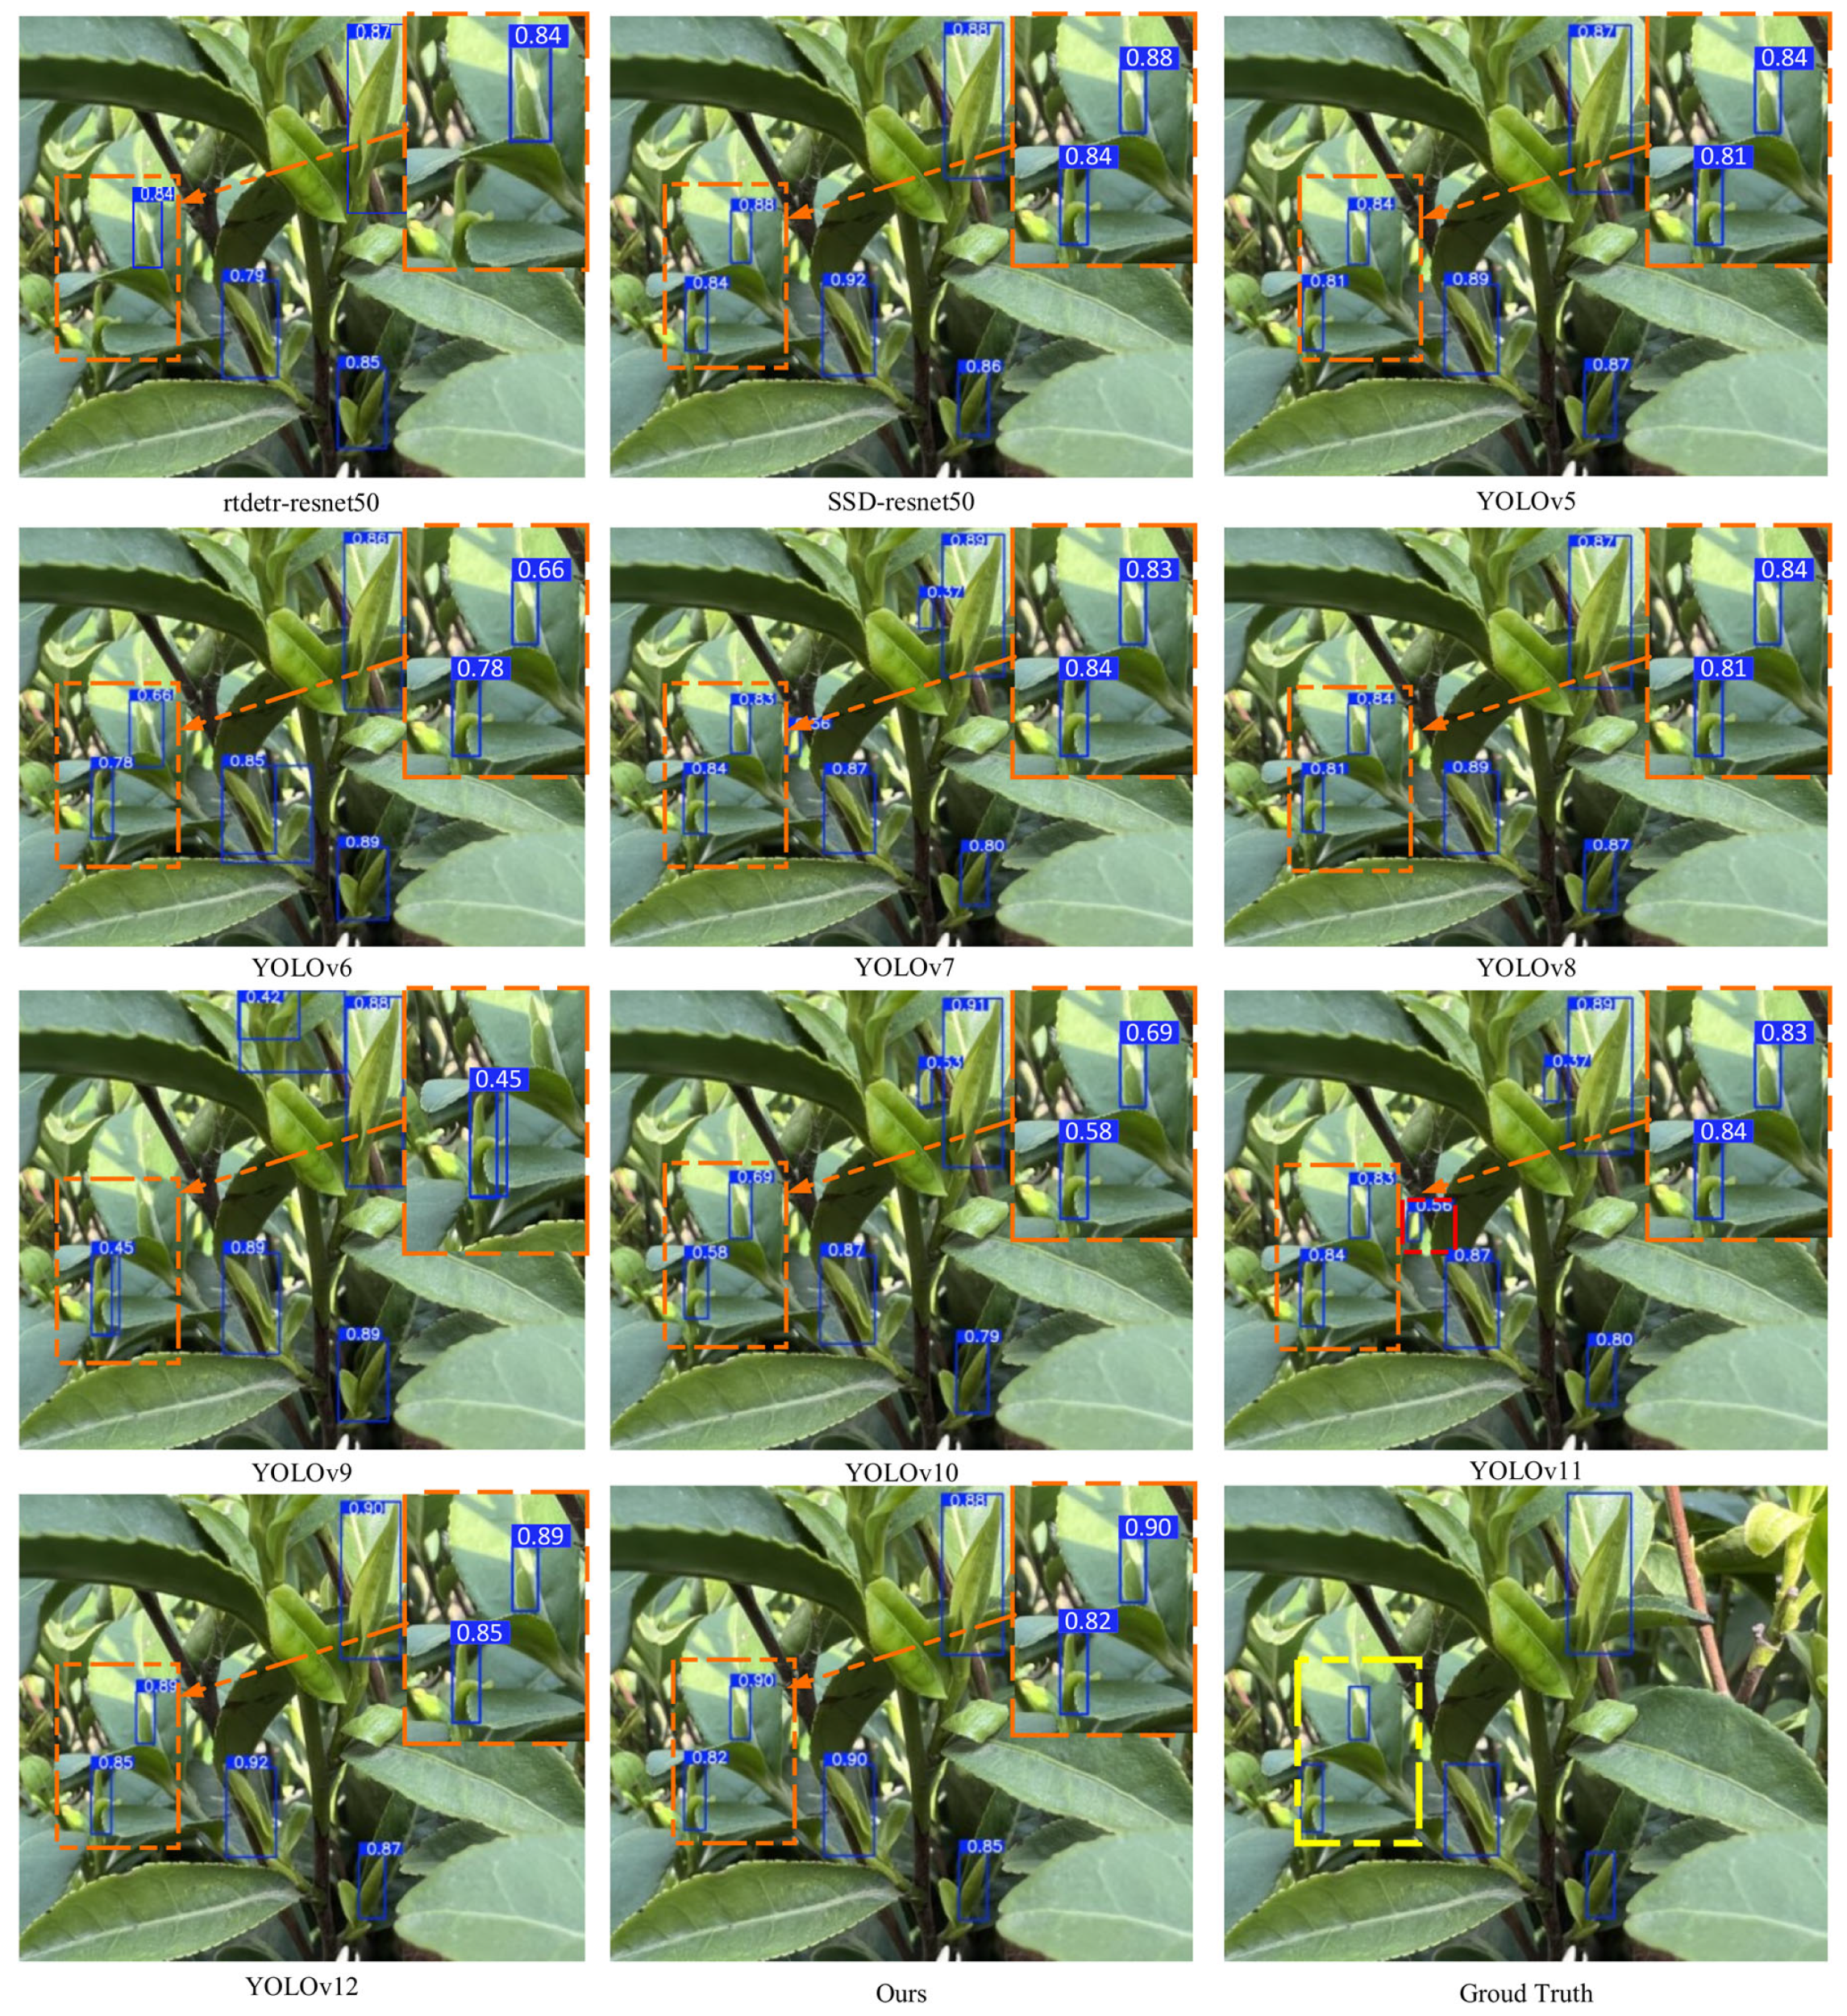
Tea shoots grow in complex natural environments where challenges such as occlusion, varying light conditions, dense targets, and the similar colors of new and old leaves impose greater demands on the robustness of detection models. To evaluate whether RFA-YOLOv8 can address these issues, additional experiments were conducted. As shown in Figure 14, under cloudy conditions with low light and highly similar leaf colors, the proposed model accurately detected all targets without misidentification, demonstrating strong robustness. In cases of partial occlusion, RFA-YOLOv8 effectively integrates global context and produces more precise bounding boxes due to its enhanced sensitivity to spatial location.
Lighting conditions exert a strong influence on image quality in natural environments. Under both intense direct light and dim light, captured images often suffer from overexposed regions or local blurring, leading to the loss of fine-grained features and reduced detection accuracy. To systematically evaluate this effect, the validation set was divided into three categories based on light intensity: strong light, moderate light, and dim light.
The experimental results are shown in Table 6, and the improved model RFA-YOLOv8 demonstrates superior detection performance compared with the benchmark model YOLOv8 (m) in tea garden scenes with different light intensities. Specifically, in the bright light environment, the metrics mAP@0.5 and mAP@0.5:0.95 increased by 3.6% and 5.6%, respectively, indicating that the model has stronger robustness against interference under high exposure conditions. Under moderate light, the metrics mAP@0.5 and mAP@0.5:0.95 increased by 0.9% and 3.8%, respectively, confirming the baseline performance advantages of the model under ideal conditions. In the critical low-light scenario, the metrics mAP@0.5 and mAP@0.5:0.95 increased by 6.3% and 7.1%, respectively, and the improvement of key indicators achieved the greatest gains among lighting conditions, proving that the model has a significant effect on low-light noise suppression and low-contrast feature enhancement. This advantage mainly stems from RFCAConv and C2f-RFA, which strengthen weak edge and texture signals, SPPFCSPC, which supplies multi-scale/global context to compensate for blurred local details, and EIoU, which improves bounding-box localization under low contrast. The model maintains stable accuracy in extreme light fluctuations, which is crucial for automated picking in tea gardens during morning and dusk hours.
The visual results in Figure 15 further illustrate this effect. In low-light environments, the baseline YOLOv8 model suffers from reduced confidence and missed detections, as indicated by lower scores and undetected buds in Figure 15b. In contrast, the proposed RFA-YOLOv8 model successfully detects all tea shoots with higher confidence, as shown in Figure 15a. These results confirm that the introduction of RFCAConv and SPPFCSPC enhances feature extraction in weak illumination, while the RFAConv module improves spatial sensitivity, jointly contributing to the model’s robustness against feature loss caused by low-light conditions.
To further strengthen the robustness validation, we compared RFA-YOLOv8 with several representative lightweight architectures, including YOLOv8n, YOLOv8s, and YOLOv8m-MobileNetV4. As shown in Table 5, although these lightweight models demonstrate clear advantages in parameter size and FLOPs, their detection accuracy in complex orchard environments is significantly lower than that of RFA-YOLOv8. This comparison highlights that the proposed model not only improves robustness compared with the original YOLOv8 but also achieves a more favorable balance between accuracy and efficiency than other lightweight baselines.

5. Conclusions

In this study, we tailored RFA-YOLOv8, an improved detection framework tailored for the challenges of tea shoot recognition in complex natural environments. By integrating the RFCAConv and SPPFCSPC modules, the model effectively mitigates information loss during downsampling and enhances multi-scale feature extraction. The introduction of the C2f-RFA module further strengthens spatial localization, while the adoption of an optimized loss function improves bounding box regression. Collectively, these strategies provide a comprehensive solution that balances accuracy and robustness for practical tea shoot detection.
Extensive experiments on a self-constructed dataset demonstrate the superiority of RFA-YOLOv8 over conventional baselines. The model achieved notable improvements of 4.8% in precision, 2.6% in recall, and gains of 3.6% and 5.5% in mAP@0.5 and mAP@0.5:0.95, respectively. Moreover, robustness tests under diverse conditions—including occlusion, color similarity, and varying illumination—confirmed that the proposed method maintains stable and accurate detection. Particularly under dim lighting, mAP improved by 6.3% and 7.1%, verifying the adaptability of the model to challenging field scenarios.
Despite these advances, the present research is constrained by its focus on a single tea species, which limits the model’s applicability in real tea gardens where morphological and phenological variations exist across cultivars. The absence of cross-species validation poses a challenge to broader deployment. In addition, RFA-YOLOv8 still exhibits limitations in certain extreme scenarios, such as severe occlusion where tea buds are heavily overlapped by leaves or branches, and adverse weather conditions like heavy rain or fog, where visibility and contrast are significantly reduced.
Future work will therefore focus on cross-species generalization. Specifically, we plan to address inter-varietal differences such as bud morphology and color confusion (e.g., purple azalea versus green tea shoots), as well as robustness under extreme weather and illumination conditions. Further efforts will also be devoted to designing occlusion-aware feature learning and weather-robust augmentation strategies to mitigate the above limitations. By enhancing the model’s adaptability to heterogeneous tea cultivars, we aim to provide a scalable and reliable technical foundation for automated precision picking in diverse tea production environments.

Author Contributions

Q.Y.: conceptualization, methodology, writing—review and editing; J.G.: funding acquisition, project administration, supervision; T.X.: formal analysis, validation; Q.W.: data curation, methodology; J.H.: funding acquisition, resource, supervision; Y.X.: investigation, visualization; Z.S.: resources, supervision. All authors have read and agreed to the published version of the manuscript.

Funding

This research was funded by the financial support of the Key project of Jiangsu Provincial Key Research and Development Program (BE2021016-3).

Data Availability Statement

The data presented in this study are available on request from the corresponding author. The data are not publicly available due to the privacy policy of the organization.

Conflicts of Interest

The authors declare no conflicts of interest.

References

  1. Zhang, Z.; Lu, Y.; Yang, M.; Wang, G.; Zhao, Y.; Hu, Y. Optimal Training Strategy for High-Performance Detection Model of Multi-Cultivar Tea Shoots Based on Deep Learning Methods. Sci. Hortic. 2024, 328, 112949. [Google Scholar] [CrossRef]
  2. Xu, Z.; Liu, J.; Wang, J.; Cai, L.; Jin, Y.; Zhao, S.; Xie, B. Realtime Picking Point Decision Algorithm of Trellis Grape for High-Speed Robotic Cut-and-Catch Harvesting. Agronomy 2023, 13, 1618. [Google Scholar] [CrossRef]
  3. Wang, C.; Li, H.; Deng, X.; Liu, Y.; Wu, T.; Liu, W.; Xiao, R.; Wang, Z.; Wang, B. Improved You Only Look Once v.8 Model Based on Deep Learning: Precision Detection and Recognition of Fresh Leaves from Yunnan Large-Leaf Tea Tree. Agriculture 2024, 14, 2324. [Google Scholar] [CrossRef]
  4. Chen, Z.; Chen, J.; Li, Y.; Gui, Z.; Yu, T. Tea Bud Detection and 3D Pose Estimation in the Field with a Depth Camera Based on Improved YOLOv5 and the Optimal Pose-Vertices Search Method. Agriculture 2023, 13, 1405. [Google Scholar] [CrossRef]
  5. Jin, Y.; Liu, J.; Xu, Z.; Yuan, S.; Li, P.; Wang, J. Development Status and Trend of Agricultural Robot Technology. Int. J. Agric. Biol. Eng. 2021, 14, 1–19. [Google Scholar] [CrossRef]
  6. He, Q.; Liu, Z.; Li, X.; He, Y.; Lin, Z. Detection of the Pigment Distribution of Stacked Matcha During Processing Based on Hyperspectral Imaging Technology. Agriculture 2024, 14, 2033. [Google Scholar] [CrossRef]
  7. Yang, N.; Yuan, M.; Wang, P.; Zhang, R.; Sun, J.; Mao, H. Tea Diseases Detection Based on Fast Infrared Thermal Image Processing Technology. J. Sci. Food Agric. 2019, 99, 3459–3466. [Google Scholar] [CrossRef]
  8. Wang, R.; Feng, J.; Zhang, W.; Liu, B.; Wang, T.; Zhang, C.; Xu, S.; Zhang, L.; Zuo, G.; Lv, Y.; et al. Detection and Correction of Abnormal IoT Data from Tea Plantations Based on Deep Learning. Agriculture 2023, 13, 480. [Google Scholar] [CrossRef]
  9. Jia, W.; Zheng, Y.; Zhao, D.; Yin, X.; Liu, X.; Du, R. Preprocessing Method of Night Vision Image Application in Apple Harvesting Robot. Int. J. Agric. Biol. Eng. 2018, 11, 158–163. [Google Scholar] [CrossRef]
  10. Li, H.; Hu, W.; Hassan, M.M.; Zhang, Z.; Chen, Q. A Facile and Sensitive SERS-Based Biosensor for Colormetric Detection of Acetamiprid in Green Tea Based on Unmodified Gold Nanoparticles. J. Food Meas. Charact. 2019, 13, 259–268. [Google Scholar] [CrossRef]
  11. Girshick, R.; Donahue, J.; Darrell, T.; Malik, J. Rich Feature Hierarchies for Accurate Object Detection and Semantic Segmentation. arXiv 2014. [Google Scholar] [CrossRef]
  12. Girshick, R. Fast R-CNN. arXiv 2015, arXiv:1504.08083. [Google Scholar] [CrossRef]
  13. Ren, S.; He, K.; Girshick, R.; Sun, J. Faster R-CNN: Towards Real-Time Object Detection with Region Proposal Networks. IEEE Trans. Pattern Anal. Mach. Intell. 2017, 39, 1137–1149. [Google Scholar] [CrossRef]
  14. Khanam, R.; Hussain, M. What Is YOLOv5: A Deep Look into the Internal Features of the Popular Object Detector. arXiv 2024. [Google Scholar] [CrossRef]
  15. Li, C.; Li, L.; Jiang, H.; Weng, K.; Geng, Y.; Li, L.; Ke, Z.; Li, Q.; Cheng, M.; Nie, W.; et al. YOLOv6: A Single-Stage Object Detection Framework for Industrial Applications. arXiv 2022, arXiv:2209.02976. [Google Scholar] [CrossRef]
  16. Wang, C.-Y.; Bochkovskiy, A.; Liao, H.-Y.M. YOLOv7: Trainable Bag-of-Freebies Sets New State-of-the-Art for Real-Time Object Detectors. arXiv 2022, arXiv:2207.02696. [Google Scholar] [CrossRef]
  17. Wang, C.-Y.; Yeh, I.-H.; Liao, H.-Y.M. YOLOv9: Learning What You Want to Learn Using Programmable Gradient Information. arXiv 2024. [Google Scholar] [CrossRef]
  18. Wang, A.; Chen, H.; Liu, L.; Chen, K.; Lin, Z.; Han, J.; Ding, G. YOLOv10: Real-Time End-to-End Object Detection. arXiv 2024, arXiv:2405.14458. [Google Scholar] [CrossRef]
  19. Khanam, R.; Hussain, M. YOLOv11: An Overview of the Key Architectural Enhancements. arXiv 2024, arXiv:2410.17725. [Google Scholar] [CrossRef]
  20. Tian, Y.; Ye, Q.; Doermann, D. YOLOv12: Attention-Centric Real-Time Object Detectors. arXiv 2025, arXiv:2502.12524. [Google Scholar] [CrossRef]
  21. Zhou, C.; Zhu, Y.; Zhang, J.; Ding, Z.; Jiang, W.; Zhang, K. The Tea Buds Detection and Yield Estimation Method Based on Optimized YOLOv8. Sci. Hortic. 2024, 338, 113730. [Google Scholar] [CrossRef]
  22. Liu, W.; Anguelov, D.; Erhan, D.; Szegedy, C.; Reed, S.; Fu, C.-Y.; Berg, A.C. SSD: Single Shot MultiBox Detector. In Computer Vision—ECCV 2016; Springer: Cham, Switzerland, 2016; pp. 21–37. [Google Scholar]
  23. Gui, Z.; Chen, J.; Li, Y.; Chen, Z.; Wu, C.; Dong, C. A Lightweight Tea Bud Detection Model Based on Yolov5. Comput. Electron. Agric. 2023, 205, 107636. [Google Scholar] [CrossRef]
  24. Xie, S.; Sun, H. Tea-YOLOv8s: A Tea Bud Detection Model Based on Deep Learning and Computer Vision. Sensors 2023, 23, 6576. [Google Scholar] [CrossRef] [PubMed]
  25. Zhang, C.; Yu, X.; Shi, X.; Han, Y.; Guo, Z.; Liu, Y. Development of Carbon Quantum Dot–Labeled Antibody Fluorescence Immunoassays for the Detection of Morphine in Hot Pot Soup Base. Food Anal. Methods 2020, 13, 1042–1049. [Google Scholar] [CrossRef]
  26. Huang, X.; Yu, S.; Xu, H.; Aheto, J.H.; Bonah, E.; Ma, M.; Wu, M.; Zhang, X. Rapid and Nondestructive Detection of Freshness Quality of Postharvest Spinaches Based on Machine Vision and Electronic Nose. J. Food Saf. 2019, 39, e12708. [Google Scholar] [CrossRef]
  27. Cao, Y.; Li, H.; Sun, J.; Zhou, X.; Yao, K.; Nirere, A. Nondestructive Determination of the Total Mold Colony Count in Green Tea by Hyperspectral Imaging Technology. J. Food Process Eng. 2020, 43, e13570. [Google Scholar] [CrossRef]
  28. Lv, J.; Wang, Y.; Xu, L.; Gu, Y.; Zou, L.; Yang, B.; Ma, Z. A Method to Obtain the Near-Large Fruit from Apple Image in Orchard for Single-Arm Apple Harvesting Robot. Sci. Hortic. 2019, 257, 108758. [Google Scholar] [CrossRef]
  29. He, K.; Zhang, X.; Ren, S.; Sun, J. Spatial Pyramid Pooling in Deep Convolutional Networks for Visual Recognition. IEEE Trans. Pattern Anal. Mach. Intell. 2015, 37, 1904–1916. [Google Scholar] [CrossRef]
  30. He, K.; Gkioxari, G.; Dollár, P.; Girshick, R. Mask R-CNN. arXiv 2018, arXiv:1703.06870. [Google Scholar] [CrossRef]
  31. Cai, Z.; Vasconcelos, N. Cascade R-CNN: Delving into High Quality Object Detection. arXiv 2017, arXiv:1712.00726. [Google Scholar] [CrossRef]
  32. Lin, T.-Y.; Goyal, P.; Girshick, R.; He, K.; Dollár, P. Focal Loss for Dense Object Detection. arXiv 2018, arXiv:1708.02002. [Google Scholar] [CrossRef]
  33. Tian, Z.; Shen, C.; Chen, H.; He, T. FCOS: Fully Convolutional One-Stage Object Detection. arXiv 2019, arXiv:1904.01355. [Google Scholar] [CrossRef]
  34. Carion, N.; Massa, F.; Synnaeve, G.; Usunier, N.; Kirillov, A.; Zagoruyko, S. End-to-End Object Detection with Transformers. arXiv 2020, arXiv:2005.12872. [Google Scholar] [CrossRef]
  35. Zhao, Y.; Lv, W.; Xu, S.; Wei, J.; Wang, G.; Dang, Q.; Liu, Y.; Chen, J. DETRs Beat YOLOs on Real-Time Object Detection. In Proceedings of the 2024 IEEE/CVF Conference on Computer Vision and Pattern Recognition (CVPR), Seattle, WA, USA, 17–21 June 2024; IEEE: Piscataway, NJ, USA, 2024; pp. 16965–16974. [Google Scholar]
  36. Dosovitskiy, A.; Beyer, L.; Kolesnikov, A.; Weissenborn, D.; Zhai, X.; Unterthiner, T.; Dehghani, M.; Minderer, M.; Heigold, G.; Gelly, S.; et al. An Image Is Worth 16x16 Words: Transformers for Image Recognition at Scale. arXiv 2021, arXiv:2010.11929. [Google Scholar] [CrossRef]
  37. Graham, B.; El-Nouby, A.; Touvron, H.; Stock, P.; Joulin, A.; Jégou, H.; Douze, M. LeViT: A Vision Transformer in ConvNet’s Clothing for Faster Inference. arXiv 2021, arXiv:2104.01136. [Google Scholar] [CrossRef]
  38. Chu, X.; Tian, Z.; Zhang, B.; Wang, X.; Shen, C. Conditional Positional Encodings for Vision Transformers. arXiv 2023, arXiv:2102.10882. [Google Scholar] [CrossRef]
  39. Ranftl, R.; Bochkovskiy, A.; Koltun, V. Vision Transformers for Dense Prediction. arXiv 2021, arXiv:2103.13413. [Google Scholar] [CrossRef]
  40. Li, Y.; Zhang, K.; Cao, J.; Timofte, R.; Magno, M.; Benini, L.; Van Gool, L. LocalViT: Analyzing Locality in Vision Transformers. arXiv 2025, arXiv:2104.05707. [Google Scholar] [CrossRef]
  41. Dai, Z.; Liu, H.; Le, Q.V.; Tan, M. CoAtNet: Marrying Convolution and Attention for All Data Sizes. arXiv 2021, arXiv:2106.04803. [Google Scholar] [CrossRef]
  42. Ren, R.; Sun, H.; Zhang, S.; Zhao, H.; Wang, L.; Su, M.; Sun, T. FPG-YOLO: A Detection Method for Pollenable Stamen in “Yuluxiang” Pear under Non-Structural Environments. Sci. Hortic. 2024, 328, 112941. [Google Scholar] [CrossRef]
  43. Sun, X.; Mu, S.; Xu, Y.; Cao, Z.; Su, T. Detection Algorithm of Tea Tender Buds under Complex Background Based on Deep Learning. J. Hebei Univ. (Nat. Sci. Ed.) 2019, 39, 211–216. [Google Scholar] [CrossRef]
  44. Yang, H.; Chen, L.; Chen, M.; Ma, Z.; Deng, F.; Li, M.; Li, X. Tender Tea Shoots Recognition and Positioning for Picking Robot Using Improved YOLO-V3 Model. IEEE Access 2019, 7, 180998–181011. [Google Scholar] [CrossRef]
  45. Xie, J.; Huang, C.; Liang, Y.; Huang, Y.; Zhou, Z.; Huang, Y.; Mu, S. Tea Shoot Recognition Method Based on Improved YOLOX Model. GDNYKX Guangdong Agric. Sci. 2022, 49, 49–56. [Google Scholar] [CrossRef]
  46. Wang, M.; Gu, J.; Wang, H.; Hu, T.; Fang, X.; Pan, Z. Method for Identifying Tea Buds Based on Improved YOLOv5s Model. Nongye Gongcheng Xuebao/Trans. Chin. Soc. Agric. Eng. 2023, 39, 150–157. [Google Scholar] [CrossRef]
  47. Gui, J.; Wu, D.; Xu, H.; Chen, J.; Tong, J. Tea Bud Detection Based on Multi-scale Convolutional Block Attention Module. J. Food Process Eng. 2024, 47, e14556. [Google Scholar] [CrossRef]
  48. Gao, F.; Wen, X.; Huang, J.; Chen, G.; Jin, S.; Zhao, X. Tea Bud Recognition Algorithm Based on AD-YOLOX-Nano. Trans. Chin. Soc. Agric. Mach. 2025, 46, 178–184. [Google Scholar] [CrossRef]
  49. Chen, Y.; Guo, Y.; Li, J.; Zhou, B.; Chen, J.; Zhang, M.; Cui, Y.; Tang, J. RT-DETR-Tea: A Multi-Species Tea Bud Detection Model for Unstructured Environments. Agriculture 2024, 14, 2256. [Google Scholar] [CrossRef]
  50. Wang, J.; Liu, L.; Tang, Q.; Sun, K.; Zeng, L.; Wu, Z. Evaluation and Selection of Suitable QRT-PCR Reference Genes for Light Responses in Tea Plant (Camellia sinensis). Sci. Hortic. 2021, 289, 110488. [Google Scholar] [CrossRef]
  51. Lv, R.; Hu, J.; Zhang, T.; Chen, X.; Liu, W. Crop-Free-Ridge Navigation Line Recognition Based on the Lightweight Structure Improvement of YOLOv8. Agriculture 2025, 15, 942. [Google Scholar] [CrossRef]
  52. Zhang, X.; Liu, C.; Yang, D.; Song, T.; Ye, Y.; Li, K.; Song, Y. RFAConv: Innovating Spatial Attention and Standard Convolutional Operation. arXiv 2024, arXiv:2304.03198. [Google Scholar] [CrossRef]
  53. Hou, Q.; Zhou, D.; Feng, J. Coordinate Attention for Efficient Mobile Network Design. arXiv 2021, arXiv:2103.02907. [Google Scholar] [CrossRef]
  54. Xue, H.; Chen, J.; Tang, R. Improved YOLOv8 for Small Object Detection. In Proceedings of the 2024 5th International Conference on Computing, Networks and Internet of Things, Tokyo, Japan, 24–26 May 2024; ACM: New York, NY, USA, 2024; pp. 266–272. [Google Scholar]
  55. Zhang, F.; Leong, L.V.; Yen, K.S.; Zhang, Y. An Enhanced Lightweight Model for Small-Scale Pedestrian Detection Based on YOLOv8s. Digit. Signal Process. 2025, 156, 104866. [Google Scholar] [CrossRef]
  56. Wang, S.; Hao, X. YOLO-SK: A Lightweight Multiscale Object Detection Algorithm. Heliyon 2024, 10, e24143. [Google Scholar] [CrossRef]
  57. Xue, Z.; Xu, R.; Bai, D.; Lin, H. YOLO-Tea: A Tea Disease Detection Model Improved by YOLOv5. Forests 2023, 14, 415. [Google Scholar] [CrossRef]
  58. Zhu, M.; Kong, E. Multi-Scale Fusion Uncrewed Aerial Vehicle Detection Based on RT-DETR. Electronics 2024, 13, 1489. [Google Scholar] [CrossRef]
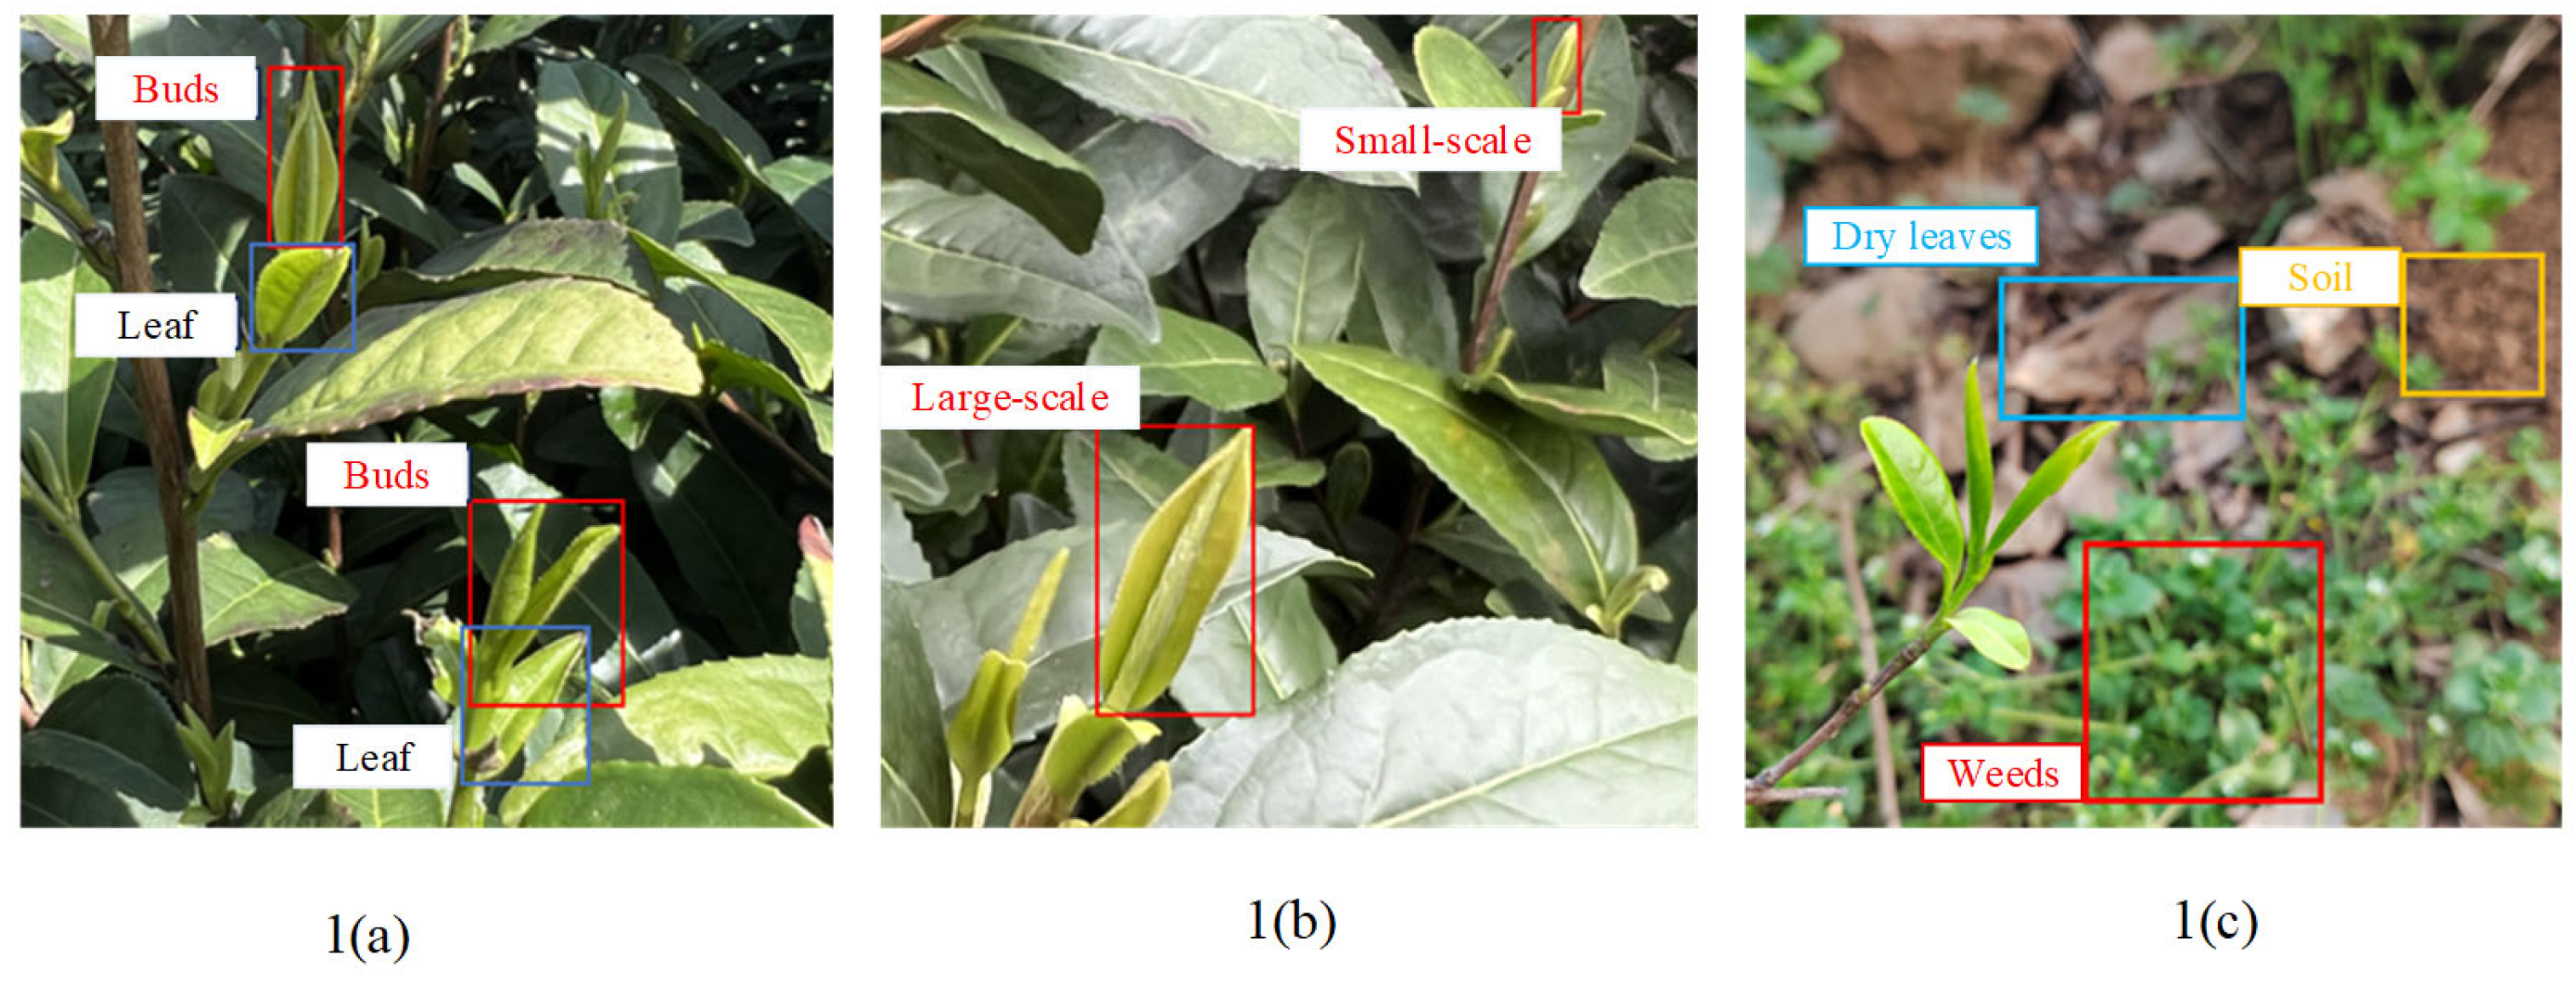
Figure 1. Representative challenges in detecting tea buds under natural conditions. (a) High similarity in color and texture between tea buds and mature leaves. (b) Multi-scale targets caused by different growth stages and shooting distances. (c) Complex background interference from dry leaves, weeds, and soil.
Agriculture 15 01982 g001
Figure 2. Schematic diagram of the improved YOLOv8 network architecture.
Agriculture 15 01982 g002
Figure 3. Detailed structure of RFCAConv, which focuses on receptive-field spatial features.
Agriculture 15 01982 g003
Figure 4. Structure diagram of the SPPFCSPC module. The input feature is split into two branches. The outputs of both branches are concatenated and fused by a final 1 × 1 Conv to generate the output feature map.
Agriculture 15 01982 g004
Figure 5. Structure diagrams of the C2f and C2f-RFA modules.
Agriculture 15 01982 g005
Figure 6. Structure diagrams of the RFAConv module.
Agriculture 15 01982 g006
Figure 7. Structure diagram of the decoupled detection head.
Agriculture 15 01982 g007
Figure 8. Comparison of convergence curves between DIOU and EIOU. EIOU achieves faster convergence and lower final regression loss, demonstrating its advantage in decoupling width–height regression.
Agriculture 15 01982 g008
Figure 9. Examples of tea shoot images under different natural conditions.
Agriculture 15 01982 g009
Figure 10. This image demonstrates data augmentation techniques, showing how an original image is modified through affine transformations and color adjustments to create a more diverse and robust training dataset for machine learning models.
Agriculture 15 01982 g010
Figure 11. Visualization results of heatmaps for each model.
Agriculture 15 01982 g011
Figure 12. The mAP50 change curves of two models on the validation set during the training process.
Agriculture 15 01982 g012
Figure 13. Detection results of tea shoots in complex environments using different models, including RT-DETR-ResNet50, SSD-ResNet50, YOLOv5–YOLOv12, the proposed RFA-YOLOv8 (Ours).
Agriculture 15 01982 g013
Figure 14. Detection results for tea buds with partial occlusion across different models. The yellow box denotes the reference annotation region, while the red box indicates a misdetection produced by YOLOv11.
Agriculture 15 01982 g014
Figure 15. Detection results of tea shoots under low-light conditions. (a) Proposed RFA-YOLOv8: all tea shoots are detected with higher confidence, demonstrating improved robustness under weak illumination. (b) YOLOv8 baseline model: lower confidence scores and missed detections are observed.
Agriculture 15 01982 g015
Table 1. Experimental environment and configuration.
Experimental EnvironmentModel/Parameter
CPU device12th Gen Intel(R) Core(TM) i3-12100F
GPU deviceNVIDIA RTX 3060 12G
operating systemUbuntu 20.04
CUDA VersionCUDA 11.8
programming languagePython 3.8.19
Deep Learning FrameworkPytorch 2.4.0
IDEPyCharm Community Edition 2024.2.0.1
Table 2. Experimental results of data augmentation.
DatasetsmAP@0.5/%mAP@0.5:0.95/%
Original dataset79.752.1
Enhanced dataset80.553.2
Table 3. Results of the ablation experiment.
ModelP/%R/%mAP@0.5/%mAP@0.5:0.95/%FPS/
(f·s−1)
baseline77.774.580.553.268.5
A79.175.781.755.651.0
B77.977.081.555.366.5
C81.671.980.954.557.5
D80.175.181.355.670.2
A + B80.776.982.455.944.5
A + B + C82.076.383.557.540.0
Ours82.577.184.1 (↑ 3.6)58.7 (↑ 4.3)42.4
Table 4. Lightweight comparison experiment results.
ModelmAP@0.5mAP@0.5:0.95Params (M)FLOPs (G)FPS
BaselineYOLOv8m80.553.224.678.768.5
YOLOv8m + DWConv78.455.218.718.728.8
YOLOv8m + GhostConv77.654.623.673.886.2
RFA-YOLOv884.158.734.386.742.4
Table 5. Comparison of RFA-YOLOv8 with mainstream and lightweight object detection models in complex orchard environments.
ModelmAP@0.5/%mAP@0.5:0.95/%Parameters/MFLOPs/GFPS/(f·s−1)
rtdetr-resnet5072.949.141.9125.683.3
SSD-resnet5074.348.324.487.755.6
YOLOv5 (m)78.752.123.964.075.8
YOLOv6 (m)79.251.349.6161.152.4
YOLOv778.550.935.5105.159.9
YOLOv8 (n)76.251.138.117.4
YOLOv8 (s)79.649.811.128.415.7
YOLOv8 (m)80.553.224.678.768.5
YOLOv8m-MobileNetV475.849.48.621.718.9
YOLOv9 (m)80.253.319.176.558.8
YOLOv10 (m)79.752.115.763.477.5
YOLOv11 (m)79.052.419.167.673.5
YOLOv12 (m)79.457.620.167.1119.1
Ours84.158.734.386.742.4
Table 6. Comparison of results under different lighting conditions.
Luminous IntensityModelsmAP@0.5/%mAP@0.5:0.95/%
High intensityYOLOv878.950.9
Ours82.556.5
Moderate
intensity
YOLOv887.359.6
Ours88.263.4
Low intensityYOLOv875.349.1
Ours81.656.2
Disclaimer/Publisher’s Note: The statements, opinions and data contained in all publications are solely those of the individual author(s) and contributor(s) and not of MDPI and/or the editor(s). MDPI and/or the editor(s) disclaim responsibility for any injury to people or property resulting from any ideas, methods, instructions or products referred to in the content.