Article

Linking the Changes of Soil Organic Carbon with Rare Bacterial Diversity in Sagebrush Desert Grassland Under Grazing Exclusion

1
College of Grassland Science, Xinjiang Agricultural University, Urumqi 830052, China
2
Key Laboratory of Grassland Resources and Ecology of Western Arid Region, Ministry of Education, Urumqi 830052, China
3
Xinjiang Key Laboratory of Grassland Resources and Ecology, Urumqi 830052, China
*
Author to whom correspondence should be addressed.
Agriculture 2025, 15(18), 1959; https://doi.org/10.3390/agriculture15181959
Submission received: 21 July 2025 / Revised: 2 September 2025 / Accepted: 5 September 2025 / Published: 17 September 2025
(This article belongs to the Section Agricultural Soils)

Abstract

Grazing exclusion is an effective and economical tool for restoring degraded grasslands. Yet, less attention is paid to the changes of rare and abundant bacterial taxa and their connections with soil organic carbon changes after grazing exclusion (GE). Using high-throughput sequencing and multiple statistical methods, we assessed shifts in rare and abundant bacterial taxa and contributions to soil organic carbon in five typical sagebrush (Xinyuan, Bole, Qitai, Hutubi, Manasi) desert experimental plots in Xinjiang, northwest China. The results demonstrated that rare bacterial α-diversity decreased significantly in Xinyuan, Bole, and Qitai plots, while Hutubi and Manasi plots significantly increased during GE (p < 0.05). GE increased the edges/nodes ratio from 29.60% to 44.90% and changed network complexity by shifting the nodes and topological properties, cohesion, and robustness in the bacterial network. The changes in rare bacterial diversity are tightly correlated with changes in soil organic carbon. The results not only underline the pivotal role of rare bacterial taxa in response to GE and soil organic carbon changes but also provide novel insights into the mechanisms of soil organic carbon changes after GE.

1. Introduction

Grasslands account for more than one-third of the Earth’s land surface and are essential for maintaining ecological sustainability and preventing soil erosion [1,2]. Grazing has been the major use of grasslands, but overgrazing leads to severe degradation of grassland ecosystems [3,4], reducing vegetative biomass and affecting the grassland ecosystem’s nutrient cycling [5], thereby exacerbating soil organic carbon (SOC) losses [6]. Therefore, restoration practices are needed to address these negative impacts. Grazing exclusion (GE) is broadly applied in restoring degraded grasslands, resulting in improved vegetation biomass and soil fertility [7,8]. Currently, although the influences of GE on soil characteristics and plant communities are well described [9,10], research on its impact on bacterial communities remains limited.
Soil microbes are essential for carbon cycling in soil, actively involved in the decomposition and storage of SOC [11]. Studies indicated that soil bacteria diversity is negatively correlated with SOC, potentially due to redundant metabolism, growth strategies, and the elevation of decomposition capacities [12,13]. For instance, Zang et al. found that the increase in vegetation diversity due to vegetation restoration weakens SOC stocks by increasing bacterial diversity, which is linked to increased decomposition capacity [14]. GE can influence bacterial activity, consequently regulating SOC in grassland soils. Numerous studies have shown that GE reduces soil bacterial diversity and alters bacterial community composition, primarily owing to alterations in vegetation diversity, soil nutrient levels, and pH [15,16]. In addition, GE increased the abundance of dominant bacterial taxa, such as Actinobacteria and Bacteroidetes, which are fast-growing and positively correlated with SOC [17]. Understanding the changes in soil bacteria following GE will help identify appropriate grassland management practices to improve SOC.
Bacterial communities exhibit high diversity, of which a mass of rare taxa is characterized by low abundance, and a few abundant taxa dominate the pool [18,19]. Recent research has demonstrated that ecological attributes for rare and abundant taxa respond paradoxically to environmental variations [20]. For example, research in agricultural management practices has demonstrated that rare taxa display stronger sensitivity to long-term crop recovery and utilization [21]. But the findings were discordant with those of copper mine contaminated and floating microplastic (FMP) disturbed river sediments [20]. Additionally, these taxa play complementary roles in the degradation and mineralization of organic matter, such as carbon cycling [22]. Prior studies have concentrated on abundant taxa, as mass ratio theory suggests that they have high microbial biomass and presumably dictate biogeochemical C cycling processes [23,24]. In fact, emerging evidence indicates that rare species are disproportionately important [25,26]. Despite their low abundance, rare taxa serve as an important microbial “seed bank” and reveal their unique morphological and physiological characteristics, potentially acting as hidden drivers of microbiome function [27,28]. For example, rare microbial taxa could be used as an ecological indicator for identifying vegetation restoration in four sandy lands [29], and grazing intensity may act as an environmental filter that has a strong effect on rare taxa and SOC fractions [25]. These studies indicate that the roles of abundant and rare microbial taxa differ in ecosystems and highlight the significance of rare taxa in maintaining SOC [30]. Unfortunately, little is known about the important roles that rare and abundant species play in carbon changes during environmental changes, including GE. Understanding this information will help develop effective strategies for grassland restoration and management.
Moreover, our knowledge about the complex interactions across bacterial communities is still limited [31]. Network analysis is increasingly utilized to examine interactions among bacterial species, which are diverse and encompass both synergistic and antagonistic relationships [32]. Additionally, keystone taxa may be identified statistically by bacterial networks [33]. The removal of keystone results in SOC loss, as their reduced abundance in a community may affect soil C processes [25]. However, the relationship between abundant and rare key taxa and SOC remains poorly understood.
The sagebrush desert grassland, as an essential part of the desert grassland in Xinjiang, has an area of about 3.78 × 10¹⁰ m2 and has long been used as a spring–autumn pasture [34]. However, excessive and inappropriate grazing has led to severe degradation of sagebrush desert grasslands. Therefore, GE has been an important measurement to restore their ecosystem functions [34]. Our past studies have shown that GE led to a more significant decrease in SOC content, insignificant changes in bacterial diversity, and a decrease in the correlation between bacterial diversity and SOC content [35]. The reason could be the failure to distinguish among different bacterial taxa, resulting in a microbial community whose functions may be hidden [36]. Thus, we further analyzed the response of SOC changes and ecological properties of different bacterial taxa to GE in the sagebrush desert grassland. Based on this, we hypothesized that rare taxa are more sensitive to GE than the abundant ones and that changes in the rare ones might play a crucial role in SOC changes. We aimed to (a) compare the response of the rare and abundant taxa to composition, diversity, and co-occurrence patterns under GE and (b) explore the contribution of changes in the characteristics of the rare and abundant taxa to SOC changes in the sagebrush desert grassland following GE. Our findings offer a new perspective on the mechanism of SOC changes after GE and provide a scientific basis for the better development of grassland restoration strategies.

2. Materials and Methods

2.1. Study Area

The experimental site, situated in the sagebrush desert grassland on the northern slope of the Tianshan Mountains in Xinjiang, China (82.58~89.24° E, 43.37~43.78° N; 950~1270 m above sea level; Figure 1), exhibits a continental arid climate. The region experiences a mean annual temperature ranging from 4 °C to 9 °C, along with a yearly rainfall averaging 150–350 mm, concentrated from May to September. In contrast, annual evaporation averages around 2000 mm, six to seven times the precipitation, creating very dry conditions. The natural vegetation species mainly were Seriphidium transiliense and S. borotalalense, along with the other common species, such as Kochia prostrate and Petrosimonia sibirica. Gray desert soil is identified as the primary soil type based on the FAO/UNESCO Taxonomy.

2.2. Experimental Design and Sampling

These sites were selected along the precipitation trend on the northern slope of Mt, covering five typical sagebrush desert sites, namely Xinyuan (XY), Bole (BL), Hutubi (HTB), Manas (MNS), and Qitai (QT). All sites are located in arid and semi-arid regions, and the basic information is shown in Figure 1. Within each plot, two treatments were adopted, namely, the GE plot and the freely grazing plot (CK). These GE plots were fenced for 4~7 years, which belonged to grazing exclusion. The CK was grazed in spring and fall, with medium grazing intensity, and the livestock were mostly sheep. Prior to enclosure, the GE plot exhibited comparable topographic conditions to the CK plot in each site. The details of each sample plot are shown in Table S1.
Soil samplings were conducted in mid-May 2019. Briefly, within the 100 m × 100 m sampling area at the GE and CK plots, five 100 m line transects were established at 25 m intervals within both plots at each site. Five 1 m × 1 m quadrats were randomly selected for the field investigation and sampling at 20 m intervals along each line transect (Figure 1). Then, three quadrats were selected for each line transect, and pits (60 cm × 60 cm × 20 cm deep) were dug at the center of each quadrat. Soil samples from depths of 0–5 and 5–10 cm were taken from each pit, and three soil samples at the same depth and line transect were thoroughly mixed and homogenized to obtain a composite sample, thus producing five replicates at every GE and CK plot. At the same time, stones and plant roots were removed using a 2 mm sieve. A total of 100 composite soil samples were collected from 5 sites, each containing 2 plots, with 5 composite samples taken at 2 depths. Subsequently, each soil sample was divided into 2 parts. One part was stored at −20 °C for subsequent DNA extraction. The other part was naturally air-dried and used for the determination of soil physicochemical properties, as determined by Cui et al. [35]. Furthermore, soil organic matter (SOM) was measured by the Walkley and Black procedure [37], and SOC was obtained by the following equation: SOC = SOM/1.724. The changes in SOC were defined as the difference between the SOCGE and the SOCCK with the following equation: ΔSOC = (SOCGE − SOCCK)/GE years.

2.3. DNA Extraction and Sequencing

We selected composite samples synthesized from sample lines 1, 3, and 5 for microbial sequencing, totaling 60 samples. DNA was extracted from 0.5 g of soil samples with the PowerSoil DNA Kit (Omega Bio-tek, Norcross, GA, USA) according to the manufacturer’s protocol. The quality and quantity of DNA were evaluated using agarose gel electrophoresis and a NanoDrop ND-1000 spectrophotometer (Thermo Fisher Scientific, Waltham, MA, USA). The V4–V5 region of the bacterial 16S rRNA gene was amplified using the primer pairs 338F/806R. PCR amplifications were purified and recovered using magnetic beads (Vazyme VAHTSTM DNA Clean Beads, Nanjing, China) for purification and recovery and quantified by fluorescence using a microplate reader (BioTek, FLx800). Owing to the fluorescence quantification results and sequencing volume requirements, the amplicons were mixed in equal amounts and sequenced on a HiSeq2500 platform (Illumina Inc., Shanghai Parsenor Biotechnology Co., Ltd., Shanghai, China).
The sequencing data were bioinformatically analyzed using the QIIME2 (version 2018.11) platform. Raw sequencing data were imported into QIIME2, and noise reduction was performed using the q2-dada2-plugin. Subsequently, sequences with 97% similarity were clustered into operational taxonomic units (OTUs) using the vsearch plugin. Finally, the OTUs were annotated using SILVA annotations for the 16S rRNA gene. Further normalization of the OTUs table based on minimum read counts resolved the uneven sequencing depth between samples. All the sequencing data have been deposited in the NCBI Sequence Reads under accession number PRJNA886844.

2.4. Definition of the Six Bacterial Taxa

According to previous studies [38], all OTUs were divided into six groups: (1) abundant taxa (AAT) and (2) always rare taxa (ART), relative abundance ≥1% and <0.01% in all samples, respectively; (3) conditionally abundant taxa (CAT) and (4) conditionally rare taxa (CRT), OUTs with relative abundance ≥1% and <0.01% in some samples, respectively, but never rare (<0.01%) and abundant (≥1%) in any samples, respectively; (5) moderate taxa (MT), OTUs with relative abundance 0.01% to 1% in all samples; (6) conditionally rare and abundant taxa (CRAT), OTUs with relative abundance between <0.01% and ≥1%. In this study, AAT, CAT, and CRAT were considered together as abundant taxa and moderate taxa, and ART and CRT were considered together as rare taxa. It is important to note that “abundance” and “rare” are widely recognized in the ecological literature as being continuous. In any given study, there is always a certain amount of arbitrariness in determining the threshold of rarity. Here, we refer to other recent publications to define “abundant” and “rare” in order to facilitate comparisons between studies.

2.5. Statistical Analysis

The Shannon index of abundant and rare bacterial taxa was calculated, and statistical differences between treatments were determined using Kruskal–Wallis tests at a significance level of 0.05. Non-metric multidimensional scaling (NMDS) analysis based on the Bray–Curtis similarity matrices was used to assess the β-diversity in soil samples. PERMANOVA (permutation multivariate analysis of variance) was used to evaluate the significant differences in abundant and rare bacterial communities between GE and CK presented in NMDS. The above analyses were performed with the R (v.4.1.2) package “vegan” except for the specific description. Statistical significance of the relative abundance of rare and abundant bacterial phyla was assessed using the R (v.4.1.2) package “DESeq2”. The amount of change in bacterial communities after GE was calculated by the following equation: Δ = (XGE − XCK)/GE years, where X represents each indicator in the study.
Bacterial co-occurrence networks were performed using the R (v.4.1.2) packages “igraph” and “psych”. Only OTUs that appeared in over 20% of the sample were used in the network analysis to increase the confidence in correlations. Spearman correlations between OTUs were computed in the R package “psych”. Only robust correlations (|r|< 0.75, FDR corrected p < 0.01) were incorporated into networks, which were visualized in Gephi 0.9.3. Node properties and topological characteristics were analyzed using the R package “igraph”. Moreover, we calculated cohesion to further validate the results of the network analysis [39]. The stability of the network was evaluated by calculating the robustness using the method of Yuan et al. [40]. The statistical significance of each network indicator was assessed using Kruskal–Wallis tests at a significance level of 0.05. Among-module (Pi) and within-module (Zi) connectivity of the OTUs in the network were calculated. Here, to clearly illustrate, the topological roles of nodes were defined in four categories according to their Pi and Zi threshold value: connectors (Pi ≥ 0.62, Zi < 2.5), module hubs (Pi ≤ 0.62, Zi > 2.5), network hubs (Pi > 0.62, Zi > 2.5), and peripherals (Zi < 2.5, Pi < 0.62) [41]. The relationships between the changes of SOC and bacterial diversity (rare and abundant α- and β-diversity), bacterial networks (negative cohesion, positive cohesion, degree and betweenness), relative abundance of keystone taxa (rare and abundant bacteria) properties were analyzed by a linear mixed-effects model (LMM) using the “lme4” package in R. The sampling point locations were considered as random factors incorporated in LMM to mitigate the impact of random effects on the research findings. Spearman’s correlation was used to determine the correlation between bacterial characteristics and soil physicochemical properties.
Spearman’s correlation and random forest (RF) were utilized to determine the correlation between bacterial diversity indices, Bray–Curtis dissimilarity (NMDS1 in rare/abundant bacterial NMDS), relative abundance of keystone taxa, and SOC changes. Structural equation modeling (SEM) was conducted to evaluate the relative importance of bacterial diversity (rare and abundant α- and β-diversity), bacterial networks (negative cohesion, positive cohesion, degree and betweenness), and relative abundance of keystone taxa (rare and abundant bacterial) in SOC changes using the “piecewiseSEM” and “nlme” packages in R (v.4.1.2). The sampling point locations were considered as random factors incorporated in SEM to mitigate the impact of random effects on the research findings. The best model was assessed with Fisher’s C-test (p-value > 0.05) and the lowest AIC.

3. Results

3.1. Responses of Soil Physicochemical Properties and Different Bacterial Taxa to GE

In the 0–5 cm soil layer, GE led to decreased soil water content (SWC), pH, and bulk density (BD) in the XY, BL, and QT plots while positively affecting the MNS and HTB plots. The EC results are contrary to their findings. Positive TN, TP, and C/N appeared in BL, MNS, and HTB plots, while other plots yielded opposite results. At a depth of 5–10 cm, positive SWC, pH, and C/N appeared in BL, MNS, and HTB plots. In contrast, negative EC and TN appeared in XY, BL, and MNS plots, while the TP results demonstrated an opposite trend. Additionally, GE resulted in negative SOC in XY, MNS, and QT plots. Conversely, positive SOC appeared in BL and HTB plots within the 0–10 cm soil layer (Table S1).
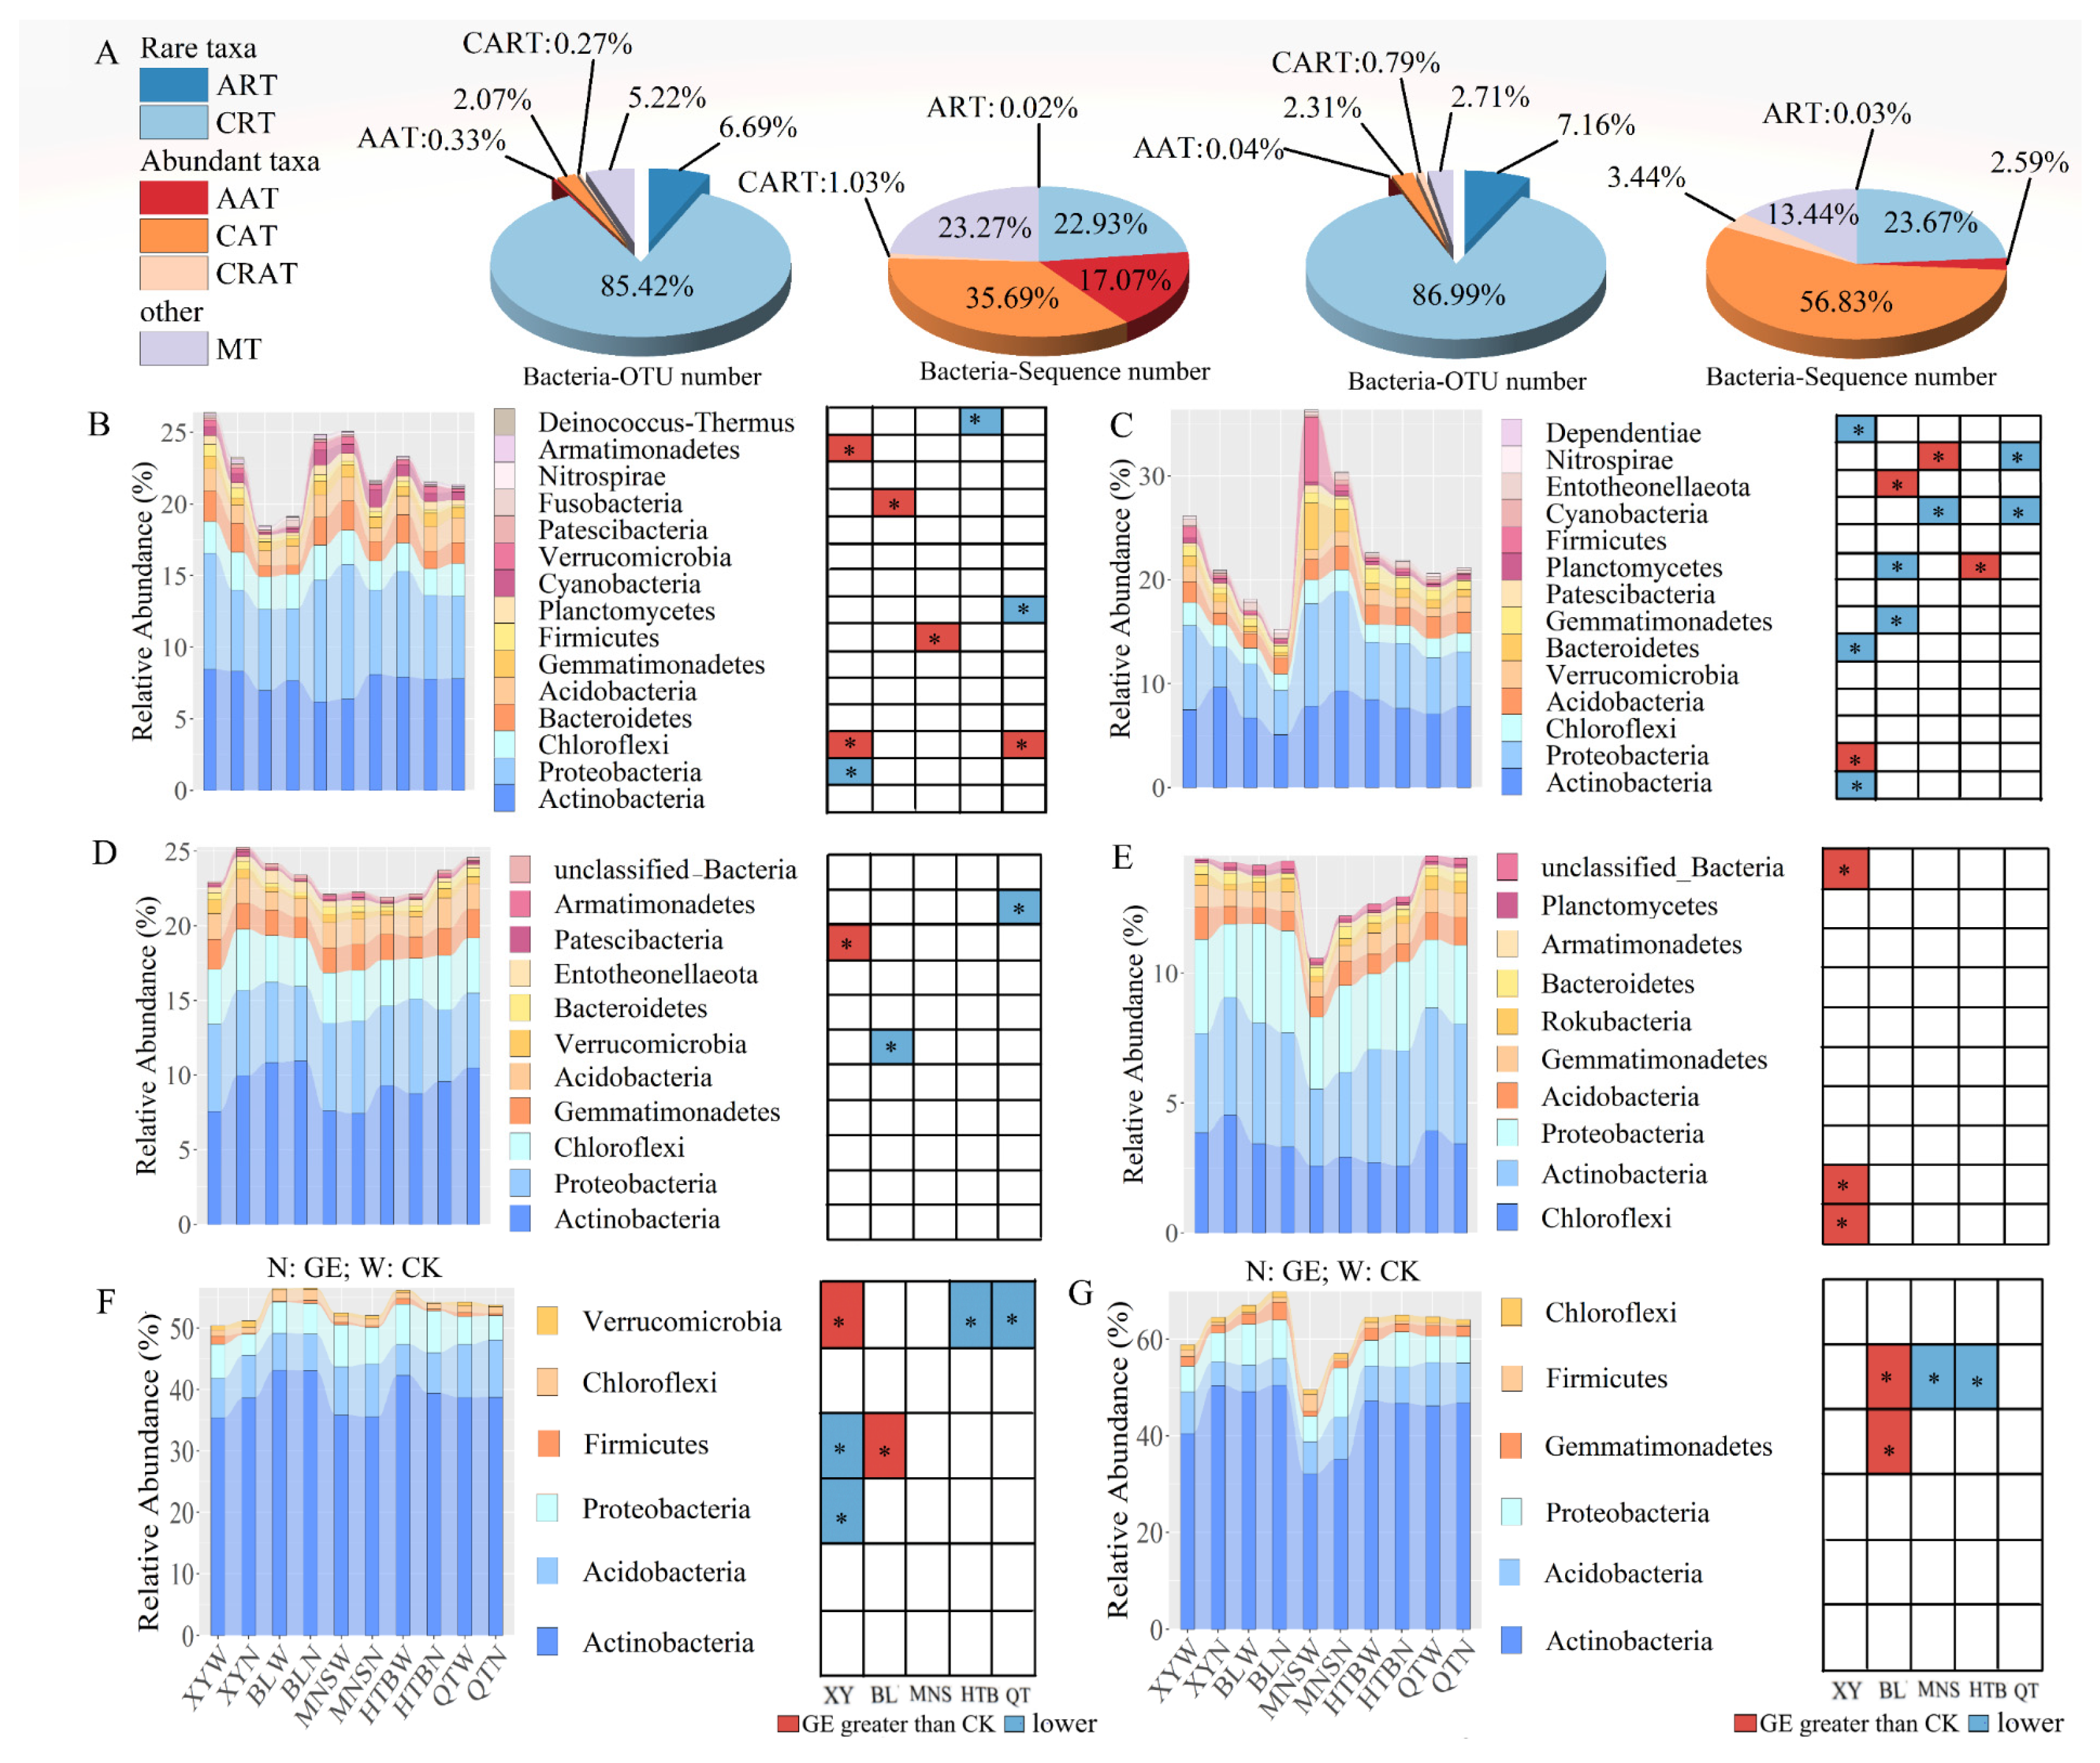
At the depths of 0–5 cm and 5–10 cm, smaller proportions (2.67~3.14%) of the bacterial OTUS were identified as abundant taxa, and their sequence count was 53.79~62.86%. Conversely, higher proportions (92.11~94.15%) of the OTUS were identified as rare taxa, and their sequence count was only 22.95~23.70%. In addition, among moderate taxa, smaller proportions (2.71~5.22%) of the OTUS constituted 13.44~23.27% of the total sequence count (Figure 2A).
In the 0–5 cm and 5–10 cm soil layers, Actinobacteria, Proteobacteria, and Chloroflexi were dominant in the rare phyla. These dominant phyla constituted 15.94% and 16.54% of all sequences, respectively (Figure 2B,C). Among moderate phyla, results are similar to those of abundant phyla (Figure 2D,E). By comparison, abundant bacterial taxa were composed of six phyla, with Actinobacteria, Proteobacteria, and Acidobacteria as dominant. Their contribution to the total sequences was 44.08~64.04% (Figure 2F,G).
At the depths of 0–5 cm and 5–10 cm, compared with abundant phyla (33.33~50.00%), more rare phyla (53.33~71.43%) changed significantly after GE (Figure 2B,C,F,G). The abundant and moderate phyla were quite stable, and their relative abundance was little affected by GE. For instance, GE resulted in a notable reduction in the relative abundance of Verrucomicrobia in the HTB and QT plots. In contrast, the XY plot was significantly increased in the 0–5 cm soil layer (Figure 2F). The relative abundance of Firmicutes significantly decreased in XY (0–5 cm), MNS, and HTB (5–10 cm) plots, but the BL plot showed an increase at 0–10 cm soil depth (p < 0.05, Figure 2F,G). Conversely, rare phyla were more strongly responsive to GE than abundant and moderate phyla, with dramatic changes in the abundance of Proteobacteria, Cyanobacteria, Planctomycetes, Chorolexi, and Entotheonellaeotes at different plots and soil layers (p < 0.05, Figure 2B,C). For example, the abundance of Chorolexi in rare phyla was observed to increase significantly in the 0–5 cm soil layer, while reversed results were observed for Cyanobacteria in the 5–10 cm soil layer. Additionally, the abundances of Planctomycetes and Nitrospirae increased significantly in the MNS and HTB plots but decreased significantly in the QT and BL plots (Figure 2B,C).

3.2. Diversity of the Different Bacterial Taxa in Response to GE

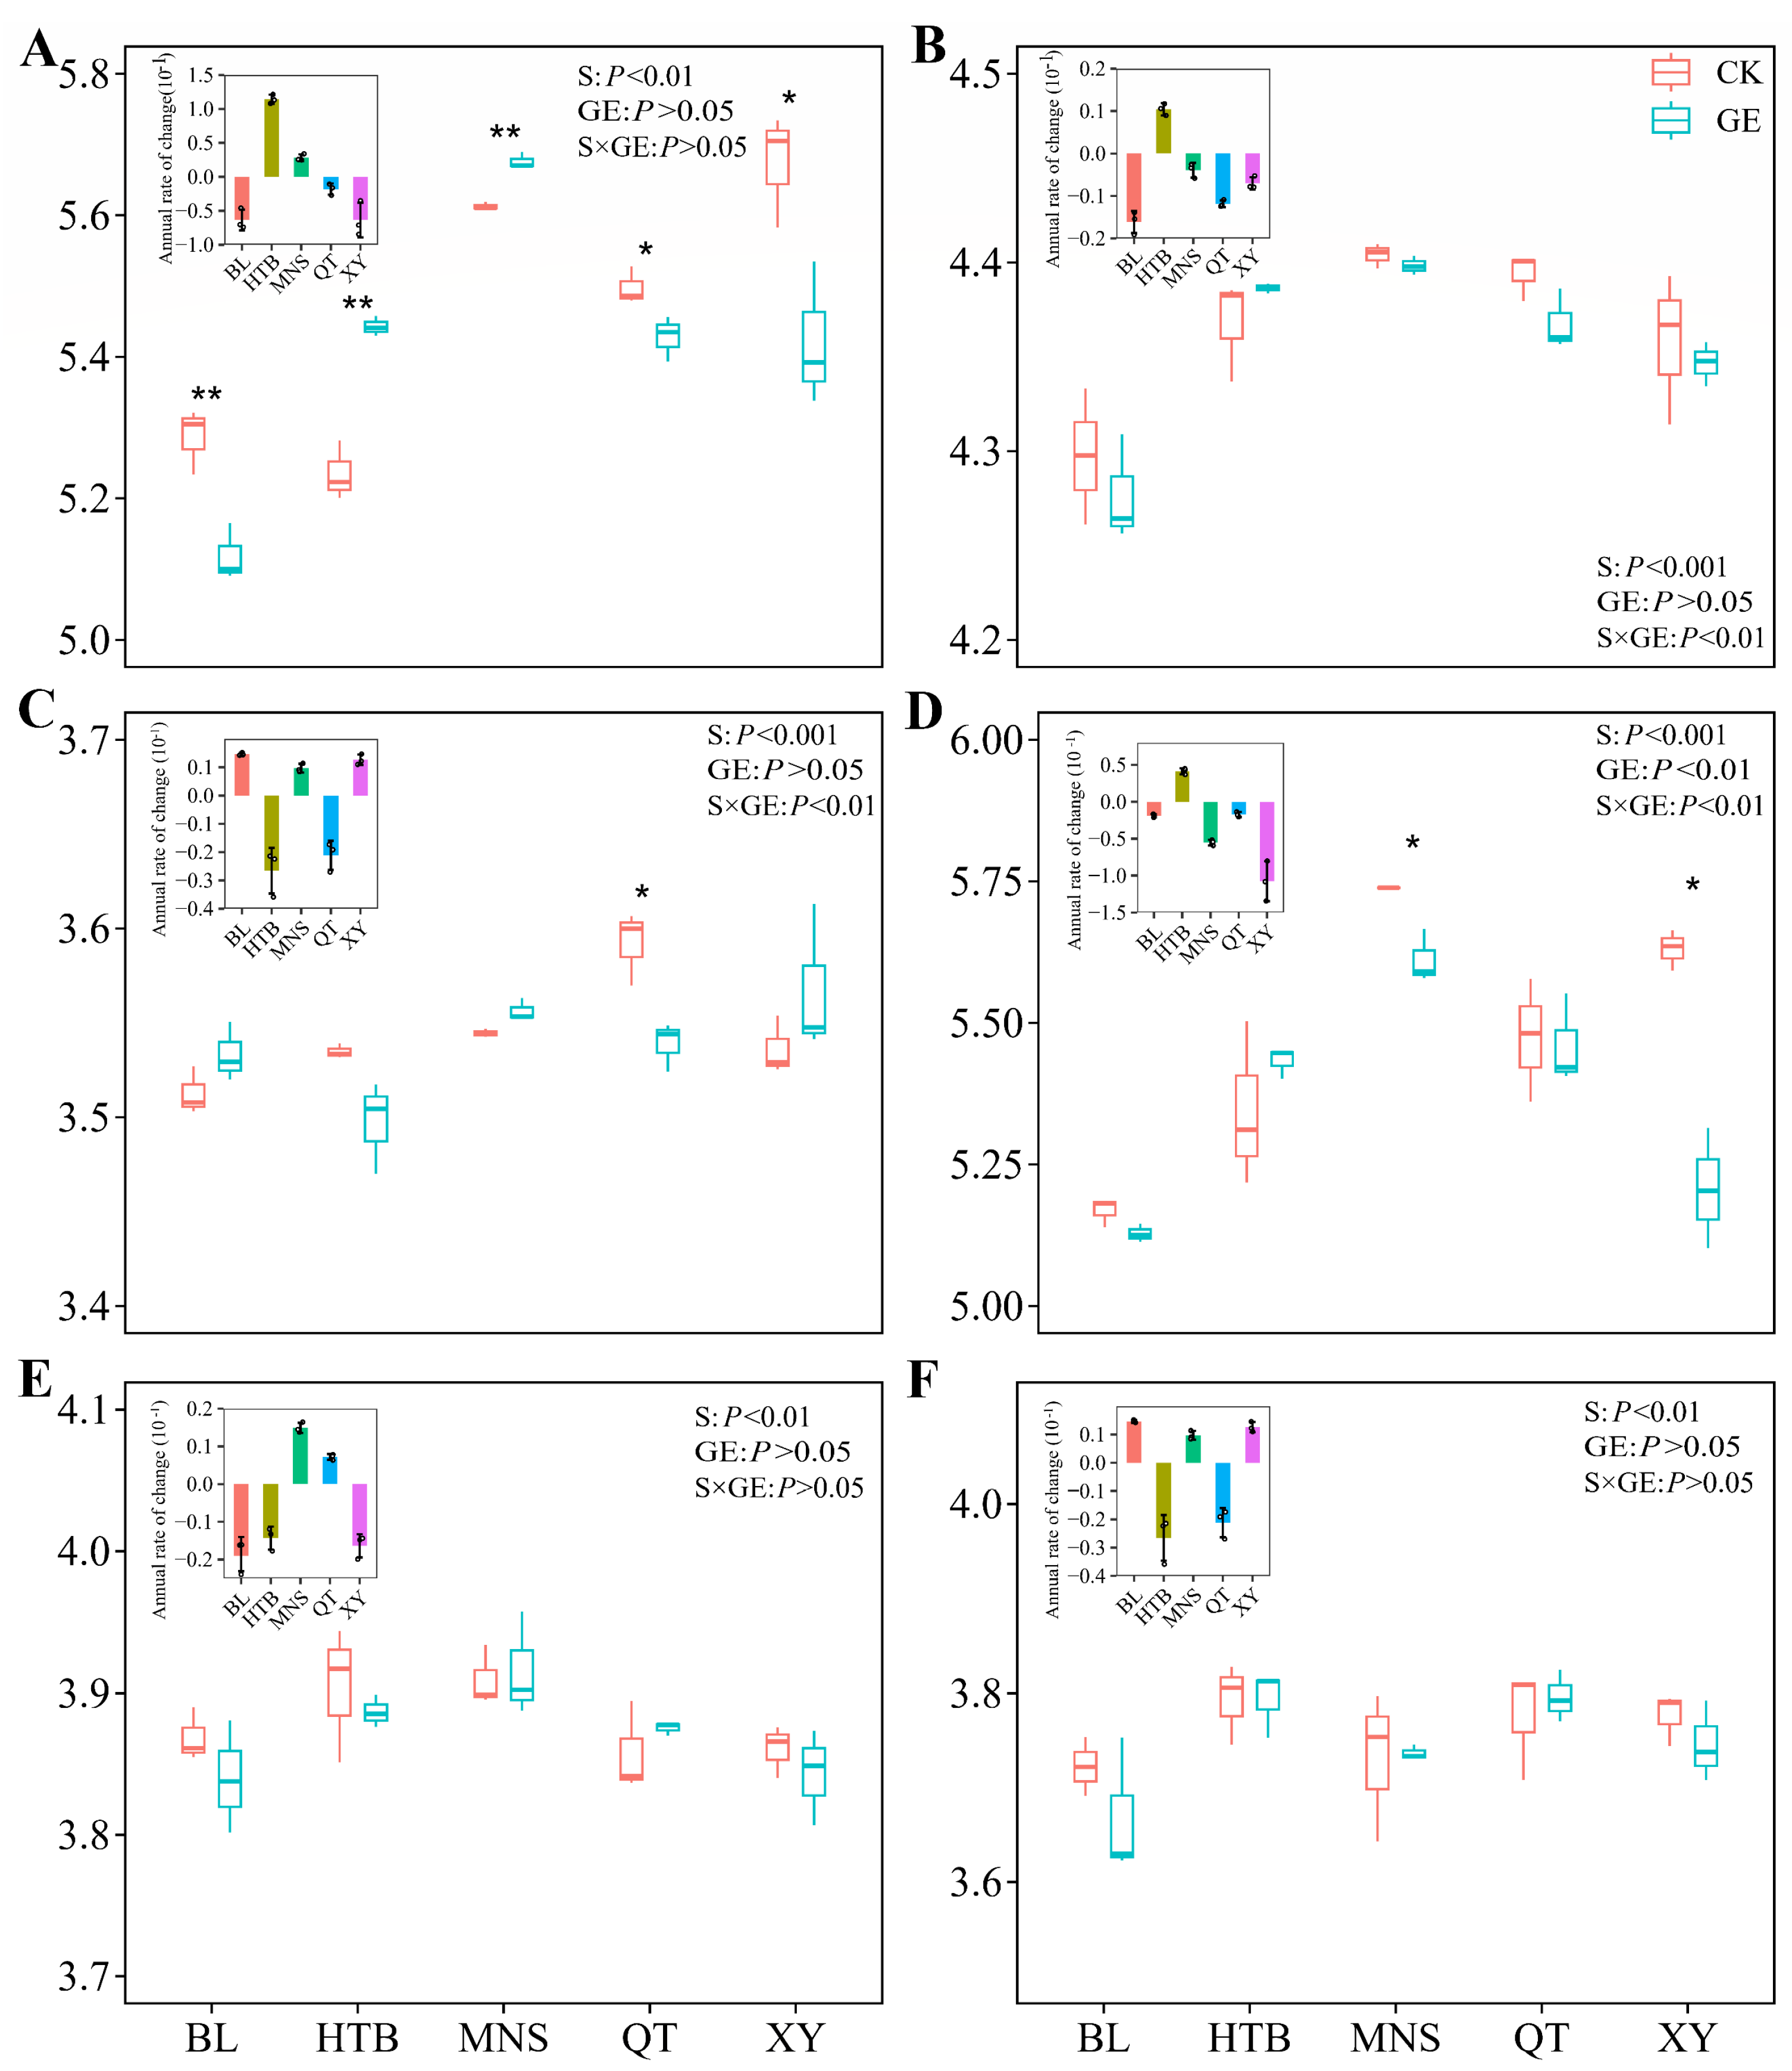
At the 0–5 cm soil layer, the Shannon index of rare taxa was significantly reduced by 4.44%, 3.17%, and 1.27% and the annual rate of change was −0.08 ± 0.004, −0.06 ±0.008, and −0.02 ± 0.004 in XY, BL, and QT plots, respectively. In contrast, it was significantly increased by 1.23% and 4.56% and the annual rate of change was 0.12 ± 0.01, 0.02 ± 0.003 in MNS and HTB plots, respectively (p < 0.05, Kruskal–Wallis test, Figure 3A). There was no significant difference in the α-diversity index of moderate taxa between GE and CK at soil depths of 0–5 cm (Figure 3B). The Shannon index of abundant taxa was significantly reduced by 1.48% and the annual rate of change was −0.01 ± 0.002 in the QT plot (Figure 3C). At the same time, the change in rare bacterial diversity was significantly positively linked with ΔBD, ΔpH, and ΔTP while showing a negative correlation with ΔEC (Figure S4A). At the 5–10 cm soil layer, only the Shannon index of the rare taxa notably dropped at the XY and MNS plots (p < 0.05, Figure 3D–F). Simultaneously, the change in rare bacterial diversity was significantly negatively correlated with the changes in EC and TN while showing a positive correlation with the change in TP (Figure S4B).
Overall, among different bacterial taxa, no clear separation was observed for GE and CK using non-metric multidimensional scaling analysis (NMDS) and permutation multivariate analysis of variance (PERMANOVA). The change in bacterial community patterns ranging from high to low was rare taxa (R = 0.044, Figure 4A,D), moderate taxa (R = 0.004, Figure 4B,E), and abundant taxa (R = −0.002, Figure 4C,F), respectively. However, the community composition of bacterial taxa responded differently to GE in different plots. At soil depths of 0–5 cm, the rare bacterial composition was only significantly different between GE and CK in XY (R = 0.64, p < 0.05) and HTB (R = 0.63, p < 0.05) plots, while for the moderate bacterial composition only in the HTB plot (R = 0.74, p< 0.05, Table S3). At the same time, the change in rare β-diversity was significantly negatively linked with ΔpH and ΔTP (Figure S4A). At a soil depth of 5–10 cm, GE only significantly altered the rare bacterial composition in XY (R = 0.78, p < 0.05) and BL (R = 0.37, p < 0.05) plots and the moderate bacterial composition only in the XY plot (R = 0.96, p < 0.05, Table S4). The change in rare β-diversity was significantly negatively linked with ΔSWC and ΔC/N (Figure S4B).

3.3. Changes in Bacterial Network Co-Occurrence Under GE

In the 0–5 cm and 5–10 cm soil layers, we found that GE increased the network size, and the bacterial network edges/nodes ratio increased by 29.60% (3.993 vs. 3.081) and 44.90% (4.670 vs. 3.223), respectively (Table 1). Compared with the CK network, we found that node properties changed little in the 0–5 cm soil layer, with similar results observed for topological characteristics (Figure 5B, Table 1). In contrast, the 5–10 cm soil layer exhibited significant increases in degree and betweenness, increased obviously by 47.52% and 49.46%, respectively, indicating increased network complexity. This was confirmed by changes in the topological properties of the whole bacterial network, which showed 52.00%, 50.00%, 10.32%, and 170.82% increases in connectance, density, clustering coefficient, and natural connectivity, respectively, in the GE network. Additionally, the degree of community complexity was quantified using cohesion, and it was found that GE decreased cohesion significantly, including total cohesion (13.09%) and positive cohesion (12.45%) in the 0–5 cm soil layer (Figure 5C). However, for the 5–10 cm soil layer, total cohesion changed little while displaying an 11.11% decrease in positive cohesion and a 16.99% increase in negative cohesion (Figure 5C). Furthermore, the proportion of negative correlations (39.73~44.67% and 26.56~38.55%) was greatly lower than that of positive correlations (55.34~60.72% and 61.45~73.44%) in bacterial networks of both the GE and CK plots in the 0–10 cm soil layer, suggesting cooperation among the bacterial communities (Table 1). GE weakened resistance in the 0–5 cm soil layer, including a 40.34% decrease in network robustness when 50% of the taxa were randomly removed, while network robustness changed little in the 5–10 cm soil layer (Table 1). The Zi-Pi plots were constructed to identify the keystone taxa in the bacterial networks. In the 0–5 cm soil layer, GE reduced the proportion of keystone taxa by 11.27% (Figure S1A), while the cumulative relative abundance of ones changed little. Nevertheless, the proportion and cumulative relative abundance of keystone taxa increased by 19.16% and 65.81%, respectively, in the 5–10 cm soil layer (Figure S1B). Additionally, keystone taxa were primarily dominated by Actinobacteria, Acidobacteria, and Proteobacteria in both 0–5 cm and 5–10 cm soil layers (Figure S2). Surprisingly, rare taxa were consistently high in keystone taxa and bacterial networks, even though their relative abundance was extremely low in the 0–10 cm soil layer (Figure 5A,B and Figure S3, Table S5). Additionally, in the 0–5 cm soil layer, the change in negative cohesion was significantly positively linked with ΔBD, ΔpH, and ΔTP while positively linked with ΔSWC in the 5–10 cm soil layer (Figure S4).

3.4. Relationship Between Soil Bacterial Taxa Characteristics and SOC Changes

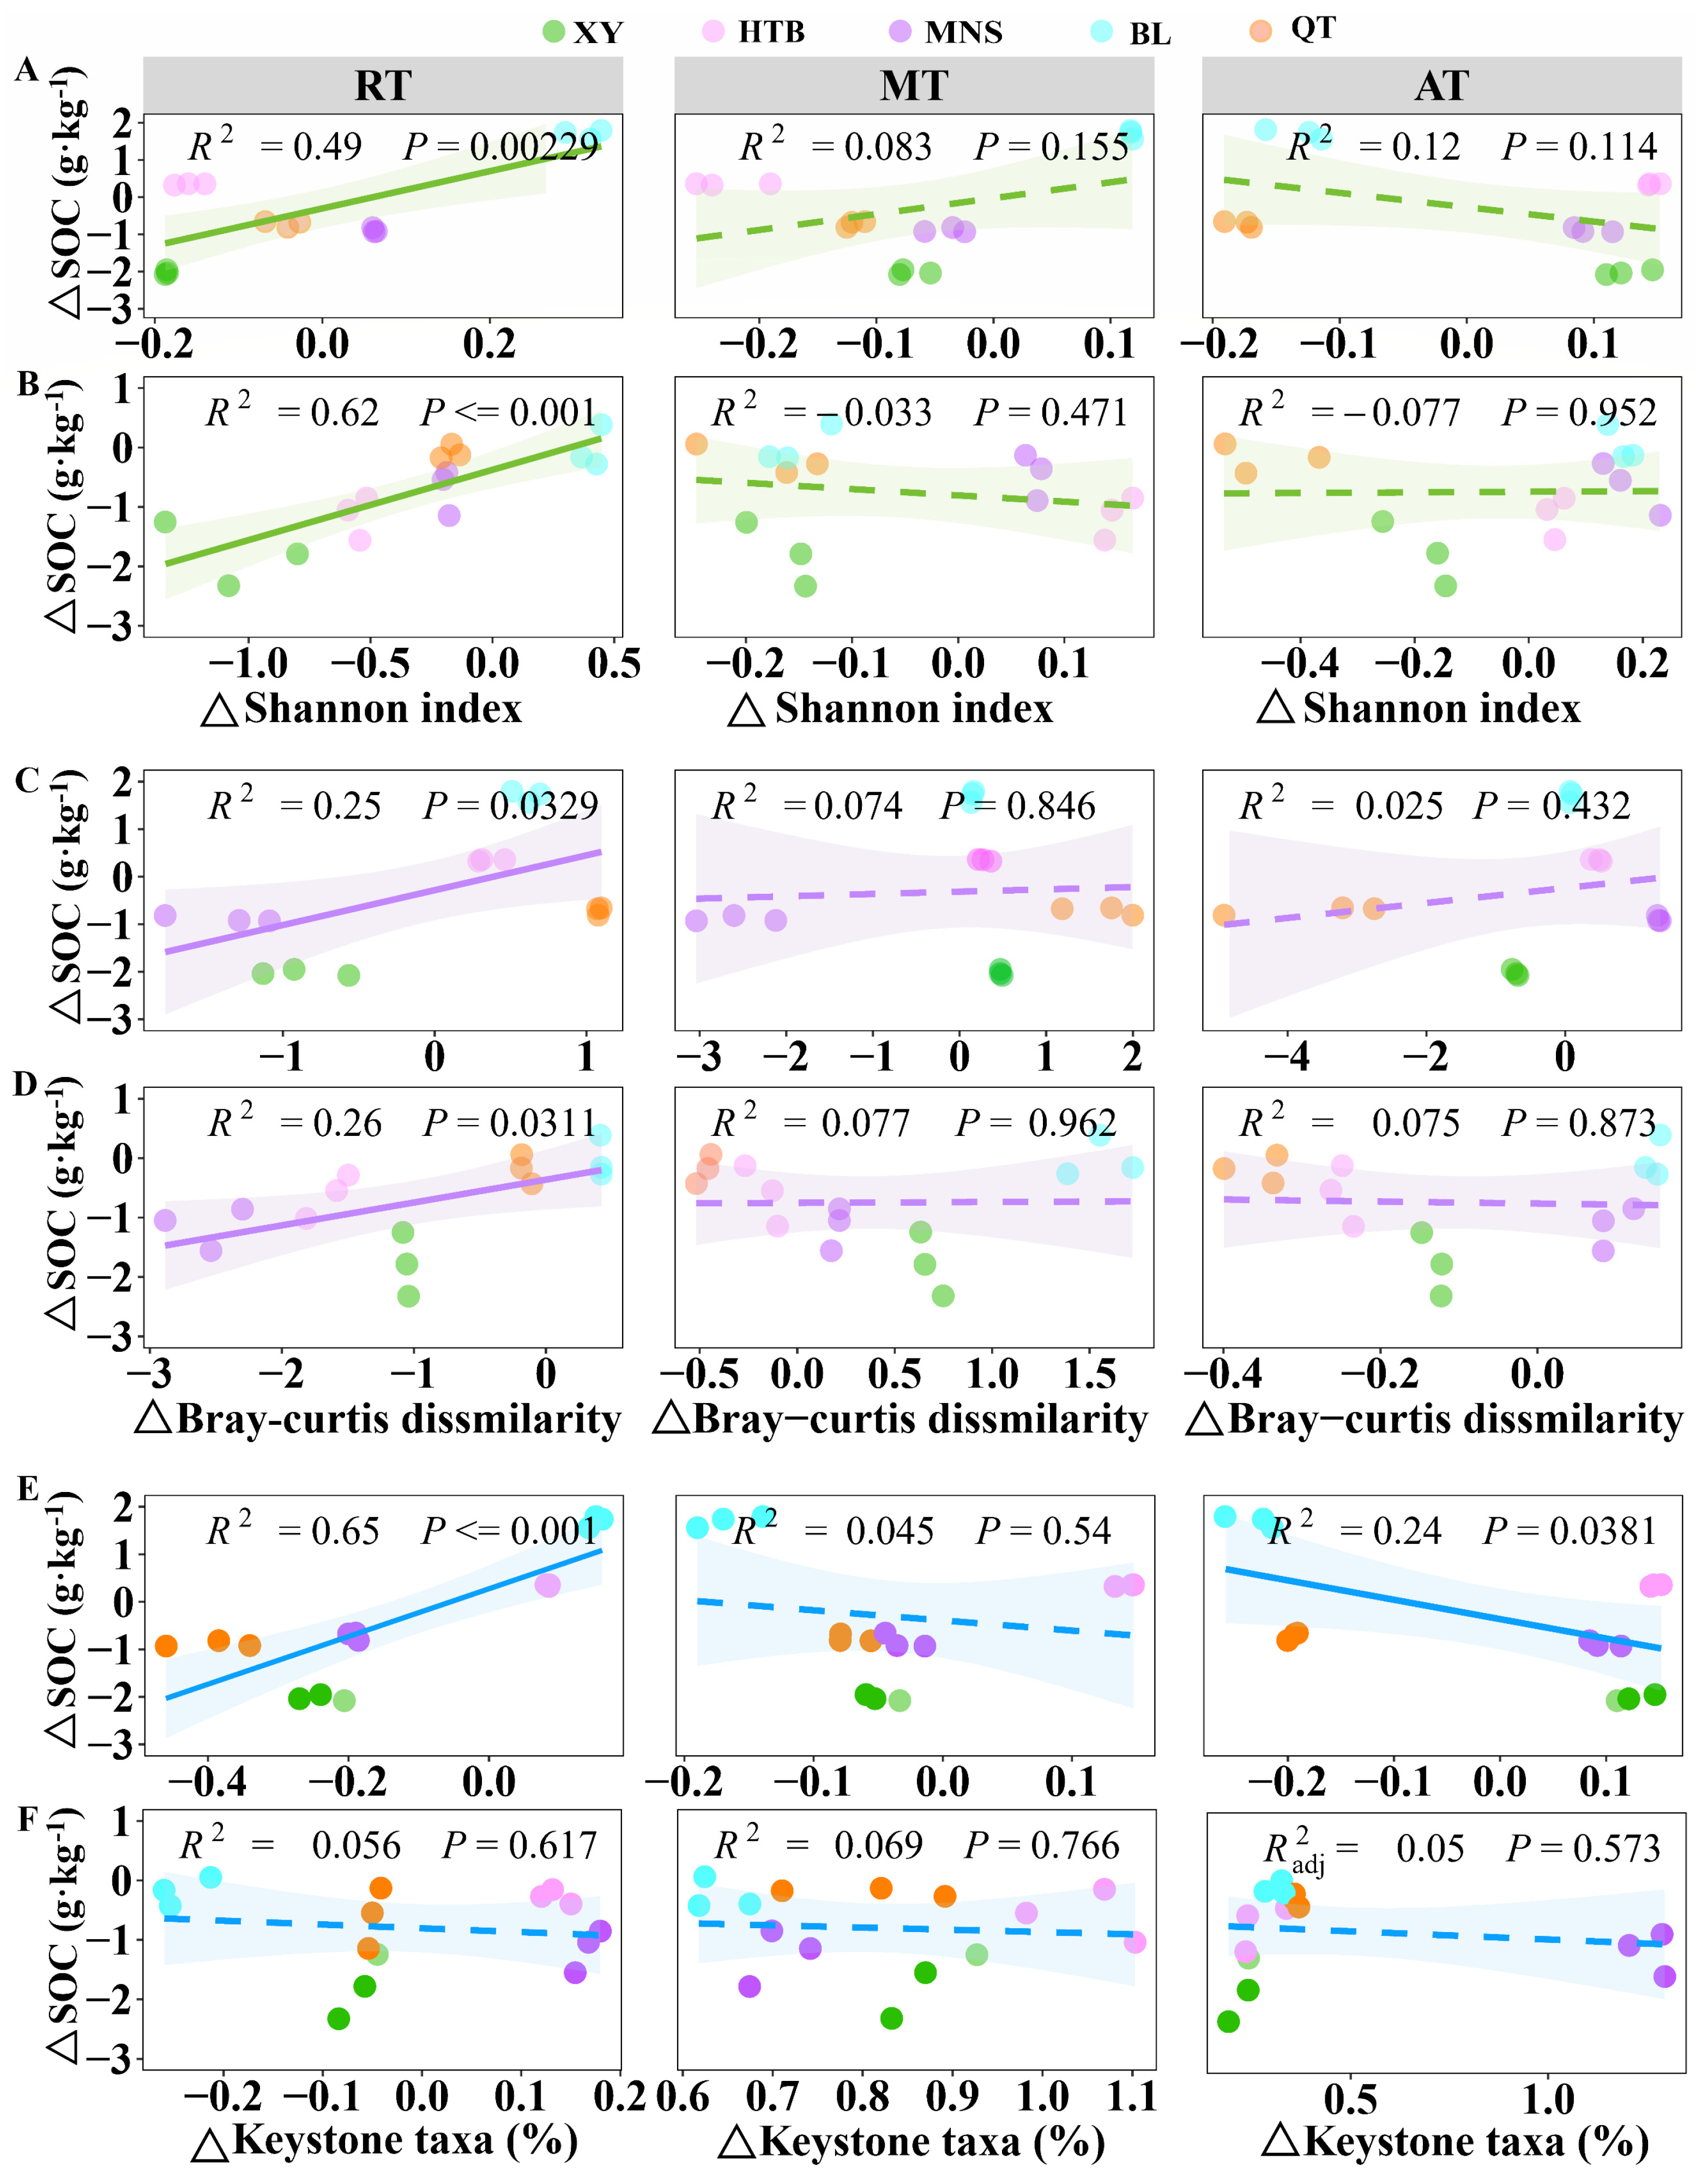
In the 0–5 cm soil layer, the SOC changes were significantly positively associated with the change in Shannon index and Bray–Curtis dissimilarity of rare taxa (Figure 6A,C), with similar results in the 5–10 cm soil layer (Figure 6B,D). Yet, compared to the 5–10 cm soil layer, the relative abundance change of keystone taxa of rare bacteria was significantly positively correlated with SOC changes in the 0–5 cm soil layer (Figure 6E,F). Furthermore, the change in Shannon index and Bray–Curtis dissimilarity of abundant and moderate bacterial taxa were not related to SOC changes in the 0–10 soil layer (Figure 6A–D,F). However, the relative abundance of keystone taxa was significantly negatively correlated with SOC changes in the 0–5 cm soil layer (Figure 6E). Through the further study of the dominant phyla in keystone taxa, we found that SOC changes were highly negatively correlated with the change in relative abundance of Acidobacteria and Proteobacteria but significantly positively with Actinobacteria and Gemmatimonadetes in the 0–5 cm soil layer (Figure S3A). In contrast, we found that only the change in relative abundance of Actinbacteria was significantly negatively correlated with SOC changes in the 5–10 cm soil layer (Figure S3B).
The Random Forest (RF) model predicted the effects of diversity, keystone taxa, and network complexity on ΔSOC, which explained 83% of the variation in the 0–5 cm soil layer, and the change of the relative abundance of rare keystone taxa in rare taxa was the most critical factor, followed by the Shannon index (Figure 7A). We further employed a structural equation model (SEM) to explore the effects of diversity, keystone taxa, and network complexity on ΔSOC, which explained 83% of the variation (Figure 7B). SEM and heatmap plots also supported the results of RF that changes in Shannon diversity (ΔShannonR, r = 0.69, p < 0.01) and keystone taxa abundance (ΔKeystoneR, r = 0.41, p < 0.05) in rare taxa significantly affect ΔSOC after GE (Figure 7A,B). At a depth of 5 to 10 cm of soil, RF and SEM explained 52% and 87% variations in ΔSOC, respectively, which also identified ΔMNDSR (r = −0.64, p < 0.05) and ΔBetweenness (r = 0.67, p < 0.01) as the most important driving predictors for ΔSOC (Figure 7C,D). The heatmap plot showed that network complexity (ΔBetweenness and ΔDegree) and diversity (ΔMNDSR and ΔShannonR) were closely linked to ΔSOC (Figure 7C).

4. Discussion

4.1. Response of Different Bacterial Taxa to GE

GE is an effective method for managing and restoring degraded grasslands [5]. Many studies have delved into the impacts of GE on bacterial community composition [14,35,42], enhancing our comprehension of the changes in bacterial communities in vegetation restoration. However, most of these studies have failed to examine the response of abundant and rare taxa to GE, particularly in the sagebrush desert. This study delved deeper into differences in bacterial composition and diversity within the sagebrush desert between these two taxa after GE. In our study, the bacterial rare phyla changed significantly more than the abundant and moderate phyla under GE in the sagebrush desert (Figure 2B–G), which was confirmed by changes in the Shannon index, which showed a significant reduction in rare taxa α-diversity. In contrast, abundant taxa changed little. These results suggest bacterial rare taxa were more sensitive to GE, which aligns with the results of Fan et al. [25]. These observed findings are consistent with previous research that focused on subtropical plateau grassland and sandy lands [29,43] but differed from outcomes in dryland and farmland ecosystems [29,44]. This difference may be explained by environmental stress levels and habitat heterogeneity [38,45]. In addition, rare taxa α-diversity showed a significant reduction in the XY, BL, and QT plots, while it was notably higher in the MNS and HTB plots. This may be attributed to the following: (1) grazing exclusion years. The XY, BL, and QT plots have more than 5 years of grazing exclusion, while the HTB and MNS plots have less than 5 years. (2) Litter biomass. Litter biomass was significantly lower in XY, BL, and QT plots but significantly higher in MNS and HTB plots. Litter decomposition returns aboveground biological resources to the soil, effectively reducing soil nutrients and energy outflows, increasing inter- and extraroot microbial activity, and increasing microbial diversity. (3) Soil physicochemical properties. GE led to decreased pH and BD in the XY, BL, and QT plots while positively affecting the MNS and HTB plots and showing a significant positive link with rare bacterial diversity (Table S1; Figure S4). Furthermore, the NMDS and PERMANOVA analysis also showed that the change in bacterial rare community similarity was higher than moderate and abundant taxa and in XY, BL, and HTB plots varied considerably after GE (Figure 4; Tables S3 and S4). These observed results in this study prove the view that abundant and moderate taxa were less sensitive to GE than rare ones, confirming our hypothesis. This is attributed to the differences in resource utilization and ecological niche between rare and abundant taxa [46]. Abundant bacterial taxa have a greater ecological niche breadth and can competitively utilize a wider range of resources than rare ones, and these strategies help them to be more resistant [38,47]. On the other hand, rare bacteria are characterized by high diversity, low density, high metabolic activity, and a narrow distribution of environmental breadth [27], so they can respond rapidly to grazing exclusion. This could explain why rare taxa exhibited higher sensitivity under GE (Figure 5). Similar results were reported for other types of environmental changes, such as vegetation recovery [29], pH disturbance [47], and environmental pollution [48,49]. These findings further substantiate that bacterial communities with elevated diversity reacted rapidly to environmental variations [50].

4.2. Response of Bacterial Network to GE

In natural ecosystems, microorganisms often create intricate patterns of co-occurrence that help improve their resilience to environmental changes [33,40,49,51]. Our results demonstrated that GE increased the edges/nodes ratio, suggesting an increase in the network size (Figure 5A,B; Table 1), which is inconsistent with research in temperate grasslands and may be a result of the barren soil nutrients of the sagebrush desert, where bacteria require large networks to optimize limited resources [34,35]. Higher node characteristics, topological characteristics, and cohesion indicate a higher network complexity [40,49]. Surprisingly, the complexity of the bacterial network in response to soil depth was not consistent. In this study, in the 0–5 soil layer, GE extremely significantly reduced cohesion, indicating a decrease in network complexity. However, in the 5–10 soil layer, the results are the opposite, including higher node properties, topological characteristics, and proportion of keystone taxa (Figure 5C,D; Figure S1; Table 1). This may be attributed to the following: (1) Environmental stress levels. Reportedly, by increasing microbial network complexity, bacteria were able to overcome environmental stresses and maintain metabolic activities [52]. In the 0–5 cm soil layer, which is more susceptible to grazing pressure, this could create more competition or cooperation to overcome environmental stress [53]. (2) Habitat nutrients. Soil microbial network complexity increases with increasing nutrients [54]. GE prompted a downward extension of root transport of root products, which was caused by an increase in nutrients in the lower soil layer. (3) Microbial networks in soil micro-aggregates have higher complexity [55]. This study showed that the top 0–5 cm of soil is more susceptible to animal trampling during grazing, which collapses soil pores and causes an increase in microaggregates [56]. We also observed more positive connections among the rare nodes and other nodes within the 0–10 cm soil layer (Table S5). Generally, positive interactions were considered cooperative relationships [57]. This result demonstrated that cooperation performed vital roles in bacterial rare taxa, which could explain their recoverability under GE. The same findings were found in aquatic and agricultural systems [28,58].
In addition to the interaction between species, network keystone taxa provide the community with higher biotic connectivity and support greater ecosystem functions [27,59]. In our study, the keystone taxa, module hubs, and connectors were dominated by rare bacterial OTUs (Figure 5A,B and Figure S3), suggesting that the rare bacterial composition could play irreplaceable parts in maintaining bacterial community structures. The results were consistent with those for other previous studies [60] but contradicted those of Jiao et al., who found that farmland environmental disturbances resulted in abundant taxa that dominated the stability of bacterial communities [47]. These conflicting findings can be explained by the degree of variability in environmental conditions among various systems, heterogeneity of environmental characteristics, and other reasons. Shi et al. found that rare taxa are the main hubs of the inter-rhizosphere network, and their loss could fragment modules and the network itself [61]. In this sense, GE shifted the stability and complexity of the sagebrush desert grassland ecosystems in a favorable direction. For rare taxa that may have higher functional redundancy, further validation of the function of different taxa by functional prediction is needed in the future.

4.3. Rare Bacterial Taxa Are More Likely to Drive SOC Changes

A rare biosphere is typically defined as including microbial taxa with low relative abundance [19]. In the present study, the rare bacteria (diversity index and keystone) have a strong driving effect on SOC changes (Figure 6 and Figure 7). This finding seems to conflict with the mass ratio theory that abundant taxa can perform a wide range of ecosystem functions, while rare taxa perform limited functions [24]. In fact, rare taxa in different ecosystems have gradually been shown to play key roles in C cycling [25,26], suggesting that their ecological relationship were widespread [62].
Presently, several ecological theories can support our findings. Firstly, rare taxa have higher nutrient cycling functions and significantly more functions associated with C cycling and cellulose degradation, indicating higher nutrient use efficiency [59,62]. Secondly, rare bacterial communities are sensitive indicators of environmental change or stress [48,63]. Rare taxa respond more to environmental changes and significantly impact soil carbon cycles [64]. In addition, network keystone taxa are dominated by rare bacteria (Figure 6A,B, Figure S3), which have high stability [46]. Stable rare taxa have the reservoir effect, providing a rapid response to environmental changes, protecting the stability of the entire community, and maintaining ecosystem function [19].
Another possible reason was that rare taxa had high diversity, increasing “functional redundancy”; metabolic functions are executed by many coexisting and taxonomically distinguished microorganisms [58]. As a result, many rare species with similar functions might not be needed to maintain function, considering an “insurance effect” [65]. Furthermore, the rarity of taxa is not permanent, and 1.5% to 28% of microorganisms are “conditionally rare taxa” that can dominate under specific conditions [46]. Microbial taxa considered functionally weak may become important in providing necessary functional features under the right conditions [66]. Further measurements of enzyme activity and live cell abundance are needed to support this claim.

5. Conclusions

Overall, our results indicated that the influence of GE on rare bacterial α- and β-diversity was greater than that in abundant taxa. Therefore, rare taxa were more sensitive to GE than abundant ones. However, due to variations in soil physicochemical properties across different plots following GE, rare bacterial α-diversity decreased in the XY, BL, and QT plots, while it increased in the MNS and HTB plots. Additionally, due to varying grazing pressures across different soil depths, GE reduced the complexity of bacterial networks in the 0–5 cm soil layer while increasing it in the 5–10 cm layer. The keystones consisted mainly of rare bacterial taxa that dominated the complexity and stability of the ecological network. Given that different bacterial taxa respond uniquely to GE, it suggests they may play distinct roles in carbon cycling. Thus, we focused on analyzing the relationship between changes in different bacterial taxa and SOC after GE. We found that rare taxa contributed more to the prediction of SOC than abundant taxa. Overall, these results may provide new perspectives on the ecological characteristics of bacterial communities in response to GE as well as improve the understanding of SOC changes mediated by bacterial taxa under GE. Such knowledge is key to the development of grassland restoration strategies in the sagebrush desert.

Supplementary Materials

The following supporting information can be downloaded at: https://www.mdpi.com/article/10.3390/agriculture15181959/s1, Figure S1: The Zi-Pi plots show the distribution of bacterial OTUs based on their topological roles in 0–5 cm (A) and 5–10 cm (B) soil layer; Figure S2: The taxonomic distribution of OTUs in each network module at the phylum level; Figure S3: Relationship between SOC accumulation and the relative abundances of dominant keystone taxa in 0–5 cm (A) and 5–10 cm (B) soil layer; Figure S4: Correlation analysis between the change in microbial characteristics and the change in soil physicochemical properties under grazing exclusion; Table S1: General conditions of the experimental sites; Table S2: Rate of change in soil physicochemical properties under grazing exclusion; Table S3: Analysis of Anosim testing different abundances, moderate, and rare bacterial communities at different plots in the 0–5 cm soil layer; Table S4: Analysis of Anosim testing different abundances, moderate, and rare bacterial communities at different plots in a 5–10 cm soil layer.

Author Contributions

B.Y.: Formal analysis (equal); investigation (equal); methodology (equal); visualization (lead); writing—original draft (lead); writing—review and editing (lead). Z.S.: Funding acquisition (lead); investigation (equal); project administration (lead); resources (equal). Y.C.: investigation (equal); investigation (equal); formal analysis (equal). H.L.: Data curation (equal); resources (equal); writing—review and editing (equal). All authors have read and agreed to the published version of the manuscript.

Funding

This research was funded by [National Natural Science Foundation of China] grant number [32060408], [Natural Science Foundation of Xinjiang Uygur Autonomous Region] grant number [2020D01A60], [Open Project of Key Laboratory of Xinjiang Uygur Autonomous Region] grant number [2022D04003], and [Postgraduate Scientific Research Innovation Project of Xinjiang Agricultural University] grant number [XJ202G117].

Institutional Review Board Statement

Not applicable

Data Availability Statement

The data that support the findings of this study are openly available in Zenedo at DOI: 10.5281/zenodo.14058643. The datasets generated and analyzed during the current study is available from the corresponding author on reasonable request.

Conflicts of Interest

The authors declare no conflicts of interest.

Abbreviations

AbbreviationFull Name
GEGrazing exclusion
XYXinyuan
BLBole
MNSManasi
HTBHutubi
QTQitai
SOCSoil organic carbon
SOMSoil organic matter
RFRandom Forest
ATAbundant taxa
RTRare taxa
MTModerate taxa
AATAlways abundant taxa
ARTAlways rare taxa
CRTConditionally rare taxa
CATConditionally abundant taxa
CARTConditionally rare and abundant taxa
SEMStructural equation model
LMMLinear mixed-effects model
NMDSNon-metric multidimensional scaling
PERMANOVAPermutation multivariate analysis of variance
OTUOperational taxonomic unit
NCNegative cohesion
PCPositive cohesion
ECElectrical conductivity
TNTotal nitrogen
TPTotal phosphorus
SWCSoil water content
BDBulk density
Δ(GE-CK)/GE years

References

  1. Dlamini, P.; Chivenge, P.; Chaplot, V. Overgrazing decreases soil organic carbon stocks the most under dry climates and low soil pH: A meta-analysis shows. Agric. Ecosyst. Environ. 2016, 221, 258–269. [Google Scholar] [CrossRef]
  2. Zhou, X.; Wu, F. Land-use conversion from open field to greenhouse cultivation differently affected the diversities and assembly processes of soil abundant and rare fungal communities. Sci. Total. Environ. 2021, 788, 147751. [Google Scholar] [CrossRef]
  3. Bardgett, R.D.; Bullock, J.M.; Lavorel, S.; Manning, P.; Schaffner, U.; Ostle, N.; Chomel, M.; Durigan, G.; Fry, E.L.; Johnson, D.; et al. Combatting global grassland degradation. Nat. Rev. Earth Environ. 2021, 2, 720–735. [Google Scholar] [CrossRef]
  4. Deng, L.; Shangguan, Z.P.; Wu, G.L.; Chang, X.-F. Effects of grazing exclusion on carbon sequestration in China’s grassland. Earth-Sci. Rev. 2017, 173, 84–95. [Google Scholar] [CrossRef]
  5. Xiong, D.; Shi, P.; Zhang, X.; Zou, C.B. Effects of grazing exclusion on carbon sequestration and plant diversity in grasslands of China: A meta-analysis. Ecol. Eng. 2016, 94, 647–655. [Google Scholar] [CrossRef]
  6. Deng, L.; Sweeney, S.; Shangguan, Z. Long-term effects of natural enclosure: Carbon stocks, sequestration rates and potential for grassland ecosystems in the Loess Plateau. Clean 2014, 42, 617–625. [Google Scholar] [CrossRef]
  7. Listopad, C.M.; Köbel, M.; Príncipe, A.; Gonçalves, P.; Branquinho, C. The effect of grazing exclusion over time on structure, biodiversity, and regeneration of high nature value farmland ecosystems in Europe. Sci. Total. Environ. 2018, 610–611, 926–936. [Google Scholar] [CrossRef]
  8. Cao, J.; Jiao, Y.; Che, R.; Holden, N.M.; Zhang, X.; Biswas, A.; Feng, Q. The effects of grazer exclosure duration on soil microbial communities on the Qinghai-Tibetan Plateau. Sci. Total. Environ. 2022, 839, 156238. [Google Scholar] [CrossRef] [PubMed]
  9. Wiesmeier, M.; Urbanski, L.; Hobley, E.; Lang, B.; von Lützow, M.; Marin-Spiotta, E.; van Wesemael, B.; Rabot, E.; Ließ, M.; Garcia-Franco, N.; et al. Soil organic carbon storage as a key function of soils—A review of drivers and indicators at various scales. Geoderma 2019, 333, 149–162. [Google Scholar] [CrossRef]
  10. Cao, J.; Wang, L.; Adamowski, J.F.; Biswas, A.; Alizadeh, M.R.; Feng, Q. A context-dependent response of soil carbon and nitrogen to grazing exclusion: Evidence from a global meta-analysis. J. Clean. Prod. 2024, 434, 139792. [Google Scholar] [CrossRef]
  11. Jing, Z.; Chen, R.; Wei, S.; Feng, Y.; Zhang, J.; Lin, X. Response and feedback of C mineralization to P availability driven by soil microorganisms. Soil Biol. Biochem. 2017, 105, 111–120. [Google Scholar] [CrossRef]
  12. Maron, P.A.; Mougel, C.; Ranjard, L. Soil microbial diversity: Methodological strategy, spatial overview and functional interest. Comptes Rendus Biol. 2011, 334, 403–411. [Google Scholar] [CrossRef]
  13. Fierer, N.; Bradford, M.A.; Jackson, R.B. Toward an ecological classification of soil bacteria. Ecology 2007, 88, 1354–1364. [Google Scholar] [CrossRef]
  14. Zang, Z.; Li, Y.; Wang, Y.; Zhang, Y.; Deng, S.; Guo, X.; Yang, K.; Zhao, W. Contrasting roles of plant, bacterial, and fungal diversity in soil organic carbon accrual during ecosystem restoration: A meta-analysis. Sci. Total Environ. 2024, 930, 172767. [Google Scholar] [CrossRef] [PubMed]
  15. Fan, D.; Kong, W.; Wang, F.; Yue, L.; Li, X. Fencing decreases microbial diversity but increases abundance in grassland soils on the Tibetan Plateau. Land Degrad. Dev. 2020, 31, 2577–2590. [Google Scholar] [CrossRef]
  16. Cheng, J.; Jing, G.; Wei, L.; Jing, Z. Long-term grazing exclusion effects on vegetation characteristics, soil properties and bacterial communities in the semi-arid grasslands of China. Ecol. Eng. 2016, 97, 170–178. [Google Scholar] [CrossRef]
  17. Wang, Z.; Li, X.; Ji, B.; Struik, P.C.; Jin, K.; Tang, S. Coupling between the responses of plants, soil, and microorganisms following grazing exclusion in an overgrazed grassland. Front. Plant Sci. 2021, 12, 640789. [Google Scholar] [CrossRef]
  18. Delgado-Baquerizo, M.; Reith, F.; Dennis, P.G.; Hamonts, K.; Powell, J.R.; Young, A.; Singh, B.K.; Bissett, A. Ecological drivers of soil microbial diversity and soil biological networks in the Southern Hemisphere. Ecology 2018, 99, 583–596. [Google Scholar] [CrossRef]
  19. Lynch, M.D.; Neufeld, J.D. Ecology and exploration of the rare biosphere. Nat. Rev. Microbiol. 2015, 13, 217–229. [Google Scholar] [CrossRef]
  20. Yuan, X.; Cui, J.; Wu, L.; Liu, C.-C.; Zhang, Q.; Zeng, Q.; Zhou, J.; Lin, K.; Wu, Y.; Lin, H.; et al. Relationship between soil bacterial communities and dissolved organic matter in a subtropical Pinus taiwanensis forest after short-term nitrogen addition. For. Ecol. Manag. 2022, 512, 120165. [Google Scholar] [CrossRef]
  21. Liu, B.; Arlotti, D.; Huyghebaert, B.; Tebbe, C.C. Disentangling the impact of contrasting agricultural management practices on soil microbial communities—Importance of rare bacterial community members. Soil Biol. Biochem. 2022, 166, 108573. [Google Scholar] [CrossRef]
  22. Philippot, L.; Spor, A.; Hénault, C.; Bru, D.; Bizouard, F.; Jones, C.M.; Sarr, A.; Maron, P.A. Loss in microbial diversity affects nitrogen cycling in soil. ISME J. 2013, 7, 1609–1619. [Google Scholar] [CrossRef]
  23. Pedrós-Alió, C. Marine microbial diversity: Can it be determined? Trends Microbiol. 2006, 14, 257–263. [Google Scholar] [CrossRef] [PubMed]
  24. Zhao, Z.Y.; Ma, Y.T.; Feng, T.Y.; Kong, X.; Wang, Z.H.; Zheng, W.; Zhai, B.N. Assembly processes of abundant and rare microbial communities in orchard soil under a cover crop at different periods. Geoderma 2022, 406, 115543. [Google Scholar] [CrossRef]
  25. Fan, J.L.; Zhang, C.H.; Jin, H.; Zhang, J.; Han, G.D. Grazing accelerates labile and recalcitrant soil carbon loss driving by rare microbial taxa in a desert steppe. Land Degrad. Dev. 2021, 32, 4241–4253. [Google Scholar] [CrossRef]
  26. Shu, D.T.; Guo, Y.Q.; Zhang, B.G.; Zhang, C.F.; Van Nostrand, J.D.; Lin, Y.B.; Zhou, J.Z.; Wei, G.H. Rare prokaryotic sub-communities dominate the complexity of ecological networks and soil multinutrient cycling during long-term secondary succession in China’s Loess Plateau. Sci. Total Environ. 2021, 774, 145737. [Google Scholar] [CrossRef]
  27. Jousset, A.; Bienhold, C.; Chatzinotas, A.; Gallien, L.; Gobet, A.; Kurm, V.; Kusel, K.; Rillig, M.C.; Rivett, D.W.; Salles, J.F.; et al. Where less may be more: How the rare biosphere pulls ecosystems strings. ISME J. 2017, 11, 853–862. [Google Scholar] [CrossRef]
  28. Wan, W.J.; Grossart, H.P.; He, D.L.; Yuan, W.K.; Yang, Y.Y. Stronger environmental adaptation of rare rather than abundant bacterioplankton in response to dredging in eutrophic Lake Nanhu (Wuhan, China). Water Res. 2021, 190, 116751. [Google Scholar] [CrossRef] [PubMed]
  29. Pan, H.; Gao, H.; Peng, Z.; Chen, B.; Chen, S.; Liu, Y.; Gu, J.; Wei, X.; Chen, W.; Wei, G.; et al. Aridity threshold induces abrupt change of soil abundant and rare bacterial biogeography in dryland ecosystems. mSystems 2022, 7, e0130921. [Google Scholar] [CrossRef]
  30. Xue, M.; Guo, Z.; Gu, X.; Gao, H.; Weng, S.; Zhou, J.; Gu, D.; Lu, H.; Zhou, X. Rare rather than abundant microbial communities drive the effects of long-term greenhouse cultivation on ecosystem functions in subtropical agricultural soils. Sci. Total Environ. 2020, 706, 136004. [Google Scholar] [CrossRef] [PubMed]
  31. Barberán, A.; Casamayor, E.O. A phylogenetic perspective on species diversity, β-diversity and biogeography for the microbial world. Mol. Ecol. 2014, 23, 5868–5876. [Google Scholar] [CrossRef]
  32. Faust, K.; Raes, J. Microbial interactions: From networks to models. Nat. Rev. Microbiol. 2012, 10, 538–550. [Google Scholar] [CrossRef]
  33. Banerjee, S.; Schlaeppi, K.; van der Heijden, M.G.A. Keystone taxa as drivers of microbiome structure and functioning. Nat. Rev. Microbiol. 2018, 16, 567–576. [Google Scholar] [CrossRef]
  34. Dong, Y.Q.; Yang, H.L.; Sun, Z.J.; An, S.Z. Difference of soil carbon density under different grazing exclusion duration in seriphidium transiliense desert with distinct degrees of degradation. Arid. Land Res. Manag. 2021, 35, 198–212. [Google Scholar] [CrossRef]
  35. Cui, Y.X.; Dong, Y.Q.; Liu, H.X.; Sun, Z.J. Short-term grazing exclusions reduced soil organic carbon but not bacterial diversity in the sagebrush desert, Northwest China. Glob. Ecol. Conserv. 2021, 31, e01872. [Google Scholar] [CrossRef]
  36. Fierer, N. Embracing the unknown: Disentangling the complexities of the soil microbiome. Nat. Rev. Microbiol. 2017, 15, 579–590. [Google Scholar] [CrossRef] [PubMed]
  37. Nelson, D.; Sommers, L.E. Total carbon, organic carbon, and organic matter. In Methods of Soil Analysis. Part 2; Page, A.L., Miller, D.R., Keeney, D.R., Eds.; American Society of Agronomy, Inc.: Madison, WI, USA, 1982; pp. 230–257. [Google Scholar] [CrossRef]
  38. Liang, Y.T.; Xiao, X.; Nuccio, E.E.; Yuan, M.T.; Zhang, N.; Xue, K.; Cohan, F.M.; Zhou, J.Z.; Sun, B. Differentiation strategies of soil rare and abundant microbial taxa in response to changing climatic regimes. Environ. Microbiol. 2020, 22, 1327–1340. [Google Scholar] [CrossRef]
  39. Herren, C.M.; McMahon, K.D. Cohesion: A method for quantifying the connectivity of microbial communities. ISME J. 2017, 11, 2426–2438. [Google Scholar] [CrossRef]
  40. Yuan, M.M.; Guo, X.; Wu, L.; Zhang, Y.; Xiao, N.; Ning, D.; Shi, Z.; Zhou, X.; Wu, L.; Yang, Y.; et al. Climate warming enhances microbial network complexity and stability. Nat. Clim. Change 2021, 11, 343–348. [Google Scholar] [CrossRef]
  41. Dong, K.; Yu, Z.; Kerfahi, D.; Lee, S.S.; Li, N.; Yang, T.; Adams, J.M. Soil microbial co-occurrence networks become less connected with soil development in a high arctic glacier foreland succession. Sci. Total Environ. 2022, 813, 152565. [Google Scholar] [CrossRef]
  42. Hu, J.P.; Zhang, M.X.; Lü, Z.L.; He, Y.Y.; Yang, X.X.; Khan, A.; Xiong, Y.C.; Fang, X.L.; Dong, Q.M.; Zhang, J.L. Grazing practices affect phyllosphere and rhizosphere bacterial communities of Kobresia humilis by altering their network stability. Sci. Total Environ. 2023, 900, 165814. [Google Scholar] [CrossRef]
  43. Chen, W.; Zhou, H.; Wu, Y.; Wang, J.; Zhao, Z.; Li, Y.; Qiao, L.; Chen, K.; Liu, G.; Ritsema, C.; et al. Long-term warming impacts grassland ecosystem function: Role of diversity loss in conditionally rare bacterial taxa. Sci. Total Environ. 2023, 892, 164722. [Google Scholar] [CrossRef]
  44. Li, W.; Shi, F.; Yi, S.; Feng, T.; Wang, C.; Li, Z.; Zheng, W.; Zhai, B. Soil multifunctionality predicted by bacterial network complexity explains differences in wheat productivity induced by fertilization management. Eur. J. Agron. 2024, 153, 127058. [Google Scholar] [CrossRef]
  45. Qin, Q.; Wang, Y.; Qiu, C.; Zheng, D.; Liu, Y. Wildfire drives the transition from deterministic- to stochastic-dominated community assembly of abundant bacterial in forest soils. Catena 2022, 215, 106290. [Google Scholar] [CrossRef]
  46. Chen, J.; Wang, P.; Wang, C.; Wang, X.; Miao, L.; Liu, S.; Yuan, Q.; Sun, S. Distinct assembly mechanisms underlie similar biogeographic patterns of rare and abundant bacterioplankton in cascade reservoirs of a large river. Front. Microbiol. 2020, 11, 158. [Google Scholar] [CrossRef] [PubMed]
  47. Jiao, S.; Lu, Y. Soil pH and temperature regulate assembly processes of abundant and rare bacterial communities in agricultural ecosystems. Environ. Microbiol. 2020, 22, 1052–1065. [Google Scholar] [CrossRef]
  48. Xu, M.; Huang, Q.Y.; Xiong, Z.Q.; Liao, H.G.; Lv, Z.; Chen, W.L.; Luo, X.S.; Hao, X.L. Distinct responses of rare and abundant microbial taxa to in situ chemical stabilization of cadmium-contaminated soil. mSystems 2021, 6, e0104021. [Google Scholar] [CrossRef]
  49. Du, S.C.; Dini-Andreote, F.; Zhang, N.; Liang, C.L.; Yao, Z.Y.; Zhang, H.J.; Zhang, D.M. Divergent co-occurrence patterns and assembly processes structure the abundant and rare bacterial communities in a salt marsh ecosystem. Appl. Environ. Microbiol. 2020, 86, e00322-20. [Google Scholar] [CrossRef]
  50. Allison, S.D.; Martiny, J.B.H. Resistance, resilience, and redundancy in microbial communities. Proc. Natl. Acad. Sci. USA 2008, 105, 11512–11519. [Google Scholar] [CrossRef]
  51. Sun, J.; Zhou, H.; Cheng, H.; Chen, Z.; Wang, Y. Bacterial abundant taxa exhibit stronger environmental adaption than rare taxa in the Arctic Ocean sediments. Mar. Environ. Res. 2024, 199, 106624. [Google Scholar] [CrossRef] [PubMed]
  52. Santolini, M.; Barabasi, A.L. Predicting perturbation patterns from the topology of biological networks. Proc. Natl. Acad. Sci. USA 2018, 115, 6375–6383. [Google Scholar] [CrossRef]
  53. Menéndez-Serra, M.; Ontiveros, V.J.; Barberán, A.; Casamayor, E.O. Absence of stress-promoted facilitation coupled with a competition decrease in the microbiome of ephemeral saline lakes. Ecology 2022, 103, e3834. [Google Scholar] [CrossRef]
  54. Qiu, L.P.; Zhang, Q.; Zhu, H.S.; Reich, P.B.; Banerjee, S.; van der Heijden, M.G.A.; Sadowsky, M.J.; Ishii, S.; Jia, X.; Shao, M.; et al. Erosion reduces soil microbial diversity, network complexity and multifunctionality. ISME J. 2021, 15, 2474–2489. [Google Scholar] [CrossRef]
  55. Liu, D.; Bhople, P.; Keiblinger, K.M.; Wang, B.; An, S.; Yang, N.; Chater, C.C.C.; Yu, F. Soil rehabilitation promotes resilient microbiome with enriched keystone taxa than agricultural infestation in barren soils on the Loess Plateau. Biology 2021, 10, 1261. [Google Scholar] [CrossRef]
  56. Shrestha, B.M.; Singh, B.R.; Sitaula, B.K.; Lal, R.; Bajracharya, R.M. Soil aggregate- and particle-associated organic carbon under different land uses in nepal. Soil Sci. Soc. Am. J. 2007, 71, 1194–1203. [Google Scholar] [CrossRef]
  57. Ju, F.; Xia, Y.; Guo, F.; Wang, Z.P.; Zhang, T. Taxonomic relatedness shapes bacterial assembly in activated sludge of globally distributed wastewater treatment plants. Environ. Microbiol. 2014, 16, 2421–2432. [Google Scholar] [CrossRef]
  58. Louca, S.; Polz, M.F.; Mazel, F.; Albright, M.B.N.; Huber, J.A.; O’Connor, M.I.; Ackermann, M.; Hahn, A.S.; Srivastava, D.S.; Crowe, S.A.; et al. Function and functional redundancy in microbial systems. Nat. Ecol. Evol. 2018, 2, 936–943. [Google Scholar] [CrossRef] [PubMed]
  59. Meng, L.; Xu, C.; Wu, F.; Hu, H. Microbial co-occurrence networks driven by low-abundance microbial taxa during composting dominate lignocellulose degradation. Sci. Total Environ. 2022, 845, 157197. [Google Scholar] [CrossRef] [PubMed]
  60. Zhu, Y.; Ge, X.; Wang, L.; You, Y.; Cheng, Y.; Ma, J.; Chen, F. Biochar rebuilds the network complexity of rare and abundant microbial taxa in reclaimed soil of mining areas to cooperatively avert cadmium stress. Front. Microbiol. 2022, 13, 972300. [Google Scholar] [CrossRef] [PubMed]
  61. Shi, S.; Nuccio, E.E.; Shi, Z.J.; He, Z.; Zhou, J.; Firestone, M.K. The interconnected rhizosphere: High network complexity dominates rhizosphere assemblages. Ecol. Lett. 2016, 19, 926–936. [Google Scholar] [CrossRef]
  62. Tang, S.; Ma, Q.; Marsden, K.A.; Chadwick, D.R.; Luo, Y.; Kuzyakov, Y.; Wu, L.; Jones, D.L. Microbial community succession in soil is mainly driven by carbon and nitrogen contents rather than phosphorus and sulphur contents. Soil Biol. Biochem. 2023, 180, 109019. [Google Scholar] [CrossRef]
  63. Lin, L.; Jing, X.; Lucas-Borja, M.E.; Shen, C.; Wang, Y.; Feng, W. Rare taxa drive the response of soil fungal guilds to soil salinization in the Taklamakan Desert. Front. Microbiol. 2022, 13, 862245. [Google Scholar] [CrossRef]
  64. Fu, Y.; Tang, X.; Sun, T.; Lin, L.; Wu, L.; Zhang, T.; Gong, Y.; Li, Y.; Wu, H.; Xiong, J.; et al. Rare taxa mediate microbial carbon and nutrient limitation in the rhizosphere and bulk soil under sugarcane–peanut intercropping systems. Front. Microbiol. 2024, 15, 1403338. [Google Scholar] [CrossRef]
  65. Yachi, S.; Loreau, M. Biodiversity and ecosystem productivity in a fluctuating environment: The insurance hypothesis. Proc. Natl. Acad. Sci. USA 1999, 96, 1463–1468. [Google Scholar] [CrossRef] [PubMed]
  66. Shade, A.; Jones, S.E.; Caporaso, J.G.; Handelsman, J.; Knight, R.; Fierer, N.; Gilbert, J.A. Conditionally rare taxa disproportionately contribute to temporal changes in microbial diversity. mBio 2014, 5, e01371-14. [Google Scholar] [CrossRef] [PubMed]
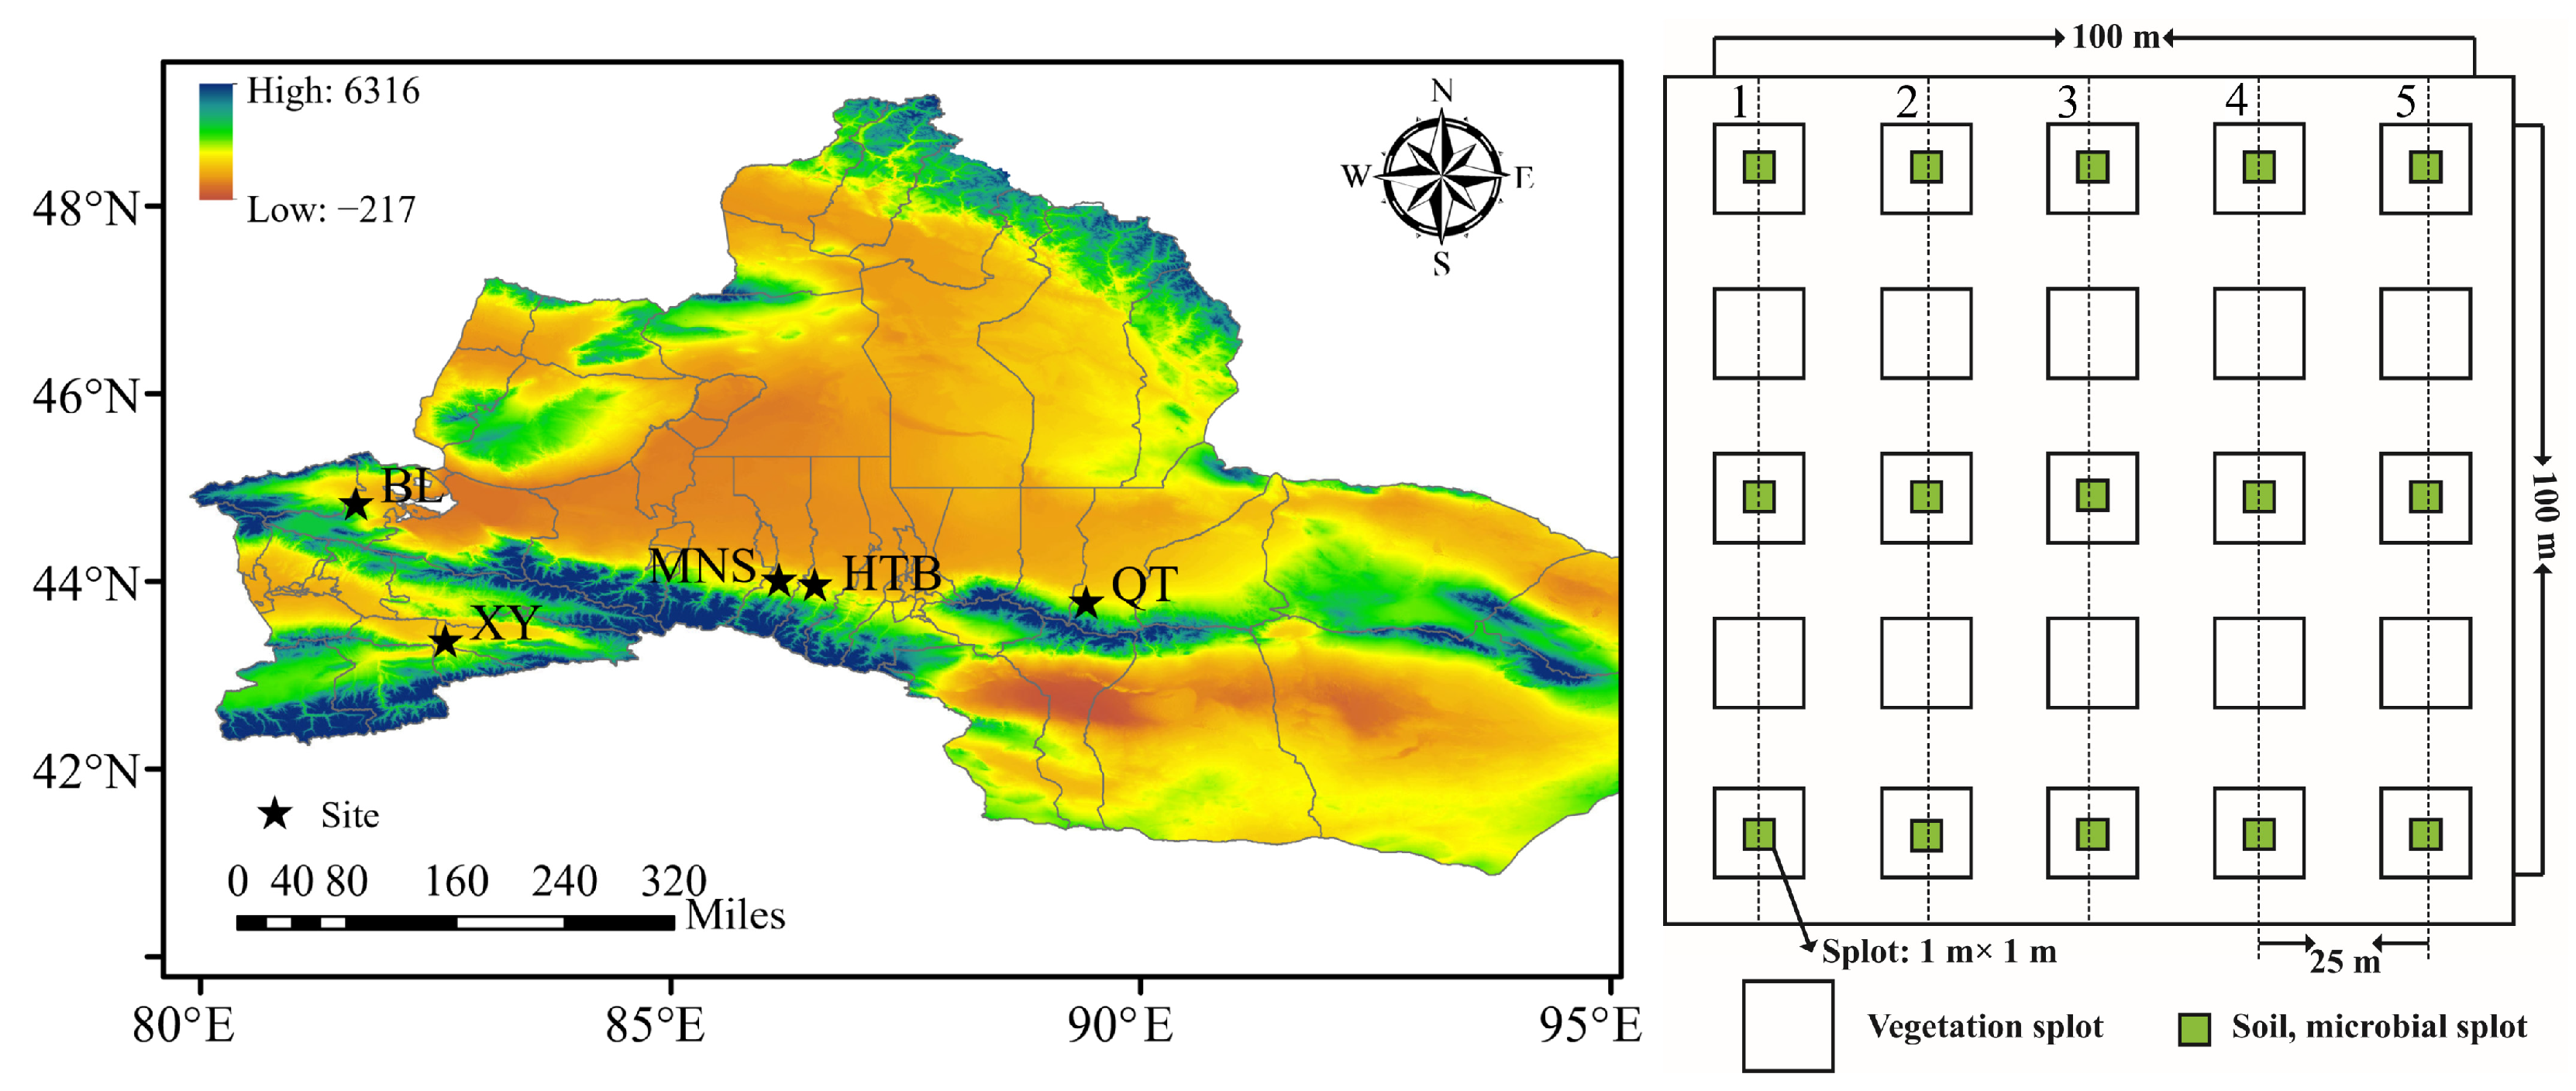
Figure 1. Distribution of sampling points and sample layouts in the study area.
Agriculture 15 01959 g001
Figure 2. Effect of GE on the bacterial community composition of different bacterial taxa. (A) Proportions of six bacterial taxa to total OTU numbers and sequences. Relative abundance of rare (B,C), moderate (D,E), and abundant bacterial phyla (F,G) at 0–5 (B,D,F) and 5–10 cm (C,E,G) soil layers. Bacterial phyla with relative abundances that were distinctly varying in the GE and CK groups were characterized via DeSeq (p < 0.05) and explained in heatmaps. * indicates significant differences in bacterial phyla.
Agriculture 15 01959 g002
Figure 3. Differences of Shannon for rare (A,D), moderate (B,E), and abundant (C,F) bacterial taxa between the grazing exclusion (GE) and the free grazing (CK) at depth 0–5 cm (AC) and 5–10 cm (DF) (n = 3). S and GE refer to sample sites and grazing exclusion, respectively. * p < 0.05; ** p < 0.01
Agriculture 15 01959 g003
Figure 4. Comparison of OTU-level bacterial communities in the sagebrush desert under GE. Non-metric multidimensional scale ranking of rare (A,D), moderate (B,E), and abundant (C,F) bacterial taxa based on Bray–Curtis phase dissimilarity at depths of 0–5 cm (AC) and 5–10 cm (DF).
Agriculture 15 01959 g004
Figure 5. Comparison of co-occurrence pattern, node-level topological features, and cohesion of bacterial taxa to GE and CK in 0–5 cm (A,C) and 5–10 cm soil layer (B,D). The nodes were colored according to abundant, moderate, and rare taxa. A connection shows a significant correlation between OTUs (|r| > 0.75, FDR corrected p < 0.01). The size of each node corresponds to the degree of the OTUs. The colors of the edges indicate the type of interaction, with red representing positive interactions and green representing negative ones. (C,D) node properties and cohesion of GE and CK bacterial taxa, specifically the degree, betweenness, and cohesion. ** p < 0.01, *** p < 0.001.
Agriculture 15 01959 g005
Figure 6. Relationship between SOC changes and rare and abundant bacterial community in 0–5 cm (A,C,E) and 5–10 cm (B,D,F) soil layer, including the Shannon index (A,B), Bray–Curtis dissimilarity (C,D), and relative abundance of keystone taxa (E,F). RT, MT, and AT represent rare, moderate, and abundant taxa, respectively. The first component (NMDS1) was used for Bray–Curtis dissimilarity. Green line, purple line, and blue represent the relationship between △SOC and changes in bacterial α-diversity, β-diversity, and keystone taxa.
Agriculture 15 01959 g006
Figure 7. The contribution of diversity (ΔShannon index and ΔNMDS), keystone taxa, and network complexity to ΔSOC in 0–5 (A) and 5–10 cm soil layer (C). The heatmap showed the Spearman correlations. The random forest showed the total variations explained using the bar chart. SEMS described the effects of diversity, keystone taxa, and network complexity on ΔSOC in the 0–5 (B) and 5–10 cm soil layers (D). The black arrows indicate a positive correlation, while the red arrows signify a negative correlation. Dotted arrowheads refer to insignificant paths. Arrowhead widths are proportional to the size of the standardized road coefficients. Numbers associated with the arrows indicate the magnitude of the relationship effect. ΔShannonR and ΔShannonA indicate changes in alpha diversity for rare and abundant bacterial taxa, respectively; ΔNMDSR and ΔNMDSA represent changes in beta diversity for rare and abundant bacteria, respectively (NMDS first axis); ΔkeystoneR and ΔkeystoneA indicate the changes in abundance in rare and abundant keystone taxa, respectively; ΔNCand ΔPC indicate the changes in negative cohesion and positive cohesion, respectively. * p < 0.05, ** p < 0.01; *** p < 0.001.
Agriculture 15 01959 g007
Table 1. Topological properties of co-occurrence networks in bacterial communities from 0–5 cm and 5–10 cm soil layers.
Network Metrics0–5 cm Soil Layer5–10 cm Soil Layer
GECKGECK
Number of edges/number of nodes3.9933.0814.6703.223
Proportions of positive correlations (%)55.3461.4560.2773.44
Proportions of negative correlations (%)44.6738.5539.7326.56
Average clustering coefficient0.2730.2760.3100.281
Average path length4.0293.9833.8284.346
Connectance0.0300.0290.0380.025
Diameter10.12010.89112.04313.610
Density0.0140.0130.0180.012
Average degree8.0577.5359.3406.446
Modularity0.5430.5650.4930.613
Centralization betweenness0.0110.0120.0150.022
Centralization degree0.0790.0630.1070.079
Natural connectivity1.1171.1194.0461.494
Robustness0.5340.8951.1031.033
Disclaimer/Publisher’s Note: The statements, opinions and data contained in all publications are solely those of the individual author(s) and contributor(s) and not of MDPI and/or the editor(s). MDPI and/or the editor(s) disclaim responsibility for any injury to people or property resulting from any ideas, methods, instructions or products referred to in the content.