Abstract
Data on social dimensions of the bioeconomy, particularly gender equity and poverty, two core Sustainable Development Goals, remains limited and difficult to operationalise. This paper presents a desk-based assessment of social risks related to gender inequality and working conditions in agriculture, using the Social Hotspot Database (2021) alongside sectoral data on cereals, wheat, and paddy rice. Agriculture was examined as a key component of the bioeconomy in five East African countries: Burundi, Kenya, Rwanda, Tanzania, and Uganda, all signatories of the East Africa Regional Bioeconomy Strategy. Additional data from FAO and ILO were incorporated to strengthen the analysis. Results indicate persistent gender inequality, with women continuing to face systemic disadvantages compared to men in agricultural production, potentially constraining the development of a sustainable bioeconomy in the region. Regarding working conditions, all countries demonstrated high risks of failing to achieve living wages, leaving many workers in poverty. However, a significant limitation lies in the absence of sex disaggregated data and datasets explicitly addressing bioenergy or the bioeconomy. Evidence from international organisations suggests that restricted access to education, limited financial resources, and enduring cultural norms exacerbate the gender gap in agriculture. This paper concludes that advancing education, expanding access to finance, and strengthening gender parity are critical pathways to mitigate social risks and to support inclusive bioeconomy development in East Africa.
1. Introduction
The concept of “bioeconomy” has gained global attention in research and policy circles in recent years. Many argue that substituting a bio-based, or renewables-based, economy for the fossil fuels-based economy will help to reduce some of the complex challenges of climate change impacts. The term bioeconomy was developed in 1997, but the definition has evolved over time as international organisations have supported it through their various national or regional strategies (e.g., refs. [1,2]). Views on the bioeconomy vary according to the perspective on the capacity of the economy and resources to address global societal challenges [3]. Some definitions of the bioeconomy make the food, health care, chemicals, and energy sectors key components. Others focus on driving forces such as sustainability, competitiveness, and welfare provision [3]. According to the European Commission Bioeconomy Strategy [2] the bioeconomy covers all the sectors and systems that depend on biological resources and the functioning of all animals, plants, micro-organisms, derived biomass, and organic waste. All those economic and industrial sectors which rely on biological resources and processes to produce food, feedstocks, and other bio-based products are also part of the bioeconomy [2].
Current definitions perceive the bioeconomy as a large system that binds together natural resources, technologies, markets, people, and policies. In addition to the preservation of natural resources for future generations, the bioeconomy strives to optimally manage environmental resources for current generations [4]. It has been suggested that the transition to a bioeconomy will address pertinent issues related to climate change, food security, health, industrial restructuring, and energy security [3].
The transition to sustainable economies will not automatically result in more equal or just societies; furthermore, bioeconomy might have unintended social consequences [5,6]. In fact, if not properly assessed and addressed, many current challenges in the mainstream economy, such as gender inequality, social inequalities, and poverty, are likely to continue or even deepen within the bioeconomy [7,8,9]. On the other hand, several positive impacts have been attributed to the use of biomass for bioenergy and to the bioeconomy [10]. Nonetheless, current social impacts are still poorly understood [11].
This paper provides an assessment of selected social indicators with a gender focus within the agricultural sector, as part of the bioeconomy in East Africa. The socio-economic aspects analysed include (a) gender equality, using three indicators (indices)—Overall Gender Equality Risk, Global Gender Gap Index, and Gender Inequality Index—and (b) working conditions, with the following indicators: wage below benchmark, wage below living wage, workers in poverty, and overall workplace discrimination. The assessment covers five countries: the Republic of Burundi, the Republic of Kenya, the Republic of Rwanda, the United Republic of Tanzania, and the Republic of Uganda (hereafter referred to as Burundi, Kenya, Rwanda, Tanzania, and Uganda).
2. Sustainability, Gender, Poverty, and Equality in the Bioeconomy
The bioeconomy has emerged as a framework for promoting sustainable development by linking biological resources with new economic opportunities. It aims to enhance stability through the provision of essential resources such as food, fuel, and raw materials, while supporting the growth of sustainable industries. In principle, the bioeconomy is expected to contribute to environmental sustainability, climate change mitigation, and economic transformation. Yet, its outcomes depend on who has access to and control over resources and opportunities, and on how benefits are distributed. Factors such as gender, class, ethnicity, race, age, religion, sexuality, and geographical location shape these dynamics, often determining who benefits and who is marginalised [12]. The central challenge lies in ensuring that the bioeconomy delivers not only environmental but also social sustainability, particularly in reducing poverty and advancing gender equality. Several factors will influence the future of the bioeconomy, such as global economics and contexts, and the sustainability of the bioeconomy will depend on the synergies between production of biomass feedstock and conversion procedures [13]. The level of sustainability will also depend on whether the bioeconomy improves, reinforces, or deepens existing societal inequalities [10,12,14].
2.1. Synergies with the Sustainable Development Goals
Several frameworks have sought to capture the synergies and trade-offs between the bioeconomy and the Sustainable Development Goals (SDGs). These highlight the importance of situating the bioeconomy within broader sustainability objectives, emphasising how social, economic, and environmental goals interact [15,16,17,18,19]. Pradhan et al. [19] used United Nations Statistics Division data from 1983 to 2016, covering 122 indicators for 227 countries, disaggregated by gender, age, urban and rural populations, and income, to examine correlations across SDGs. Their study revealed that SDG 1 (No Poverty) demonstrated strong synergies with most other goals, while SDG 12 (Responsible Consumption and Production) and SDG 15 (Life on Land) were negatively correlated with many others. Importantly, these two goals are directly linked to bioeconomy activities, highlighting the inherent tension between resource use and sustainability.
The indicators with the strongest synergies were associated with SDG 1 (No Poverty), SDG 11 (Sustainable Cities and Communities) and SDG 13 (Climate Action), all of which build on the Millennium Development Goals and are underpinned by extensive data and indices. By contrast, SDG 8 (Decent Work and Economic Growth), SDG 9 (Industry, Innovation and Infrastructure), SDG 12 (Responsible Consumption and Production), and SDG 15 (Life on Land) showed the most significant trade-offs [19]. These results underline the risks that, unless carefully managed, the bioeconomy could exacerbate inequality or create new forms of exclusion, even while contributing to environmental goals.
2.2. Social Sustainability in the Bioeconomy
Social sustainability refers to the fair distribution of benefits, the reduction in poverty, and the safeguarding of dignity in human life. It encompasses employment rates, equal opportunities, gender equality, and political participation, and forms one of the three central pillars of sustainability. Yet, in practice, assessments of the bioeconomy often privilege environmental and economic outcomes over social dimensions [12]. The United Nations Commission on Sustainable Development has developed indicators for tracking progress across social, economic, environmental, and institutional domains, but these are primarily applied at a national level and lack sector specific focus [20]. Similarly, the Global Reporting Initiative (GRI) offers over 100 indicators across categories such as economy, environment, human rights, product responsibility, and society, yet these too face limitations in capturing local or sectoral dynamics [21].
For the bioeconomy to meet its potential, sustainability indicators must capture context-specific realities, especially in the Global South where agriculture remains the backbone of livelihoods. Effective frameworks must account for poverty, tenure rights, resilience to shocks, and access to decent work. Table 1 illustrates dimensions of the poverty framework that can guide assessments of the bioeconomy in reducing poverty and strengthening inclusion (e.g., vulnerable groups such as women, girls, youth, people with disabilities, and the elderly [10]).

Table 1.
Poverty dimensions [22] and examples of indicators on the bioeconomy [12].
2.3. Gender, Poverty, and Equality Frameworks
The transition to a bioeconomy will not automatically lead to greater equality. Existing inequalities, particularly those related to gender, risk being reproduced or deepened without explicit interventions [7,8,9]. Women play critical roles in agriculture and agrifood systems, yet continue to face unequal access to land, credit, education, and decision-making processes [23]. These barriers limit their ability to adapt to sustainable production, even when their interest in such practices matches that of men [23,24,25,26]. Ensuring that gender and social equality concerns are integrated into bioeconomy frameworks is therefore essential.
Gender indicator frameworks, such as the UN Gender Inequality Index and the OECD Social Institutions and Gender Index, provide important tools for assessing disparities [27]. However, they operate mainly at national level, offering limited insights into regional or sectoral inequalities. Measuring gender inequality is inherently complex, and findings vary depending on whether indicators are quantitative or qualitative [27,28,29]. Employment and wage issues are more comprehensively addressed in prominent sustainability standards, but other concerns, such as resource rights, unpaid care work, and access to decision-making, remain insufficiently considered [12].
Some of the existing gender-related indicators and indices relevant to the bioeconomy are summarised in Table 2. These indicators do not represent the full range of possible measures but some of those applied in the Social Hotspot Database. While some have their own annual reports and have evolved over time, most are applied at a national level and in a social context, rather than being tailored to specific sectors or to multisectoral approaches such as the bioeconomy.
Table 2.
Selected indicators and index related to gender equity.
Among the most influential is the Gender Gap Index developed by the World Economic Forum, which evaluates economic participation and opportunity, educational attainment, health and survival, and political empowerment [34].
2.4. Risks of Reinforcing Inequality
Addressing gender inequality requires moving beyond documentation of disparities to identify their structural drivers. This involves examining (a) the social norms and institutional factors that determine who benefits or loses from bioeconomy initiatives, (b) emerging forms of exclusion and vulnerability, (c) the ways in which sustainability is framed by different actors such as governments and private companies, and (d) the trade-offs that may arise between environmental sustainability and social well-being [12].
Access to and control over resources such as land, water, technology, knowledge, and jobs, as well as the distribution of income and benefits at local, regional, and national levels, are central to this analysis. Small-scale producers, rural populations, and Indigenous communities are often the most affected. Research shows that there is no guarantee the bioeconomy will benefit all groups equally; it may reinforce discrimination if social dynamics are not fully addressed [37,38].
The prevailing technocratic approach to the bioeconomy often sidelines socio-economic, cultural, and gendered impacts. Applying a gender and social equality (GSE) lens makes it possible to unpack power relations that allocate opportunities to some groups while constraining others [37]. Yet, much of the current literature focuses on describing inequalities rather than transforming the structures that perpetuate them. For the bioeconomy to contribute to a more just society, the redistribution of power across households, communities, private enterprises, governments, and civil society is required [12].
2.5. Expanding Biomass Use and Measurement Challenges
An additional characteristic of the bioeconomy is its capacity to extend biomass production beyond food, feed, and fibre to a wide range of value-added products in agriculture, forestry, health, tourism, and energy. The cascading use principle highlights opportunities for maximising value creation [12]. However, assigning socio-economic indicators to the bioeconomy is complicated by overlaps with traditional sectors such as agriculture, forestry, and industry. Typical indicators include job creation, working conditions, women’s participation, and legal issues, but data remain inconsistent and sometimes risk double counting.
Social, legal, and political factors also influence the acceptability and diffusion of new technologies. Evaluating social sustainability requires tracing linkages between supply chains and social structures, identifying suitable indicators, and collecting reliable data. Some of the social and economic indicators currently used have been criticised for their limitations, but their relative ease of collection and presentation makes them attractive for policymakers and stakeholders. The challenge remains to identify quantitative and qualitative data that are both reliable and cost effective. Diaz-Chavez et al. argue for “a consistent and transparent framework or minimum applicable criteria and indicators for sustainability assessment of bioproducts that are transparent and can be adapted to regional specific conditions” [39], p. 85.
2.6. The Importance of Reliable Data
Used in tools such as the SHDB are applied only at national level and are not suited to sectoral or multisectoral contexts. While influential indices such as the World Economic Forum’s Gender Gap Index offer valuable global comparisons, their scope is limited to four dimensions and does not provide sufficient granularity for sector specific analysis [34].
The lack of sex-disaggregated and sector-specific data constrains the ability to design effective policies, monitor progress, or assess the inclusiveness of bioeconomy strategies. Gender-disaggregated data are critical for identifying barriers to women’s participation, ensuring equitable access to resources, and enabling evidence-based policy decisions. Without such data, the bioeconomy risks overlooking women’s contributions and perpetuating existing inequalities.
3. Methodology
3.1. Background: The Agriculture Sector and Bioeconomy in East Africa
Bioeconomy activities involve multiple sectors and have different definitions and visions. The East Africa Regional Bioeconomy Strategy [40] aims to foster economic growth and generate employment by utilising the region’s bioresources to develop sustainable products and services, while enhancing environmental quality and supporting climate change mitigation. It focuses on four thematic areas: (1) food security and sustainable agriculture; (2) health and well-being; (3) biobased industrial development; and (4) sustainable energy. The agricultural sector is key for any country’s food security. In the case of the bioeconomy, the added value for products, waste, and residues is the key feature to differentiate it from the agricultural sector as key economic activity.
It is estimated that in sub-Saharan Africa, around 66% of women’s employment is in agrifood systems and it is their main source of livelihood [41]. Although, some authors have reviewed individual countries and found that the percentage is less to even 24% in Niger and 37% in Nigeria [42]. Figure 1 shows the trends by area and sex from 1995 to 2020. Each line represents a country’s male or female population’s trend in the agrifood sector in key selected countries in East Africa.
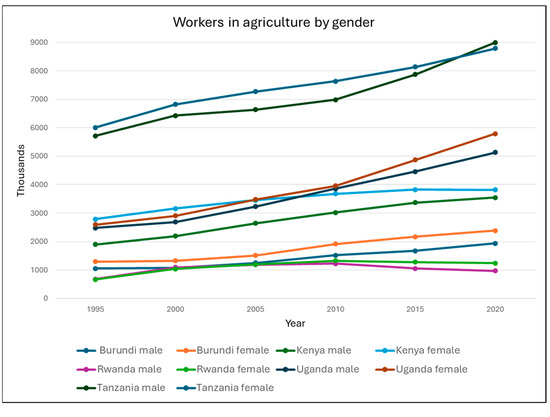
Figure 1.
Trends in number of workers in agriculture by year and gender (data source: FAO stats [43]).
Agrifood systems’ statistics refer not only to agricultural production but also other activities that involve some added value to the food product. Agrifood systems encompass all actors and interconnected processes involved in adding value to both food and non-food agricultural products. This includes activities across the entire value chain—from production to off-farm operations such as storage, aggregation, post-harvest handling, transportation, processing, distribution, marketing, consumption, and waste management [41]. Shifting the focus from women’s roles in agriculture to their broader participation within agrifood systems allows their roles and challenges to be better understood.
3.2. Methodology for Risk Assessment of Gender Inequality and Working Conditions
There are different definitions of hotspots, but it can be considered as (in a region or within life cycle analysis) processes or activities that may be seen as problematic or where there is a risk or an opportunity, in a social theme [44,45]. A rapid assessment using the Social Hotspot Database [35] was performed on five countries in East Africa (Burundi, Kenya, Rwanda, Tanzania, and Uganda) where the Bioeconomy Strategy was developed. Two themes of the SHDB were reviewed. Under the theme of society, gender equality was assessed under three indicators: overall gender equality risk, global gender gap index, and Gender Inequality Index. Under the theme of Labour rights and working conditions, the following criteria were analysed: country sector risk wage below benchmark, sector average wage below living wage, workers in poverty, and overall discrimination in the workplace. Three sectors related to Topic 1 of the Bioeconomy Regional Strategy were selected: cereal grains, rice paddy, and wheat. These were selected as a proxy of the multisectoral approach of the bioeconomy. This assessment was complemented with additional data from other sources (e.g., WEF, FAO).
The parameters assessed with the hotspot database used a scale for the risk from low (1), medium (2), high (3), and very high (4). These parameters in the hotspot database used the methodology from Benoit et al. [46]. As the assessment includes more than 50 characterised social issues for 20 social themes, the amount of data is difficult to assess for decision-making. For this reason, the UNEP report [45] recommends calculating a Social Hotspot Index for each country-specific sector (CSS) and identifying hotspots in the supply chain. The authors constructed the index by weighting the level of risk identified for each social issue. In the scale, a zero was assigned to social issues with low risk, a 1 was assigned to those that are medium, a 2 to those with high risk, and a 3 for those with very high risk; Nd was used where no data was indicated in the database. Summing across all social issues resulted in a total number of weighted hotspots to be aware of when working in that country and sector. Thus, social issues are not compared against each other. All issues are weighted equally in the sum, and all are considered a risk or negative impact. Positive impacts are not assessed with the Social Hotspot Index.
The three selected sectors were cereal grains (includes maize), wheat, and rice paddy as they constitute the staple for most countries in East Africa. For gender inequality, three indexes were used as per Table 2: the SHDB for gender inequality (overall gender equality risk, OGER) from the SHDB; Global Gender Gap Index (GGGI) from WRI; and Gender Inequality Index (GII) from UNDP.
To assess working conditions, two indicators were considered: the minimum national wage, which is normally regulated at the national level and according to some activities (affecting both women and men); and the living wage, which ensures minimum acceptable living standards and may vary from one region to another in the same country (also affecting both women and men).
Data from the SHDB was crossed with data gathered from other organisations such as the International Labour Organisation, the United Nations, and other literature.
It is important to note that the SHDB is not open source and uses aggregated data that has not been updated since 2021, therefore explaining the need to cross information with other sources. Nevertheless, it still provides good reliable assessment of the risks.
4. Results
4.1. Risk Assessment of Gender Inequality in East Africa
The assessment for risks for gender inequality in the five countries showed that Burundi scored as medium risk for the overall gender equality risk across the three sectors, while for the Global Gender Gap Index it was scored as low risk across the sectors, and in the gender inequality risk it was scored as high risk in the three sectors. For all indexes and sectors, Kenya showed a high risk.
Rwanda scored as low risk for all sectors for the Overall Gender Equality Risk and the Gender Gap Index but for the Gender Inequality Index it scored as high risk. Tanzania and Uganda showed the same scores of medium risks across the three sectors for the Overall Gender Equality Risk and the Gender Gap Index, while they scored as high risk for the Gender Inequality Risk for the three sectors.
Figure 2, Figure 3 and Figure 4 show the results of the SHDB for gender inequality (overall gender equality risk, OGER); Global Gender Gap Index (GGGI); and Gender Inequality Index, (GII) for the sectors of cereal grains, wheat, and paddy rice. The GII was consistently high for all countries and all crops.
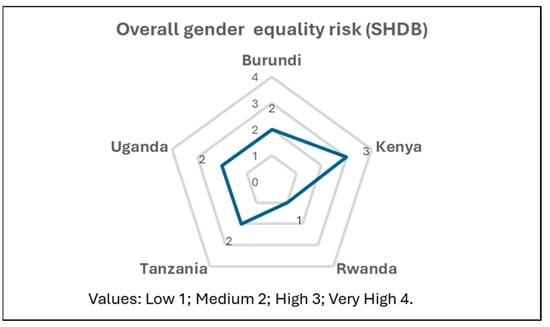
Figure 2.
Overall gender risk by country for cereals (cereal grains, wheat, and paddy rice) (Source: [35]).
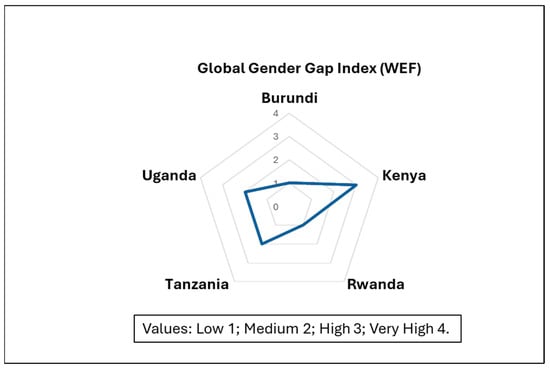
Figure 3.
Global Gender Gap Index by country for cereals (cereal grains, wheat, and paddy rice) (Source: [35]).
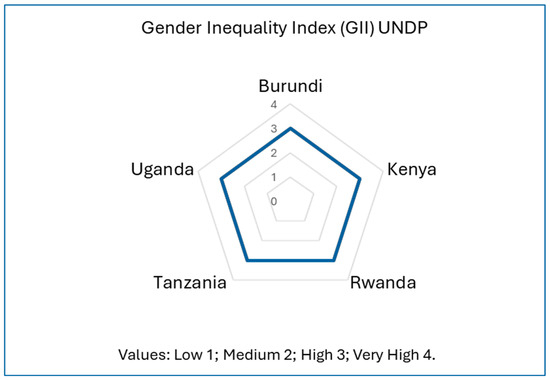
Figure 4.
Gender Inequality Index by country for cereals (cereal grains, wheat, and paddy rice) (Source: [35]).
A comparison of the results from the World Economic Forum’s 2024 Global Gender Gap Index Report [47] reveals that the countries are ranked relatively high globally. The report’s assessment shows the progress towards gender parity, where each indicator is represented as a ratio of values for men and women. A parity score of 1 indicates full equality, while lower scores highlight the gender gap. Table 3 presents these values and rankings for the selected countries.
Table 3.
Global Gender Gap Index for selected countries (Source: [48]).
According to the 2023 UNDP report on the Gender Inequality Index (GII), Kenya, Rwanda, Uganda, and Tanzania are classified as countries with medium scores for the Human Development Index. The GII values highlight gender inequality in these nations (where a lower GII value signifies less inequality) (Table 4). Out of 170 countries, the data reveals that these selected countries still exhibit a gender gap. However, Rwanda stands out in the region with a relatively better ranking.
Table 4.
Gender Inequality Index by country and rank [33].
4.2. Assessment of Working Conditions in East Africa
In order to assess the risks of working conditions (e.g., not complying with minimum national wage and the living wage), a review of the current minimum wage and the living wage in the region was conducted. Table 4 shows the minimum wage and living wage both in national currency and in USD in the selected countries in East Africa.
To assess working conditions within the SHDB, the assessment was conducted on the societal theme related to poverty and inequality. The criteria selected included the risk of wages falling below the benchmark in the country’s crop sectors (e.g., national and living wage); the sectors’ average wage below living wage; workers living in poverty (under 1.9 USD/day); and overall discrimination in of workers in the workplace. This last criterion was selected because despite its effects on both men and women, particularly in the agroindustry, the impacts on women are larger (Figure 5). Individual countries are presented in Figure 6, Figure 7, Figure 8 and Figure 9.
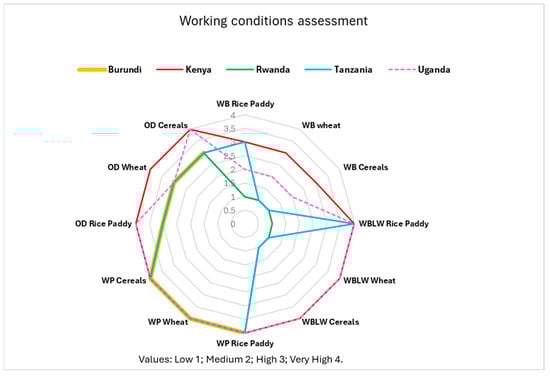
Figure 5.
Working conditions assessment (data source: [35]).
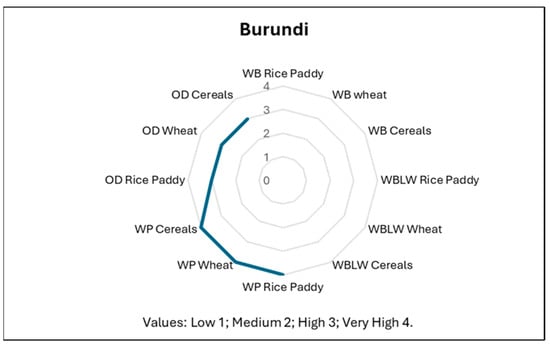
Figure 6.
Burundi working conditions assessment (Source: [35]) (WB—wage below benchmark; WBLW—wage below living wage; WP—workers in poverty; OD—overall discrimination).
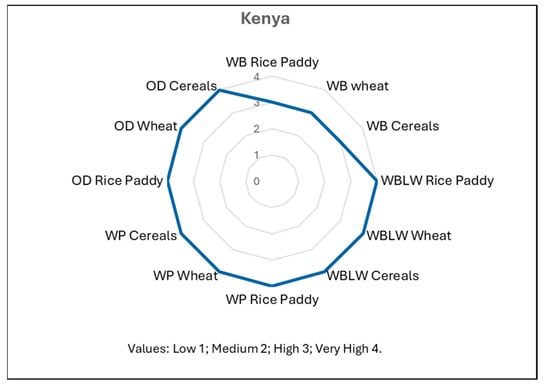
Figure 7.
Kenya working conditions assessment (source: [35]) (WB—wage below benchmark; WBLW—wage below living wage; WP—workers in poverty; OD—overall discrimination).
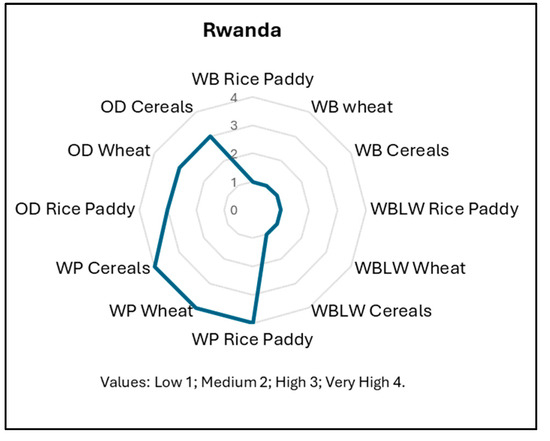
Figure 8.
Rwanda working conditions assessment (source: [35]) (WB—wage below benchmark; WBLW—wage below living wage; WP—workers in poverty; OD—overall discrimination).
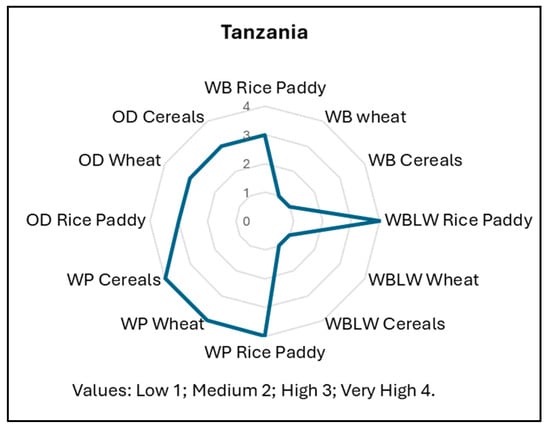
Figure 9.
Tanzania working conditions assessment (source: [35]) (WB—wage below benchmark; WBLW—wage below living wage; WP—workers in poverty; OD—overall discrimination).
All countries showed a high risk of workers being in poverty for the three sectors, which is living with a daily rate of under USD 1.90. Burundi had no data for the risk assessment for minimum wages and under living wages but as shown in Table 5, the minimum wage is regulated in the country. For overall discrimination, Burundi showed a high risk (Figure 6).
Table 5.
Minimum wage and estimated living wage.
Kenya’s assessment shows a very high risk for worker not receiving a living wage, for workers in poverty, and for forms of discrimination in the workplace for all three sectors of cereals. There was no difference between the selected sectors. Only the risk of not complying with minimum wages shows a high risk (Figure 7).
Rwanda was the only country with a low risk for wages falling under the benchmark and for having wages below the living wages marked for the country, while for discrimination for workers, it was classified as low-risk. There was no difference shown between the three sectors. (Figure 8).
Tanzania was the only country that showed differences across the sectors. For the minimum wage below the benchmark, it showed a high risk for the paddy rice sector and a low for wheat and cereals; for the wages below living wages, it showed a very high risk for paddy rice and low risk for wheat and cereals. For the overall discrimination against workers, it showed a high risk, with no difference across the sectors (Figure 9).
Finally, Uganda’s assessment showed medium risk for minimum wage below the benchmark in the three sectors (Figure 10). The assessment showed very high risk for wages below living wages, workers in poverty, and discrimination across all sectors, except the wheat sector, for which overall discrimination was scored as being high (3). This difference with the wheat sector may be due to the farming system in Uganda. Wheat is not a staple food like maize (included in the cereals sector) and rice. It is becoming an economic crop but is not yet of great economic importance. The production of maize in 2024–2025 was of 5 Mt versus 25 thousand tons in the same year. Furthermore, wheat is not cultivated at household farm level [49].
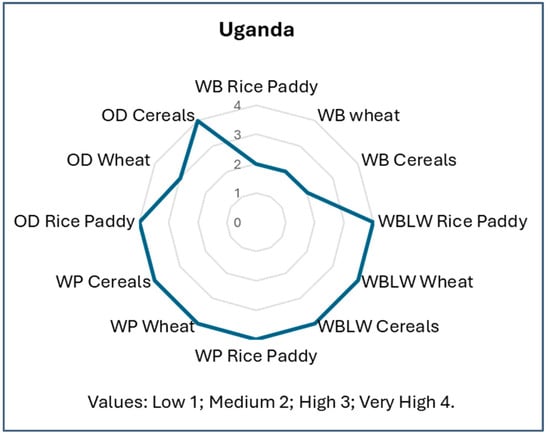
Figure 10.
Uganda working conditions assessment (source: [35]). (WB—wage below benchmark; WBLW—wage below living wage; WP—workers in poverty; OD—overall discrimination).
5. Discussion
According to the Gender Gap Index report in 2024, sub-Saharan Africa has increased its collective gender parity score by +5.6 percentage points since 2006, when the index was created. This demonstrates that there has been some progress in certain areas and certain countries. As the report indicates, some are masked due to the size of the region and their differences. Nevertheless, there has been improvement in the economic gender parity particularly in the Economic Participation and Opportunity subindex [34].
Recent studies such as [42,50] demonstrate that the inequalities for women engaged in agriculture are persistent but with regional differences, showing greater increments of inequality in East Africa. These studies recommend policies to support women in agriculture, better financial mechanisms to access credit and land, and improved education. Notably, some of the recommendations indicate that all issues need to be considered to avoid exacerbating other conditions (e.g., more house labour for women).
Conditions for women in the agriculture sector have slightly improved, particularly in the percentage of participation. Nevertheless, this is due to the male-dominated migration from rural areas and rural economic activities. This has led to the “feminisation of agriculture”, which has different challenges, particularly regarding empowerment and roles in the household and communities [41]. Although this is not further discussed in this paper, the topic is highly relevant for the bioeconomy regarding power over resources and the role of women, as discussed in previous section. Furthermore, the working conditions for women in the agriculture sector is still an issue, as shown above with the criteria of discrimination and minimum wages. Despite the fact that the SHDB does not differentiate in working conditions between women and men, the FAO and ILO have reported that these conditions have not improved significantly. One key indicator, particularly in sub-Saharan Africa is land tenure and how it affects women. Nevertheless, the FAO report on agrifoods found that two of the countries in this paper have made progress regarding the legal and policy reforms for land rights (Kenya and Uganda), but the land tenure under men rights continues to be under men property. This is mostly due to a lack of enforcement of land rights, but Burundi, Rwanda, and Tanzania also showed progress in the share of women among owners of land in the last ten years [41]. Discrimination against women in agriculture also persist in agribusiness. Women still receive less payment and in some cases, men are favoured for some jobs (specially management) and women do not have the same access to financial mechanisms as men, with the same problems arising in access to education [41].
The bioeconomy is multisectoral, yet the agricultural sector is important as it is the largest production sector. It has multiple benefits such as economic, employment, and biodiversity [51]. It will continue to be a firm basis for bioeconomy along with forestry and fisheries, particularly in the Global South. Nevertheless, it should consider other aspects in order to move it from the traditional agricultural sector to looking at larger aims that support the SDGs and sustainability, particularly with regard to adaptation to climate change. In East Africa, as indicated in the Regional Bioeconomy Strategy [40] and the state of the bioeconomy [52], food production is still an important and clear objective for the region. Adding sustainable social objectives may help the region to achieve gender parity in a shorter time. Adding value to the products and extended value chains that are not just horizontal but vertical may allow the creation of greater environmental, economic, and social benefits.
Not achieving gender parity has demonstrated to have a cost. For instance, in Uganda, it has been estimated that the gender gap in agriculture may be around USD 11M per year and this gap is due to unequal access for women to key agricultural inputs such as land, labour, knowledge, fertiliser, and improved seeds [53]. The differences are shaped by gender roles, land access, economic opportunities, and cultural norms. While women play essential roles in agriculture, they often face challenges related to land rights, resource access, and market opportunities. Enhancing support for farming communities through the acquisition of modern equipment, mechanisation technologies, precision agriculture tools, and improved access to water for production, alongside investing in infrastructure to boost market accessibility, optimise food distribution systems, and attract private sector investment, will significantly expand cultivated land and increase agricultural productivity [54].
Data plays a critical role in advancing gender equality within the bioeconomy, particularly by highlighting the unique challenges and opportunities faced by women in agriculture and related sectors. The integration of gender-disaggregated data enables more informed policy decisions, ensuring that women’s contributions are recognised and that barriers such as limited access to resources, technology, and land are addressed. In the bioeconomy, providing women with access to accurate data and tools for decision-making can foster greater participation in sectors like agriculture, bioenergy, and sustainable resource management, ultimately driving inclusive economic growth and environmental sustainability. This is not just the case for the Global South, as Roos et al. [55] found out in the Nordic region. As the bioeconomy sector becomes increasingly intertwined with the male-dominated technology sector, there is a risk of perpetuating existing gender disparities. The authors argue that without intentional efforts to collect and analyse gender-disaggregated data, policies may overlook the specific needs and contributions of women in the bioeconomy. Such data is crucial for identifying barriers to women’s participation, ensuring equitable access to resources, and promoting inclusive development within the sector [55].
The future of the bioeconomy can be improved with more detailed disaggregated data to provide support for the decision-making process to empower women in the different bioeconomy sectors.
6. Conclusions and Recommendations
Monitoring systems for the bioeconomy are still under development outside the European Union and the proposals use various methodologies and types of indicators. The main message to keep in mind is that the purpose of the bioeconomy is to reduce greenhouse gas emissions and develop alternative economic and social opportunities in a new sector, using bioresources as feedstocks or intermediate products. One of the challenges is gathering data for the assessments. In this paper, a few criteria have been used to highlight the current situation of this multi-sectoral activity and the challenges it presents, specifically for women in selected countries in sub-Saharan Africa. The use of the HSDAB was also included as part of the case study as there are multiple methodologies and tools to evaluate risks and identify hotspots.
Among the main challenges facing this social sustainability assessments of the bioeconomy are the following:
- Lack of disaggregated data and monitoring, even from some of the SDG indicators, which hinders the findings in some sectors.
- Some of the indicators and indexes are not updated in the SHDB. The databases are dynamic and not just the data but also the methodologies are updated frequently. That is the case of the World Economic Forum Global Gender Gap Report. The report of 2021 includes the impacts of COVID-19, which affected economies worldwide, but it has not been possible to update the SHDB accordingly.
- An additional challenge is the recognition that the bioeconomy is multisectoral, which therefore also makes it difficult to assess gender and poverty at national level only. There is a need to combine some primary data, even if it is qualitative, such as through surveys and interviews.
- Considering the specific characteristics of the region and local population and stakeholders for the assessment: the bioeconomy is based on biomass and therefore context must be considered.
- One framework does not fit all contexts but a unified approach to deciding on the specific indicators may be a better alternative; this is also related to the contextuality, not just in terms of geographical regions, but also of objectives, production, materials, and so on.
- The need for reliable data that fulfils the characteristics of a “good” indicator, such as cost-effectiveness, and has time and spatial significance, along with consistent collection methods: this should also be decided in terms of the characteristics of indicators, as previously suggested.
The biggest challenge continues to be how to apply the potential of the bioeconomy to contribute to a more equal and just society; this may be difficult to achieve, particularly in the Global South, where the bioeconomy is still emerging.
In addition, issues of governance must be considered alongside policies, regulations, and standards. There is a need to advance the dialogue on synergies between science, policy, and the decision-making process.
As a general recommendation, more studies looking at synergies across the sectors of the bioeconomy and how they could help to gather some gender equity will be necessary to be conducted to inform international organisations and development agencies. Some specific recommendations for the agricultural sector include the following:
- Provide systems that allow women access to funds for agricultural inputs;
- Create mechanisms that support added value to products in the agricultural sector and access to markets;
- Stimulate the private sector to invest in women in activities and sectors related to the bioeconomy;
- Increase education and capacity building to assist girls and women in the Global South.
6.1. Future Research
Additional synergy with qualitative research could benefit the quantitative research and complementary studies. There are many examples, as indicated in the paper, that could be explored as case studies to demonstrate the need for disaggregated data specific to the bioeconomy and bioenergy. Data gathering may be costly but collaboration among organisations and governments may help to reduce the gap regarding sex-disaggregated data.
6.2. Limitations of the Study
This study is desk-based, which presents certain limitations. Bioenergy and bioeconomy data are not readily accessible, necessitating the use of proxy data. Additionally, the use of the Social Hotspot Database (SHDB), which is not an open-source resource, imposes constraints, particularly due to the absence of up-to-date information and potential gaps in local data.
Funding
This research received no external funding.
Institutional Review Board Statement
This is desk-based research that did not require ethical approval by the institution.
Informed Consent Statement
Not applicable.
Data Availability Statement
Restrictions apply to the datasets. The datasets used in this article are not readily available because the source is the Social Hotspot Database. Requests to access the datasets should be directed to them. Other datasets are publicly available and can found at the websites of the relevant organisations (e.g., FAO).
Conflicts of Interest
The author declares no conflicts of interest.
Abbreviations
The following abbreviations are used in this manuscript:
| GEI | Gender Inequality Index |
| GGGI | Global Gender Gap Index |
| OGER | Overall gender equality risk |
| SDG | Sustainable Development Goals |
| SHDB | Social Hotspot Database |
| USD | United States Dollars |
| UN | United Nations |
References
- OECD. The Application of Biotechnology to Industrial Sustainability; OECD: Paris, France, 2001. [Google Scholar] [CrossRef]
- European Commission. Bioeconomy: The European Way to Use our Natural Resources: Action Plan 2018. Available online: https://op.europa.eu/en/publication-detail/-/publication/775a2dc7-2a8b-11e9-8d04-01aa75ed71a1 (accessed on 19 July 2024).
- Haapala, A.; Härkönen, J.; Leviäkangas, P.; Kess, P.; Häggman, H.; Arvola, J.; Stoor, T.; Ämmälä, A.; Karppinen, K.; Leppilampi, M.; et al. Bioeconomy potential—Focus on Northern Finland. Int. J. Sustain. Econ. 2015, 7, 66. [Google Scholar] [CrossRef]
- Lewandowski, I. Bioeconomy; Springer International Publishing: Cham, Switzerland, 2018. [Google Scholar] [CrossRef]
- Egenolf, V.; Bringezu, S. Conceptualization of an Indicator System for Assessing the Sustainability of the Bioeconomy. Sustainability 2019, 11, 443. [Google Scholar] [CrossRef]
- Piggot, G.; Boyland, M.; Down, A.; Torre, A.R. Realizing a Just and Equitable Transition Away from Fossil Fuels. 2019. Available online: https://www.sei.org/wp-content/uploads/2019/01/realizing-a-just-and-equitable-transition-away-from-fossil-fuels.pdf (accessed on 17 April 2024).
- Alvarez, I. Increasing the Gender Gap: The Impacts of the Bioeconomy and Markets in Environmental Services on Women; Global Forest Coalition: Asuncion, Paraguay, 2013; Available online: https://globalforestcoalition.org/wp-content/uploads/2013/06/INCREASING-THE-GENDER-GAP-FINAL.pdf (accessed on 20 November 2024).
- Harcourt, W.; Nelson, I.L. Practising Feminist Political Ecologies; Zed Books Ltd.: London, UK, 2015. [Google Scholar] [CrossRef]
- Resurrección, B.P. Gender and environment in the global South: From ‘women, environment and development’ to feminist political ecology. In Routledge Handbook of Gender and Environment; MacGregor, S., Ed.; Routledge: Abingdon, Oxon, UK; New York, NY, USA, 2017; pp. 71–85. Available online: https://www.routledge.com/Routledge-Handbook-of-Gender-and-Environment/MacGregor/p/book/9780415707749 (accessed on 17 April 2025).
- Diaz-Chavez, R.; Stichnothe, H.; Johnson, K. Sustainability Considerations for the Future Bioeconomy. In Developing the Global Bioeconomy, 1st ed.; Lamers, P., Searcy, E., Hess, J.R., Stichnothe, H., Eds.; Elsevier: Amsterdam, The Netherlands, 2016; pp. 69–90. [Google Scholar] [CrossRef]
- Mattila, T.J.; Judl, J.; Macombe, C.; Leskinen, P. Evaluating social sustainability of bioeconomy value chains through integrated use of local and global methods. Biomass Bioenergy 2018, 109, 276–283. [Google Scholar] [CrossRef]
- Diaz-Chavez, R.; Mortensen, S.; Wikman, A. Bioeconomy: Tapping Natural and Human Resources to Achieve Sustainability; Stockholm Environment Institute: Stockholm, Sweden, 2019; p. 32. Available online: https://www.sei.org/wp-content/uploads/2020/01/sei-report-2020-bioeconomy-diaz-chavez.pdf (accessed on 15 April 2024).
- Buchholz, T.; Luzadis, V.A.; Volk, T.A. Sustainability criteria for bioenergy systems: Results from an expert survey. J. Clean. Prod. 2009, 17, S86–S98. [Google Scholar] [CrossRef]
- Diaz-Chavez, R.A. Assessing biofuels: Aiming for sustainable development or complying with the market? Energy Policy 2011, 39, 5763–5769. [Google Scholar] [CrossRef]
- Schmidt, O.; Padel, S.; Levidow, L. The bioeconomy concept and knowledge base in a public goods and farmer perspective. Bio-Based Appl. Econ. 2012, 1, 47–63. [Google Scholar] [CrossRef]
- Costanza, R.; Daly, L.; Fioramonti, L.; Giovannini, E.; Kubiszewski, I.; Mortensen, L.F.; Pickett, K.E.; Ragnarsdottir, K.V.; De Vogli, R.; Wilkinson, R. Modelling and measuring sustainable wellbeing in connection with the UN Sustainable Development Goals. Ecol. Econ. 2016, 130, 350–355. [Google Scholar] [CrossRef]
- Rickels, W.; Dovern, J.; Hoffmann, J.; Quaas, M.F.; Schmidt, J.O.; Visbeck, M. Indicators for monitoring sustainable development goals: An application to oceanic development in the European Union. Earths Future 2016, 4, 252–267. [Google Scholar] [CrossRef]
- ICSU. A Guide to SDG Interactions: From Science to Implementation; International Council for Science: Paris, France, 2017. [Google Scholar] [CrossRef]
- Pradhan, P.; Costa, L.; Rybski, D.; Lucht, W.; Kropp, J.P. A Systematic Study of Sustainable Development Goal (SDG) Interactions. Earths Future 2017, 5, 1169–1179. [Google Scholar] [CrossRef]
- UN. Indicators of Sustainable Development: Guidelines and Methodologies; United Nations Department of Economic and Social Affairs: New York, NY, USA, 2007; Available online: https://sustainabledevelopment.un.org/content/documents/guidelines.pdf (accessed on 17 April 2024).
- GRI. Consolidated Set of the GRI Standards; GRI: Amsterdam, The Netherlands, 2022. [Google Scholar] [CrossRef]
- Sida. Dimensions of Poverty Sida’s Conceptual Framework. Sida: Stockholm, Sweden, 2017. Available online: https://cdn.sida.se/publications/files/sida62028en-dimensions-of-poverty-sidas-conceptual-framework.pdf (accessed on 7 September 2025).
- Meinzen-Dick, R.; Kovarik, C.; Quisumbing, A.R. Gender and Sustainability. Annu. Rev. Environ. Resour. 2014, 39, 29–55. [Google Scholar] [CrossRef]
- Kent, J.; Fannin, M.; Dowling, S. Gender dynamics in the donation field: Human tissue donation for research, therapy and feeding. Sociol. Health. Illn. 2019, 41, 567–584. [Google Scholar] [CrossRef] [PubMed]
- Kent, J.; Farrell, A.-M. Risky Bodies in the Plasma Bioeconomy. Body Soc. 2015, 21, 29–57. [Google Scholar] [CrossRef] [PubMed]
- Smith, S. Assessing the gender impacts of Fairtrade. Soc. Enterp. J. 2013, 9, 102–122. [Google Scholar] [CrossRef]
- Permanyer, I. The Measurement of Multidimensional Gender Inequality: Continuing the Debate. Soc. Indic. Res. 2010, 95, 181–198. [Google Scholar] [CrossRef]
- Kabeer, N. Gender equality and women’s empowerment: A critical analysis of the third millennium development goal 1. Gend. Dev. 2005, 13, 13–24. [Google Scholar] [CrossRef]
- Smith, S.; Busiello, F.; Taylor, G.; Jones, E. Voluntary Sustainability Standards and Gender Equality in Global Value Chains Geneva. 2019. Available online: https://dai-global-developments.com/uploads/VSS%20and%20Gender%20Equality%20in%20Global%20Value%20Chains%202019.pdf (accessed on 12 May 2025).
- Cingranelli, D.; Richards, D.; Clay, C. The CIRI Human Rights Dataset Version 2014.04.14. Available online: https://dataverse.harvard.edu/dataset.xhtml?persistentId=doi:10.7910/DVN/UKCPXT (accessed on 10 April 2024).
- OECD. 2012 SIGI Social Institutions and Gender Index; OECD Publishing: Paris, France, 2012. [Google Scholar] [CrossRef]
- Ferrant, T.A. Measuring Women’s Economic Empowerment: Time Use Data and Gender Inequality; OECD: Paris, France, 2019; Available online: https://www.oecd.org/content/dam/oecd/en/publications/reports/2019/03/measuring-women-s-economic-empowerment_c84d0bb5/02e538fc-en.pdf (accessed on 11 August 2024).
- UNDP. Gender Inequality Index. United Nations Development Programme. Available online: http://hdr.undp.org/en/content/gender-inequality-index-gii (accessed on 1 May 2024).
- WEF. Global Gender Gap Report 2021. Insight Report; WEF: Geneva, Switzerland, 2021; Available online: https://www.weforum.org/publications/global-gender-gap-report-2021/ (accessed on 7 April 2023).
- SHDB. Social Hotspot Data Base. 2021. Available online: http://www.socialhotspot.org/ (accessed on 7 September 2025).
- ILO. Statistics on Women. Available online: https://ilostat.ilo.org/topics/women/ (accessed on 19 February 2025).
- Weber, L. Defining contested concepts. In Race, Gender, Sexuality, and Social Class: Dimensions of Inequality and Identity; Ferguson, S.J., Ed.; SAGE Publications: London, UK, 2013; pp. 5–16. Available online: https://www.researchgate.net/publication/236028390_Defining_Contested_Concepts (accessed on 16 April 2025).
- Arora-Jonsson, S. Forty years of gender research and environmental policy: Where do we stand? Women’s Stud. Int. Forum 2014, 47, 295–308. [Google Scholar] [CrossRef]
- Diaz-Chavez, R.; Walter, A.; Gerber, P. Socio-Economic Assessment of the Pellets Supply Chain in the USA. 2019. Available online: https://www.ieabioenergy.com/wp-content/uploads/2019/02/IEA-Bioenergy-Task_-USA-final-January-2019.1.21-FINAL.pdf (accessed on 17 June 2023).
- EASTECO. The East African Regional Bioeconomy Strategy 2021/22–2031/32; EASTECO: Kigali, Rwanda, 2022; Available online: https://www.iacgb.net/lw_resource/datapool/systemfiles/elements/files/2ebdbc71-a097-11ed-9ee4-dead53a91d31/current/document/EAC-Regional-East-Africa-Bioeconomy-Strategy.pdf (accessed on 19 May 2023).
- FAO. The Status of Women in Agrifood Systems; FAO: Rome, Italy, 2023. [Google Scholar] [CrossRef]
- Palacios-Lopez, A.; Christiaensen, L.; Kilic, T. How much of the labor in African agriculture is provided by women? Food Policy 2017, 67, 52–63. [Google Scholar] [CrossRef]
- FAOSTATS. Employment Indicators: Agriculture and Agrifood Systems. Available online: https://www.fao.org/faostat/en/#data/OEA (accessed on 23 March 2025).
- UNEP. Hotspots Analysis an Overarching Methodological Framework and Guidance for Product and Sector Level Application; UNEP: Paris, France, 2017; Available online: https://www.lifecycleinitiative.org/wp-content/uploads/2017/07/hotspots-publication-25.7.17.pdf (accessed on 30 August 2024).
- UNEP SETAC. Guidelines for Social Life Cycle Assessment of Products; UNEP SETAC: Paris, France, 2009; Available online: https://wedocs.unep.org/bitstream/handle/20.500.11822/7912/-Guidelines%20for%20Social%20Life%20Cycle%20Assessment%20of%20Products-20094102.pdf?sequence=3&%3BisAllowed= (accessed on 29 November 2022).
- Benoît, C.; Norris, G.A.; Valdivia, S.; Ciroth, A.; Moberg, A.; Bos, U.; Prakash, S.; Ugaya, C.; Beck, T. The guidelines for social life cycle assessment of products: Just in time! Int. J. Life Cycle Assess. 2010, 15, 156–163. [Google Scholar] [CrossRef]
- Indicator, W. Minimum Wages per Country. Available online: https://wageindicator.org/salary/minimum-wage/minimum-wages-per-country (accessed on 28 April 2025).
- WEF. Global Gender Gap Report 2024; WEF: Geneva, Switzerland, 2024; Available online: https://www3.weforum.org/docs/WEF_GGGR_2024.pdf (accessed on 30 May 2024).
- USA FAS. Uganda Country Summary; Foreign Agricultural Service: Washington, DC, USA. Available online: https://ipad.fas.usda.gov/countrysummary/default.aspx?id=UG (accessed on 31 May 2025).
- Akpa, F.; Amegnaglo, C.J.; Chabossou, A.F. Women’s engagement in agriculture and income inequality in sub-Saharan Africa. Soc. Sci. Humanit. Open 2024, 9, 100888. [Google Scholar] [CrossRef]
- Nowak, A.; Kobiałka, A.; Krukowski, A. Significance of Agriculture for Bioeconomy in the Member States of the European Union. Sustainability 2021, 13, 8709. [Google Scholar] [CrossRef]
- Virgin, I.; Diaz-Chavez, R.; Morris, E.J.; Haileselassie, T.; Tesfaye, K.; De Cliff, S.; Njau, K.; Munganyinka, E.; Muyambi, F.; Otim, M.O. The State of the Bioeconomy in Eastern Africa: 2022. 2022. Available online: https://easteco.org/policy_strategy/eac-regional-bioeconomy-strategy/ (accessed on 19 June 2023).
- UNWOMEN. The Gender Gap in Agricultural Productivity: Five African Countries; UNWOMEN: Nairobi, Kenya, 2018; Available online: https://africa.unwomen.org/sites/default/files/Field%20Office%20Africa/Attachments/Publications/2019/Cost%20of%20the%20Gender%20Gap%20-%20web.pdf (accessed on 1 June 2025).
- CARE. Gender Equality and Women’s Empowerment in the Context of Food Security and Nutrition; CARE: Rome, Italy, 2020; Available online: https://www.fao.org/fileadmin/templates/cfs/Docs1920/Gender/GEWE_Scoping_Paper-FINAL040ct.pdf (accessed on 28 May 2025).
- Roos, A.; Blomquist, M.; Bhatia, R.; Ekegren, K.; Rönnberg, J.; Torfgård, L.; Tunberg, M. The digitalisation of the Nordic bioeconomy and its effect on gender equality. Scand. J. For. Res. 2021, 36, 639–654. [Google Scholar] [CrossRef]
Disclaimer/Publisher’s Note: The statements, opinions and data contained in all publications are solely those of the individual author(s) and contributor(s) and not of MDPI and/or the editor(s). MDPI and/or the editor(s) disclaim responsibility for any injury to people or property resulting from any ideas, methods, instructions or products referred to in the content. |
© 2025 by the author. Licensee MDPI, Basel, Switzerland. This article is an open access article distributed under the terms and conditions of the Creative Commons Attribution (CC BY) license (https://creativecommons.org/licenses/by/4.0/).