Abstract
Citrus diseases severely impact fruit yield and quality. To facilitate in-field, non-destructive, and rapid detection of citrus leaf physiological and pathological conditions, this study proposes a classification method for citrus leaf physiological and pathological statuses that integrates visible/near-infrared multispectral technology with deep learning. First, a handheld spectrometer was employed to acquire spectral images of five sample categories—Healthy, Huanglongbing, Yellow Vein Disease, Magnesium Deficiency and Manganese Deficiency. Mean spectral data were extracted from regions of interest within the 350–2500 nm wavelength range, and various preprocessing techniques were evaluated. The Standard Normal Variate (SNV) transformation, which demonstrated optimal performance, was selected for data preprocessing. Next, we innovatively introduced an adaptive spectral positional encoding mechanism into the Transformer framework. A lightweight, learnable network dynamically optimizes positional biases, yielding the ASTransformer (Adaptive Spectral Transformer) model, which more effectively captures complex dependencies among spectral features and identifies critical wavelength bands, thereby significantly enhancing the model’s adaptive representation of discriminative bands. Finally, the preprocessed spectra were fed into three deep learning architectures (1D-CNN, 1D-ResNet, and ASTransformer) for comparative evaluation. The results indicate that ASTransformer achieves the best classification performance: an overall accuracy of 97.7%, underscoring its excellent global classification capability; a Macro Average of 97.5%, reflecting balanced performance across categories; a Weighted Average of 97.8%, indicating superior performance in classes with larger sample sizes; an average precision of 97.5%, demonstrating high predictive accuracy; an average recall of 97.7%, showing effective detection of most affected samples; and an average F1-score of 97.6%, confirming a well-balanced trade-off between precision and recall. Furthermore, interpretability analysis via Integrated Gradients quantitatively assesses the contribution of each wavelength to the classification decisions. These findings validate the feasibility of combining a handheld spectrometer with the ASTransformer model for effective citrus leaf physiological and pathological detection, enabling efficient classification and feature visualization, and offer a valuable reference for disease detection of physiological and pathological conditions in other fruit crops.
1. Introduction
As a core economic crop in tropical and subtropical regions, the citrus industry has long faced dual threats from pathogenic diseases and physiological disorders. Among pathogenic diseases, Huanglongbing (HLB) is the most lethal and the most difficult to detect. This disease can infect all citrus species and continues to spread via insect vectors, with no cure available to date. Because asymmetric blotchy mottle symptoms often resemble nutrient deficiency, and infected trees may remain asymptomatic for extended periods—serving as reservoirs for bacterial transmission—field identification is highly challenging [1]. More critically, infected plants can remain symptom-free for months to years, rendering symptom-based diagnosis extremely ineffective. Multiple asymptomatic infections, incomplete systemic distribution within the tree, and a prolonged latency period complicate detection and severely hinder disease control efforts [2]. Early and accurate HLB detection is therefore key to limiting its spread, and the limitations of traditional methods create an urgent need for novel early-diagnosis technologies. Excessive starch accumulation—an early HLB symptom manifesting as yellowish/greenish islands on citrus leaves—provides a physiological basis for spectral detection. Yellow Vein Disease, likewise, caused by a xylem-dwelling pathogen, is characterized by tissue degeneration and chlorosis around the veins; its distinct spectral signatures have been validated using various optical spectroscopy techniques [3]. Among physiological disorders, Magnesium Deficiency impairs photosynthetic electron transport and carbon assimilation, resulting in overall chlorosis and anomalous starch accumulation; its metabolomic profile has been elucidated by UHPLC-Q-TOF/MS and exhibits pronounced differences in optical spectral screening [4]. Manganese Deficiency primarily induces banded chlorosis on leaves while the veins remain green, and these visual and spectral features provide a basis for distinguishing nutrient deficiencies from pathological symptoms [5]. Therefore, this study acquired visible and near-infrared spectral data from five leaf categories—healthy, Huanglongbing, Yellow Vein Disease, Magnesium Deficiency, and Manganese Deficiency—to develop a multi-class classification framework that encompasses both pathogenic infection and nutrient imbalance. This framework is designed to enhance the robustness and practical applicability of phenotypic change detection in citrus leaves, with important implications for early intervention and precision disease management.
Empirical studies across multiple dimensions have substantiated the limitations of conventional manual detection approaches in the identification of citrus leaf pathology and physiology [6]. Wang and Trivedi [7] have elaborated on the challenges posed by Huanglongbing to the citrus industry, highlighting that early misdiagnosis rates in visual inspections are high, primarily due to the close resemblance between chlorosis symptoms and the visual manifestations of zinc deficiency and root-related disorders. More critically, missed detections during the asymptomatic phase exacerbate the risk of disease dissemination. Wang et al. [8], using molecular marker tracking, confirmed that Candidatus Liberibacter asiaticus can remain latent for 6–12 months post-infection without any visible symptoms; during this period, manual surveillance exhibits a miss rate exceeding 70%, constituting a key factor in trans-regional spread.
In addition to conventional manual inspection, computer-vision-based image recognition techniques have garnered extensive attention in citrus physiological and pathological detection. Deep learning architectures, such as convolutional neural networks (CNNs), have demonstrated remarkable performance in classifying and detecting foliar physiology and pathology, autonomously extracting chromatic, textural, and morphological features of infected leaves [9]. However, image-based methods exhibit inherent limitations: (1) they are highly contingent on illumination and capture conditions, as complex field lighting variations can markedly degrade recognition accuracy; (2) they struggle to identify early, asymptomatic infections—such as Huanglongbing during its latent phase, when affected foliage is virtually indistinguishable from healthy leaves; and (3) the phenotypic similarity among different disorders (e.g., various chlorosis manifestations) renders it challenging to discriminate pathogenic diseases from physiological disorders using visual features alone [10].
In contrast, visible/near-infrared (VNIR) spectroscopy enables the direct detection of microscopic biochemical alterations in leaf tissues, allowing identification of disease-induced metabolic perturbations prior to symptom manifestation and remaining impervious to ambient lighting conditions. This provides a more reliable technical avenue for precise citrus physiological and pathological diagnostics [11]. Moreover, with the advent of handheld portable spectrometers, researchers can perform in-orchard spectral acquisition of citrus leaves, achieving real-time, non-destructive, and rapid analysis without transporting samples back to the laboratory, thereby greatly enhancing applicability and responsiveness. Nevertheless, variable field environments may compromise sensor stability, and development and maintenance costs remain substantial. By analyzing overtone and combination band absorptions of hydrogen-containing functional groups (e.g., C-H, N-H, S-H, O-H) and other chemical bonds in the near-infrared region, this approach comprehensively reflects the organic composition and biochemical structural features of the sample [12]. Its broad utility spans agriculture, pharmaceuticals, and the petroleum industry [13]. Luqing Li et al. [14] innovatively coupled a smartphone imaging system with NIRS to classify quality grades of Keemun black tea, achieving an accuracy of 94.29%. Khadeja Najjar et al. [15], using principal component analysis (PCA) on near-infrared spectra, accomplished reliable detection of Botrytis cinerea during its latent phase.
Therefore, this study selected citrus leaves as the core detection target, with the key considerations being: leaves serve not only as the primary and sensitive indicators of early responses to physiological and pathological stress [16], but also as the ideal gateway for achieving early, precise, and non-destructive detection through Vis/NIR spectroscopy technology. Although physiological and pathological conditions ultimately affect the entire plant [17], the microscopic physiological and biochemical changes they induce (such as pigment degradation, water imbalance, and alterations in hydrogen-containing group compounds) can often be effectively captured through leaf Vis/NIR spectra at the earliest stages, even before symptoms become visible [18]. This capability to capture pre-symptomatic signals at the leaf level, combined with the convenience of real-time field analysis provided by handheld spectrometers, makes leaf-based spectral detection the most direct, efficient, and practically valuable technical pathway for assessing the overall health status of citrus plants (particularly for early detection of physiological and pathological conditions). This study aims to thoroughly explore the application potential of this technical pathway in precision prevention and control of citrus physiological and pathological conditions [19].
In recent years, machine learning techniques have continued to play a pivotal role in visible/near-infrared (VNIR) spectral classification of citrus leaf physiology and pathology. By optimizing feature selection and the hyperparameters of their models, researchers have achieved marked improvements in classification accuracy. Xia Jing et al. [20] used mRMR-XGBoost to predict winter wheat stripe rust from hyperspectral data, achieving = 0.8894 and RMSE = 0.1135. Their findings demonstrate that XGBoost can provide a valuable reference framework for monitoring crop disease indices. From these results, one can infer that ensemble learning models substantially improve predictive performance. Zhang et al. [21] integrated visible imaging with machine learning techniques to rapidly and accurately assess the severity of downy mildew in cucumbers cultivated in a greenhouse. They then developed shallow machine learning estimation models based on image features that showed high correlation with actual disease severity metrics. The outcomes revealed a strong linear relationship between the severity predicted by the model and the values obtained from ground truth.
However, with the escalating complexity of analytical tasks, deep networks such as convolutional neural networks (CNNs) and other deep learning architectures have emerged as the predominant approach for processing spectral data. Deep learning models can autonomously learn intricate feature representations from raw data without the necessity of manual feature engineering, thereby substantially enhancing classification accuracy and computational efficiency. Cao et al. [22] utilized a spectral dilated convolutional three dimensional CNN (SDC-3DCNN) to detect bacterial leaf blight in rice. They employed principal component analysis (PCA) and random forest (RF) for band selection as input to the model, achieving an accuracy of 95.44%. Bao et al. [23] combined hyperspectral imaging with deep learning to enable early detection of sugarcane black scorch and sugarcane mosaic diseases. Their detection framework fed image patches into a ResNet34 backbone to generate predictive labels for each patch. Nevertheless, the inherently limited receptive field of CNNs constrains their ability to capture long range inter band dependencies [24]. By contrast, Transformer networks underpinned by the self-attention (SA) mechanism exhibit superior global information exchange and latent feature modeling capabilities, outperforming CNNs in numerous domains, including natural language processing [25] and image analysis [26].
To this end, the ASTransformer architecture was introduced and integrated with visible/near-infrared (Vis/NIR) spectral data to classify physiological and pathological conditions in citrus leaves. Leaves affected by Huanglongbing, Yellow Vein Disease, Magnesium Deficiency, Manganese Deficiency, and healthy controls served as research subjects. The spectral signatures characteristic of each physiological and pathological condition were analyzed, key spectral feature information was extracted, and a rapid diagnostic model for citrus physiological and pathological conditions was developed. This approach provides a theoretical foundation for monitoring citrus growth status and for precise identification of pests and pathological conditions.
2. Materials and Methods
2.1. Collection and Processing of Citrus Leaf Samples
The experiment was conducted at the Citrus Disease Orchard of the College of Plant Protection, South China Agricultural University, Guangzhou, Guangdong Province, where Huanglongbing-infected citrus leaves were collected under the guidance of HLB experts. Leaves exhibiting Yellow Vein Disease, Magnesium Deficiency, Manganese Deficiency, and healthy controls were harvested from a citrus plantation in Conghua District, Guangzhou, under the supervision of an agronomist. Both the disease orchard and the plantation were each divided into six zones. In each zone, five citrus trees were randomly selected, and from each tree, leaves were evenly sampled from the top and bottom positions on the east, south, west, and north aspects. After collecting leaves of all five categories (see Figure 1), branches were immediately inserted into water-retaining floral foam for preservation and then transported as a batch to the laboratory for spectral data acquisition, ensuring uniform sampling conditions.
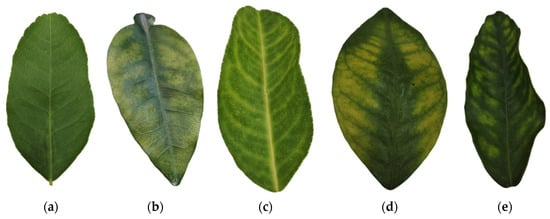
Figure 1.
Five categories of sampled citrus leaves: (a) healthy; (b) Huanglongbing; (c) Yellow Vein Disease; (d) magnesium deficiency; (e) manganese deficiency.
2.2. Spectral Data Acquisition
The PSR + 3500 spectrometer developed by Spectral Evolution (see Figure 2) was employed to collect spectral data from citrus leaf surfaces. The PSR + 3500 spectrometer has a spectral range of 350 nm to 2500 nm, with spectral resolutions of 2.8 nm@700 nm, 8 nm@1500 nm, and 6 nm@2100 nm, and a minimum scanning speed of 100 milliseconds. The spectrometer is equipped with a reflectance contact probe, which connects to the spectrometer via optical fiber for handheld close-contact spectral data collection. The probe has a standard spot size of 10 mm and incorporates a built-in 5-watt tungsten halogen lamp as the light source. The spectral data processing software is DARWin SP Data Acquisition version 1.5.
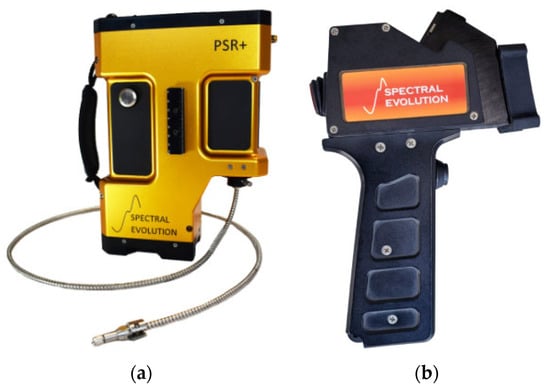
Figure 2.
PSR + 3500 spectrometer: (a) spectrometer, (b) probe.
After powering on the system, the spectrometer was allowed to complete its initialization process. The instrument was subsequently connected to the DARWin SP Data Acquisition software installed on a laptop computer via Bluetooth, and the data storage path was configured. The probe was positioned in direct contact with the citrus leaf sample surface, and upon pressing the acquisition button on the probe, data were transmitted to the software with real-time display of the acquired spectral curves. To ensure data accuracy and stability, spectral measurements were conducted at different locations on each leaf sample, with four spectral data points collected on both sides of the leaf veins for each sample, thereby minimizing the influence of surface imperfections and probe handling angles on the results. Prior to each batch of data collection, reference measurements were taken from both white and black reference panels to facilitate subsequent calibration and baseline correction.
Upon completion of data acquisition, all spectral data were stored in the connected computer and subjected to preliminary data processing using the DARWin SP Data Acquisition software. All collected data were recorded using sample identification numbers and annotated with corresponding physiological and pathological category labels: healthy leaves labeled 0; Huanglongbing labeled 1; Yellow Vein Disease labeled 2; Magnesium Deficiency labeled 3; and Manganese Deficiency labeled 4. This labeling scheme ensured accuracy and traceability in subsequent analyses. Through the aforementioned procedures, after accounting for experimental losses, spectral data from a total of 6790 samples were obtained. These data were partitioned into training and testing sets at a ratio of 7:3, with specific allocation quantities presented in Table 1, for subsequent spectral analysis and training and validation of physiological and pathological classification models.

Table 1.
Dataset partitioning summary.
2.3. Data Preprocessing
In this study, to effectively suppress instrumental noise, eliminate light scattering, and mitigate baseline drift effects on spectral classification of citrus leaf physiological and pathological conditions, a systematic comparison was conducted among three commonly used preprocessing methods: Savitzky–Golay smoothing (SG), Multiplicative Scatter Correction (MSC), and Standard Normal Variate (SNV).
Savitzky–Golay (SG) smoothing fits a low-order polynomial to a moving window of equally spaced spectral points and performs a least-squares smoothing; it substantially reduces high-frequency noise while preserving peak shapes and positions, and is therefore widely used for smoothing and for computing first/second derivatives in absorption spectroscopy. Multiplicative Scatter Correction (MSC) operates by linearly regressing each individual sample spectrum against the mean spectrum of the dataset and then correcting each spectrum by removing the regression intercept and scaling by the regression slope; in the context of leaf reflectance, MSC can effectively correct baseline offsets and multiplicative intensity changes caused by between-leaf differences in surface properties (e.g., surface roughness, cuticular wax thickness, trichome density), variability in leaf thickness and tissue density, and disease- or physiology-driven changes in internal light scattering. Similarly, Standard Normal Variate (SNV) independently centers each spectrum by subtracting its mean and scales it by its standard deviation (so that each spectrum has zero mean and unit variance), thereby reducing spectral intensity variation due to individual leaf morphological and physiological differences without relying on a global reference spectrum; SNV thus helps to emphasize spectral features associated with biochemical composition.
In practical applications, SG, MSC, and SNV are often used in combination with other preprocessing steps (such as baseline correction and derivative transformation) to achieve more thorough correction of complex spectral backgrounds (ResearchGate). In this study, five preprocessing methods—Savitzky–Golay (SG) smoothing, Multiplicative Scatter Correction (MSC), Standard Normal Variate (SNV), SG + MSC, and SG + SNV—were applied to the same baseline reflectance data after black-and-white calibration. Using a consistent training/validation split, classification accuracy was evaluated based on cross-entropy loss, allowing identification of the most suitable preprocessing approach for physiological and pathological classification of citrus leaves.
2.4. Classification Models
2.4.1. 1D-CNN
Convolutional Neural Networks (CNN) are a type of feedforward neural network that perform convolution operations by sliding convolutional kernels across input data, enabling the capture of local features and spatial hierarchical relationships. Their shared weight mechanism reduces the number of parameters, while pooling layers reduce feature dimensionality and enhance model robustness. CNNs demonstrate excellent learning capabilities for high-dimensional data [27] and have achieved tremendous success in qualitative analysis of food using near-infrared spectroscopy [28]. When applying CNN to spectral classification, the convolutional layers of 1D-CNN can automatically extract local spectral features, such as specific wavelength absorption peaks, without the need for manual feature band selection. The pooling layers perform dimensionality reduction and abstraction of extracted features, enabling the model to capture the overall structural characteristics of spectral data.
The 1D-CNN model in this study underwent structural optimization, with convolutional kernel sizes of 9, 5, and 3, and output channels of 16, 32, and 64, respectively, allowing the model to extract spectral features more efficiently.
2.4.2. 1D-ResNet
ResNet is a classical convolutional neural network architecture that addresses the gradient vanishing problem in deep networks through the introduction of residual blocks and skip connections [29]. Residual blocks enable the network to learn the difference between input and output, accelerating gradient propagation [30]. In spectral classification, ResNet’s convolutional layers automatically extract local spectral features without requiring manual band selection, effectively capturing local patterns in one-dimensional spectral data [31].
In spectral classification and detection of citrus leaf physiological and pathological conditions, ResNet leverages its powerful feature-extraction capabilities to learn discriminative local features from spectral data, automatically extracting critical information such as absorption peaks at specific wavelengths. Skip connections enhance the model’s ability to learn complex spectral patterns, enabling better identification of spectral characteristics associated with different physiological and pathological conditions.
The 1D-ResNet model constructed in this study comprises four residual layers, with each residual block consisting of two convolutional layers with kernel size 3 and skip connections. The model first extracts features through an initial convolutional layer with kernel size 7 and 64 output channels, followed by a max pooling layer, then progressively extracts high-level features through four residual layers (with channel numbers 64 → 128 → 256 → 512), and finally completes classification through a global average pooling layer and fully connected layer.
Compared to traditional ResNet, this model simplifies the structure, reducing parameter count and computational complexity. By employing the RMSprop optimizer and StepLR scheduler, and adding Dropout to prevent overfitting, the model achieved good accuracy and robustness in spectral classification of citrus leaf physiological and pathological conditions.
2.4.3. ASTransformer
In spectral data classification, Transformer has demonstrated its powerful potential. Spectral data typically exhibits high dimensionality, complexity, and long-range dependencies. Traditional spectral analysis methods such as Convolutional Neural Networks (CNNs) usually focus on local feature extraction and may fail to adequately capture long-distance correlations [32]. The self-attention mechanism of Transformer can model global dependencies between wavelengths across the entire spectral data, thereby extracting features more precisely. Through multi-head attention mechanisms, Transformer can learn different features of spectral data within multiple subspaces, further improving classification accuracy. Additionally, Transformer’s advantages in parallel computing make it more efficient when processing large-scale spectral data, significantly reducing training time. Therefore, through innovative self-attention mechanisms, multi-head attention, positional encoding, and parallel computing design, Transformer models not only perform excellently in natural language processing tasks but also demonstrate strong potential in spectral data analysis and classification tasks, becoming an important tool for handling complex, high-dimensional data [33]. Notably, a growing body of recent work demonstrates both theoretical and practical advantages of Transformer-based spectral/spectral–spatial methods for hyperspectral data modeling (e.g., Spatial–Spectral Transformer [34], SSATNet [35], and related reviews [36]).
This study proposes ASTransformer (Adaptive Spectral Transformer), specifically designed for near-infrared (350–2500 nm) one-dimensional spectral classification and detection of citrus leaf physiological and pathological conditions. The model architecture is shown in Figure 3. The overall architecture of ASTransformer follows the multi-head self-attention and feed-forward network structure of the original Transformer encoder, with key innovations in the positional encoding module to maximize the preservation of Transformer’s advantages in modeling global dependencies [37,38], while finely capturing differential information across different wavelength bands in discriminating physiological and pathological conditions. Specifically, ASTransformer first projects the original 2151-dimensional spectral reflectance vector into a 128-dimensional feature space through a linear mapping layer, then enhances the projected features using the adaptive spectral positional encoding mechanism proposed in this study: at each wavelength position, ASTransformer maintains a set of trainable positional embedding vectors and fine-tunes them through a two-layer fully connected network (Linear–ReLU–Linear) in an input-independent manner to generate the final positional bias matrix. This bias matrix is continuously optimized adaptively during training, enabling the model to automatically enhance its representational capability for key wavelength bands and suppress attention to redundant or noise bands according to data statistics and task requirements. The feature sequence fused with positional encoding is then fed into an encoder consisting of 3 stacked TransformerEncoderBlocks, where each layer performs multi-head self-attention to aggregate interaction information between different wavelength bands [39] and further refines high-order features through feed-forward networks; the encoder output undergoes global average pooling in the wavelength dimension to obtain a unified-length feature vector, which is finally mapped to five-class output through a fully connected layer.
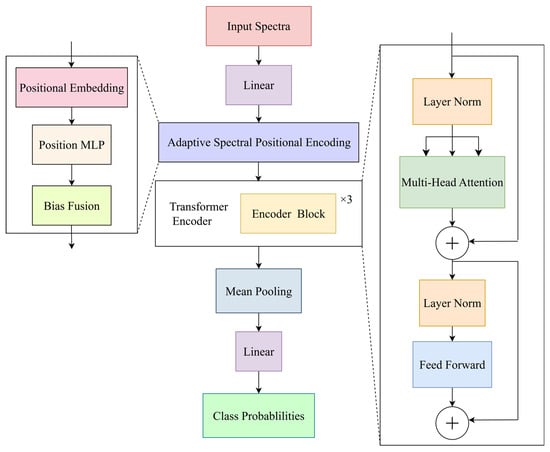
Figure 3.
Architecture of the ASTransformer model.
The core innovation of ASTransformer lies in its adaptive spectral positional encoding module and end-to-end trainable pipeline: compared to traditional static sine/cosine encoding, ASTransformer dynamically adjusts positional embeddings through small-scale MLPs, enabling dynamic weighting of information quality and discriminative capability for each wavelength band according to the spectral characteristics of citrus leaves and differences in physiological and pathological states; compared to conventional models that only use fixed or learnable positional vectors, this approach further introduces nonlinear mapping, significantly enhancing the expressiveness of positional encoding without substantially increasing model complexity. Extensive experiments demonstrate that on standard hyperspectral datasets, ASTransformer achieved significant improvements in classification accuracy and generalization capability compared to baseline Transformer models, indicating that this method has good feasibility and application value in spectral identification of citrus leaf physiological and pathological conditions.
2.5. Model Evaluation Criteria
In model evaluation, the confusion matrix shown in Figure 4 is a tool used to assess the performance of classifiers across each category. Key performance metrics include Accuracy, Precision, Recall, and F1 Score. These metrics are based on four fundamental elements in the confusion matrix: True Positive (TP), True Negative (TN), False Positive (FP), and False Negative (FN). Where TP represents the number of samples correctly predicted as positive class, TN represents the number of samples correctly predicted as negative class, FP represents the number of negative class samples incorrectly predicted as positive class, and FN represents the number of positive class samples incorrectly predicted as negative class.
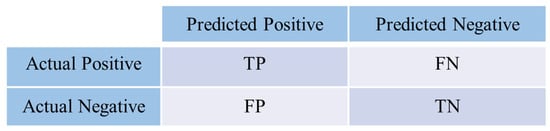
Figure 4.
Schematic of the confusion matrix.
Accuracy: Reflects the model’s overall correct classification capability on the test dataset and serves as an important metric for evaluating the global performance of the model. As shown in Equation (1):
Precision: Represents the proportion of actual positive cases among all samples predicted as positive class. Precision measures the accuracy of the model when predicting positive class, namely the ability to reduce False Positive () errors. As shown in Equation (2):
Recall: Represents the proportion of actual positive class samples that are correctly identified by the model. Recall measures the model’s ability to capture positive class samples, namely the ability to reduce False Negative () errors. As shown in Equation (3):
Score: Is the harmonic mean of precision and recall, comprehensively considering the balance between the two. Score is particularly important in scenarios with class imbalance, as it provides a single evaluation metric that considers both precision and recall. As shown in Equation (4):
In multi-class classification tasks, commonly employed aggregation metrics include Macro Average and Weighted Average. Macro Average computes the simple arithmetic mean of precision, recall, and F1 scores calculated individually for each class. This approach treats all classes equally, disregarding sample size disparities, and is particularly suitable for evaluating the performance balance of models across different classes. Weighted Average performs weighted averaging based on the sample size of each class, providing a more accurate reflection of how class imbalance affects overall model performance. This metric is appropriate for assessing the practical performance of models, especially when class distributions are imbalanced. Through these metrics, comprehensive evaluation of classification model performance across different classes can be achieved, particularly in scenarios with imbalanced class distributions, thereby providing more detailed model performance assessment.
2.6. Integrated Gradients Feature Attribution
Considering the one-dimensional sequential characteristics of spectral data and the practical application requirements for physiological and pathological diagnosis, this study employed the Integrated Gradients (IG) method for model interpretability analysis [40]. Compared to methods such as Grad-CAM, which are primarily designed for two-dimensional images and convolutional neural networks, Integrated Gradients possesses a more rigorous mathematical theoretical foundation and satisfies two important axioms: sensitivity and implementation invariance. This enables more accurate quantification of the contribution degree of each wavelength position to physiological and pathological classification decisions [41]. More importantly, the Integrated Gradients method directly analyzes the importance distribution of input spectral features, which allows the analytical results to correspond directly to specific spectral bands, thereby providing explicit band guidance significance for mechanistic interpretation and practical applications of spectral diagnosis [42].
Integrated Gradients was proposed by Sundararajan et al. as a classical feature attribution method. Its core principle involves constructing a linear interpolation path between the original input and a reference input (baseline), and then integrating the gradients of the model output with respect to each input feature along this path direction, thereby quantifying the contribution degree of each feature to the final prediction result.
Specifically, let the model represent a mapping from the input space (such as spectral vectors of wavelengths) to the output space (such as prediction scores for certain categories). For an input sample and a reference baseline , the integrated gradients are defined as shown in Equation (5):
This formula demonstrates that Integrated Gradients traces the gradient changes in model output with respect to the input wavelength during the transformation process from baseline samples to actual samples , thereby deriving the “cumulative contribution” of that wavelength to the prediction results. Compared to methods that utilize only single-point gradients, Integrated Gradients maintains sensitivity while possessing superior smoothness and stability, enabling more accurate revelation of the feature regions on which the model depends.
In spectral classification tasks, the input typically consists of one-dimensional spectral vectors containing hundreds or even thousands of wavelengths, where different categories (such as healthy versus physiological and pathological plants) often exhibit systematic differences in reflectance at specific wavelengths. Integrated Gradients can reveal which wavelengths play crucial roles in model classification, providing significant interpretative value. This study employs the average spectrum of the “Healthy” category as the reference baseline , and calculates integrated gradients for each physiological and pathological category sample to analyze their feature differences relative to healthy samples. This configuration can significantly highlight the relative changes in spectral characteristics of diseased samples, effectively capturing the discriminative information relied upon by the model when identifying “physiological/pathological versus healthy” categories.
During the interpretation process of Integrated Gradients, when data differences between two distinct categories are pronounced at a specific wavelength, the corresponding integrated gradient value for that wavelength is typically elevated, indicating that changes in that wavelength exert significant influence on model output. Specifically, if the integrated gradient value at a particular wavelength is positive and numerically large, this indicates that enhancement of spectral features at that wavelength will increase the model’s prediction confidence for the current target category, with that wavelength playing a positive facilitating role in model decision-making. Conversely, if the integrated gradient value at a wavelength is negative, this indicates that enhancement of spectral features at that wavelength will decrease the model’s confidence for the current category, playing an inhibitory role in classification decisions. Through this attribution analysis for each wavelength channel, it becomes possible to accurately identify which wavelengths are most critical for distinguishing between disease and healthy conditions.
3. Results Analysis and Discussion
3.1. Comparison of Data Preprocessing
To evaluate the impact of different spectral preprocessing methods on model classification performance, this study organized six methods based on the preprocessing strategies introduced previously: the unprocessed raw spectra (Raw), Savitzky–Golay smoothing (SG), Standard Normal Variate transformation (SNV), Multiplicative Scatter Correction (MSC), and two combined methods (SG + SNV, SG + MSC). Comparative experiments were conducted under unified experimental settings. All experiments employed the ASTransformer model constructed and optimized in this study for training and testing, with test accuracy serving as the primary performance evaluation metric.
The experimental results are presented in Table 2, showing that all preprocessing methods improved model classification performance to varying degrees. Among these, SNV preprocessing demonstrated the most superior performance, achieving a test accuracy of 0.984, significantly higher than the unprocessed raw spectral data (0.948). This was followed by MSC (0.962), SG + SNV (0.959), SG + MSC (0.959), and SG (0.956). These results indicate that appropriate preprocessing operations can effectively enhance the model’s representation capability for spectral data and improve classification performance. Particularly, the SNV method exhibits strong advantages in correcting scale differences between samples, demonstrating optimal effectiveness under the data and model architecture employed in this study.
Table 2.
Comparison of Data Preprocessing Results.
These results confirm that SNV achieves optimal balance between eliminating interference from non-target variables and preserving key spectral features. Its standardization processing effectively enhances the ASTransformer model’s capability to capture essential spectral patterns, providing an optimal data foundation for subsequent analysis.
3.2. Comparison Results of Different Classification Models
To assess the performance of ASTransformer on citrus leaf spectral classification, we compare it against two representative deep-learning baselines: 1D-CNN and 1D-ResNet. Table 3 reports the results in terms of precision, accuracy, macro-averaged F1, and weighted-averaged F1.
Table 3.
Comparison of Results Among Various Classification Models.
In this study, a single five-class classification framework was employed, in which the model directly predicts one of the five categories for each input spectrum. To ensure comparability, all samples—including those from all five categories—were randomly partitioned into training and independent validation sets (70%:30%) during both training and evaluation.
The experimental results demonstrate that the ASTransformer model proposed in this paper exhibits significant advantages in citrus physiological and pathological classification detection tasks, with comprehensive performance superior to the compared 1D CNN and 1D ResNet models. Specifically, in terms of classification precision, the ASTransformer model performs particularly well in Huanglongbing detection (0.968), achieving a 2.2% improvement compared to the 1D ResNet model. Particularly noteworthy is its performance in Magnesium Deficiency detection, reaching a precision value of 0.995, representing a significant 14.4% improvement over the 1D CNN model (0.871). This improvement is not only attributed to the multi-head self-attention mechanism’s capability to model global dependencies, but also benefits from the adaptive spectral position encoding module: it dynamically adjusts bias through trainable embeddings for various band positions, adaptively enhancing key band features and suppressing redundant noise, enabling the model to more accurately capture fine-grained spectral differences in leaf disease symptoms and reduce inter-class confusion problems.
In terms of overall performance, the ASTransformer model surpasses 1D ResNet (0.952) and 1D CNN (0.898) with an accuracy of 0.977, and its powerful sequence modeling capability ensures global associative learning of sample features. Regarding balance indicators, ASTransformer’s macro average (0.975) and weighted average (0.978) both rank first, with improvements of 2.2% and 2.5%, respectively, compared to 1D ResNet, indicating that the model maintains stable classification performance under different class sample size conditions, particularly demonstrating better adaptability in small-sample disease categories. Notably, in Yellow Vein Disease detection, ASTransformer achieves a precision value of 0.980, significantly superior to 1D ResNet (0.952), further validating the dynamic focusing capability of adaptive position encoding on useful bands in complex texture and noise environments.
The comparative data among models indicate that the ASTransformer architecture achieves cross-regional and key-band-focused collaborative perception of physiological and pathological features through multi-head self-attention combined with adaptive spectral position encoding. Therefore, this study selects the ASTransformer model as the core architecture for intelligent agricultural physiology and pathology classification detection, and its excellent performance validates the application potential of deep learning models based on attention and adaptive position encoding in the field of agricultural physiological and pathological detection.
Table 4 presents the multi-classification results of the ASTransformer model for five categories of citrus leaf physiological and pathological conditions. The data show that the average precision for the five categories is 97.5%, average recall is 97.7%, and average F1-score is 97.6%. The experimental results demonstrate that ASTransformer exhibits excellent classification performance across most categories. Among them, Magnesium Deficiency achieves a precision of 99.5% and an F1-score of 97.6%, indicating extremely high recognition reliability for its features. Yellow Vein Disease maintains stable performance across all three indicators at 98.0%, reflecting balanced capability in capturing comprehensive pathological features. Notably, the recall rate for Healthy leaves reaches 98.1%, significantly reducing the risk of missed diagnosis, which is crucial for early disease prevention and control.
Table 4.
Detailed Classification Results for Five Leaf Categories Using ASTransformer.
However, the model demonstrates relatively weaker performance in Huanglongbing detection, with precision (96.8%) and recall (96.5%) lower than other categories by 1.3–2.0 percentage points. This may stem from the spectral feature similarity between early symptoms of Huanglongbing and other diseases (such as Manganese Deficiency), resulting in limited model capability to distinguish subtle differences. Additionally, although Manganese Deficiency achieves a precision of 97.5%, potential spectral confusion with some nutritional deficiencies (such as zinc deficiency) still requires attention, particularly in samples with progressive pathological evolution.
The current results indicate that the ASTransformer model has achieved practical performance (average F1-score 97.6%) in multi-spectral physiology and pathology classification tasks, but challenges remain in fine-grained discrimination of similar physiological and pathological conditions. To address these issues, further optimization of model parameters and structure is planned, along with expansion of the physiological and pathological sample database to enhance the model’s generalization performance.
3.3. Spectral Data Analysis
3.3.1. Raw Spectral Data of the Samples
Figure 5 presents the average spectral reflectance and variability of five categories of citrus leaf samples. Each curve represents the average reflectance of one category (Healthy, Huanglongbing, Yellow Vein Disease, Magnesium Deficiency, and Manganese Deficiency) across the wavelength range from 350 nm to 2500 nm. Chlorophyll content is a key factor influencing leaf spectral reflectance [43]. In the visible light region (approximately 400–700 nm), chlorophyll primarily absorbs red light (approximately 600–700 nm) and blue-violet light (approximately 400–500 nm) for photosynthesis. Therefore, normal leaves exhibit relatively low reflectance due to high chlorophyll content and pronounced absorption [44]. Reflectance changes are directly correlated with chlorophyll content and photosynthetic efficiency. A relative peak appears in the green light region (500–600 nm), which is an area where chlorophyll absorption is relatively weak, accounting for the green appearance of plants. The reflectance variations near 550 nm primarily reflect differences in chlorophyll content.
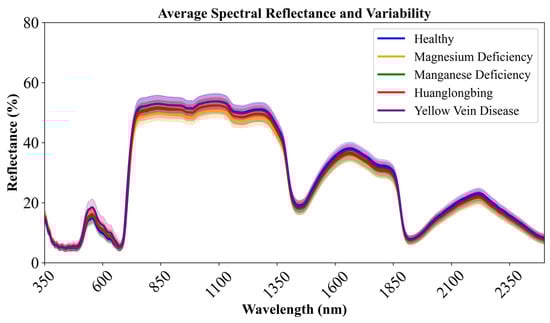
Figure 5.
Average Spectral Reflectance and Variability.
In the red-edge region (700–750 nm), reflectance increases sharply, forming the characteristic. Red-edge position and slope are important indicators of plant health status [45], primarily influenced by both leaf internal structure and chlorophyll content. In the near-infrared band (700–1300 nm), reflectance remains relatively stable, and the reflectance in this band is mainly affected by leaf internal structure. When leaves are affected by disease or nutrient deficiency, cellular structure may be damaged, such as cell wall damage and changes in intercellular spaces, thereby reducing reflectance in the near-infrared band. Multiple peaks appear in the 1300–2500 nm band, where water and some chemical components (such as proteins, starch, etc.) absorb light. Disease may affect the content and proportion of chemical components in leaves, as well as water status, thereby causing changes in reflectance.
3.3.2. Spectral Absorption Characteristics
To further elucidate leaf spectral features, first-order derivative analysis was applied to raw spectra, as shown in Figure 6, and second-order derivative analysis was performed separately, as shown in Figure 7. Compared to the original spectra, first-order derivatives amplify rates of spectral change and remove baseline drift, while second-order derivatives emphasize inflection points and hidden peaks, thereby enhancing inter-sample contrast [46].
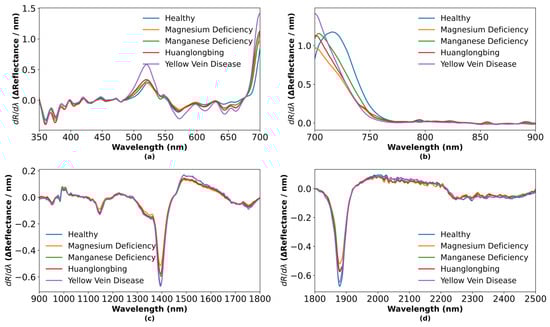
Figure 6.
First-order derivative spectra of five leaf categories: (a) 350–700 nm; (b) 700–900 nm; (c) 900–1800 nm; (d) 1800–2500 nm.
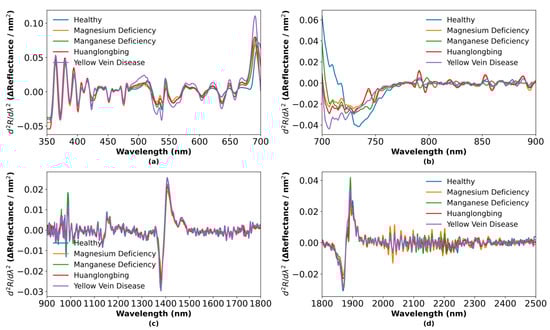
Figure 7.
Second-order derivative spectra of five leaf categories: (a) 350–700 nm; (b) 700–900 nm; (c) 900–1800 nm; (d) 180–2500 nm.
In the visible region (500–675 nm), Figure 6a shows that the first-order derivative initially increases and then decreases, reflecting variations in carotenoid, xanthophyll, and chlorophyll concentrations. Under physiological and pathological stress, accessory pigment levels rise to protect the photosynthetic apparatus from photooxidative damage [47]. Chlorophyll a absorption at 663 nm and chlorophyll b absorption at 642 nm are altered under physiological and pathological conditions. Figure 7a demonstrates that second-order derivatives resolve fine absorption-peak structures and further magnify compositional differences among physiological and pathological types.
In the red-edge region (700–800 nm), Figure 6b reveals significant shifts in peak position and magnitude for the first-order derivative, corresponding to the abrupt transition from strong chlorophyll absorption in the red band to high reflectance in the near-infrared band. Physiological and pathological stress-induced chlorophyll degradation and mesophyll cell disruption reduce absorption near 680 nm and alter scattering properties, causing the red edge to shift toward shorter wavelengths [48]. Figure 7b shows that second-order derivatives sensitively detect subtle changes in the red-edge slope.
In the water-sensitive region (1300–1500 nm), Figure 6c indicates that the first-order derivative exhibits a pronounced absorption trough around 1400 nm, followed by a sharp rise, reflecting differential effects of physiological and pathological conditions on leaf water status due to overtone and combination-tone absorptions of O-H bonds. Figure 7c highlights these water-related spectral features even more clearly in the second-order derivative.
In the long-wave near-infrared region (1800–2000 nm), Figure 6d displays complex absorption-recovery patterns in the first-order derivative. Healthy leaves, with intact cellular structure and abundant organic content, exhibit the strongest absorption, whereas disease-induced cellular damage and biochemical degradation lead to reduced absorption. Figure 7d clarifies the contributions of structural carbohydrates such as starch, cellulose, and lignin to these patterns through second-order derivative analysis [49].
3.4. Feature Importance Visualization and Decision Explanation
The integrated gradients method reveals the relative importance of different spectral bands in physiological and pathological identification by calculating the gradient integral of model output with respect to each wavelength of the input spectrum. The integrated gradients analysis plot displays the IG curves for different physiological and pathological categories relative to the healthy reference spectrum across the wavelength range of 350 nm to 2500 nm, directly reflecting the diagnostic value of each spectral band in the input spectral data. The horizontal axis represents wavelength, while the vertical axis shows the normalized IG values (indicating the importance of the spectral band at that wavelength for “category i vs. healthy” discrimination). The colored curves correspond to four physiological and pathological categories: Magnesium Deficiency (orange), Manganese Deficiency (green), Huanglongbing (red), and Yellow Vein Disease (purple). The dashed line (y = 0) serves as the reference level. When the IG curve of a category is above zero at a certain wavelength, it indicates that this wavelength band makes a positive contribution to distinguishing that category from healthy samples. When the IG curve is below zero, it suggests that the spectral features at that wavelength band are unimportant for the model’s judgment of that category, or drive the model output in the opposite direction (more towards healthy).
Figure 8 demonstrates that with the healthy category as baseline, Magnesium Deficiency shows the most significant positive peak at 536 nm (IG ≈ 0.26), which is located in the green light region and closely related to chlorophyll content changes [50]. Yellow Vein Disease reaches a positive peak at 713 nm (IG ≈ 0.72), which is in the red edge region, a sensitive band for plant chlorophyll fluorescence and leaf structural changes [51]. Manganese Deficiency exhibits a notable positive peak at 1670 nm (IG ≈ 0.51), corresponding to plant leaf water content and cellular structural characteristics [52]. Huanglongbing shows a positive peak at 2454 nm (IG ≈ 0.24), located in the long-wave infrared region, primarily reflecting biochemical composition changes in leaves [53]. The key wavelength bands revealed by IG analysis are highly consistent with known plant physiological spectral response mechanisms. Differences in the visible light region mainly reflect changes in pigment content, differences in the near-infrared region primarily represent alterations in leaf structure and water status, while differences in the shortwave infrared region correspond to changes in biochemical composition. These findings indicate that the integrated gradients method successfully identified biologically meaningful diagnostic features in spectral data, providing scientific evidence for spectrum-based physiological and pathological diagnosis.
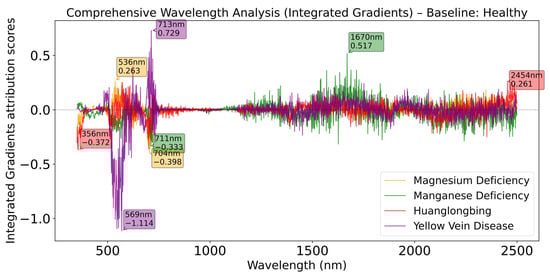
Figure 8.
Comprehensive wavelength analysis (Integrated Gradients) relative to healthy baseline.
As shown in Figure 9, when Huanglongbing serves as the baseline, the healthy category shows significant positive contribution at 537 nm, but simultaneously exhibits stronger negative influence at 702 nm, forming distinct red light region suppression characteristics. The Manganese Deficiency category presents a positive peak at 703 nm, close to the negative peak position of the healthy category, indicating that the red light band plays an important role in distinguishing Huanglongbing from other physiological disorders.
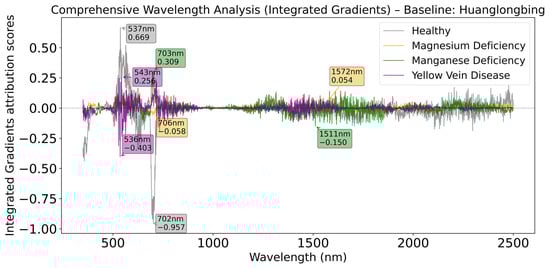
Figure 9.
Comprehensive wavelength analysis (Integrated Gradients) relative to Huanglongbing baseline.
As shown in Figure 10, in the analysis with Yellow Vein Disease as baseline, the healthy category demonstrates the strongest spectral response intensity, reaching a peak at 537 nm while showing strong negative contribution at 702 nm. This combination pattern of positive peak at 537 nm and negative peak at 702 nm repeatedly appears in multiple baseline analyses, indicating that the green light-red light band combination is a stable feature for distinguishing Yellow Vein Disease from other categories.
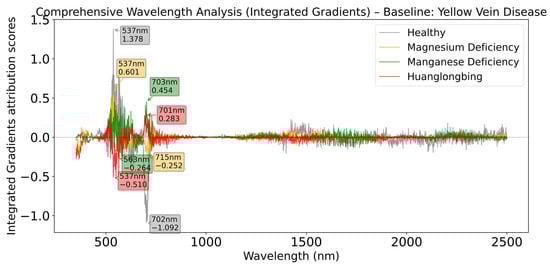
Figure 10.
Comprehensive wavelength analysis (Integrated Gradients) relative to Yellow Vein Disease baseline.
As shown in Figure 11, when Magnesium Deficiency serves as baseline, the healthy category exhibits the highest positive peak at 540 nm, while the Yellow Vein Disease category shows stronger positive contribution at 530 nm, indicating that the green light band is significant for distinguishing these two categories.
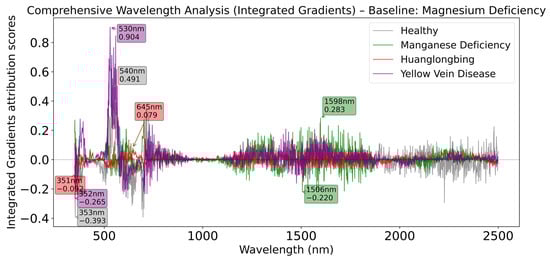
Figure 11.
Comprehensive wavelength analysis (Integrated Gradients) relative to Magnesium Deficiency baseline.
As shown in Figure 12, the analysis results with Manganese Deficiency as baseline show different spectral response patterns, with the Yellow Vein Disease category exhibiting the strongest integrated gradient value at 530 nm, far exceeding other categories, while the main contribution band of the healthy category shifts to 713 nm. Particularly, the healthy category shows a strong negative peak at 2227 nm in the near-infrared region, a feature rarely seen in other baseline analyses, reflecting the unique near-infrared spectral response mechanism specific to manganese deficiency.
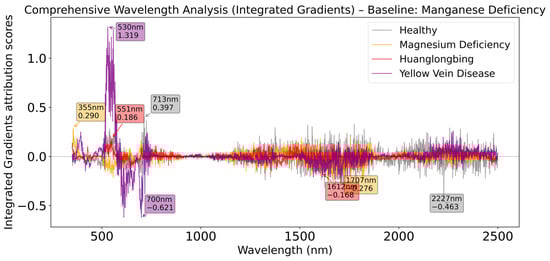
Figure 12.
Comprehensive wavelength analysis (Integrated Gradients) relative to Manganese Deficiency baseline.
By comparing integrated gradient distribution patterns under different baselines, we found that the 530–540 nm green light region and 700–715 nm red edge region show significant importance in most analyses, which can be considered as core bands for citrus physiological and pathological spectral diagnosis, as follows:
- (1)
- 530–540 nm (green light region): The high IG values (positive contribution) in this band primarily reflect significant decline in leaf chlorophyll content, which is a common response to various stresses. Chlorophyll a and b have strong absorption peaks in the green light region. Magnesium deficiency directly inhibits the activity of Mg-chelatase, a key enzyme in chlorophyll synthesis [54], leading to sharp reduction in total chlorophyll content, thereby significantly reducing absorption capacity in this band and enhancing reflectance at 530–540 nm. This change forms the spectral basis for the characteristic yellowing (chlorosis) of magnesium-deficient leaves. Yellow Vein Disease is easily distinguishable in the 530–540 nm green light band due to its unique pathological characteristics. Citrus yellow vein disease virus infection impedes the phloem transport of iron-nicotianamine complexes, causing localized iron deficiency in leaf veins and adjacent mesophyll, triggering targeted chlorophyll degradation, which greatly weakens green light absorption in this region and significantly increases reflectance [55]. Meanwhile, the virus also destroys chloroplast structure in this region, causing grana lamellae disintegration and enhancing green light diffuse reflection. These specific spectral features formed by local chlorophyll reduction and structural damage make it easily distinguishable from other physiological and pathological conditions in this band.
- (2)
- 700–715 nm (red edge region): This band is the most sensitive “red edge” region for monitoring plant photosynthetic organ health status. The red edge position (inflection point of steep reflectance increase) of healthy vegetation is typically located at 720–750 nm [56]. Yellow vein disease is usually caused by pathogen infection localized in phloem/vascular tissues, triggering immune and physicochemical reactions in phloem (such as callose deposition and sieve plate pore blockage) and disrupting material transport within vascular tissues, thereby leading to local nutrient and water redistribution and leaf metabolic imbalance [57]. Due to impaired vascular transport and disrupted nutrient/water balance, infected leaves often exhibit starch/carbohydrate retention, inhibited chlorophyll synthesis, and cellular dehydration and wilting. These physiological changes are often accompanied by reconstruction of mesophyll cell arrangement, volume, and air gap distribution (such as cell loosening, cavitation, or changes in cell wall/intercellular space morphology) [58]. The three-dimensional structure within leaves (mesophyll stacking, cell-air gap interfaces, and leaf thickness) is the dominant factor in multiple scattering of near-infrared (NIR) photons [59]; therefore, the cellular/tissue morphological changes caused by yellow vein disease significantly alter NIR scattering characteristics, subsequently changing the red edge reflectance spectral shape in adjacent bands (such as red edge position shift or abnormal reflectance at red edge). Healthy samples often show negative peaks near 700–715 nm in analyses with physiological and pathological conditions as baselines, which precisely demonstrates that healthy leaves have relatively low and stable reflection characteristics in this band, and any changes (such as increased reflectance accompanied by a blue shift of the red edge position) would significantly reduce the model’s probability of classifying them as healthy.
The application value of the integrated gradients method in this study is reflected in three aspects: (1) direct quantification of the diagnostic importance of each band in input spectral data; (2) identification of key bands with clear biological significance, providing scientific evidence for mechanistic research of physiological and pathological diagnosis; (3) analysis results can directly guide spectral instrument band optimization and diagnostic algorithm feature selection, with important practical value. This interpretability analysis method based on input feature importance provides important theoretical support and practical guidance for the development of intelligent diagnostic technologies in precision agriculture.
4. Conclusions
This study, based on handheld spectroscopy combined with the ASTransformer deep learning model, enables on-site, non-destructive, rapid, and accurate classification and identification of citrus leaves in five different states: Healthy, Huanglongbing, Yellow Vein Disease, Magnesium Deficiency, and Manganese Deficiency, providing a novel technological approach for citrus physiological and pathological diagnosis and precision prevention and control. The ASTransformer model demonstrates excellent computational efficiency and deployment feasibility. The model has approximately 2.3 million total parameters, including linear mapping layer (2151→128 dimensions), approximately 275 K parameters, adaptive spectral position encoding, approximately 275 K parameters, 3-layer Transformer encoder blocks, approximately 1.65–1.95 million parameters, and classification head, approximately 645 parameters. Under RTX 4060 GPU and Intel i7 processor configuration, the training time for 6790 spectral samples is only 10 min, and the inference speed meets the requirements for real-time spectral analysis. Compared to traditional deep learning models, ASTransformer achieves lightweight design while maintaining high accuracy, making it suitable for deployment on mobile devices and edge computing platforms, providing technical support for real-time field physiological and pathological diagnosis. The key points are summarized below:
- (1)
- Through systematic comparison of six spectral preprocessing methods, SNV preprocessing demonstrated significant superiority: testing accuracy of 98.4%, representing a 3.6% improvement over raw spectra (94.8%), and outperforming other methods including MSC (96.2%) and SG + SNV (95.9%). These results confirm the unique advantages of SNV in correcting scale differences between samples, providing a standardized benchmark for citrus physiological and pathological spectral modeling.
- (2)
- ASTransformer surpassed baseline models, achieving 97.7% accuracy in overall performance, superior to 1D-ResNet (95.2%) and 1D-CNN (89.8%). In terms of critical case precision, the ASTransformer model achieved 96.8% accuracy for Huanglongbing identification, outperforming the 1D-ResNet model’s 94.6%. The ASTransformer model achieved 99.5% accuracy in Magnesium Deficiency detection, representing a significant 14.4% improvement over the 1D-CNN model (87.1%). In terms of generalization capability, ASTransformer ranked first in both macro-average (0.975) and weighted average (0.978). Compared with recent published studies, ASTransformer’s overall performance lies at or above the range reported in similar works—for example, a fused-feature CNN for early detection of strawberry gray mold reported approximately 96.6% accuracy [60]; a reflectance-plus-fluorescence study for citrus leaf discrimination reported a best leaf-level accuracy of approximately 94.5% [61]; several studies using shallow CNNs or classical classifiers for citrus leaf/fruit classification report overall accuracies around approximately 92% [62]; a YOLOv8 + HSI study reported a weighted F1 ≈ 0.896 under its experimental settings [63]; and a 3D-CNN study for strawberry gray mold achieved validation accuracies in the 0.74–0.84 range depending on input format [64].
- (3)
- Integrated gradients revealed that the 530–540 nm and 700–715 nm bands serve as core diagnostic regions, while 350–355 nm consistently exhibits negative contribution for magnesium deficiency, and the 1500–1700 nm and above 2200 nm bands show significant differences among different physiological and pathological categories. It should be noted that the 350–450 nm region and wavelengths > 2400 nm often exhibit low SNR in handheld/field spectral measurements. To enhance model generalizability and avoid prematurely discarding potentially useful information, we retained the full 350–2500 nm range in the primary analyses; concurrently, we applied Savitzky–Golay smoothing, baseline correction, normalization, and SNV/MSC preprocessing together with model regularization to reduce the impact of noise. We recommend that, in applied settings, researchers perform local sensitivity tests (e.g., cropping < 400 nm or >2400 nm) to balance generalizability and robustness according to instrument and task requirements.
Based on the limitations of the present study, future work should design dedicated experiments to quantify spectral variability across different regions of the leaf, particularly on either side of the main veins. Such variability could be incorporated as covariates in the model or addressed through more standardized sampling strategies (e.g., deliberately avoiding the primary vein regions) to further enhance model accuracy and interpretability. Particular emphasis should be placed on validating the consistency between in-field (on-site) spectral measurements and those obtained under laboratory conditions—for example, by assessing the effects of seasonal variation, water stress, and illumination differences on key wavelength bands—while concurrently establishing a quantitative assessment framework to characterize spectral feature changes occurring during sample transport and storage. This work should include the development of field-calibration protocols for portable spectrometers and the construction of spectral correction models that explicitly account for environmental covariates, thereby improving the accuracy and stability of diagnostic models in real-world agricultural settings. In addition, long-term field-validation trials are necessary to evaluate model generalizability across different geographic regions and cultivation practices.
Author Contributions
Conceptualization, Q.D. and Y.H.; methodology, Y.H.; software, S.Z. and X.X.; validation, S.L. (Shiyao Liang) and S.S.; formal analysis, J.F. and S.L. (Shiyao Liang); investigation, S.Z. and X.X.; resources, Z.L.; data curation, S.L. (Shiyao Liang) and J.F.; writing—original draft preparation, Y.H.; writing—review and editing, Y.H. and Q.D.; supervision, S.S. and X.X.; project administration, Z.L. and S.L. (Shilei Lyu); funding acquisition, Z.L. and S.L. (Shilei Lyu). All authors have read and agreed to the published version of the manuscript.
Funding
This research was funded by Earmarked Fund for CARS, grant no. CARS-26. It was also partly supported by the National Natural Science Foundation of China, grant no. 32271997; the National Natural Science Foundation of China, grant no. 32472020; Science and Technology Projects in Guangzhou, grant No. 2024B03J1309. The recipients of these four funds are Zhen Li, Shilei Lyu, and Shuran Song.
Data Availability Statement
The original contributions presented in the study are included in the article, further inquiries can be directed to the corresponding author.
Acknowledgments
ChatGPT 4.0 was used in this article for the translation and polishing of the entire manuscript. The authors have reviewed and edited the output and take full responsibility for the content of this publication.
Conflicts of Interest
The funders had no role in the design of the study; in the collection, analysis, or interpretation of data; in the writing of the manuscript; or in the decision to publish the results.
References
- Deng, X.; Zhu, Z.; Yang, J.; Zheng, Z.; Huang, Z.; Yin, X.; Wei, S.; Lan, Y. Detection of Citrus Huanglongbing Based on Multi-Input Neural Network Model of UAV Hyperspectral Remote Sensing. Remote Sens. 2020, 12, 2678. [Google Scholar] [CrossRef]
- Yang, K.; Hu, B.; Zhang, W.; Yuan, T.; Xu, Y. Recent progress in the understanding of Citrus Huanglongbing: From the perspective of pathogen and citrus host. Mol. Breed. 2024, 44, 77. [Google Scholar] [CrossRef] [PubMed] [PubMed Central]
- Bharadwaj, S.; Midha, A.; Sharma, S.; Singh Sidhu, G.; Kumar, R. Optical Screening of Citrus Leaf Diseases Using Label-Free Spectroscopic Tools: A Review. J. Agric. Food Res. 2024, 18, 101303. [Google Scholar] [CrossRef]
- Huang, Z.; Zhang, H.; Ye, X.; Lai, N.; Yang, L.; Guo, J.; Chen, L. UHPLC-Q-TOF/MS-based metabolomics reveals altered metabolic profiles in magnesium deficient leaves of Citrus sinensis. Sci. Hortic. 2021, 278, 109870. [Google Scholar] [CrossRef]
- Alejandro, S.; Höller, S.; Meier, B.; Peiter, E. Manganese in Plants: From Acquisition to Subcellular Allocation. Front. Plant Sci. 2020, 11, 300. [Google Scholar] [CrossRef]
- Elaraby, A.; Hamdy, W.; Alanazi, S. Classification of Citrus Diseases Using Optimization Deep Learning Approach. Comput. Intell. Neurosci. 2022, 2022, 9153207. [Google Scholar] [CrossRef] [PubMed] [PubMed Central]
- Qiu, X.; Chen, H.; Huang, P.; Zhong, D.; Guo, T.; Pu, C.; Li, Z.; Liu, Y.; Chen, J.; Wang, S. Detection of citrus diseases in complex backgrounds based on image-text multimodal fusion and knowledge assistance. Front. Plant Sci. 2023, 14, 1280365. [Google Scholar] [CrossRef] [PubMed] [PubMed Central]
- Acosta, M.; Quiñones, A.; Munera, S.; José, M.; Blasco, J. Rapid Prediction of Nutrient Concentration in Citrus Leaves Using Vis-NIR Spectroscopy. Sensors 2023, 23, 6530. [Google Scholar] [CrossRef] [PubMed] [PubMed Central]
- Wang, N.; Trivedi, P. Citrus huanglongbing: A newly relevant disease presents unprecedented challenges. Phytopathology 2013, 103, 652–665. [Google Scholar] [CrossRef] [PubMed]
- Wang, Q.; Xu, Y.; Yang, X.; Jia, J.; Zhou, J.; Zeng, J.; Yan, X.; Li, J.; Yue, J.; Guo, J.; et al. Novel insight into the distribution and dissemination of Candidatus Liberibacter asiaticus, the causal agent of citrus Huanglongbing. Plant Biotechnol. J. 2022, 20, 247–249. [Google Scholar] [CrossRef] [PubMed] [PubMed Central]
- Patrizia, F.; Remo, B.; Federico, M.; Biancolillo, A. Authentication of “Avola almonds” by near infrared (NIR) spectroscopy and chemometrics. J. Food Compos. Anal. 2019, 82, 103235. [Google Scholar] [CrossRef]
- Wang, Y.; Wang, K.; Zhou, Z.; Du, W. Modeling of oil near-infrared spectroscopy based on similarity and transfer learning algorithm. Front. Chem. Sci. Eng. 2019, 13, 599–607. [Google Scholar] [CrossRef]
- Anna, O.C.; Wei, L.; Da, Y.; Guo, L.; Luis, R.; Pierluigi, B. Machine Learning-Based Presymptomatic Detection of Rice Sheath Blight Using Spectral Profiles. Plant Phenomics 2020, 2020, 8954085. [Google Scholar] [CrossRef]
- Li, L.; Wang, Y.; Jin, S.; Li, M.; Chen, Q.; Ning, J.; Zhang, Z. Evaluation of black tea by using smartphone imaging coupled with micro-near-infrared spectrometer. Spectrochim. Acta A Mol. Biomol. Spectrosc. 2021, 246, 118991. [Google Scholar] [CrossRef] [PubMed]
- Najjar, K. VISIBLE/NEAR-INFRARED (VIS/NIR) SPECTROSCOPY TECHNIQUE TO DETECT GRAY MOLD DISEASE IN THE EARLY STAGES OF TOMATO FRUIT. J. Microbiol. Biotechnol. Food Sci. 2021, 11, e3108. [Google Scholar] [CrossRef]
- Li, C.; Czyż, E.; Halitschke, R.; Baldwin, I.; Schaepman, M.; Schuman, M. Evaluating potential of leaf reflectance spectra to monitor plant genetic variation. Plant Methods 2023, 19, 108. [Google Scholar] [CrossRef] [PubMed] [PubMed Central]
- Kothari, S.; Beauchamp-Rioux, R.; Blanchard, F.; Crofts, A.L.; Girard, A.; Guilbeault-Mayers, X.; Hacker, P.; Pardo, J.; Schweiger, A.; Demers-Thibeault, S.; et al. Predicting leaf traits across functional groups using reflectance spectroscopy. New Phytol. 2023, 238, 549–566. [Google Scholar] [CrossRef]
- Dung, C.; Trueman, S.; Wallace, H.; Farrar, M.; Gama, T.; Tahmasbian, I.; Bai, S. Hyperspectral imaging for estimating leaf, flower, and fruit macronutrient concentrations and predicting strawberry yields. Environ. Sci. Pollut. Res. Int. 2023, 30, 114166–114182. [Google Scholar] [CrossRef]
- Zhou, C.; Bucklew, V.; Edwards, P.; Zhang, C.; Yang, J.; Ryan, P.; Hughes, D.; Qu, X.; Liu, Z. Portable Diffuse Reflectance Spectroscopy of Potato Leaves for Pre-Symptomatic Detection of Late Blight Disease. Appl. Spectrosc. 2023, 77, 491–499. [Google Scholar] [CrossRef]
- Jing, X.; Zou, Q.; Yan, J.; Dong, Y.; Li, B. Remote Sensing Monitoring of Winter Wheat Stripe Rust Based on mRMR-XGBoost Algorithm. Remote Sens. 2022, 14, 756. [Google Scholar] [CrossRef]
- Zhang, L.X.; Tian, X.; Li, Y.X.; Chen, Y.Q.; Chen, Y.Y.; Ma, J.C. Estimation of Disease Severity for Downy Mildew of Greenhouse Cucumber Based on Visible Spectral and Machine Learning. Spectrosc. Spectr. Anal. 2020, 40, 227–232. [Google Scholar]
- Cao, Y.; Yuan, P.; Xu, H.; Martínez, O.J.F.; Feng, J.; Zhai, Z. Detecting Asymptomatic Infections of Rice Bacterial Leaf Blight Using Hyperspectral Imaging and 3-Dimensional Convolutional Neural Network With Spectral Dilated Convolution. Front. Plant Sci. 2022, 13, 963170. [Google Scholar] [CrossRef] [PubMed] [PubMed Central]
- Bao, D.; Zhou, J.; Bhuiyan, S.A.; Adhikari, P.; Tuxworth, G.; Ford, R.; Gao, Y. Early detection of sugarcane smut and mosaic diseases via hyperspectral imaging and spectral-spatial attention deep neural networks. J. Agric. Food Res. 2024, 18, 101369. [Google Scholar] [CrossRef]
- Chen, Q.; Wen, W.; Qin, J. GlobalSR: Global context network for single image super-resolution via deformable convolution attention and fast Fourier convolution. Neural Netw. 2024, 180, 106686. [Google Scholar] [CrossRef] [PubMed]
- Vaswani, A.; Shazeer, N.; Parmar, N.; Uszkoreit, J.; Jones, L.; Gomez, A.N.; Kaiser, Ł.; Polosukhin, I. Attention is All You Need. arXiv 2017. [Google Scholar] [CrossRef]
- Dosovitskiy, A.; Beyer, L.; Kolesnikov, A.; Weissenborn, D.; Zhai, X.; Unterthiner, T.; Dehghani, M.; Minderer, M.; Heigold, G.; Gelly, S. An image is Worth 16x16 Words: Transformers for Image Recognition at Scale. arXiv 2020. [Google Scholar] [CrossRef]
- Du, J.; Hu, B.; Liu, Y.; Wei, C.; Zhang, G.; Tang, X. Study on quality identification of macadamia nut based on convolutional neural networks and spectral features. Spectrosc. Spectr. Anal. 2018, 38, 1514–1519. [Google Scholar]
- Chen, X.; Chai, Q.; Lin, N.; Li, X.; Wang, W. 1D convolutional neural network for the discrimination of aristolochic acids and their analogues based on near-infrared spectroscopy. Anal. Methods 2019, 11, 5118–5125. [Google Scholar] [CrossRef]
- Chen, J.; Liu, H.; Li, J.Q.; Wang, Y.Z. A rapid and effective method for species identification of edible boletes: FT-NIR spectroscopy combined with ResNet. J. Food Compos. Anal. 2022, 112, 104698. [Google Scholar] [CrossRef]
- Zhang, Z.; Chang, Z.; Huang, J.; Leng, G.; Xu, W.; Wang, Y.; Xie, Z.; Yang, J. Enhancing soil texture classification with multivariate scattering correction and residual neural networks using visible near-infrared spectra. J. Environ. Manag. 2024, 352, 120094. [Google Scholar] [CrossRef] [PubMed]
- Chen, T.; Baek, S.J. Library-Based Raman Spectral Identification Using Multi-Input Hybrid ResNet. ACS Omega 2023, 8, 37482–37489. [Google Scholar] [CrossRef] [PubMed] [PubMed Central]
- Xu, Z.; Su, C.; Wang, S.; Zhang, X. Local and Global Spectral Features for Hyperspectral Image Classification. Remote Sens. 2023, 15, 1803. [Google Scholar] [CrossRef]
- Ma, C.; Jiang, J.; Li, H.; Mei, X.; Bai, C. Hyperspectral Image Classification via Spectral Pooling and Hybrid Transformer. Remote Sens. 2022, 14, 4732. [Google Scholar] [CrossRef]
- He, X.; Chen, Y.; Lin, Z. Spatial-Spectral Transformer for Hyperspectral Image Classification. Remote Sens. 2021, 13, 498. [Google Scholar] [CrossRef]
- Wang, B.; Chen, G.; Wen, J.; Li, L.; Jin, S.; Li, Y.; Zhou, L.; Zhang, W. SSATNet: Spectral-spatial attention transformer for hyperspectral corn image classification. Front. Plant Sci. 2025, 15, 1458978. [Google Scholar] [CrossRef] [PubMed] [PubMed Central]
- Muhammad, A.; Salvatore, D.; Adil, M.; Manuel, M.; Chen, L.; Hao, L.; Jagannath, A.; Yao, D.; Gemine, V.; Dan, H. A comprehensive survey for Hyperspectral Image Classification: The evolution from conventional to transformers and Mamba models. Neurocomputing 2025, 644, 130428. [Google Scholar] [CrossRef]
- Hong, D.; Han, Z.; Yao, J.; Gao, L.; Zhang, B.; Plaza, A.; Chanussot, J. SpectralFormer: Rethinking hyperspectral image classification with transformers. IEEE Trans. Geosci. Remote Sens. 2021, 60, 1–15. [Google Scholar] [CrossRef]
- Sun, L.; Zhao, G.; Zheng, Y.; Wu, Z. Spectral–spatial feature tokenization transformer for hyperspectral image classification. IEEE Trans. Geosci. Remote Sens. 2022, 60, 1–14. [Google Scholar] [CrossRef]
- Arshad, T.; Zhang, J. Hierarchical Attention Transformer for Hyperspectral Image Classification. IEEE Geosci. Remote Sens. Lett. 2024, 21, 1–5. [Google Scholar] [CrossRef]
- Pourdarbani, R.; Sabzi, S.; Nadimi, M.; Paliwal, J. Interpretation of Hyperspectral Images Using Integrated Gradients to Detect Bruising in Lemons. Horticulturae 2023, 9, 750. [Google Scholar] [CrossRef]
- Ferreira, H.; Marta, A.; Machado, J.; Couto, I.; Marques, J.P.; Beirão, J.M.; Cunha, A. Retinitis Pigmentosa Classification with Deep Learning and Integrated Gradients Analysis. Appl. Sci. 2025, 15, 2181. [Google Scholar] [CrossRef]
- Arefi, A.; Sturm, B.; Hoffmann, T. Explainability of deep convolutional neural networks when it comes to NIR spectral data: A case study of starch content estimation in potato tubers. Food Control 2024, 169, 110979. [Google Scholar] [CrossRef]
- Yang, H.; Ming, B.; Nie, C.; Xue, B.; Xin, J.; Lu, X.; Xue, J.; Hou, P.; Xie, R.; Wang, K.; et al. Maize Canopy and Leaf Chlorophyll Content Assessment from Leaf Spectral Reflectance: Estimation and Uncertainty Analysis across Growth Stages and Vertical Distribution. Remote Sens. 2022, 14, 2115. [Google Scholar] [CrossRef]
- Ustin, S.; Jacquemoud, S. How the Optical Properties of Leaves Modify the Absorption and Scattering of Energy and Enhance Leaf Functionality; Springer: Cham, Switzerland, 2020. [Google Scholar] [CrossRef]
- Ali, A.; Imran, M. Evaluating the potential of red edge position (REP) of hyperspectral remote sensing data for real time estimation of LAI & chlorophyll content of kinnow mandarin (Citrus reticulata) fruit orchards. Sci. Hortic. 2020, 267, 109326. [Google Scholar] [CrossRef]
- Ozaki, Y.; Morita, S.; Morisawa, Y. Spectral Analysis in the NIR Spectroscopy; Springer: Singapore, 2020. [Google Scholar] [CrossRef]
- Song, G.; Wang, Q. Developing Hyperspectral Indices for Assessing Seasonal Variations in the Ratio of Chlorophyll to Carotenoid in Deciduous Forests. Remote Sens. 2022, 14, 1324. [Google Scholar] [CrossRef]
- Li, N.; Huo, L.N.; Zhang, X.L. Using only the red-edge bands is sufficient to detect tree stress: A case study on the early detection of PWD using hyperspectral drone images. Comput. Electron. Agric. 2024, 217, 108665. [Google Scholar] [CrossRef]
- Zhang, A.; Hu, Z.; Hu, X.; Zhao, T.; Wang, Y.; Li, Y.; Wang, Y.; Peng, L.; Ren, X. Large-scale screening of diverse barely lignocelluloses for simultaneously upgrading biomass enzymatic saccharification and plant lodging resistance coupled with near-infrared spectroscopic assay. Ind. Crops Prod. 2023, 194, 116324. [Google Scholar] [CrossRef]
- Yu, Y.P.; Li, L.L.; Sheng, L.; Miao, M.N.; Jian, L.; Lu, D.Z.; Jian, F.M.; Zhi, C.C. Magnesium Deficiency Triggers SGR–Mediated Chlorophyll Degradation for Magnesium Remobilization. Plant Physiol. 2019, 181, 262–275. [Google Scholar] [CrossRef]
- Luo, Y.; Xie, D.; Qi, J.; Yan, G.; Mu, X. Simulating High-Resolution Sun-Induced Chlorophyll Fluorescence Image of Three-Dimensional Canopy Based on Photon Mapping. Remote Sens. 2024, 16, 3783. [Google Scholar] [CrossRef]
- Ge, Y.; Atefi, A.; Zhang, H.; Miao, C.; Ramamurthy, R.K.; Sigmon, B.; Yang, J.; Schnable, J.C. High-throughput analysis of leaf physiological and chemical traits with VIS-NIR-SWIR spectroscopy: A case study with a maize diversity panel. Plant Methods 2019, 15, 66. [Google Scholar] [CrossRef] [PubMed] [PubMed Central]
- Mubeen, M.; Ali, A.; Iftikhar, Y.; Shahbaz, M.; Ullah, M.I.; Ali, M.A.; Fatima, N.; Sathiya Seelan, J.S.; Tan, Y.S.; Algopishi, U.B. Innovative strategies for characterizing and managing huanglongbing in citrus. World J. Microbiol. Biotechnol. 2024, 40, 342. [Google Scholar] [CrossRef] [PubMed]
- Ye, X.; Gao, Z.; Xu, K.; Li, B.; Ren, T.; Li, X.; Cong, R.; Lu, Z.; Cakmak, I.; Lu, J. Photosynthetic plasticity aggravates the susceptibility of magnesium-deficient leaf to high light in rapeseed plants: The importance of Rubisco and mesophyll conductance. Plant J. 2024, 117, 483–497. [Google Scholar] [CrossRef] [PubMed]
- Jiang, T.; Chen, J.; Xu, K.; Sharon, B.; Li, L.; Guo, J.; Liu, L.; Ge, J.; Lin, H.; Tian, S.; et al. Citrus yellow vein clearing virus infection triggers phloem remobilization of iron- and zinc-nicotianamine in citrus. Plant Physiol. 2025, 197, kiae528. [Google Scholar] [CrossRef] [PubMed]
- Sun, C.; Zhou, J.; Ma, Y.; Xu, Y.; Pan, B.; Zhang, Z. A review of remote sensing for potato traits characterization in precision agriculture. Front. Plant Sci. 2022, 13, 871859. [Google Scholar] [CrossRef] [PubMed] [PubMed Central]
- Haider, M.W.; Sharma, A.; Majumdar, A.; Fayaz, F.; Bromand, F.; Rani, U.; Singh, V.K.; Saharan, M.S.; Tiwari, R.K.; Lal, M.K.; et al. Unveiling the phloem: A battleground for plant pathogens. Phytopathol. Res. 2024, 6, 65. [Google Scholar] [CrossRef]
- Lv, M.; Dai, Y.; Xie, L.; Guo, J.; Liao, Z.; Shang, W.; Zhao, X.; Hong, J.; Zhang, H. Volume electron microscopy reconstruction uncovers a physical barrier that limits virus to phloem. New Phytol. 2024, 241, 343–362. [Google Scholar] [CrossRef] [PubMed]
- Xu, K.; Ye, H. Light scattering in stacked mesophyll cells results in similarity characteristic of solar spectral reflectance and transmittance of natural leaves. Sci. Rep. 2023, 13, 4694. [Google Scholar] [CrossRef]
- Ou, Y.; Yan, J.; Liang, Z.; Zhang, B. Hyperspectral Imaging Combined with Deep Learning for the Early Detection of Strawberry Leaf Gray Mold Disease. Agronomy 2024, 14, 2694. [Google Scholar] [CrossRef]
- Min, H.J.; Qin, J.; Yadav, P.K.; Frederick, Q.; Burks, T.; Dewdney, M.; Baek, I.; Kim, M. Classification of Citrus Leaf Diseases Using Hyperspectral Reflectance and Fluorescence Imaging and Machine Learning Techniques. Horticulturae 2024, 10, 1124. [Google Scholar] [CrossRef]
- Yadav, P.K.; Burks, T.; Qin, J.; Kim, M.; Frederick, Q.; Dewdney, M.M.; Ritenour, M.A. Automated classification of citrus disease on fruits and leaves using convolutional neural network generated features from hyperspectral images and machine learning classifiers. J. Appl. Remote Sens. 2024, 18, 014512. [Google Scholar] [CrossRef]
- Frederick, Q.; Burks, T.; Watson, J.A.; Yadav, P.K.; Qin, J.; Kim, M.; Dewdney, M.M. Supervised Hyperspectral Band Selection Using Texture Features for Classification of Citrus Leaf Diseases with YOLOv8. Sensors 2025, 25, 1034. [Google Scholar] [CrossRef]
- Jung, D.; Kim, J.; Kim, H.; Lee, T.; Kim, H.; Park, S. A Hyperspectral Data 3D Convolutional Neural Network Classification Model for Diagnosis of Gray Mold Disease in Strawberry Leaves. Front. Plant Sci. 2022, 13, 837020. [Google Scholar] [CrossRef] [PubMed] [PubMed Central]
Disclaimer/Publisher’s Note: The statements, opinions and data contained in all publications are solely those of the individual author(s) and contributor(s) and not of MDPI and/or the editor(s). MDPI and/or the editor(s) disclaim responsibility for any injury to people or property resulting from any ideas, methods, instructions or products referred to in the content. |
© 2025 by the authors. Licensee MDPI, Basel, Switzerland. This article is an open access article distributed under the terms and conditions of the Creative Commons Attribution (CC BY) license (https://creativecommons.org/licenses/by/4.0/).