Abstract
Cake fertilizers are phosphorus-rich organic fertilizers that are commonly used in horticulture. Soil plays a crucial role in determining the effectiveness of phosphorus fertilizer. Comparative data on the relative phosphorus efficiency (rPE) of cake fertilizers across contrasting soils are scarce in the international literature. Information on the mechanisms that control phosphorus supply is also limited. This study examined the rPE of rapeseed and soybean cakes in three soils using ryegrass growth experiments and investigated the main factors affecting their phosphorus efficiency. The results showed that the rPE of rapeseed cake did not differ significantly among the three soils, with an average value of 71%. In contrast, the rPE of soybean cake showed a clear soil-dependent pattern, with the highest rPE in red soil (67%), followed by fluvo-aquic soil (47%), and the lowest in yellow-brown soil (32%). In red soil, there was no significant difference in rPE between the two cakes. Water-soluble phosphorus content of cake fertilizers and soil phosphatase activity are key factors affecting rPE. Owing to its low water-soluble phosphorus content, the phosphorus supplied by soybean cake is predominantly mobilized through soil phosphatase–mediated mineralization of organic phosphorus. In phosphorus fertilization practices, both cake water-soluble phosphorus content and soil phosphatase activity should be considered. In soils with low phosphatase activity, cake fertilizers with a higher water-soluble phosphorus content should be prioritized.
1. Introduction
Cake fertilizers are residues remaining after oil extraction from oilseed crops. They are commonly used as basal fertilizers for landscape greening and horticultural production. Cake fertilizers generally have a high phosphorus content (0.5–1.5%); however, their phosphorus inputs are often overlooked in practice. Recycling of phosphorus from organic materials to close the phosphorus cycle has received increasing attention and recognition in agronomic research [1,2,3].
Relative phosphorus fertilizer efficiency (rPE) is commonly used to evaluate the agronomic performance of recycled fertilizers relative to mineral phosphorus fertilizers. It is calculated from nutrient uptake during the vegetative growth phase of the plant [4,5]. Reported rPE values for recycled fertilizers range from 0% to 100%. Animal manures generally show moderate to high rPE (22–111%, median 77%), while sewage sludge rPE varies widely (0–103%) depending on treatment method [6,7]. Raw animal manure can exceed 100% rPE [8], whereas biochar-produced or iron-precipitated sludge has an rPE below 20%. Bone meal and compost have low rPE (<37%), whereas guano exhibits very high rPE (90–111%) [9]. However, studies on the relative phosphorus efficiency of cake fertilizers are largely lacking [6,10].
Different recycled phosphorus fertilizers vary in phosphorus forms and chemical properties; therefore, evaluating their fertilizer value is complex. Studies have shown that both inorganic and organic phosphorus in compost and sludge influence phosphorus efficiency [11]. Sludge treated by chemical precipitation usually has a low rPE because of its high Fe:P ratio, which can reduce soil phosphorus availability after application [12,13]. Fertilizer performance also depends on soil pH, texture, and other factors [14,15]. Water-extractable phosphorus content is an important indicator of the efficiency of recycled fertilizers [16]. However, studies on struvite, manures, and sludge have shown that water solubility does not always predict plant availability in soil [10]. For example, struvite has low water-soluble phosphorus but still achieves high rPE in both acidic and calcareous soils, approaching that of mineral fertilizers [17,18]. However, research on how soil type affects the relative phosphorus efficiency (rPE) of cake fertilizer is still limited.
Different recycled phosphorus fertilizers exhibit significant short-term differences in phosphorus efficiency. These differences are largely influenced by soil properties [4,19]. In cake fertilizers, phosphorus mostly occurs as organic P, whereas in compost and excreta, it is predominantly inorganic [20]. As organic residues, their inherent properties affect fertilizer efficiency. Soil microbial activity and phosphorus sorption reactions also play important roles [21]. Organic residue P release in soil typically occurs in two stages: an initial rapid release of labile P (mainly soluble P), followed by slower mineralization of more stable P pools [22,23]. By analogy, P in cake fertilizers can be expected to be released similarly. The labile fraction becomes quickly available to plants, while the stable fraction requires mineralization before plant uptake [10,21].
In this study, we evaluated the rPE of rapeseed and soybean cakes in yellow-brown, red, and fluvo-aquic soils using a pot experiment with ryegrass. The choice of these two cake fertilizers was based on their large-scale production and frequent application as organic fertilizers. We combined these results with a soil incubation trial to analyze the environmental factors that influence the rPE of cake fertilizer. The purpose of this study was to provide a basis for phosphorus management and soil fertilization.
2. Materials and Methods
2.1. Experimental Materials
The tested cakes were derived from rapeseed and soybean cakes, two widely used cake fertilizers with relatively high production. They were purchased from oil mills in Liupanshui, China (rapeseed cake, Guizhou Wantongxianghe Agricultural Products Technology Development Co., Ltd.), and Suqian, China (soybean cake, Shuyang Jinghua Oil Industry Co., Ltd.), and were in granular form (<2 mm). The basic chemical properties of these materials are listed in Table 1.

Table 1.
Nutrient composition and chemical properties of the cake fertilizers used in the experiment.
The three tested soils were collected from Wuhan, China: (1) yellow-brown soil (YS), located at Shizishan, Hongshan District (114°21′1″ E, 30°28′24″ N); (2) red soil (RS), located at Leijiawan, Jiangxia District (114°16′17″ E, 30°9′59″ N); and (3) fluvo-aquic soil (FS), located at Tianxinzhou, Hongshan District (114°24′12″ E, 30°40′7″ N). These three soils were chosen as they are representative of the major soil types in Wuhan. All sampling sites were dominated by a combination of camphor trees (Cinnamomum camphora) and Poaceae grasses. The area has a subtropical monsoon climate, with an annual mean temperature of 15.8–17.5 °C and annual precipitation ranging from 1150 to 1450 mm.
Surface litter was removed before sampling at each site. Composite soil samples were collected from the 0–20 cm horizon using a multi-point sampling method. The collected soils were air-dried, cleared of roots and gravel, passed through a 4 mm sieve, and thoroughly mixed before use. Basic physicochemical properties of the soils are presented in Table 2.

Table 2.
Characteristics of soil used in the experiment.
2.2. Experimental Design
2.2.1. Pot Experiment
The tested cakes were derived from rapeseed and soybean cakes, two widely used cake fertilizers with relatively high production. They were purchased from oil mills in Liupanshui, Guizhou, and Suqian, Jiangsu, and were in granular form (<2 mm). The basic chemical properties of these materials are listed in Table 1. The test plant was perennial ryegrass (Lolium perenne), which grows rapidly and produces a large biomass, making it suitable for phosphorus uptake experiments.
For each soil type, six treatments were established: no phosphorus application (CK), rapeseed cake (RC, 5 g/kg), soybean cake (SC, 5 g/kg), and potassium dihydrogen phosphate at three rates (30, 60, and 120 mg P/kg, abbreviated as P30, P60, and P120), each with three replicates. The application rate of the cake was based on common field usage (10 t/ha). To ensure an adequate supply of other nutrients, sufficient amounts of nitrogen, potassium, and micronutrients were applied to the soil. The fertilizers were thoroughly mixed with the soil and placed in plastic pots, each containing 3.5 kg of soil.
The experiment commenced in October 2023 and was conducted as a 7-month pot trial in a rain shelter. Approximately 50 seeds were sown per pot, and the plants were irrigated with deionized water throughout the growth period to ensure adequate moisture for plant development. Three harvests were performed during the growth period, with plants neatly clipped 2 cm above the soil surface using scissors. Due to slow initial growth, the first harvest occurred after 3 months, followed by two subsequent harvests at 2-month intervals. After each harvest, nitrogen, potassium, magnesium, and sulfur were added. After the third harvest, soil samples were collected from each pot by thoroughly mixing soil from top to bottom, air-dried, and ground through 2 mm and 0.15 mm sieves for subsequent analyses.
2.2.2. Decomposition of Cake Fertilizers
Cake fertilizers were loaded at 5 g/kg into nylon bags (mesh size < 0.15 mm) and placed together with 100 g of soil (<2 mm) into plastic cups. The bags were fully buried in the soil and incubated at 25 °C in an incubator, with soil moisture maintained at 60–70% of the field water-holding capacity. Each treatment was replicated three times. At 3, 7, 15, 30, and 60 days of incubation, nylon bags were retrieved, oven-dried to constant weight, and the mass loss was recorded.
2.2.3. Soil Incubation
Cake fertilizers were thoroughly mixed with 150 g of soil (<2 mm) at a rate of 5 g/kg and placed into 200 mL plastic cups. The cups were incubated at 25 °C, with soil moisture maintained at 60–70% of the field water holding capacity. Each treatment was replicated three times. Non-destructive sampling was performed at 14, 30, and 60 days of incubation. Soil samples were air-dried, thoroughly mixed, ground, and sieved through 2 mm and 0.15 mm sieves for subsequent analyses. Decomposition and incubation experiments were designed to elucidate the processes governing phosphorus (P) mobilization from cake fertilizers.
2.3. Measurement Items and Methods
2.3.1. Cake Fertilizers
The pH of the cake fertilizers was measured using a glass electrode (FiveEasy Plus FE2, Mettler-Toledo Instruments, Shanghai, China). Organic matter content was determined using potassium dichromate oxidation. After digestion with sulfuric acid and hydrogen peroxide, total nitrogen (TN) was quantified using the Kjeldahl method. Total potassium (K), iron (Fe), aluminum (Al), and calcium (Ca) contents were measured using ICP-OES (Agilent 5110, Agilent Technologies, Santa Clara, CA, USA). Total phosphorus (TP) was determined using the molybdenum blue colorimetric method with a UV-Vis spectrophotometer (UV-1500, Aoyi Instruments, Shanghai, China).
Phosphorus fractions in the cake fertilizers were analyzed using a modified Hedley sequential fractionation [24,25]. Extractions were performed in sequence with deionized water, 0.5 mol L−1 NaHCO3, 0.1 mol L−1 NaOH, and 1.0 mol L−1 HCl. Phosphorus in each extract was measured by the molybdenum blue method. Inorganic phosphorus (Pi) was taken as the sum of the water- and bicarbonate-extractable fractions, and organic phosphorus (Po) was calculated as TP minus total Pi.
2.3.2. Characters and P Fractions of Soils
Soil pH was measured using a glass electrode in a 1:2.5 soil-to-water suspension. Organic carbon content was determined using potassium dichromate oxidation. Total potassium (K) and total phosphorus (TP) were measured after digestion with sulfuric–perchloric acid: K by inductively coupled plasma optical emission spectrometry (ICP-OES, Agilent 5110), and P by the molybdenum blue colorimetric method. Total nitrogen (TN) was quantified using the semi-micro-Kjeldahl method. Soil texture was determined using the hydrometer method. Available P (Olsen-P) was extracted with 0.5 mol L−1 NaHCO3 (pH 8.5) and measured using the molybdenum blue method.
Soil phosphorus fractions were determined using a modified Hedley sequential fractionation procedure [24]. Sequential extractions were performed with anion-exchange resin (Resin-P), 0.5 mol L−1 NaHCO3 (NaHCO3-Pi and Po), 0.1 mol L−1 NaOH (NaOH-Pi and Po), and 1.0 mol L−1 HCl (HCl-Pi). Phosphorus in each extract was measured by the molybdenum blue colorimetric method. Organic phosphorus (Po) was calculated as the difference between total phosphorus (TP) and total inorganic phosphorus (sum of Pi fractions).
Soil ACP and ALP activities were determined using the p-nitrophenyl phosphate enzymatic hydrolysis method [26]. Fresh soil (<2 mm) was used for the assay. One gram of fresh soil was placed in each reaction tube. Soil was incubated with 4 mL of modified universal buffer (MUB) at the appropriate pH. Incubations were carried out at 37 °C for 1 h. Released p-nitrophenol was quantified using UV–Vis spectrophotometry.
2.3.3. Phosphorus Fertilizer Efficiency
After each harvest, ryegrass shoots were rinsed with deionized water, placed in paper bags, and dried at 65 °C to constant weight to determine dry biomass per pot. Dried shoots were ground and digested with concentrated H2SO4–H2O2, and phosphorus content in the shoot was measured using the molybdenum blue colorimetric method. Phosphorus uptake per pot was calculated by multiplying the shoot phosphorus content by dry biomass.
A quadratic function y = b2x2 + b1x + b0 (b2 ≠ 0) was used to fit the relationship between phosphorus (P) application rates of inorganic P treatments and ryegrass P uptake. Based on this fitted equation, the amount of P uptake corresponding to the P input from cake fertilizers was estimated. The relative phosphorus efficiency (rPE) of the cake fertilizers was calculated using Equation (3). rPE expresses the phosphorus efficiency of cake fertilizers relative to the reference inorganic fertilizer KH2PO4.
Net P uptake (NPU):
NPU = PU+P − PU0P
PU+P is ryegrass P uptake in a P-fertilized treatment, and PU0P is ryegrass P uptake in the unfertilized control.
Phosphorus use efficiency (PUE):
PUE (%) = (PU+P − PU0P)/PI × 100
PI is the total P applied. PU+P and PU0P are the same as above.
Relative phosphorus efficiency (rPE):
rPE (%) = (PUiP − PU0P)/(PUcP − PU0P) × 100
PUiP is ryegrass P uptake under the inorganic P treatment (KH2PO4). PUcP is ryegrass P uptake under the cake fertilizer treatment.
2.4. Data Processing and Statistical Analysis
Experimental data were processed using IBM SPSS Statistics 21.0. Graphs were generated using GraphPad Prism 9.5. Statistical analyses were performed using IBM SPSS Statistics 21.0. Multiple comparisons of treatment means were performed using Duncan’s new multiple range test at a significance level of p < 0.05.
3. Results
3.1. Effect of Cake Fertilizers on Ryegrass Phosphorus Uptake
Compared with the unfertilized control, rapeseed cake significantly increased total phosphorus uptake by ryegrass in all three soils (Table 3), by 364%, 89%, and 58% in yellow-brown, red, and fluvo-aquic soils, respectively. Soybean cake significantly increased total P uptake in red soil and fluvo-aquic soil by 49% and 20%, respectively. In yellow-brown soil, soybean cake did not significantly affect total P uptake. In all soils, rapeseed cake increased P uptake more than soybean cake did. In each soil type, P uptake under rapeseed cake did not differ significantly from that under 30 mg P kg−1 KH2PO4. Soybean cake, however, resulted in lower P uptake.

Table 3.
Phosphorus uptake by ryegrass in different fertilizer treatments (mg P/pot).
Ryegrass P uptake varied with harvest time, soil type, and cake fertilizer (Table 3). In all three soils, P uptake under rapeseed cake initially increased and then declined over the three harvests. This bell-shaped trend was similar to that observed under inorganic P fertilizer. This pattern may be due to the high water-soluble P content of rapeseed cake. In contrast, soybean cake treatments in red soil also followed a rise-fall pattern, but in yellow-brown and fluvo-aquic soils, P uptake increased steadily over successive harvests. Rapeseed and soybean cake treatments did not significantly differ in P uptake in red soil. However, in yellow-brown and fluvo-aquic soils, P uptake under soybean cake was significantly lower than that under rapeseed cake at the second harvest (p < 0.05).
3.2. Relative Phosphorus Efficiency and Phosphorus Use Efficiency
Relative phosphorus efficiency (rPE) and phosphorus use efficiency (PUE) of the cake fertilizers were significantly influenced by soil type, fertilizer type, and their interaction. The rPE of soybean cake followed the order: red soil (67%) > fluvo-aquic soil (47%) > yellow-brown soil (32%) (Figure 1). In contrast, the rPE of rapeseed cake did not differ significantly among the three soils, with a mean value of 71%. This indicates that, in terms of plant-available phosphorus, rapeseed cake supplies phosphorus equivalent to 71% of that from KH2PO4. In red soil, no significant difference was observed in rPE between rapeseed and soybean cakes. However, in yellow-brown and fluvo-aquic soils, the rPE of rapeseed cake was significantly higher than that of soybean cake (Figure 1). This difference suggests variations in the decomposition and plant utilization of phosphorus between the two cake fertilizers.
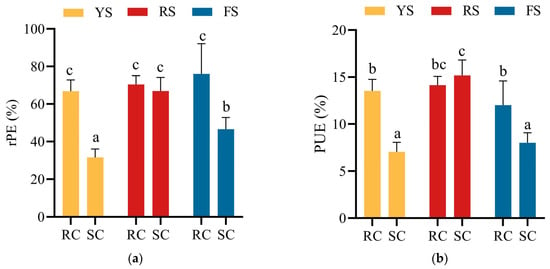
Figure 1.
(a) Relative phosphorus efficiency (rPE) of cake fertilizers in different soils; (b) phosphorus use efficiency (PUE) of cake fertilizers in different soils. Different letters indicate significant differences (p < 0.05) between treatments.
The pattern of phosphorus use efficiency (PUE) mirrored that of rPE. Rapeseed cake showed no significant difference in PUE among the three soils, with a mean value of 13.2%. In contrast, soybean cake PUE was significantly higher in red soil (15.2%) than in yellow-brown soil (7.0%) and fluvo-aquic soil (8.0%). In red soil, PUE did not differ between the two types of cakes. However, in yellow-brown and fluvo-aquic soils, the PUE of rapeseed cake was significantly higher than that of soybean cake (Figure 1).
Overall, rapeseed cake exhibited rPE and PUE values similar to those of soybean cake in red soil. In the other two soils, rapeseed cake outperformed soybean cake. This pattern indicates that rapeseed cake provides a more stable and efficient phosphorus release across soils.
Temporal variations in relative phosphate efficiency (rPE) and phosphorus use efficiency (PUE) of cake fertilizers differed by soil type and fertilizer (Figure 2 and Figure 3). In red soil, rPE and PUE of rapeseed and soybean cakes showed no significant differences across the three harvests. In yellow-brown and alluvial soils, rapeseed cake had significantly higher rPE and PUE than soybean cake during the initial two harvests (p < 0.05); however, the differences diminished by the third harvest. In red soil, both rPE and PUE of the cakes initially increased and then declined over time.
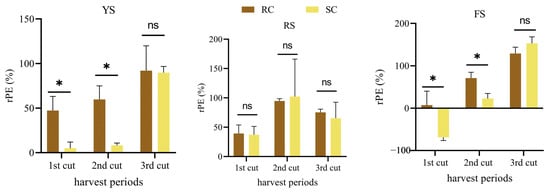
Figure 2.
Phosphorus fractions of the two cake fertilizers. Relative phosphorus efficiency (rPE) of cake fertilizer in different soils at different harvest periods. * represents a significant difference between treatments (p < 0.05), ns represents no significant difference (p > 0.05).
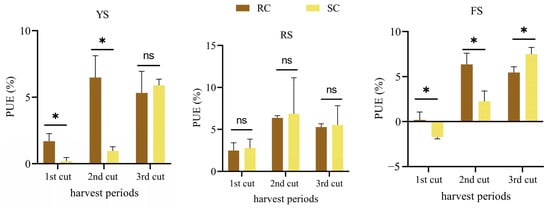
Figure 3.
Phosphorus use efficiency (PUE) of cake fertilizers in three soils at different harvest periods. * represents a significant difference between treatments (p < 0.05), ns represents no significant difference (p > 0.05).
3.3. Phosphorus Fractions and Decomposition Dynamics of Cake Fertilizers
The two cake fertilizers differed markedly in terms of their phosphorus fractions. Rapeseed cake contained and released more water-soluble phosphorus (32.4%) than soybean cake (14.6%). In both cakes, a large proportion of total P was in the organic form (Po), with soybean cake having a higher Po fraction (81.1%) than rapeseed cake (60.2%) (Figure 4). Soybean cake also showed a greater amount and proportion of Po in the NaHCO3− and NaOH-extractable fractions. This finding indicates that soybean cake harbors relatively larger and more stable P pools than rapeseed cakes.
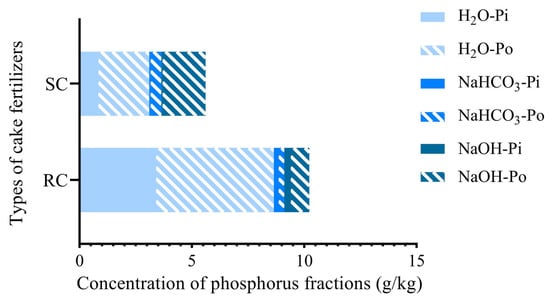
Figure 4.
Phosphorus fractions of the two cake fertilizers.
The weight-loss dynamics of the two cake fertilizers over 60 days in the three soils are shown in Figure 5. For each cake, neither the trend in mass loss nor the residual mass differed significantly among soils (p > 0.05). Rapeseed cake decomposed more slowly and retained a greater residual mass than did soybean cake. This finding indicates that differences in rPE are not closely linked to overall mass loss. This also suggests that decomposition dynamics do not mirror P uptake patterns. By day 60, soybean cake had lost approximately 80% of its initial weight, whereas rapeseed cake had lost about 60%. In both cakes, the rate of weight loss markedly slowed after 15 days.
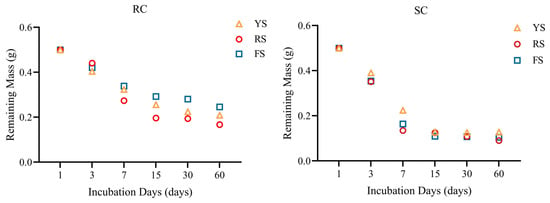
Figure 5.
Weight variation of rapeseed and soybean cakes decomposition in different soils.
For soil incubation, both cake fertilizers significantly increased Olsen-P levels in all three soils (Figure 6). Compared to the control, rapeseed cake resulted in a greater increase in soil Olsen-P than soybean cake. Over time, Olsen-P in the rapeseed cake treatments first increased and then decreased. In contrast, the temporal pattern of Olsen-P under soybean cake depended on soil type: it increased and then decreased in yellow-brown soil, declined steadily in red soil, and increased gradually in fluvo-aquic soil. These dynamics partly mirror plant P uptake trends and indicate that soil available P is governed by the balance between P release from the cakes and soil P-fixation.

Figure 6.
Weight variation of rapeseed and soybean cakes decomposition in different soils. Changes in soil Olsen-P content over time under different treatments. Different letters in the same column represent significant differences (p < 0.05) between different periods, and L to R represents left to right.
3.4. Correlation Between Soil Phosphatase Activity and rPE
Application of cake fertilizers significantly increased soil phosphatase activity (Figure 7). Activity differed among soils: acid phosphatase dominated in yellow-brown and red soils, while alkaline phosphatase dominated in fluvo-aquic soil. Compared to the control, rapeseed cake increased total phosphatase activity by 35.2 μg/(g·h) (27%) in yellow-brown soil and by 23.7 μg/(g·h) (12%) in fluvo-aquic soil, but had no significant effect on red soil. Soybean cake increased phosphatase activity by 22.4, 45.0, and 24.3 μg/(g·h) in yellow-brown, red, and fluvo-aquic soils, respectively, corresponding to relative increases of 17%, 16%, and 12%.
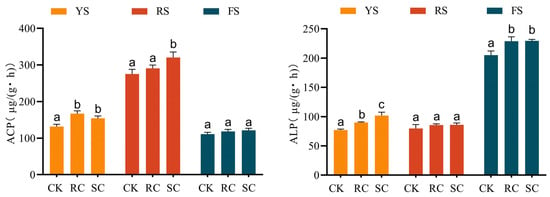
Figure 7.
Soil acid phosphatase (ACP) and alkaline phosphatase (ALP) activities in different treatments. Different letters indicate significant differences (p < 0.05) between treatments.
Across the three soils, phosphatase activity under cake treatments followed the order: red soil > fluvo-aquic soil > yellow-brown soil. This ranking mirrors the pattern observed for soybean cake rPE in the same soils (Figure 1 and Figure 8). Correlation analysis (Figure 8) revealed a highly significant positive correlation between soybean cake rPE and soil phosphatase activity (p < 0.01), indicating that phosphatase activity is a key factor for P mineralization and availability from soybean cake compost. In contrast, rPE from rapeseed cake showed no significant correlation with phosphatase activity (p > 0.10). This difference likely reflects P fractionation. Soybean cake contains more stable P pools that require enzymatic mineralization. In contrast, rapeseed cake has a higher proportion of water-soluble P that is less dependent on soil phosphatase.
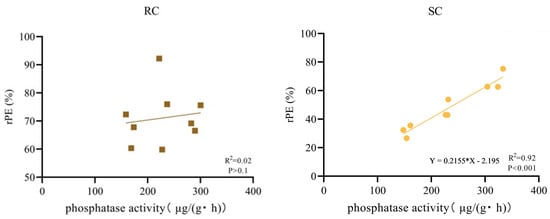
Figure 8.
Correlation between soil phosphatase activity and relative phosphorus efficiency (rPE) of cake fertilizer.
3.5. Effect of Cake Fertilizer Application on Soil Phosphorus Fractions
Application of cake fertilizers increased the contents of Resin-P, NaHCO3-Pi, NaOH-Pi, and NaOH-Po in all three soils (Table 4), with different extents among soils. In yellow-brown soil, rapeseed cake increased Resin-P, NaHCO3-Pi, and NaOH-Pi by 4.6, 5.2, and 16.0 mg kg−1, respectively; soybean cake increased these by 1.2, 2.1, and 25.2 mg kg−1. Rapeseed cake thus produced higher active P fractions than soybean cake, likely due to its higher water-soluble P content. In red soil, rapeseed cake increased Resin-P, NaOH-Pi, and NaOH-Po by 2.1, 26.7, and 60.8 mg kg−1, while soybean cake increased them by 1.6, 31.0, and 43.3 mg kg−1. Rapeseed cake also resulted in significantly higher NaHCO3-Pi than soybean cake, while Resin-P did not differ. In fluvo-aquic soil, rapeseed cake increased Resin-P, NaHCO3-Pi, and NaOH-Po by 10.6, 7.7, and 3.0 mg kg−1; soybean cake increased them by 15.7, 5.4, and 3.5 mg kg−1. Rapeseed cake produced higher NaHCO3-Pi and NaOH-Pi, whereas soybean cake produced higher Resin-P, consistent with the late-stage increase in P uptake under soybean cake in this soil.

Table 4.
Contents and proportions of soil phosphorus fractions in different treatments.
4. Discussion
Cake fertilizer application can improve crop yield, appearance, and nutritional quality [8]. Our findings suggest that both rapeseed and soybean cakes may serve as alternatives to inorganic P fertilizers. Rapeseed cake resulted in greater increases in P uptake and shoot dry mass than soybean cake, likely due to its higher total P input. This finding is consistent with previous studies showing that plant P uptake increases with greater organic P input [27].
rPE values between 40% and 80% represent a medium level [22]; rapeseed cake fell within this range in all three soils, while soybean cake ranged from low to medium. The rPE of cake fertilizers is comparable to that of animal manures and biosolids [28] and exceeds that of many iron- or aluminum-treated sludges [29,30], likely because cake fertilizers contain more water-soluble P. However, variations in cake type, soil properties, incubation time, and plant species can all affect rPE measurements [6].
Both fertilizer, soil properties, and their interaction controlled cake rPE. In sludge, the Fe:Al:P ratio is a key negative factor for rPE [15,31]. Although rapeseed cake has a higher (Fe + Al): P ratio (0.061) than soybean cake (0.044), it still achieved higher rPE. This outcome likely reflects that cake fertilizers have much lower (Fe + Al): P ratios overall than sludges (0.08–2.69) [13] and that cake fertilizers are dominated by organic P, whereas sludges are dominated by inorganic P [32].
This study provides evidence that soil phosphatase activity and cake fertilizer water-soluble P jointly influence P availability, offering insights into the biochemical mechanisms underlying the efficiency of recycled fertilizers. Water-soluble P drove the initial release of P, while enzyme-mediated mineralization governed later P availability. This finding is consistent with previous studies that identified water-extractable P as a critical predictor of recycled fertilizer efficiency [6]. Organic residue P release typically occurs in two stages: a rapid release of labile P and slower mineralization of stable P pools [22,23]. Consequently, a highly water-soluble P cake (rapeseed cake) can supply P throughout plant growth, whereas a low water-soluble P cake (soybean cake) relies on organic P mineralization, a process that strongly depends on soil phosphatase activity. The significant correlation between soybean cake rPE and phosphatase activity (Figure 8) confirms this mechanism. When phosphatase activity is high, cake water-soluble P content no longer limits rPE (Figure 1). Future experiments could inhibit soil phosphatase activity to further test this relationship. Few studies have directly assessed the role of soil phosphatase in fertilizer P use; our results help fill this gap by linking rPE of recycled fertilizers to the underlying biochemical processes.
Although soybean cake exhibited similar mass loss patterns across soils, its P efficiency varied markedly. Decomposition rates did not sync with P release, indicating that P availability is not simply a function of residue breakdown. This decoupling supports carbon–P mineralization separation models [33,34]. Other studies have shown that microbial access to residue carbon can drive concurrent P mineralization [35].
Application of cake fertilizers significantly increased soil labile inorganic P fractions (Resin-P and NaHCO3-Pi) and available P (Table 4), consistent with reports on organic residue amendments [36,37]. Available P first increased and then decreased over time, indicating that soil P availability is governed by both P release from the cakes and subsequent adsorption and fixation in the soil matrix [38,39]. Rapeseed cake produced larger increases in labile P fractions than soybean cake, likely owing to its higher water-soluble P content—an effect also observed for organic residues with differing P contents [40,41]. Among the soils, the greatest increase in Resin-P occurred in the fluvo-aquic soil, which may reflect its lower P-adsorption capacity, as soils with weaker adsorption show more pronounced increases in labile P [42].
Cake fertilizer amendments also markedly enhanced soil phosphatase activity, demonstrating their capacity to stimulate organic P mineralization and improve P availability [43,44]. The carbon and nitrogen inputs from the cake likely promoted microbial growth and extracellular phosphatase production. In particular, microbial communities harboring phoC and phoD genes can drive phosphatase activity and accelerate soil P cycling [45,46], thereby further increasing P availability [47].
5. Conclusions
This study shows that rapeseed and soybean cakes effectively enhance phosphorus uptake and dry matter accumulation in ryegrass while improving soil phosphorus availability. Rapeseed cake consistently exhibited a higher phosphorus supply and faster fertilizer efficiency across all soils. Soybean cake released phosphorus more slowly, and its effect varied strongly with soil type. Phosphorus efficiency was primarily governed by water-soluble phosphorus and soil phosphatase activity, indicating soil-specific utilization patterns. In practice, rapeseed cake is more suitable for yellow, brown, and fluvo-aquic soils with low phosphorus availability, whereas soybean cake shows potential in red soil with high phosphatase activity. These findings provide theoretical support for the efficient use of phosphorus resources in recycled fertilizers.
Author Contributions
Conceptualization, H.H. and Y.L.; methodology, P.W.; software, Y.L.; validation, H.H. and Y.L.; formal analysis, H.H. and Y.L.; investigation, J.Z., H.H. and Y.L.; resources, Q.F., H.H. and P.W.; data curation, Q.F., H.H. and Y.L.; writing—original draft preparation, Y.L.; writing—review and editing, P.W., J.Z., H.H. and Y.L.; visualization, H.H. and Y.L.; supervision, H.H.; project administration, H.H.; funding acquisition, H.H. All authors have read and agreed to the published version of the manuscript.
Funding
This research was funded by the Wuhan Institute of Landscape Architecture.
Data Availability Statement
The original contributions presented in this study are included in this article. Further inquiries should be directed to the corresponding author.
Acknowledgments
This research was financially supported by the Wuhan Institute of Landscape Architecture.
Conflicts of Interest
The authors declare no conflicts of interest.
References
- Kahiluoto, H.; Kuisma, M.; Kuokkanen, A.; Mikkilä, M.; Linnanen, L. Local and social facets of planetary boundaries: Right to nutrients. Environ. Res. Lett. 2015, 10, 104013. [Google Scholar] [CrossRef]
- Mayer, N.; Kaltschmitt, M. Closing the phosphorus cycle: Current P balance and future prospects in Germany. J. Clean. Prod. 2022, 347, 12. [Google Scholar] [CrossRef]
- Sica, P.; Sitzmann, T.J.; Mueller-Stoever, D.; Magid, J. Strategic placement of mineral and biobased fertilizers for optimizing phosphorus use efficiency: A comprehensive review. Soil Use Manag. 2025, 41, 25. [Google Scholar] [CrossRef]
- Brod, E.; Ogaard, A.F.; Haraldsen, T.K.; Krogstad, T. Waste products as alternative phosphorus fertilisers part II: Predicting P fertilisation effects by chemical extraction. Nutr. Cycl. Agroecosystems 2015, 103, 187–199. [Google Scholar] [CrossRef]
- Kratz, S.; Bloem, E.; Papendorf, J.; Schick, J.; Schnug, E.; Harborth, P. Agronomic efficiency and heavy metal contamination of phosphorus (P) recycling products from old sewage sludge ash landfills. J. Für Kult. 2017, 69, 373–385. [Google Scholar] [CrossRef]
- Kratz, S.; Vogel, C.; Adam, C. Agronomic performance of P recycling fertilizers and methods to predict it: A review. Nutr. Cycl. Agroecosysystem 2019, 115, 1–39. [Google Scholar] [CrossRef]
- Steckenmesser, D.; Vogel, C.; Herzel, H.; Felix, R.; Adam, C.; Steffens, D. Thermal treatment of sewage sludge for phosphorus fertilizer production: A model experiment. J. Plant Nutr. 2022, 45, 1123–1133. [Google Scholar] [CrossRef]
- Zhou, T.; Chen, L.; Wang, W.; Xu, Y.; Zhang, W.; Zhang, H.; Liu, L.; Wang, Z.; Gu, J.; Yang, J. Effects of application of rapeseed cake as organic fertilizer on rice quality at high yield level. J. Sci. Food Agric. 2022, 102, 1832–1841. [Google Scholar] [CrossRef]
- Christiansen, N.H.; Sorensen, P.; Labouriau, R.; Christensen, B.T.; Rubaek, G.H. Characterizing phosphorus availability in waste products by chemical extractions and plant uptake. J. Plant Nutr. Soil Sci. 2020, 183, 745. [Google Scholar] [CrossRef]
- Moeller, K.; Oberson, A.; Bunemann, E.K.; Cooper, J.; Friedel, J.K.; Glaesner, N.; Hoertenhuber, S.; Loes, A.; Mader, P.; Meyer, G.; et al. Improved phosphorus recycling in organic farming: Navigating between constraints. Adv. Agron. 2018, 147, 159–237. [Google Scholar] [CrossRef]
- Toor, G.S.; Hunger, S.; Peak, J.D.; Sims, J.T.; Sparks, D.L. Advances in the characterization of phosphorus in organic wastes: Environmental and agronomic applications. In Advances in Agronomy; Academic Press: Cambridge, MA, USA, 2006; Volume 89, pp. 1–72. [Google Scholar]
- Øgaard, A.F.; Brod, E. Efficient Phosphorus cycling in food production: Predicting the phosphorus fertilization effect of sludge from chemical wastewater treatment. J. Agr. Food Chem. 2016, 64, 4821–4829. [Google Scholar] [CrossRef]
- Ylivainio, K.; Lehti, A.; Jermakka, J.; Wikberg, H.; Turtola, E. Predicting relative agronomic efficiency of phosphorus-rich organic residues. Sci. Total Environ. 2021, 773, 9. [Google Scholar] [CrossRef]
- Hauck, D.; Lohr, D.; Meinken, E.; Schmidhalter, U. Phosphorus Availability from german sewage sludge ashes to plants cultivated in soilless growing media of contrasting pH. Agronomy 2022, 12, 2610. [Google Scholar] [CrossRef]
- Lemming, C.; Nielsen, M.T.S.; Jensen, L.S.; Scheutz, C.; Magid, J. Phosphorus availability of sewage sludges and ashes in soils of contrasting pH. J. Plant Nutr. Soil Sci. 2020, 183, 682–694. [Google Scholar] [CrossRef]
- Kratz, S.; Schick, J.; Øgaard, A.F. Phosphorus in Agriculture: 100% Zero; Springer: Dordrecht, Netherlands, 2016; p. 353. [Google Scholar]
- Achat, D.L.; Daumer, M.; Sperandio, M.; Santellani, A.; Morel, C. Solubility and mobility of phosphorus recycled from dairy effluents and pig manures in incubated soils with different characteristics. Nutr. Cycl. Agroecosystems 2014, 99, 1–15. [Google Scholar] [CrossRef]
- Bonvin, C.; Etter, B.; Udert, K.M.; Frossard, E.; Nanzer, S.; Tamburini, F.; Oberson, A. Plant uptake of phosphorus and nitrogen recycled from synthetic source-separated urine. Ambio 2015, 44, S217–S227. [Google Scholar] [CrossRef]
- Wollmann, I.; Gauro, A.; Mueller, T.; Moeller, K. Phosphorus bioavailability of sewage sludge-based recycled fertilizers. J. Plant Nutr. Soil Sci. 2018, 181, 158–166. [Google Scholar] [CrossRef]
- Frossard, E.; Skrabal, P.; Sinaj, S.; Bangerter, F.; Traore, O. Forms and exchangeability of inorganic phosphate in composted solid organic wastes. Nutr. Cycl. Agroecosystems 2002, 62, 103–113. [Google Scholar] [CrossRef]
- Damon, P.M.; Bowden, B.; Rose, T.; Rengel, Z. Crop residue contributions to phosphorus pools in agricultural soils: A review. Soil Biol. Biochem. 2014, 74, 127–137. [Google Scholar] [CrossRef]
- Kwabiah, A.B.; Stoskopf, N.C.; Palm, C.A.; Voroney, R.P. Soil P availability as affected by the chemical composition of plant materials: Implications for P-limiting agriculture in tropical Africa. Agric. Ecosyst. Environ. 2003, 100, 53–61. [Google Scholar] [CrossRef]
- Umrit, G.; Friesen, D.K. The effect of c-p ratio of plant residues added to soils of contrasting phosphate sorption capacities on p uptake by panicum-maximum (jacq). Plant Soil 1994, 158, 275–285. [Google Scholar] [CrossRef]
- Hedley, M.J.; Stewart, J.; Chauhan, B.S. Changes in inorganic and organic soil-phosphorus fractions induced by cultivation practices and by laboratory incubations. Soil Sci. Soc. Am. J. 1982, 46, 970–976. [Google Scholar] [CrossRef]
- Sharpley, A.; Moyer, B. Phosphorus forms in manure and compost and their release during simulated rainfall. J. Environ. Qual. 2000, 29, 1462–1469. [Google Scholar] [CrossRef]
- Tbatabai, M.A.; Bremner, J.M. Use of p-nitrophenyl phosphate for assay of soil phosphatase activity. Soil Biol. Biochem. 1969, 1, 301–307. [Google Scholar] [CrossRef]
- Rose, T.J.; Schefe, C.; Weng, Z.H.; Rose, M.T.; van Zwieten, L.; Liu, L.; Rose, A.L. Phosphorus speciation and bioavailability in diverse biochars. Plant Soil 2019, 443, 233–244. [Google Scholar] [CrossRef]
- Vaneeckhaute, C.; Janda, J.; Vanrolleghem, P.A.; Tack, F.M.G.; Meers, E. Phosphorus use efficiency of bio-based fertilizers: Bioavailability and fractionation. Pedosphere 2016, 26, 310–325. [Google Scholar] [CrossRef]
- Bogdan, A.; Aguilar, A.A.R.; Nys, O.; Michels, E.; Meers, E. Phosphorus availability in recycled fertilizers: Comparison of 11 chemical extraction methods with plant uptake during a 7-month growth experiment. J. Soil Sci. Plant Nutr. 2023, 23, 693–705. [Google Scholar] [CrossRef]
- Vogel, T.; Nelles, M.; Eichler-Loebermann, B. Phosphorus application with recycled products from municipal waste water to different crop species. Ecol. Eng. 2015, 83, 466–475. [Google Scholar] [CrossRef]
- Kahiluoto, H.; Kuisma, M.; Ketoja, E.; Salo, T.; Heikkinen, J. Phosphorus in manure and sewage sludge more recyclable than in soluble inorganic fertilizer. Environ. Sci. Technol. 2015, 49, 2115–2122. [Google Scholar] [CrossRef]
- Yu, B.; Luo, J.; Xie, H.; Yang, H.; Chen, S.; Liu, J.; Zhang, R.; Li, Y. Species, fractions, and characterization of phosphorus in sewage sludge: A critical review from the perspective of recovery. Sci. Total Environ. 2021, 786, 12. [Google Scholar] [CrossRef]
- Baggie, I.; Rowell, D.L.; Robinson, J.S.; Warren, G.P. Decomposition and phosphorus release from organic residues as affected by residue quality and added inorganic phosphorus. Agrofor. Syst. 2005, 63, 125–131. [Google Scholar] [CrossRef]
- Jalali, M.; Ranjbar, F. Rates of decomposition and phosphorus release from organic residues related to residue composition. J. Plant Nutr. Soil Sci. 2009, 172, 353–359. [Google Scholar] [CrossRef]
- Spohn, M.; Kuzyakov, Y. Phosphorus mineralization can be driven by microbial need for carbon. Soil Biol. Biochem. 2013, 61, 69–75. [Google Scholar] [CrossRef]
- Malik, M.A.; Marschner, P.; Khan, K.S. Addition of organic and inorganic P sources to soil—Effects on P pools and microorganisms. Soil Biol. Biochem. 2012, 49, 106–113. [Google Scholar] [CrossRef]
- Pu, J.; Jiang, N.; Zhang, Y.; Guo, L.; Huang, W.; Chen, L. Effects of various straw incorporation strategies on soil phosphorus fractions and transformations. Gcb Bioenergy 2023, 15, 88–98. [Google Scholar] [CrossRef]
- Alamgir, M.; McNeill, A.; Tang, C.; Marschner, P. Changes in soil P pools during legume residue decomposition. Soil Biol. Biochem. 2012, 49, 70–77. [Google Scholar] [CrossRef]
- Islam, M.; Siddique, K.H.M.; Padhye, L.P.; Pang, J.; Solaiman, Z.M.; Hou, D.; Srinivasarao, C.; Zhang, T.; Chandana, P.; Venu, N.; et al. Chapter Four—A critical review of soil phosphorus dynamics and biogeochemical processes for unlocking soil phosphorus reserves. In Advances in Agronomy; Sparks, D.L., Ed.; Academic Press: Cambridge, MA, USA, 2024; Volume 185, pp. 153–249. [Google Scholar]
- Alamgir, M.; Marschner, P. Changes in phosphorus pools in three soils upon addition of legume residues differing in carbon/phosphorus ratio. Soil Res. 2013, 51, 484–493. [Google Scholar] [CrossRef]
- Erinle, K.O.; Doolette, A.; Marschner, P. Changes in phosphorus pools in the detritusphere induced by removal of P or switch of residues with low and high C/P ratio. Biol. Fert. Soils 2020, 56, 1–10. [Google Scholar] [CrossRef]
- Iyamuremye, F.; Dick, R.P.; Baham, J.E. Organic amendments and phosphorus dynamics: II. Distribution of soil phosphorus fractions. Soil Sci. 1996, 161, 436–443. [Google Scholar] [CrossRef]
- Guo, L.; Wang, C.; Feng, T.Y.; Shen, R.F. Short-term application of organic fertilization impacts phosphatase activity and phosphorus-mineralizing bacterial communities of bulk and rhizosphere soils of maize in acidic soil. Plant Soil 2023, 484, 95–113. [Google Scholar] [CrossRef]
- Wu, W.; Zhang, Y.; Turner, B.L.; He, Y.; Chen, X.; Che, R.; Cui, X.; Liu, X.; Jiang, L.; Zhu, J. Organic amendments promote soil phosphorus related functional genes and microbial phosphorus cycling. Geoderma 2025, 456, 117247. [Google Scholar] [CrossRef]
- Wang, L.; Wang, J.; Yuan, J.; Tang, Z.; Wang, J.; Zhang, Y. Long-term organic fertilization strengthens the soil phosphorus cycle and phosphorus availability by regulating the pqqc—and phod-harboring bacterial communities. Microb. Ecol. 2023, 86, 2716–2732. [Google Scholar] [CrossRef] [PubMed]
- Zheng, M.M.; Wang, C.; Li, W.X.; Guo, L.; Cai, Z.J.; Wang, B.R.; Chen, J.; Shen, R.F. Changes of acid and alkaline phosphatase activities in long-term chemical fertilization are driven by the similar soil properties and associated microbial community composition in acidic soil. Eur. J. Soil Biol. 2021, 104, 11. [Google Scholar] [CrossRef]
- Luo, G.; Sun, B.; Li, L.; Li, M.; Liu, M.; Zhu, Y.; Guo, S.; Ling, N.; Shen, Q. Understanding how long-term organic amendments increase soil phosphatase activities: Insight into phoD—and phoC -harboring functional microbial populations. Soil Biol. Biochem. 2019, 139, 10. [Google Scholar] [CrossRef]
Disclaimer/Publisher’s Note: The statements, opinions and data contained in all publications are solely those of the individual author(s) and contributor(s) and not of MDPI and/or the editor(s). MDPI and/or the editor(s) disclaim responsibility for any injury to people or property resulting from any ideas, methods, instructions or products referred to in the content. |
© 2025 by the authors. Licensee MDPI, Basel, Switzerland. This article is an open access article distributed under the terms and conditions of the Creative Commons Attribution (CC BY) license (https://creativecommons.org/licenses/by/4.0/).