Article

Analysis and Optimization of Seeding Depth Control Parameters for Wide-Row Uniform Seeding Machines for Wheat

1
College of Mechanical and Electrical Engineering, Xinjiang Agricultural University, Urumqi 830052, China
2
Xinjiang Key Laboratory of Intelligent Agricultural Equipment, Urumqi 830052, China
3
The State Key Laboratory of Soil Plant and Machine System Technology, China Academy of Agricultural Mechanization Sciences Group Co., Ltd., Beijing 100083, China
*
Author to whom correspondence should be addressed.
Agriculture 2025, 15(17), 1800; https://doi.org/10.3390/agriculture15171800
Submission received: 25 July 2025 / Revised: 19 August 2025 / Accepted: 20 August 2025 / Published: 22 August 2025
(This article belongs to the Section Agricultural Technology)

Abstract

Seeding depth is a critical factor influencing the uniformity and vigor of wheat seedlings. To address inconsistent seeding depth in wide-row uniform seeding agricultural practices, we performed parameter analysis and optimization experiments on the seeding depth device of a wheat wide-row uniform seeding machine. The structure and working principle of the device were described, soil movement during operation was analyzed, and the models of rotary tiller blades and soil retention plates were investigated, identifying three key factors affecting seeding quality. Using the discrete element method, a model of the seeding depth device was established, and experiments were conducted, yielding the following conclusions: 1. Single-factor experiments were conducted under different seeding rate conditions, and it was found that the effects of various factors on the two indicators, namely the seeding depth qualification rate and the coefficient of variation for seeding uniformity, were regular. 2. A quadratic orthogonal rotated combination experiment with three factors determined the optimal structural parameters: tillage device penetration depth of 120 mm, rotational speed of 310 rpm, and soil retention plate inclination angle of 27°. Under these parameters, the seed depth qualification rate exceeded 90%, and the coefficient of variation for seed distribution uniformity was below 25%. 3. Field validation tests under optimal parameters confirmed a seed depth qualification rate ≥90% and variation for seed distribution uniformity was below ≤20.69%. 4. The error between simulation and field tests was ≤5%, validating the reliability of the discrete element method-based optimization for the seeding depth device.

1. Introduction

China’s annual wheat planting area and production account for approximately 22% of grain crops, establishing it as the world’s largest wheat producer and consumer [1,2]. According to 2023 data from the National Bureau of Statistics, China’s wheat planting area reached 23.6 million hectares with a total output of 136.59 million tons, representing a 0.82% increase in area but a 0.46% decrease in output compared with 2022 [3,4]. Ensuring continuous, efficient, and stable production is crucial for safeguarding China’s food security [5]. Sowing constitutes a critical agricultural production phase, where quality directly influences crop germination, population structure, and ultimate yield. The implantation of scientifically standardized sowing practices can substantially enhance grain production.
As a novel method of wheat cultivation, wide-row uniform sowing technology facilitates stronger seedling production compared with row sowing technology [6] and enhances production efficiency [7,8,9], consequently increasing yield. Therefore, research on wide-row uniform sowing technology holds significant importance. Currently, wide-row uniform seeding technology is extensively applied in wheat cultivation but remains under development for other crops. Wide-row uniform seeding leads to uneven soil coverage and poor seedbed flatness due to the extensive width of the equipment, thereby compromising the consistency and stability of seeding depth [10]. Traditional drill furrow openers may experience soil clogging due to improper soil-entry angle adjustment or excessive descent speed. This issue can be mitigated by adjusting soil moisture content, modifying the soil-entry angle, and optimizing the furrow opener structure [11]. Conventional wide-width rotary tiller seeders often encounter fertilizer tube blockage caused by overly dense or irrational rear-mounted tube arrangements. This results in ejected soil accumulating before the fertilizer tubes, preventing complete seedbed coverage and compromising seeding depth consistency and stability. Rearranging or relocating the fertilizer tubes can minimize or eliminate such blockages to improve seeding quality [12]. Similarly, improper tillage depth or rotational speed that is excessive, insufficient, or otherwise inappropriate for the rotary tillage device affects soil-throwing volume, thereby impacting seeding depth uniformity and stability. Adjusting tillage depth and rotational speed can optimize seeding performance [12]. Currently, wide-row uniform seeding predominantly utilizes rear-mounted fertilizer tube-type wheat rotary tillage and seeding combination machines. These machines initially employ a tractor to conduct rotary tillage operations to improve seedbed conditions, followed sequentially by fertilization, seeding, drip irrigation tape laying, and rolling. Fertilizer is dispersed via the fertilizer tube in the seeding area, while seeds are uniformly distributed by the seed distribution device in the designated zone [13,14]. To ensure wheat seeds are sown at an optimal depth for growth in level soil conditions, thereby establishing an ideal growing environment, researchers globally have conducted extensive research. Luo Jiaming et al. [15] designed a double-rotary tillage wheat wide-row seeder. The performance of the seeder was verified through discrete element testing, bench testing, and field trials. The coefficient of variation for sowing uniformity was less than 45%, which meets national standards, and the consistency of seed sowing depth was more than 85%. Liu Chenqing et al. [16] conducted research based on the agronomic practice principle of uniform wheat sowing. They designed a rotary tillage soil covering device that utilizes the soil throwing characteristics of rotary tillage to achieve efficient soil coverage and ensure a high qualification rate for uniform wheat sowing depth. However, during the operation of the machine, the soil covering roller is prone to changing the soil movement trajectory, thereby disrupting the distribution of seeds. Therefore, the uniformity of sowing needs to be further improved. Xue Bing et al. [17] employed a pre-sowing roller to continuously adjust the soil covering amount during rotary tillage, thereby maintaining high consistency in sowing depth. Although the aforementioned cases demonstrated favorable outcomes, the rear fertilizer pipe accumulates soil and creates fertilizer grooves during operation, hindering further reduction in the coefficient of variation for sowing uniformity and depth consistency.
This study placed the fertilizer hopper at the front and designed a front-mounted wide-row wheat seeder, which differs from the dual rotary tillage wide-row seeder developed by Luo Jiaming et al. [15]. The front-mounted design of the fertilizer hopper alleviates soil blockage issues, thereby improving seeding quality. Compared with the dual rotary tillage system, the single rotary tillage mechanism utilizes soil retention plates for secondary soil fragmentation and leveling, offering higher stability, lower fuel consumption, and greater operational practicality. This configuration aims to optimize seeding depth consistency and operational stability, achieving a high seed seeding depth qualification rate and a low seed distribution uniformity coefficient. Through discrete element simulation experiments, the effects of tillage blade penetration depth, rotation speed, and soil retention plate angle on seed distribution uniformity and seeding depth consistency were investigated. Comparative experiments validated the optimal operating conditions under the optimal parameter combination, providing a reference for the design of integrated wheat tillage–fertilization–seeding machinery.

2. Materials and Methods

This study encompasses the design and testing of a seeding depth control device, incorporating the design and analysis of both a rotary tillage device and a retaining plate device. The methodology comprised discrete element modeling DEM simulations, a single-factor experiment followed by a multifactorial orthogonal experimental design, and concluding with field validation to assess key seeding-influencing factors.

2.1. Structure and Working Principle of the Whole Machine

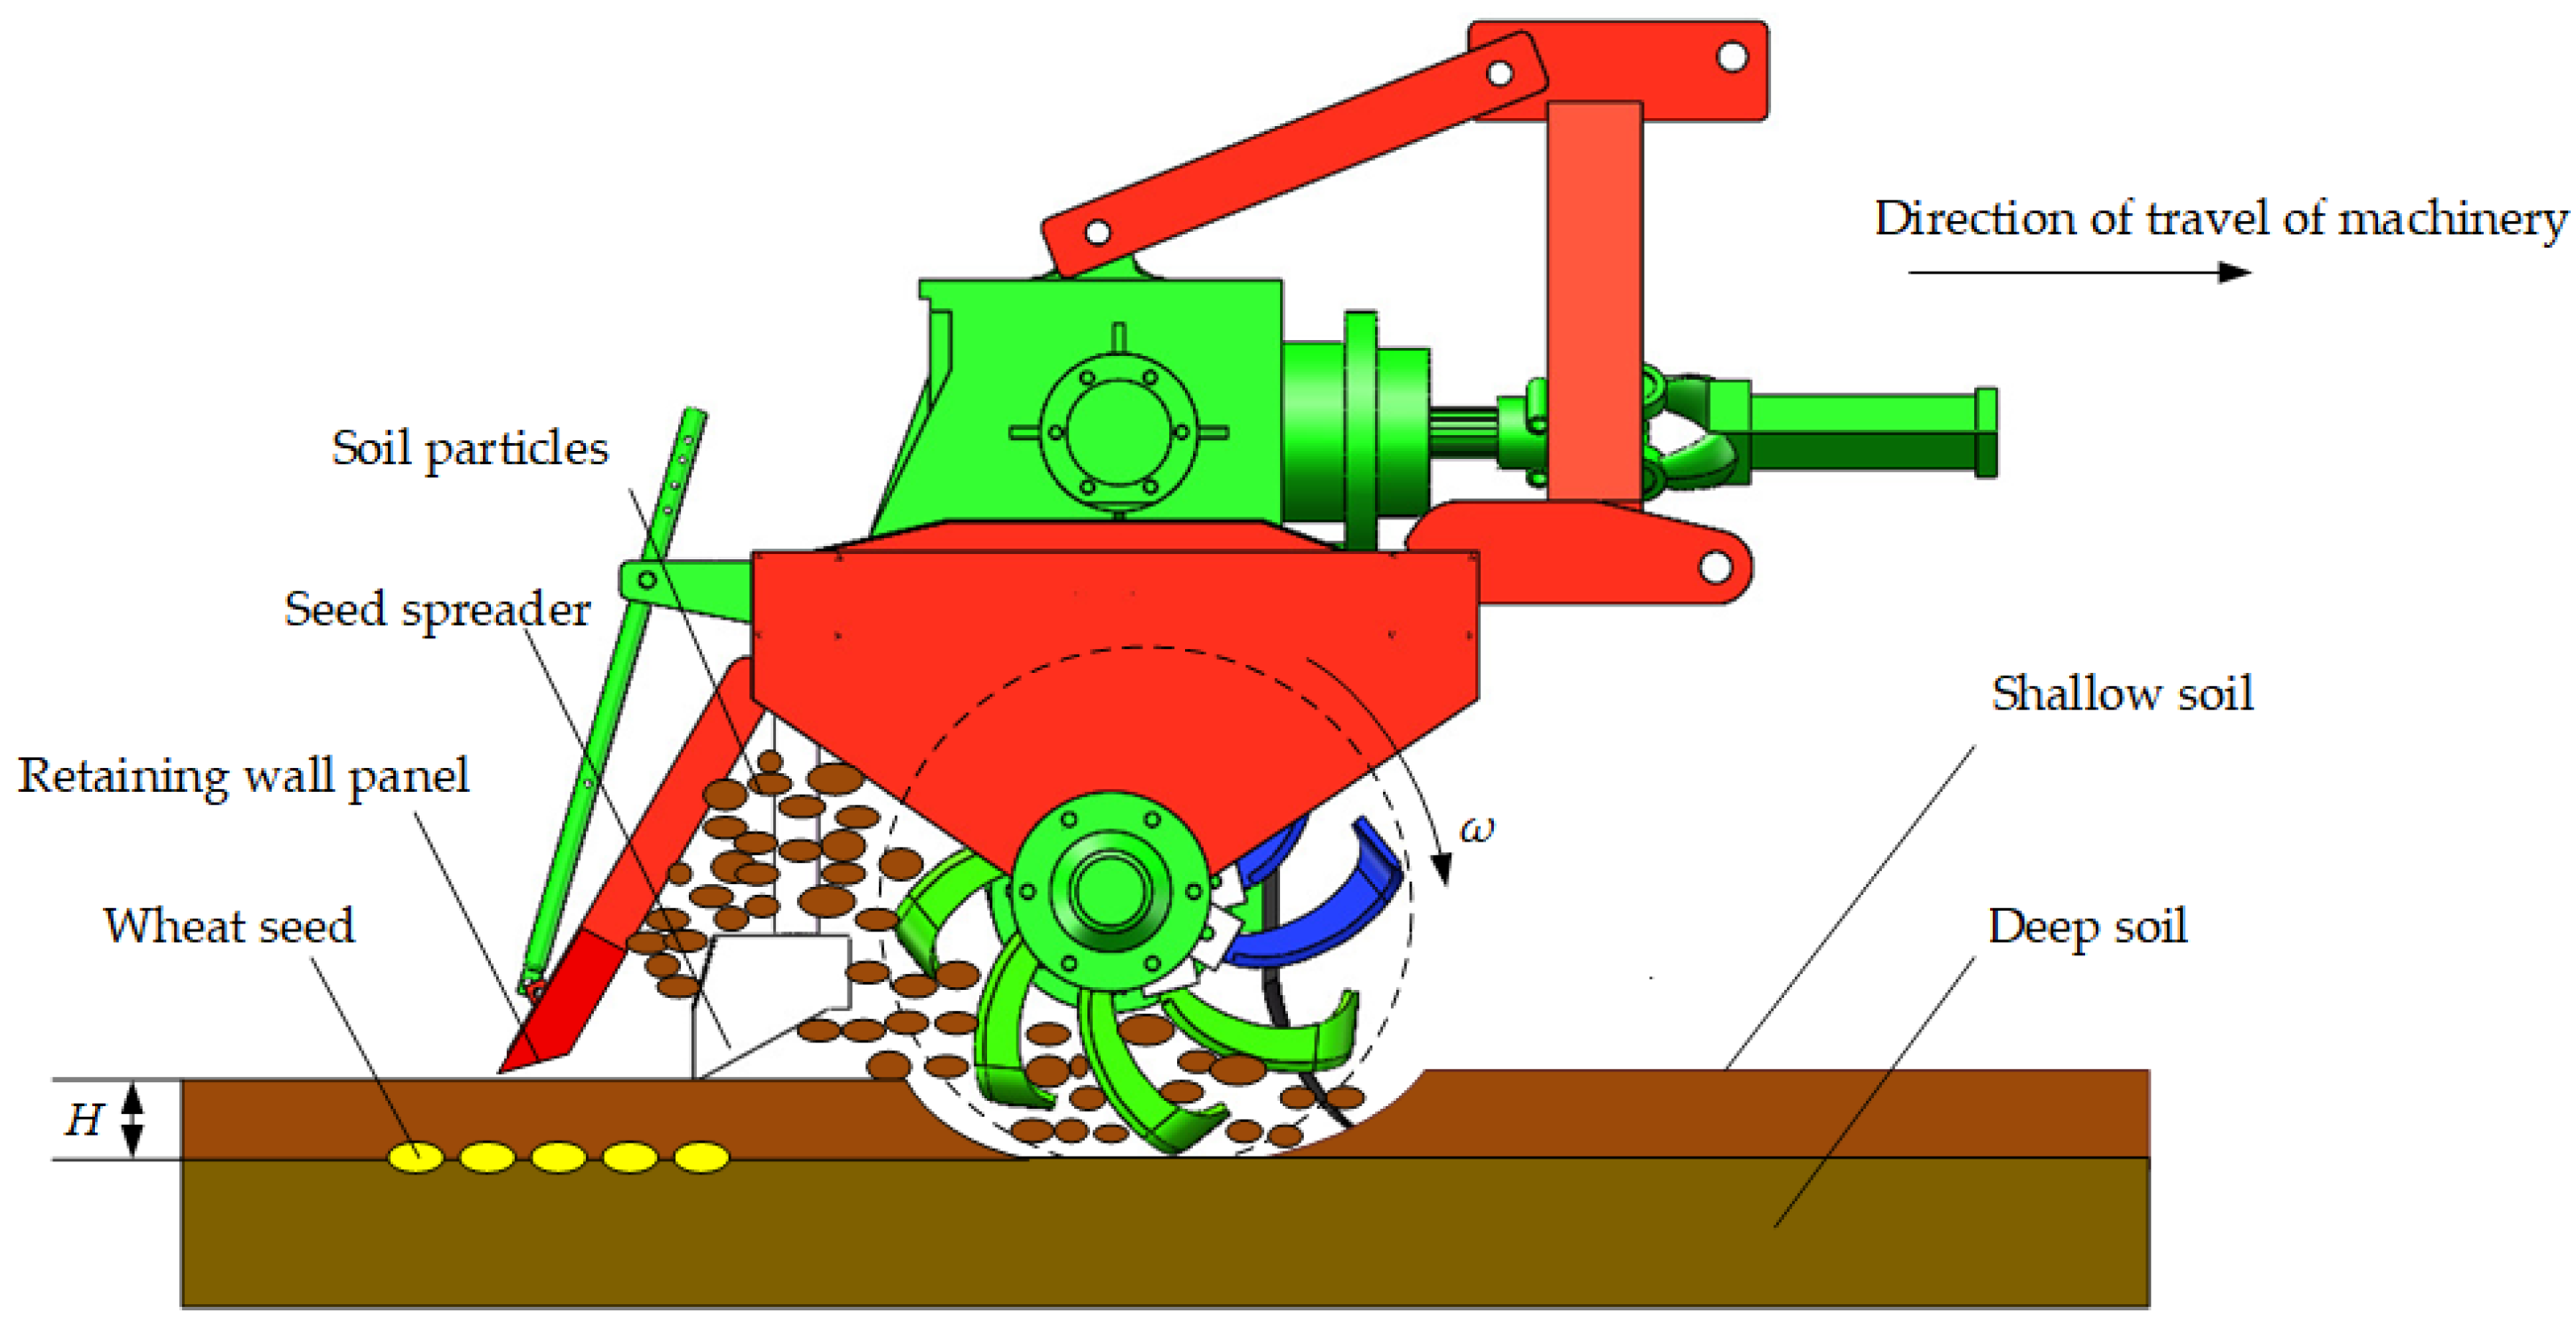
Figure 1 illustrates the structure of the wheat wide-row uniform seeder. This integrated system comprises seven core components: a fertilization device, a rotary tillage device, a three-point suspension device, transmission device, seeding device, seeding depth control device, and rolling device.
During operation, power is transmitted from the tractor’s rear output shaft to the seeder. This power actuates the rotary tiller via the transmission system, while tractor traction propels the seeder wheels. Wheel rotation subsequently drives the seeding and fertilization mechanisms. Fertilizer is dispersed across designated areas through the fertilizer chute. Simultaneously, the rotary tiller incorporates surface-applied fertilizer into subsurface soil layers, enhancing distribution uniformity. Wheat seeds deposited in the sowing zone are covered by dispersed soil. As shown in the Figure 2 below. To address irregular soil dispersion from rotary tiller blades, a rear-mounted soil retaining plate facilitates secondary soil fragmentation, removes excess material, and enables subsequent compaction. This configuration enhances sowing depth consistency for the soil dispersion system.

2.2. Structure and Motion Analysis of the Rotary Tillage Soil Throwing Device

2.2.1. Structure of the Rotary Plowing Device

Agronomic requirements for wide-row uniform seeding necessitate minimal soil bed disturbance to optimize seeding conditions. Rotary tillage equipment operates in two distinct modes: forward rotation and reverse rotation. Aligned with seeding methodology and machinery configurations, the IT245 rotary tillage blade that is compliant with national standards was selected.
Effective soil fragmentation requires λ > 1, where λ is defined as the ratio of rotary tiller rotational speed to seeder forward speed. Soil fragmentation is significantly influenced by cutting pitch S [18,19,20,21,22,23]. Optimal soil fragmentation occurs at S = 70 mm. Under these parameters, blade count B per cutting section is derived as follows:
B = 60000 V N S
where N is the rotational speed of the rotary tillage unit, r/min; V is the forward speed of seeding machinery, m/s.
The number 60,000 is the value obtained after converting rad/s to rpm; before conversion, the unit for v was m/s, and after conversion, it became 60,000 mm/min. The number 60,000 is the value in front of the unit mm/min to avoid errors when directly entering the value.
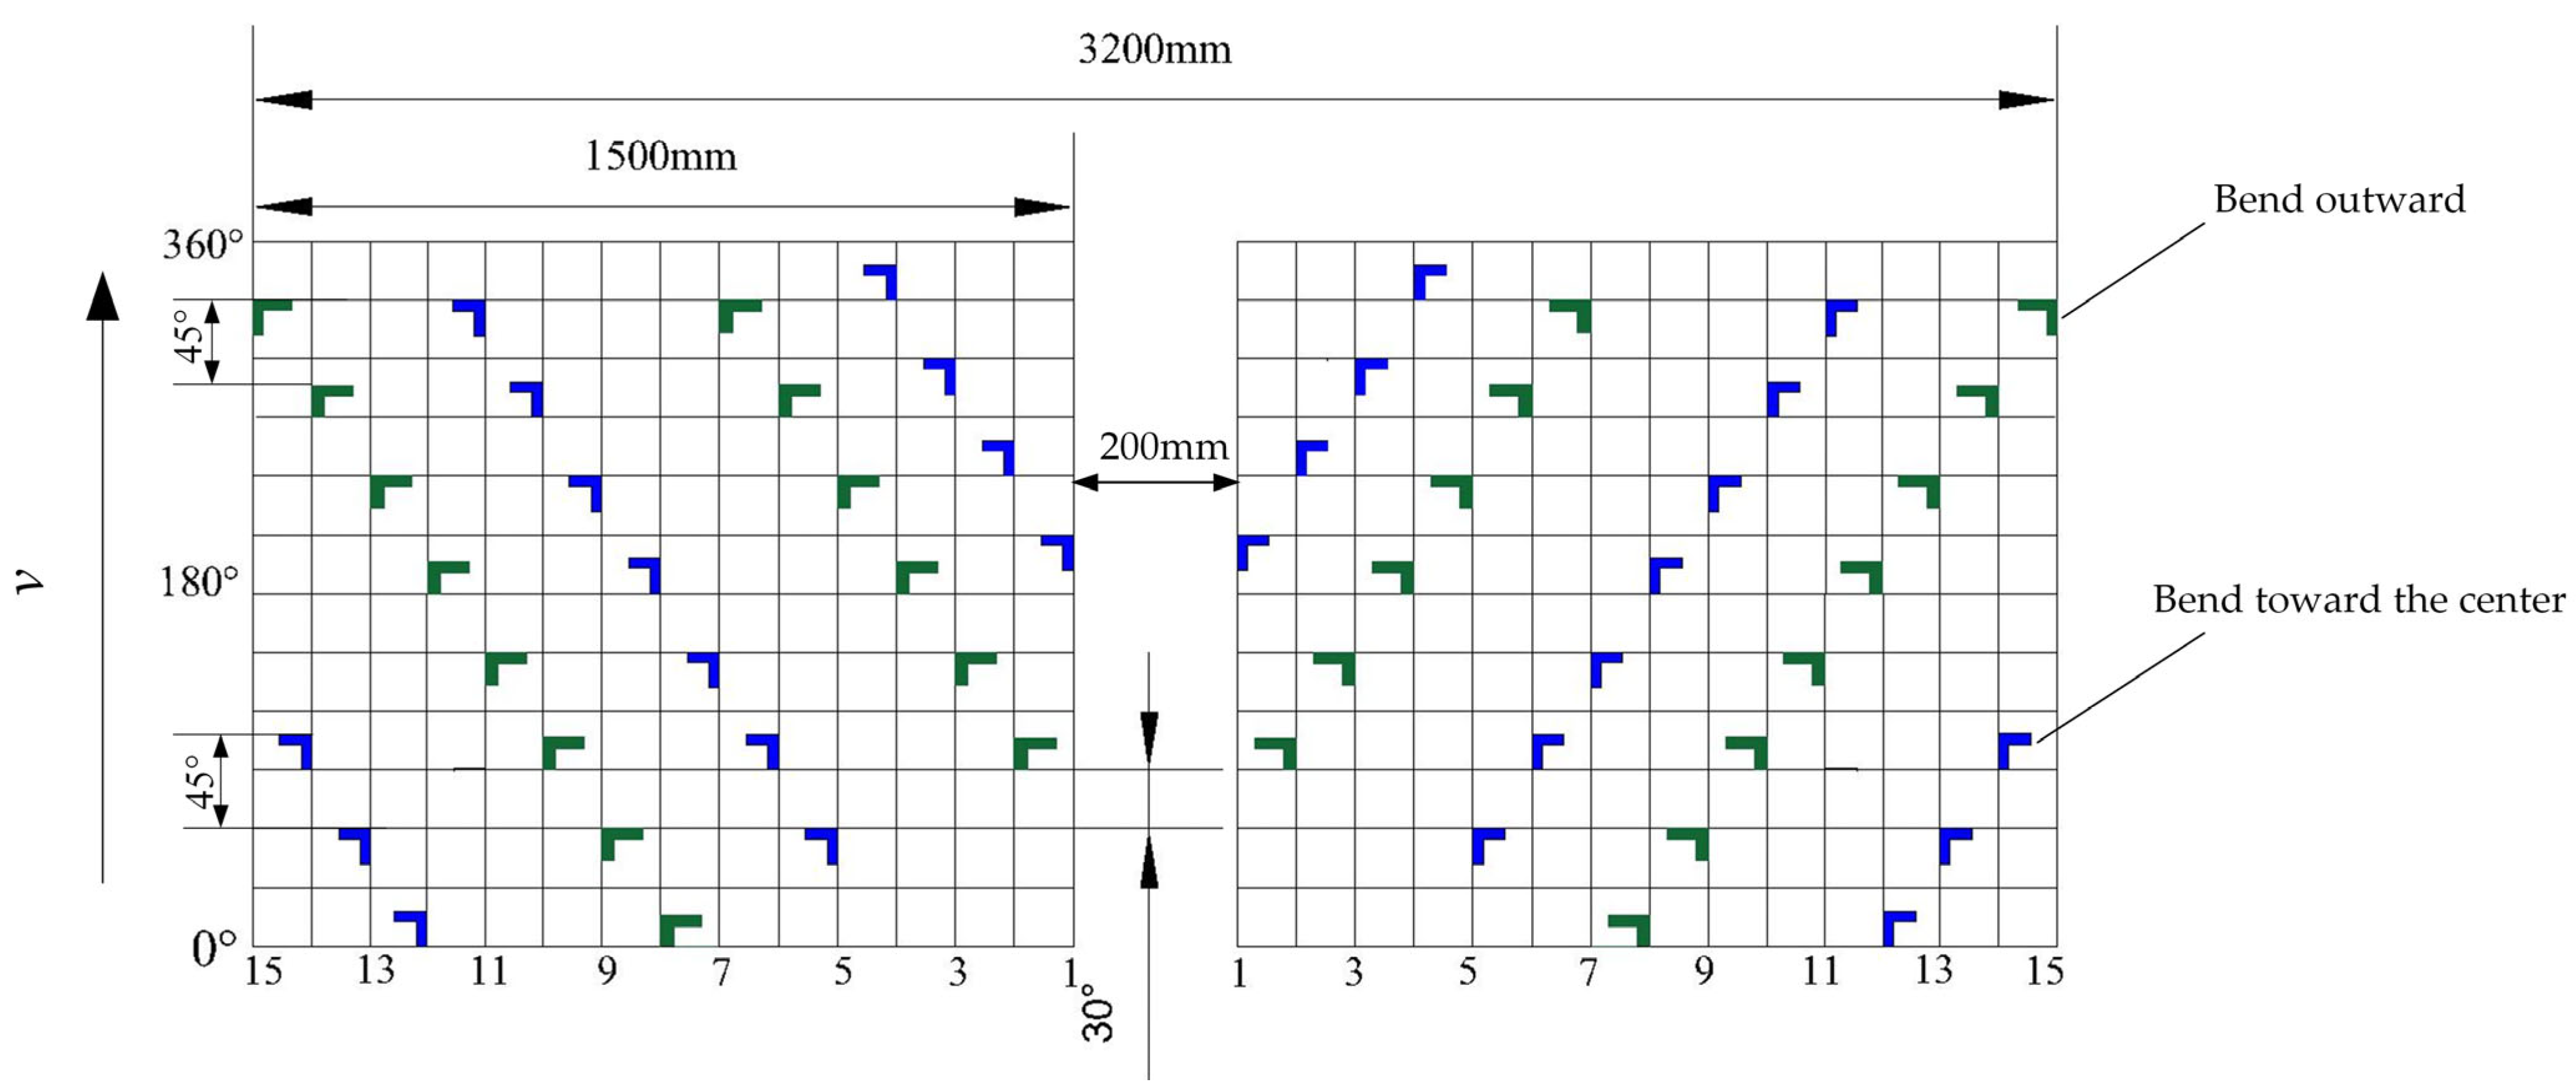
According to the formula, when the mechanical seeding forward speed is 1 m/s and the rotary tilling device speed is 310 rpm, the number of rotary tilling blades B within the same soil-cutting zone is 2, meaning that each blade disc is equipped with two rotary tilling blades. The single-sided rotary tilling blade roller is designed with alternating left and right blades. The angle between the rotary tiller blades on the same plane is set to 180°, and the angle between adjacent rotary tiller blades is 45°. The rotary tiller blades are driven by the tractor’s rear output shaft via a transmission system, which in turn drives the rotary tilling mechanism. With the transmission system at the center, the rotary tiller rollers are arranged symmetrically on both sides, ensuring both effective soil fragmentation and operational stability during use. The arrangement of the rotary tiller blades is illustrated in Figure 3 below.

2.2.2. Motion Analysis of Rotary Plowing Devices

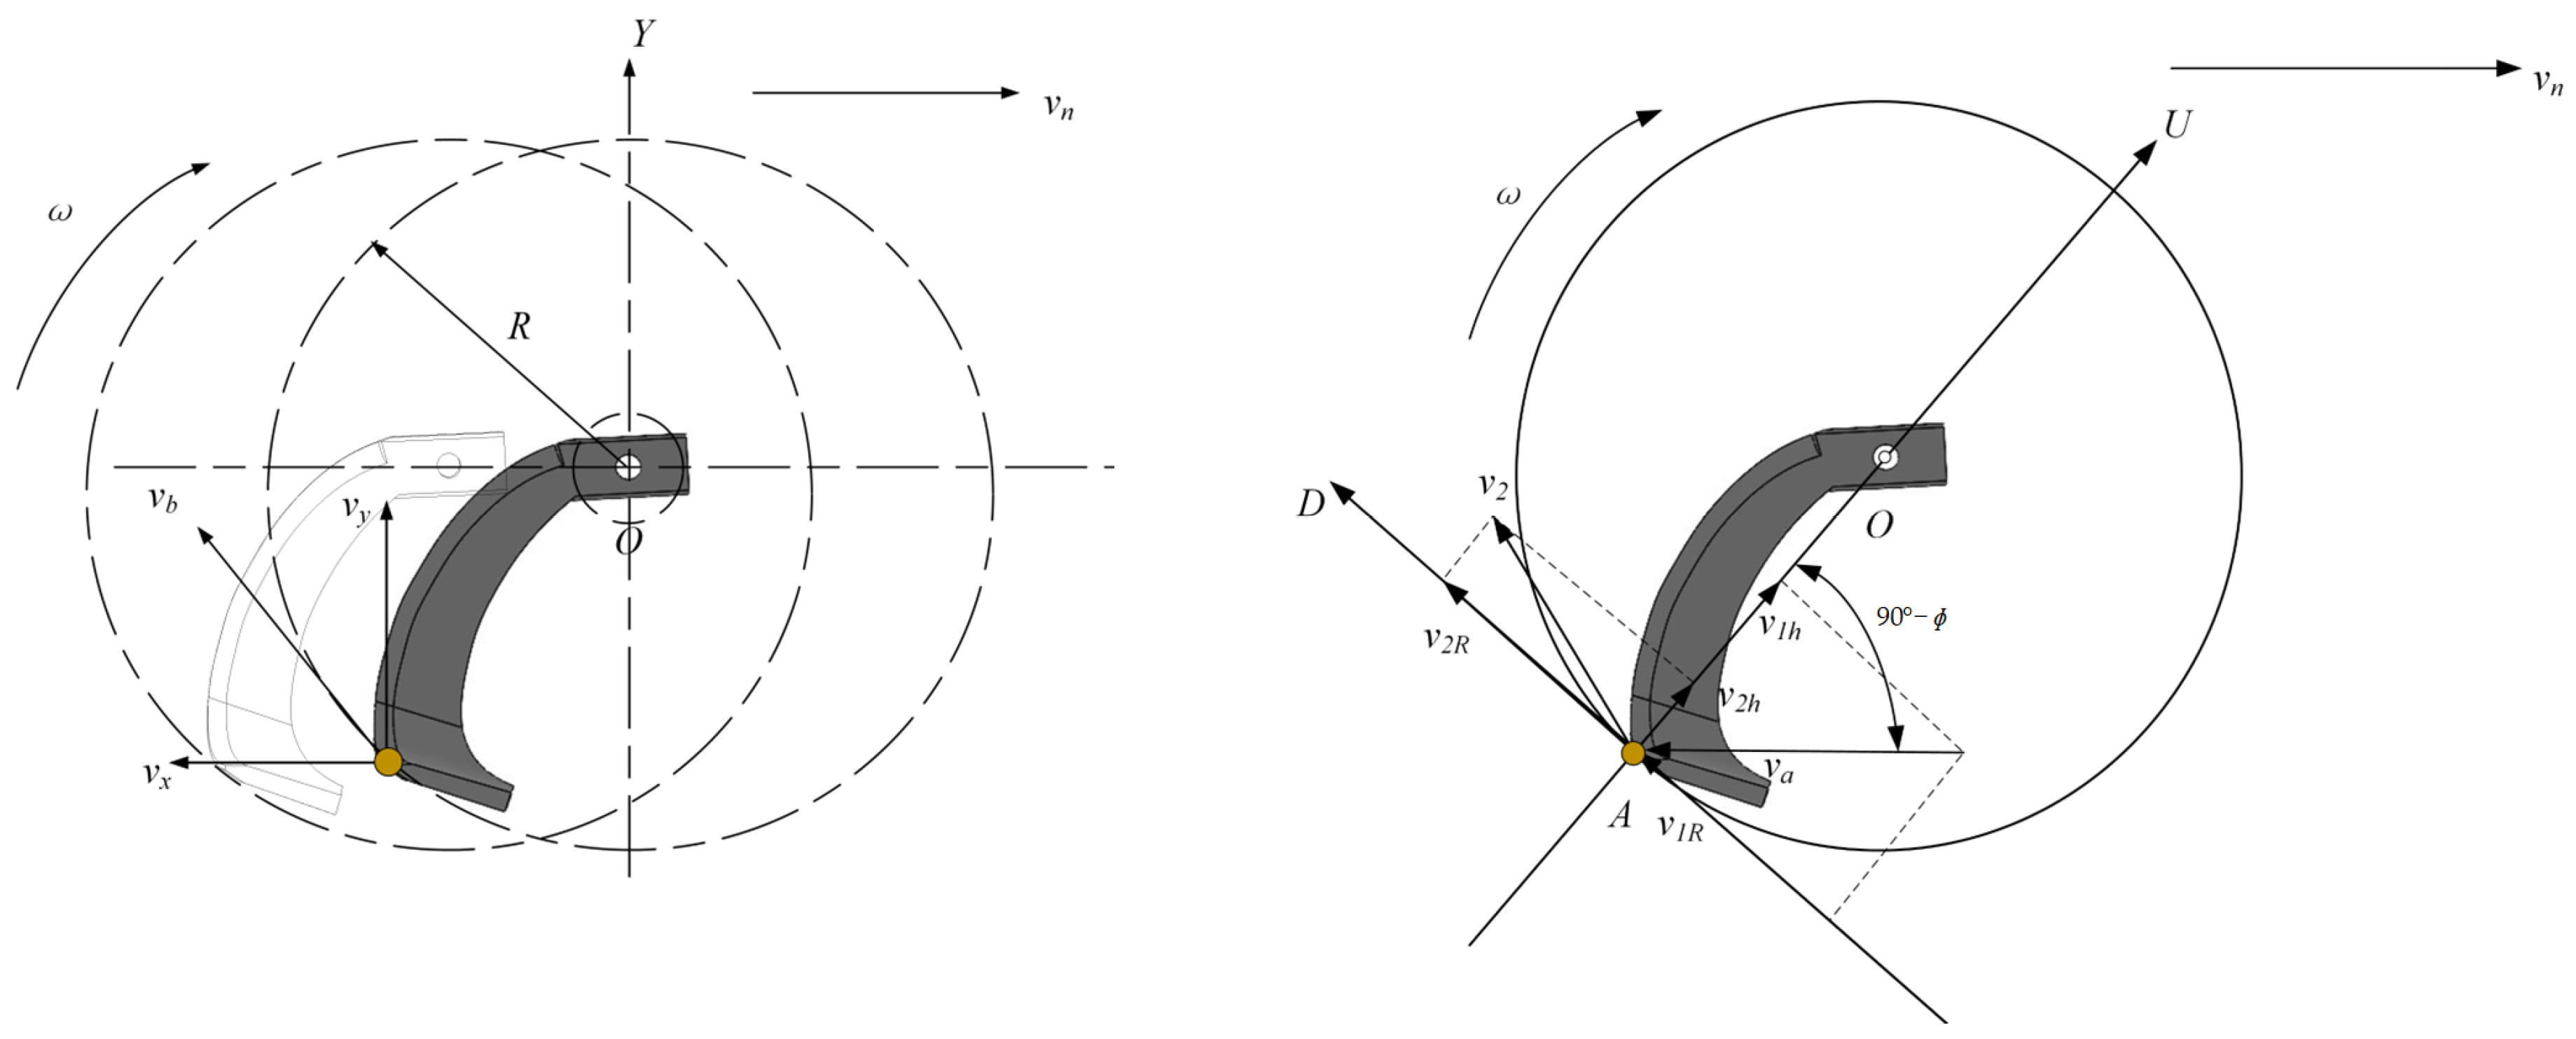
The rotary tiller shaft operates in bidirectional rotation modes: forward and reverse. Rotation direction significantly influences both the power requirements of the rotary tillage seeder and the soil discharge characteristics. During horizontal translation of the entire machine, the rotary tillage mechanism simultaneously executes rotational motion. A coordinate system is defined with the rotary tiller shaft as both rotational center and origin. The resulting trajectory of the rotary tiller shaft is illustrated in Figure 4
The integrated rotary tillage mechanism provides soil coverage for wheat seeds deposited rearward. Rotary direction governs soil displacement magnitude during operation. Forward rotation yields optimal soil fragmentation, complete seed coverage, and minimal draft resistance, whereas reverse rotation produces uneven fragmentation and elevated energy consumption [24,25]. Considering both mechanical design constraints and agronomic requirements, blades engage soil from the surface downward, with ejected soil directed rearward to accomplish coverage. Consequently, forward rotation was selected for the tillage mechanism.
The equation of motion for the endpoint of the rotary cutter shaft is as follows:
x = r cos ω t + v n t y = r sin ω t
By taking the derivative of Equation (2) with respect to t, the equation of cutting speed of a rotary tiller can be obtained as follows:
v x = v n r ω sin ω t v y = r ω cos ω t
where the total rotary cutter cutting speed vb is as follows:
v b = v n 2 2 v n ω r sin ω t + ω 2 r 2
where vn is the speed at which the machine travels, m/s; r is the value of the rotary radius of the rotary plow blade, mm; ω is the angular velocity of the rotary cutter roller, rad/s.
The movement of individual soil particles A are analyzed as separate entities. When the rotary tiller blade has a cutting angle of ɸ and a total cutting speed of vn, the ejected soil particles can be regarded as a contact model between the soil particles and the rotary tiller blade in a stationary state, colliding at an angle of 90°. Establish a rectangular coordinate system as shown in Figure 4.
After impact, the ratio of the normal component to the tangential component of the relative velocity of soil particles compared with the velocity before collision is as follows:
v 2 h v b sin ϕ = k v 2 R v b cos ϕ = 1 f
where k is the coefficient of reduction of the soil; f is the instantaneous friction factor;
k is the soil reduction coefficient. When the soil impact process is considered to be in an ideal state with no energy loss, the normal component of the relative velocity is constant, and in an ideal state, k = 1. Under general conditions, due to plastic deformation and energy loss, this ideal state cannot be achieved. In the soil type conditions of the test site, the soil reduction coefficient k ≈ 0.6, and the instantaneous friction coefficient f ≈ 0.45.
The equation of motion of soil particles after rotary cutting is:
x A = x 0 + v 2 R v 2 h t y A = y 0 + v 2 n t g t 2 / 2
where x0 is the original horizontal coordinate of the soil particle; y0 is the original vertical coordinate of the soil particle; g is the acceleration of gravity, m/s2; t is The time before the soil was thrown out prior to the impact, s;
Integrating Equation (6) and eliminating the time t from the equation, the equation for the trajectory of soil particle A is:
y A = y 0 + v 2 n x A x 0 v 2 R v n 1 2 g x A x 0 v 2 R v n 2
After analyzing and combing the soil throwing performance of a rotary tillage knife, it is known that the soil throwing path of a rotary tillage knife takes the form of a parabola. From Equations (6) and (7), it can be obtained that: when the radius of the rotary plow blade does not change, the displacement of the thrown soil particles will be affected by the rotary plow blade speed ω of the machine tool. At the same time, when a change in the soil depth to which the rotary tillage device penetrates will affect the amount of thrown soil, thereby affecting the sowing depth and sowing quality.

2.2.3. Trajectory Analysis of Thrown Soil Particles and Retaining Plates

The post-impact vertical trajectory of soil particles, given an obliquely upward initial velocity vector, is governed by impact parameters, baffle inclination angle θ, restitution coefficient, and gravitational acceleration. Three distinct phases were analyzed: 1. Projectile phase; 2. Baffle impact phase; 3. Particle rebound phase; with Figure 5 illustrating force diagrams for all phases.
Let the soil particles be thrown obliquely with an initial velocity v0 at an angle η to the horizontal, and its equation of motion is as follows:
x = v 0 cos η t 1 y = v 0 sin η t 1 1 2 g t 1 2
where η is the angle between the soil particle and the horizontal plane when it is thrown, °; t1 is the speed of the soil particle from the time it is thrown to the time it hits the baffle plate, s.
Expressing the inclination of the baffle in terms of β, the equation can be expressed as follows:
y = x tan β + b
where b is a constant; β is the inclination angle.
Associative Equations (8) and (9) can be obtained as follows:
v 0 sin η t 1 1 2 g t 1 2 = v 0 cos η t 1 tan β + b
Solve for t1 as follows:
t 1 = v 0 sin η + v 0 2 sin 2 η 2 g b g
The velocity component of the soil particle at impact can be expressed as follows:
v 2 x = v 0 cos η v 2 y = v 0 sin η g t 1
where v 2 is the velocity of the soil particle when it collides with the baffle, m/s; v 2 x is the horizontal component of velocity of the soil particle when it collides with the baffle, m/s; v 2 y is the vertical component of the velocity of the soil particle when it collides with the baffle.
The velocity of the soil particle at the moment of collision with the baffle begins to change, where the incident normal velocity is as follows:
v 3 n = v 2 y cos β + v 2 x sin β
where v 3 n is the normal velocity of the incident soil particle, m/s.
The rebound normal velocity is as follows:
v 4 n = e v 3 n = e cos β v 0 cos θ g t 1 + v 0 cos η sin β
where v 4 n is the normal velocity of rebounding soil particles, m/s; μ is the friction coefficient; e is the elastic recovery coefficient.
The incident tangential velocity is as follows:
v 3 t = v 2 y sin β v 2 x cos β = sin β v 0 sin β g t 1 v 0 cos β cos η
where v 3 t is the tangential velocity of incidence of soil particles, m/s.
The rebound tangential velocity is as follows:
v 4 t = v 3 t μ 1 + e v 3 n
The synthetic velocity after rebound is as follows:
v 4 x = v 4 n sin β + v 4 t cos β v 4 y = v 4 n cos β v 4 t sin β
where v 4 x is the partial velocity in the x-direction, m/s; v 4 y is the partial velocity in the y-direction, m/s.
The distance that the soil particles move in the horizontal direction after bouncing is calculated as follows:
d x = T v 0 sin η g t 1 cos β 1 + e sin β μ 1 + e cos β + T v 0 cos η e sin 2 β cos 2 β μ 1 + e sin β cos β
The distance that the soil particles move in the vertical direction after bouncing is calculated as follows:
d y = T v 0 sin η g t 1 e cos 2 β + sin β μ 1 + e cos β 1 + T 1 + e sin β cos β + μ sin β v 0 cos η
where dx is the distance traveled in the horizontal direction by the rebounding soil particles, mm; dy is the distance traveled by rebounding soil particles in the vertical direction, mm.
Equations (18) and (19) indicate that the horizontal and vertical soil particle displacements after rebound are positively correlated with the deflector angle θ. Therefore, θ has a critical impact on the consistency of sowing depth and overall sowing quality. To achieve optimal soil fragmentation and uniform seed coverage, θ should be maintained between 15° and 40° in the horizontal direction.
The baffle inclination angle θ governs soil fragmentation efficiency. During oblique collisions between rotary-tiller-ejected soil and baffles at varying θ, soil aggregates undergo differential fragmentation. This directly modulates post-sowing coverage uniformity for wheat, thereby affecting germination success and ultimate crop yields.

2.3. Simulation Test

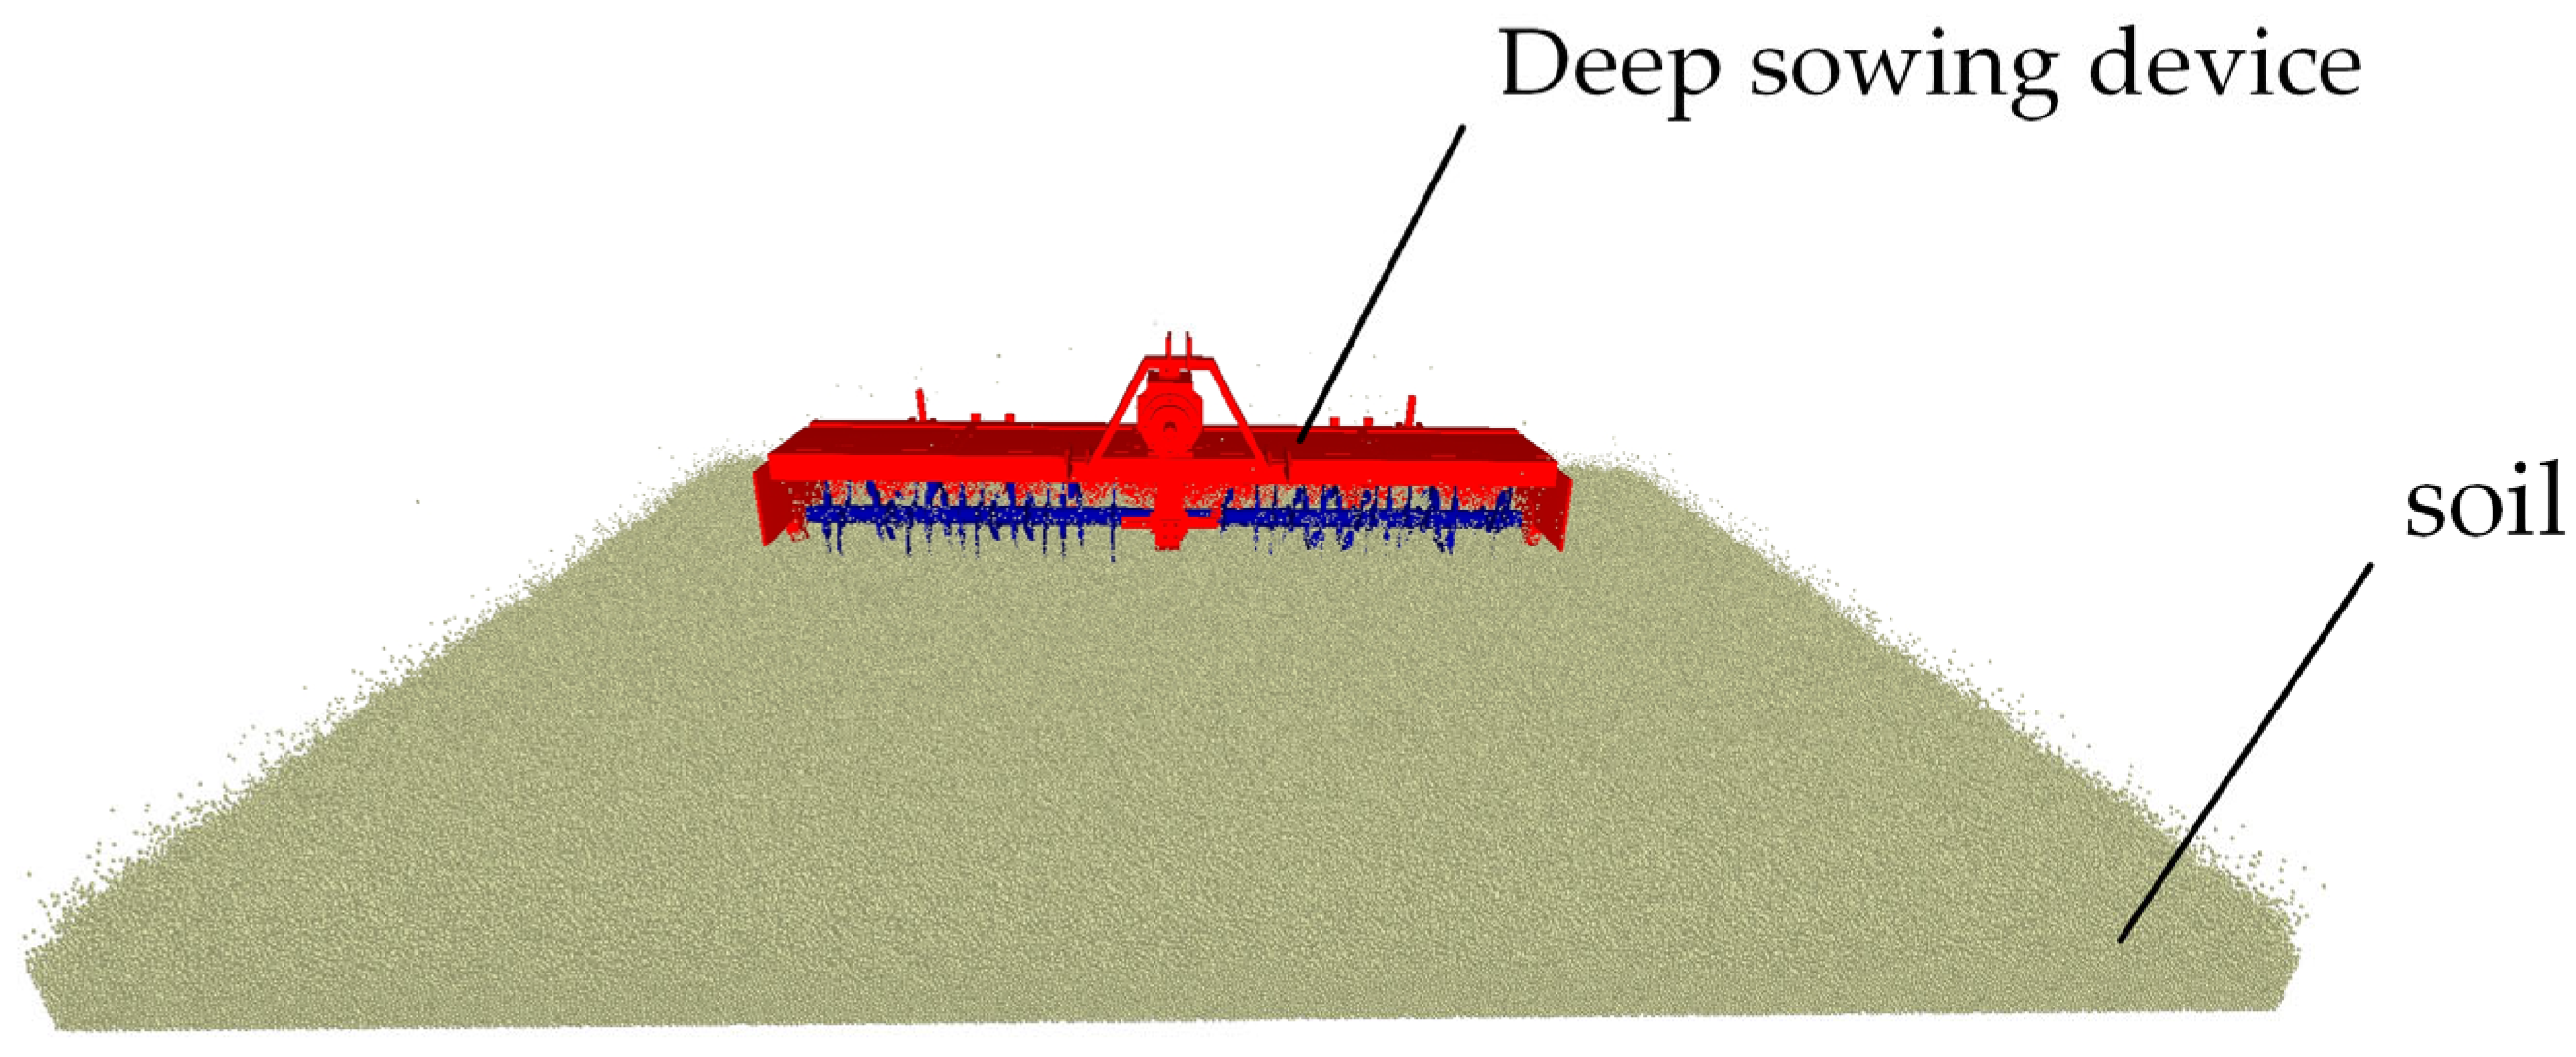
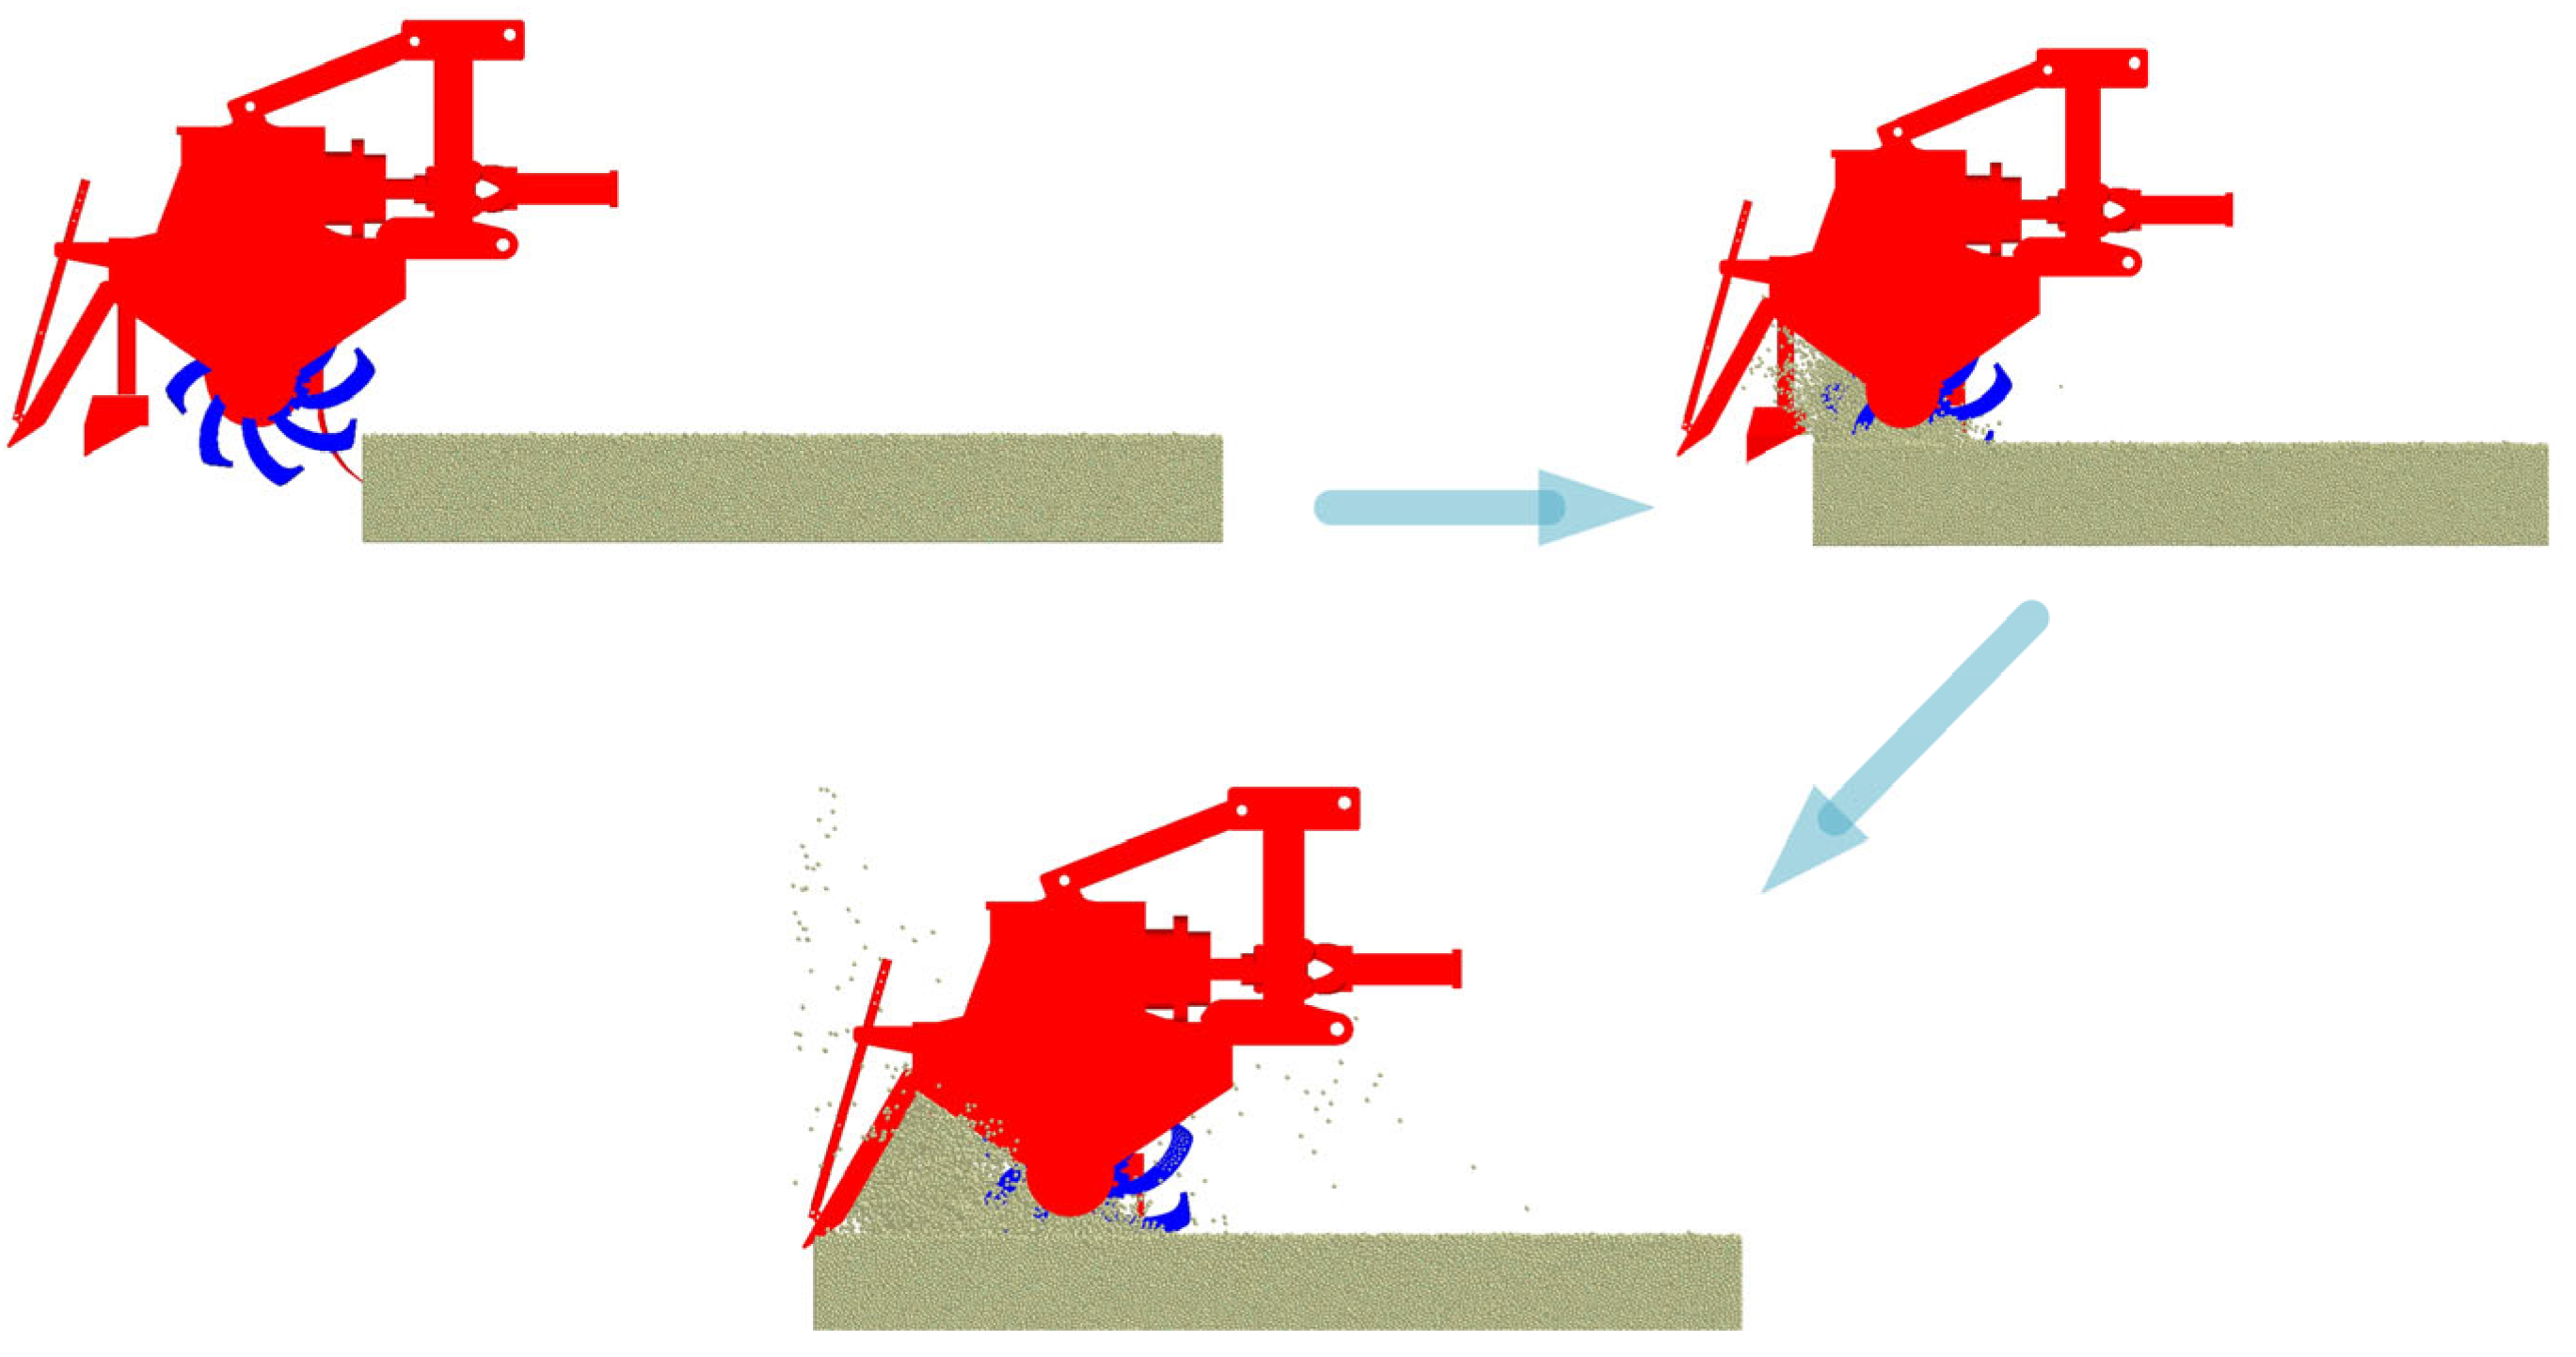
To evaluate the agronomic impact of this methodology, a discrete element model DEM was developed using EDEM2022 software from DEM Solutions. Within a wide-strip uniform sowing agronomic framework, simultaneous fertilization–rotary tillage–seeding operations were simulated. The depth control mechanism of the integrated implement was isolated in simulations to analyze parameter combination effects on seeding depth consistency. The simulation configuration appears in Figure 6.

2.3.1. Simulation Test Parameter Setting

A discrete element method (DEM) soil–seedbed model was developed using EDEM software (DEM). Contact parameters are detailed in Table 1 and parameterized using experimental field soil characteristics, with inter-particle contacts modeled via the Hertz–Mindlin no-slip bonding model [26,27]. Component interactions employed the Hertz–Mindlin no-slip model, with soil particles represented as 5 mm diameter spheres. The soil trench measured 5000 × 5000 × 300 mm3. This 3D model was imported into EDEM for discrete element simulation, incorporating rotary tillage, seeding, and baffle plate assemblies. All components were assigned steel material properties.
The contact parameter values for each material are as follows: the Poisson’s ratio, density, and shear modulus of soil are 0.4, 1770, and 2.8 × 10⁷ kg/m3, respectively; the Poisson’s ratio, density, and shear modulus of steel are 0.3, 7850 kg/m3, and 7.9 × 10¹⁰ Pa, respectively. The detailed contact parameters are shown in the table below [28,29,30].

2.3.2. Simulation and Measurement Methods

This study quantifies the impact of front-mounted fertilizer trough depth control mechanisms on seeding depth consistency and distribution uniformity in wide-strip sowing systems. Furthermore, it examines rotary tillage depth, blade rotational velocity, and baffle inclination angle relative to wide-strip agronomic requirements and their collective influence on seeding performance.
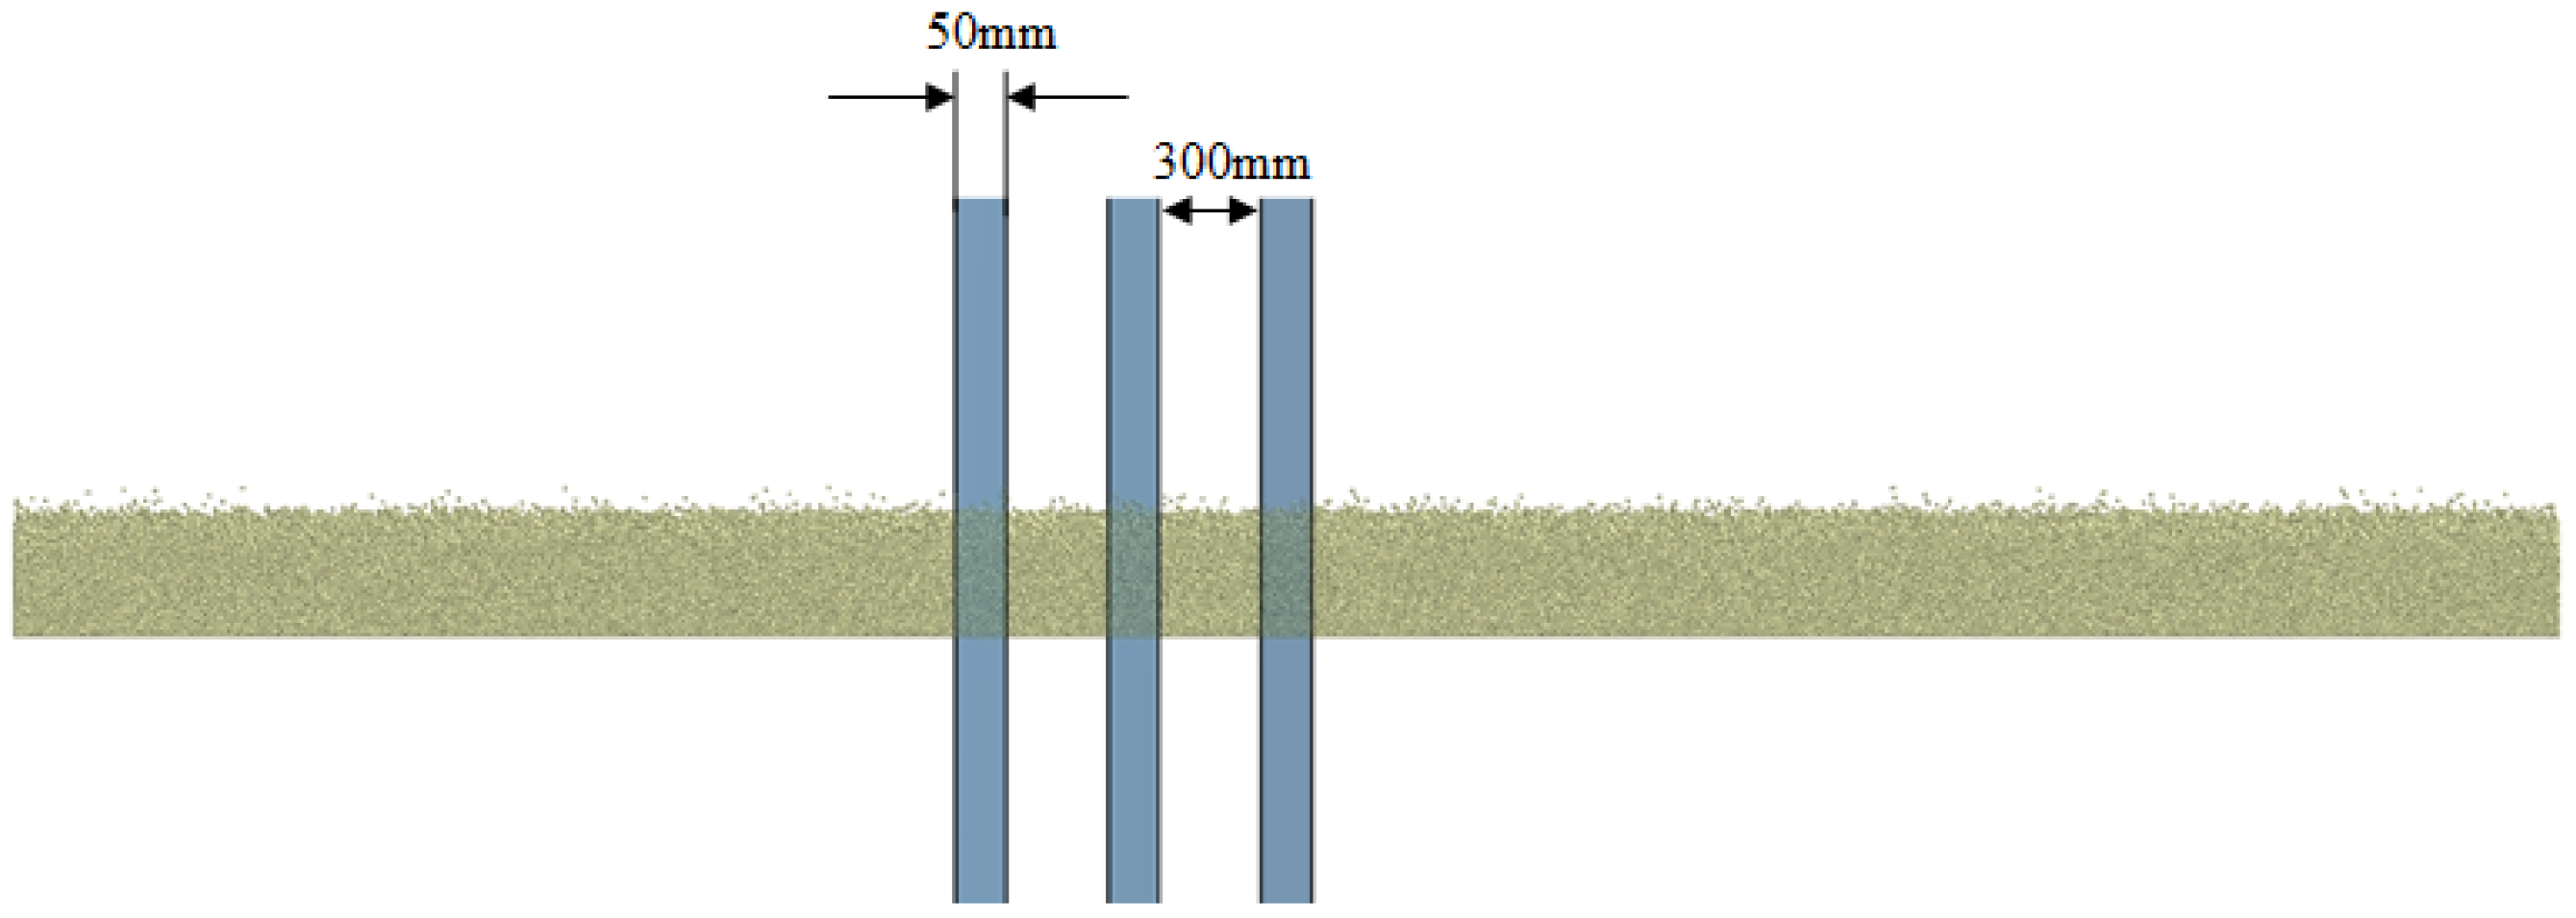
The computational mesh resolution was calibrated to 2× soil particle radius. Soil particles were generated with bonding contacts to form the seedbed. The wheat wide-strip seeder’s depth control assembly was then imported. A seed particle factory, 5000 seeds/s; with a descent velocity of 1 m/s, was implemented within the seed tube. The implemented forward velocity was maintained at 1 m/s with rotary tillage at 310 rpm. The rotary tillage depth was set at 120 mm. Figure 7 illustrates the simulation configuration. Statistical significance was ensured through triplicate simulations with randomized initialization. Post-processing via EDEM’s Analyst module extracted key simulation data. The Clipping function sampled transverse seedbed planes. Seed depth qualification rates target: 30–50 mm [31,32] were measured from three transverse planes at 300 mm intervals Figure 8. Vertical distance between the seed apex and the soil surface was measured at corresponding locations.
The calculation is based on the sowing depth qualification rate and the coefficient of variation for sowing uniformity. The formula is as follows:
(1) Measurement of sowing depth consistency:
Following seeding operations, five sampling zones were randomly positioned along diagonal transects at 300 mm intervals. Each zone measured 50 mm longitudinally × full implement working width laterally. Seed depth (vertical distance from seed apex to soil surface) was measured. Five replicate trials were performed, with data reported as means. Depth acceptability was determined according to regional agronomic standards, specifically 30–50 mm [31,32]. Let Nacceptable represent seeds within an acceptable depth range and H the seeding depth qualification rate (H ≥ 80%). The qualification rate was calculated as follows:
H = M N × 100 %
where H is the qualification rate of seed sowing depth in the testing area, %; M is the number of qualified points for sowing depth within the detection area, pcs; N is the number of measurement points, pcs.
(2) Measurement of sowing uniformity:
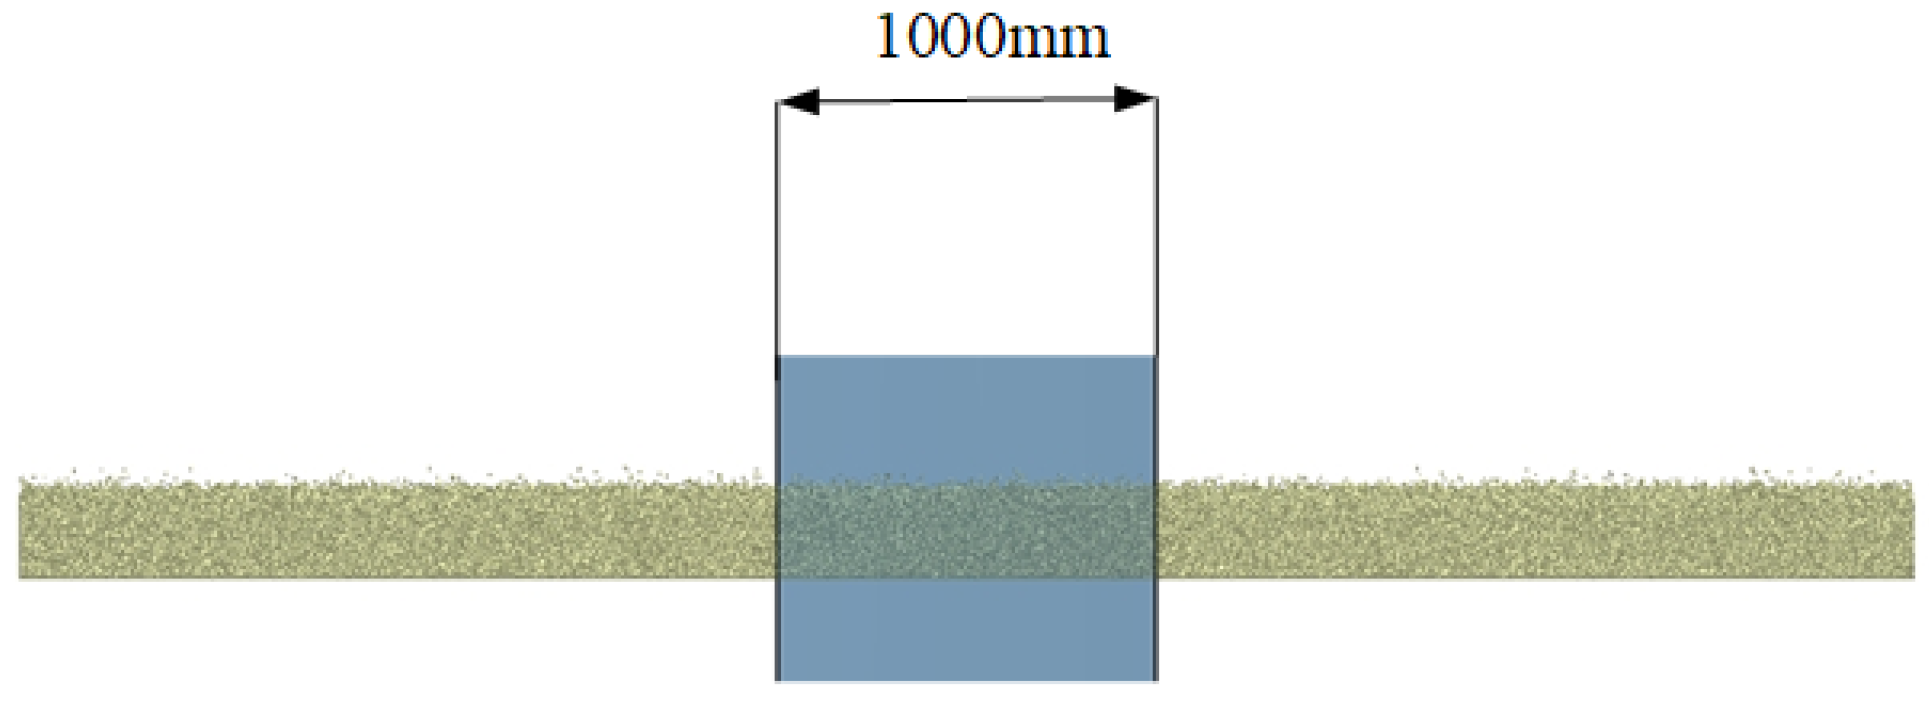
Following the completion of the simulation, key data were extracted using the Analyst post-processing module. The Clipping function sampled transverse seedbed planes. For sowing uniformity assessment, a representative transverse plane was selected post-sowing. Five 1000 mm sampling zones were positioned via the five-point sampling method to quantify seed distribution Figure 9. Sampled data were subsequently analyzed.
According to Equation (21), counting the number of seeds in each sub-grid after each simulation test can be performed as follows:
x ¯ = x i n
where x ¯ is the average number of particles in all grids, grains; x i is the number of seeds in the ith segment of grid cells, grains; n is the number of determinations, times.
The standard deviation of the number of wheat seeds in a grid cell was calculated according to Equation (22), as follows:
s = x i x ¯ n
where x i is the number of seeds in segment i grid cell, grains.
The coefficient of variation for wheat seed sowing uniformity was expressed according to Equation (23). At the same time, a coefficient of variation v ≥ 45 was used for uniform sowing.
v = s x × 100 %
where v is the coefficient of variation for sowing uniformity,%; s is the number of qualified points in the detection area; x is the total number of points detected.

2.4. One-Way Test

2.4.1. Relationship Between the Depth of Entry of Rotary Tillage Devices and Evaluation Indicators

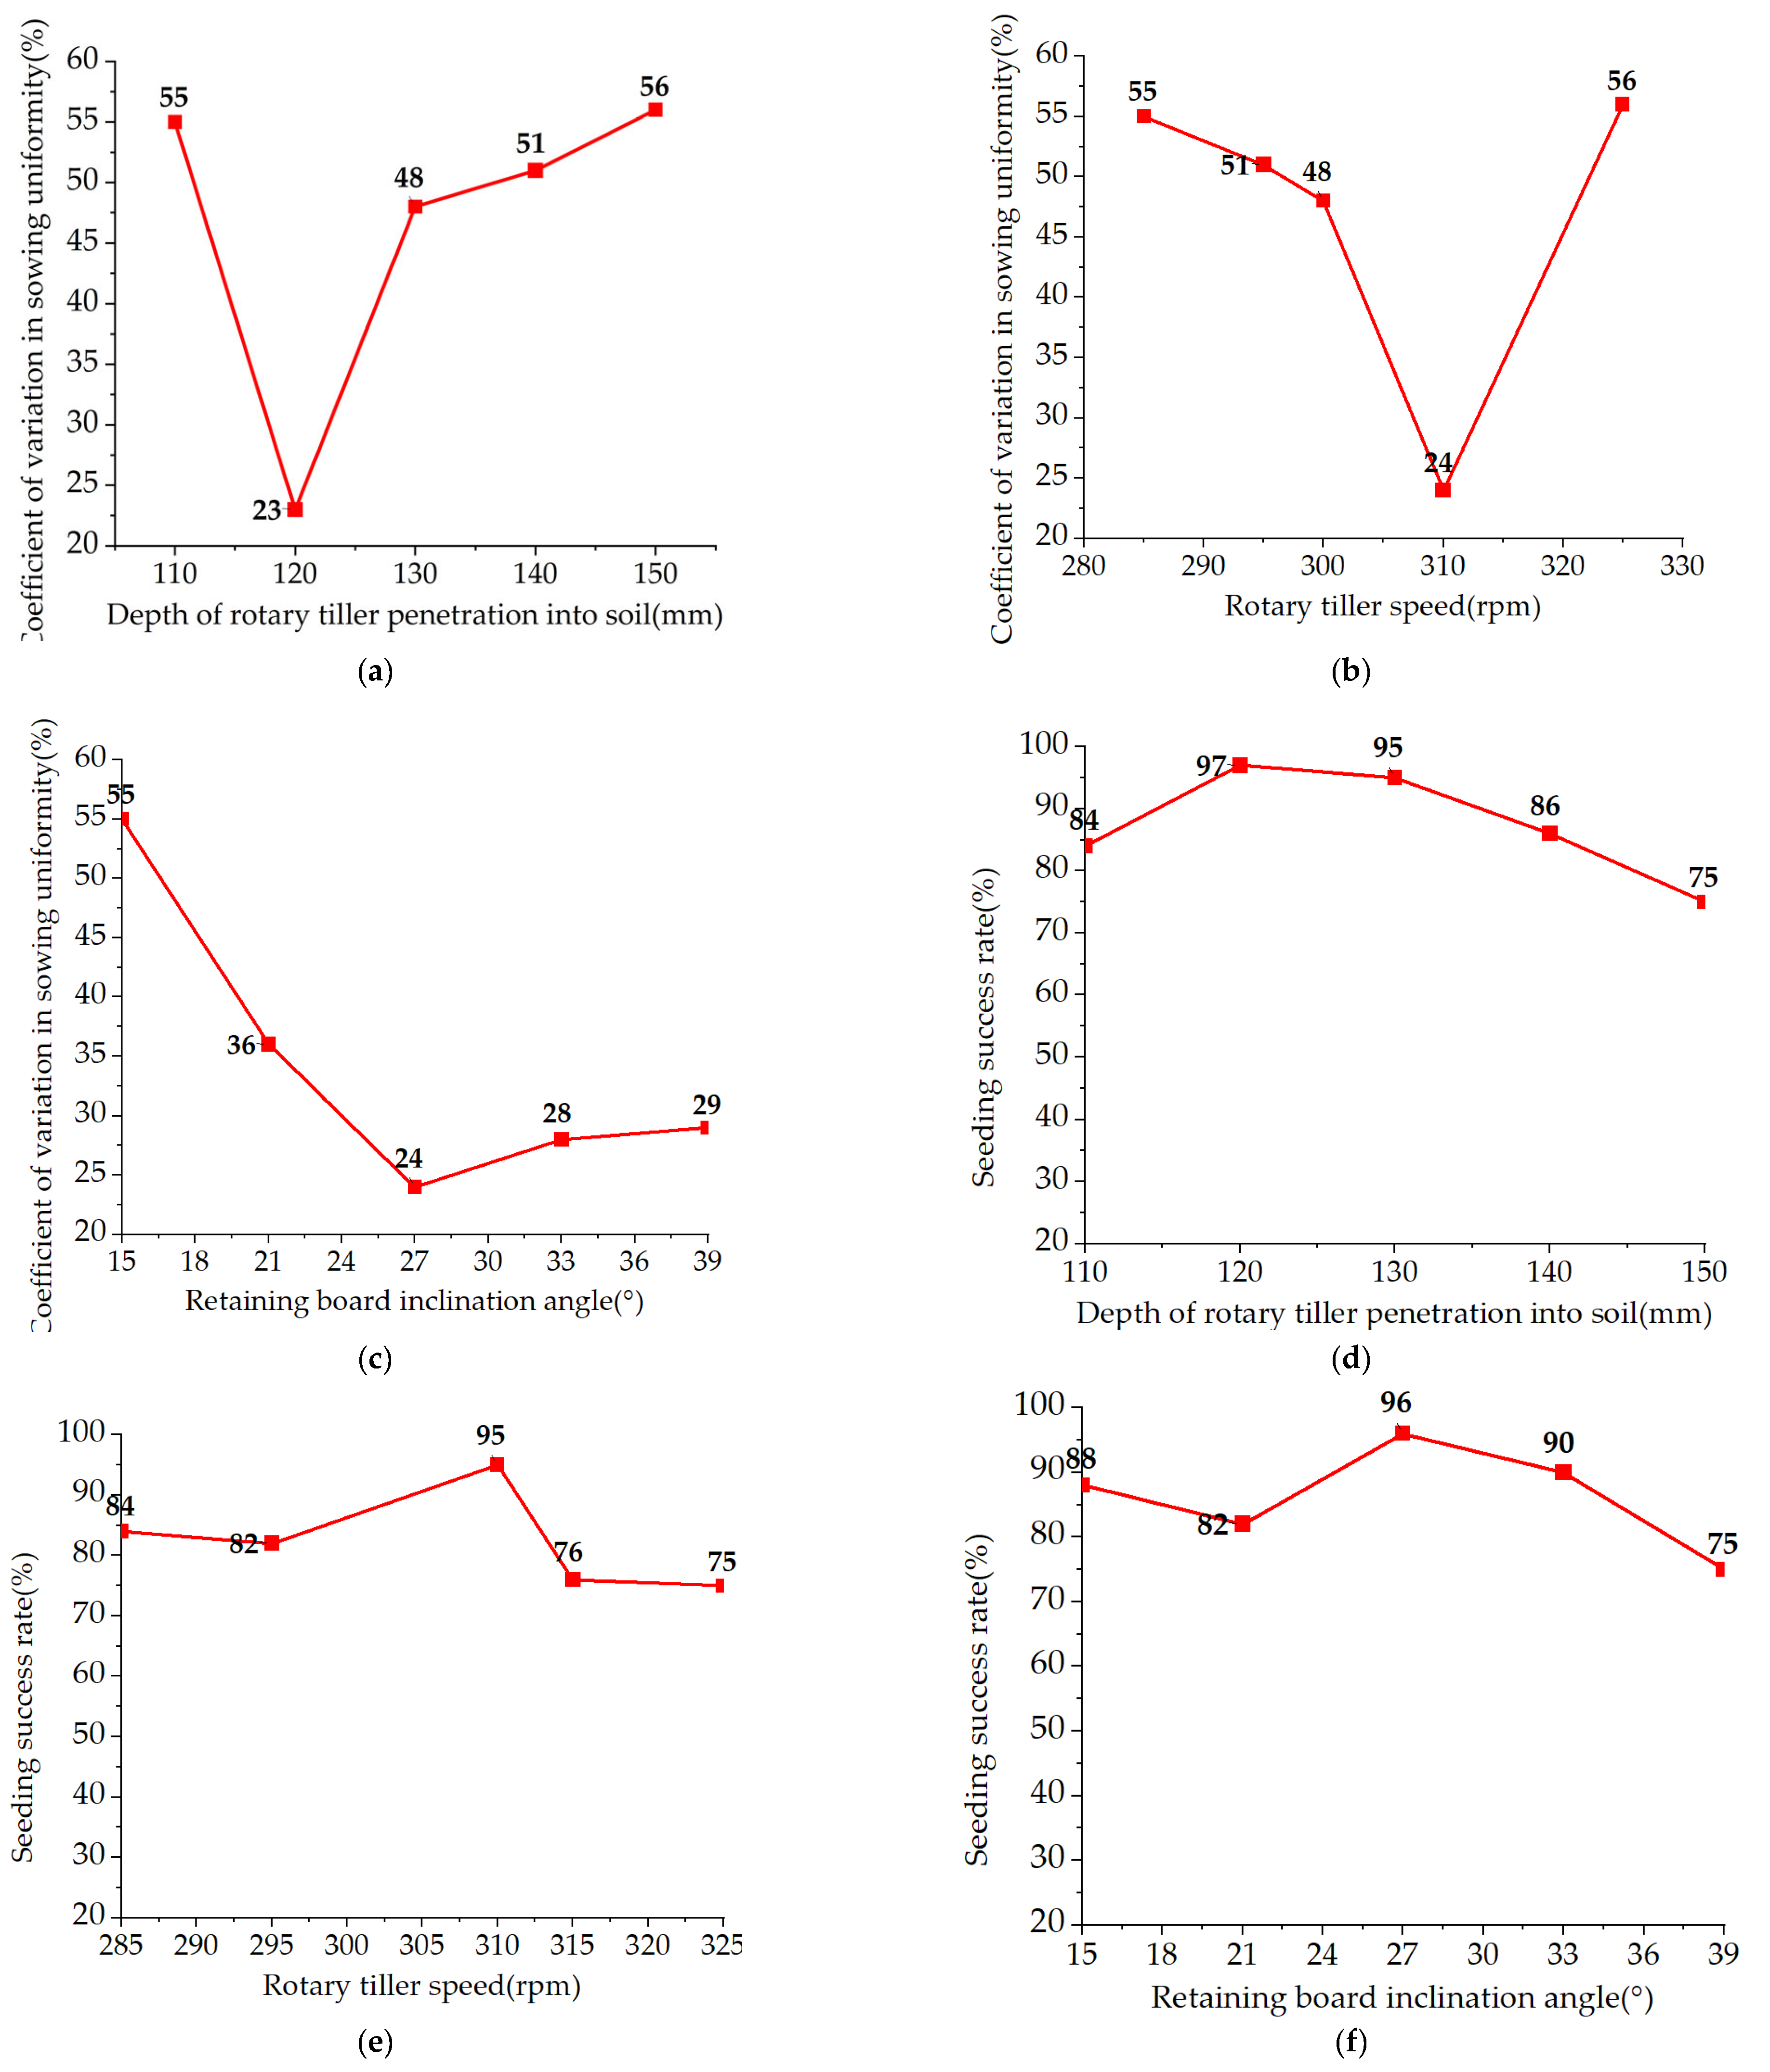
A single-factor experiment evaluated five tillage depths: 110, 120, 130, 140, and 150 mm. Rotary velocity (310 rpm) and baffle angle (27°) remained constant across treatments; all components were steel. At a 120 mm tillage depth, the seeding uniformity coefficient of variation (CV) was minimized to 19.3% (Figure 10a). Figure 10a illustrates tillage depth versus seeding uniformity CV. Seeding uniformity CV varied significantly with tillage depth (p < 0.05), directly impacting seed placement quality. Depth qualification rate peaked at 94.7% (Figure 10d) under a 120 mm tillage depth.

2.4.2. Relationship Between Rotary Speed and Evaluation Indicators

Rotary velocity treatments (285, 295, 310, 315, and 325 rpm) were tested in a randomized sequence. Tillage depth (120 mm) and baffle angle (27°) remained constant across treatments. At 310 rpm, the seeding uniformity coefficient of variation (CV) was minimized to 20.3%, while the depth qualification rate peaked at 93.7%. Figure 10b demonstrates rotary velocity versus seeding uniformity CV. Seeding uniformity CV varied significantly with rotary velocity (p < 0.01), directly affecting seed spatial distribution. Depth qualification rate maximized at 93.7% (Figure 10e) under a 120 mm tillage depth.

2.4.3. Relationship Between Baffle Inclination and Evaluation Indicators

Simulation tests were conducted using five different angles of inclination for the deflector plate: 15°, 21°, 27°, 33°, and 39°. In all five cases, the soil penetration depth and rotary tillage speed were set to 120 mm and 310 rpm, respectively. When the deflector plate angle was 27°, the coefficient of variation for seed distribution uniformity was measured to be 24.7%, and the seed depth qualification rate was 92.1%.
Figure 10c shows the relationship between the slope angle of the retaining plate and the coefficient of variation for seeding uniformity under different experimental conditions. It can be seen that the coefficient of variation for seeding uniformity varies with the slope angle of the retaining plate, exhibiting different seeding effects. When the slope angle of the retaining plate is 27°, the coefficient of variation for seeding uniformity is the lowest, at 18.3%. As shown in Figure 10f, the seeding pass rate reaches its highest value of 95.4% when the retaining plate inclination angle is 27°.

2.5. Orthogonal Test

2.5.1. Orthogonal Experimental Design

By analyzing the simulation test results of seeding performance under different combinations of structural parameters, including the penetration depth of the rotary tillage device, the rotational speed of the rotary tillage device, and the angle of the deflector plate, we optimized the structural parameter combinations. Orthogonal rotational combination experiments were conducted to analyze the effects of tillage device penetration depth, tillage speed, and deflector angle on the qualified seeding depth rate and the coefficient of variation for seeding uniformity. Based on the results of single-factor experiments, the following ranges were selected: penetration depth range of 100–150 mm, tillage device speed range of 285–325 rpm, and deflector angle range of 15–40°.
Based on the above parameters, orthogonal tests were developed, and the detailed programs are shown in Table 2, Table 3 and Table 4 below.

2.5.2. Results and Analysis of Orthogonal Tests for Sowing Depth Qualification

The application of Design–Expert software for regression analysis of orthogonal test results was used to determine the pattern of change in evaluation indicators under the three test factors, as shown in Table 2.
Table 2. Experimental factors and level coding.
Serial NumberA. Depth of Entry/mmB. Rotary Speed/rpmC. Baffle Inclination/(°)
112531027
212528540
310031040
410031015
512531027
612528515
710028527
815031015
912531027
1015032527
1112532540
1212532515
1312532527
1415032540
1515028527
1610028527
1712531027
According to the simulation test as well as the evaluation index testing method, the sowing depth pass rate is shown in Table 2 and Table 3. The simulation results were fitted to obtain the regression equation of sowing depth passability as follows (24):
H = 92.64 4.42 A 5.95 C 27.43 A 2 19.63 B 2 21.98 C 2
According to Table 3, the p value of the regression model for the sowing depth qualification rate is less than 0.01, indicating that the independent variable has a significant effect on the sowing depth qualification rate. Furthermore, the misfit value is greater than 0.05, indicating that the misfit term is not significant. For factor C less than 0.01, it indicates that factor C has a highly significant effect on the coefficient of variation for sowing uniformity. For factor A, the value is greater than 0.01 and less than 0.05, indicating that the significance is significantly lower than that of factor C. For factor B, the value is greater than 0.05. The explanation has no significant impact on the pass rate. The factors affecting the seed depth qualification rate, in descending order of significance, are the angle of the baffle plate, the tillage depth, and the tillage speed. When the tillage device enters the soil to a depth of 120 mm, the tillage speed is 310 rpm, and the angle of the baffle plate is 27°, the seed depth qualification rate is at its maximum of 95.3%.
Table 3. Indicator sowing depth qualification rate analysis.
TargetSource of VarianceSum of SquaresDegrees of FreedomMean SquareFSignificant Level, p
HA156.641156.647.960.0257
B13.52113.520.68700.4345
C283.221283.2214.390.0068
A23168.6013168.60161.00<0.0001
B21622.8811622.8882.46<0.0001
C22034.6512034.65103.39<0.0001
AB16.40116.400.83340.3916
AC44.72144.222.250.1775
BC6.00160.30500.5979
Model8126.629902.9645.88<0.0001
Residuals137.76719.68
Misfits105.27335.094.320.0957
Errors32.4948.12
Sums8284.3816
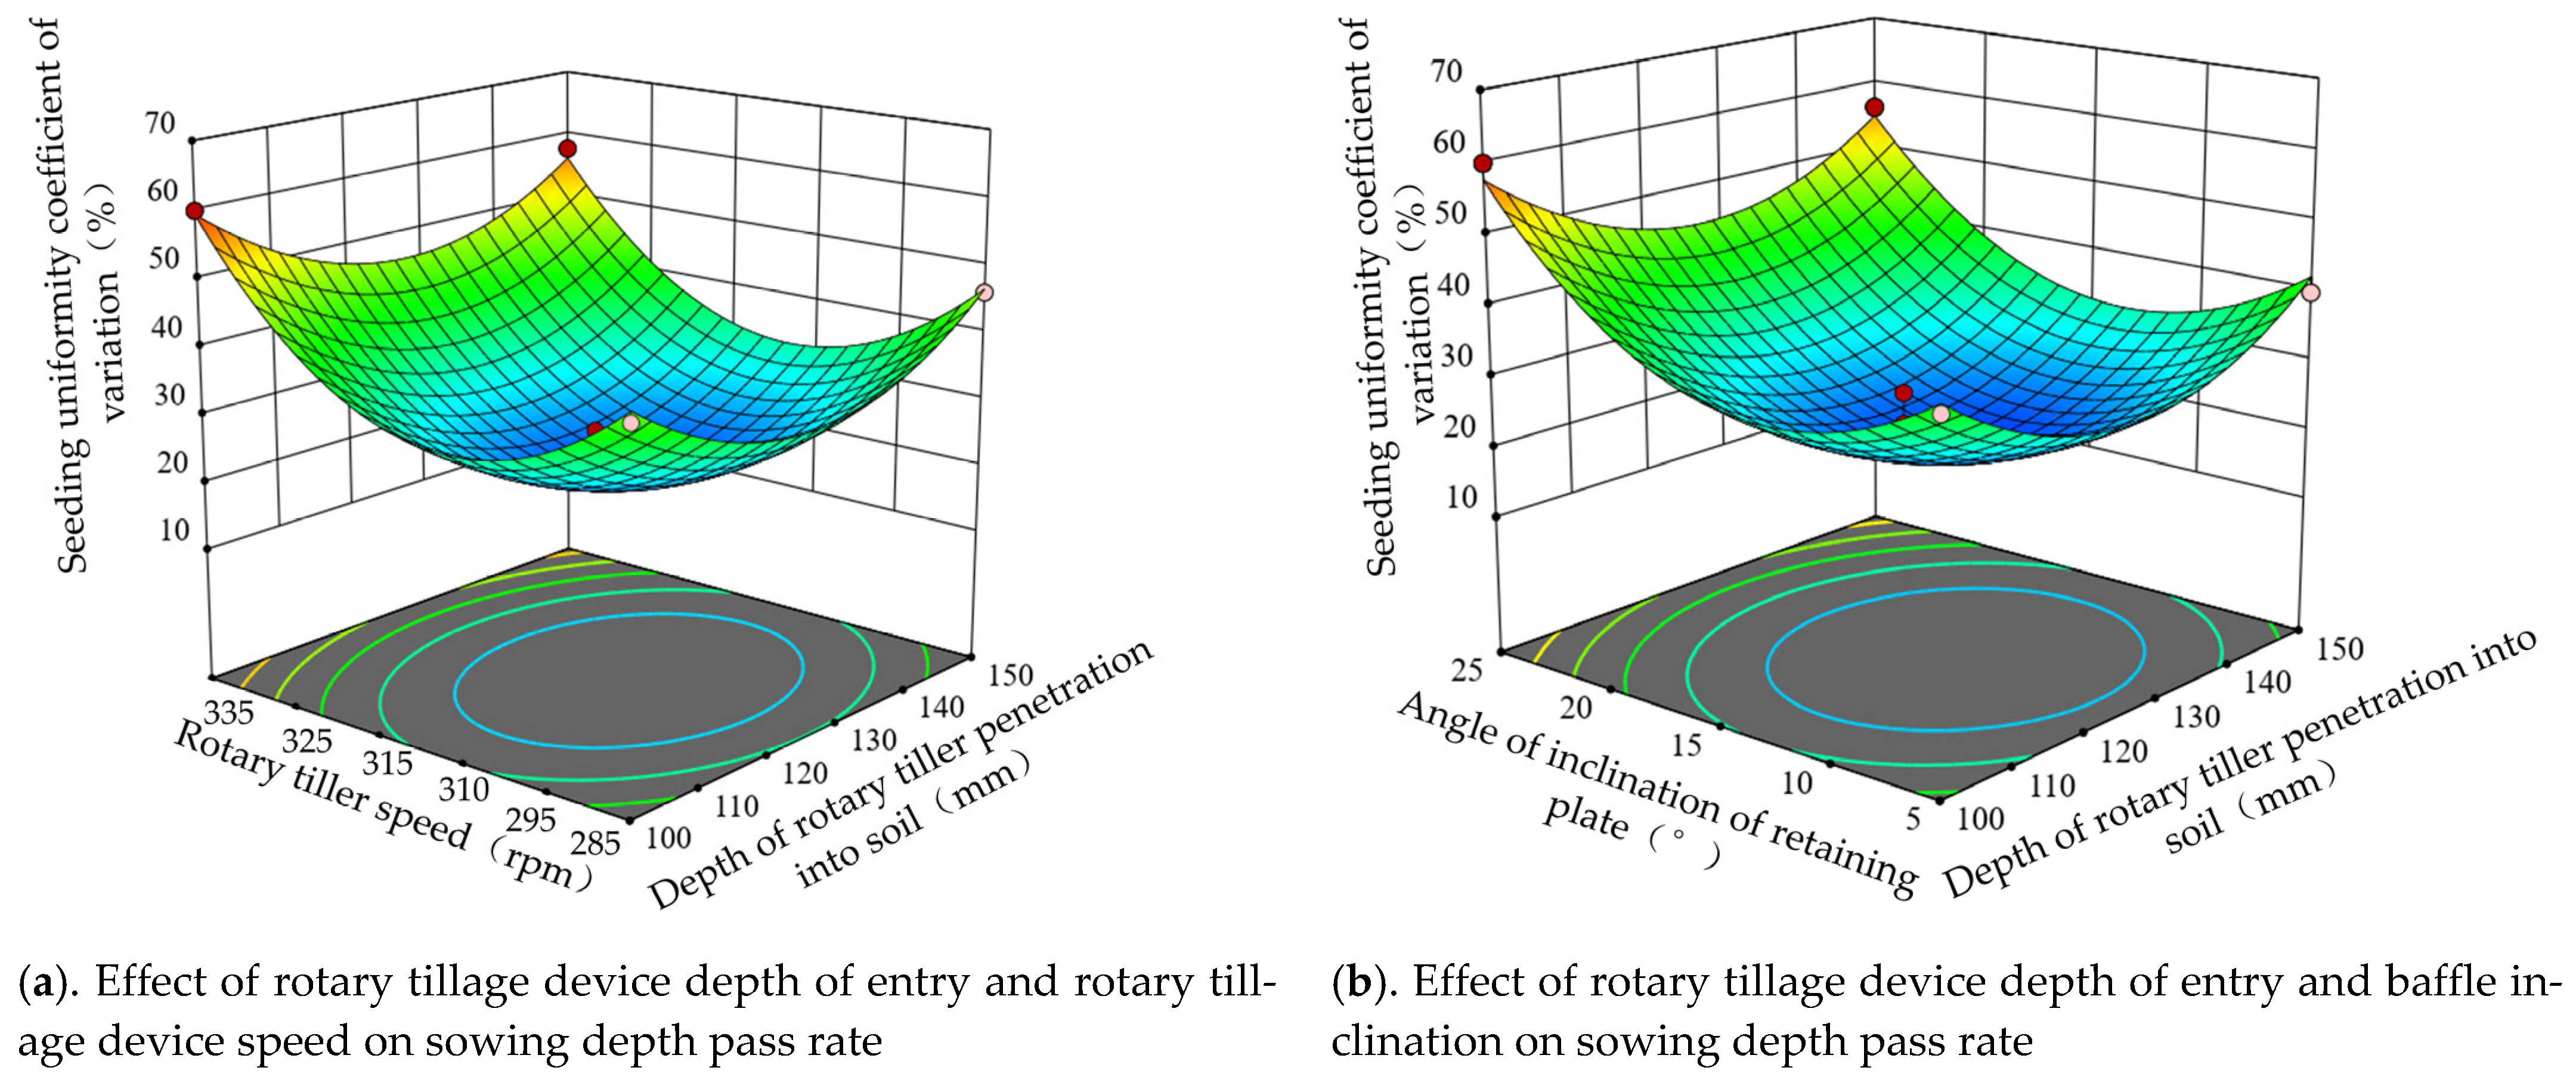
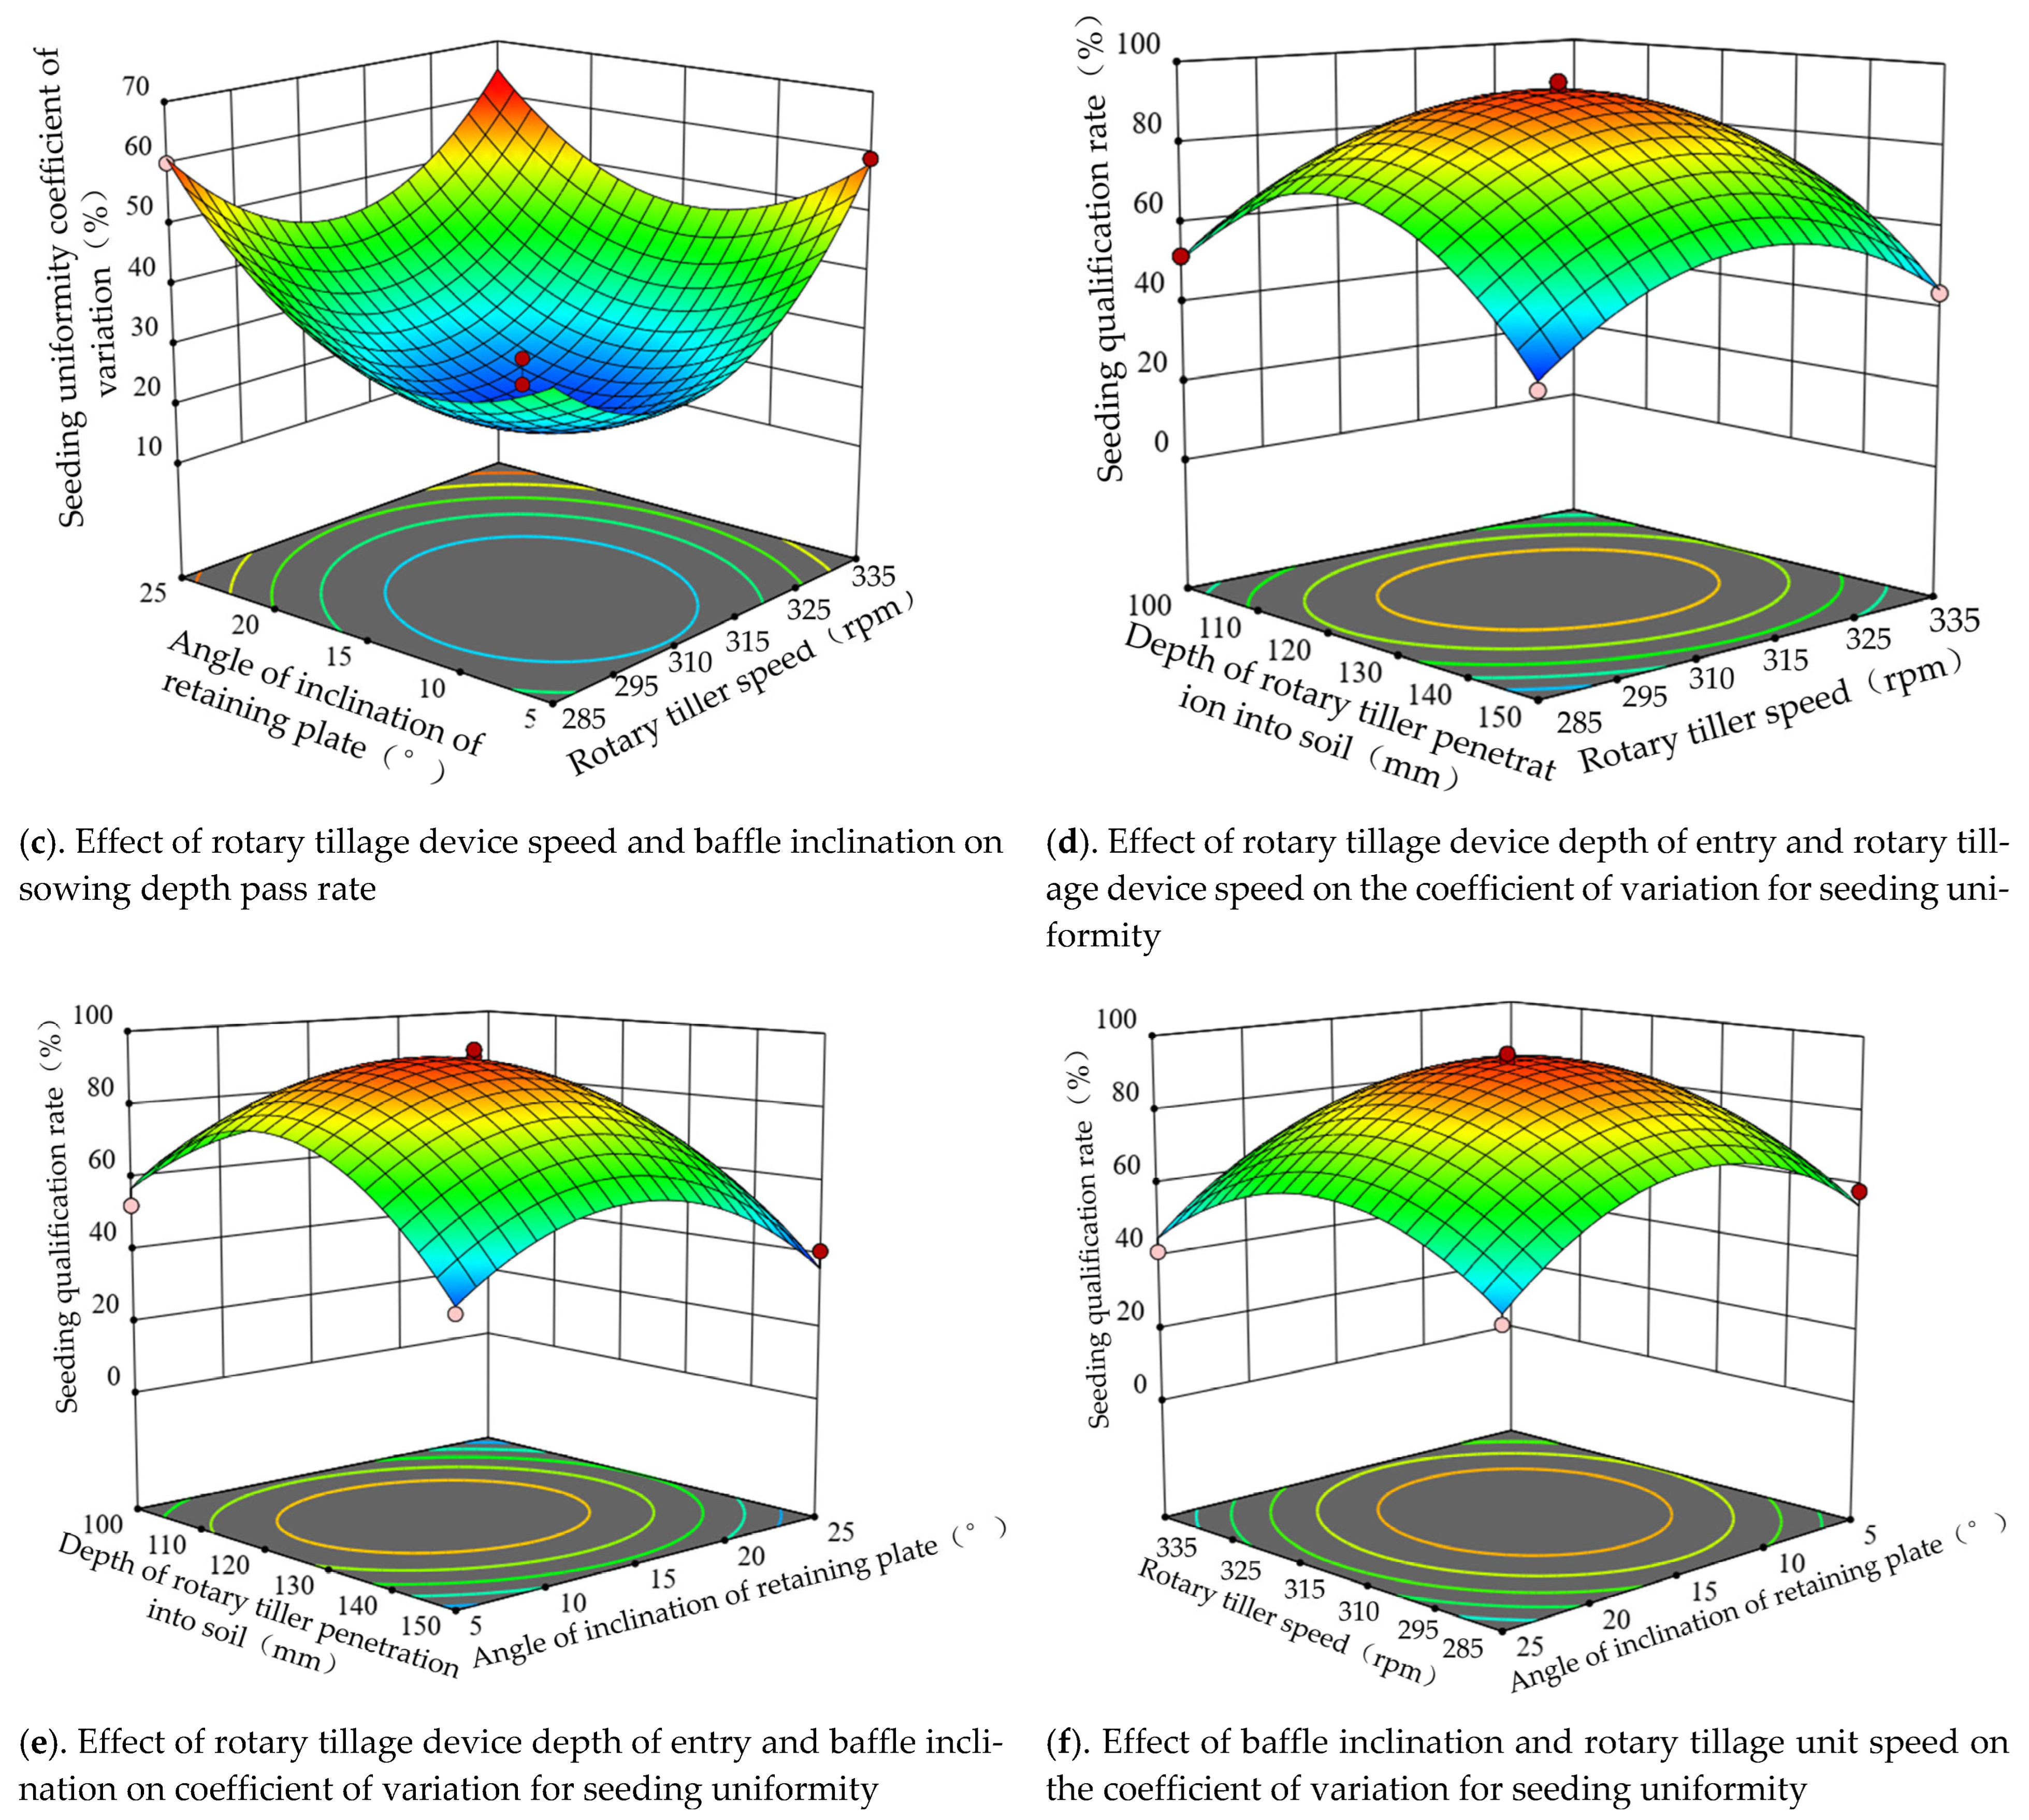
As shown in Figure 11, when any two of the following factors remain constant—tillage depth, tillage speed, and soil retention plate angle—the seed planting depth qualification rate increases and then decreases as the third factor changes. As can be seen from Figure 11d,f, the seedling establishment rate shows minimal variation with changes in rotary tillage speed, indicating that rotary tillage speed has a negligible effect. When the rotary tillage depth is 120 mm, the rotary tillage speed is 310 rpm, and the deflector angle is 27°, the maximum seedling establishment rate reaches 94.6%.

2.5.3. Results and Analysis of the Orthogonal Test of the Coefficient of Variation for Sowing Uniformity

The results of the coefficient of variation for sowing uniformity are shown in Table 2 and Table 4 according to the simulation test and the method of testing the evaluation index. The regression equation for sowing uniformity obtained by fitting the test results of the simulation is as follows (25):
v = 21.82 + 5.93 B + 7.26 C 3.95 B C + 11.73 A 2 + 18.30 B 2 + 15.48 C 2
As shown in Table 2 and Table 4, the factors affecting seed distribution uniformity in order of significance from highest to lowest are deflector angle, tillage speed, and tillage depth, with interactive effects. When the deflector angle is 27°, the tillage depth is 120 mm, and the tillage speed is 310 rpm, the coefficient of variation for seed distribution uniformity is minimized at 18.5%.
Table 4. Indicator coefficient of variation for sowing uniformity analysis.
TargetSource of VarianceSum of SquaresDegrees of FreedomMean SquareFSignificant Level p
vA2.1012.100.20240.6664
B280.851280.8527.060.0013
C421.951421.8540.650.0004
A2579.091579.0955.79<0.0001
B21410.4511410.45135.89<0.0001
C21008.6411008.6497.18<0.0001
AB5.7615.760.55490.4806
AC3.0613.060.29510.6039
BC62.41162.416.010.0440
Model4111.689456.8544.02<0.0001
Residuals72.66710.38
Misfits36.79312.211.370.3729
Errors35.8748.97
Sums4184.3416
As shown in Figure 11, when any two factors (rotary tillage speed and deflector angle) remain constant, the coefficient of variation for seeding uniformity decreases first and then increases as the level of the other factor changes. As can be seen from Figure 11a,b, the coefficient of variation for seeding uniformity fluctuates minimally with changes in the depth of the rotary tillage device, indicating that the depth of the rotary tillage device has no significant effect. As shown in Table 4, the p value of the regression model for the coefficient of variation for sowing uniformity is less than 0.01, indicating that the independent variables have a significant effect on the coefficient of variation for sowing uniformity. For factors B and C, the p values are both less than 0.01, indicating that their effects on the coefficient of variation for sowing uniformity are extremely significant. However, for factor A, the p value is greater than 0.05, with a significantly lower level of significance compared with B and C, indicating that its effect on the coefficient of variation for sowing uniformity is not significant. As shown in Figure 11, when the rotary tillage speed is 310 rpm, the deflector angle is 27°, and the soil penetration depth is 120 mm, the coefficient of variation for seed distribution uniformity is minimized to 20.1%.
Based on the analysis results of the comprehensive seeding qualification rate and the coefficient of variation for seeding uniformity, the optimal operating parameter combination for the rotary tillage device is as follows: rotary tillage blade speed of 310 rpm, rotary tillage blade penetration depth of 120 mm, and deflector angle of 27°.

2.5.4. Test Conditions and Sites

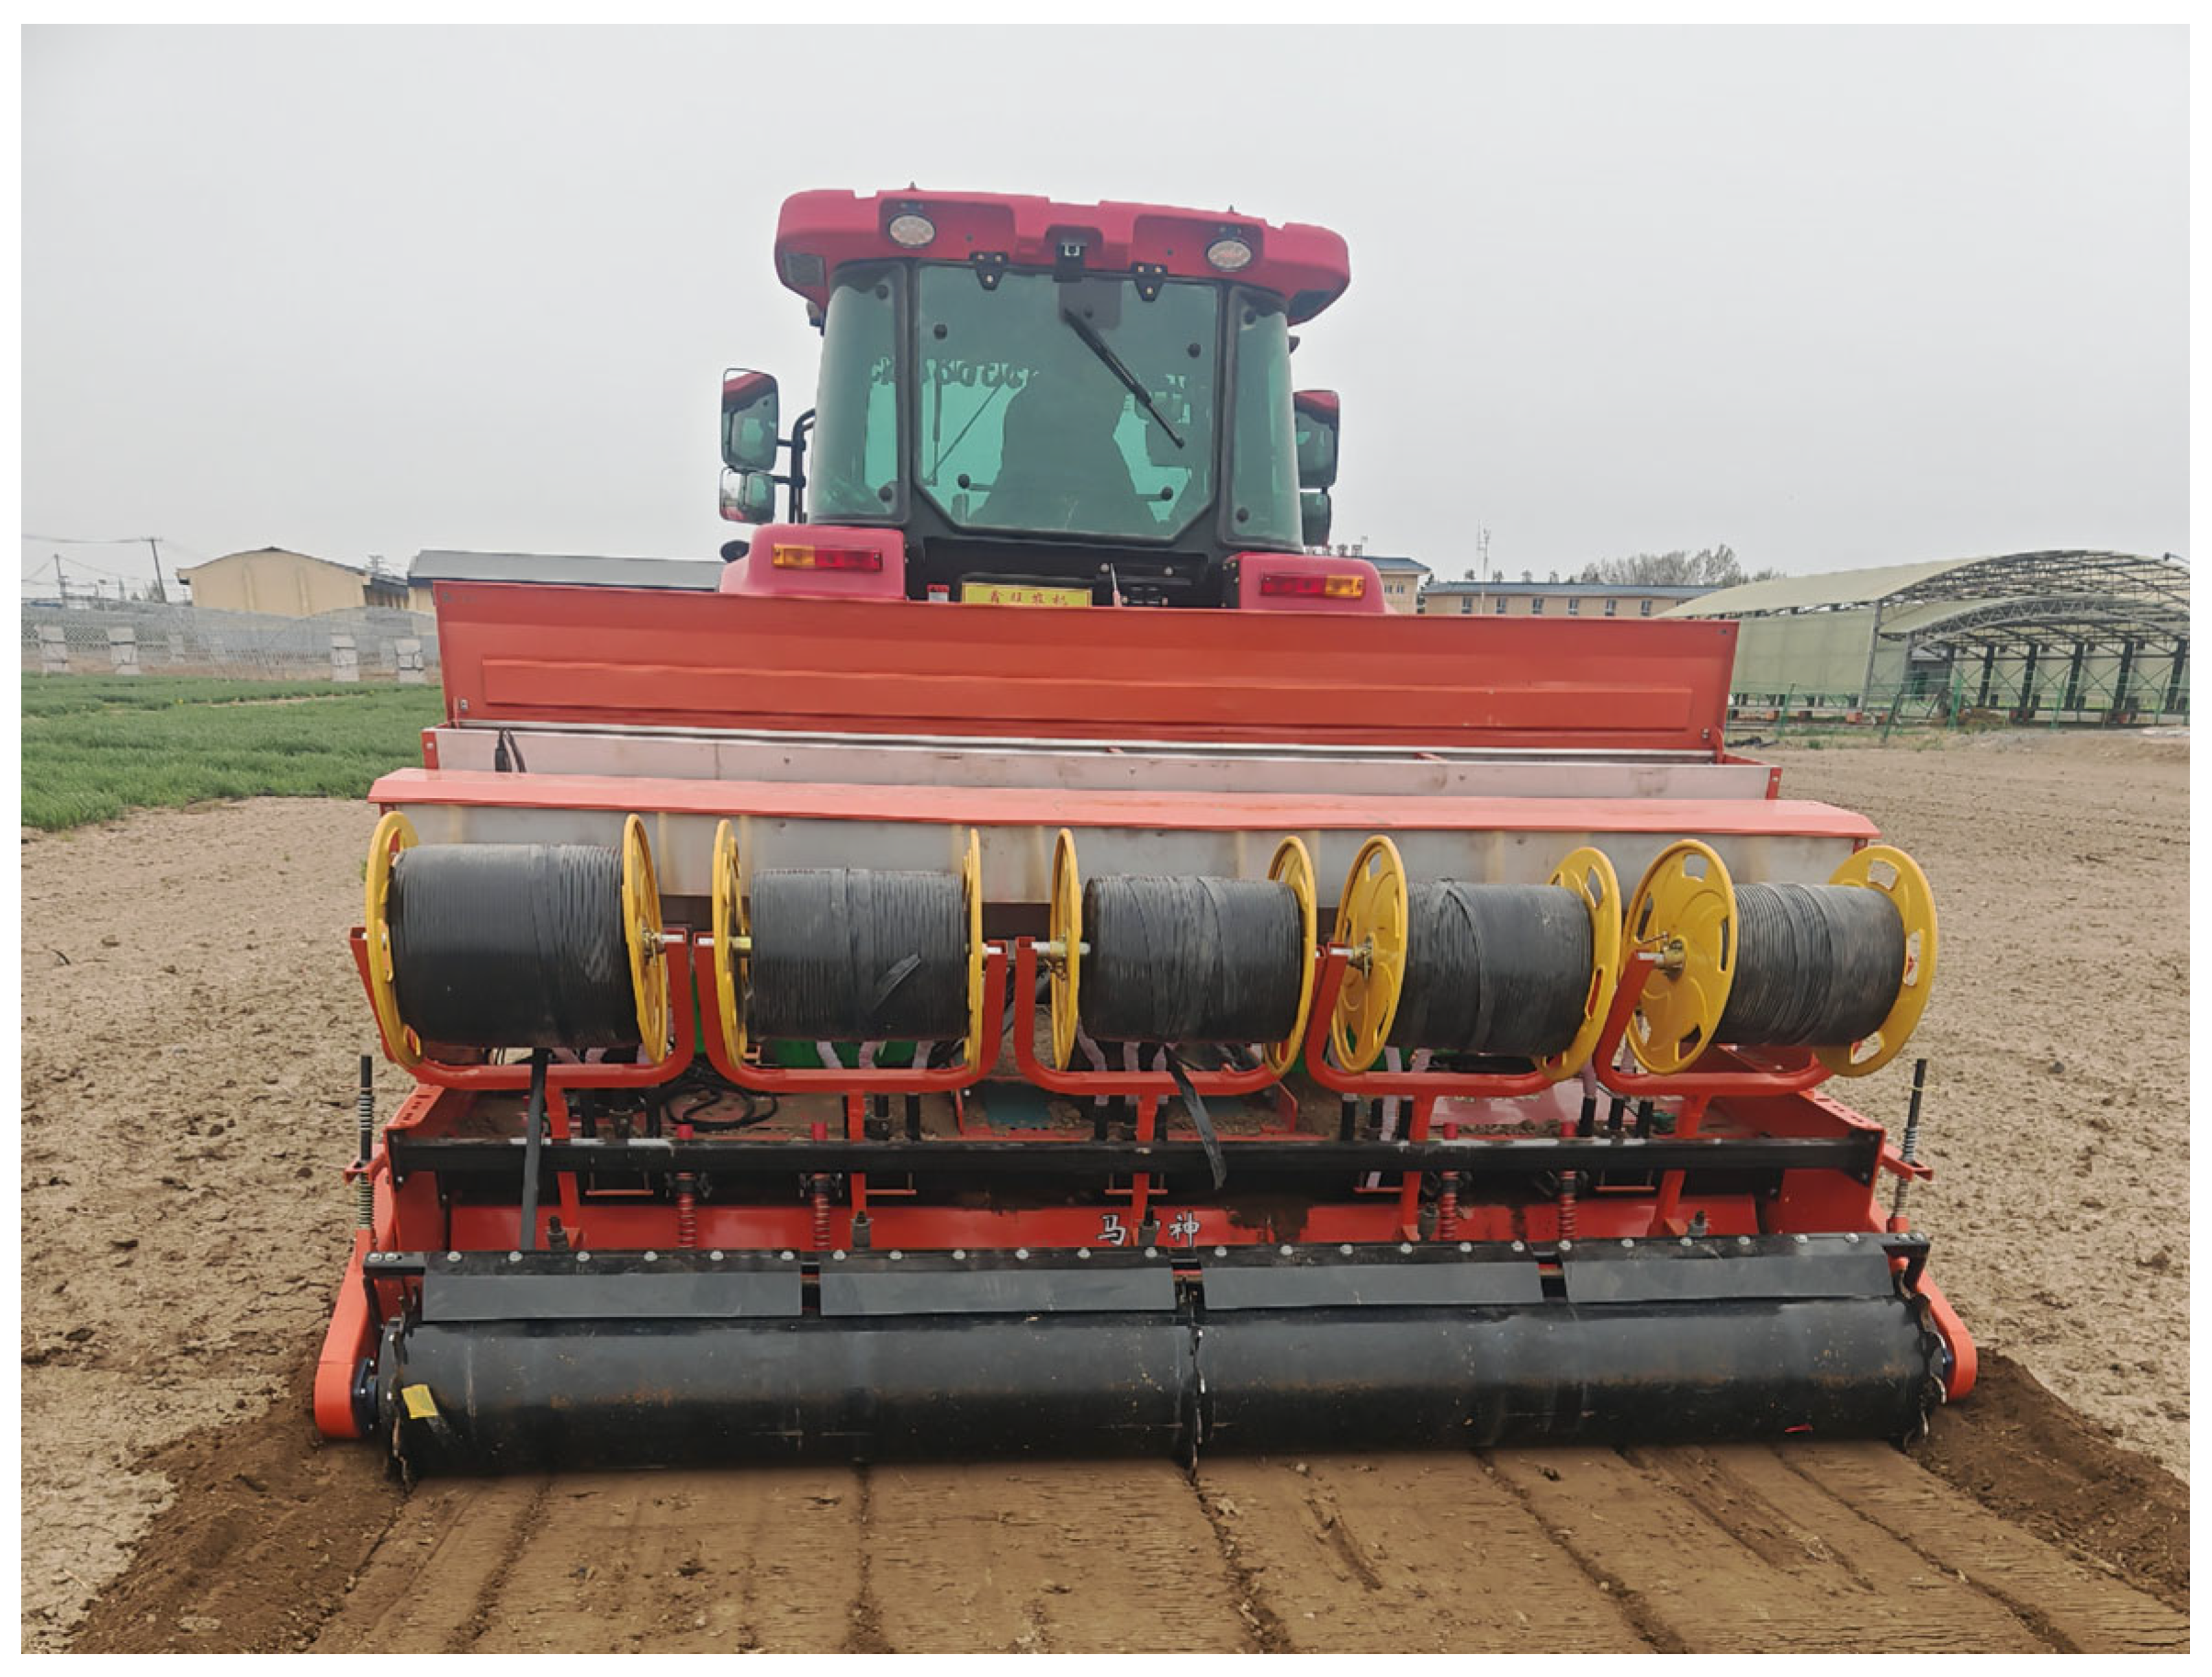
In order to validate the simulated one-way and orthogonal tests, field validation tests were carried out; these included validation tests of the coefficient of variation for sowing uniformity of wheat seeds and field validation tests of the sowing depth compliance rate. In order to verify the actual working performance of the front-mounted fertilizer tank-type wheat wide-width uniform seeder’s seeding depth device, the physical prototype was manufactured and assembled based on the optimal parameter results of the rotary tillage device and soil retaining plate obtained from the discrete element simulation test. Field performance trials were conducted at the Grain Experiment Station in Qitai County, Changji Hui Autonomous Prefecture, Xinjiang Uygur Autonomous Region. The trial site has a significantly arid climate with low precipitation. Figure 12 shows a field trial site with a wide-width uniform seeder for wheat.

2.5.5. Test Indicators and Methods

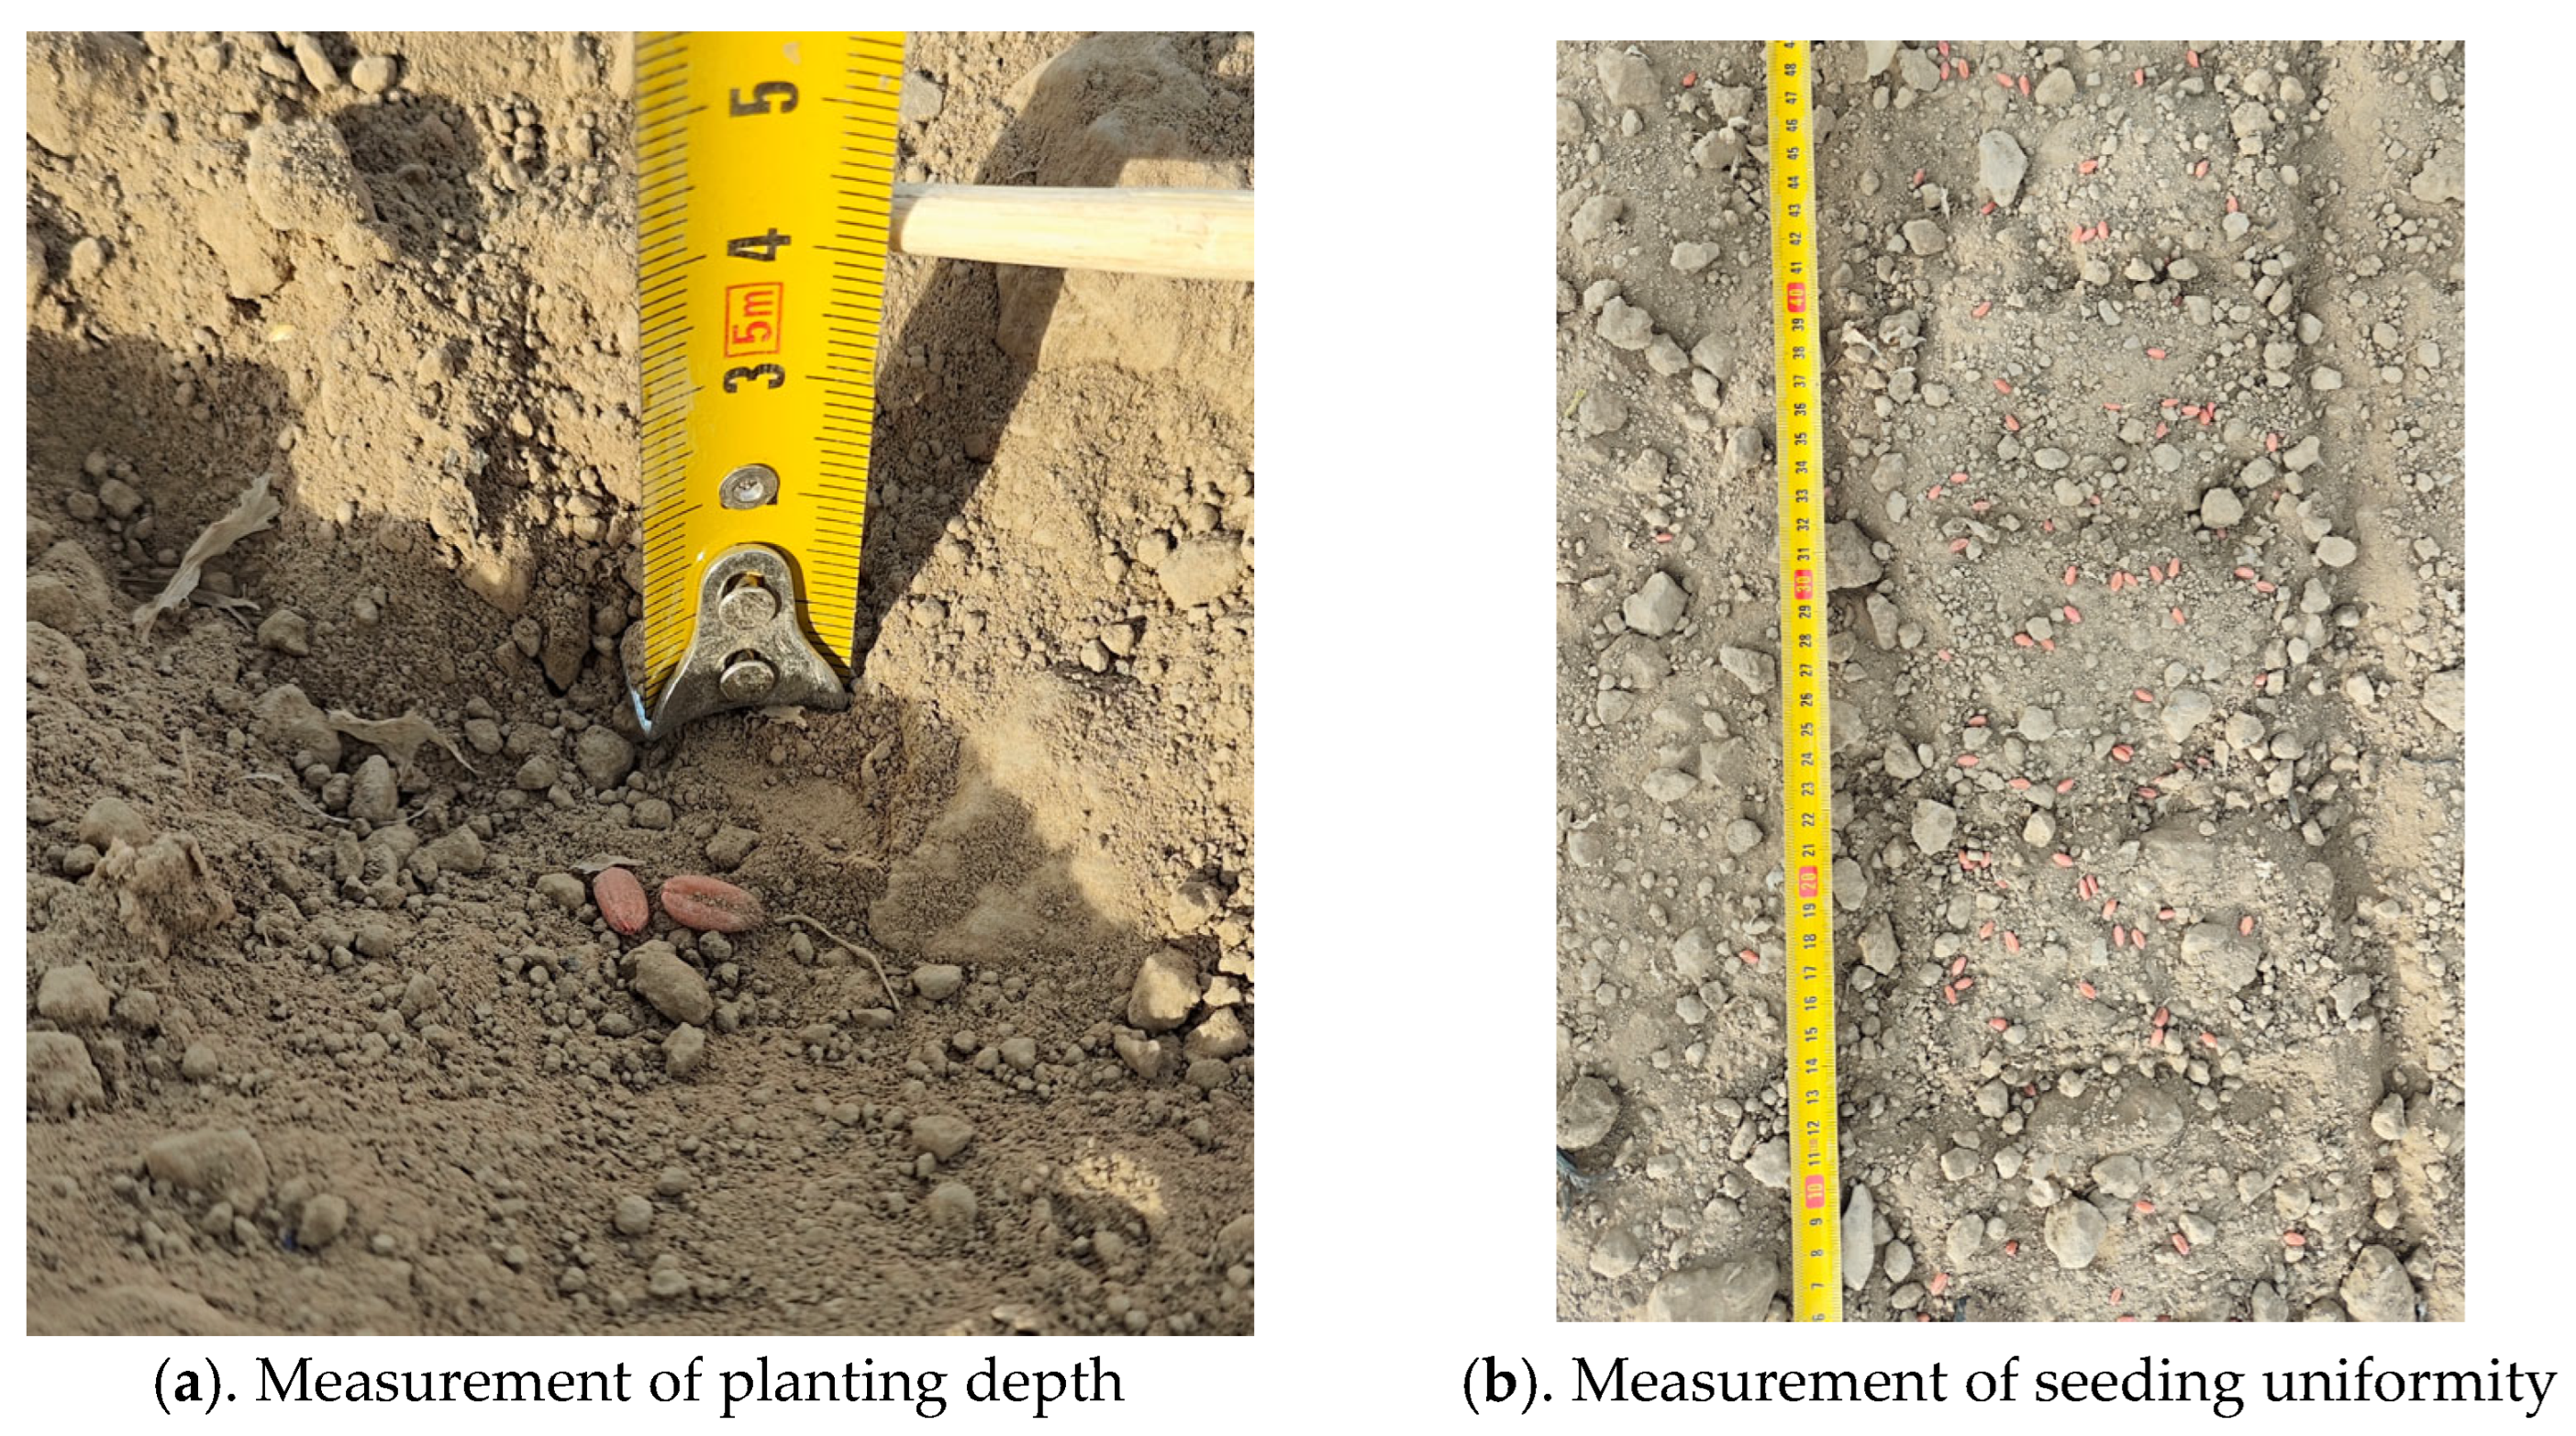
Field trial sowing performance testing standards refer to the agricultural machinery reference standards [31,32] rotary tiller seeders for field sowing trials. Using the five-point method, four test points are randomly selected within the diagonal length range of 1/4 to 1/8 of the test site, plus the midpoint of the diagonal. The coefficient of variation for seed distribution uniformity is determined using the five-point method to select measurement points. Each measurement point must have at least two rows, and each row of wheat must be randomly selected to be 0.5 m long. After sowing, the soil layer is dug up for measurement, and seed movement should be avoided. Seeding depth is determined using the five-point method. Each measurement point must have at least two rows, with five points randomly selected from each row. The soil layer above the seed row is cut open to measure the thickness of the soil layer covering the seed. The optimal parameter combination for the simulation test was selected, and the forward speed of the machine was set to 1 m/s. Data collection was conducted after the operation status stabilized. The coefficient of variation for sowing uniformity and the coefficient of variation for sowing depth were used as evaluation indicators for the performance of the wide-row uniform sowing machine with a pre-fertilizer hopper-type sowing depth device. Figure 13 below shows the field measurement diagram.

3. Results

3.1. Measurements of the Coefficient of Variation for Sowing Uniformity

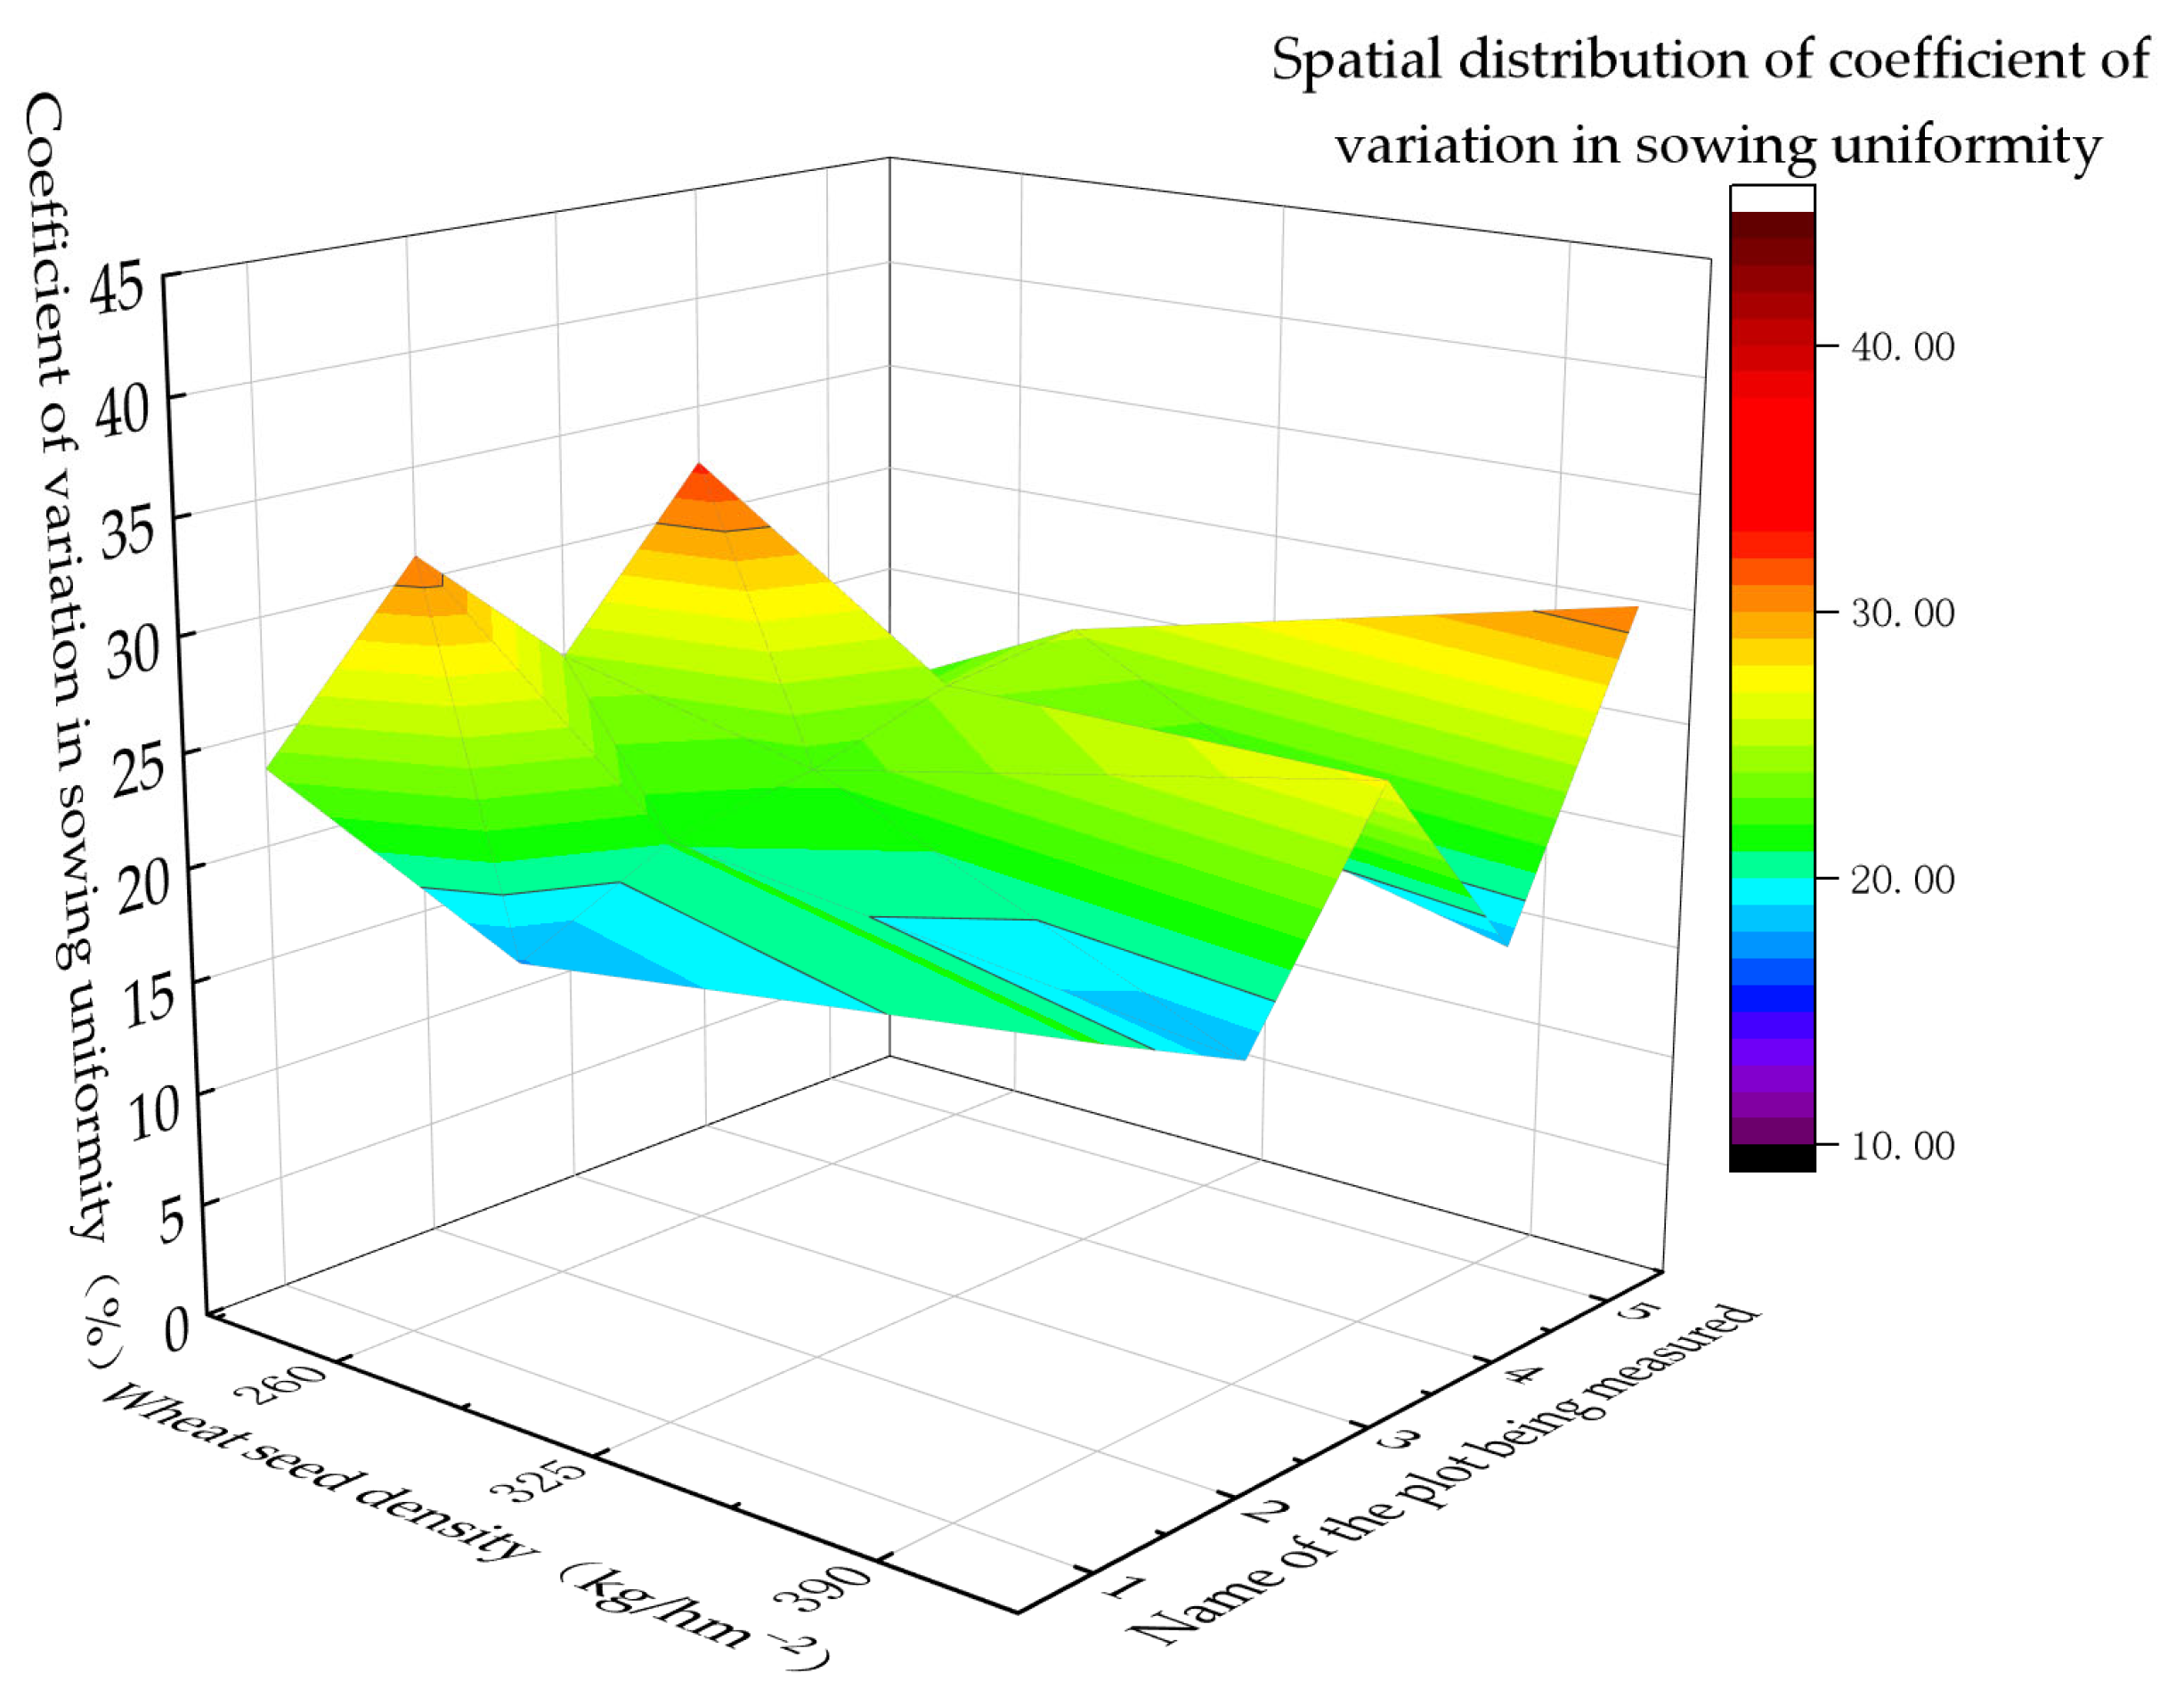
The coefficient of variation for sowing uniformity was based on the above criteria in accordance with the five-point method to select plots with a width of 1 m from the five points of the test plots for data collection, in which the coefficient of variation for sowing uniformity was measured as shown in Figure 14 below.

3.2. Measurement Results of Sowing Depth Pass Rate

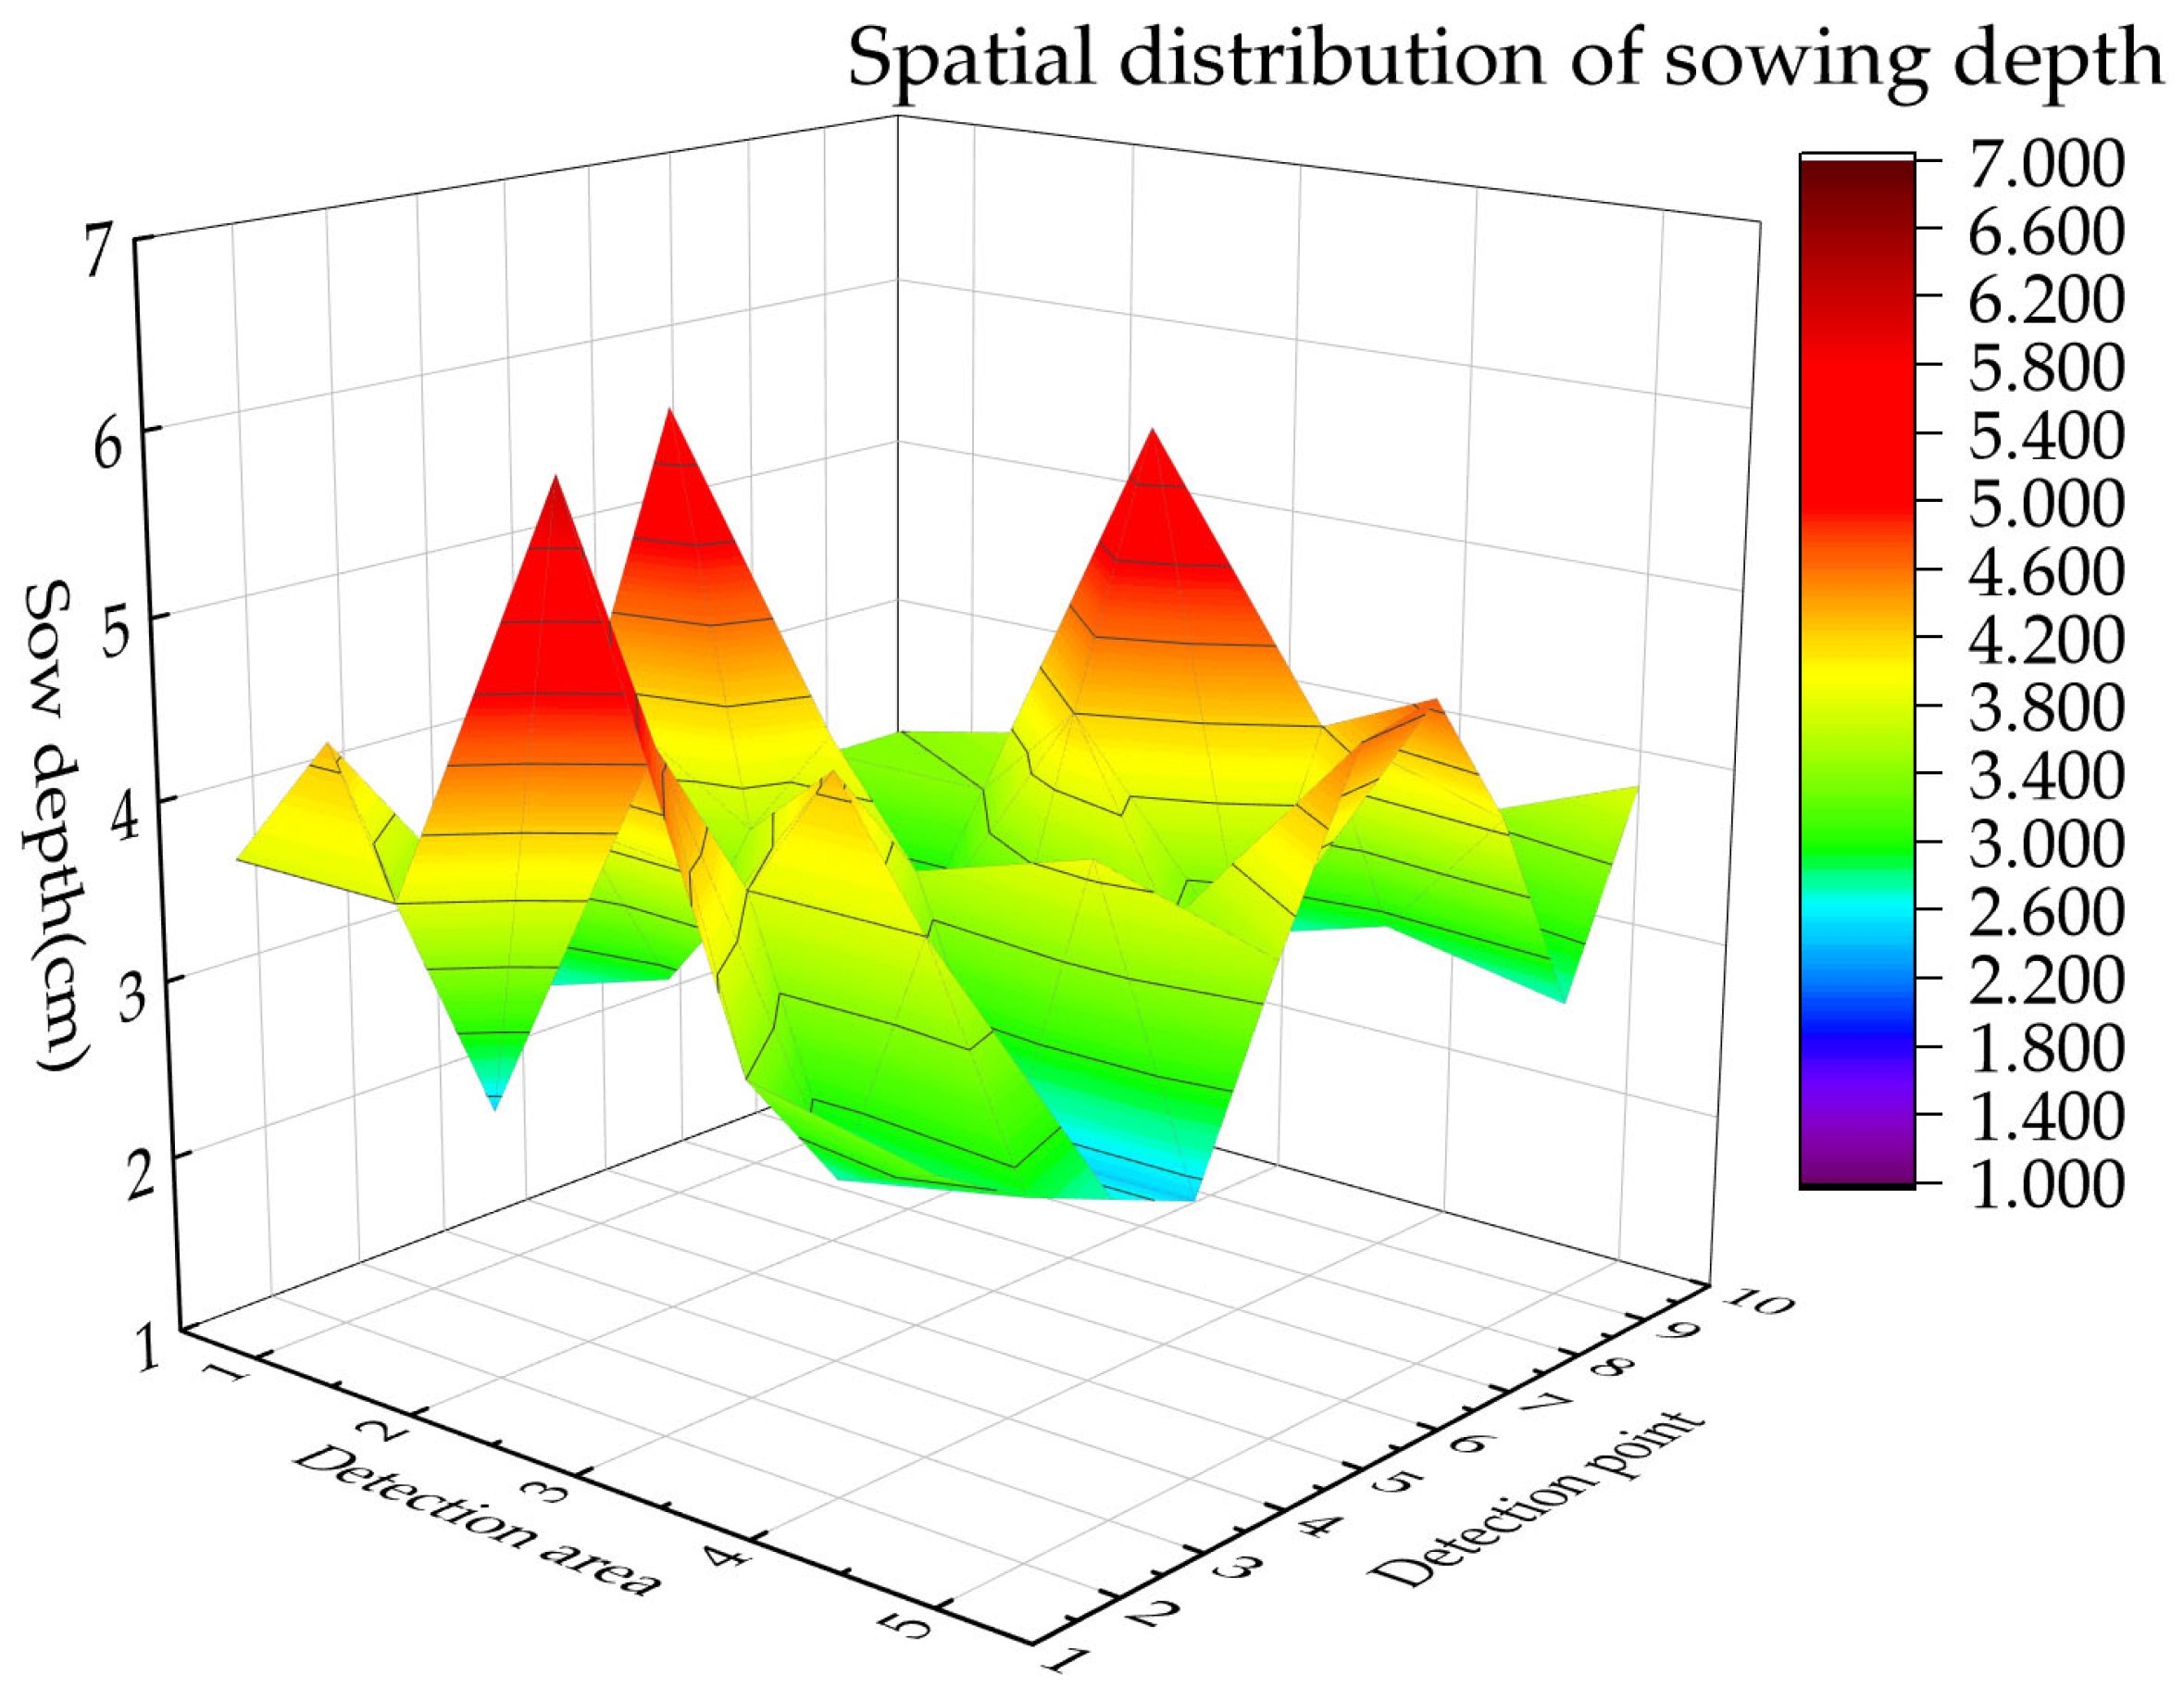
The sowing depth qualification rate is sampled by the five-point method, 10 points are selected for sowing depth measurement at each testing point, and the qualification range is 30 mm~50 mm according to the above standards and agronomic requirements. The following Figure 15 shows measurement data for the sowing depth qualification rate.
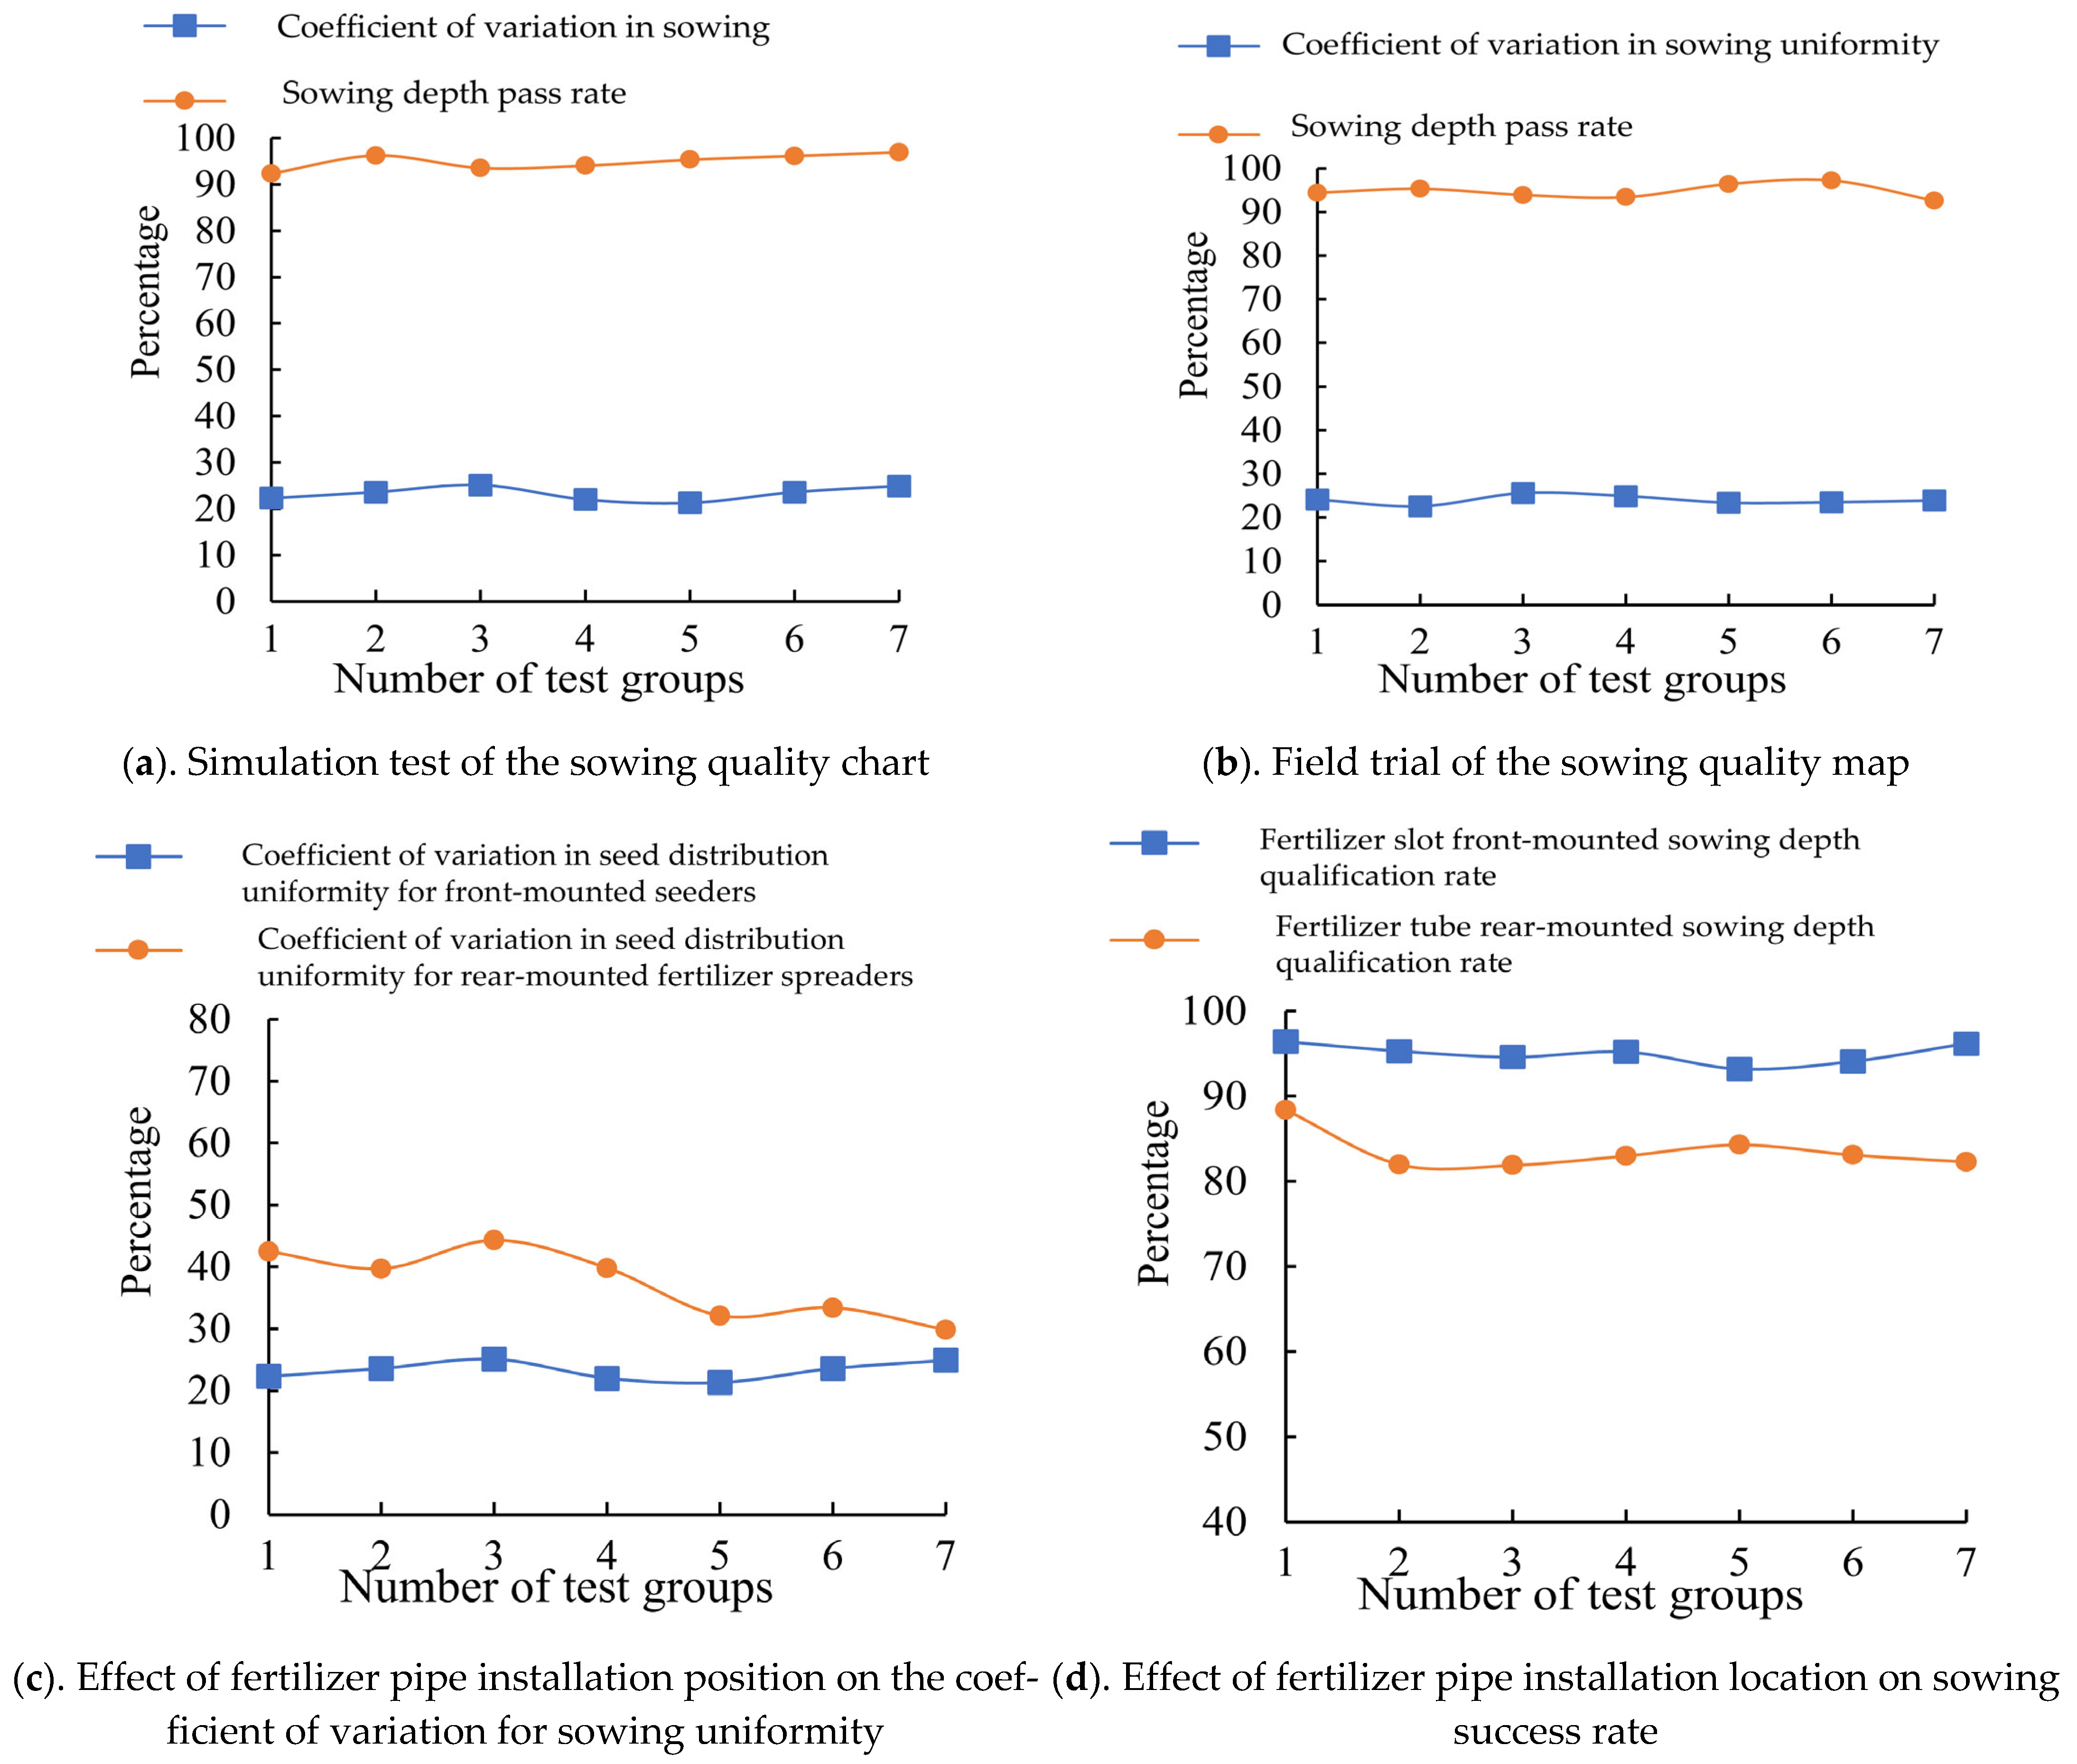
The above Figure 13b and Figure 14 show field test data for the Coefficient of variation in sowing uniformity. The above Figure 13a and Figure 15 show field test data for the sowing depth device, and the errors of the simulation test and the field validation test in the sowing depth qualification rate, as well as the coefficient of variation for sowing uniformity, are not greater than 5%.
The following are the average values of the seed depth qualification rate and the coefficient of variation for seed distribution uniformity for each group in the repeated experiments conducted in the simulation tests and field tests. Each group consisted of 10 measurements in both the simulation tests and field tests, and data from the 10 measurements were summarized to obtain the average value. A total of seven groups were tested.
Based on experimental data obtained from field trials and referring to Equations (20) to (23), the seeding success rate of wheat seed sowing depth and the coefficient of variation for sowing uniformity were calculated. The simulation test data results were compared, as shown in Figure 16. Under various seeding rates, the average coefficient of variation for seeding uniformity and the average seeding depth qualification rate were measured to be 21.4% and 96.2%, respectively. Under various seeding rates, the average coefficient of variation for seeding uniformity and the average seeding depth qualification rate measured in field trials were 23.7% and 95.2%, respectively. The deviation between simulation trials and bench trials was less than 5%, indicating that the simulation trial results were basically consistent with the field trial results.
The results of optimizing the structural parameters of the sowing depth device using the discrete element method are reliable.

4. Discussion

This study develops a seed depth adjustment device for wide-row uniform wheat seeders that enhances operational stability while simplifying installation and calibration. The design replaces traditional furrow applicators by implementing sequential fertilization–tillage operations, improving upon Model [10] through front-mounted hopper placement, which eliminates seed displacement from tube interference during sowing. This configuration enables homogeneous fertilizer–soil integration without compromising seed placement, resolving trench fertilization issues affecting seed quality while addressing inconsistent sowing depth and poor emergence. Unlike Model [16], which depends solely on tillage for depth consistency, our approach incorporates forward-hopper positioning with parameter optimization to enhance planting quality. This facilitated determination of optimal operating parameters, maximizing efficiency while resolving depth inconsistency and emergence deficiencies, achieving > 92% depth qualification rates and <25% uniformity coefficients in wide-row systems. Field validation (Figure 16) confirmed depth qualification rates exceeding 92% with uniformity coefficients below 25%. Relative to conventional systems, uniformity improved by 5–10 percentage points and qualification rates by 4–10 percentage points.
This study focuses mainly on optimizing the combination of operating parameters for rotary tillage equipment and soil retention plates to improve sowing quality. Through theoretical analysis and simulation experiments of rotary tillage equipment, ideal soil throwing effects were achieved. Through the structural design of the soil retention board and control of its tilt angle, the process of soil fragmentation and leveling after sowing is ensured, making the process simple and convenient. This not only reduces costs but also achieves excellent results. Based on previous research findings, although domestic and international researchers have completely eliminated the influence of traditional models by changing the structural components and types of wide-row uniform seeders for wheat, this study adopted a fertilization method that ensures that fertilization and seeding operations do not interfere with each other, thereby avoiding problems such as reduced seeding quality and yield caused by mechanical interference. In addition, this paper analyzes the component structure and types of wide-row uniform wheat seeders and proposes corresponding improvement measures, with a focus on a detailed analysis of the rotary tillage device and soil retention plate. By comparing multiple parameters, the efficiency of wide-row uniform wheat seeders has been effectively improved. However, it is still very difficult to improve planting accuracy solely through mechanical means. In the future, control systems will be needed to achieve more precise wheat planting.
The detailed list of expressions in the above text can be found in the Supplementary Materials.

5. Conclusions

(1) Aligned with wide-row agronomic requirements, this study develops a front-mounted fertilizer hopper–rotary tillage depth–sowing device, theoretically determining fundamental structural parameters for tillage blades and retention plates, establishing a predictive model with soil penetration depth, rotational speed, and retention plate angle as dependent variables.
(2) An EDEM-based simulation platform replicated the wide-row depth-sowing process, employing single-factor tests with seeding uniformity coefficient of variation CV and depth qualification rate as performance metrics. Optimal performance occurred at penetration depths of 110–150 mm, rotational speeds of 285–325 rpm, and retention plate angles of 15–40°, with depth qualification rates > 90% and uniformity CV < 25%.
(3) Through orthogonal rotation combination experiments, regression equations were established for three factors—tiller penetration depth, tiller speed, and soil retention plate inclination angle—and their effects on seed distribution uniformity coefficient and seed depth qualification rate. The results showed that the primary and secondary factors affecting the seed distribution uniformity coefficient were soil retention plate inclination angle, tiller speed, and tiller penetration depth. The primary and secondary factors influencing the seed depth qualification rate are the angle of the soil retention plate, the depth of penetration of the rotary tillage device, and the rotational speed of the rotary tillage device. When the angle of the soil retention plate, the depth of penetration of the rotary tillage device, and the rotational speed of the rotary tillage device are 27°, 120 mm, and 310 rpm, respectively, the seed depth device achieves optimal seeding performance.
(4) Field validation tests were conducted to verify the final results of the structural parameter optimization of the seeding depth device. The results showed that under multiple trials, the average coefficient of variation for seeding uniformity and the average seeding depth qualification rate for wheat seeds in various seeding rate field trials were 21.4% and 92.9%, respectively. The average deviation between the two indicators from the simulation trials and the two indicators from the field trials was less than 3.16%. A trial deviation of less than 5% indicates that the structural parameter optimization of the seeding depth device is reliable and can meet the requirements of the wheat wide-row planting agronomic model.
(5) This paper focuses on parameter optimization of a wide-width agricultural tillage machine for wheat rotary tillage seeding. Compared with the pre-optimization stage, the coefficient of variation for seed distribution uniformity has decreased by more than seven percentage points. The seed depth qualification rate increased by five percentage points compared with before optimization. Additionally, wide-row seeders offer advantages such as higher seeding efficiency and higher yield during harvest compared with conventional models. However, they also have disadvantages, such as poor terrain adaptability and sensitivity to soil conditions. To achieve further development, future efforts should focus on breakthroughs in cutting-edge fields such as multi-sensor fusion control and digital twin maintenance, to establish a smart seeding technology system and promote the development of wide-row uniform seeding machines toward precision, intelligence, and environmental sustainability.

Supplementary Materials

The following supporting information can be downloaded at: https://www.mdpi.com/article/10.3390/agriculture15171800/s1, Table S1, Variable table in the text.

Author Contributions

Conceptualization, L.Y. and Z.S.; methodology, Z.S.; software, L.Y.; validation, L.Y., Y.J. and S.B.; formal analysis, J.Z.; investigation, Y.X.; resources, X.Z.; data curation, L.Y.; writing—original draft preparation, L.Y.; writing—review and editing, Z.S.; visualization, X.Z.; supervision, Z.S.; project administration, Y.X.; funding acquisition, Z.S. All authors have read and agreed to the published version of the manuscript.

Funding

This research was funded by Major science and technology projects of Xinjiang Uygur Autonomous Region, grant number 2022A02003-3; and Xinjiang Production and Construction Corps key scientific and technological research projects.

Data Availability Statement

Data are contained within the article. The data presented in this study can be requested from the authors.

Conflicts of Interest

Author Shenghe Bai was employed by the company China Academy of Agricultural Mechanization Sciences Group Co., Ltd. The remaining authors declare that the research was conducted in the absence of any commercial or financial relationships that could be construed as a potential conflict of interest.

References

  1. Liu, L. Current Status and Outlook for Scientific and Technological Innovation in China’s Wheat Industry. J. Cold-Arid Agric. Sci. 2024, 3, 491–494. [Google Scholar]
  2. Lu, C. The Current Status of Wheat Production in China and Considerations for Improving Wheat Production Capacity. J. South. Agric. 2021, 15, 177–178. [Google Scholar]
  3. Wang, H.; Cao, R.; Huang, X. Study on the physiological indicators and yield of different varieties of spring wheat in response to moisture. J. Irrig. Drain. 2024, 43, 1–10. [Google Scholar]
  4. Shi, F. Analysis of the high yield, stable yield, and adaptability of the dryland winter wheat variety Jinmai 100. Mod. Agric. Sci. Technol. 2024, 19, 1–4. [Google Scholar]
  5. Zhao, S.; Yang, X.; Li, L. Hyperspectral monitoring of nitrogen nutritional indices in wheat leaves under water-nitrogen coupling effect. J. Hebei Agric. Univ. 2025, 1–11. [Google Scholar]
  6. Xi, T.; Zhao, H.; Liang, Z.; Xie, S.; Liu, Q.; Xue, J. The effect of combined sowing methods on wheat population and yield formation. Chin. Agric. Sci. Bull. 2014, 30, 185–188. [Google Scholar]
  7. Pei, Y. Advantages and Key Points of High-Yield Wheat Wide-Row Uniform Seeding Technology. Agric. Sci. Eng. China 2024, 36, 93–96. [Google Scholar]
  8. Chen, G.; Cheng, H.; Fan, H.; Fan, Z.; Hu, F.; Yin, W. Study on the Adaptability of Spring Wheat Yields in Oasis Irrigation Areas to Reduced Water and Nitrogen Use under Wide-Row Uniform Seeding and Traditional Row Seeding. Sci. Agric. Sin. 2023, 56, 2461–2473. [Google Scholar]
  9. Li, S. Key Technologies for Wide-Row Uniform Seeding of Wheat. Henan Agric. 2021, 13, 46. [Google Scholar]
  10. Zhao, P.; Ju, X.; Yang, P.; Zheng, Z.; Huang, Y.; Gao, X.; Shi, J. Design and Experiment of a Pre-placed Fertilizer Pipe Wheat Wide Seedling Rotary Tiller Fertilization Seeding Machine. Trans. Chin. Soc. Agric. Eng. 2024, 40, 12–21. [Google Scholar]
  11. Ye, R.; Ma, X.; Zhao, J.; Liao, J.; Liu, X.; Xi, L.; Su, G. Optimization and Design of Disc-Type Furrow Opener of No-Till Seeder for Green Manure Crops in South Xinjiang Orchards. Agriculture 2023, 13, 1474. [Google Scholar] [CrossRef]
  12. Aikins, K.A.; Ucgul, M.; Barr, J.B.; Awuah, E.; Antille, D.L.; Jensen, T.A.; Desbiolles, J.M.A. Review of Discrete Element Method Simulations of Soil Tillage and Furrow Opening. Agriculture 2023, 13, 541. [Google Scholar] [CrossRef]
  13. Yang, Y.; Hu, Z.; Gu, F.; Ding, Q. Simulation and Experimental Study of the Tillage Mechanism for the Optimal Design of Wheat Rotary Strip–Tiller Blades. Agriculture 2023, 13, 632. [Google Scholar] [CrossRef]
  14. Li, Y.; Qi, B.; Bao, E.; Tang, Z.; Lian, Y.; Sun, M. Design and Analysis of Sowing Depth Detection and Control Device for MultiRow Wheat Seeders Adapted to Different Terrain Variations. Agriculture 2025, 15, 290. [Google Scholar] [CrossRef]
  15. Luo, J. Design and Experimental Study of a Wheat Uniform Seeder. Master’s thesis, Jiangsu University, Zhenjiang, China, 2019. [Google Scholar]
  16. Liu, C.; Liu, J.; Sang, Y.; Feng, X.; Zhou, X. Design and Testing of a Rotary Tillage and Soil Covering Device for Wheat Planting Based on Uniform Broadcasting. J. Agric. Mech. Res. 2025, 47, 185–190. [Google Scholar]
  17. Xue, B.; Zhou, L.; Niu, K.; Zheng, Y.; Bai, S.; Xi, L. Research of Sowing Depth Based on Adaptive Fuzzy PID Control System of Wheat Planter. Trans. Chin. Soc. Agric. Mach. 2023, 54, 93–102. [Google Scholar]
  18. Kang, Y.; Liao, Q.; Lin, J.; Han, J.; Wan, X.; Zhang, Q. Development of the rapeseed direct seeding machine with stubble covering based on combined harvesting machine platform. Trans. Chin. Soc. Agric. Eng. 2024, 40, 15–25. [Google Scholar]
  19. Zhang, X.; Zhang, L.; Hu, X.; Wang, H.; Shi, X.; Ma, X. Simulation of soil cutting and power consumption optimization of a typical rotary tillage soil blade. Appl. Sci. 2022, 12, 8177. [Google Scholar] [CrossRef]
  20. Yang, Y.; Fielke, J.; Ding, Q.; He, R. Field experimental study on optimal design of the rotary strip-till tools applied in rice-wheat rotation croping system. IJABE 2018, 11, 88–94. [Google Scholar]
  21. Mandal, S.K.; Bhattacharya, B.; Mukherjee, S. Optimization of design parameters for rotary tiller’s blade. Power 2013, 4. [Google Scholar]
  22. Chen, X.; Xu, G.; Zhang, X.; Tan, W.; Ding, Q.; Tagar, A.A. Performance Evaluation of Biomimetic-Designed Rotary Blades for Straw Incorporation in an Intensive Tillage System. Agriculture 2024, 14, 1426. [Google Scholar] [CrossRef]
  23. Qin, Y.; Gao, Y.; Xie, C.; Tong, J.; Wang, Q.; Feng, X. Design and Test of an Energy-Saving Bionic-Inspired Rotary Blade: A Study on Power Consumption and Soil Surface Quality. Agriculture 2025, 15, 938. [Google Scholar] [CrossRef]
  24. Salokhe, V.M.; Ramalingam, N. Effects of direction of rotation of a rotary tiller on properties of Bangkok clay soil. Soil Till. Res. 2001, 63, 65–74. [Google Scholar] [CrossRef]
  25. Gao, J.; Qi, H. Soil throwing experiments for reverse rotary tillage at various depths, travel speeds, and rotational speeds. Trans. ASABE 2017, 60, 1113–1121. [Google Scholar] [CrossRef]
  26. Ma, F.; Wang, L.; Wang, C.; Wang, Q.; Lu, C. Study on Impact Soil Movement Experiments on Wheat Seeds Based on EDEM. Agriculture 2025, 15, 400. [Google Scholar] [CrossRef]
  27. Niu, Y.; Zhang, J.; Qi, J.; Meng, H.; Peng, H.; Li, J. Design and Test of Soil–Fertilizer Collision Mixing and Mulching Device for Manure Deep Application Machine. Agriculture 2023, 13, 709. [Google Scholar] [CrossRef]
  28. Sugirbay, A.; Hu, G.R.; Chen, J.; Mustafin, Z.; Muratkhan, M.; Iskakov, R.; Chen, Y.; Zhang, S.; Bu, L.; Dulatbay, Y.; et al. A study on the calibration of wheat seed interaction properties based on the discrete element method. Agriculture 2022, 12, 1497. [Google Scholar] [CrossRef]
  29. Sun, K.; Yu, J.; Liang, L.; Wang, Y.; Yan, D.; Zhou, L.; Yu, Y. A DEM-based general modelling method and experimental verification for wheat seeds. Powder Technol. 2022, 401, 117353. [Google Scholar] [CrossRef]
  30. Patidar, P.; Soni, P.; Jain, A.; Mahore, V. Modelling soil-rotor blade interaction of vertical axis rotary tiller using discrete element method (DEM). J. Terramech. 2024, 112, 59–68. [Google Scholar] [CrossRef]
  31. GB/T 9478-2005; Testing Methods for Grain Strip Seeders, General Administration of Quality Supervision. Inspection and Quarantine of the People’s Republic of China: Beijing, China, 2005.
  32. NY/T 1143-2006; Operational Quality of Rotary Tillage, Fertilization, and Seeding Combination Machines. Ministry of Agriculture of the People’s Republic of China: Beijing, China, 2006.
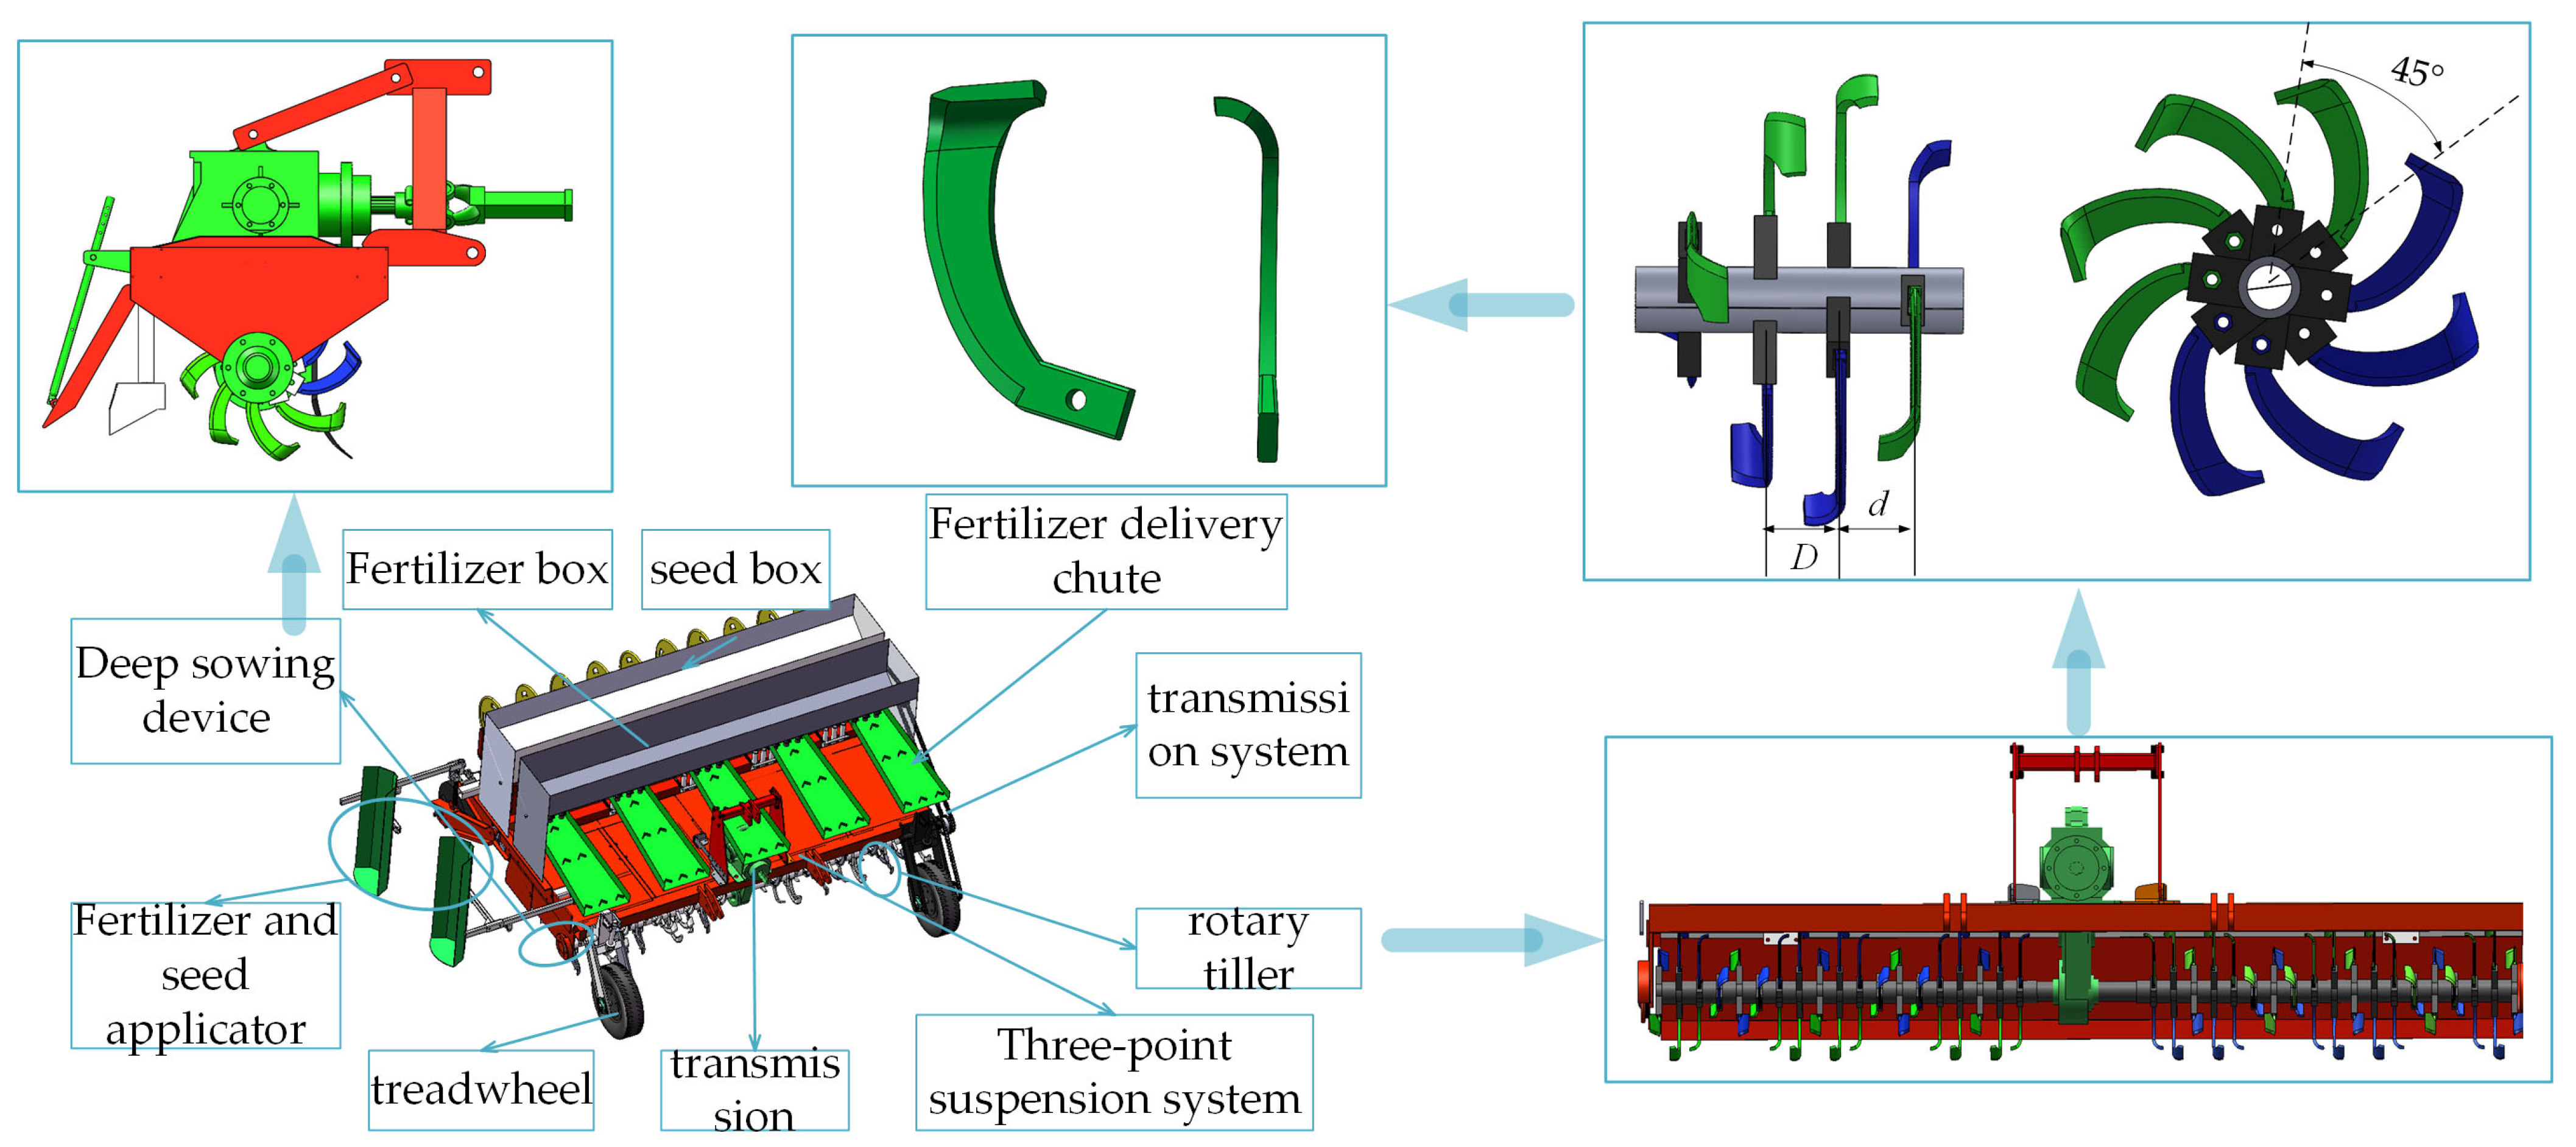
Figure 1. Wheat wide even sowing machine structure diagram.
Agriculture 15 01800 g001
Figure 2. Structural diagram of the rotary tillage throwing device of the wheat wide uniform seeder.
Agriculture 15 01800 g002
Figure 3. Schematic diagram of rotary plow blade arrangement.
Agriculture 15 01800 g003
Figure 4. Trajectory of thrown soil particles.
Agriculture 15 01800 g004
Figure 5. Force analysis of thrown soil particles in different stages.
Agriculture 15 01800 g005
Figure 6. Discrete meta-simulation test plot of the depth sowing device.
Agriculture 15 01800 g006
Figure 7. Schematic diagram of the discrete element simulation test of the depth sowing device at different time periods.
Agriculture 15 01800 g007
Figure 8. Schematic of discrete element soil sampling for seeding depth compliance testing.
Agriculture 15 01800 g008
Figure 9. Schematic of discrete element soil sampling for seeding uniformity testing.
Agriculture 15 01800 g009
Figure 10. Impact of one-factor simulation tests on evaluation indicators. (a) Relationship between the depth of penetration of the rotary tillage device into the soil and the coefficient of variation for sowing uniformity. (b) Relationship between the depth of the rotary tiller and the seedbed depth qualification rate. (c) Relationship between the inclination angle of the retaining board and the coefficient of variation for sowing uniformity. (d) Relationship between the depth of the rotary tiller and the seedbed depth qualification rate. (e) Relationship between rotary tillage device speed and seed depth qualification rate. (f) Relationship between the inclination angle of the retaining board and the seed depth qualification rate.
Agriculture 15 01800 g010
Figure 11. Response surface plots of the impact of factors on evaluation indicators.
Agriculture 15 01800 g011aAgriculture 15 01800 g011b
Figure 12. Map of field trials.
Agriculture 15 01800 g012
Figure 13. Measurement diagram of field test results.
Agriculture 15 01800 g013
Figure 14. Spatial distribution of the coefficient of variation for sowing uniformity under different conditions.
Agriculture 15 01800 g014
Figure 15. Spatial distribution of seeding depth under different conditions.
Agriculture 15 01800 g015
Figure 16. Seeding quality performance chart under different conditions.
Agriculture 15 01800 g016
Table 1. Setting of contact parameters between materials.
Material Contact Parameters ParameterValues
Soil–soil coefficient of recovery0.38
Soil–soil static friction factor0.48
Soil–soil kinetic friction factor0.28
Soil–steel coefficient of recovery0.42
Soil–steel static friction factor0.48
Soil–steel kinetic friction factor0.22
Soil–wheat coefficient of recovery0.02
Soil–wheat static friction factor1.25
Soil–wheat kinetic friction factor1.24
Wheat–steel recovery factor0.41
Wheat–steel static friction factor0.32
Wheat–steel kinetic friction factor0.18
Disclaimer/Publisher’s Note: The statements, opinions and data contained in all publications are solely those of the individual author(s) and contributor(s) and not of MDPI and/or the editor(s). MDPI and/or the editor(s) disclaim responsibility for any injury to people or property resulting from any ideas, methods, instructions or products referred to in the content.