Article

Field Schedule of UAV-Assisted Pollination for Hybrid Rice Based on CFD–DPM Coupled Simulation

1
College of Engineering, Jiangxi Agricultural University, Nanchang 330045, China
2
Jiangxi Provincial Key Laboratory of Modern Agricultural Equipment, Nanchang 330045, China
3
Jiangxi Super-Rice Research and Development Center, Jiangxi Provincial Key Laboratory of Rice Germplasm Innovation and Breeding, Jiangxi Academy of Agricultural Sciences, National Engineering Research Center for Rice, Nanchang 330200, China
*
Author to whom correspondence should be addressed.
These authors contributed equally to this work.
Agriculture 2025, 15(17), 1798; https://doi.org/10.3390/agriculture15171798
Submission received: 3 July 2025 / Revised: 28 July 2025 / Accepted: 20 August 2025 / Published: 22 August 2025
(This article belongs to the Section Artificial Intelligence and Digital Agriculture)

Abstract

UAV pollination holds significant promise for enhancing hybrid rice seed production, yet the mechanisms of pollen diffusion under UAV downwash and the lack of theoretical guidance for operational parameter optimization remain critical challenges. To address this, this study employed a coupled Computational Fluid Dynamics–Discrete Phase Model (CFD–DPM) numerical simulation to systematically investigate the interaction between the UAV-induced wind field and pollen particles. A validated CFD model was first developed to characterize the UAV wind-field distribution, demonstrating good agreement with field measurements. Building upon this, a coupled wind field–pollen CFD–DPM model was established, enabling a detailed visualization and analysis of airflow patterns and pollen transport dynamics under varying flight parameters (speed and height). Using the pollen disturbance area and effective settling range as key evaluation metrics, the optimal pollination parameters were identified as a flight speed of 3 m/s and a height of 4 m. Field validation trials confirmed that UAV-assisted pollination using these optimized parameters significantly increased the seed yield by 21.4% compared to traditional manual methods, aligning closely with simulation predictions. This study establishes a robust three-tier validation framework (“numerical simulation—wind-field verification—field validation”) that provides both theoretical insights and practical guidance for optimizing UAV pollination operations. The framework demonstrates strong generalizability for improving the efficiency and mechanization level of hybrid rice seed production.

1. Introduction

As a key link in hybrid rice seed production, the pollination process requires strict timeliness. However, at present, the country mainly relies on artificial pollination, which presents significant limitations in actual effectiveness [1,2,3,4]. Remote sensing technologies are an advanced support tool for agricultural operations, providing timely, non-destructive, and spatial information about plants to help farmers’ decision-making [5,6].
Furthermore, with the rapid development of agricultural UAV-assisted hybrid rice seed pollination technology in China, the pollination advantages of high efficiency, uniformity, and low damage have significantly improved seed production [7,8,9,10,11,12,13]. Liu Aimin et al. [1] found that the best effect of UAV-assisted pollination occurred when the parent-row ratio was 6:(40–60). Wang Pei et al. [14] used a wind-field measurement system to analyze the flow field of a single-rotor UAV and determined that the Z3 model could achieve a balance of efficiency, safety, and agronomic requirements at an operating altitude of 7 m. Wu Hui et al. [2] further innovated traditional planting patterns, confirming that the parent-compartment width could be extended to 1.2–2 m, and the mother-compartment width could reach 7–12 m. However, existing studies are mostly focused on the optimization of field parameters, and there is a lack of systematic research on the spatiotemporal distribution characteristics of UAV flow fields and pollen diffusion dynamics, which restricts the fine control and large-scale application of this technology
Numerical modeling and simulation techniques are effective methods to study flow-field distribution characteristics, and computational fluid dynamics (CFD) technology provides a new path to break through the above bottleneck [15,16,17,18]. Yang Shenghui [19] established a CFD system for the hexacopter UAV JF01-10 and its 1:10 scaled model based on the ANSYS platform and found that experimental validation confirmed a full-size model validation error of <34%. Zhang Songchao et al. [20] confirmed, through experiments on fog droplet deposition in the N-3 UAV, that the spatial distribution consistency between CFD simulation results and measured data reached 89%. Yang Fengbo’s team [21] developed a UAV simulation model, achieving a simulation error of ≤9% compared to the actual model. Guo’s team [22] achieved a simulation error breakthrough of <10% for hovering conditions of the ZHKU-0404-01 UAV. These studies show that the reasonable construction of CFD models can effectively predict real test scenarios.
The particle size of rice pollen is extremely small, but the strength of the wind field under the rotor of the UAV is significant [23]. Since the interaction between the two involves complex coupling effects between gas and solid phases, the mechanism must be analyzed with the help of gas–solid coupling theory. In this context, the coupling method based on CFD–DPM (discrete phase model) shows significant advantages due to its accurate modeling ability in the study of the interaction between the flow field and small particulate matter. Luke [24] simulated the particle settling of horizontal airflow through CFD–DPM coupling to establish an experimentally validated calibration method for improving simulation reliability under complex working conditions; Paula [25] utilized the CFD–DPM model to reveal the particle settlement characteristics of wheat, which has a very small particle size, and to analyze the explosion characteristics of wheat starch pyrolysis gas mixtures, finding that the turbulent dissipation rate is positively correlated with explosion intensity. Xiao Fenfang [26] applied the CFD–DPM model to optimize the design of the rice pollen collection device, achieving a 23% efficiency increase. Te et al. [17] used CFD–DPM coupling to simulate hybrid rice pollen diffusion, and others employed a coupled CFD–DPM method to predict the entire process of hybrid rice pollen dispersal, with a deposition distribution prediction error of <15%, further verifying the method’s feasibility.
This study implemented a coupled CFD–DPM method to investigate the interaction mechanism between UAV wind-field and pollen particles, quantify the model accuracy by comparing numerical simulation with field measurement data, and construct a pollination-parameter optimization framework that could be transferred to multi-rotor UAVs, avoiding model-dependent limitations. This study is expected to solve the problem of the insufficient validation of the current UAV pollination technology and provide important theoretical support and tools to promote its standardization and intelligent development.

2. Materials and Methods

2.1. Materials and Equipment

The UAV used in this study was a DJI T50 quadcopter eight-propeller plant protection UAV (Shenzhen DJI Technology Co., Ltd., Shenzhen, China), as shown in Figure 1. This UAV performs the functions of path planning and automatic obstacle avoidance; it can complete the operation autonomously according to the planned route, and the main performance indexes are shown in Table 1.
The wind-field measurements utilized a Testo 410i vane anemometer (Testo SE & Co., KGaA, Titisee-Neustadt, Germany; distributed by Testo Instruments International Trading, Shanghai, China) with wireless connectivity, as shown in Figure 2. This sensor provides a 0.4–30 m/s measurement range, ±0.2 m/s accuracy, and a 0.1 m/s resolution. The system supports simultaneous Bluetooth connections with up to nine sensors within a 10 m operational radius, enabling real-time environmental monitoring through smartphones or computers.
The pollen collection device used in this study consisted of two components: the collection part was a slide coated with petroleum jelly, and the fixation device was a 1.5-m-long sampling hose, both connected via an adjustable universal clamp. The device could adjust the position secured via the gimbal clamp according to the rice spike layer height to ensure that the sampling point height closely matched the mother spike layer height, as shown in Figure 3.

2.2. Based on Wind Field–Pollen Coupling

2.2.1. Simulation Modeling

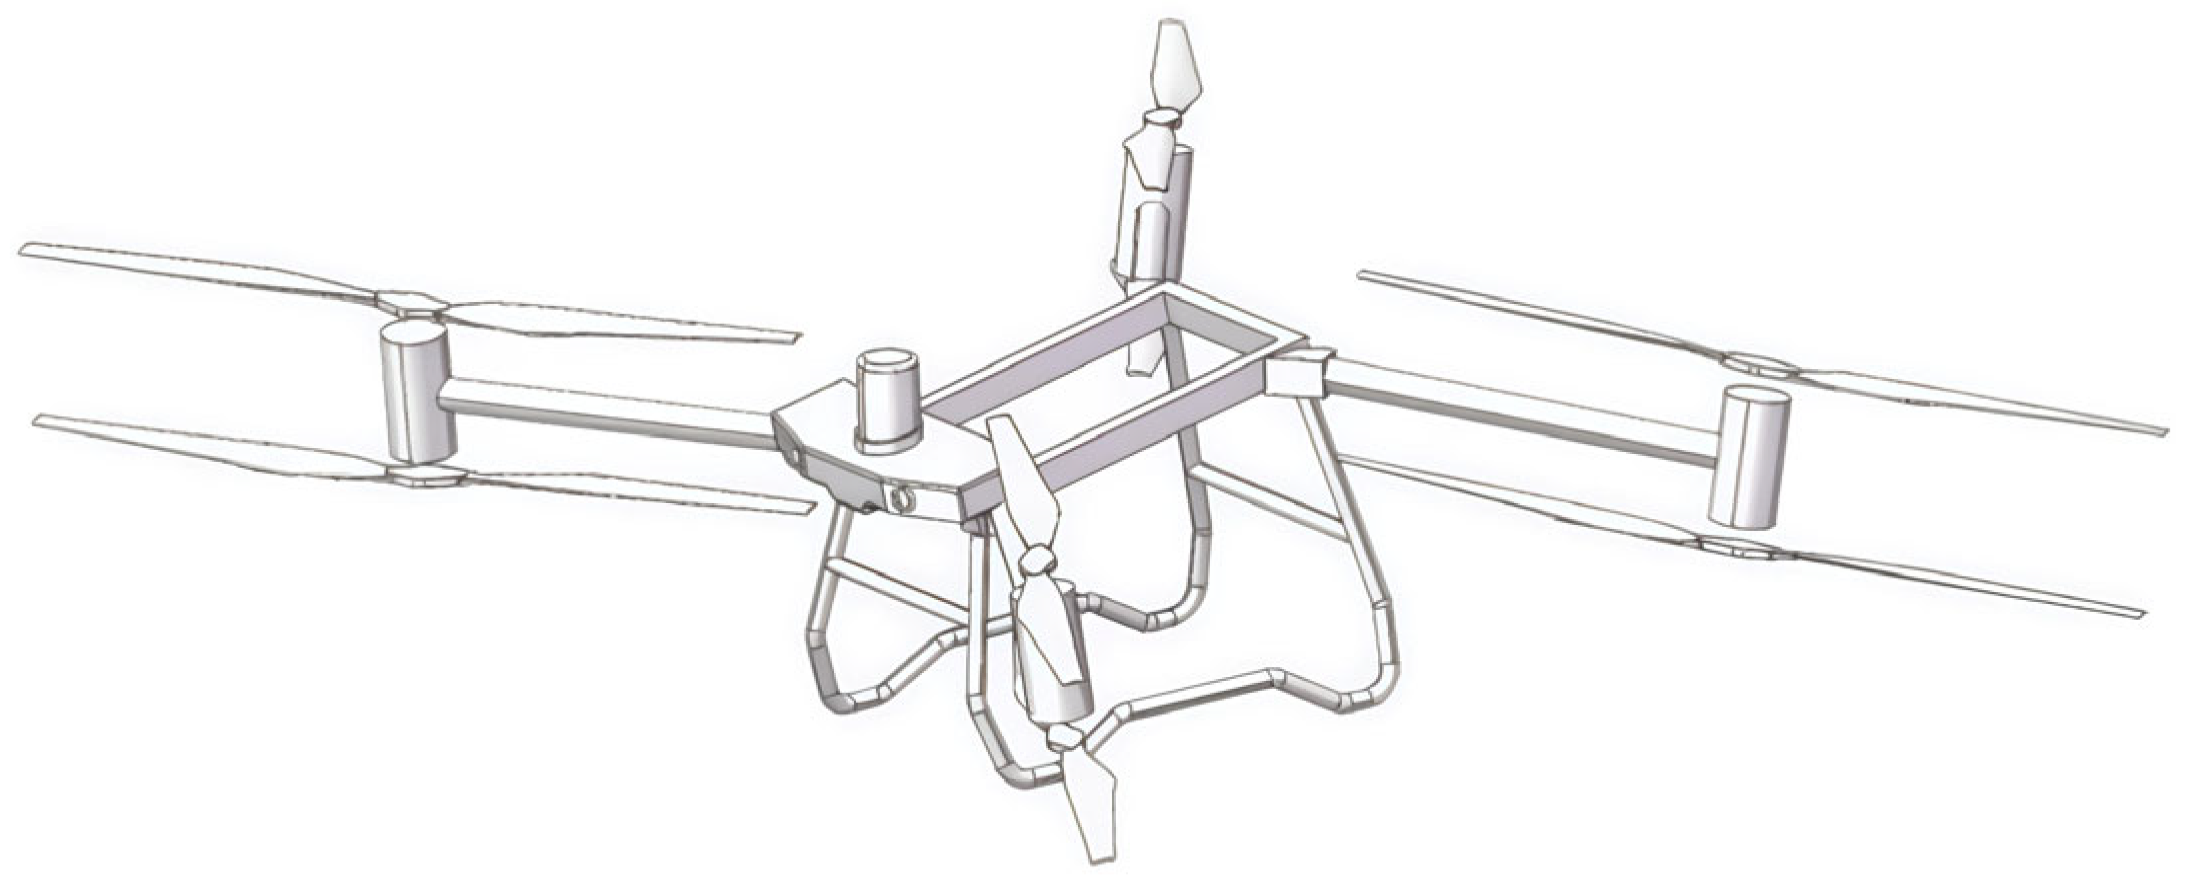
This study conducted aerodynamic–pollen diffusion coupling simulations based on the DJI T50 UAV platform, establishing a complete analysis system through reverse engineering with 3D scanning and refined flow-field domain design. The Creaform EXAScan handheld 3D laser scanner (measurement accuracy: 0.025 mm) acquired rotor blade point cloud data, which was processed through point cloud denoising, feature alignment, and NURBS surface reconstruction using DesignX 2023 software. Integrated with full-scale UAV measurement data, SolidWorks 2022 performed CFD-oriented geometric optimization by eliminating millimeter-scale voids and non-structural features, with the final simplified model presented in Figure 4.
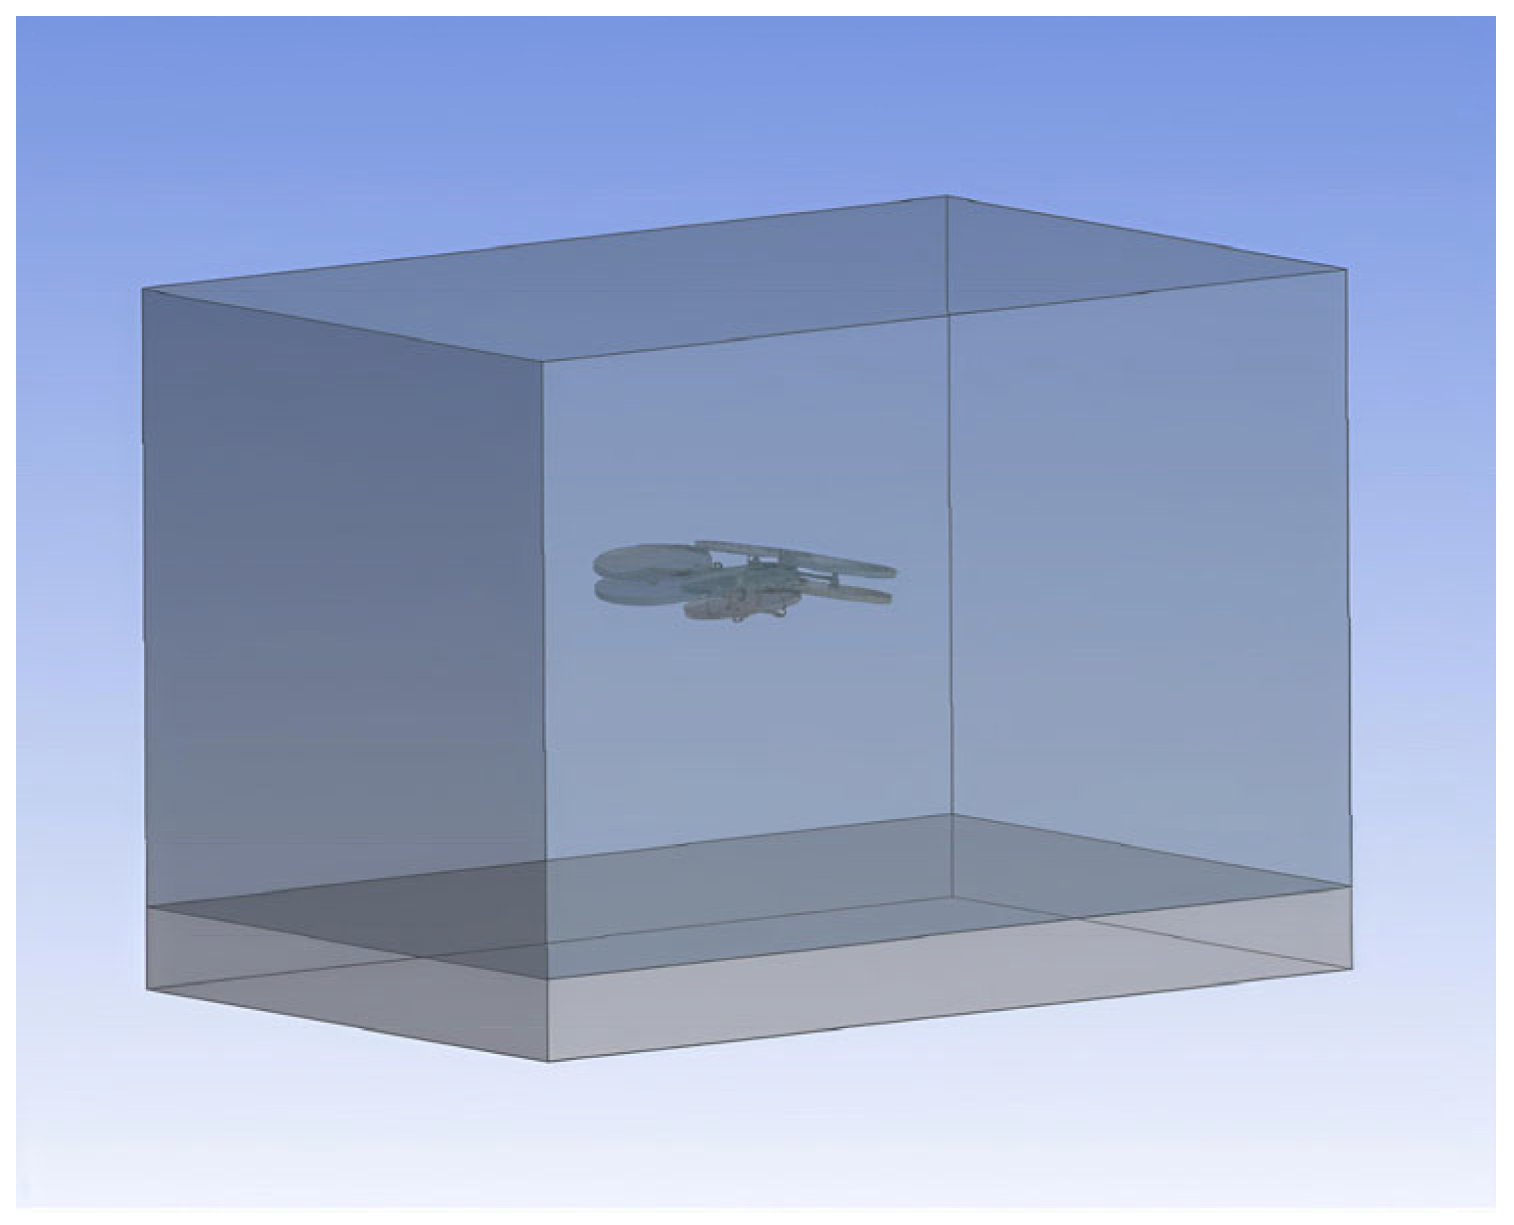
In terms of flow-field simulation, the computational domain of the external flow field is established according to the simulation requirements of ANSYS Fluent 19.0, and a square basin of 2.5 times the side length of the propeller diameter is designed, with the propeller rotation plane as the boundary to divide the upper and lower wind-field areas. The upwind field is fixed at a height of 4 m to form a fully developed inlet boundary layer; the downwind field is dynamically adjusted according to the height of the UAV flight operation to optimize the computational efficiency under the premise of ensuring the complete development of the wake field, and the specific basin topology is shown in Figure 5. For the rice pollen propagation characteristics, according to the agronomic requirements, the hybrid rice parent plant height observation data during the flowering period, set the plane pollen source term at a height of 1 m from the ground, through a step-by-step coupling solution strategy: first, use the discrete phase model (DPM) to simulate the generation and initial dispersion of pollen particles, and then import the particle distribution data into the steady-state flow field for the bi-directional flow–solid coupling calculations, which effectively characterizes the canopy microenvironmental influence on the pollen trajectory. The modeling method effectively characterizes the influence mechanism of the canopy microenvironment on the pollen trajectory.

2.2.2. Grid Division

In this study, the ANSYS Meshing module was used to implement a multi-scale meshing strategy, considering the balance between computational accuracy and efficiency. Given the large spatial scale of the total fluid domain, the basic grid size was set to 400 mm; critical flow-field areas (e.g., UAV rotating parts) underwent local refinement, with the minimum grid size controlled at 20 mm to ensure the accurate capture of near-wall flow features.
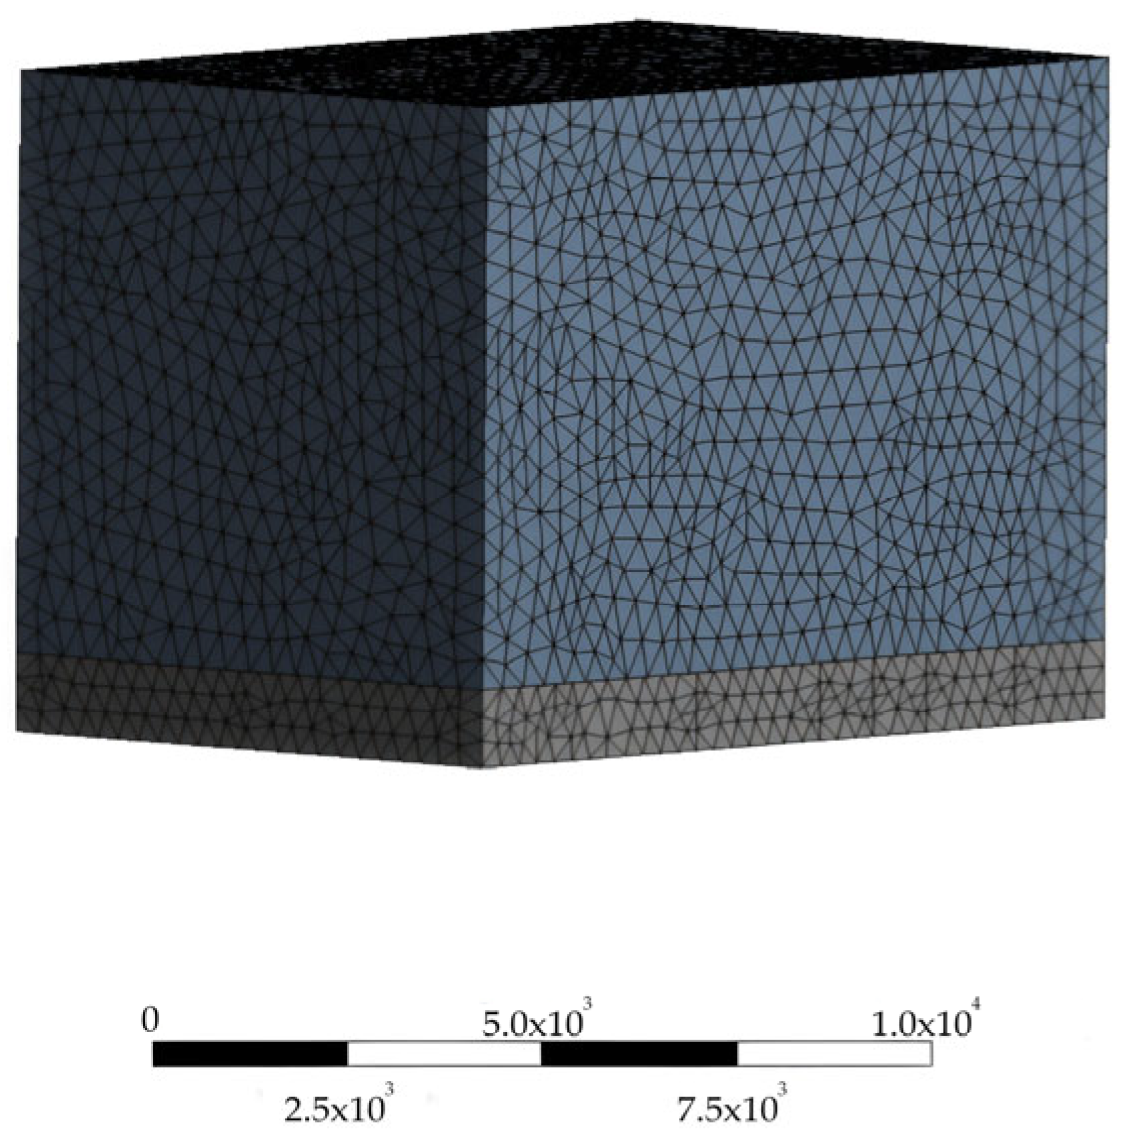
Based on the unstructured tetrahedral mesh, the full-domain discrete system was constructed, with curvature-adaptive encryption applied to geometrically variable regions such as arm joints and rotor surfaces. The encryption strength was dynamically adjusted based on surface second-order derivatives. A three-layer transition grid was specifically established at the rotor-flow interface to achieve a smooth transition between refined and non-refined areas. Figure 6 shows the final meshing model, with the total cell count limited to 2.7 million to meet engineering simulation requirements. The grid partitioning quality is shown in Table 2. The core parameters, including turbulence model selection, discretization schemes, and convergence criteria, are shown in Table 3.

2.3. Wind Testing

To validate the reliability of the wind-field model for the DJI T50 plant protection UAV developed through CFD simulations, a field-based anemometric survey was conducted on 27 March 2024 at the Rice Smart Farm facility in the Jinggangshan Agricultural Highland Zone, Ji’an City, Jiangxi Province. Under meteorological conditions classified as a Type 1 wind regime (0.3–1.5 m/s wind velocity range), the experimental design implemented the three-dimensional line array methodology proposed by Wang Pei et al. [14], informed by CFD-predicted wind-field widths of 5–6 m from Section 3.1.
The sensor layout (Figure 7a) included six sampling points (#1–#6, 1-m intervals) spaced equally along the wind-field width in the vertical course cross-section, with an additional control point (#7) positioned 15 m downstream from the final sampling point to synchronously monitor natural wind-field variations. This design ensured the coverage of the CFD-predicted wind-field range while capturing boundary-layer wind-field attenuation characteristics. Each sampling point was equipped with a three-axis wind speed sensor, aligned as follows: the X-axis parallel to flight direction, the Y-axis horizontal and perpendicular to the heading, and the Z-axis vertical to the ground. The detailed installation orientation is shown schematically in Figure 7b.

2.4. Field Pollination Production Trials

To investigate the effects of different UAV pollen-driving parameters on rice pollen distribution patterns in parent rows and validate the reliability of the CFD–DPM coupled simulation model, this study conducted pollen-driving tests on Wanxiangyou No. 377 hybrid rice in Ningdu County, Jiangxi Province, from 18–25 September 2024. The experimental configuration included the following: a parent-to-mother ratio of 1:7, a parent plant height of 1.2 m, a mother plant height of 1.0 m, a parent planting density of 20 cm × 20 cm, a mother planting density of 16 cm × 20 cm, and 30 cm inter-parent spacing. Parent plants exhibited synchronized flowering stages with a uniform growth status. During pollination, the conditions were predominantly sunny with minimal rainfall, featuring an average temperature of 31 °C, relative humidity of 21.5%, and wind speeds of 0–1.24 m/s. Field pollination production trials were conducted daily during the paternal parent’s peak flowering period (10:00–12:00 am). Each trial plot was pollinated 2–3 times per day during the pollination window [27,28].
Based on the 5–6 m wind-field width results from previous flight parameter tests, a 5 m route spacing was set to ensure the downwash airflow field effectively intersected and sufficiently perturbed rice canopy pollen. The experiment was designed to symmetrically arrange six sampling points (#1–#6, 1-m intervals) along the vertical UAV route, with the sampling line centered on both sides of the route. Pollen was collected continuously for three days during the peak flowering season; the spatial distribution is shown in Figure 8a. The UAV flew autonomously using preset parameters, enabling the systematic acquisition of parent-line pollen spatial distribution characteristics through this arrangement and providing empirical data for simulation model validation. Three independent areas were designated as biological replicates per experimental group to avoid sampling-area cross-interference, with corresponding operating areas shown in Figure 8b. To compare UAV and artificial pollen-driving effects, three adjacent fields near the experimental plots were selected for artificial pollen driving as controls. Among these, artificial pollination involves using ropes to disturb the male rice plants, therefore promoting the spread of pollen to the female ears. The start and end times and frequency of artificial pollination are consistent with those of drone-assisted pollination [1]. The experimental groups are shown in Table 4.

2.5. Statistical Analyses

A statistical analysis was conducted using SPSS 26.0. To investigate the effect of flight parameters (flight height and speed) on pollination efficiency, continuous flight parameters were first discretized into categorical variables (flight speed: 2, 3, 4 m/s; flight height: 3.5, 4.0, 4.5 m). Then, a one-way analysis of variance (ANOVA) was used to test the mean differences in pollination efficiency between different groups, reporting the degrees of freedom, F-value, and p-value. If the ANOVA result was significant (p < 0.05), Duncan’s post hoc test was used for pairwise comparison. Additionally, the difference in pollen density between UAV-assisted pollination (under single parameter conditions) and artificial-assisted pollination was analyzed using an independent samples t-test. The graphics depicted in the article were created using Origin 2022 and GraphPad Prism 10.1.2.

3. Results

3.1. Analysis of Numerical Simulation Results of the Flow Field

This study employed computational fluid dynamics (CFD) to simulate hover-state wind-field characteristics of unloaded UAVs at different flight heights. As shown in Figure 9, a single simulation parameter set requiring approximately 12 computational hours revealed distinct wind-field stratification: a funnel-shaped low-speed zone beneath the UAV, with airflow disturbance areas from individual rotors beginning to overlap at 1.0 m below the rotor plane, followed by complete flow convergence forming a continuous wind field at 1.5 m vertical distance.
The established optimal pollination speed range (2.5–3.5 m/s), corresponding to 2–3 times the pollen suspension speed [13,27,29], was validated through systematic simulations. The results indicate that a UAV hovering at a 3.5–4.5 m altitude generates effective pollination zones with 5–6 m of lateral coverage.
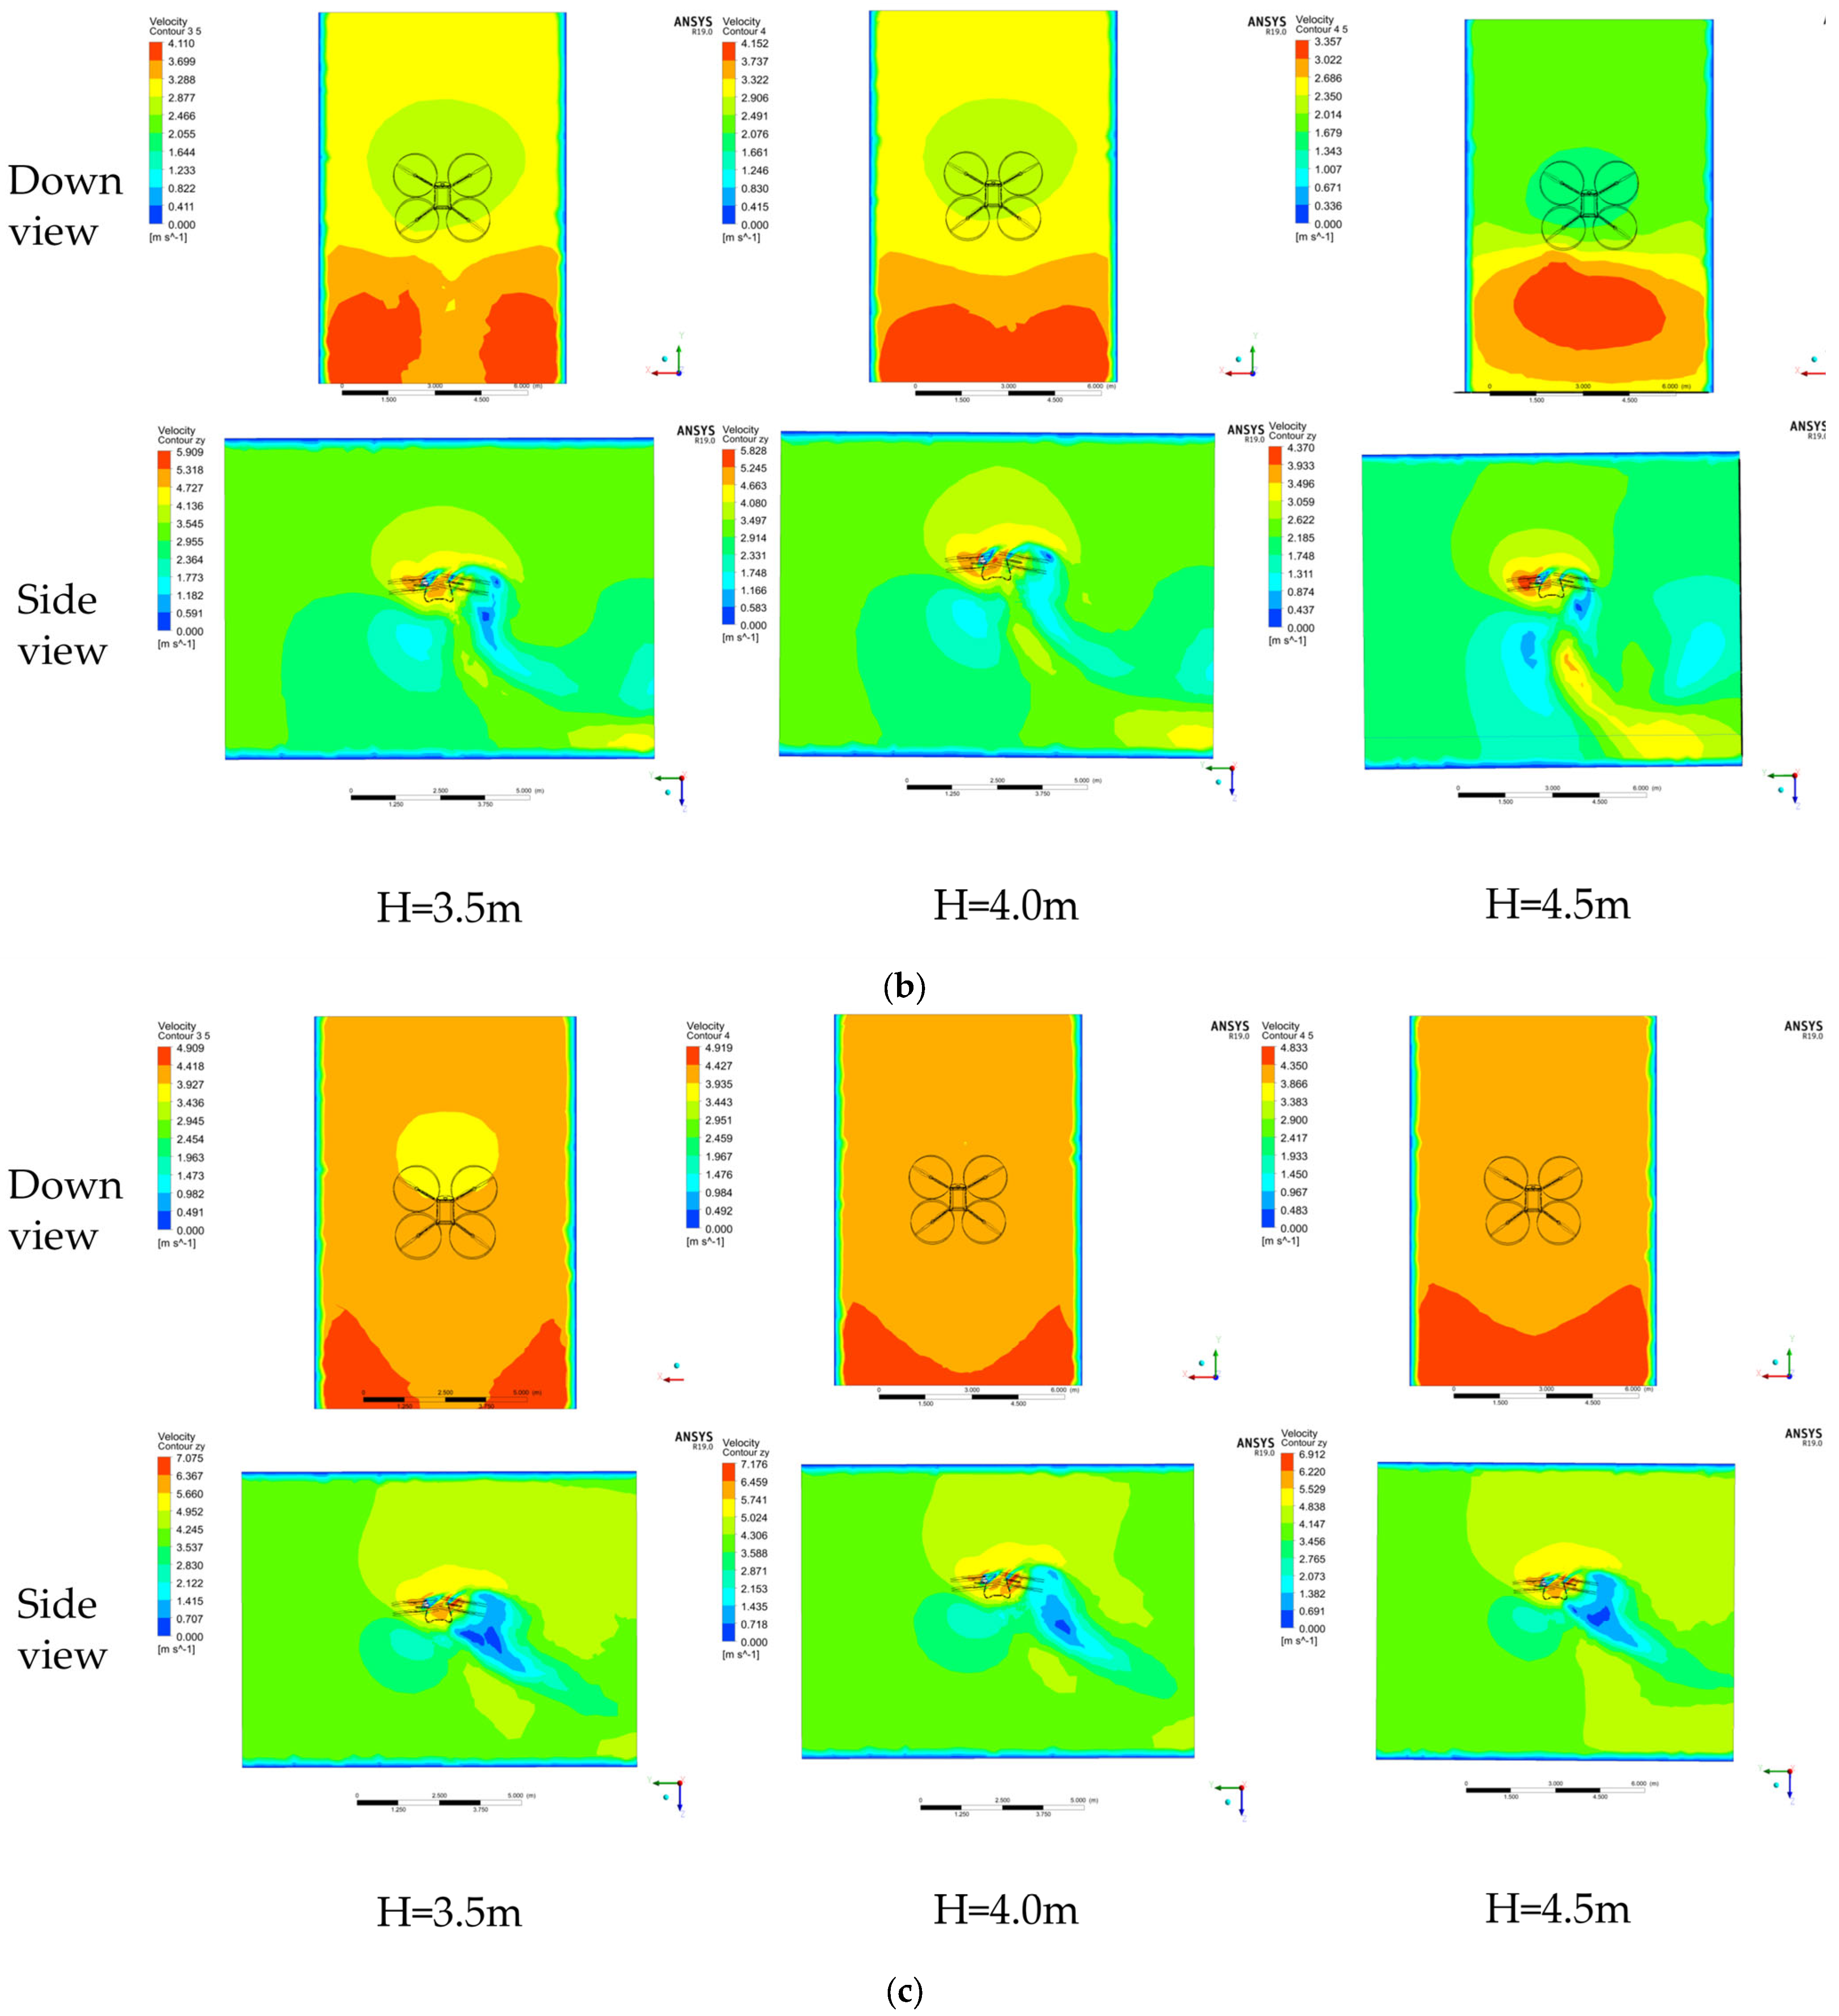
In order to be more pertinent to the wind-field distribution during UAV pollination, a simulation model was constructed under the forward working condition of the UAV. Figure 10 shows the wind-field distribution of the UAV under the simulated flight condition. After a large number of simulation tests, it was concluded that, when the flight speed is 2 m/s, 3 m/s, and 4 m/s and the flight height is 3.5 m, 4 m, and 4.5 m, the wind-field value of the simulation at this time meets the range of the pollination wind speed (2.5 m/s–3.5 m/s), and the width of the wind field is 5–6 m.

3.2. Analysis of the Results of the UAV Field Wind Measurement Test

Field wind measurement tests demonstrated a strong correlation between ground-proximal (1 m height) wind velocities and CFD simulations at 3.5 m, 4 m, and 4.5 m UAV flight heights. A comparative analysis of DJI T50 rotor hover wind fields (Figure 11) revealed a 13.55% mean relative error between experimental and simulated data. Considering ambient wind interference under Class 1 conditions (0.3–1.5 m/s) during testing, this error margin remains within acceptable thresholds, validating the numerical model’s reliability [3,21,22,30].
Yang et al. [31] demonstrated that peak wind velocities within crop canopies occur during UAV flyby events. Consequently, the maximum recorded values at each sampling location were adopted as UAV wind-field characteristic values, with corresponding temporal data preserved for subsequent airflow transmission analysis.
Since the pollination width of the UAV-assisted pollination process is mainly related to the X-direction wind-field width [14], this section focuses on the verification of the X-direction wind-field width. The results of the comparison between the UAV simulation and the field validation test in the X-axis direction under the forward condition are shown in Table 5. The results show that the relative errors in the X-axis direction range from 0.15% to 35.90%, and the average value of the whole group is 10.92%, which is in line with the expectation of the test, and effectively supports the reliability of the CFD model. Among them, due to the fact that the T3, T6, and T9 test groups (4.5 m flight height) are farther away from the sensor, the wind field is affected by the natural wind in the process of sinking, which leads to the deviation of the actual wind field collected and thus leads to a larger relative error.
A linear regression analysis was performed on experimental and simulated values for the X-direction wind speed parameters of the UAV wind field, as shown in Figure 12, with graphs plotted using GraphPad Prism 10.1.2. The regression fitting equation is y = 0.8874 × x + 0.3680 (R2 = 0.7588, p < 0.001). These results demonstrate that the numerical simulation of the UAV wind field was proven accurate.

3.3. Analysis of Test Results Based on CFD–DPM Coupled Simulation

Based on the coupled CFD–DPM simulation results (Figure 13), UAV flight parameters and pollen transport processes exhibited a significant dynamic correlation mechanism: When flight height H < 4 m and speed V < 3 m/s, pollen layer fluctuation intensity increased significantly, with lateral expansion of the disturbance region enhancing long-distance pollen diffusion to mother rows. However, the simultaneously strengthened sink effect transported substantial particles to the lower mother spike-head region, reducing effective fertilization probability and lowering fruit set rates. When parameters increased to H > 4 m and V > 3 m/s, the pollen particle subsidence range decreased markedly, improving the spike-head contact probability. Nevertheless, overall pollination efficiency remained constrained due to a limited pollen dispersal space within the disturbed area.
Simulation experiments revealed a specific threshold interval optimization law for flight parameters. When the flight parameters were set to 3 m/s speed and a 4 m altitude, the pollen disturbance area reached its maximum value, while the settling range was precisely controlled within the optimal canopy zone of parent plants. This parameter combination enabled full lateral dispersion of pollen particles and prevented excessive vertical subsidence through optimized airflow velocity gradient distribution. In this study, the pollen disturbance area (red markers) and settling range (yellow markers) were adopted as evaluation metrics, and integrated with pollen lifting/settling distribution characteristics, to assess the optimal pollination-parameter combination. A wind field–pollen coupling analysis demonstrated that the three-dimensional large-scale vortex structures formed under specific operating conditions dominated the spatial transport patterns of pollen particles. By enhancing lateral perturbation range extension while precisely controlling settling areas through vertical velocity gradients, the spatial transport efficiency was significantly improved. These findings provide hydrodynamic mechanism-level theoretical support for pollination-parameter optimization.

3.4. Analysis of Results of UAV-Assisted Field Pollination Trials

Field trials of UAV-assisted pollination in hybrid rice (Table 6) yielded the following mean operational parameters: a seed production of 2.61 t/hm2, a filled grain percentage of 34.20%, a 1000-grain weight of 20.15 g, 20.69 productive panicles per plant, and a pollen distribution density of 3.67–5.44 grains per field of view. Flight height and velocity significantly influenced hybrid rice seed yield, pollen density, and filled grain percentage (p < 0.05). UAVs operating at a 3 m/s speed and 4 m height demonstrated optimal pollination performance, achieving 5.3 pollen grains per field of view and a final yield of 2.64 t/hm2, consistent with numerical simulation predictions.
To demonstrate the superiority of UAV-assisted pollination over artificially assisted pollination, this study conducted field trials comparing their respective effects, with relevant data summarized in Table 7.
Experimental results showed that UAV-assisted pollination achieved an average yield of 2.61 t/hm2, 20.69 productive panicles per plant, a filled grain percentage of 34.2%, and a 1000-grain weight of 20.15 g. In contrast, artificial-assisted pollination yielded 2.35 t/hm2, 21.15 productive panicles per plant, a filled grain percentage of 32.9%, and a 1000-grain weight of 20.18 g. UAV-assisted pollination outperformed artificial-assisted pollination by increasing the grain yield by 11.06% and improving the filled grain percentage by 1.30 percentage points.

4. Discussion

This study established a three-tier verification system comprising “numerical simulation—wind-field verification—field verification” to systematically elucidate the coupling mechanism between airflow fields and pollen movement in the context of multi-rotor UAV-assisted pollination. By establishing a coupled CFD–DPM model, the study achieved visual analysis and quantitative assessment of airflow patterns and pollen transport dynamics at different flight altitudes and speeds.
At the model validation level, the CFD model of the drone wind field constructed in this study reflected a simulation error of 10.92%. This error value is significantly lower than the 34% model error reported by Yang Shenghui et al. [19] and is highly consistent with the <10% simulation error range reported by Guo et al. [22] under drone-hovering conditions. These comparison results fully validate the high reliability of this model in predicting the near-ground flow-field distribution of agricultural UAVs. However, during the validation process, it was found that environmental wind speed (as shown in Table 4 for the T3, T6, and T9 experimental groups) has a potential impact on measurement accuracy. To further improve the accuracy of experimental data, future studies may consider using ultrasonic wind speed and direction meters with higher precision and sensitivity. Additionally, this study involved certain limitations: Experimental verification was primarily conducted under Level 1 wind speed conditions (0.3–1.5 m/s). As shown in Appendix A Table A2, under higher wind speed conditions, the simulation error in the Z-axis direction may increase. Therefore, future simulation studies should incorporate comparison experimental data under different environmental wind speeds to clarify the model’s applicability and boundary conditions.
Based on a validated and reliable CFD model, this study further developed a wind field–pollen coupling (CFD–DPM) model aimed at systematically optimizing the operational parameters of drone pollination. A simulation analysis identified a flight speed of 3 m/s and a flight altitude of 4 m as the optimal parameter combination. This combination meets the critical threshold requirement that the pollen suspension velocity must reach 2–3 times its natural settling velocity [13,27,31]; on the other hand, by synergistically regulating the horizontal coverage width of the wind field and the vertical settling range of pollen, this parameter combination can optimally match the area of airflow disturbance on pollen with the effective settling area of pollen on the stigma. This provides an innovative solution to the lack of systematic theoretical support for optimizing drone pollination parameters in existing research.
The results of the field validation trials further confirm the practical value of this study. Compared to traditional manual pollination, drone-assisted pollination achieved a 21.4% increase in yield [29]. Most importantly, the optimized pollination parameters (speed and altitude) obtained from the field trials were highly consistent with the simulation predictions of the CFD–DPM coupled model. This consistency strongly validates the effectiveness of the established coupled simulation method in guiding agricultural drone pollination practices and provides a solid theoretical basis for the parameterization design of precision agricultural technologies.

5. Conclusions

In this study, the intrinsic correlation between pollination parameters and pollen distribution patterns of multi-rotor UAVs was systematically revealed through combined numerical simulations and field experiments. The results show that the constructed CFD simulation model for UAV wind-field distribution enables the simulation and prediction of wind-field characteristics, with a 10.92% error between model predictions and field-measured data. Furthermore, the developed CFD–DPM coupled pollen–wind field model simulates pollen transport dynamics and distribution patterns, identifying optimal UAV pollination parameters as a 3 m/s flight speed and a 4 m flight height based on operational requirements. Field production trials demonstrated that UAV-assisted pollination achieved an average production of 2.61 t/hm2, compared to 2.35 t/hm2 for artificially assisted pollination. Future research will further integrate the flow-field characteristics of multi-rotor drones with the complexity of field production environments, focusing on analyzing the impact of different flight path patterns on pollination assistance effectiveness to achieve in-depth optimization of operational parameters. Additionally, given the complexity of rice plant structures, the research team is currently working on developing a wind field–stem interaction model that integrates the actual morphology of rice plants. This model aims to more accurately simulate the interaction between wind fields and crops in real agricultural environments, thereby providing a more practical theoretical basis for optimizing the aforementioned flight path patterns and operational parameters.
Author Contributions

Conceptualization, L.L., X.C. and P.F.; formal analysis, J.L., M.L. and P.F.; data curation, L.L., X.C., P.F. and M.L.; writing—original draft preparation, L.L., J.L., M.L., X.C., P.F., L.X., Y.Z. and Y.L.; writing—review and editing, L.L., J.L., X.C. and P.F.; supervision, J.L., X.C., P.F., M.L. and L.X.; project administration, X.C., J.L., L.X. and M.L.; funding acquisition, X.C., J.L., L.X. and M.L. All authors have read and agreed to the published version of the manuscript.

Funding

This research was funded by the Key R&D Program of Jiangxi Province, China: Innovation and Application of Key Technologies and Intelligent Equipment for Mechanized Hybrid Rice Seed Production, grant number 20223BBF61025.

Data Availability Statement

The raw data supporting the conclusions of this article will be made available by the authors upon request.

Acknowledgments

We are thankful to Guodong Yu, Zhiheng Zhu, Zhiyin Wang, and Zhiguo Da, who have contributed to our data collection.

Conflicts of Interest

The authors declare no conflicts of interest.

Appendix A

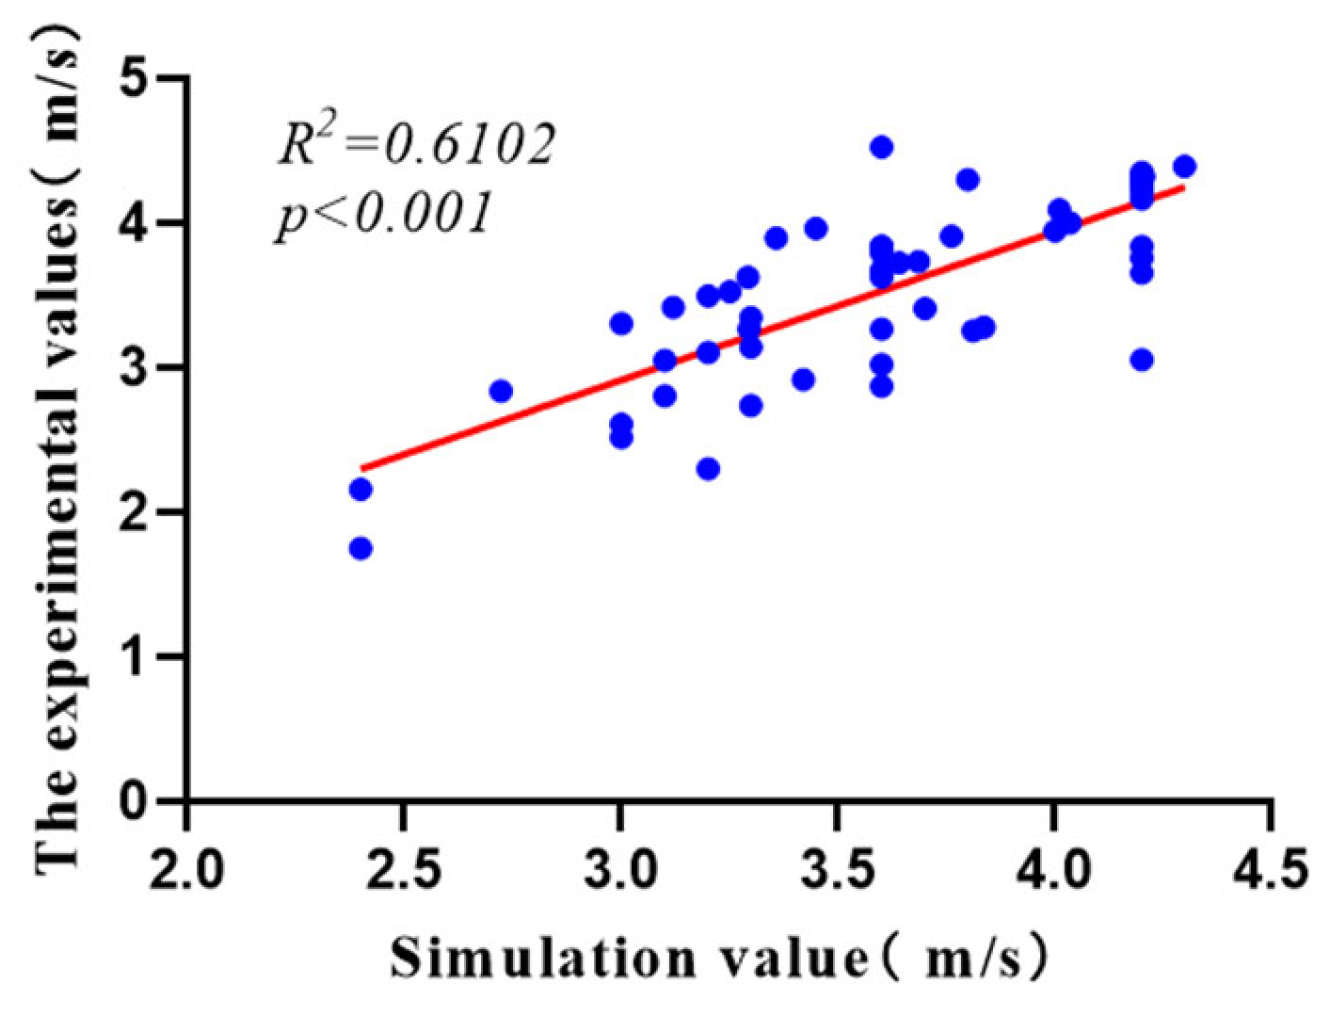
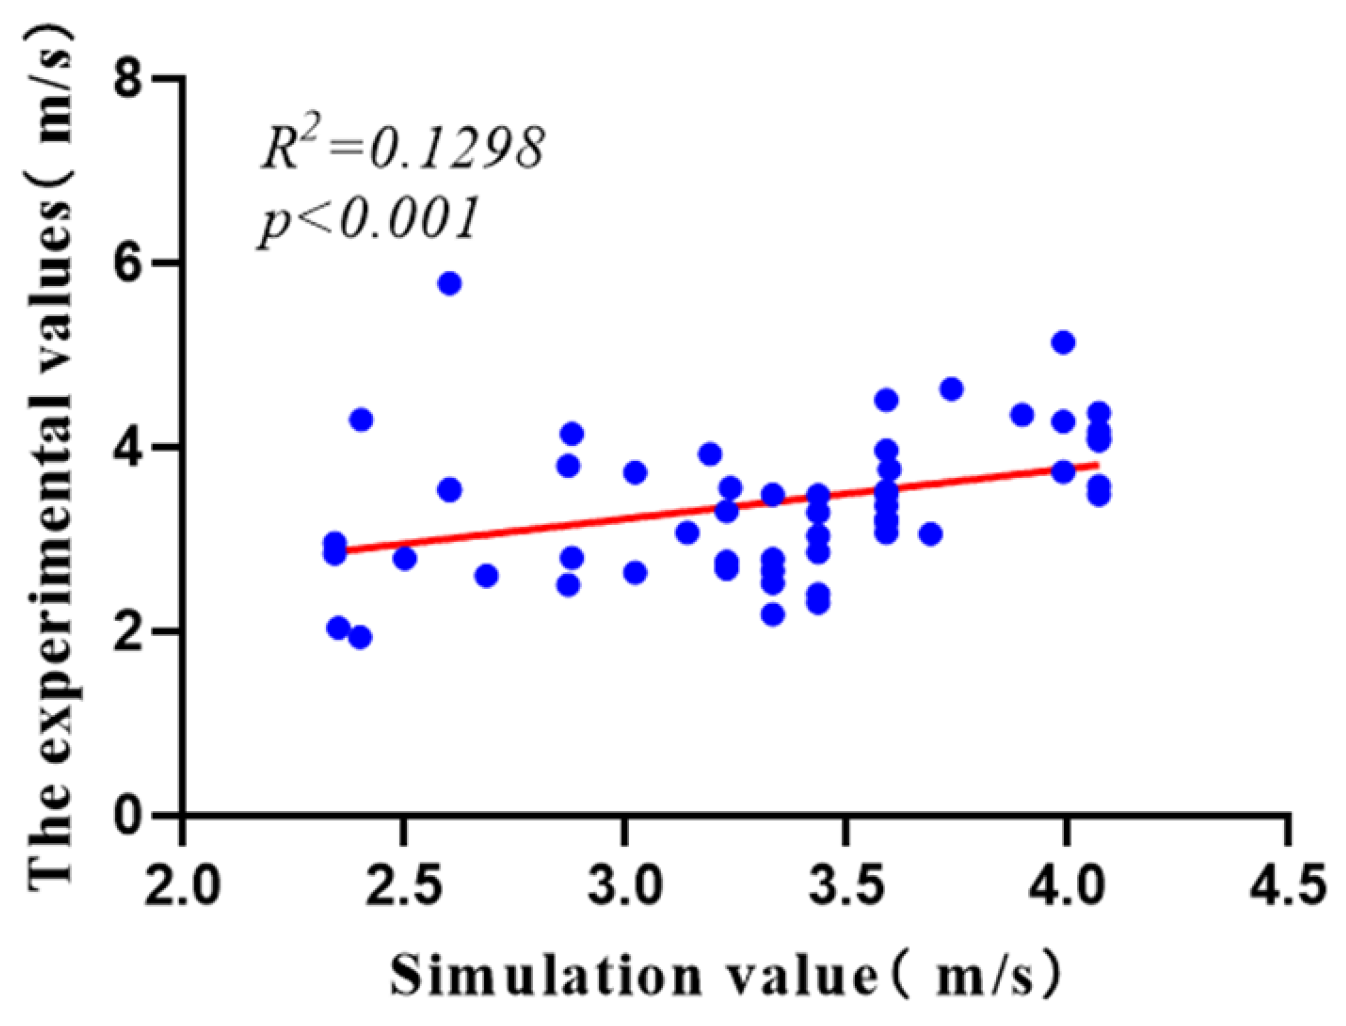
The Y-axis directional error ranges from 0.52% to 37.43%, with an average value of 8.87%; the Z-axis directional error ranges from 0.10% to 54.98%, with an average value of 15.74%. It is found that the Y-axis error control is better than that of the X-axis, while the Z-axis error level is significantly higher than that of the horizontal wind field. Combined with the asymmetric distribution characteristics of the wind field under the hovering condition, as shown in Figure 9 of the main text, it can be inferred that the complexity of the vertical flow field exerts a significant impact on the measurement accuracy. It is worth noting that, although the Z-axis error is larger, the influence of this directional error on the practical application of the model is limited because the plant protection operation mainly focuses on the characteristics of the horizontal wind field.
Table A1. Comparison of experimental and simulated values of Y-direction wind field with different flight parameters.
Test GroupRelative Error LimitsS1S2S3S4S5S6
T1Test value3.9123.8264.5283.0242.3042.838
Simulated value3.7623.6003.6003.6003.2002.723
Relative error3.83%5.91%20.49%19.05%3.15%4.05%
T2Test value3.9663.6783.8384.3042.8743.348
Simulated value3.4493.6003.6003.8003.6003.300
Relative error13.04%2.12%6.20%11.71%25.26%1.43%
T3Test value3.8982.9183.6264.2223.1063.268
Simulated value3.3583.4203.6004.2003.2003.295
Relative error13.85%17.20%0.72%0.52%3.03%0.83%
T4Test value4.0943.2682.8082.5183.0523.412
Simulated value4.0103.6003.1003.0003.1003.700
Relative error2.05%10.16%10.40%19.14%1.57%8.44%
T5Test value4.0003.9483.1422.7382.6103.525
Simulated value4.0354.0003.3003.3003.0003.250
Relative error0.88%1.32%5.03%20.53%14.94%7.80%
T6Test value3.6263.3083.4961.7502.1603.418
Simulated value3.2923.0003.2002.4002.4003.120
Relative error9.21%9.31%8.47%37.14%11.11%8.72%
T7Test value4.3244.3183.7923.8383.8404.394
Simulated value4.2054.2003.6003.6004.2004.300
Relative error2.75%2.73%5.06%6.20%9.38%2.14%
T8Test value3.7343.0564.2644.1703.7623.282
Simulated value3.6854.2004.2004.2004.2003.837
Relative error1.31%37.43%1.50%0.72%11.64%16.91%
T9Test value3.7264.2823.6564.3284.3523.256
Simulated value3.6414.2004.2004.2004.2003.812
Relative error2.28%1.91%14.88%2.96%3.49%17.08%
A linear regression analysis was performed on experimental and simulated values for the Y-direction wind speed parameters of the UAV wind field, as shown in Figure A1. The regression fitting equation is y = 1.1027 × x − 0.1636, R2 = 0.6102, p < 0.001. These results demonstrate that the numerical simulation of the UAV wind field has been proven accurate.
Figure A1. Linear fit of the actual test data to the simulation test data for the Y-direction wind field.
Agriculture 15 01798 g0a1
Table A2. Comparison of experimental and simulated values of Z-direction wind field with different flight parameters.
Test GroupRelative Error LimitsS1S2S3S4S5S6
T1Test value3.9304.2825.1423.7343.9724.514
Simulated value3.1913.9893.9893.9893.5903.590
Relative error18.80%6.84%22.42%6.83%9.62%20.47%
T2Test value2.8043.5643.7624.3544.1523.076
Simulated value2.8783.2373.5973.8972.8783.140
Relative error2.64%9.18%4.39%10.50%30.68%2.08%
T3Test value2.8484.3023.5365.7803.5482.962
Simulated value2.3422.4022.6022.6022.6022.342
Relative error17.77%44.17%26.41%54.98%26.66%20.93%
T4Test value2.6802.7622.5083.8023.3083.065
Simulated value3.2283.2282.8702.8703.2283.690
Relative error20.45%16.87%14.43%24.51%2.42%20.39%
T5Test value3.4902.6602.7902.5304.6402.190
Simulated value3.3323.3323.3323.3323.7373.332
Relative error4.53%25.26%19.43%31.70%19.46%52.15%
T6Test value2.0401.9402.8002.6403.7302.610
Simulated value2.3502.4002.5003.0223.0222.686
Relative error15.20%23.71%10.71%14.47%18.98%2.91%
T7Test value2.3182.4123.2962.8643.4843.040
Simulated value3.4363.4363.4363.4363.4363.436
Relative error3.56%42.45%4.25%19.97%1.38%13.03%
T8Test value3.1943.0763.2203.5283.4963.368
Simulated value3.5893.5893.5893.5893.5893.589
Relative error12.37%16.68%11.46%1.73%2.66%6.56%
T9Test value3.5844.1024.3784.0744.1803.488
Simulated value4.0704.0704.0704.0704.0704.070
Relative error13.56%0.78%7.04%0.10%2.63%16.69%
A linear regression analysis was performed on experimental and simulated values for the Y-direction wind speed parameters of the UAV wind field, as shown in Figure A2. The regression fitting equation is y = 0.8316 × x + 0.5789, R2 = 0.5035, p < 0.001. These results demonstrate that the numerical simulation of the UAV wind was been proven accurate.
Figure A2. Linear fit of the actual test data to the simulation test data for the Z-direction wind field.
Agriculture 15 01798 g0a2

References

  1. Aimin, L.; Haiqing, Z.; Cuimeng, L.; Qing, Z.; Xiao, C.; He, J.; Zhang, J.-O.; He, Y.; Li, J.; Luo, X. Effects of Supplementary Pollination by Single-rotor Agricultural Unmanned Aerial Vehicle in Hybrid Rice Seed Production. Agric. Sci. Technol. 2017, 18, 543–547. [Google Scholar] [CrossRef]
  2. Wu, S.; Liu, J.; Lei, X.; Zhao, S.; Lu, J.; Jiang, Y.; Xie, B.; Wang, M. Research Progress on Efficient Pollination Technology of Crops. Agronomy 2022, 12, 2872. [Google Scholar] [CrossRef]
  3. Xiaoxing, W.; Jinda, X.; Jin, Z.; Yun, H.; Xiaodong, B.; Jianjun, W. Study on seed production and pollination of Indica japonica hybrid rice assisted by multi rotor UAV. J. Chin. Agric. Mech. 2022, 43, 24–29. [Google Scholar]
  4. Ashraf, H.; Ghouri, F.; Baloch, F.S.; Nadeem, M.A.; Fu, X.; Shahid, M.Q. Hybrid Rice Production: A Worldwide Review of Floral Traits and Breeding Technology, with Special Emphasis on China. Plants 2024, 13, 578. [Google Scholar] [CrossRef]
  5. Garofalo, S.P.; Modugno, A.F.; De Carolis, G.; Sanitate, N.; Tesemma, M.N.; Scarascia-Mugnozza, G.; Tegegne, Y.T.; Campi, P. Explainable Artificial Intelligence to Predict the Water Status of Cotton (Gossypium hirsutum L., 1763) from Sentinel-2 Images in the Mediterranean Area. Plants 2024, 13, 3325. [Google Scholar] [CrossRef]
  6. Rojo, J.; Romero-Morte, J.; Lara, B.; Quirós, E.; Richardson, A.D.; Pérez-Badia, R. Biological-based and remote sensing techniques to link vegetative and reproductive development and assess pollen emission in Mediterranean grasses. Ecol. Inform. 2022, 72, 101898. [Google Scholar] [CrossRef]
  7. Wang, L.; Huang, X.; Li, W.; Yan, K.; Han, Y.; Zhang, Y.; Pawlowski, L.; Lan, Y. Progress in Agricultural Unmanned Aerial Vehicles (UAVs) Applied in China and Prospects for Poland. Agriculture 2022, 12, 397. [Google Scholar] [CrossRef]
  8. Van der Merwe, D.; Burchfield, D.R.; Witt, T.D.; Price, K.P.; Sharda, A. Drones in agriculture. In Advances in Agronomy; Elsevier: Berlin/Heidelberg, Germany, 2021; Volume 162, pp. 1–30. [Google Scholar] [CrossRef]
  9. Zhang, S.; Xue, X.; Chen, C.; Sun, Z.; Sun, T. Development of a low-cost quadrotor UAV based on ADRC for agricultural remote sensing. Int. J. Agric. Biol. Eng. 2019, 12, 82–87. [Google Scholar] [CrossRef]
  10. Pei, H.; Sun, Y.; Huang, H.; Zhang, W.; Sheng, J.; Zhang, Z. Weed Detection in Maize Fields by UAV Images Based on Crop Row Preprocessing and Improved YOLOv4. Agriculture 2022, 12, 975. [Google Scholar] [CrossRef]
  11. He, W.; Liu, W.; Jiang, R.; Gu, Q.; Huang, J.; Zou, S.; Xu, X.; Zhou, Z. Control system design and experiments of UAV shot seeding device for rice. Trans. Chin. Soc. Agric. Eng 2022, 38, 51–61. [Google Scholar] [CrossRef]
  12. Ingole, R.S.; Ingole, N.S.; Khandelwal, R.R.; Kalambe, J.P. Detection of Crop Disease and Spraying of Pesticides using Drone. In Proceedings of the 2024 IEEE 9th International Conference for Convergence in Technology (I2CT), Pune, India, 5–7 April 2024; IEEE: Piscataway, NJ, USA, 2024; pp. 1–5. [Google Scholar] [CrossRef]
  13. Shi, Q.; Liu, D.; Mao, H.; Shen, B.; Li, M. Wind-induced response of rice under the action of the downwash flow field of a multi-rotor UAV. Biosyst. Eng. 2021, 203, 60–69. [Google Scholar] [CrossRef]
  14. Wang, P.; Luo, X.; Hu, L.; Zhou, Z.; Lan, Y.; Zang, Y.; He, J.; Yan, Y. Wind Field Measurement for the Supplementary Pollination Using Two Types Unmanned Helicopter in Hybrid Rice Breeding; American Society of Agricultural and Biological Engineers: Kansas City, MO, USA, 2013. [Google Scholar] [CrossRef]
  15. Zhan, Y.; Chen, P.; Xu, W.; Chen, S.; Han, Y.; Lan, Y.; Wang, G. Influence of the downwash airflow distribution characteristics of a plant protection UAV on spray deposit distribution. Biosyst. Eng. 2022, 216, 32–45. [Google Scholar] [CrossRef]
  16. Lan, Y.; Qian, S.; Chen, S.; Zhao, Y.; Deng, X.; Wang, G.; Zang, Y.; Wang, J.; Qiu, X. Influence of the Downwash Wind Field of Plant Protection UAV on Droplet Deposition Distribution Characteristics at Different Flight Heights. Agronomy 2021, 11, 2399. [Google Scholar] [CrossRef]
  17. Xi, T.; Wang, Y.; Long, S.; Feng, H.; Zheng, C.; Li, D.; Kang, S.; Wang, J. Simulating Pollen Aerosol Diffusion and Distribution Under Horizontal Air Stream Using a Coupled CFD-DPM Method for Hybrid Rice Seed Production. J. ASABE 2024, 67, 1533–1545. [Google Scholar] [CrossRef]
  18. Wen, S.; Han, J.; Ning, Z.; Lan, Y.; Yin, X.; Zhang, J.; Ge, Y. Numerical analysis and validation of spray distributions disturbed by quad-rotor drone wake at different flight speeds. Comput. Electron. Agric. 2019, 166, 105036. [Google Scholar] [CrossRef]
  19. Zheng, Y.; Yang, S.; Liu, X.; Wang, J.; Norton, T.; Chen, J.; Tan, Y. The computational fluid dynamic modeling of downwash flow field for a six-rotor UAV. Front. Agric. Sci. Eng. 2018, 5, 159–167. [Google Scholar] [CrossRef]
  20. Zhang, S.; Xue, X.; Sun, Z.; Zhou, L.; Jin, Y. Study on the distribution law of downwash airflow in wind field under hovering state of single-rotor nitrodynamic unmanned pesticide helicopter. Int. J. Agric. Biol. Eng. 2018, 30, 13–22. [Google Scholar] [CrossRef]
  21. Yang, F.; Xue, X.; Cai, C.; Sun, Z.; Zhou, Q. Numerical Simulation and Analysis on Spray Drift Movement of Multirotor Plant Protection Unmanned Aerial Vehicle. Energies 2018, 11, 2399. [Google Scholar] [CrossRef]
  22. Guo, Q.; Zhu, Y.; Tang, Y.; Hou, C.; He, Y.; Zhuang, J.; Zheng, Y.; Luo, S. CFD simulation and experimental verification of the spatial and temporal distributions of the downwash airflow of a quad-rotor agricultural UAV in hover. Comput. Electron. Agric. 2020, 172, 105343. [Google Scholar] [CrossRef]
  23. Shi, Q.; Wang, B.; Mao, H.; Liu, Y. Calibration and measurement of micrometre-scale pollen particles for discrete element method parameters based on the Johnson-Kendal-Roberts model. Biosyst. Eng. 2024, 237, 83–91. [Google Scholar] [CrossRef]
  24. Stone, L.; Hastie, D.; Zigan, S. Using a coupled CFD–DPM approach to predict particle settling in a horizontal air stream. Adv. Powder Technol. 2019, 30, 869–878. [Google Scholar] [CrossRef]
  25. Pico, P.; Ratkovich, N.; Muñoz, F.; Dufaud, O. CFD-DPM and experimental study of the dynamics of wheat starch powder/pyrolysis gases hybrid mixtures in the 20-L Sphere. Powder Technol. 2020, 372, 638–658. [Google Scholar] [CrossRef]
  26. Xiao, F.; Zhang, C.; Wang, H.; Ye, Y.; Zhang, D.; Wang, H.; Li, B.; Wu, Y.; Liu, B. Simulation and optimization of pneumatic conveying system of hybrid rice pollen collection device. J. Agric. Sci. Technol. 2023, 25, 110–122. [Google Scholar] [CrossRef]
  27. Li, J.; Zhou, Z.; Hu, L.; Zang, Y.; Xu, S.; Liu, A.; Luo, X.; Zhang, T. Optimization of operation parameters for supplementary pollination in hybrid rice breeding using uniaxial single-rotor electric unmanned helicopter. Trans. Chin. Soc. Agric. Eng. 2014, 30, 10–17. [Google Scholar] [CrossRef]
  28. Long, L.; Lin, J.; Liu, M.; Chen, X.; Fang, P.; Xiao, L.; Zhou, Y.; Dong, X. Experimental Study on UAV-Assisted Pollination in Hybrid Rice. Drones 2025, 9, 327. [Google Scholar] [CrossRef]
  29. Shi, Q.; Pan, Y.; He, B.; Zhu, H.; Liu, D.; Shen, B.; Mao, H. The Airflow Field Characteristics of UAV Flight in a Greenhouse. Agriculture 2021, 11, 634. [Google Scholar] [CrossRef]
  30. Zhang, Q.; Zhang, Z.; Li, X.; Yang, L. Research Progress of Assisted Pollination Technology. In New Technologies Applied in Apple Production; Liu, Y., Yang, L., Shi, Y., Wang, G., Zhu, D., Zhang, Z., Eds.; Smart Agriculture; Springer Nature: Singapore, 2024; Volume 10, pp. 49–79. [Google Scholar] [CrossRef]
  31. Yang, S. Test Method and Distribution Law of the Wind Field of Multi-Rotor Unmanned Aerial Vehicles. Ph.D. Thesis, China Agricultural University, Beijing, China, 2022. [Google Scholar]
Figure 1. DJI T50 plant protection UAV.
Agriculture 15 01798 g001
Figure 2. Schematic diagram of wireless wind speed sensing system.
Agriculture 15 01798 g002
Figure 3. Schematic diagram of pollen collection device.
Agriculture 15 01798 g003
Figure 4. Full-size 3D model of the UAV.
Agriculture 15 01798 g004
Figure 5. Total fluid domain division.
Agriculture 15 01798 g005
Figure 6. Mesh model.
Agriculture 15 01798 g006
Figure 7. Layout of the test system. (a) Test-point distribution; (b) single test system arrangement.
Agriculture 15 01798 g007
Figure 8. Layout of the pollen collection experiment. (a) Schematic diagram of UAV-assisted pollination path and sampling point arrangement. (b) Area of operation for different test groups.
Agriculture 15 01798 g008
Figure 9. Distribution of wind field at different flight heights under hovering condition.
Agriculture 15 01798 g009
Figure 10. Distribution of UAV-simulated wind field under different flight parameters. (a) Flight velocity of 2 m/s. (b) Flight velocity of 3 m/s. (c) Flight velocity of 4 m/s.
Agriculture 15 01798 g010aAgriculture 15 01798 g010b
Figure 11. Comparison of rotor hovering wind-field simulation and experimental measurement results.
Agriculture 15 01798 g011
Figure 12. Linear fit of the actual test data to the simulation test data for the X-direction wind field.
Agriculture 15 01798 g012
Figure 13. Schematic diagram of CFD–DPM-based wind field-pollen coupling simulation.
Agriculture 15 01798 g013
Table 1. Main performance indicators of the UAV.
Main ParameterValue
Unfold fuselage size (L × W × H)2800 × 3085 × 820 mm
Battery capacity30 Ah
Weight39.9 kg
Operational flight speed1–10 m/s
Maximum wind speed6 m/s
Table 2. Grid partitioning quality results.
IndexNumerical Value
Minimum grid quality3.968 × 10−2
Maximum grid quality1
Average grid quality0.82399
Number of nodes3,741,232
Number of grids2,610,297
Table 3. Fluent solution parameters and boundary adjustment settings.
IndexSpecific ParameterNote
Interaction3000
Convergence condition0.0001
Turbulence modelsk-ω SST
Turbulence kinetic energy0.8
Turbulence viscosity1
Momentum0.7
ArithmeticCOUPLE
Fluid phaseTemperature of air/K: 293
Density of air/(kg/m−3): 1.225
Viscosity of air/
(kg·m−1·s−1): 1.7894 × 10⁻⁵
Dispersed phaseTemperature of pollen/K: 293
Average diameter of pollen/μm: 30
Flow of pollen/(kg·s−1): 0.05
Injection velocity of pollen/(m·s−1): 0.01Defined by the forward speed of the UAV
Pressure outletGauge pressure/(Pa): 0
InterfaceFixed interfacesUsed as a pollen generator between upwind and downwind field regions
WallReal wallsBottom surface of downwind field area
Table 4. Experimental treatments and design.
Test GroupsFlight Speed (m/s)Flight Height (m)
T123.5
T24.0
T34.5
T433.5
T54.0
T64.5
T743.5
T84.0
T94.5
Table 5. Comparison of experimental and simulated values of X-direction wind field with different flight parameters.
Test GroupRelative Error LimitsS1S2S3S4S5S6
T1Test value2.4421.8002.8862.4881.8382.226
Simulated value2.4002.3872.3872.3872.3872.400
Relative error1.72%32.61%17.29%4.06%29.87%7.82%
T2Test value3.2122.1042.4722.4462.5922.106
Simulated value2.6712.4042.4042.4042.6712.404
Relative error16.84%14.26%2.75%1.72%3.05%14.15%
T3Test value2.4861.9303.3502.1021.7662.198
Simulated value2.5002.4002.3422.3422.4002.500
Relative error0.56%24.35%30.09%11.42%35.90%13.74%
T4Test value2.9044.0152.9732.7803.5003.810
Simulated value3.4483.4503.0003.0003.4493.879
Relative error18.73%14.07%0.91%7.91%1.46%1.81%
T5Test value3.5503.3503.3412.5813.4563.746
Simulated value3.7653.7653.3462.9283.3463.765
Relative error6.06%12.39%0.15%13.44%3.18%0.51%
T6Test value2.3763.3963.8873.8302.6333.390
Simulated value2.3932.6592.6592.5902.6592.383
Relative error0.72%21.70%31.59%32.38%1.01%29.71%
T7Test value4.6524.0724.3023.9284.8864.658
Simulated value4.8524.8524.3134.3134.3134.313
Relative error4.30%19.16%0.26%9.80%11.73%7.41%
T8Test value4.7004.1524.2744.1384.1304.314
Simulated value4.3794.3794.3794.3794.3794.379
Relative error6.83%5.47%2.46%5.82%6.03%1.51%
T9Test value3.8903.9204.9924.4964.2884.540
Simulated value4.5474.5474.5474.5474.5474.547
Relative error16.89%15.99%8.91%1.13%6.04%0.15%
Table 6. Production and its composition of hybrid rice under different flight parameters. Note: different capital letters in the table indicate significant differences in flight speed at the p = 0.05 level; different lowercase letters in the table indicate significant differences in flight height at the p = 0.05 level.
Test Group NumberTest Area (m2)Number of Productive Panicles per PlantFilled Grain Percentage ± SD (%)1000-Grain Weight (g)Production ± SD (t/hm2)Pollen Distribution Density Grains per Field of View
T1106719.1113.04 ± 2.20 Bb21.801.60 ± 0.16 Bb4.11 ± 0.08 Bb
T266722.0019.43 ± 6.40 Ba22.012.32 ± 0.29 Ba4.90 ± 0.30 Ba
T3146721.7811.08 ± 0.49 Bb22.072.06 ± 0.08 Bb3.68 ± 0.02 Bc
T466719.2817.89 ± 2.82 Ab22.242.15 ± 0.00 Ab4.77 ± 0.10 Ab
T566718.1122.21 ± 7.11 Aa21.882.64 ± 0.00 Aa5.30 ± 0.13 Aa
T6106728.7220.25 ± 0.44 Ab22.162.23 ± 0.37 Ab4.37 ± 0.42 Ab
T7186824.7813.51 ± 6.83 Bb22.131.70 ± 0.00 Bb4.30 ± 0.21 Bb
T8106719.6718.94 ± 3.45 Ba22.672.39 ± 0.38 Ba5.01 ± 0.10 Ba
T986719.6714.89 ± 2.86 Bb22.061.81 ± 0.10 Bb4.35 ± 0.28 Bc
Table 7. Production and its composition under different pollination methods.
VarietyPollination MethodsNumber of Productive Panicles per PlantFilled Grain Percentage (%)1000-Grain Weight (g)Production (t/hm2)
Wanxiang You 377UAV-assisted pollination20.6934.2020.152.61
Artificial-assisted pollination21.1532.9020.182.35
Disclaimer/Publisher’s Note: The statements, opinions and data contained in all publications are solely those of the individual author(s) and contributor(s) and not of MDPI and/or the editor(s). MDPI and/or the editor(s) disclaim responsibility for any injury to people or property resulting from any ideas, methods, instructions or products referred to in the content.