Article

Using APSIM Model to Optimize Nitrogen Application for Alfalfa Yield Under Different Precipitation Regimes

1
College of Water Conservancy and Hydrpower Engineering, Gansu Agricultural University, Lanzhou 730070, China
2
Gansu Province Jingtai Chuan Power Irrigation Water Resource Utilization Center, Baiyin 730400, China
*
Author to whom correspondence should be addressed.
Agriculture 2025, 15(16), 1789; https://doi.org/10.3390/agriculture15161789
Submission received: 12 July 2025 / Revised: 18 August 2025 / Accepted: 20 August 2025 / Published: 21 August 2025

Abstract

Scientific nitrogen management is essential for maximizing crop growth potential while minimizing resource waste and environmental impacts. Alfalfa (Medicago sativa L.) is the most widely cultivated high-quality leguminous forage crop globally, and is capable of providing nitrogen through nitrogen fixation. However, there remains some disagreement regarding its nitrogen management strategies. This study conducted a three-year field experiment and calibrated the APSIM-Lucerne model. Based on the calibrated model, three typical precipitation year types (dry, normal, and wet years) were selected. Combining field experiments, eight nitrogen application scenarios (0, 80, 120, 140, 160, 180, 200, and 240 kg·ha−1) were set up. With the objectives of increasing alfalfa yield, nitrogen partial productivity, and nitrogen agronomic efficiency, this study investigates the appropriate nitrogen application thresholds for alfalfa under different precipitation year types. The results showed the following: (1) Alfalfa yield increased first and then decreased with the increase in nitrogen application level. The annual yield of the N160 treatment was the highest (13.39 t·ha−1), which was 5.15% to 32.39% higher than that of the other treatments. (2) The APSIM-Lucerne model could well reflect the growth process and yield of alfalfa under different precipitation year types. The R2 and NRMSE between the simulated and observed values of the former were 0.85–0.91 and 5.33–7.44%, respectively. The R2 and NRMSE between the simulated and measured values of the latter were 0.74–0.96 and 2.73–5.25%, respectively. (3) Under typical dry, normal, and wet years, the optimal nitrogen application rates for alfalfa yield increases were 120 kg·ha−1, 140 kg·ha−1, and 160 kg·ha−1, respectively. This study can provide a basis for precise nitrogen management of alfalfa under different precipitation year types.

1. Introduction

Nitrogen (N) is an essential nutrient element in agricultural production, playing a crucial role in crop yield formation and quality improvement [1]. The application of exogenous nitrogen is beneficial for improving soil fertility, maintaining nutrient balance, and promoting crop growth [2]. As global demand for increased agricultural production continues to grow, nitrogen fertilizer application rates have been rising year by year. Currently, global annual nitrogen fertilizer application in farmland reaches 200 million tons, yet the average utilization efficiency remains below 50% [3]. Low nitrogen fertilizer utilization is a widespread issue in agricultural production worldwide, particularly in developing countries. China, as the largest developing country, leads the world in total nitrogen fertilizer consumption [4]. Continued high levels of nitrogen fertilizer application not only cause atmospheric pollution, secondary soil salinization and acidification, and water eutrophication, but also increase agricultural production costs [5,6,7]. Therefore, exploring the appropriate nitrogen application threshold for crops is an inevitable requirement for green, efficient, and sustainable agricultural development.
Field experiments and crop growth models are the major approaches for studying nitrogen fertilizer management in crops. Field experiments are usually only conducted in specific growing seasons, with single research objects, long cycles, high costs, and are easily disturbed by factors such as climate, pests, and diseases [8]. Crop growth models simulate the entire life cycle of crops by setting crop characteristics, regional environments, and management measures through functional modeling. They can dynamically reflect the developmental process of crops and their relationships with factors such as climate, soil, and management [9]. The combination of crop growth models and field experiments can conduct production simulations of crops at spatiotemporal scales, thereby effectively avoiding the disadvantages of traditional field experiments. Currently, the crop models widely used both domestically and internationally primarily include WOFOST (World Food Studies), jointly developed by the World Food Center and Wageningen University in the Netherlands; DSSAT (Decision Support System for Agrotechnology Transfer), an agricultural technology transfer decision support system from the United States; and APSIM (Agricultural Production Systems Simulator), an agricultural production simulation system from Australia, etc. [10]. The WOFOST model has strong accuracy and universality, focusing on the mechanism description of crop physiological processes. It is sensitive to environmental responses and suitable for simulating potential crop yields and assessing climate change. However, it lacks consideration of specific crop mechanisms such as rice transplanting and alfalfa nitrogen fixation, and its ability to dynamically simulate soil moisture and nutrients is relatively weak [10,11]. The DSSAT model can simulate the dynamic growth of over 42 types of crops, covering multi-scale applications such as crop genetic modeling and farm precision management. It excels at analyzing the long-term impact of climate change on agricultural production. However, running the model requires a large amount of historical meteorological data and soil information [10,12]. Compared with the WOFOST and DSSAT models, the APSIM model adopts a modular “plug-and-play” structure to construct crop growth, soil moisture, and soil nitrogen modules. It enables quantitative and dynamic simulation of crop growth and development processes, yield formation, and responses to environmental changes and agricultural management practices [13,14]. It is convenient for users to optimize nitrogen fertilizer management in farmland by combining scenario design, and is suitable for studying the interactive effects between agricultural production and soil environment. Akram et al. [15] used the APSIM model to simulate irrigation requirements at different growth stages of oil palm in Indonesia and optimized the irrigation regime for oil palm. Wu et al. [16] used the APSIM model to simulate the growth process, leaf area index, yield, and number of seeds of different soybean varieties in the Sichuan Basin of China, establishing China’s first APSIM soybean variety parameter set. Chaki et al. [17] comprehensively evaluated the responses of the APSIM model to different tillage methods, cultivation patterns, and straw returning and irrigation scenarios, and identified the conservation agriculture management model for the rice-wheat cropping system in the eastern part of the Ganges Plain.
In summary, APSIM has been widely applied to various crops, but it has primarily focused on annual crops such as grains and cash crops [18,19]. Research on forages, especially perennial forages, is relatively scarce. Alfalfa (Medicago sativa L.) is the most widely cultivated perennial leguminous forage worldwide, and is renowned as the “King of Forages” due to its excellent palatability, high protein content, and high biological productivity [20,21]. Additionally, alfalfa has a well–developed root system that can fix nitrogen through root nodules, effectively improving soil fertility and reducing soil erosion [22,23]. Gansu Province has now developed into China’s largest high–quality alfalfa production base, with its planting area accounting for over 60% of the national total [24]. However, due to the region’s poor soil fertility and rough nutrient management, there is still significant room for improvement in the productivity of alfalfa in Gansu. In view of this, a three-year field experiment was conducted with the following aims: (1) to construct the APSIM-Lucerne model and localize its parameters to explore its regional applicability; (2) to quantify the effects of different precipitation year types and nitrogen application levels on alfalfa yield and nitrogen use efficiency; (3) to determine the nitrogen application thresholds for increased alfalfa yields under different precipitation year types based on the APSIM-Lucerne model, providing a basis for optimizing nitrogen management and efficient utilization in alfalfa production.

2. Materials and Methods

2.1. Overview of the Experimental Site

The experiment was conducted from April to October during the 2021–2023 growing seasons at the Gansu Jingtai Chuan Electric Lifting Irrigation Water Resource Utilization Center Irrigation Experiment Station (37°23′ N, 104°08′ E; elevation 2028 m). The site is located in a temperate continental climate zone, with a frost–free period of 191 days. The mean annual values for sunshine duration, solar radiation, precipitation, evaporation, and air temperature are 2652 h, 6.18 × 10⁵ J/cm2, 185 mm, 3028 mm, and 8.5 °C, respectively.
The soil at the experimental site is classified as sandy loam, with an average dry bulk density of 1.61 g/cm3 in the 0–100 cm soil layer, a field water holding capacity of 24.1%, and the soil pH is 8.11. The topsoil (plow layer) contains the following baseline nutrient levels: 1.32 g/kg organic matter, 1.62 g/kg total nitrogen, 1.32 g/kg total phosphorus, 34.03 g/kg total potassium, 55.2 mg/kg alkali-hydrolyzable nitrogen, 26.31 mg/kg available phosphorus, and 173 mg/kg available potassium. Meteorological data were recorded using a small smart agricultural weather station installed at the experimental site. The total precipitation and mean daily air temperature during the three experimental years were 192.20 mm and 19.07 °C (2021), 122.90 mm and 18.77 °C (2022), and 112.40 mm and 19.10 °C (2023), respectively (Figure 1).

2.2. Experimental Design

The tested alfalfa variety was Longdong Purple Flower Alfalfa (referred to as alfalfa). Based on the previous research by Lu et al. [25] and Lv et al. [26], the experiment adopted a completely randomized block design with four nitrogen application levels (N produced by Gansu Liuhua Group Co., Ltd., with an N content of 46.4%, Lanzhou, China): 0 kg·ha−1 (N0), 80 kg·ha−1 (N80), 160 kg·ha−1 (N160), and 240 kg·ha−1 (N240). Each treatment was replicated three times, resulting in a total of 12 plots. Each plot covered an area of 42.9 m2 (5.5 m × 7.8 m).
Alfalfa was planted in April 2021. Ten days prior to sowing, the soil was deeply plowed and leveled. Sowing was carried out at a row spacing of 30 cm and a depth of 30 mm, with a seeding rate of 22.5 kg·ha−1. In the establishment year, nitrogen fertilizer was applied in a 6:4 ratio before sowing and after the first cutting. In the subsequent two years, nitrogen was applied in a 6:2:2 ratio at the regreening stage, after the first cutting, and after the second cutting, respectively. Phosphorus (as diammonium phosphate, 16% P2O5) and potassium (as potassium chloride, 50% K2O) fertilizers were each applied at 50 kg·ha−1 as basal fertilizers at the beginning of each growing season (regrowth stage). Irrigation was provided via drip irrigation systems, with valves and precision water meters (accuracy: 0.001 m3) installed on the pipelines to control water application. Alfalfa received full irrigation during all growth stages, and field management practices followed the standard local agronomic recommendations for alfalfa production. The alfalfa was harvested on 16 July and 5 October in 2021; 29 May, 29 July, and 13 September in 2022; and 10 June, 29 July, and 15 September in 2023.

2.3. Measurement Items and Methods

2.3.1. Hay Yield (Y, t·ha−1)

To balance yield and quality and ensure the regrowth of alfalfa, it was harvested at the initial flowering stage. During each harvest, a 1 m2 (1 m × 1 m) plot with uniform plant growth was selected within each plot. Plants were cut at a stubble height of 5 cm. The samples were dried using a DHG-9070A electric hot-air drying oven (produced by Shanghai Yiheng Technology Instrument Co., Ltd., Shanghai, China). The samples were inactivated at 105 °C for 0.5 h, then oven-dried at 75 °C to constant weight. After cooling, the dry biomass was weighed to calculate the hay yield.

2.3.2. Nitrogen Use Efficiency (NUE)

Nitrogen use efficiency reflects the effectiveness of nitrogen fertilizer utilization in crop production. Partial actor productivity of nitrogen and agronomic nitrogen use efficiency are common indicators of nitrogen fertilizer utilization efficiency.
Partial factor productivity of nitrogen (PFPN, kg·kg−1)
PFPN = Y / F
Here, Y is the hay yield (t·ha−1), and F is the amount of nitrogen fertilizer applied (kg·ha−1).
Agronomic nitrogen use efficiency (ANUE, kg·kg−1)
ANUE = ( Y NPK Y PK ) / F
Here, YNPK is the hay yield under nitrogen application (t·ha−1), YPK is the yield under the zero-nitrogen control (N0), and F is the amount of nitrogen fertilizer applied (kg·ha−1).

2.4. Classification of Different Precipitation Year Types

The intra-annual distribution and total amount of precipitation are closely related to regional agricultural production. To evaluate the optimal nitrogen application rates for alfalfa under different precipitation year types, this study classified precipitation year types based on a drought coefficient (DC), calculated using historical annual precipitation data from the study area over the past 40 years (1985–2024). The calculation formula is as follows [27]:
DC = ( P A ) / σ
In the formula, DC is the drought coefficient (DC < −0.35 indicates a dry year, DC > 0.35 indicates a wet year, and −0.35 ≤ DC ≤ 0.35 indicates a normal year); P is the annual precipitation (mm); A is the long–term average annual precipitation (mm); and σ is the standard deviation of annual precipitation.
Table 1 presents the classification results of precipitation types in the study area from 1985 to 2024.

2.5. Scenario Design

To further determine the optimal nitrogen application threshold for alfalfa, on the basis of the four nitrogen application levels designed in this experiment, four additional nitrogen application levels were added based on the APSIM-Lucerne model, forming eight nitrogen fertilizer application gradients: N0 (0 kg·ha−1, control group), N80 (80 kg·ha−1), N120 (120 kg·ha−1), N140 (140 kg·ha−1), N160 (160 kg·ha−1), N180 (180 kg·ha−1), N200 (200 kg·ha−1), and N240 (240 kg·ha−1), to simulate alfalfa yield, partial factor productivity of nitrogen, and Agronomic nitrogen use efficiency under three typical precipitation year types (dry, normal and wet year). Concurrently, field-measured yields, nitrogen fertilizer utilization efficiency, and nitrogen fertilizer agronomic efficiency from 2021 to 2023 were integrated to establish a “model–empirical” dual verification system.

2.6. Model Construction and Verification

2.6.1. Construction of the APSIM-Lucerne Model

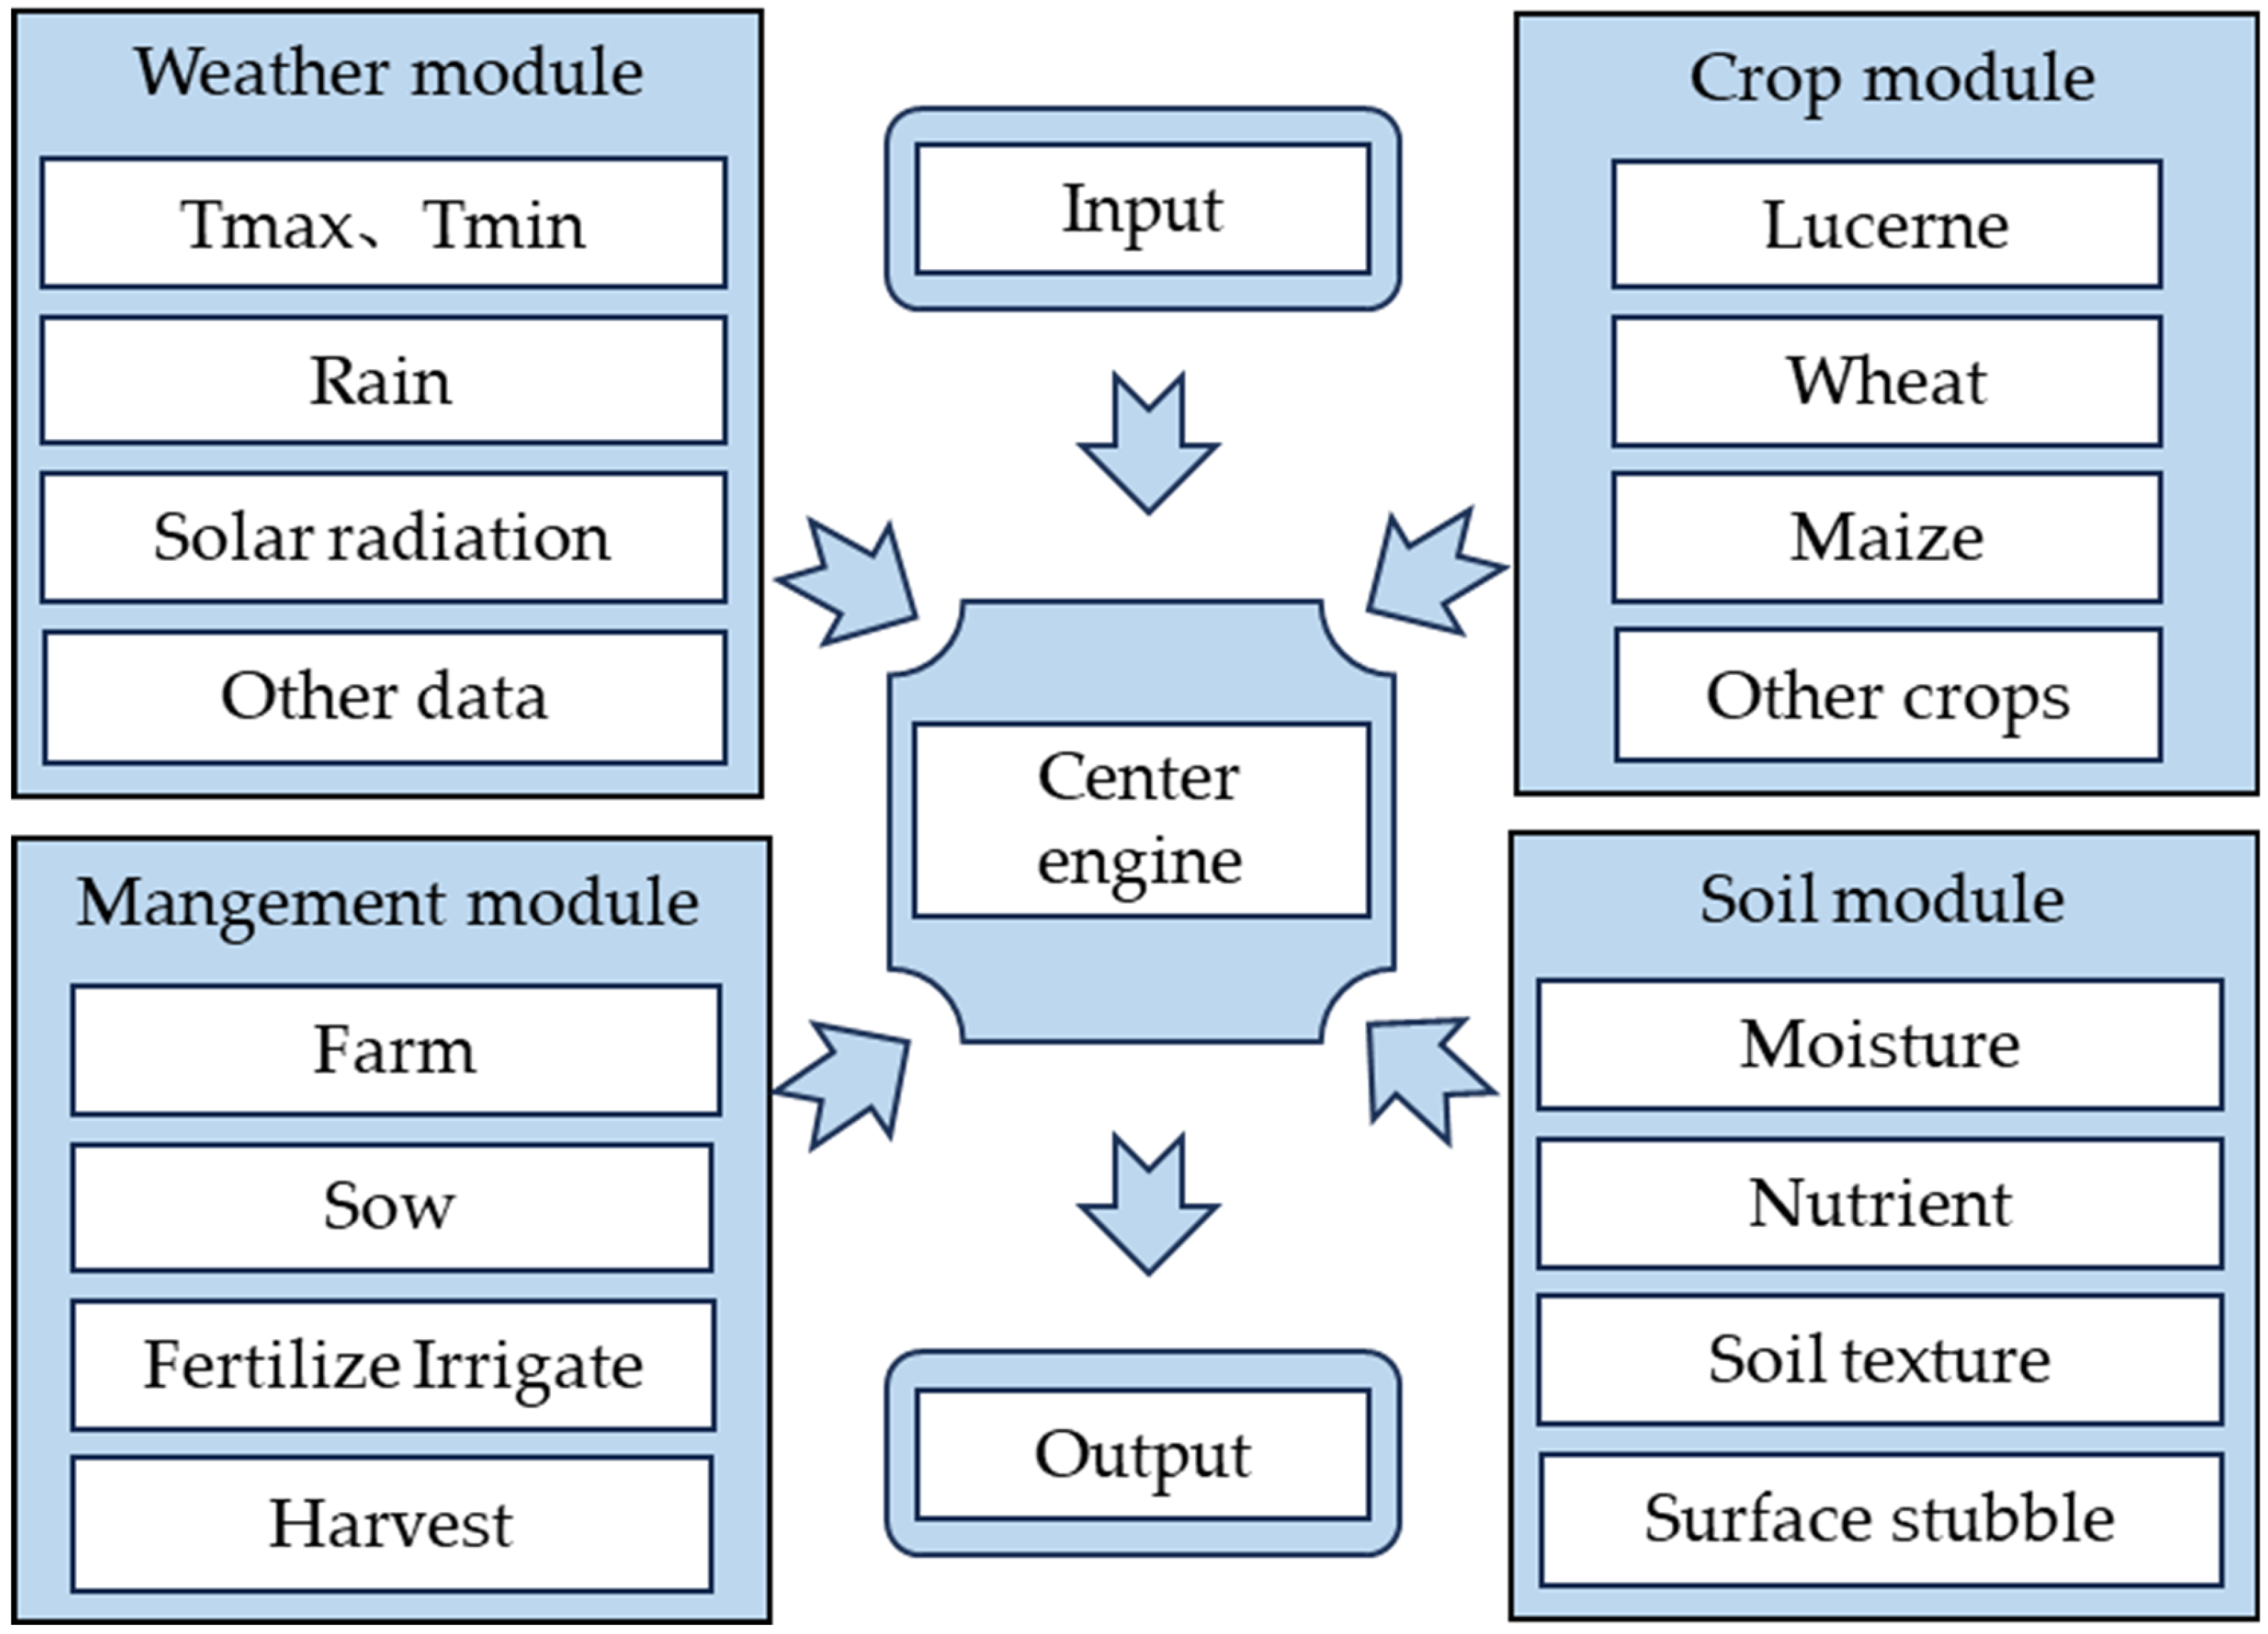
The Lucerne module is a subcomponent of the Agricultural Production Systems Model (APSIM), designed to simulate the growth and development of alfalfa. The input section includes meteorological, soil, crop, and management data, while the simulation section covers crop phenological development, growth, yield, quality, and soil indicators. The output section can present the simulated indicators as daily or final results through data or images. The structure of the model workflow is illustrated in Figure 2. The meteorological data used in the model simulations in this study were obtained from the meteorological records of Jingtai County, Baiyin City, Gansu Province, from 1985 to 2024, provided by the Gansu Provincial Meteorological Bureau. After obtaining the daily solar radiation by the sunshine duration conversion calculation method, a relatively complete meteorological database was established, including daily maximum temperature, daily minimum temperature, daily precipitation, sunshine duration, and daily solar radiation. This database was named “Longdong.met.” Table 2 shows the determination and results of the main physical and chemical properties of the soil in the experimental field, and the parameter database was named “Longdong.soils”.
Combining the main soil parameters from the experimental sites in 2021–2023 with the APSIM-Lucerne model to simulate the growth and development process of alfalfa, the model’s system control module, field management module, crop growth module, climate module, and soil module were utilized. Referring to Li et al. [28] for model parameter calibration, the model was calibrated using field measurement data from 2021 and 2022, and the model was validated using field measurement data from 2023. After repeated calibration of the APSIM-Lucerne model, a crop attribute parameter library was established, with the simulation objective being to minimize the error in yield simulation, thereby determining the variety parameters in the model (Table 3).

2.6.2. Model Verification Methods

To assess the reliability and accuracy of the model, several commonly used statistical indicators were employed for model validation, including the coefficient of determination (R2), root mean square error (RMSE), normalized root mean square error (NRMSE), index of agreement (D), and mean absolute error (MAE) [29,30]. The relevant formulas are as follows:
R 2 = 1 i = 1 n S i Q i 2 i = 1 n Q i Q ¯ i 2
RMSE = i = 1 n S i Q i 2 n
NRMSE   ( % ) = RMSE Q ¯ × 100 %
D = 1 i = 1 n S i Q i 2 i = 1 n S i Q ¯ + Q i Q ¯ 2
MAE = i = 1 n S i Q i n
In the formula, Si and Qi represent the simulated and observed values, respectively; Q ¯ is the mean of the observed values; and n is the number of samples.

2.7. Entropy Weight-TOPSIS Model

(1)
Determination of Indicator Weights Using the Entropy Weight Method
Assuming m evaluation objects and n evaluation indicators, each evaluation indicator Aij (i = 1, 2, …, m; j = 1, 2, …, n, with n = 7) is normalized to obtain the normalized indicator value Bij, and then the weight of each indicator is calculated [31]:
C ij = B ij / i = 1 m B ij
E ij = lnm 1 × i = 1 m C ij × ln C ij
C ij = B ij / i = 1 m B ij
W j = 1 E j / j = 1 n 1 E j
D j = 1 E j
In the formula, Cij is the contribution degree of the i-th evaluation object for the j-th indicator; Ej is the information entropy value; Dj is the information utility value; Wj is the weight (%) assigned to each indicator.
(2)
Entropy Weight-TOPSIS Model
Multiply the normalized Bij by the weights obtained from the entropy weight method to obtain the weighted matrix Mij, calculate the relative proximity Gi, and sort as follows:
K i + = j = 1 n W i M ij M j + 2
K i = j = 1 n W i M ij M j 2
G i = K i K i + + K i

2.8. Data Analysis

Data organization was conducted using Microsoft Excel 2021. Graphs were generated using Origin 2021 and GraphPad Prism 8.0.2. One-way analysis of variance (ANOVA), significance testing (p < 0.05), and multiple comparisons were performed using IBM SPSS Statistics 26.

3. Results

3.1. Effects of Nitrogen Application on Alfalfa Yield and Nitrogen Use Efficiency

3.1.1. Yield

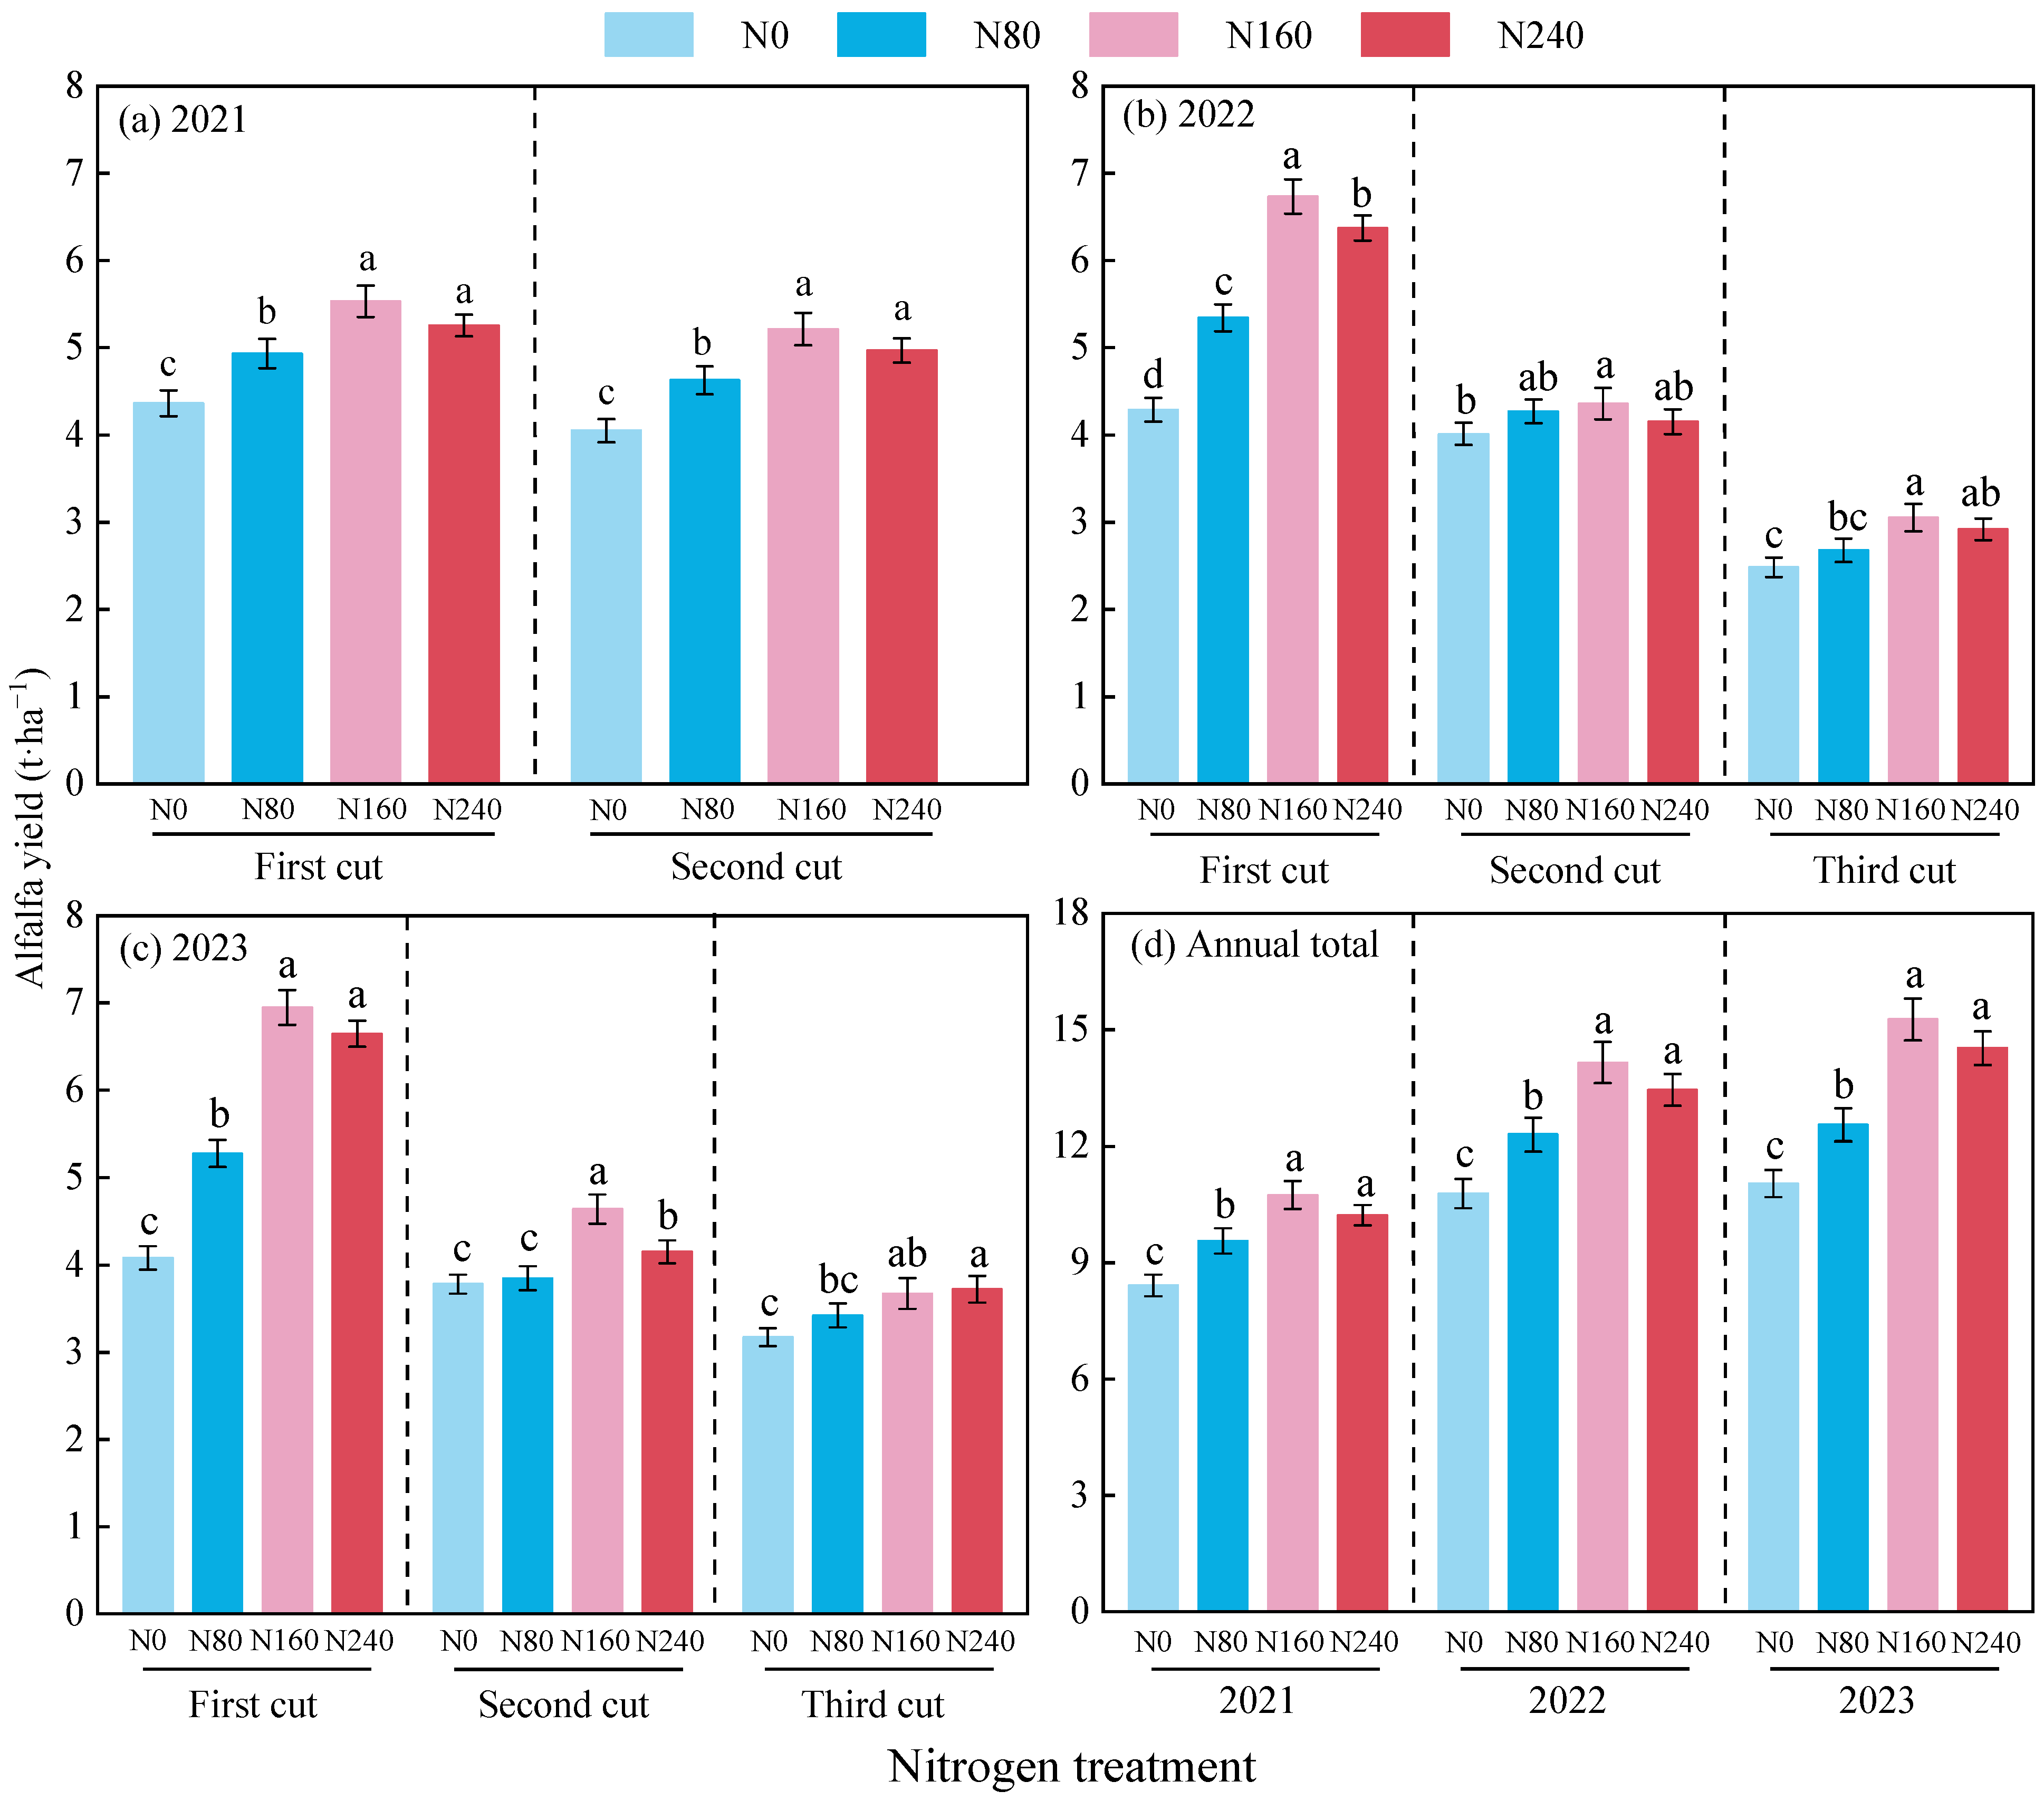
Alfalfa yield showed an increasing trend with the extension of the establishment years, a decreasing trend with the progression of cutting cycles, and a trend of first increasing and then decreasing with the increase in nitrogen application levels (Figure 3). During the three-year growing season, the yields of alfalfa in each cut and annually all showed the pattern N160 > N240 > N80 > N0. Among these, the annual yield of alfalfa in the N160 treatment was 27.74%, 12.39%, and 5.11% higher than that of the N0, N80, and N240 treatments, respectively, in 2021. In 2022, it increased by 31.17%, 15.06%, and 5.23% compared to the N0, N80, and N240 treatments, respectively. In 2023, it increased by 38.26%, 21.66%, and 5.12% compared to the N0, N80, and N240 treatments, respectively.

3.1.2. Nitrogen Use Efficiency

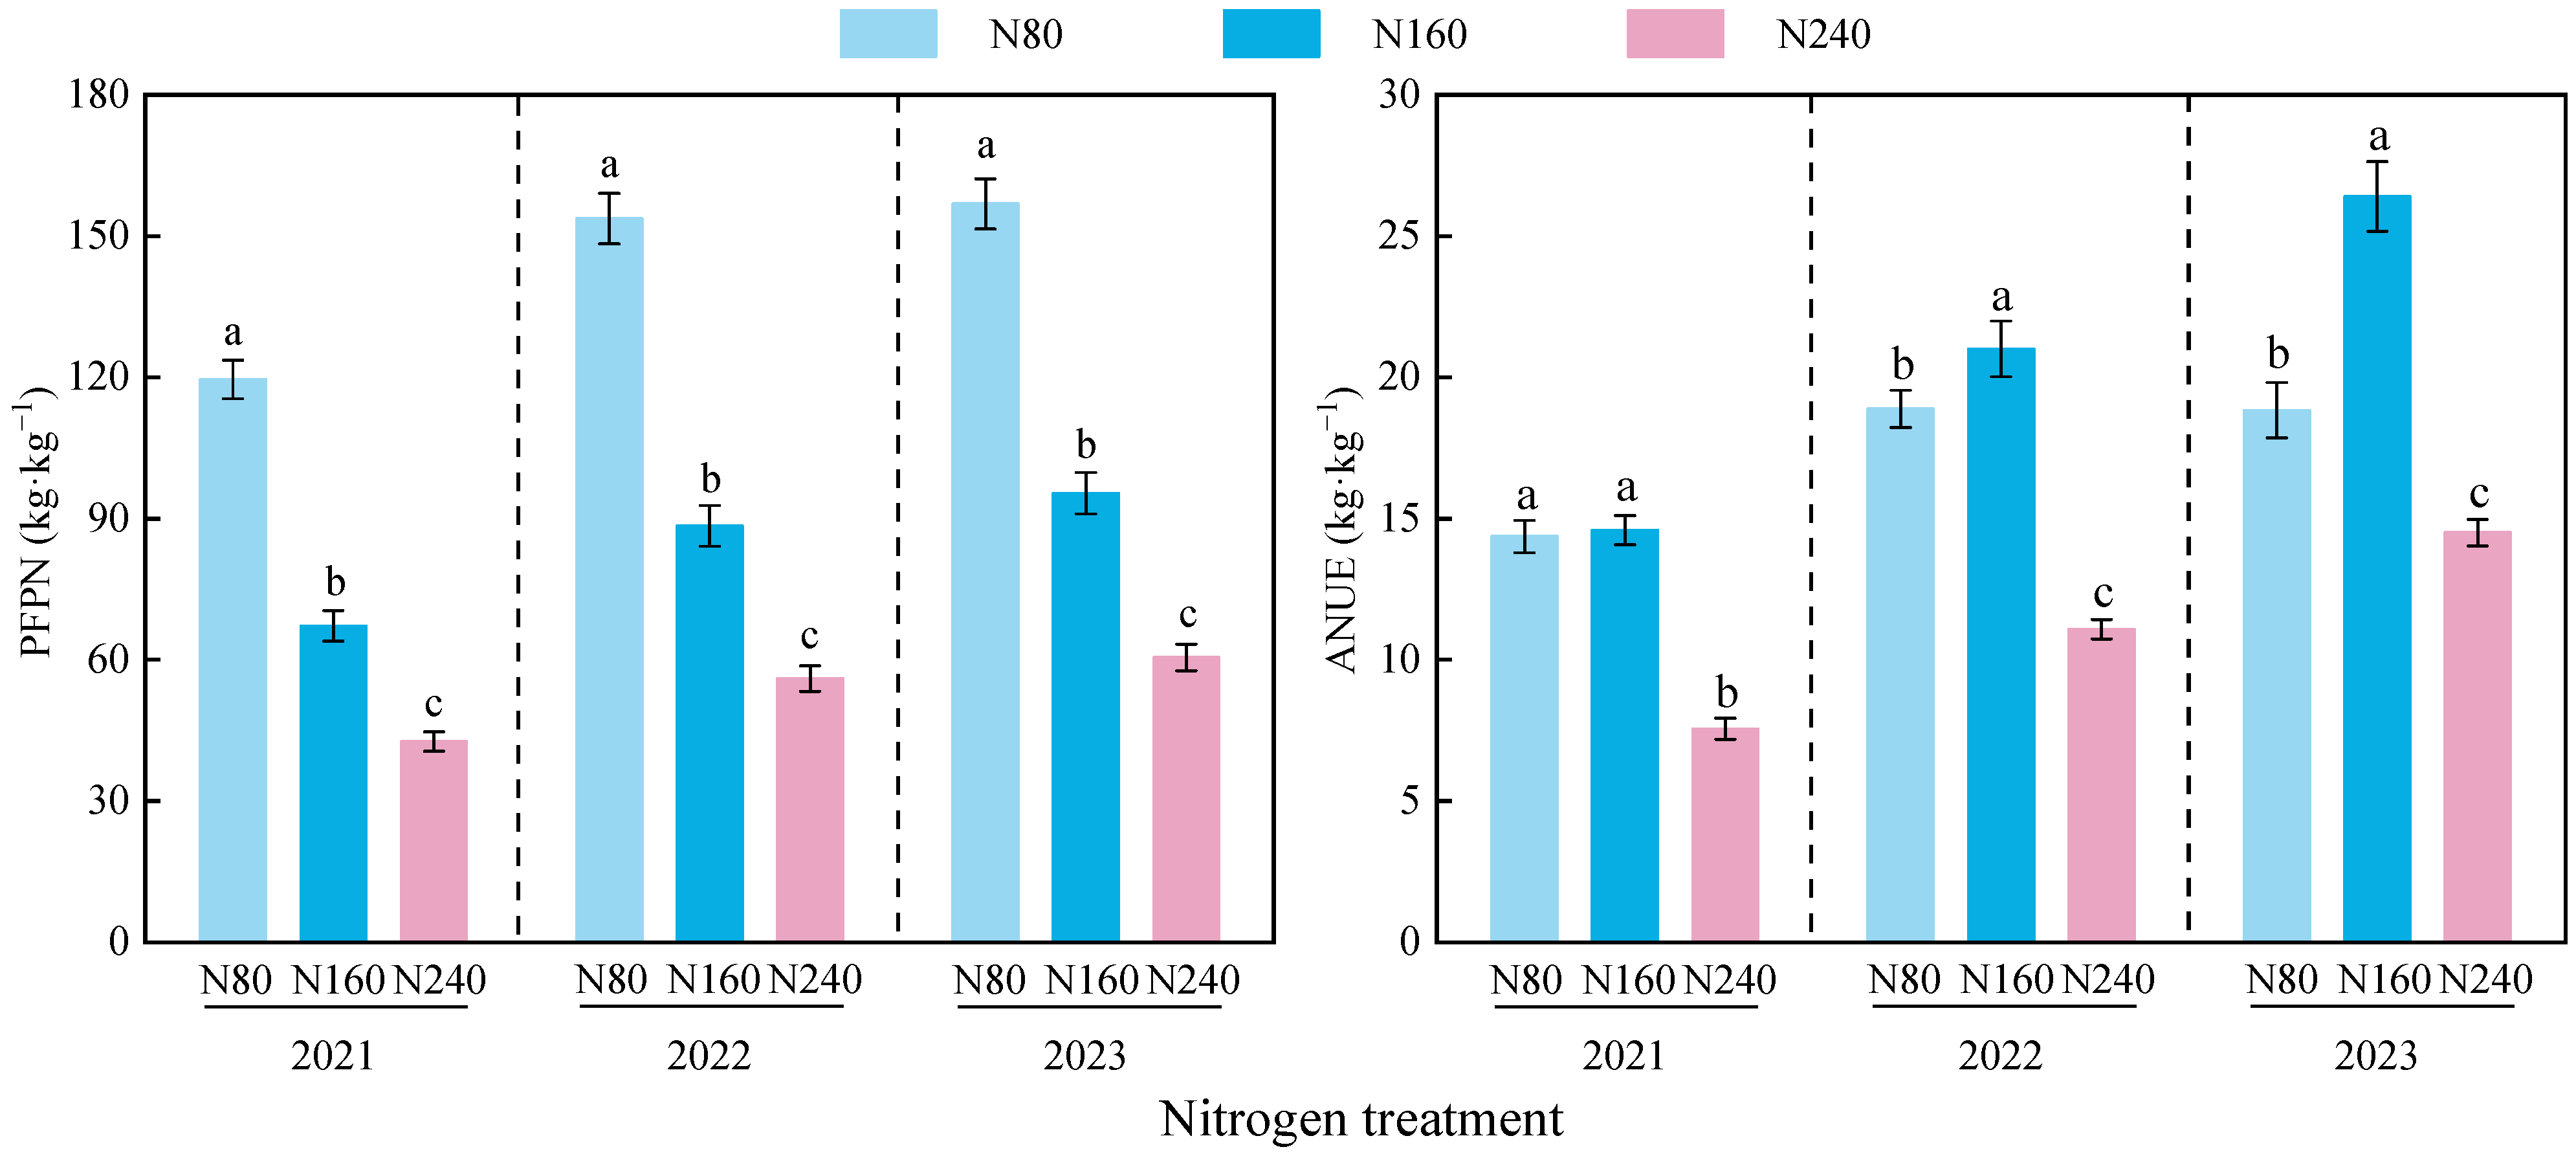
With increasing establishment years, both PFPN and ANUE of alfalfa showed an increasing trend. As nitrogen application levels increased, PFPN exhibited a decreasing trend, while ANUE increased initially and then declined (Figure 4). During the three-year growing season, alfalfa PFPN was highest under the N80 treatment, with average increases of 72.05% and 171.36% compared to the N160 and N240 treatments, respectively; alfalfa ANUE was highest under the N160 treatment, with average increases of 1.59% and 93.24% compared to the N80 and N240 treatments, respectively.

3.2. Verification of the APSIM-Lucerne Model

3.2.1. Verification of the Reproductive Period

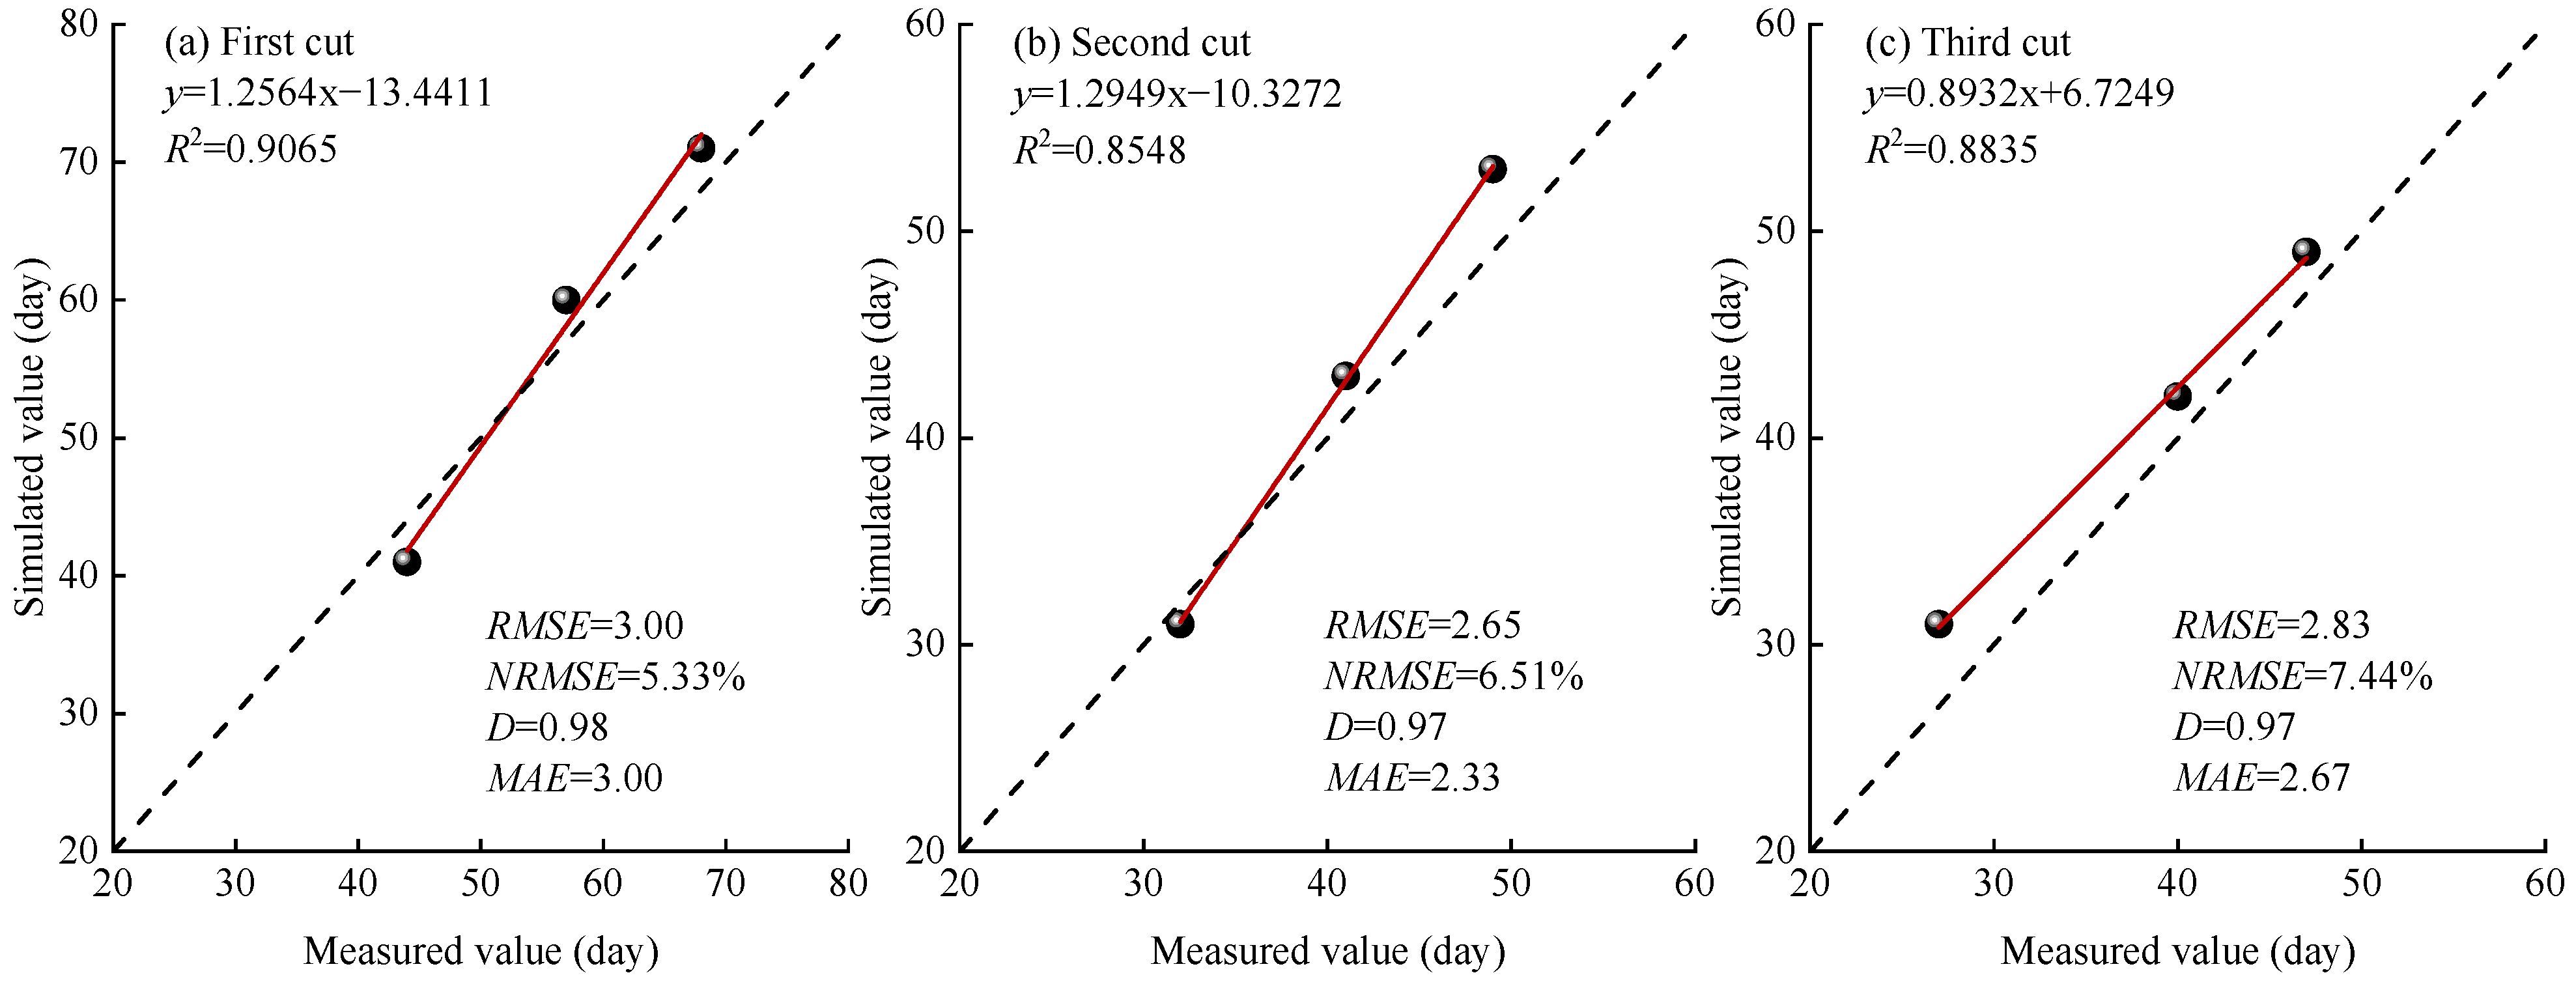
According to the correlation analysis between the observed and simulated phenological stages of alfalfa in 2023 (Figure 5), the coefficient of determination (R2) for the main growth stages of the three cuttings ranged from 0.85 to 0.91, and the index of agreement (D) ranged from 0.97 to 0.98—both approaching 1. Meanwhile, the normalized root mean square error (NRMSE) and mean absolute error (MAE) were between 5.33 and 7.44% and 2.33 and 3.00 days, respectively. These results indicate that the simulated number of days for each growth stage of alfalfa was found to be in good agreement with the measured number of days, indicating good consistency. The APSIM-Lucerne model can accurately simulate the growth process of alfalfa in the study area.

3.2.2. Verification of Yield

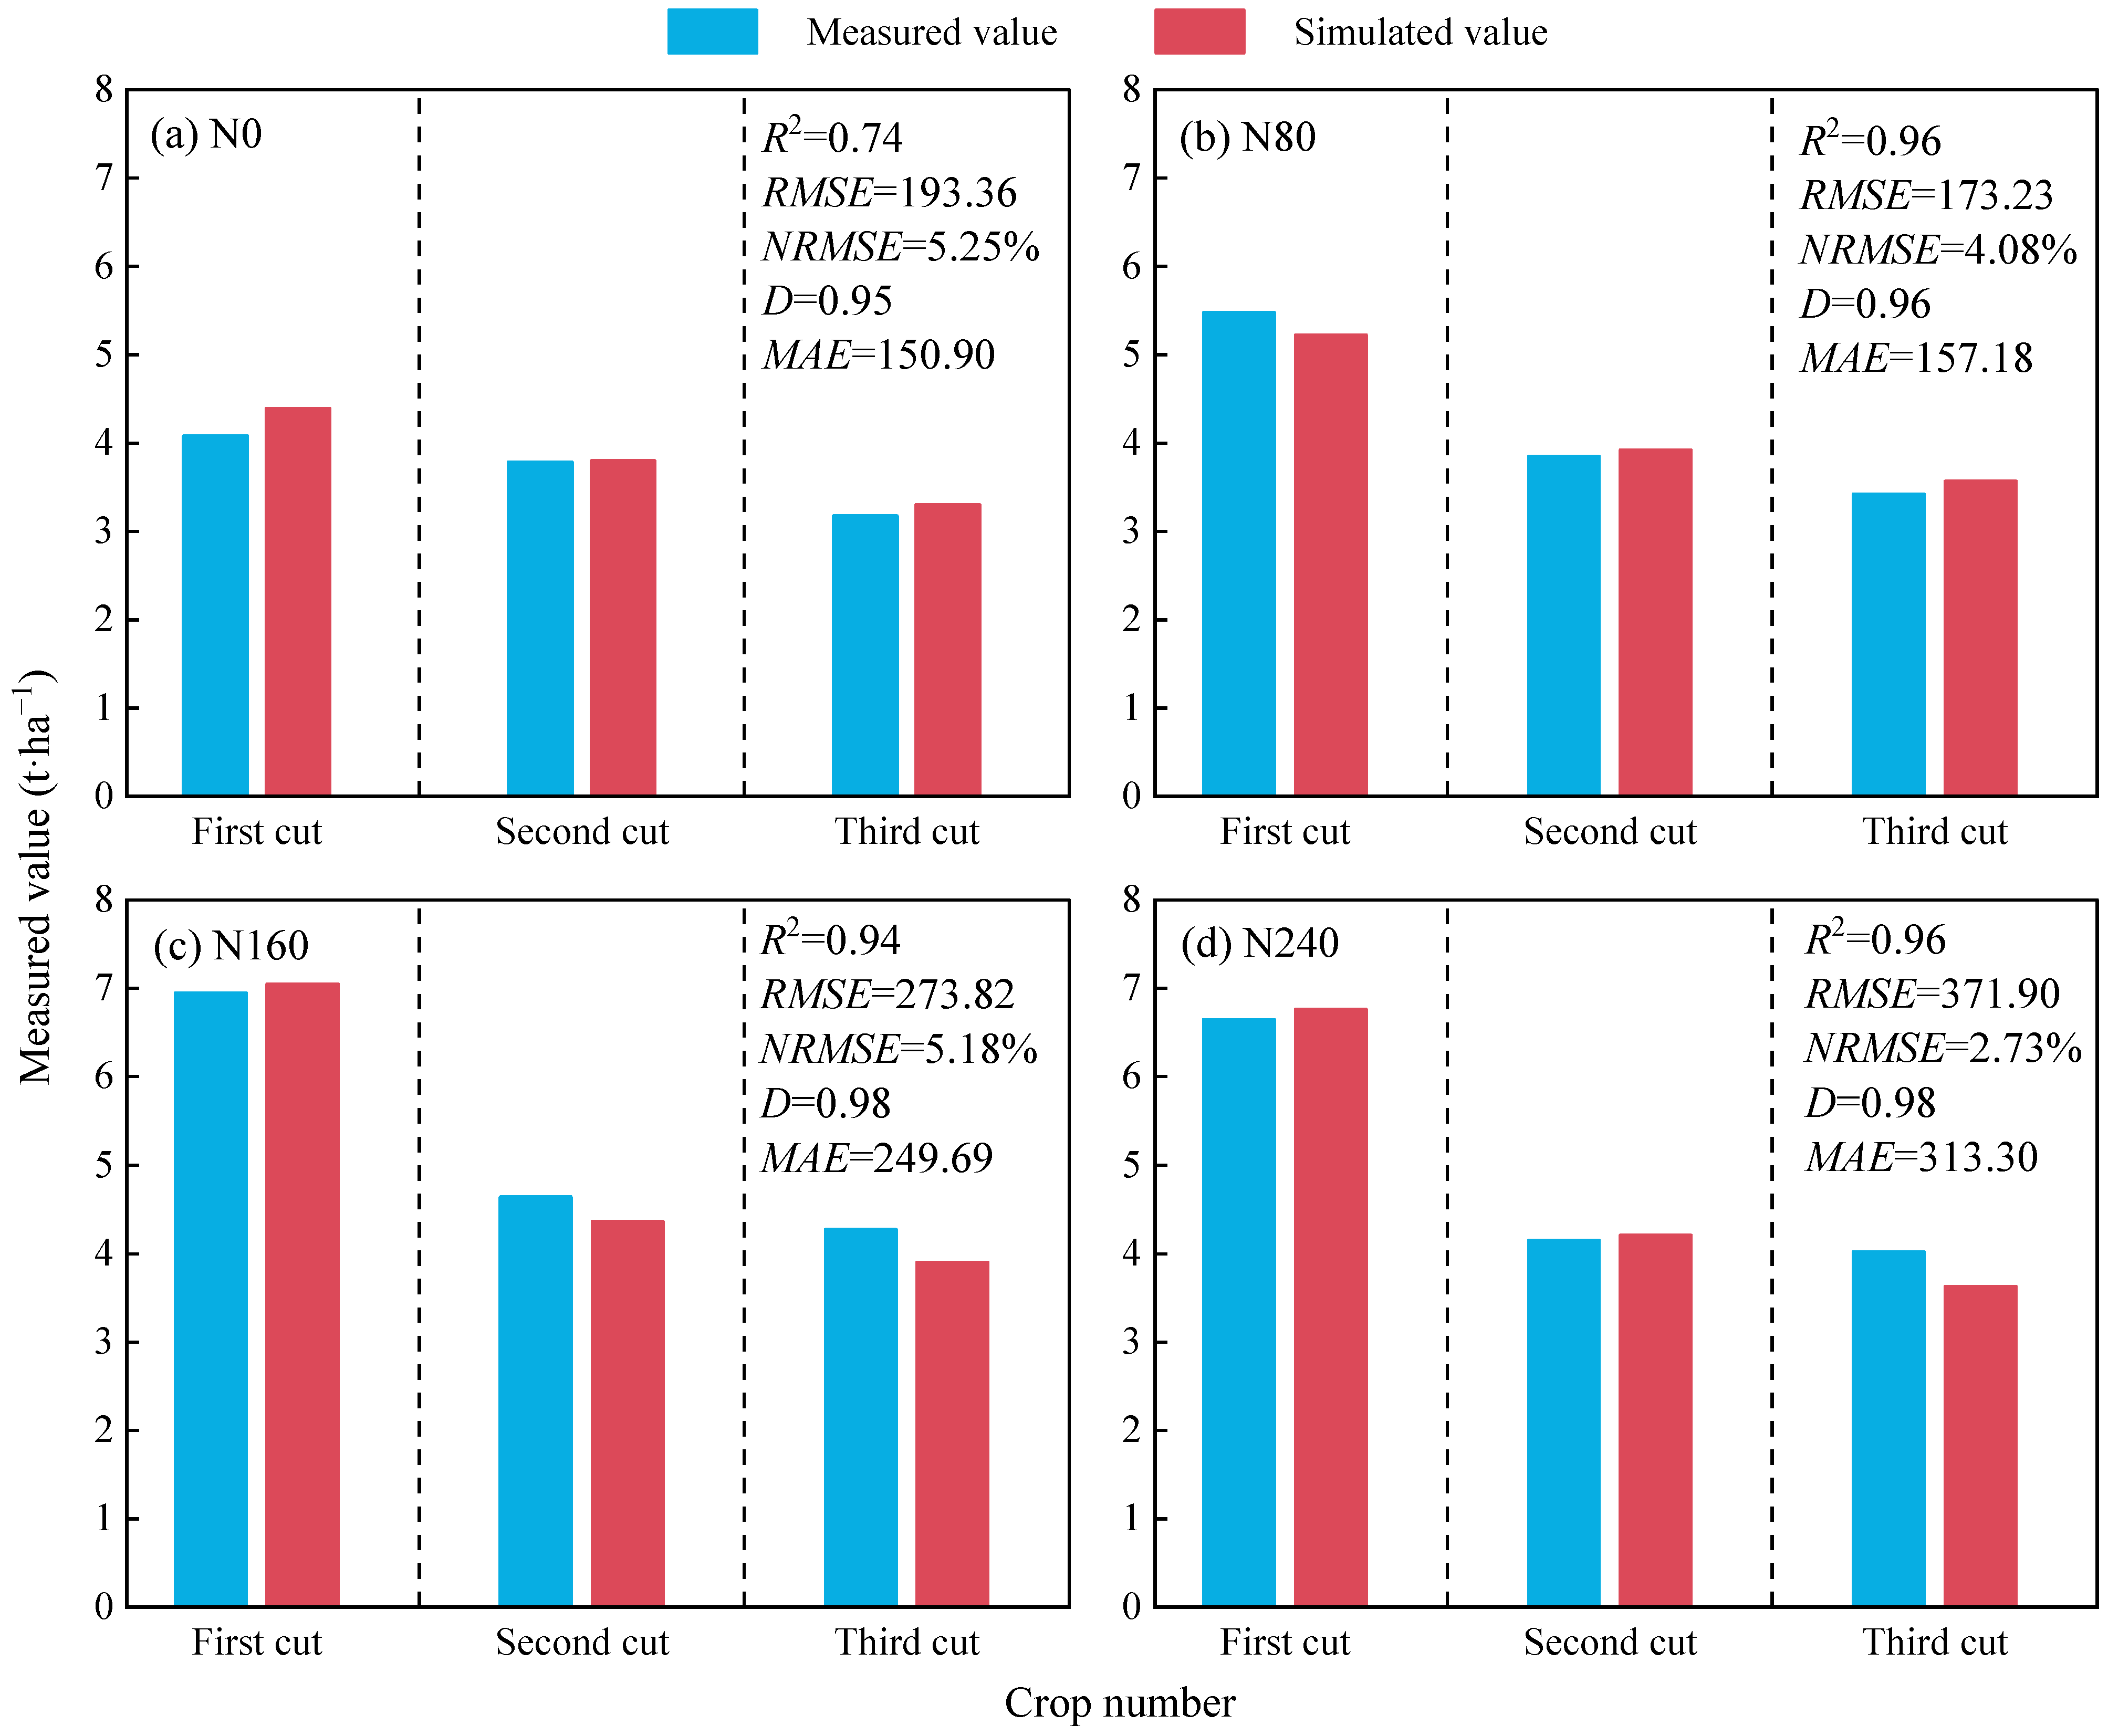
As shown by the correlation analysis between the simulated and observed alfalfa yields in 2023 (Figure 6), the coefficient of determination (R2) and index of agreement (D) under different nitrogen application levels ranged from 0.74 to 0.96 and 0.95 to 0.98, respectively. The normalized root mean square error (NRMSE) and mean absolute error (MAE) ranged from 2.73% to 5.25% and 0.15 to 0.31 t·ha−1, respectively. These results indicate that the yield simulation values closely matched the observed values, with small errors and strong consistency. Therefore, the model can be effectively used in scenario-based simulations to identify optimal nitrogen management strategies for alfalfa under different precipitation year types.

3.3. Selection of Typical Precipitation Year Types

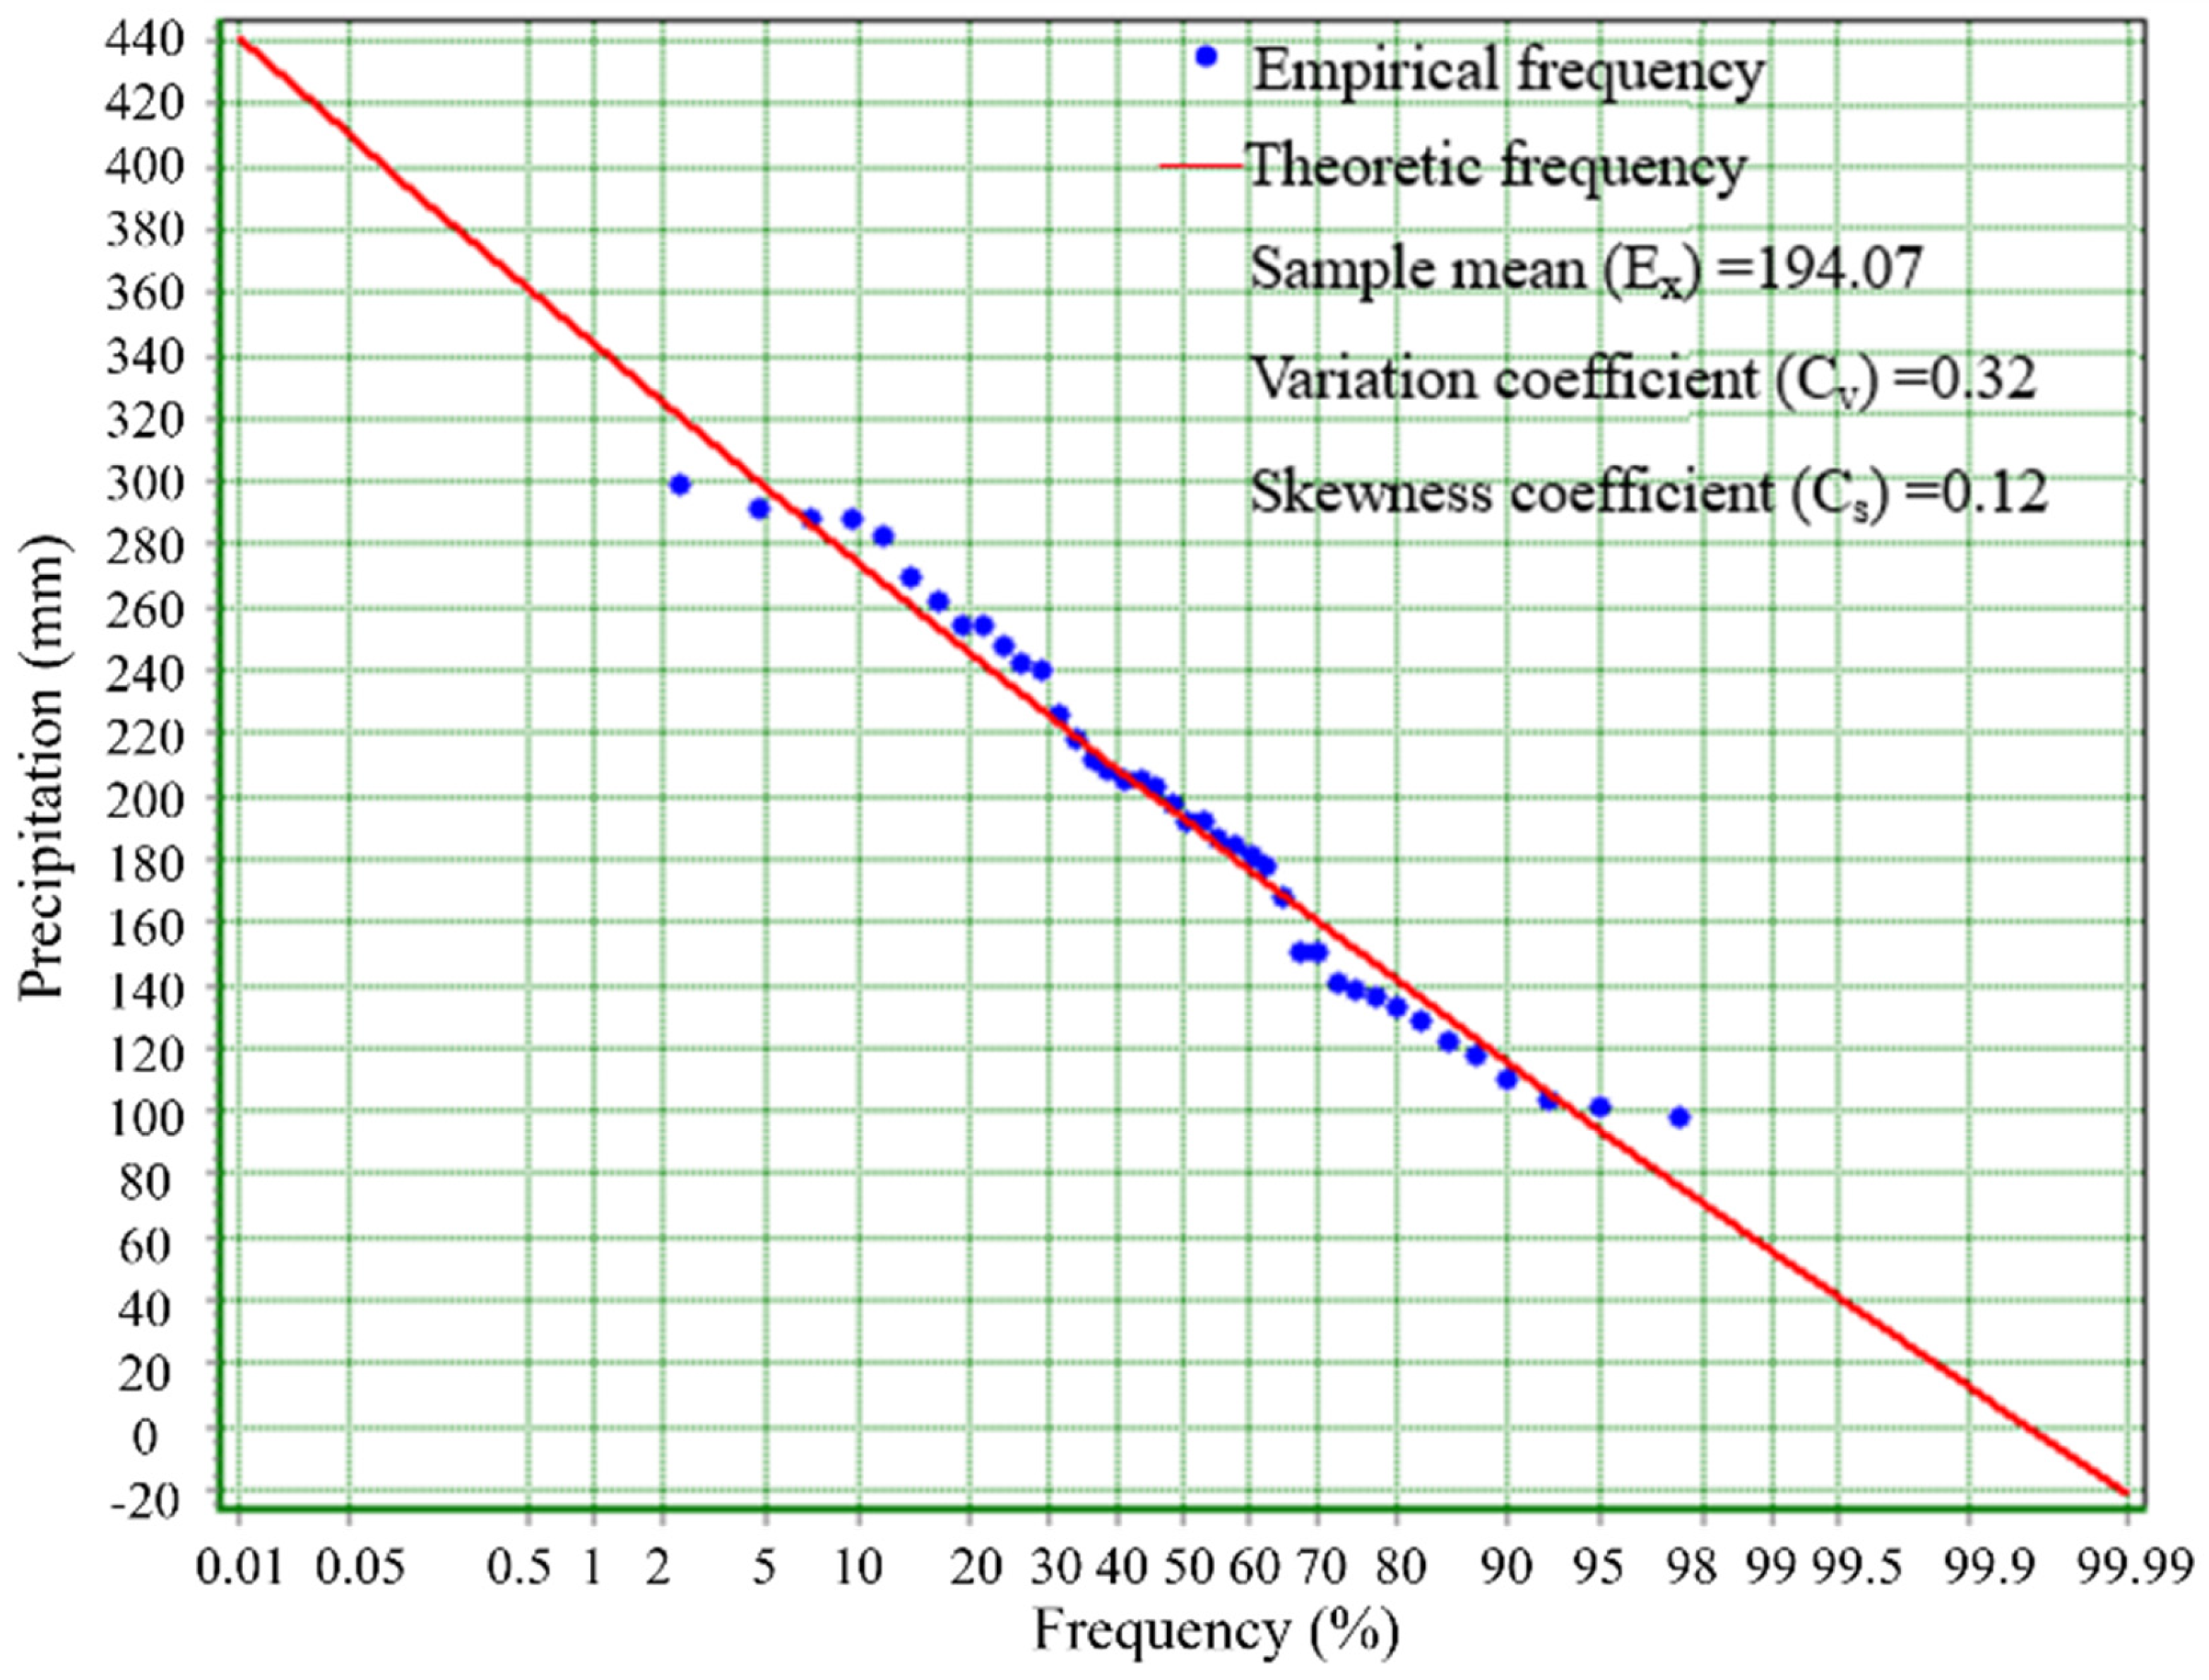
A frequency analysis was conducted based on annual precipitation data from 1985 to 2024 for the study area. The precipitation amounts corresponding to frequencies of p = 75%, 50%, and 25% were selected as the designed values for dry, normal, and wet years, respectively. Subsequently, actual years with precipitation values equal to or close to the designed values were identified from the historical dataset and designated as representative years for each precipitation type. Based on this analysis, the years 1999, 1995, and 2014 were identified as the typical dry year, normal year, and wet year, respectively (Figure 7).

3.4. Simulation of Alfalfa Yield and Nitrogen Use Efficiency Under Different Precipitation Year Types

3.4.1. Simulation of Yield

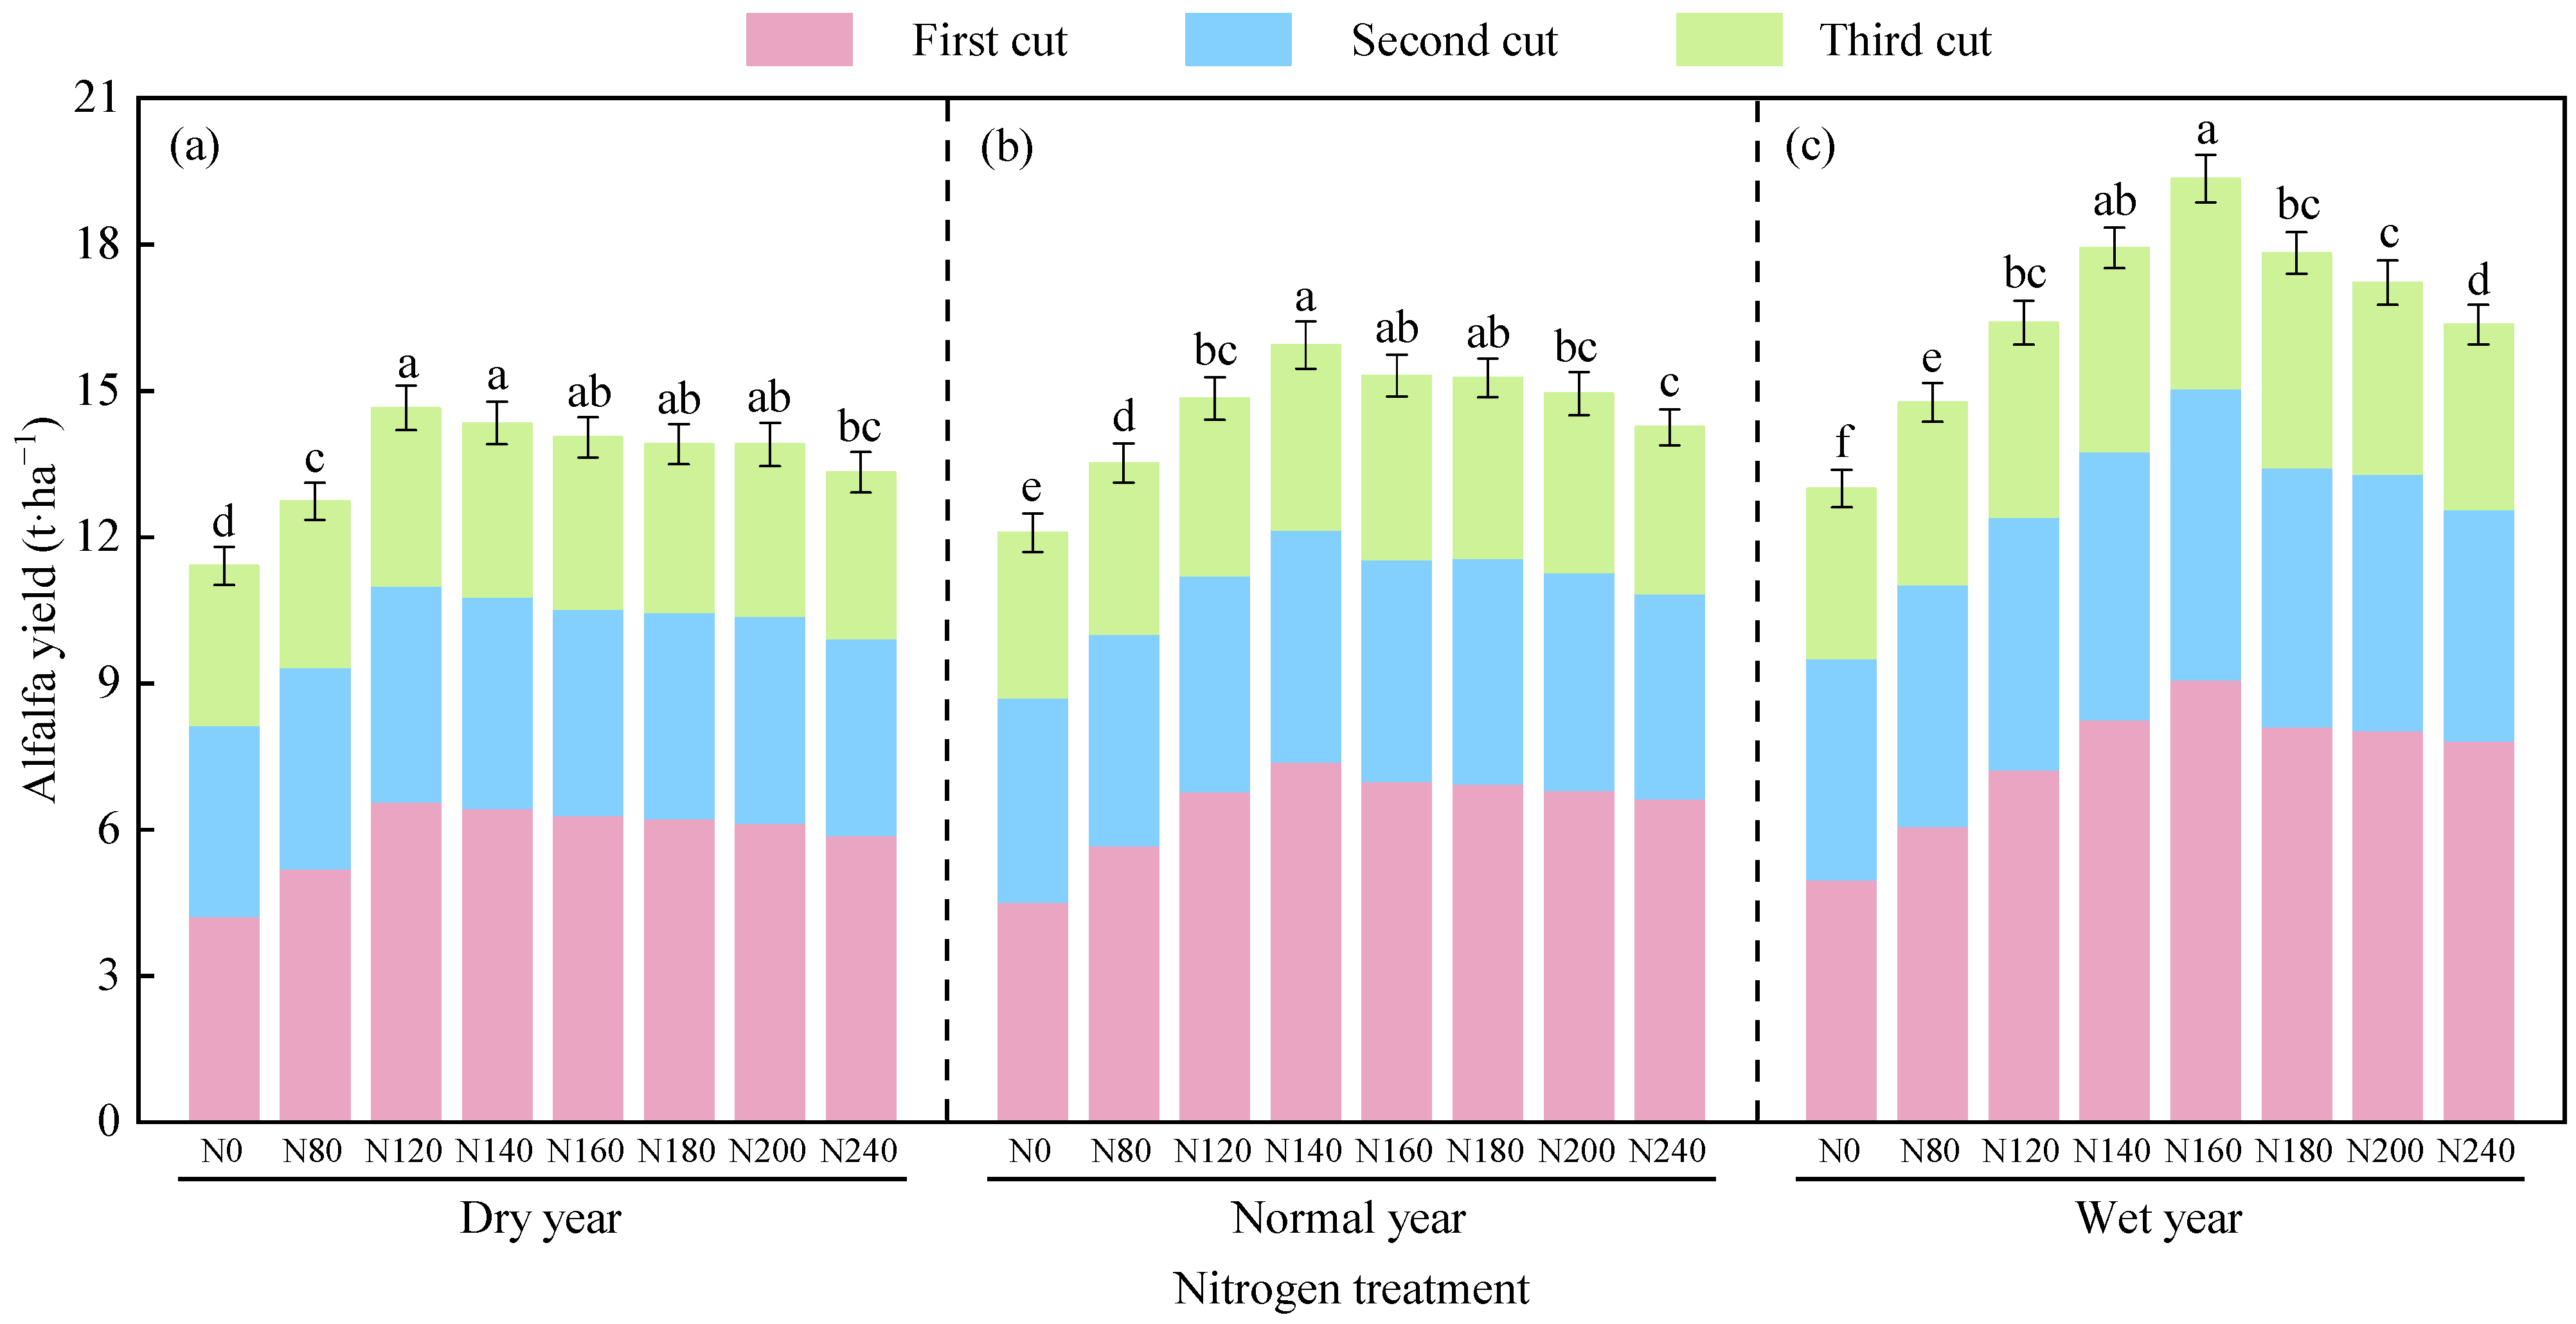
Both precipitation year types and nitrogen application levels had significant effects on alfalfa yield. Alfalfa yields followed the order: wet year > normal year > dry year. As nitrogen application levels increase, yield first increases and then decreases, and a decreasing trend across cutting cycles (Figure 8).
In the dry year, the three-cut and annual yields of alfalfa were in the order of N120 > N140 > N160 > N180 > N200 > N240 > N80 > N0. The annual yield under N120 was 2.16–28.38% higher than that of the other treatments. In the normal year, the three-cut and annual yields of alfalfa were in the order of N140 > N160 > N180 > N200 > N120 > N240 > N80 > N0. The annual yield under N140 was 4.08–31.89% higher than the others. In the wet year, the three-cut and annual yields of alfalfa were in the order of N160 > N140 > N180 > N120 > N200 > N240 > N80 > N0, with the N160 treatment achieving 7.91–48.96% higher annual yield compared to the remaining treatments.

3.4.2. Simulation of Nitrogen Use Efficiency

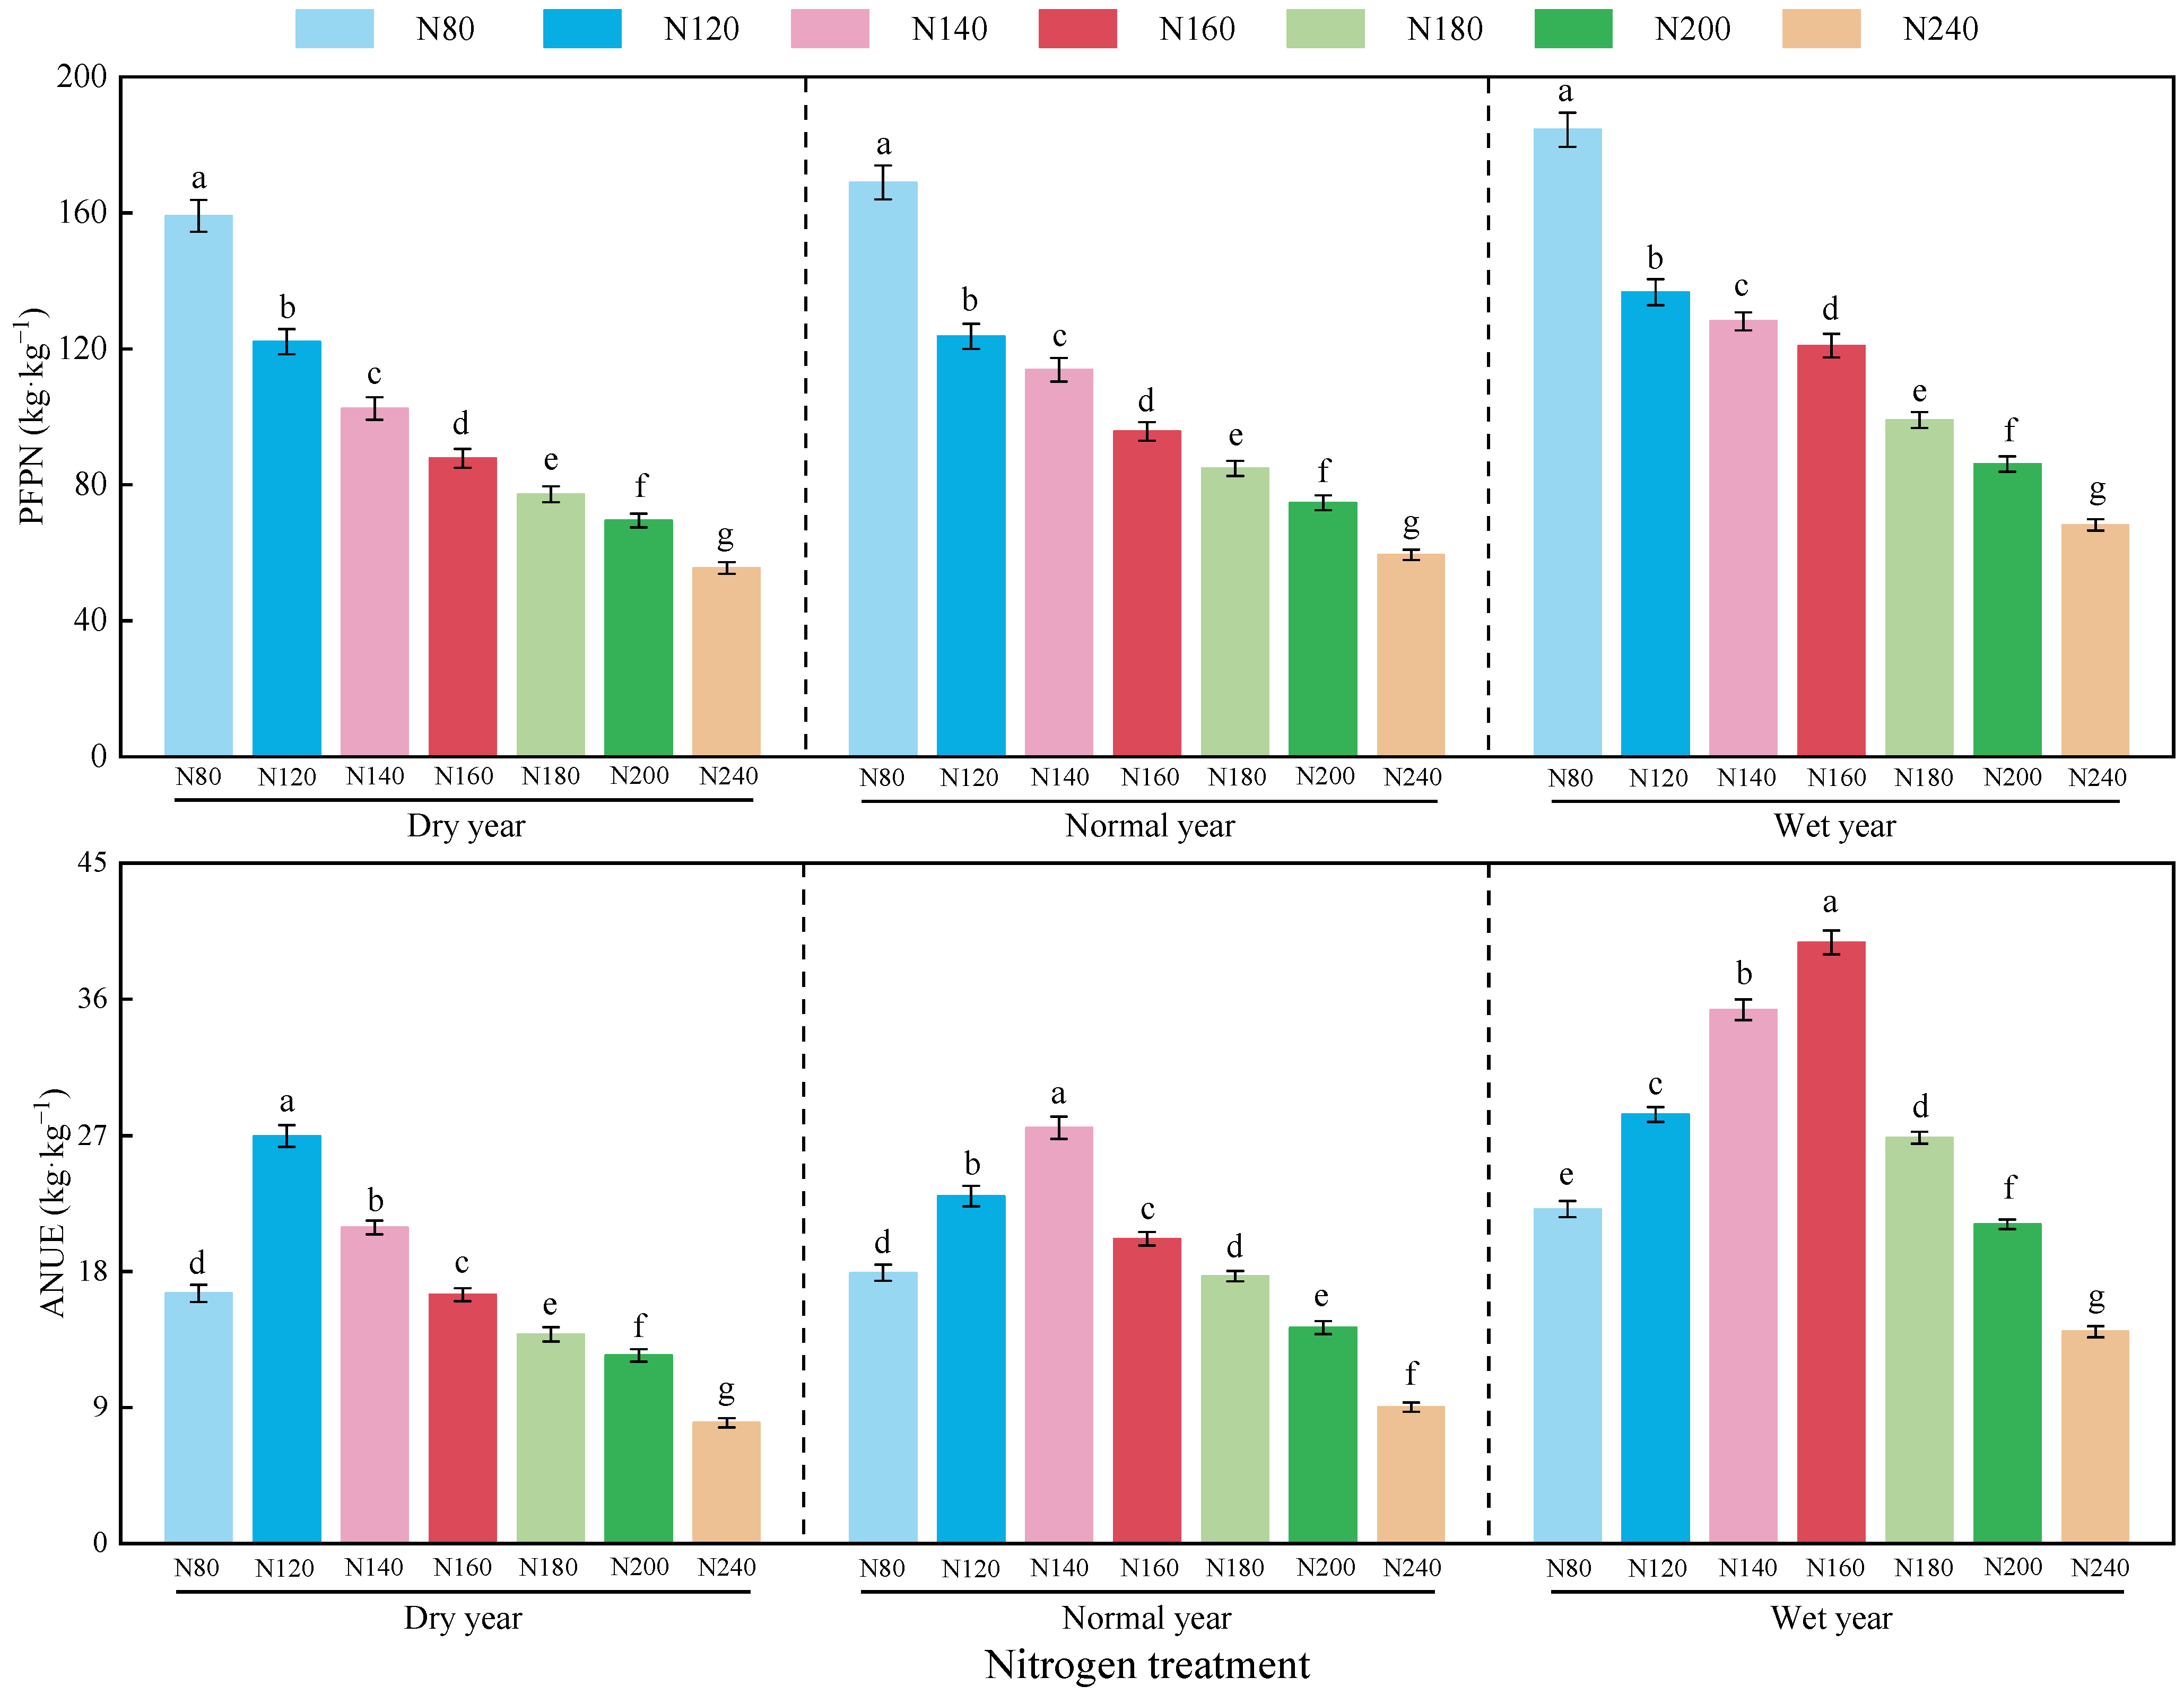
Under the same nitrogen application level, both PFPN and ANUE of alfalfa followed the trend: dry year > normal year > wet year (Figure 9). Under the same precipitation year type, PFPN showed a decreasing trend with increasing nitrogen levels, while ANUE exhibited an initial increase followed by a decline. In the dry year, alfalfa PFPN was highest under the N80 treatment, increasing by 30.41–186.62% compared to other treatments. The highest ANUE occurred under the N120 treatment, with an increase of 28.98–237.38% compared to the others. In the normal year, PFPN also peaked under N80, showing a 36.61–184.55% improvement over the other treatments, while ANUE was highest under N140, with increases of 19.71–204.67%. In the wet year, the maximum PFPN was again observed under N80, with a 35.04–170.71% increase over the others, and ANUE reached its peak under N140, exceeding the other treatments by 12.61–183.26%.

3.5. Comprehensive Evaluation Based on the Entropy Weight-TOPSIS Model

After normalization of alfalfa’s annual yield, PFPN, and ANUE under different precipitation year types and nitrogen application levels (Table 4), the indicator weights were determined using the entropy weight method (Table 5). The resulting weights ranked as PFPN > ANUE > Yield. Based on the evaluation results of the entropy weight-TOPSIS model (Figure 10), the top-ranked nitrogen treatments under dry, normal, and wet years were N120, N140, and N160, respectively.

4. Discussion

4.1. Applicability of APSIM-Lucerne Model for Simulating Alfalfa

The APSIM model adopts a modular architecture with separate “crop–soil–weather–management” components, where each crop (such as wheat, maize, or alfalfa) has independent physiological process modules; through adjusting crop physiological parameters, light use efficiency, soil parameters, and other factors within the modules, localized parameterization of different crops under various regional and field management conditions is achieved, and the model supports operations such as irrigation, fertilization, rotation, and cutting (for alfalfa), which can accurately reflect the impact of changing environment on crop growth [32,33]. Calibration and validation are key to model simulation of crop applicability under different regional and field management conditions. Based on meteorological, soil, crop, and field management data from the study area during 2021–2023, the calibration and validation of the APSIM-Lucerne model for alfalfa growth processes and yield in this study found that under different nitrogen application levels, the simulation errors for alfalfa regreening–branching period, regreening–budding period, and regreening–initial flowering period were all less than 7 days (R2 = 0.85−0.91, NRMSE = 5.33–7.44%), and the R2 for yield simulation was 0.76–0.96 with NRMSE of 2.73–5.25%. This is similar to the results of Man et al. [34] applying the APSIM model for crop yield simulation in winter wheat (NRMSE = 19.8%), Gulnazar Ali et al. [35] in alfalfa (NRMSE = 22.4%), and Thompson et al. [36] in maize (NRMSE = 6.5%). This indicates that the APSIM-Lucerne model can effectively simulate the growth and development process of alfalfa in the Yellow River irrigation area of Gansu Province.

4.2. Effect of Precipitation Year Type and Nitrogen Application Level on Alfalfa Yield

Nitrogen and moisture are two key factors affecting alfalfa growth, which are both synergistic and constrain each other [37]. In this study, it was found that alfalfa yield showed an increasing and then decreasing trend with increasing levels of nitrogen application. Alfalfa yield was highest at 160 kg·ha−1 in all three growing seasons, and it was increased by an average of 32.39%, 16.37%, and 5.15% compared with the N0, N80, and N240 treatments, respectively. It was consistent with the findings of Wan et al. [38] on spring wheat and Yin et al. [39] on alfalfa. With the increase in N application, alfalfa yield would have a diminishing return effect. Appropriate nitrogen application can significantly enhance alfalfa productivity through a multi-pathway synergistic mechanism. Firstly, nitrogen, as a key structural component of chlorophyll and Rubisco enzyme, can significantly enhance photosynthetic efficiency, optimize carbon and nitrogen metabolism, and promote an increase in crude protein content [40]. Secondly, an appropriate level of available nitrogen in the soil can not only stimulate nitrogen fixation in root nodules through the “nitrogen explosion effect”, increasing the activity of nitrogenase, but also promote root development, thereby improving the absorption efficiency of mineral nutrients such as phosphorus and potassium. In addition, an appropriate supply of nitrogen can increase proline content and stomatal regulation ability, significantly improving water use efficiency. Moreover, the preferential absorption characteristic of nitrate nitrogen helps maintain soil pH stability [41]. Insufficient nitrogen application can lead to a decrease in the effective nitrogen content in the soil, and the nitrogen fixation rate of alfalfa root nodules cannot fully compensate for the nitrogen deficiency, thereby inhibiting the activity of nitrate reductase, reducing amino acid synthesis, and further restricting the absorption and transport of other nutrients (such as phosphorus and potassium). This results in a decline in leaf chlorophyll content, a decrease in photosynthetic efficiency, and ultimately leads to a reduction in the number of branches, a slowdown in regrowth speed, and a significant impact on the yield and quality of alfalfa. Excessive nitrogen application can significantly increase the electrical conductivity of soil solution, leading to secondary soil salinization and nutrient imbalance, damaging the morphology and physiological activity of root systems, interfering with the interaction of rhizosphere microorganisms, and ultimately causing disorders in carbon and nitrogen metabolism of crops, as well as a decline in yield and quality [42]. However, Delevatti et al. [43] found that the yield of pasture grass (Marandu grass) tended to increase with increasing levels of N application. This differs from the results of the present study, probably due to the large differences in climate and soil conditions between the two study areas. Northwest China is located in an arid region with scarce and unevenly distributed precipitation and high potential evaporation. High N application leads to increased soil salinization and deterioration of soil moisture conditions. This synergistic deterioration of salinization and moisture conditions disrupts crop rhizosphere cells and soil microbial communities, thereby inhibiting crop absorption of water and nutrients and limiting crop growth [44]. In contrast, tropical regions have abundant precipitation, strong “moisture-regulated fertilizer” ability, and higher crop demand and tolerance of N fertilizer. In addition, the maximum level of N application set by Delevatti et al. may not have reached their crop N uptake threshold. Precipitation and spatial and temporal distribution of precipitation are key indicators affecting soil moisture status and crop growth and development in agricultural fields. In this study, simulation of three typical precipitation year types in the study area from 1985 to 2024 based on the APSIM-Lucerne model found that alfalfa yield showed wet year > normal year > dry year. Similarly, Zhao et al. [45] in the North China Plain also concluded that the higher the annual precipitation, the higher the yield of winter wheat and summer maize. In addition, this study found that the N application thresholds for alfalfa were 120 kg·ha−1, 140 kg·ha−1, and 160 kg·ha−1 in dry, normal, and wet years, respectively. The N application thresholds were different from those derived by Wang et al. [46] in the winter wheat study (150 kg·ha−1 in dry and normal years, and 180 kg·ha−1 in wet years). This may be because different precipitation patterns regulate the spatiotemporal distribution of soil moisture, crop water consumption rhythms, and nitrogen migration pathways, resulting in significant differences in crop water-nitrogen coupling efficiency and nitrogen application thresholds. Under different precipitation year types, there are significant differences in soil moisture between the two study areas, and the appropriate amount of soil moisture can promote crop development and nutrient uptake, and increase yields. Insufficient or excessive moisture can reduce crop resistance to lodging, causing stress on normal crop growth and development and reducing yield [47], which in turn leads to differences in their N application thresholds. In addition, alfalfa, as a leguminous pasture, has a strong rhizomatous nitrogen fixation capacity, thus reducing the dependence on nitrogen in soil and fertilizer [48]. However, wheat, as a grass grain crop, has no biological nitrogen fixation capacity, and all the nitrogen required for its growth has to be obtained from the soil; therefore, its demand for exogenous nitrogen fertilizer is higher than that of alfalfa.

4.3. Effects of Precipitation Year Type and Nitrogen Application Level on Alfalfa Nitrogen Use Efficiency

Appropriate nitrogen application can effectively promote nitrogen transport and absorption in alfalfa, increase the contribution proportion of plant nitrogen uptake to alfalfa yield, fully utilize the potential of plant nitrogen supply and sink capacity, to form a good sink-source balance [26]. Meanwhile, it can reduce soil nitrogen leaching and volatilization, decrease environmental pollution, and thus improve nitrogen use efficiency. This study found that alfalfa PFPN decreased with increasing nitrogen application rate, while ANUE first increased and then decreased with increasing nitrogen application rate. This is consistent with the research results of Lu et al. [25] and Lv et al. [26]. This may be because as nitrogen application levels increase, the nitrogen absorbed and utilized by crops relatively decreases, while nitrogen residue in soil relatively increases, increasing the risk of nitrogen loss in the root zone soil, thus gradually reducing nitrogen use efficiency. In addition to nitrogen application rate, soil moisture is also a key factor affecting alfalfa nitrogen use efficiency. This study showed that alfalfa PFPN performed as wet years > normal years > dry years (Figure 9) under optimal nitrogen application levels, and alfalfa ANUE performed as wet years > normal years > dry years (Figure 9). This may be because in wet years, water and nitrogen are highly coordinated, and sufficient moisture supply results in higher soil oxygen content, which is conducive to alfalfa root growth and expansion, thereby improving nitrogen use efficiency. In normal years, due to a relatively limited moisture supply, some nitrogen in the soil may not be able to diffuse to the alfalfa rhizosphere in time, leading to reduced nitrogen uptake efficiency. In dry years, moisture stress severely inhibits alfalfa root growth, and most of the applied nitrogen cannot be effectively utilized. Therefore, both PFPN and ANUE of alfalfa are lowest in dry years, and their “optimal nitrogen application rate” is also significantly lower than in wet years.
This study calibrated and validated the APSIM-Lucerne model based on three years of field measurement data, concluding that it has good applicability in the study area. To further improve the applicability of the APSIM-Lucerne model in the study area and reduce uncertainty in parameter localization and model simulation, future research should enhance the model’s dynamic regulation of variety, sowing date, planting density, water and fertilizer management, and other measures [49,50]. Meanwhile, the effects of nitrogen application rate and extreme climate on alfalfa yield and nitrogen use efficiency should be further explored to timely predict potential production risks and adjust management strategies.

5. Conclusions

This study investigated the effects of different precipitation patterns and nitrogen application rates on alfalfa yield and nitrogen fertilizer use efficiency through a three-year field trial combined with model simulation: (1) Alfalfa yield shows an increasing trend with the extension of establishment years and a trend of first increasing and then decreasing with increasing nitrogen application levels. ANUE shows a trend of first increasing and then decreasing with increasing nitrogen application levels. PFPN shows a decreasing trend with increasing nitrogen application levels. The N160 treatment resulted in relatively high values for yield, ANUE, and PFPN. (2) The calibrated APSIM-Lucerne model accurately simulated alfalfa growth processes (R2 = 0.85–0.91, NRMSE = 5.33–7.44%) and yield formation (R2 = 0.74–0.96, NRMSE = 2.73–5.25%). (3) The APSIM-Lucerne model predicts efficient nitrogen application rates for drought, normal water, and abundant water years to be 120 kg·ha−1, 140 kg·ha−1, and 160 kg·ha−1, respectively. In future research, the APSIM-Lucerne model can be combined with remote sensing monitoring technology to develop a multi-source data fusion nitrogen fertilizer dynamic regulation system, establishing a “space–aircraft–ground” collaborative alfalfa precision management technology system, enabling precise determination of optimal nitrogen application rates, timing, and depth. This approach will support the quality improvement and efficiency enhancement of the regional forage industry and the development of precision agriculture.

Author Contributions

Conceptualization, Y.W. (Yanbiao Wang), M.Y. and Y.M.; methodology, Y.L., Y.W. (Yanbiao Wang), H.L. (Haiyan Li) and Y.J.; formal analysis, Y.W. (Yanbiao Wang), Y.D., B.L. and J.C.; resources, G.Q. and Y.K.; writing—original draft preparation, Y.W. (Yanbiao Wang); writing—review and editing, Y.J., H.L. (Huile Lv), and Y.W. (Yayu Wang); supervision, Y.W. (Yanbiao Wang); project administration, Y.M. and Y.K.; funding acquisition, G.Q. and G.S. All authors have read and agreed to the published version of the manuscript.

Funding

This study was funded by the National Natural Science Foundation of China (NSFC) Regional Program (Grant Nos. 52069001 and 52269009); Gansu Province Higher School Innovation Fund Project (Grant No. 2023A-054); Gansu Agricultural University, the fifth batch of “Fuxi Young Talents” project (Grant No. Gaufx-05Y11); Doctoral Research Startup Fund Project of Gansu Agricultural University (GAU-KYQD-2024-31); Gansu Agricultural University the Youth Tutor Support Fund (Grant No. GAU-QDFC-2023-12); and the Gansu Agricultural University “Innovation of Efffcient Utilization of Soil and Water Resources for Specialty Crops in NorthwestArid Regions” Discipline Team Building Special Project (Grant No. GAU-XKTD-2022-09).

Data Availability Statement

All data supporting this study are included in the article.

Acknowledgments

Thanks to the Gansu Jingtai Goji Berry Science and Technology Courtyard, Gansu Province Goji Berry Harmless Cultivation Engineering Research Center, Gansu Province Agricultural Smart Water-saving Technology Innovation Center, and the Research Center for Ecological Protection and Coordinated Development of Agriculture in the Upper and Middle Reaches of the Yellow River for supporting this study; thanks to the editors and reviewers for your valuable and constructive comments.

Conflicts of Interest

The authors declare no conflicts of interest.

References

  1. Han, X.W.; Wu, K.; Fu, X.D.; Liu, Q. Improving coordination of plant growth and nitrogen metabolism for sustainable agriculture. aBIOTECH 2020, 1, 255–275. [Google Scholar] [CrossRef] [PubMed]
  2. Zhang, Q.Z.; Hao, G.; Li, H.Y. Research progress on the effectiveness and form of exogenous nitrogen input and its impact on plant growth and physiology. J. Ecol. 2024, 43, 878–887. [Google Scholar]
  3. Wang, Q.; Ou, E.L.; Wang, P.C.; Chen, Y.; Wang, Z.W.; Fang, X.W.; Zhang, J.L. Bacillus amyloliquefaciens GB03 augmented tall fescue growth by regulating phytohormone and nutrient homeostasis under nitrogen deficiency. Front Plant Sci. 2022, 13, e979883. [Google Scholar] [CrossRef] [PubMed]
  4. Li, T.Y.; Yao, L.; Zhong, Y.X.; Wang, Y.; Li, W.F.; Xu, Y.; Li, D.J.; Liu, R.; Li, B.; Zhang, W.F. Nitrogen fertilizer demand in China in the context of green development. Acta Pedol. Sin. 2025, 62, 308–321. [Google Scholar]
  5. Li, M.Y.; Wu, T.X.; Wang, S.D.; Sang, S.; Zhao, Y.T. Phenology–gross primary productivity (GPP) method for crop information extraction in areas sensitive to non-point source pollution and its influence on pollution intensity. Remote Sens. 2022, 14, 2833. [Google Scholar] [CrossRef]
  6. Chen, Y.; Hu, S.; Guo, Z.; Cui, T.; Jin, Y. Effect of balanced nutrient fertilizer: A case study in pinggu district, Beijing, China. Sci. Total Environ. 2020, 754, 142069. [Google Scholar] [CrossRef]
  7. Kabuba, J.; Lephallo, J.; Rutto, H. Comparison of various technologies used to eliminate nitrogen from wastewater: A review. J. Water Process Eng. 2022, 48, 102885. [Google Scholar] [CrossRef]
  8. Wan, K.L.; Yu, Y.D. Optimizing the irrigation schedule for winter wheat-summer maize using APEX model. Trans. Chin. Soc. Agric. Eng. 2025, 41, 118–126. [Google Scholar]
  9. Zhang, T.X.; Su, J.Y.; Liu, C.J.; Chen, W.H. State and parameter estimation of the AquaCrop model for winter wheat using sensitivity informed particle filter. Comput. Electron. Agric. 2020, 180, 105909. [Google Scholar] [CrossRef]
  10. Guo, J.P. Discussion on problems in the development and application of crop growth model. Chin. J. Appl. Ecol. 2025, 36, 1579–1589. [Google Scholar]
  11. Zhu, J.L.; Zeng, W.Z.; Ma, T.; Lei, G.Q.; Zha, Y.Y.; Fang, Y.H.; Wu, J.W.; Huang, J.S. Testing and improving the WOFOST model for sunflower simulation on saline soils of inner mongolia, China. Agronomy 2018, 8, 172. [Google Scholar] [CrossRef]
  12. Strer, M.; Svoboda, N.; Herrmann, A. Abundance of adverse environmental conditions during critical stages of crop production in Northern Germany. Environ. Sci. Eur. 2018, 30, 10. [Google Scholar] [CrossRef] [PubMed]
  13. Palosuo, T.; Hoffmann, M.; Rtter, R.; Lehtonen, H. Sustainable intensification of crop production under alternative future changes in climate and technology: The case of the North Savo region. Agric. Syst. 2021, 190, 103135. [Google Scholar] [CrossRef]
  14. Holzworth, D.P.; Huth, N.I.; Devoil, P.G.; Zurcher, E.J.; Herrmann, N.I. APSIM—Evolution towards a new generation of agricultural systems simulation. Environ. Model. Softw. 2014, 62, 327–350. [Google Scholar] [CrossRef]
  15. Akram, H.; Levia, D.F.; Herrick, J.E.; Lydiasari, H.; Schütze, N. Water requirements for oil palm grown on marginal lands: A simulation approach. Agric. Water Manag. 2022, 260, 107292. [Google Scholar] [CrossRef]
  16. Wu, Y.S.; Wang, E.L.; He, D.; Liu, X.; Archontoulis, S.V.; Huth, N.I.; Zhao, Z.G.; Gong, W.Z.; Yang, W.Y. Combine observational data and modelling to quantify cultivar differences of soybean. Eur. J. Agron. 2019, 111, 125940. [Google Scholar] [CrossRef]
  17. Chaki, A.K.; Gaydon, D.S.; Dalal, R.C.; Bellotti, W.D.; Gathala, M.K.; Hossain, A.; Menzies, N.W. How we used APSIM to simulate conservation agriculture practices in the rice–wheat system of the Eastern Gangetic Plains. Field Crop. Res. 2022, 275, 108344. [Google Scholar] [CrossRef]
  18. Carcedo, A.; Bastos, L.M.; Yadav, S.; Mondal, M.K.; Jagadish, S.V.K.; Kamal, F.A.; Sutradhar, A.; Prasad, P.; Ciampitti, I.A. Assessing impact of salinity and climate scenarios on dry season field crops in the coastal region of Bangladesh. Agric. Syst. 2022, 200, 1034281. [Google Scholar] [CrossRef]
  19. Yang, X.; Zheng, L.; Yang, Q.; Wang, Z.; Cui, S.; Shen, Y. Modelling the effects of conservation tillage on crop water productivity, soil water dynamics and evapotranspiration of a maize–winter wheat–soybean rotation system on the Loess Plateau of China using APSIM. Agric. Syst. 2018, 166, 111–123. [Google Scholar] [CrossRef]
  20. Yin, M.H.; Jiang, Y.B.; Ling, Y.; Ma, Y.L.; Qi, G.P.; Kang, Y.X.; Wang, Y.Y.; Lu, Q.; Shang, Y.J.; Fan, X.R.; et al. Optimizing lucerne productivity and resource efficiency in China’s Yellow River irrigated region: Synergistic effects of ridge-film mulchingand controlled-release nitrogen fertilization. Agriculture 2025, 15, 845. [Google Scholar] [CrossRef]
  21. Liu, J.; Lu, F.G.; Zhu, Y.M.; Wu, H.; Ahmad, I.; Dong, G.C.; Zhou, G.S.; Wu, Y.Q. The effects of planting density and nitrogen application on the growth quality of alfalfa forage in saline soils. Agriculture 2024, 14, 302. [Google Scholar] [CrossRef]
  22. Osterholz, W.R.; Renz, M.J.; Jokela, W.E.; Grabber, J.H. Interseeded alfalfa reduces soil and nutrient runoff losses during and after corn silage production. J. Soil Water Conserv. 2019, 12, 85–90. [Google Scholar] [CrossRef]
  23. Chen, D.D.; Wang, Y.R.; Han, Y.H. Effects of irrigation frequency and fertilizer rate on alfalfa seed yields in the Yellow River irrigated region. Acta Pratacult. Sin. 2016, 25, 154–163. [Google Scholar]
  24. Gu, Y.J.; Han, C.L.; Kong, M.; Shi, X.Y.; Zdruli, P.; Li, F.M. Plastic film mulch promotes high alfalfa production with phosphorus saving and low risk of soil nitrogen loss. Field Crops Res. 2018, 229, 44–54. [Google Scholar] [CrossRef]
  25. Lu, Q.; Qi, G.P.; Yin, M.H.; Kang, Y.X.; Ma, Y.L.; Jia, Q.; Wang, J.H.; Jiang, Y.B.; Wang, C.; Gao, Y.L. Alfalfa cultivation patterns in the Yellow River irrigation area on soil water and nitrogen use efficiency. Agronomy 2024, 14, 874. [Google Scholar] [CrossRef]
  26. Lv, Y.R.; Wang, J.H.; Yin, M.H.; Kang, Y.X.; Ma, Y.L.; Jia, Q.; Qi, G.P.; Jiang, Y.B.; Lu, Q.; Chen, X.L. Effects of planting and nitrogen application patterns on alfalfa yield, quality, water–nitrogen use efficiency, and economic benefits in the Yellow River irrigation region of Gansu Province, China. Water 2023, 15, 251. [Google Scholar] [CrossRef]
  27. Liu, Q.; Gao, X.H.; Wang, J. Response simulation of CO2 concentration and temperature onspring wheat yield in dryland under different precipitation types. Agric. Res. Arid Areas 2023, 41, 230–237. [Google Scholar]
  28. Li, G.; Huang, G.B.; Bellotti, W.; Chen, W. Adaptation research of APSIM model under different tillage systems in the Loess hill-gullied region. Acta Ecol. Sin. 2009, 29, 2655–2663. [Google Scholar]
  29. Chai, T.; Draxler, R.R. Root mean square error (RMSE) or mean absolute error (MAE)?—Arguments against avoiding RMSE in the literature. Geosci. Model Dev. 2014, 7, 1247–1250. [Google Scholar] [CrossRef]
  30. Shcherbakov, M.V.; Brebels, A.; Shcherbakova, N.L.; Tyukov, A.P.; Janovsky, T.A.; Kamaev, V.A. A survey of forecast error measures. World Appl. Sci. J. 2013, 24, 171–176. [Google Scholar]
  31. Tian, R.R.; Wang, J.H.; Yin, M.H.; Ma, Y.L.; Jia, Q.; Kang, Y.X.; Qi, G.P.; Gao, Y.L.; Jiang, Y.B.; Li, H.Y.; et al. Investigation of the regulatory effects of water and nitrogen supply on nitrogen transport and distribution in wolfberry fields. Front. Plant Sci. 2024, 15, 1385980. [Google Scholar] [CrossRef]
  32. Ech–Chatir, L.; Er–Raki, S.; Rodriguez, J.C.; Meddich, A. Advances in crop growth modeling: A review of perennial crop and beneficial soil microorganism approaches. Agric. Water Manag. 2025, 315, 109548. [Google Scholar] [CrossRef]
  33. Cornet, D.; Marcos, J.; Tournebize, R.; Sierra, J. Observed and modeled response of water yam (Dioscorea alata L.) to nitrogen supply: Consequences for nitrogen fertilizer management in the humid tropics. Eur. J. Agron. 2022, 138, 126536. [Google Scholar] [CrossRef]
  34. Man, J. The adaptability of APSIM-wheat model in the middle and lower reaches of the Yangtze River Plain of China: A case study of winter wheat in Hubei Province. Agronomy 2020, 10, 981. [Google Scholar]
  35. Gulnazar, A.l.I.; Tao, H.M.; Wang, Z.K.; Shen, Y.Y. Evaluating the deep-horizon soil water content and water use efficiency in the alfalfa–wheat rotation system on the dryland of Loess Plateau using APSIM. Acta Pratacult. Sin. 2021, 30, 22–33. [Google Scholar]
  36. Thompson, L.J.; Archontoulis, S.V.; Puntel, L.A. Simulating within-field spatial and temporal corn yield response to nitrogen with APSIM mode. Precis. Agric. 2024, 25, 2421–2446. [Google Scholar] [CrossRef]
  37. Wu, L.; Chen, C.; Yang, F.Y.; Fan, D.L.; Luo, J.M.; Han, J.R.; Wang, T.S.; Guo, E.J. Optimization of water and nitrogen management mode for spring wheat under different precipitation year types based on APSIM model. J. Triticeae Crops. 2025, 45, 103–111. [Google Scholar]
  38. Wan, W.L.; Zhao, Y.H.; Li, X.F.; Xu, J.; Liu, K.G.; Chai, Y.Q.; Xu, H.J.; Cui, H.X.; Chen, X.J.; Wu, P.; et al. A moderate reduction in irrigation and nitrogen improves water–nitrogen use efficiency, productivity, and profit under new type of drip irrigated spring wheat system. Front. Plant Sci. 2022, 13, 1005945. [Google Scholar] [CrossRef]
  39. Yin, H.; Wang, Q.; Shi, S.L.; Zhang, N.H.; Wang, T.T.; Liu, Q.L.; Liu, C.W.; Yu, H.L. Effect of irrigation and nitrogen supply levels on hay yield and water use efficiency and soil total nitrogen of Medicage sativa. Grassl. Turf. 2012, 32, 1–7. [Google Scholar]
  40. Sun, Y.L.; Zhao, J.W.; Liu, X.S.; Li, S.Y.; Ma, C.H.; Wang, X.Z.; Zhang, Q.B. Effect of nitrogen application on photosynthetic daily variation, leaf morphology and dry matter yield of alfalfa at the early flowering growth stage. Acta Pratacult. Sin. 2022, 31, 63–75. [Google Scholar]
  41. Liu, W.T.; Wang, Y.Q.; Sun, S.N.; Zhao, Y.; Shen, Y.; Qian, J.; Yan, X.B. Effects of nitrogen Forms on nitrogen accumulation and utilization of alfalfa in different stubbles. Pratac. Sci. 2021, 38, 716–725. [Google Scholar] [CrossRef]
  42. Yi, X.F.; Sun, X.C.; Tian, R.; Li, K.X.; Ni, M.; Ying, J.L.; Xu, L.A.; Liu, L.W.; Wang, Y. Genome-Wide Characterization of the Aquaporin Gene Family in Radish and Functional Analysis of RsPIP2-6 Involved in Salt Stress. Front. Plant Sci. 2022, 13, 860742. [Google Scholar] [CrossRef] [PubMed]
  43. Delevatti, L.M.; Cardoso, A.S.; Barbero, R.P.; Leite, R.G.; Reis, R.A. Effect of nitrogen application rate on yield, forage quality, and animal performance in a tropical pasture. Sci. Rep. 2019, 9, 7596. [Google Scholar] [CrossRef] [PubMed]
  44. Zhang, R.; Li, Z.P.; Wang, L. Relationship between soil moisture dynamics, crop growth and precipitation in rain-fed area of the Loess Tableland, China. Chin. J. Appl. Ecol. 2019, 30, 359–369. [Google Scholar]
  45. Zhao, Y.X.; Xiao, D.P.; Bai, H.Z.; Tang, J.Z. Climatic suitability of winter wheat and summer maize in the North China Plain. Chin. J. Ecol. 2020, 39, 2251–2262. [Google Scholar]
  46. Wang, P.R.; Zhong, R.; Sun, M.; Kong, W.L.; Zhang, J.J.; Hafeez, N.; Ren, A.X.; Lin, W.; Gao, Z.Q. Nitrogen application rates at rainfall gradients regulate water and nitrogen use efficiency in dryland winter wheat. J. Plant Nutr. Fert. 2022, 28, 1430–1443. [Google Scholar]
  47. García-López, J.; Lorite, I.J.; García-Ruiz, R.; Ordoñez, R.; Dominguez, J. Yield response of sunflower to irrigation and fertilization under semi-arid conditions. Agric. Water Manag. 2016, 176, 151–162. [Google Scholar] [CrossRef]
  48. Zhao, Y.; Liu, X.; Tong, C.; Wu, Y. Effect of root interaction on nodulation and nitrogen fixation ability of alfalfa in the simulated alfalfa/triticale intercropping in pots. Sci. Rep. 2020, 10, 61234. [Google Scholar] [CrossRef]
  49. Huang, M.X.; Wang, J.; Tang, J.Z.; Fang, Q.X.; Zhang, J.P.; Bai, H.Q.; Wang, N.; Li, Y.; Wu, B.J.; Zheng, J.Q.; et al. Analysis of interaction of sowing date, irrigation and nitrogen application on yield of oilsunflower based on APSIM model. Trans. Chin. Soc. Agric. Eng. 2018, 34, 134. [Google Scholar]
  50. Cheng, C.; Li, C.; Li, W.M.; Ye, C.Y.; Wang, Y.S.; Zhao, C.S.; Ding, F.H.; Jin, A.F.; Feng, L.P.; Li, Z.F. Optimal path of the simulation model in horticultural crop development and harvest period. Trans. Chin. Soc. Agric. Eng. 2023, 39, 158. [Google Scholar]
Figure 1. Daily precipitation and temperature distribution during the experiment period. Tmax represents the daily maximum temperature, and Tmin represents the daily minimum temperature.
Agriculture 15 01789 g001
Figure 2. Model structure diagram.
Agriculture 15 01789 g002
Figure 3. Effect of nitrogen application on alfalfa yield. Different lowercase letters indicate significant differences in alfalfa yield among different treatments (p < 0.05).
Agriculture 15 01789 g003
Figure 4. Effect of nitrogen application on nitrogen fertilizer use efficiency in alfalfa. Different lowercase letters indicate significant differences in alfalfa PFPN and ANUE among different treatments (p < 0.05).
Agriculture 15 01789 g004
Figure 5. Correlation analysis between measured and simulated values of the alfalfa growth process. The three solid circles in the figure represent the regreening–branching period, regreening–budding period, and regreening–initial flowering period of alfalfa, respectively.
Agriculture 15 01789 g005
Figure 6. Correlation analysis between measured and simulated alfalfa yields under different nitrogen application levels.
Agriculture 15 01789 g006
Figure 7. Frequency curve fitting of precipitation from 1985 to 2024.
Agriculture 15 01789 g007
Figure 8. Simulated alfalfa yields under different precipitation year types and nitrogen application levels. (ac) represent dry year, normal year, and wet year, respectively. Different lowercase letters indicate significant differences in alfalfa yield among different treatments (p < 0.05).
Agriculture 15 01789 g008
Figure 9. Nitrogen fertilizer use efficiency of alfalfa under different precipitation year types and nitrogen application levels. Different lowercase letters indicate significant differences in alfalfa PFPN and ANUE among different treatments (p < 0.05).
Agriculture 15 01789 g009
Figure 10. Comprehensive evaluation scores for alfalfa under different precipitation year types and nitrogen application levels. The numbers 1, 2, 3, etc., represent the ranking of the comprehensive score for each treatment, respectively.
Agriculture 15 01789 g010
Table 1. Different precipitation year types.
Model YearAverage Precipitation (mm)Total (Year)Year
Wet year267.33121985, 1994, 2002, 2003, 2007, 2011, 2014, 2016, 2017, 2018, 2019, 2024
Normal year208.0881988, 1992, 1993, 1995, 1997, 1998, 2001, 2021
Dry year144.50201986, 1987, 1989, 1990, 1991, 1996, 1999, 2000, 2004, 2005, 2006, 2008, 2009, 2010, 2012, 2013, 2015, 2020, 2022, 2023
Table 2. Main soil parameters.
ParametersSoil Depth (cm)
0–1010–2020–3030–4040–6060–8080–100100–120
BD (g·cm−1)1.2601.3401.3601.3901.2801.1401.2401.300
Air_dry (mm·mm−1)0.0100.0100.0500.0700.0700.0700.0700.070
LL15 (mm·mm−1)0.0030.0030.0160.0220.0220.0220.0220.022
DUL (mm·mm−1)0.1840.2100.2150.2250.2410.2780.2330.253
SAT (mm·mm−1)0.1340.1600.1650.1750.1910.2280.1830.203
Swcon (0–1)0.6000.6000.6000.6000.5000.5000.5000.500
Soil pH8.0808.1108.1308.3008.4108.5408.7008.700
LucerneLL (mm·mm−1)0.2900.2900.2900.2900.3000.3100.3200.330
LucerneKL (d−1)0.1000.1000.1000.1000.0900.0900.0900.090
LucerneXF (0–1)1.0001.0001.0001.0001.0001.0001.0001.000
BD stands for soil bulk density, Air_dry represents air dry coefficient, LL15 represents wilting coefficient, DUL represents field capacity, SAT represents saturated water content, and Swcon represents infiltration rate.
Table 3. Key parameters of the APSIM-Lucerne model.
ParametersValueUnit
Thermal time from emergence to end of juvenile550°C·d
Thermal time from end of juvenile to floral initiation610°C·d
Photoperiod required for floral initiation>10h
Thermal time from initiation to full-blooming260°C·d
Radiation use efficiency1.8g·MJ−1
Stem weight0~5g·plant−1
Plant height0~5000mm
Table 4. Normalized values of various indicators for alfalfa under different precipitation year types and nitrogen application levels.
TreatmentDry YearNormal YearWet Year
YieldPFPNANUEYieldPFPNANUEYieldPFPNANUE
N800.00001.00000.56580.00001.00000.48080.00001.00000.3153
N1201.00000.64181.00000.54760.58680.75500.35640.58860.5582
N1400.83840.45220.84341.00000.49681.00000.69100.51510.8269
N1600.68550.31110.56050.74140.33130.60251.00000.45361.0000
N1800.61120.20940.38660.72320.23210.46780.58080.24630.4128
N2000.60960.13470.29480.58870.13990.28450.53490.15410.2760
N2400.31080.00000.00000.30330.00000.00000.34800.00000.0000
Table 5. Weights of various indicators for alfalfa based on the entropy weight method.
ParameterDry YearNormal YearWet Year
YieldPFPNANUEYieldPFPNANUEYieldPFPNANUE
Information entropy value (Ej)0.89450.82140.88030.89320.83100.88460.88680.84480.8662
Information utility value (Dj)0.10550.17860.11970.10680.16900.11540.11320.15520.1338
Weight coefficient (Wj, %)0.26140.44230.29630.27300.43210.29490.28150.38590.3326
Disclaimer/Publisher’s Note: The statements, opinions and data contained in all publications are solely those of the individual author(s) and contributor(s) and not of MDPI and/or the editor(s). MDPI and/or the editor(s) disclaim responsibility for any injury to people or property resulting from any ideas, methods, instructions or products referred to in the content.