Article

Integration of Hyperspectral Imaging and Chemometrics for Internal Quality Evaluation of Packaged and Non-Packaged Fresh Fruits

by
Umuhoza Aline
1,
Dennis Semyalo
2,
Muhammad Fahri Reza Pahlawan
3,
Tanjima Akter
2,
Mohammad Akbar Faqeerzada
2,
Seo-Young Kim
3,
Dayoung Oh
3 and
Byoung-Kwan Cho
1,2,*
1
Department of Agricultural Machinery Engineering, College of Agricultural and Life Science, Chungnam National University, Yuseong-gu, Daejeon 34134, Republic of Korea
2
Department of Smart Agricultural Systems, College of Agricultural and Life Science, Chungnam National University, Yuseong-gu, Daejeon 34134, Republic of Korea
3
Department of Biosystems Machinery Engineering, College of Agricultural and Life Science, Chungnam National University, Daejeon 34134, Republic of Korea
*
Author to whom correspondence should be addressed.
Agriculture 2025, 15(16), 1718; https://doi.org/10.3390/agriculture15161718
Submission received: 2 July 2025 / Revised: 30 July 2025 / Accepted: 6 August 2025 / Published: 8 August 2025
(This article belongs to the Section Agricultural Product Quality and Safety)

Abstract

Research on packaged fruits has seen a notable upturn primarily driven by consumers’ desire for fruit safety and quality across the distribution network. This study examined the effectiveness of hyperspectral imaging (HSI) combined with chemometrics to assess the internal quality of packaged and non-packaged fresh fruits. Visible–near-infrared (Vis-NIR; 400–1000 nm) and short-wave infrared (SWIR; 1000–2500 nm) hyperspectral images of apples and plums were captured using 200 samples for each fruit across three groups—plastic wrap (PW), polyethylene terephthalate (PET) box, and non-packaged (NP)—for the prediction of soluble solid content (SSC), moisture content (MC), and pH. A partial least square regression (PLSR) model demonstrated promising results on SSC and MC across all sample groups in both Vis-NIR and SWIR, with performance ranked NP > PW > PET. Calibration and prediction coefficients of determination (R2) exceeded 0.82, 0.80, and 0.79, with root mean square errors (RMSE) less than 0.57, 0.59, and 0.59 for NP, PW, and PET, respectively. This research outcome confirmed the suitability of HSI as a critical instrument for predicting the composition of fresh fruits inside plastic packaging, offering a quick and non-invasive approach for quality evaluation in supply chains.

1. Introduction

The packaging of fresh produce, in particular fruits and vegetables, involves using protective materials to enclose and preserve them to ensure that the quality is maintained until consumption [1]. The traditional materials used in packaging include paper, paperboard, glass, metals, and plastics. Currently, one-third of plastics are used in packaging due to low weight, cost-effectiveness, and water resistance [2]. Eminent plastic packaging films are polyolefins, including polyethylene (PE), and polyesters [3]. Polyethylene plastics are categorized as high-density polyethylene (HDPE), linear low-density polyethylene (LLDPE), and low-density polyethylene (LDPE) with (940–965 kg m−3), (915–940 kg m−3), and (915–935 kg m−3), respectively [4]. The LDPE plastics used in local markets are plastic wraps (PW), which are used to seal fruits and vegetables such as apples, plums, oranges, and tomatoes. Polyesters are the economically important class of plastic polymers that contain ester monomers in every repeat unit of their main chain, typically driven by polyethylene terephthalate (PET) plastics with a density range of 1290–1400 kg m−3 [5]. PET plastic boxes are used for the commercial handling and distribution of different fruit types because of their rigidity, gas permeability, resistance to chemicals, and moisture [6].
Climacteric fruits including apples and plums continue to ripen after harvest, owing to the formation of volatile organic acids, aldehydes, and ethylene. These physiological and biochemical processes result in changes in the internal components including sugar, water content, and acidity along the storage and distribution lines [7]. Efforts have been made to improve post-harvest activities, primarily including proper packaging, maintaining freshness, and delaying the fruit spoilage. These efforts easily communicate the external quality to the customers because the fruits inside a transparent package can be viewed. However, consumers cannot determine the real internal quality of the packaged fruit. Non-destructive technologies for fruit quality control throughout the supply chain have undergone a significant transformation, motivated by advancements in new techniques, such as active, aseptic, smart or intelligent, bioactive, and edible packaging [8]. Extensive research on using smart or intelligent packaging with various indicators, and chemical sensors for the evaluation of apple ripeness [9], the respiration rate of strawberries and apples [10], color change in pineapples and pomegranates [11], and kiwi fruit freshness [12] have been reported. Even though these previous studies contributed to the potential for non-destructive measurements, they produced no quantitative data and involved chemical migration to the sample. In addition, the development and deployment of sensors is a challenging process because it requires understanding and categorization of fruit physiology [13].
Hyperspectral imaging (HSI) has been increasingly applied in the field of agriculture, notably for the quality assessment of fruit and vegetables, due to its ability to detect variations in their chemical composition and structural features [14]. HSI provides spatial and spectral information, enabling a more detailed analysis of both internal constituents and external parameters [15,16]. Internal quality traits of produce primarily consist of soluble solids content (SSC), moisture content (MC), pH, dry matter content (DMC), internal defects, and nutritional composition [17,18,19]. HSI technology has been widely recognized for its ability to analyze various quality parameters of fruits, such as firmness, sugar content, acidity, and moisture levels. HSI was used to evaluate important characteristics of apples, such as in the detection of soluble solids content (SSC) [20], moisture content (MC), and pH [21], and in the detection of soluble solids content (SSC) in plums [22]. Studies by Siche et al. [23] and Liu et al. [24] established the foundational principles of applying HSI in assessing internal and external attributes of fresh produce. These studies emphasized the versatility of HSI in capturing high-dimensional data, which allows for the simultaneous analysis of multiple quality metrics [23,24]. Lan and colleagues demonstrated the use of HSI in determining the internal composition of sliced apples. The study highlighted how HSI could accurately predict the heterogeneity of total soluble content (TSC) and dry matter content (DMC) through spectral data [25]. A report by Metlenkin et al. [26] focused on identifying defects and classifying avocado fruits using HSI and chemometrics. The integration of chemometric models significantly enhanced the classification accuracy of defect detection and was adopted and used in the recognition of fresh fruits like apples, pears, and bananas inside their packaging to enhance automated barcode-less supermarket checkouts [27]. This study used linear discriminant analysis (LDA) to classify fruit from packaging material and investigated the influence of plastic packaging on the surface of the fruit. Chemometrics combines the power of numerical and statistical approaches to retrieve meaningful data from physicochemical measurements of fruit [28]. Chemometric models, such as Partial Least Square Regression (PLSR), were recently confirmed to show the best performance when dealing with datasets that have a huge number of highly correlated predictor variables or when the number of predictors exceeds the number of observations [29,30]. For example, Shawky and Selim [31] successfully employed PLSR to predict the moisture content in citrus fruits with R2 > 0.98. The integration of HSI with PLSR was utilized to correlate the HSI dataset with the chemical compositions, including sugar, vitamin C, and organic acid content in pomelo fruit [32], SSC in apples [33], and nutrient concentrations in avocados [34]. While prior research has made significant strides in applying HSI to fresh fruit quality assessment, certain limitations persist. Most studies concentrate on a limited range of fruits, leaving a gap in understanding the broader applicability of HSI. Research predominantly focuses on non-packaged fruits, overlooking the challenges posed by packaging materials on the fruit surface during spectral analysis. Furthermore, information on the internal characteristics of packaged fruit has not yet been reported and remains underexplored.
Therefore, the current study intends to integrate HSI and chemometrics for assessing the internal quality of both packaged and non-packaged fresh fruits. By addressing the challenges associated with spectral interference from packaging materials, this research suggests an approach to investigate the feasibility of using HSI combined with chemometrics in order to (1) predict the internal quality parameters, specifically the soluble solid content (SSC), moisture content (MC), and pH of packaged and non-packaged apples and plums; (2) use the visible–near-infrared (Vis-NIR) and short-wave infrared (SWIR) HSI systems to scan fruit inside the packaging (PW and PET) and in a non-packaged (NP) environment; and (3) build the PLSR model for all sample groups (PW, PET, and NP) after spectral data acquisition.

2. Materials and Methods

2.1. Sample Preparation

Fresh apples and plums were purchased from Gyeongbuk, South Korea. Fuji apples and Avolan plum varieties were used. Fruit samples were selected based on uniformity in size and absence of visible defects as described in the study of Zhang and Yang [35], who emphasized the importance of uniform sample selection to enhance the reliability of spectral data. For each fruit type, a total of 200 samples without flaws were chosen, cleaned, and kept at room temperature (20 ± 1) °C, ensuring a representative distribution of packaged and non-packaged fruits. Before the experiment, fruits were marked for proper identification during measurement. Packaged fruits were selected with varying packaging materials—plastic wrap (PW) and polyethylene terephthalate (PET) box—to assess their influence on HSI performance. Fruits were packaged and sealed following the typical method employed at the market, whereas non-packaged (NP) fruits were placed on a 210 × 150 mm black background plate without any material concealing them, as illustrated in Figure 1.

2.2. Hyperspectral Imaging System

2.2.1. Experimental Configuration of the HSI System

A push-broom hyperspectral camera was used to scan fresh apple and plum samples, with the specifications in Table 1. The HSI camera was equipped with a forced convection cooling with ambient operating temperature set at −20 °C.

2.2.2. HSI Image Acquisition and Data Extraction

The HSI systems controlled by the software comprised motor speeds of 0.21 mms−1 and 4.732 mms−1, exposure times of 0.014 s and 0.052 s, and object distances of 360 mm and 499 mm for Vis-NIR and SWIR, respectively, to acquire images. The terms ‘non-packaged’ (NP) and ‘packaged’ (PET and PW) were used to indicate the distinct experimental approaches used to scan fruit with HSI. For NP fruits, images were captured without any material medium between the light source and the fruit. The light was allowed to shine directly from the illumination source onto the fruits and was reflected reversely onto the HSI camera sensors. For PET and PW fruits, the plastic material functioned as the medium between the fruits and the light source. As in the study of Mishra et al. [27], the fruits were imaged such that the light passed through the plastic onto the fruits, and the reflected light from the fruits passed through the plastic onto the HSI sensors [27]. The same number of fruits positioned identically was measured for NP, PET, and PW, enabling the line-shaped field of view to cover all fruits when scanning with HSI. The HSI system was calibrated using a standardized white reference panel (Spectralon, Labsphere, North Sutton, NH, USA) to ensure uniform reflectance across the spectral range of 400–1000 nm and 1000–1800 nm for Vis-NIR and SWIR, respectively. The dark current was corrected by capturing images without illumination and subtracting them from the raw data to avoid sensor noise, following the procedure outlined by [36]. Thus, the HSI images were corrected using Equation (1).
x c a l = x r a w x d a r k x w h i t e x d a r k
where xcal, xraw, xdark, and xwhite represent the calibrated, raw hyperspectral, dark, and white reference images, respectively.

2.3. Reference Value Measurements

Reference measurements were obtained directly via chemical analysis after obtaining the HSI images. All apples and plums were peeled, sliced, and crushed individually using a laboratory disperser (Ultra-Turrax, IKA T25 Digital, Staufen, Germany) to prepare the juice [37]. A portion of the juice was used to determine SSC (%) using a digital refractometer (SCM-1000, HM Digital, CA, United States) [38]. About 5 g of the juice was blended with distilled water to a final weight of 50 g. This mixture was placed in a 0.1 L beaker for pH measurement using a pH meter (Mettler Toledo, Routine Pro-ISM, Shanghai, China) [39]. The remaining cut fruits were arranged on disposable aluminum dishes (Koryo Ace Science Co., Ltd., KA.D57-100, Seoul, Republic of Korea) to measure their weight using an electronic balance (FX-2000i, A&D Co., Ltd., Tokyo, Japan) [40]. According to the official methods of analysis of AOAC International, the recorded weights (minimum 5 g) were subsequently subjected to heating in a laboratory dryer (HST-502M, Hanbaek Co., Ltd., Gwangju, Republic of Korea) at 105 °C for 86,400 s [41]. The moisture content (wet basis) was determined following Equation (2).
M C %   w b = w i w f w i × 100
where MC is the moisture content; % wb is the sample percentage on a wet basis; and wi and wf are the initial and final weights of the fruit before and after heating, respectively. All measurements were performed in triplicate and averaged to determine SSC, MC, and pH reference values.

2.4. Data Processing and Chemometric Analysis

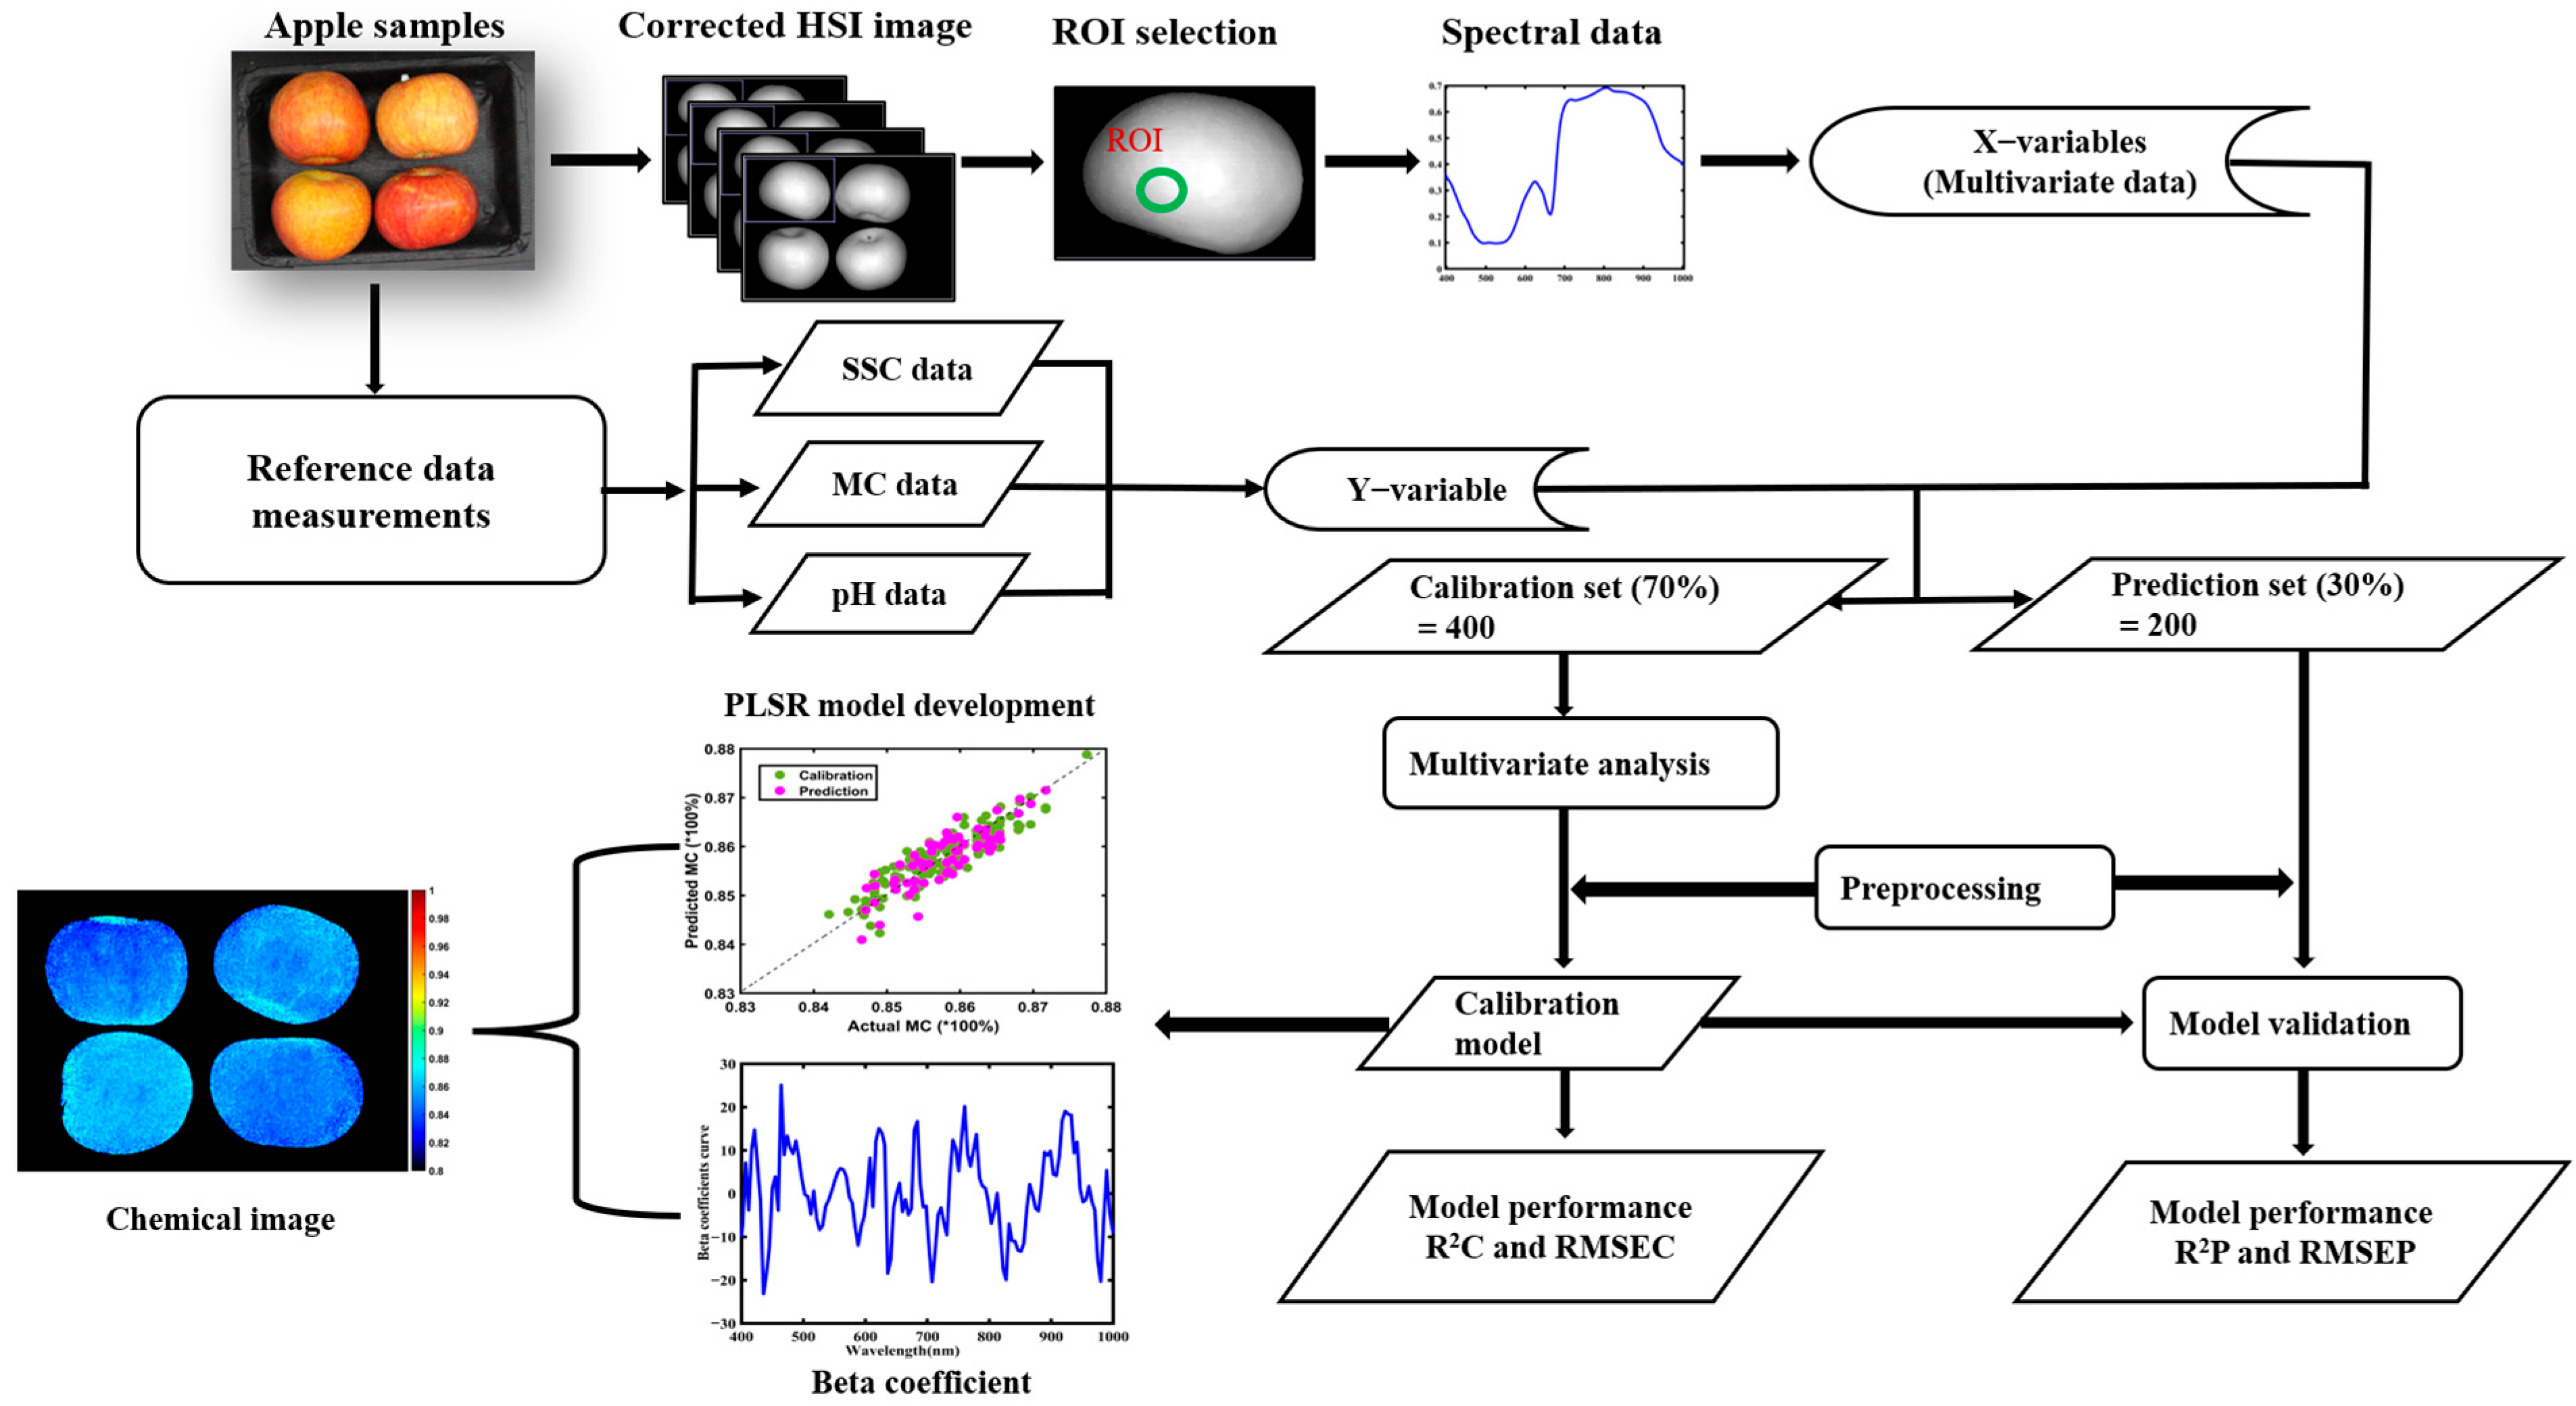
The spectral data were obtained from the region of interest (ROI) of the fruit HSI images, as depicted in Figure 2, which summarizes the steps used to develop the model. During ROI selection, the central area of the fruit where the packaging materials were uniformly applied was prioritized as they are less affected by edge effects and they reduce noise caused by irregular illumination or shape distortions. After extracting the spectrum of each pixel within the ROI for each fruit, the spectral profiles of all pixels across each wavelength were averaged and considered as the equivalent reflection spectrum for each sample group. The total dataset comprised 600 spectra for each of the 3 sample groups (NP, PET, and PW). This implied that 3 spectra were extracted for each fruit in each sample group, provided that 200 samples were used for each fruit. The 600 spectral observations were then divided randomly into calibration (70%) for spectral analysis and model building, and the remaining (30%) were used to validate the model.
The PLSR model developed was coupled with different preprocessing methods like normalization (mean, maximum, and range), multiplicative scatter correction (MSC), standard normal variate (SNV), Savitzky–Golay (SG) derivatives (1st and 2nd), and smoothing to remove uneven illumination and reflectance, reducing noise in the spectral data [38]. Each of these techniques was applied individually and impacted the raw spectra in different ways. Normalization such as mean, maximum, and range was used to scale spectra to a common range and improve comparability across samples such that all data values take on a value of 0 to 1 [42]. MSC was applied to incorporate a mean centering step to further reduce variation due to intensity differences among spectra enabling the extraction of meaningful information concerning the chemical and physical qualities of apples and plums [43]. SNV was used to remove the background signal from the spectra which can be produced by the dissimilarity in particle size [44]. The Savitzky–Golay filter was employed in enhancing signal quality by reducing noise and smoothing spectral curves while preserving important features. Lastly, smoothing impacted the peak positions and widths which reduced noise in the spectra, leading to cleaner data [44].
PLSR is a chemometric model that integrates the elements of dimension reduction and multiple linear regression, aiming at modeling the correlation between multiple independent variables x and the dependent variable y [45]. The following equations were used to express the PLSR model:
x = T P T + E
y = U Q T + F
U = X B + G ,   B = T T T 1 T T U
where x and y denote the spectral data and reference values, respectively, related to the SSC, MC, and pH of apples and plums. T and U represent score matrices. Similarly, P and Q denote the loading matrices. The matrices E, F, and G represent residuals. Equation (5) involves matrix B, which contains the regression coefficients. The beta coefficients represent the weights assigned to each predictor in the final regression equation. These coefficients were calculated by iteratively minimizing the residual variance between the predicted and measured values of the dependent variables. Hence, the relationship between the reference values and the spectral data for apples and plums (SSC, MC, and pH) was established using the least squares method [46]. The Equation (6) represents the predicted root mean square error (RMSE) with the minimum value for determining the latent variables:
R M S E = 1 z i = 1 Z y i y ^ i 2
where z is the prediction number, y i   is the actual reference value, and y ^ i is the predicted data using the PLSR model.

2.5. Chemical Image Development

HSI offers the possibility of creating chemical images of the desired internal parameters as a visual representation of the chemical distribution in agricultural products. The PLSR model was used to create an image of the measured SSC, MC, and pH of the fruits at every pixel of the HSI, using the full wavelength. The 3D-HSI image was converted into a 2D matrix and multiplied by the beta coefficient derived from the best model. The SSC, MC, and pH concentrations were calculated by adding the equivalent pixels of all the band images. The Equation (7), outlines the procedure used to compute the final chemical image:
C I = n = 1 i I i B i + C
where CI is the chemical image, Ii is the HSI image of a specific band (i), Bi is the beta coefficient associated with input variables, and C is a constant. All processes from data processing to chemical image development were performed using MATLAB software 2021b (MathWorks, Natick, MA, USA).

3. Results

3.1. Package Spectral Characteristics

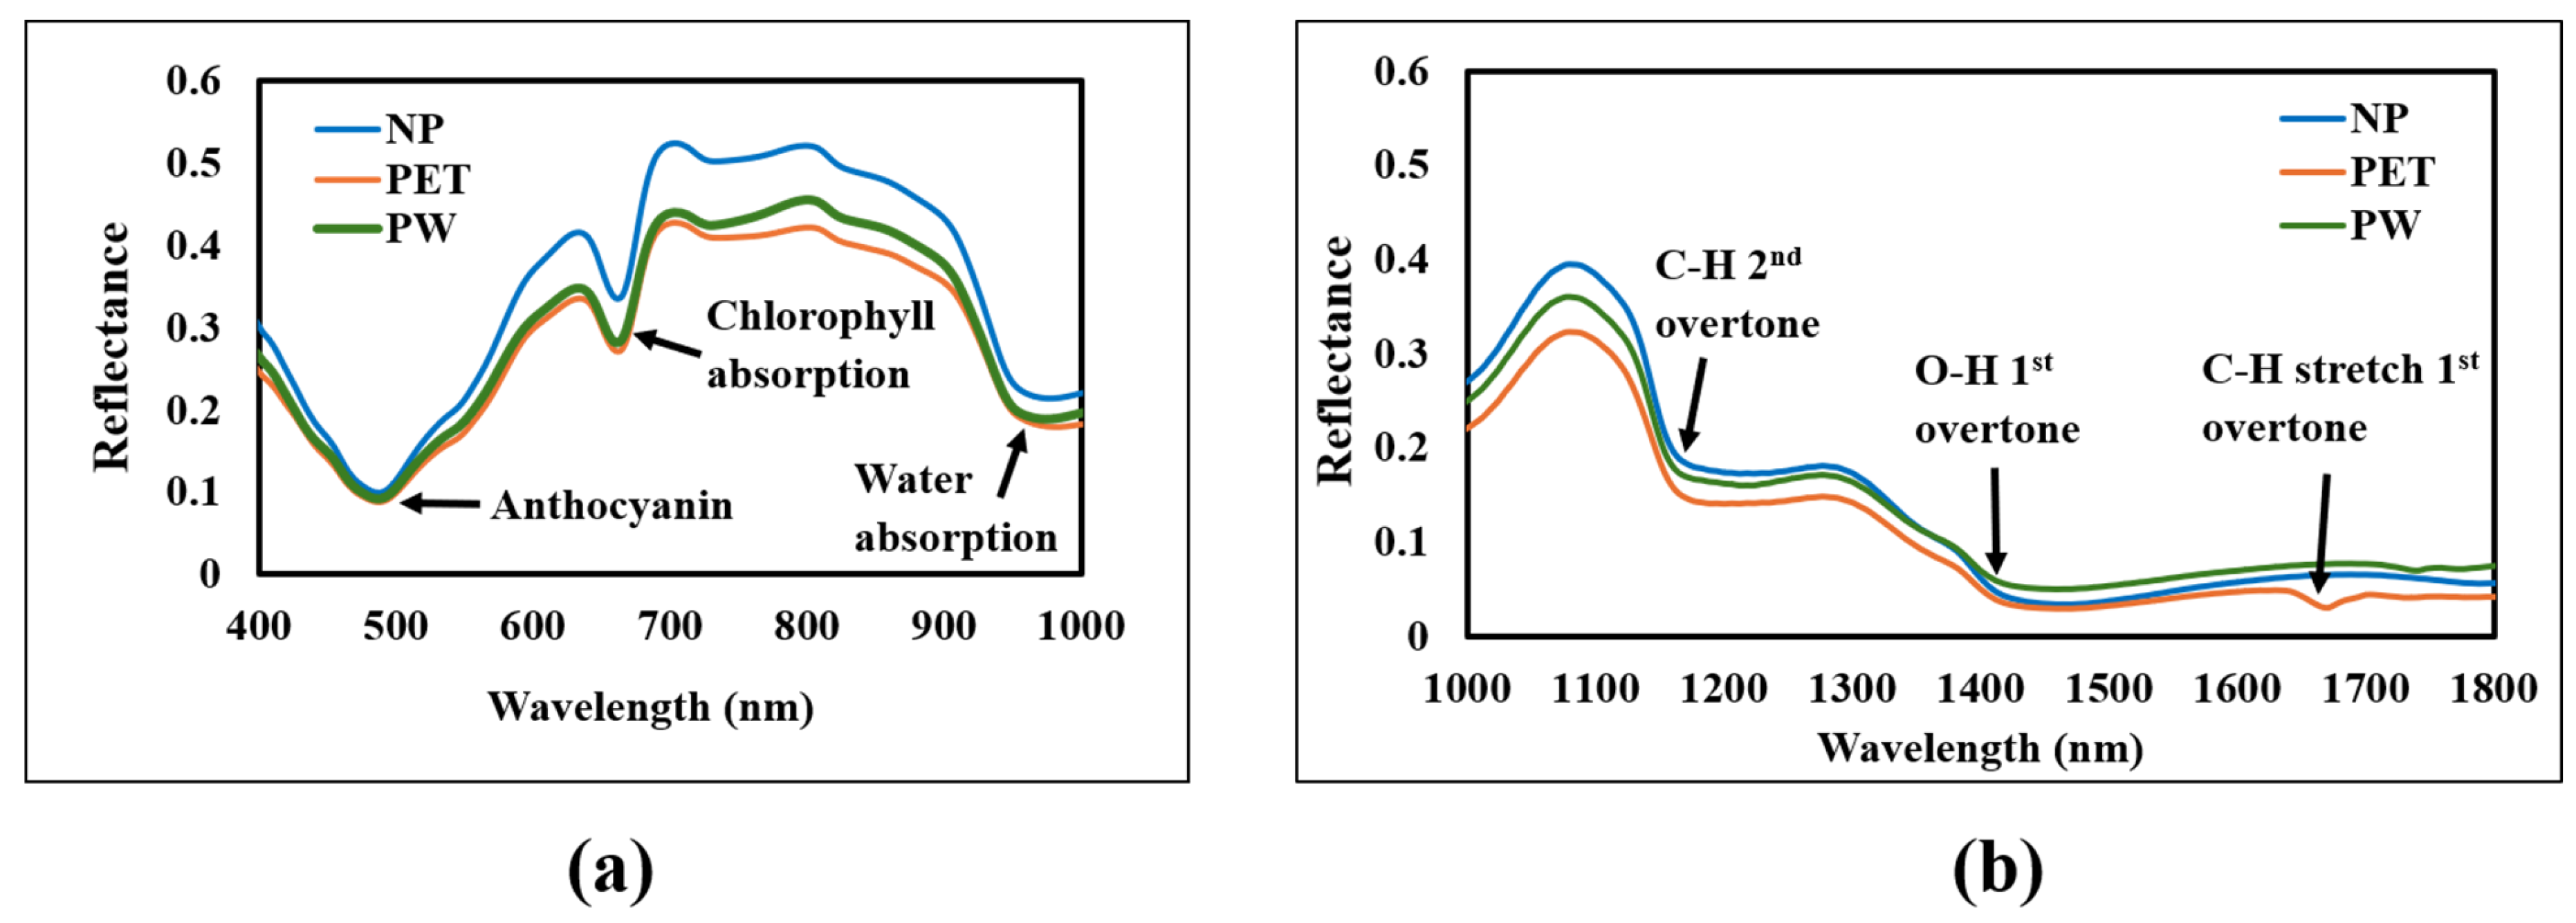
The mean spectral data of apples and plums for the NP, PET, and PW groups based on the Vis-NIR and SWIR regions are presented. The Vis-NIR spectra for NP, PET, and PW for apples Figure 3a and plums Figure 4a shows similar peaks between 650–700 nm and 950–980 nm, corresponding to chlorophyll pigment absorption [47] and the integration of O-H bands with absorption of water [48,49], respectively. Unlike in apples, the peak between 450 and 500 nm was clearly seen in plums, which is attributed to the presence of anthocyanin pigments in this fruit [50]. The packages (PET and PW) are constructed using transparent polymers which influence the limited spectral features observed in the Vis-NIR range, making it difficult to distinguish them from NP. In contrast, SWIR, which has a wider wavelength range and greater penetration depth, is suitable for analyzing heterogeneous samples [51]. For apples Figure 3b and plums Figure 4b, SWIR spectra show similar absorption peaks between 1100–1200 nm and 1400–1500 nm, due to the C-H 2nd overtone and vibration of the O-H 1st overtone, respectively [27]. The low reflectance peak of the PET packaging was noticeable at 1650–1700 nm which could be attributed to the C-H stretch’s 1st overtone [51,52]. The molecular formula of the PET plastic polymer which is made of a chain of ester (C = O) groups, C-H stretching, and deformation of CH in the aromatic ring was also reported [53].

3.2. Reference Value Results

The statistical values obtained for the determination of the SSC, MC, and pH of the fruit are shown in Table 2. For all parameters, the results were within the ranges that helped to build the best PLSR model.

3.3. Partial Least Square Regression (PLSR) Model

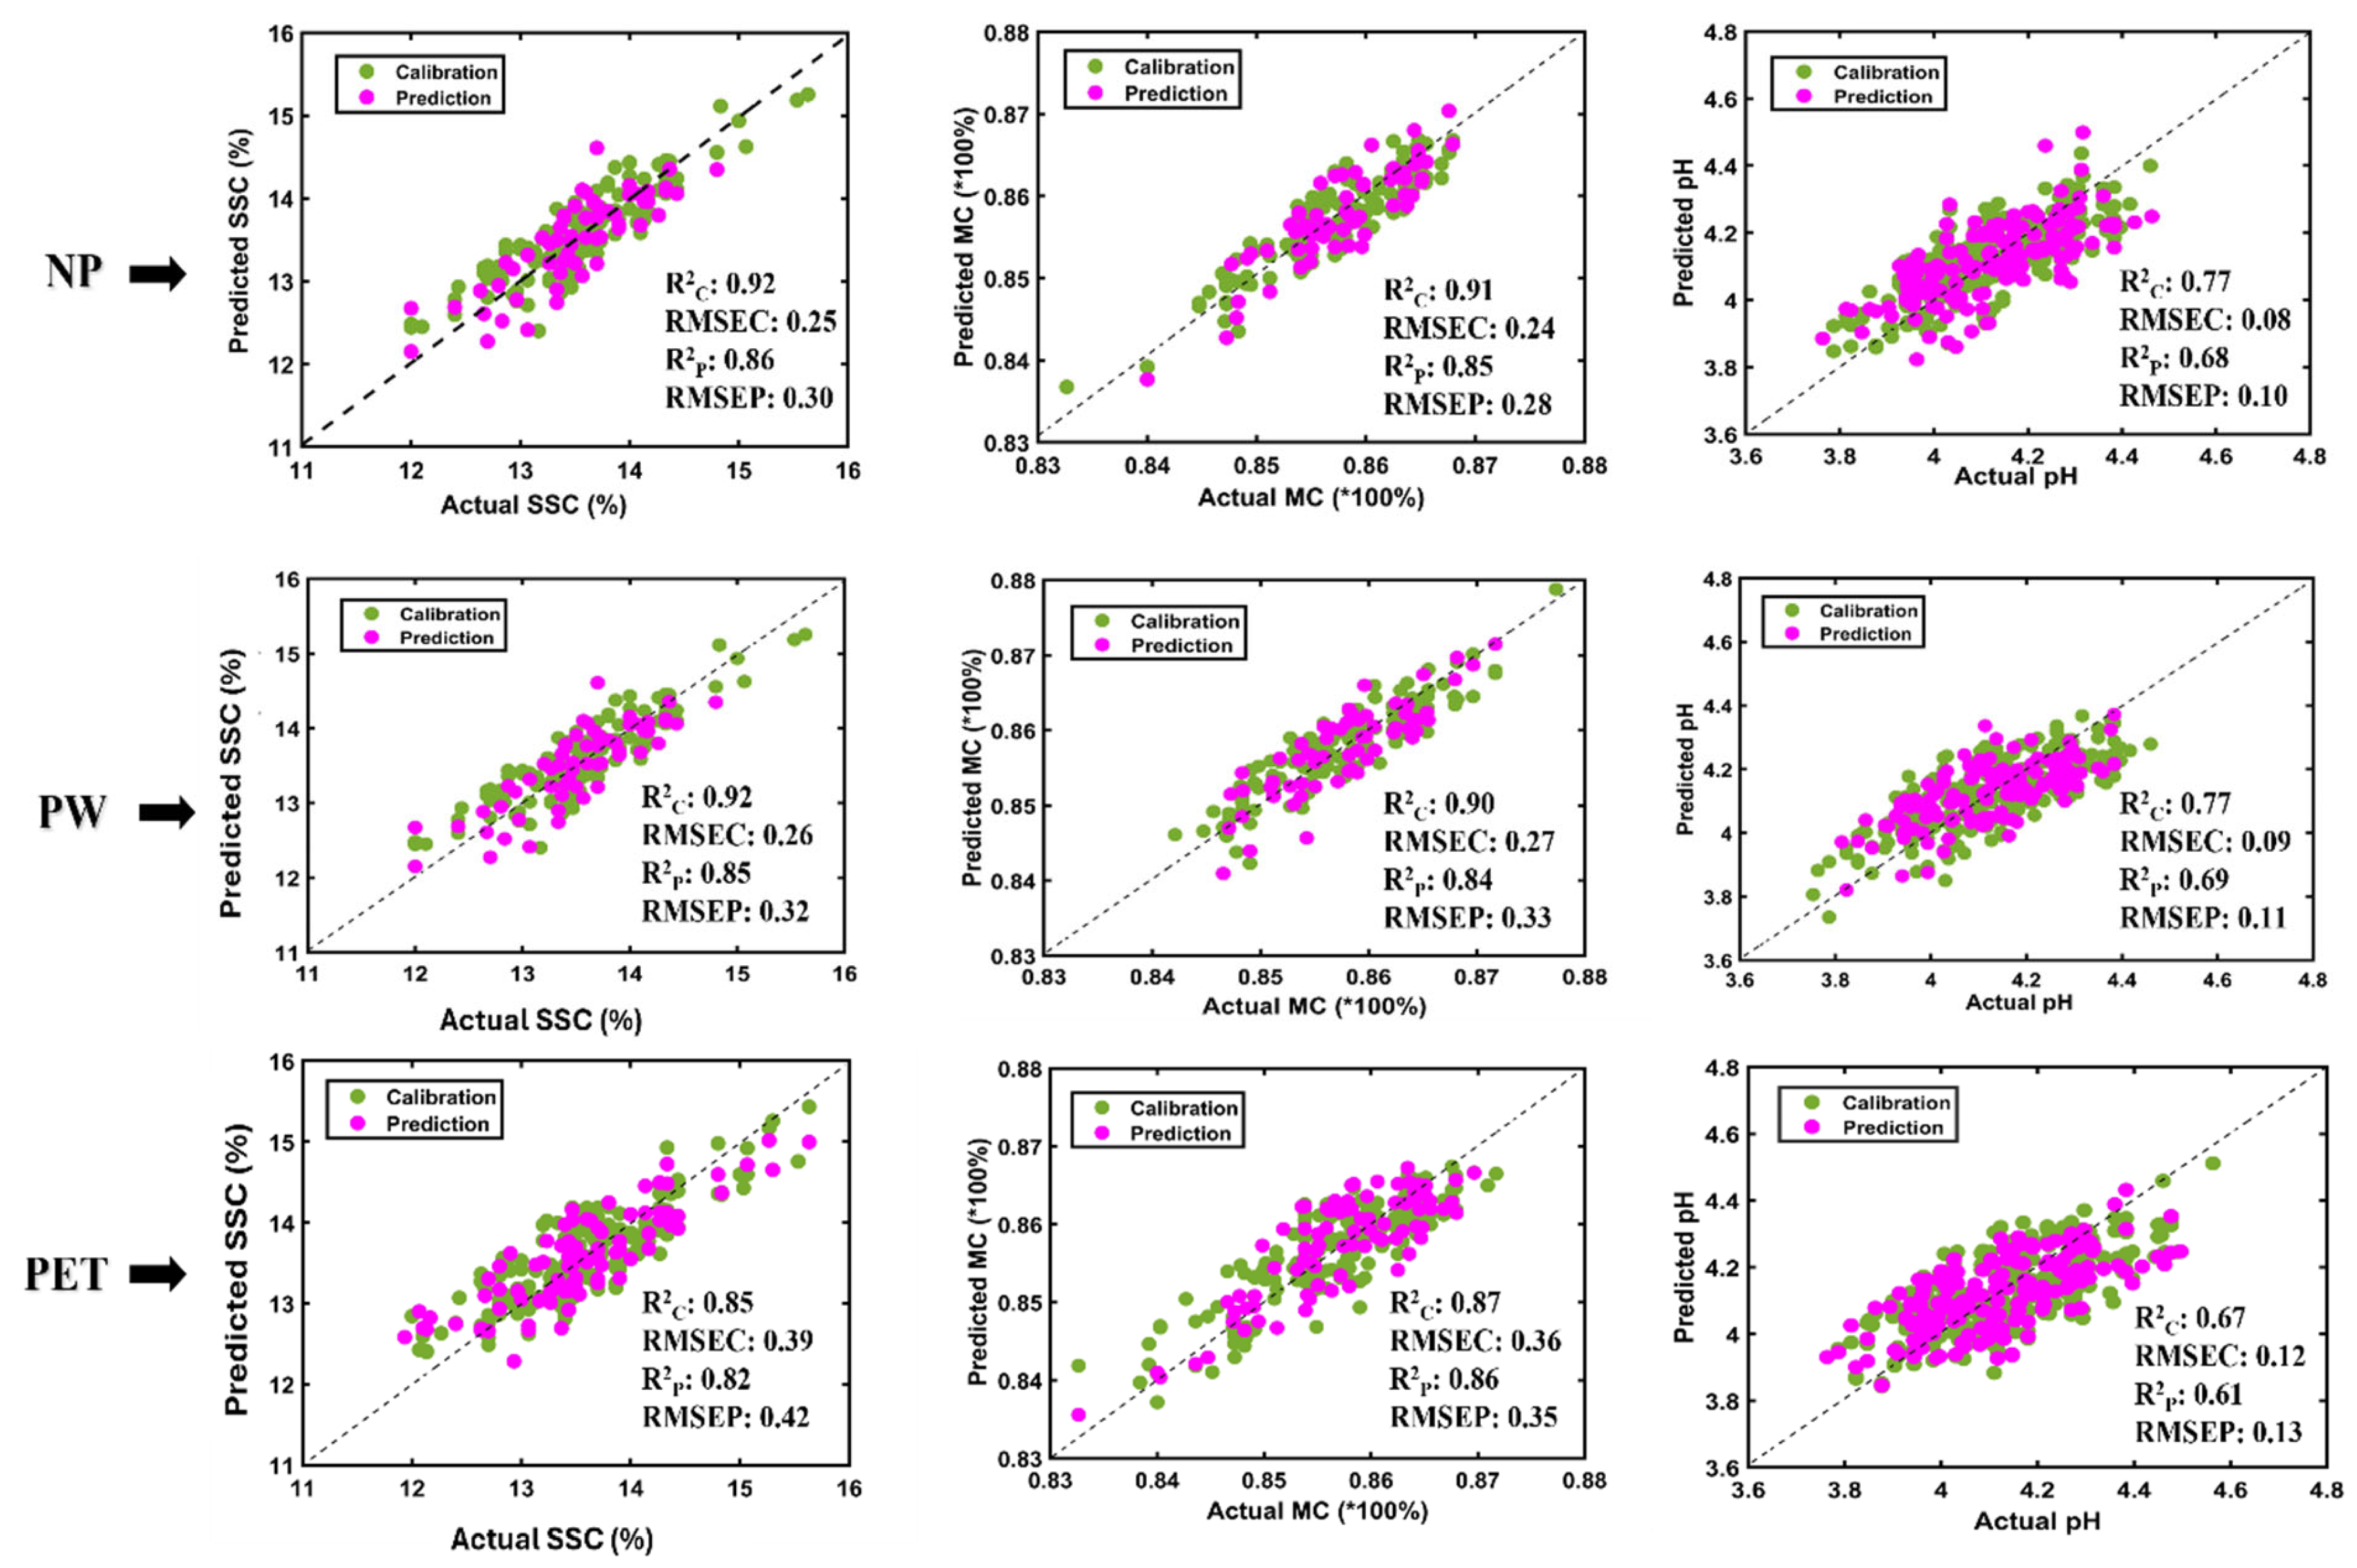
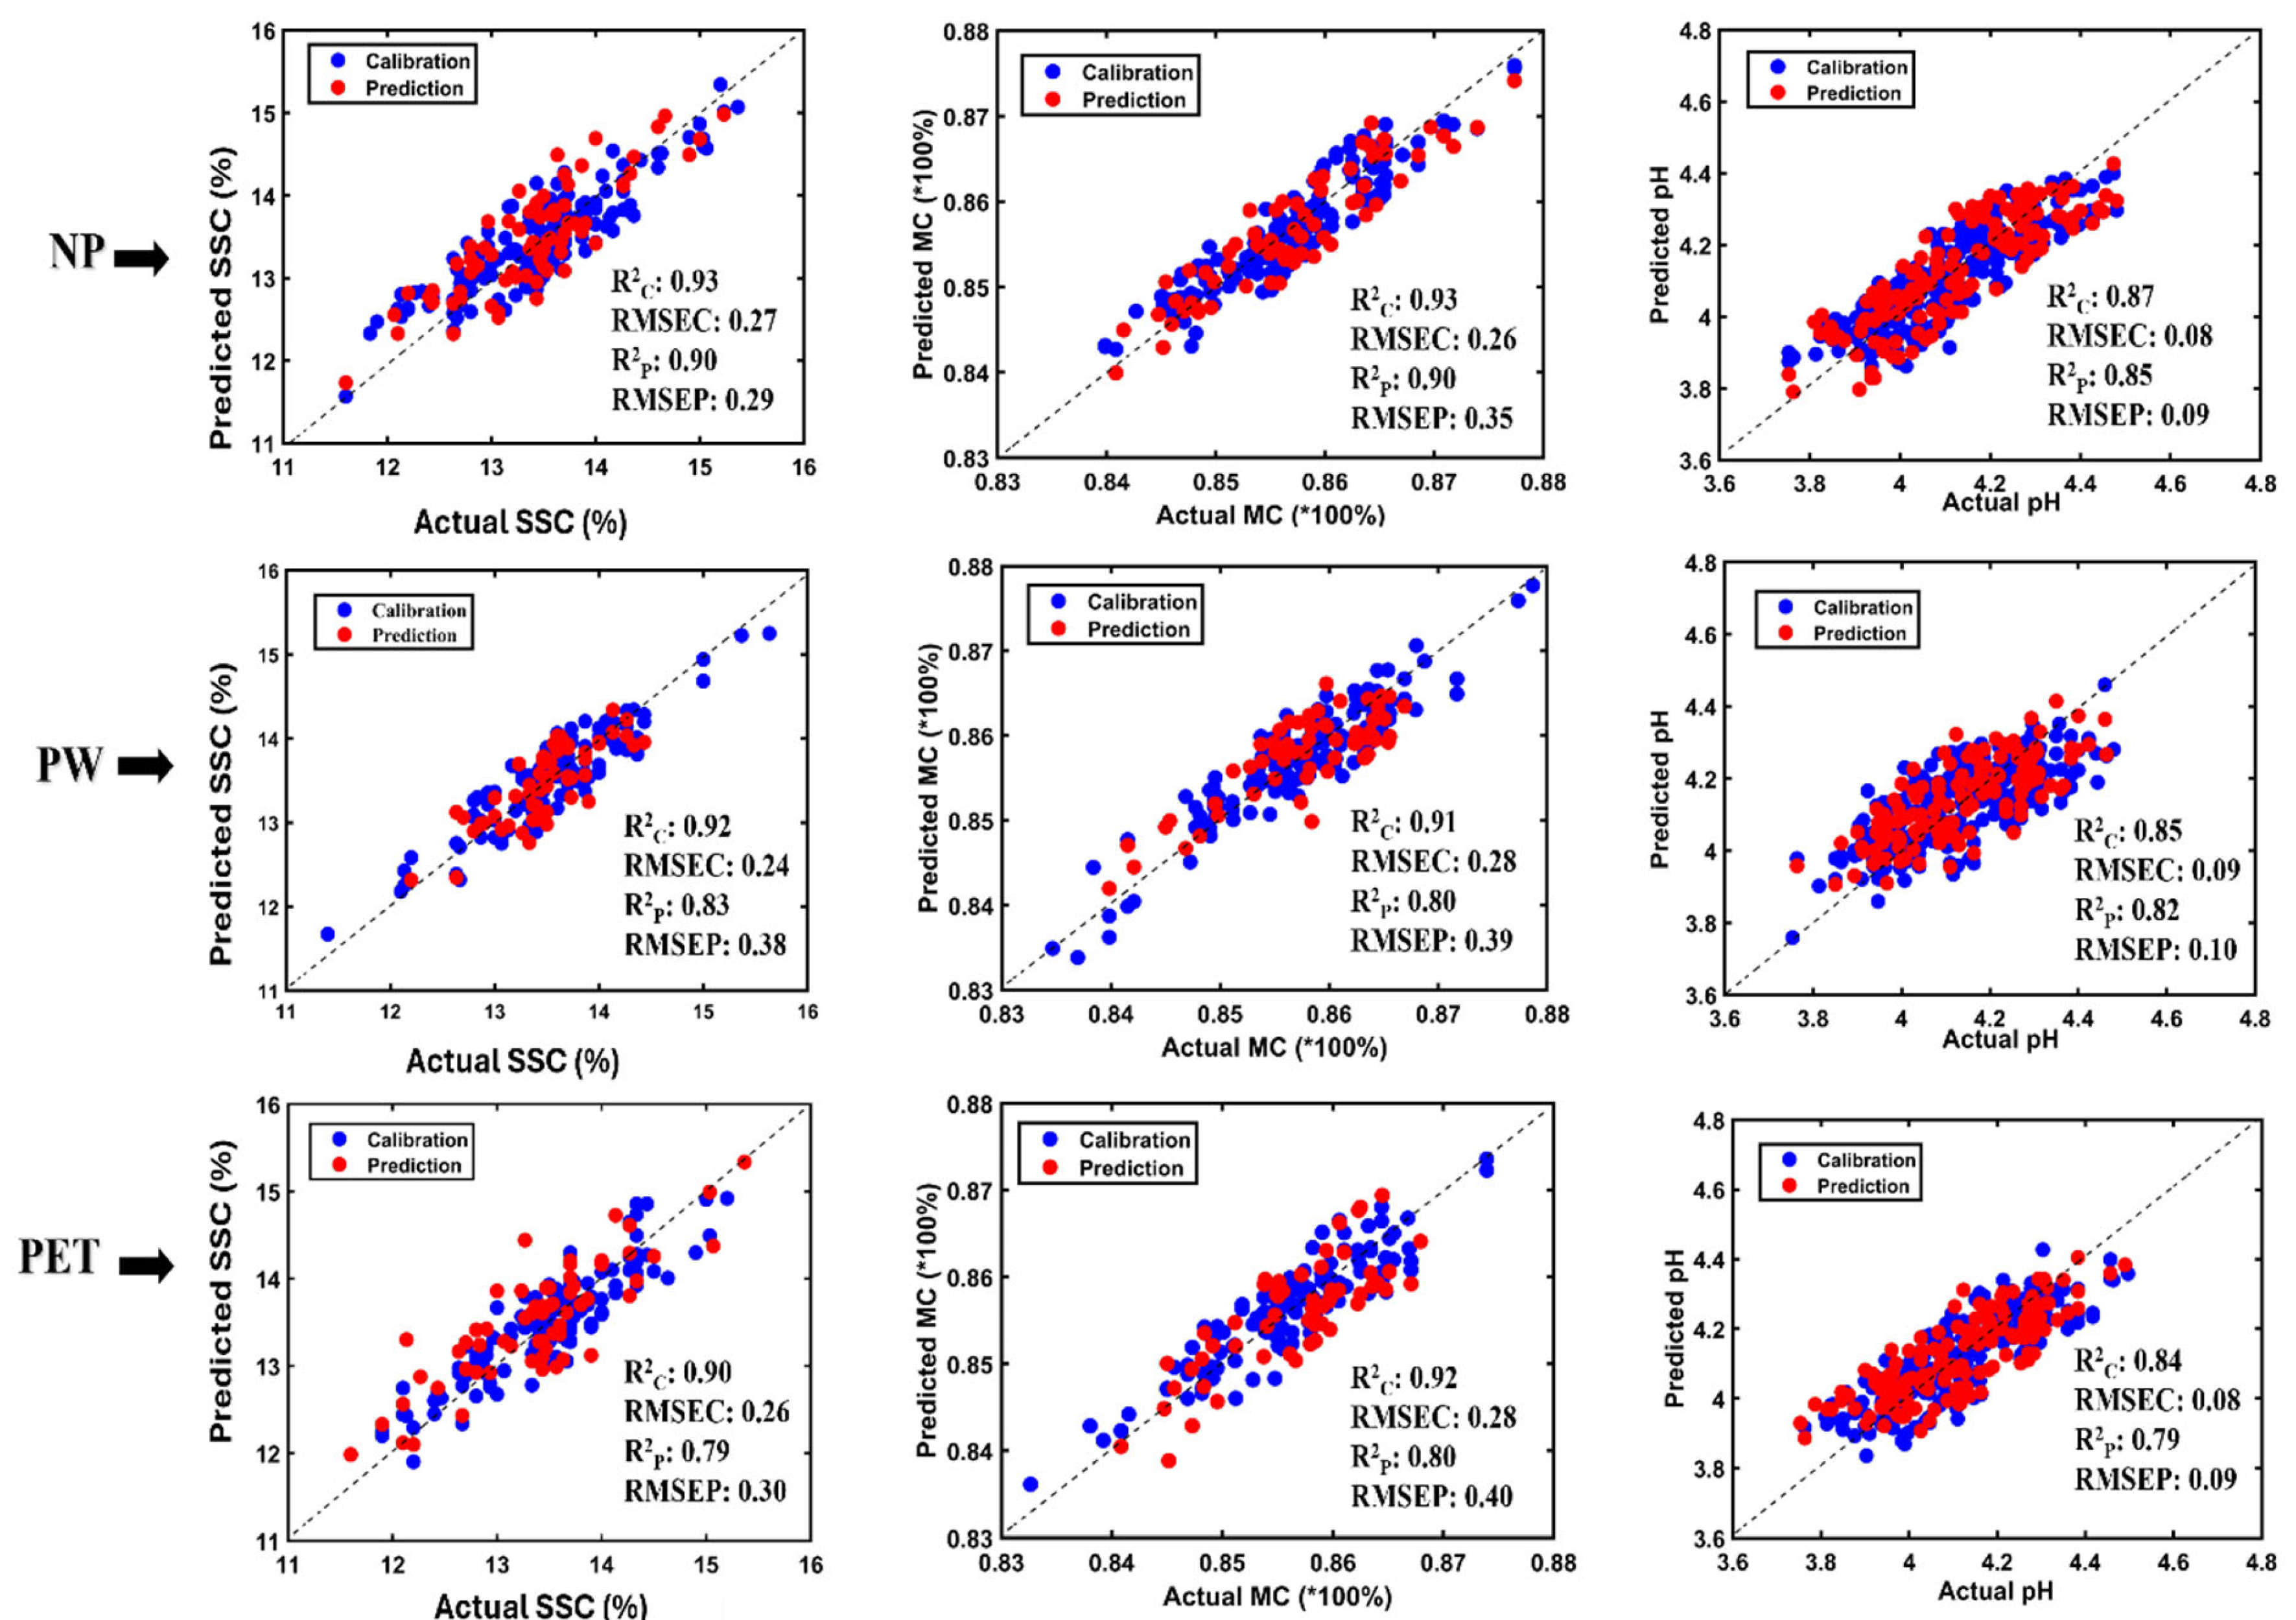
The PLSR model results for apples and plums for all parameters in each sample group were analyzed. Among the preprocessing techniques applied individually, Savitzky–Golay second derivative (SGD2) and multiplicative scatter correction (MSC) were chosen as the best, due to the uppermost coefficient of determination (R2) and lowest root mean square error (RMSE) across all parameters. MSC minimized the baseline compensation and multiplicative effects, whereas SGD2 calculated the changes in reflectance in the wavelength variation rate [54]. All sample groups of apple for Vis-NIR showed promising results for SSC and MC but not for pH, as shown in Figure 5. The PLSR model accuracy in both calibration and validation had R2 values higher than 0.85, 0.84, and 0.82, with RMSE values less than 0.30, 0.33, and 0.42 for NP, PW, and PET, respectively. All parameters (SSC, MC, and pH) were effectively predicted using SWIR (Figure 6), and the PLSR model accuracy in both calibration and validation indicated a good R2 of more than 0.85, 0.80, and 0.79, with RMSE of less than 0.35, 0.39, and 0.40 for NP, PET, and PW, respectively. The results for the plums are presented in Figure 7 (Vis-NIR) and Figure 8 (SWIR). Vis-NIR in both calibration and validation had R2 values higher than 0.82, 0.81, and 0.80 with RMSE less than 0.57, 0.59, and 0.59 for NP, PW, and PET, respectively. For SWIR, the PLSR model accuracy in both calibration and validation was better with R2 values greater than 0.83, 0.82, and 0.80, and RMSE values less than 0.55, 0.56, and 0.58 for NP, PET, and PW, respectively. The calibration range was greater than that of the prediction, which supported building a robust PLSR model, as evidenced by the relationship between the distribution of the actual and predicted values in both the calibration and prediction datasets of apples and plums.

3.4. Chemical Visualization and Mapping of Apple and Plum Fruit

HSI has been successfully used in tomatoes to visualize different chemical components including SSC, MC, and pH [41]. In this research, HSI was utilized and PLS images were created to visualize and map the same chemical distribution, as shown in Figure 9 for apples and Figure 10 for plums.

4. Discussion

For both apples and plums, the model performance followed the order NP > PW > PET. The PW and PET samples were scanned with fruit inside, resulting in the spectra reflected onto the HSI sensors being a combination of the chemical properties of the fruit and plastic. This mixture caused the results to be slightly lower than those of NP. In the study of Gowen et al. [55], the effect of polymer-based packaging on HSI data which is applicable to various agricultural commodities was investigated. The primary effect of the tested plastic films was found to be attributed to light scattering [55]. Moreover, the density of the PET box, which is greater and thicker than PW, caused the result to be slightly lower. The recognition of thin plastic materials is easy compared to thicker plastics like PET due to the reflection of wave spectra [56]. Zhang et al. [57] reported that the packaging materials introduced significant challenges to the beef samples under visible–near-infrared HSI due to the spectral interference. The preprocessing and modeling techniques were used to eliminate the influence of plastics, and the results improved with R2p higher than 0.90 [57]. Therefore, the application of this methodology to different types of packaged fruit is recommended for future studies to investigate the behavior and effect of different plastic signals on the inner quality parameters of the fruit. The Vis-NIR and SWIR pH values were lower than SSC and MC. However, the predicted pH values correlated strongly with the actual values and were closely aligned. This can be attributed to the statistical values of pH, ranging from 3.74 to 4.75 for apples and 3.55 to 3.95 for plums, which are consistent with those found by [58,59]. Furthermore, the SWIR results were greater than those of Vis-NIR because of the sensitivity of SWIR to the chemical bonds of fruit, which implies the reaction of molecular bonds including C-H, O-H, and N-H. Therefore, it was possible to predict the SSC, MC, and pH of apples and plums containing bonds such as C–H, O–H, C–O, and C–C [41]. Although the spectral range of the HSI-SWIR used was from 1000 to 2500 nm, the lighting provided by the tungsten halogen lamp was effective only for wavelengths between 1000 and 1800 nm. The same range was reported in the identification and detection of various plastics including PW and PET from soil debris [60]. Beyond 1800 nm, the intensity of the white image reflection, measured with a Teflon sheet (99% reflectance), was minimal and flat, indicating that the information from this region was unreliable. This limitation can hinder the accurate detection of certain chemical properties requiring extended spectral coverage [45]. Although PLSR performed better, it assumes a simple linear latent relationship between the spectra and the target parameters, which does not improve results for the complex, curved responses often seen in fruit physiology. The comparative analysis of different regression method or the ensemble approach, which integrates the strengths of multiple diverse models, including support vector regression (SVR) and random forest (RF), could have the benefit of accurate prediction with lower errors [61,62]. To create chemical images of the fruits with minimized glare and free specular reflections on the surface, only images taken by Vis-NIR for each fruit were used. The SWIR setup lacked polarization filters or polarizer sheets, leading to specular reflection and artifacts that can obscure the chemical image visualization of the fruits [63]. Signoroni and colleagues have discussed the effect of glare on the acquired HSI data. The unwanted light contributions were evidenced in both spatial and spectral measurements [64]. Therefore, Vis-NIR was used to depict variations in the chemical composition of the fruits and offer a convenient means of observing the spatial distribution and relative concentrations of these chemicals. On the color bar maps, the sky blue, deep blue, and yellow colors indicate the concentration of SSC, MC, and pH, respectively. The concentrations were in the range of 11–16, 0.83–0.88, 3.6–4.8, and 7–14, 0.87–0.93, 3.55–3.95, representing the SSC, MC, and pH of apples and plums, respectively, which is consistent with the values used in Table 2 helped to build the best PLSR model.

5. Conclusions

This study presents an approach to assess the quality traits of fresh fruit in plastic packaging and non-packaged forms using Vis-NIR and SWIR HSI systems. The PLSR chemometric model was used to evaluate the SSC, MC, and pH of apples and plums. For both HSI systems, the PLSR model accuracy of non-packaged apples was higher than that of packaged ones, as indicated by the highest R2 values, exceeding 0.82, and the smallest errors, less than 0.57, across all parameters in both the calibration and validation datasets, except for pH. In predicting packaged fruit’s quality characteristics, the results were also promising, indicated by the R2 surpassing 0.80 and 0.79, and RMSE of 0.59 and 0.59 for PW and PET, respectively. When evaluating packaged fruit using HSI, the camera must be equipped with cooling settings to avoid a temperature elevation inside the scanner, as HSI involves halogen lamps as a light source. Vis-NIR is recommended for clear visualization of chemical distribution inside the fruit. This study highlights the ability of HSI as a critical instrument for ensuring the quality of packaged agricultural products in laboratory settings, offering valuable insights for industry practitioners and consumers. Further studies should explore the sustainable implementation of this approach on commercial supply chains. Technical expertise in data handling and packaging material interference with the fruit spectral data are issues that need closer attention. Therefore, this work provides new insights into the field by validating the robustness of chemometric models under diverse scenarios, thereby emphasizing the novelty and practical relevance of the findings.

Author Contributions

Conceptualization, B.-K.C. and U.A.; methodology, D.S., M.F.R.P., T.A. and M.A.F.; software, U.A., M.F.R.P. and D.S.; validation, B.-K.C.; formal analysis, U.A. and M.F.R.P.; investigation, U.A., M.F.R.P. and T.A.; data curation, U.A., T.A., S.-Y.K. and D.O.; writing—original draft preparation, U.A.; writing—review and editing, U.A. and B.-K.C.; visualization, U.A.; supervision, B.-K.C.; project administration, B.-K.C.; funding acquisition, B.-K.C. All authors have read and agreed to the published version of the manuscript.

Funding

This work was supported by Korea Institute of Planning and Evaluation for Technology in Food, Agriculture, Forestry (IPET) through Smart Agri Products Flow Storage Technology Development Program, funded by Ministry of Agriculture, Food and Rural Affairs (MAFRA) (322051-05).

Institutional Review Board Statement

Not applicable.

Data Availability Statement

The data presented in this study are available on request from the corresponding author. The data are not publicly available due to confidentiality agreements with participating partners.

Conflicts of Interest

The authors declare no conflicts of interest. The funders had no role in the design of the study; in the collection, analyses, or interpretation of the data; in the writing of the manuscript; or in the decision to publish the results.

References

  1. Alam, A.U.; Rathi, P.; Beshai, H.; Sarabha, G.K.; Jamal Deen, M. Fruit Quality Monitoring with Smart Packaging. Sensors 2021, 21, 1509. [Google Scholar] [CrossRef]
  2. Mujtaba, M.; Lipponen, J.; Ojanen, M.; Puttonen, S.; Vaittinen, H. Trends and Challenges in the Development of Bio-Based Barrier Coating Materials for Paper/Cardboard Food Packaging; a Review. Sci. Total Environ. 2022, 851, 158328. [Google Scholar] [CrossRef] [PubMed]
  3. Ibrahim, I.D.; Hamam, Y.; Sadiku, E.R.; Ndambuki, J.M.; Kupolati, W.K.; Jamiru, T.; Eze, A.A.; Snyman, J. Need for Sustainable Packaging: An Overview. Polymers 2022, 14, 4430. [Google Scholar] [CrossRef] [PubMed]
  4. Wu, S.; Montalvo, L. Repurposing Waste Plastics into Cleaner Asphalt Pavement Materials: A Critical Literature Review. J. Clean. Prod. 2021, 280, 124355. [Google Scholar] [CrossRef]
  5. Elfaleh, I.; Abbassi, F.; Habibi, M.; Ahmad, F.; Guedri, M.; Nasri, M.; Garnier, C. A Comprehensive Review of Natural Fibers and Their Composites: An Eco-Friendly Alternative to Conventional Materials. Results Eng. 2023, 19, 101271. [Google Scholar] [CrossRef]
  6. Sarkar, S.; Aparna, K. Research Trends in Home Science and Extension; AkiNik Publications: New Delhi, India, 2020. [Google Scholar] [CrossRef]
  7. He, X.; Pu, Y.; Chen, L.; Jiang, H.; Xu, Y.; Cao, J.; Jiang, W. A Comprehensive Review of Intelligent Packaging for Fruits and Vegetables: Target Responders, Classification, Applications, and Future Challenges. Compr. Rev. Food Sci. Food Saf. 2023, 22, 842–881. [Google Scholar] [CrossRef]
  8. Dirpan, A.; Djalal, M.; Kamaruddin, I. Application of an Intelligent Sensor and Active Packaging System Based on the Bacterial Cellulose of Acetobacter Xylinum to Meat Products. Sensors 2022, 22, 544. [Google Scholar] [CrossRef]
  9. Kim, Y.H.; Yangb, Y.J.; Kim, J.S.; Choi, D.S.; Park, S.H.; Jin, S.Y.; Park, J.S. Non-Destructive Monitoring of Apple Ripeness Using an Aldehyde Sensitive.Pdf. Food Chem. 2018, 267, 149–156. [Google Scholar] [CrossRef]
  10. Keshri, N.; Truppel, I.; Herppich, W.B.; Geyer, M.; Weltzien, C.; Mahajan, P.V. In-Situ Measurement of Fresh Produce Respiration Using a Modular Sensor-Based System. Sensors 2020, 20, 3589. [Google Scholar] [CrossRef]
  11. Adiani, V.; Gupta, S.; Variyar, P.S. A Simple Time Temperature Indicator for Real Time Microbial Assessment in Minimally Processed Fruits. J. Food Eng. 2021, 311, 110731. [Google Scholar] [CrossRef]
  12. Shao, P.; Liu, L.; Yu, J.; Zheng, L.; Sun, P. Novel Aldehyde Sensitive Bio-Based Colorimetric Film for Kiwi Fruit Freshness Monitoring. LWT 2022, 159, 113177. [Google Scholar] [CrossRef]
  13. Alamri, M.S.; Qasem, A.A.A.; Mohamed, A.A.; Hussain, S.; Ibraheem, M.A.; Shamlan, G.; Alqah, H.A.; Qasha, A.S. Food Packaging’s Materials: A Food Safety Perspective. Saudi J. Biol. Sci. 2021, 28, 4490–4499. [Google Scholar] [CrossRef]
  14. Wang, B.; Jianfei, S.; Lianming, X.; Junjie, L.; Zhenhe, W.; Pei, L.; Yemin, G.; Sun, X. The Applications of Hyperspectral Imaging Technology for Agricultural Products Quality Analysis: A Review. Food Rev. Int. 2023, 39, 1043–1062. [Google Scholar] [CrossRef]
  15. Aline, U.; Bhattacharya, T.; Faqeerzada, M.A.; Kim, M.S.; Baek, I.; Cho, B.-K. Advancement of Non-Destructive Spectral Measurements for the Quality of Major Tropical Fruits and Vegetables: A Review. Front. Plant Sci. 2023, 14, 1240361. [Google Scholar] [CrossRef]
  16. Park, S.J.; Yoon, H.I.; Lee, H.; Kim, M.; Yang, J.; Jung, D.; Ahn, J.Y.; Park, S.H. Evaluating the Accuracy of Machine Learning Classification Models for Similar Herbal Medicine Using Hyperspectral Imaging. J. Biosyst. Eng. 2024, 49, 156–166. [Google Scholar] [CrossRef]
  17. Zeng, S.; Zhang, Z.; Cheng, X.; Cai, X.; Cao, M.; Guo, W. Prediction of Soluble Solids Content Using Near-Infrared Spectra and Optical Properties of Intact Apple and Pulp Applying PLSR and CNN. Spectrochim. Acta Part A Mol. Biomol. Spectrosc. 2024, 304, 123402. [Google Scholar] [CrossRef] [PubMed]
  18. Semyalo, D.; Kim, Y.; Omia, E.; Arief, M.A.A.; Kim, H.; Sim, E.-Y.; Kim, M.S.; Baek, I.; Cho, B.-K. Nondestructive Identification of Internal Potato Defects Using Visible and Short-Wavelength Near-Infrared Spectral Analysis. Agriculture 2024, 14, 2014. [Google Scholar] [CrossRef]
  19. Kaparapu, J.; Pragada, P.M.; Geddada, M.N.R. Fruits and Vegetables and Its Nutritional Benefits BT. In Functional Foods and Nutraceuticals: Bioactive Components, Formulations and Innovations; Egbuna, C., Dable Tupas, G., Eds.; Springer International Publishing: Cham, Switzerland, 2020; pp. 241–260. ISBN 978-3-030-42319-3. [Google Scholar]
  20. Tian, Y.; Sun, J.; Zhou, X.; Yao, K.; Tang, N. Detection of Soluble Solid Content in Apples Based on Hyperspectral Technology Combined with Deep Learning Algorithm. J. Food Process. Preserv. 2022, 46, 1–11. [Google Scholar] [CrossRef]
  21. Kavuncuoğlu, E.; Çetin, N.; Yildirim, B.; Nadimi, M.; Paliwal, J. Exploration of Machine Learning Algorithms for PH and Moisture Estimation in Apples Using VIS-NIR Imaging. Appl. Sci. 2023, 13, 8391. [Google Scholar] [CrossRef]
  22. Li, B.; Cobo-Medina, M.; Lecourt, J.; Harrison, N.B.; Harrison, R.J.; Cross, J.V. Application of Hyperspectral Imaging for Nondestructive Measurement of Plum Quality Attributes. Postharvest Biol. Technol. 2018, 141, 8–15. [Google Scholar] [CrossRef]
  23. Siche, R.; Vejarano, R.; Aredo, V.; Velasquez, L.; Saldaña, E.; Quevedo, R. Evaluation of Food Quality and Safety with Hyperspectral Imaging (HSI). Food Eng. Rev. 2016, 8, 306–322. [Google Scholar] [CrossRef]
  24. Liu, Y.; Pu, H.; Sun, D.W. Hyperspectral Imaging Technique for Evaluating Food Quality and Safety during Various Processes: A Review of Recent Applications. Trends Food Sci. Technol. 2017, 69, 25–35. [Google Scholar] [CrossRef]
  25. Lan, W.; Jaillais, B.; Renard, C.M.G.C.; Leca, A.; Chen, S.; Le Bourvellec, C.; Bureau, S. A Method Using near Infrared Hyperspectral Imaging to Highlight the Internal Quality of Apple Fruit Slices. Postharvest Biol. Technol. 2021, 175, 111497. [Google Scholar] [CrossRef]
  26. Metlenkin, D.A.; Platov, Y.T.; Platova, R.A.; Zhirkova, E.V.; Teneva, O.T. Non-Destructive Identification of Defects and Classification of Hass Avocado Fruits with the Use of a Hyperspectral Image. Agron. Res. 2022, 20, 326–340. [Google Scholar] [CrossRef]
  27. Mishra, P.; Chauhan, A.; Pettersson, T. Seeing through Plastics: A Novel Combination of NIR Hyperspectral Imaging and Spectral Orthogonalization for Detecting Fresh Fruit inside Plastic Packaging to Support Automated Barcode Less Checkouts in Supermarkets. Food Control 2023, 150, 109762. [Google Scholar] [CrossRef]
  28. Kharbach, M.; Alaoui Mansouri, M.; Taabouz, M.; Yu, H. Current Application of Advancing Spectroscopy Techniques in Food Analysis: Data Handling with Chemometric Approaches. Foods 2023, 12, 2753. [Google Scholar] [CrossRef]
  29. Burnett, A.C.; Anderson, J.; Davidson, K.J.; Ely, K.S.; Lamour, J.; Li, Q.; Morrison, B.D.; Yang, D.; Rogers, A.; Serbin, S.P. A Best-Practice Guide to Predicting Plant Traits from Leaf-Level Hyperspectral Data Using Partial Least Squares Regression. J. Exp. Bot. 2021, 72, 6175–6189. [Google Scholar] [CrossRef]
  30. Yu, W.; Lee, S.-J.; Cho, H. Partial Least Squares Regression Trees for Multivariate Response Data with Multicollinear Predictors. IEEE Access 2024, 12, 36636–36644. [Google Scholar] [CrossRef]
  31. Shawky, E.; Selim, D.A. NIR Spectroscopy-Multivariate Analysis for Discrimination and Bioactive Compounds Prediction of Different Citrus Species Peels. Spectrochim. Acta Part A Mol. Biomol. Spectrosc. 2019, 219, 1–7. [Google Scholar] [CrossRef]
  32. Chen, H.; Qiao, H.; Feng, Q.; Xu, L.; Lin, Q.; Cai, K. Rapid Detection of Pomelo Fruit Quality Using Near-Infrared Hyperspectral Imaging Combined With Chemometric Methods. Front. Bioeng. Biotechnol. 2021, 8, 1–9. [Google Scholar] [CrossRef]
  33. Gao, Q.; Wang, P.; Niu, T.; He, D.; Wang, M.; Yang, H.; Zhao, X. Soluble Solid Content and Firmness Index Assessment and Maturity. Food Chem. 2022, 370, 131013. [Google Scholar] [CrossRef]
  34. Hapuarachchi, N.S.; Trueman, S.J.; Kämper, W.; Farrar, M.B.; Wallace, H.M.; Nichols, J.; Bai, S.H. Hyperspectral Imaging of Adaxial and Abaxial Leaf Surfaces for Rapid Assessment of Foliar Nutrient Concentrations in Hass Avocado. Remote Sens. 2023, 15, 3100. [Google Scholar] [CrossRef]
  35. Zhang, X.; Yang, J. Advanced Chemometrics toward Robust Spectral Analysis for Fruit Quality Evaluation. Trends Food Sci. Technol. 2024, 150, 104612. [Google Scholar] [CrossRef]
  36. Tunny, S.S.; Kurniawan, H.; Amanah, H.Z.; Baek, I.; Kim, M.S.; Chan, D.; Faqeerzada, M.A.; Wakholi, C.; Cho, B.K. Hyperspectral Imaging Techniques for Detection of Foreign Materials from Fresh-Cut Vegetables. Postharvest Biol. Technol. 2023, 201, 112373. [Google Scholar] [CrossRef]
  37. De Oliveira, T.S.; Costa, A.M.M.; Cabral Correa, L.M.; Freitas-Silva, O.; Tonon, R.V. Physical and Biological Properties of Alginate-Based Cinnamon Essential Oil. Int. J. Biol. Macromol. 2024, 275, 133627. [Google Scholar] [CrossRef] [PubMed]
  38. Semyalo, D.; Kwon, O.; Wakholi, C.; Min, H.J.; Cho, B.K. Nondestructive Online Measurement of Pineapple Maturity and Soluble Solids Content Using Visible and Near-Infrared Spectral Analysis. Postharvest Biol. Technol. 2024, 209, 112706. [Google Scholar] [CrossRef]
  39. Chen, S.; Feng, Z.; Wang, M.; Zhao, L.; Yu, Z.; Xia, C.; Huang, X. Leaching Kinetic Study of Sulfuric Acid Roasted Mixed-Type Rare Earth Concentrate for Reducing the Solid-Waste Production and Chemical Consumption. J. Clean. Prod. 2020, 260, 120989. [Google Scholar] [CrossRef]
  40. Puligundla, P.; Kim, J.W.; Mok, C. Effects of Nonthermal Plasma Treatment on Decontamination and Sprouting of Radish (Raphanus Sativus L.) Seeds. Food Bioprocess Technol. 2017, 10, 1093–1102. [Google Scholar] [CrossRef]
  41. Rahman, A.; Kandpal, L.M.; Lohumi, S.; Kim, M.S.; Lee, H.; Mo, C.; Cho, B.K. Nondestructive Estimation of Moisture Content, PH and Soluble Solid Contents in Intact Tomatoes Using Hyperspectral Imaging. Appl. Sci. 2017, 7, 109. [Google Scholar] [CrossRef]
  42. Morais, C.L.M.; Paraskevaidi, M.; Cui, L.; Fullwood, N.J.; Isabelle, M.; Lima, K.M.G.; Martin-Hirsch, P.L.; Sreedhar, H.; Trevisan, J.; Walsh, M.J. Standardization of Complex Biologically Derived Spectrochemical Datasets. Nat. Protoc. 2019, 14, 1546–1577. [Google Scholar] [CrossRef]
  43. Dorrepaal, R.; Malegori, C.; Gowen, A. Tutorial: Time Series Hyperspectral Image Analysis. J. Near Infrared Spectrosc. 2016, 24, 89–107. [Google Scholar] [CrossRef]
  44. Rinnan, Å.; Van Den Berg, F.; Engelsen, S.B. Review of the Most Common Pre-Processing Techniques for near-Infrared Spectra. TrAC Trends Anal. Chem. 2009, 28, 1201–1222. [Google Scholar] [CrossRef]
  45. Amanah, H.Z.; Wakholi, C.; Perez, M.; Faqeerzada, M.A.; Tunny, S.S.; Masithoh, R.E.; Choung, M.G.; Kim, K.H.; Lee, W.H.; Cho, B.K. Near-Infrared Hyperspectral Imaging (Nir-Hsi) for Nondestructive Prediction of Anthocyanins Content in Black Rice Seeds. Appl. Sci. 2021, 11, 4841. [Google Scholar] [CrossRef]
  46. Aulia, R.; Kim, Y.; Amanah, H.; Andi, A.; Kim, H.; Kim, H.; Lee, W.-H.; Kim, K.-H.; Baek, J.-H.; Cho, B.-K. Non-Destructive Prediction of Protein Contents of Soybean Seeds Using Near-Infrared Hyperspectral Imaging. Infrared Phys. Technol. 2022, 127, 104365. [Google Scholar] [CrossRef]
  47. Wang, Z.; Wu, S.; Zuo, C.; Jiang, M.; Song, J.; Ding, F.; Tu, K.; Lan, W.; Pan, L. Exploring the Variability and Heterogeneity of Apple Firmness Using Visible and Near-Infrared Hyperspectral Imaging. LWT 2024, 192, 115704. [Google Scholar] [CrossRef]
  48. Çetin, N.; Karaman, K.; Kavuncuoğlu, E.; Yıldırım, B.; Jahanbakhshi, A. Using Hyperspectral Imaging Technology and Machine Learning Algorithms for Assessing Internal Quality Parameters of Apple Fruits. Chemom. Intell. Lab. Syst. 2022, 230, 104650. [Google Scholar] [CrossRef]
  49. Castillo-Girones, S.; Van Belleghem, R.; Wouters, N.; Munera, S.; Blasco, J.; Saeys, W. Detection of Subsurface Bruises in Plums Using Spectral Imaging and Deep Learning with Wavelength Selection. Postharvest Biol. Technol. 2024, 207, 112615. [Google Scholar] [CrossRef]
  50. Horbowicz, M.; Grzesiuk, A.; DĘBski, H.; Kosson, R. Anthocyanins of Fruits and Vegetables—Their Occurrence, Analysis and Role in Human. Veg. Crop. Res. Bull. 2008, 68, 5–22. [Google Scholar] [CrossRef]
  51. Moshtaghi, M.; Knaeps, E.; Sterckx, S.; Garaba, S.; Meire, D. Spectral Reflectance of Marine Macroplastics in the VNIR and SWIR Measured in a Controlled Environment. Sci. Rep. 2021, 11, 5436. [Google Scholar] [CrossRef]
  52. Chen, X.; Kroell, N.; Althaus, M.; Pretz, T.; Pomberger, R.; Greiff, K. Enabling Mechanical Recycling of Plastic Bottles with Shrink Sleeves through Near-Infrared Spectroscopy and Machine Learning Algorithms. Resour. Conserv. Recycl. 2023, 188, 106719. [Google Scholar] [CrossRef]
  53. Alassali, A.; Fiore, S.; Kuchta, K. Assessment of Plastic Waste Materials Degradation through near Infrared Spectroscopy. Waste Manag. 2018, 82, 71–81. [Google Scholar] [CrossRef]
  54. Tiecher, T.; Moura-Bueno, J.M.; Caner, L.; Minella, J.P.G.; Evrard, O.; Ramon, R.; Naibo, G.; Barros, C.A.P.; Silva, Y.J.A.B.; Amorim, F.F. Improving the Quantification of Sediment Source Contributions Using Different Mathematical Models and Spectral Preprocessing Techniques for Individual or Combined Spectra of Ultraviolet–Visible, near-and Middle-Infrared Spectroscopy. Geoderma 2021, 384, 114815. [Google Scholar] [CrossRef]
  55. Gowen, A.A.; O’Donnell, C.P.; Esquerre, C.; Downey, G. Influence of Polymer Packaging Films on Hyperspectral Imaging Data in the Visible–near-Infrared (450–950 Nm) Wavelength Range. Appl. Spectrosc. 2010, 64, 304–312. [Google Scholar] [CrossRef] [PubMed]
  56. Koinig, G.; Friedrich, K.; Rutrecht, B.; Oreski, G.; Barretta, C.; Vollprecht, D. Influence of Reflective Materials, Emitter Intensity and Foil Thickness on the Variability of near-Infrared Spectra of 2D Plastic Packaging Materials. Waste Manag. 2022, 144, 543–551. [Google Scholar] [CrossRef] [PubMed]
  57. Zhang, W.; Pan, L.; Lu, L. Prediction of TVB-N Content in Beef with Packaging Films Using Visible-near Infrared Hyperspectral Imaging. Food Control 2023, 147, 109562. [Google Scholar] [CrossRef]
  58. Pourdarbani, R.; Sabzi, S.; Arribas, J.I. Nondestructive Estimation of Three Apple Fruit Properties at Various Ripening Levels with Optimal Vis-NIR Spectral Wavelength Regression Data. Heliyon 2021, 7, e07942. [Google Scholar] [CrossRef]
  59. Abasi, S.; Minaei, S.; Jamshidi, B.; Fathi, D.; Khoshtaghaza, M.H. Rapid Measurement of Apple Quality Parameters Using Wavelet De-Noising Transform with Vis/NIR Analysis. Sci. Hortic. 2019, 252, 7–13. [Google Scholar] [CrossRef]
  60. Mehrubeoglu, M.; Van Sickle, A.; Turner, J. Detection and Identification of Plastics Using SWIR Hyperspectral Imaging. In Imaging Spectrometry XXIV: Applications, Sensors, and Processing; SPIE: Bellingham, WA, USA, 2020; Volume 11504, pp. 85–95. [Google Scholar]
  61. Xin, Z.; Ju, S.; Zhang, D.; Zhou, X.-G.; Guo, S.; Pan, Z.; Wang, L.; Cheng, T. Construction of Spectral Detection Models to Evaluate Soluble Solids Content and Acidity in Dangshan Pear Using Two Different Sensors. Infrared Phys. Technol. 2023, 131, 104632. [Google Scholar] [CrossRef]
  62. Nguyen Van, L.; Lee, G. Optimizing Stacked Ensemble Machine Learning Models for Accurate Wildfire Severity Mapping. Remote Sens. 2025, 17, 854. [Google Scholar] [CrossRef]
  63. Faqeerzada, M.A.; Kim, Y.-N.; Kim, H.; Akter, T.; Kim, H.; Park, M.-S.; Kim, M.S.; Baek, I.; Cho, B.-K. Hyperspectral Imaging System for Pre-and Post-Harvest Defect Detection in Paprika Fruit. Postharvest Biol. Technol. 2024, 218, 113151. [Google Scholar] [CrossRef]
  64. Signoroni, A.; Conte, M.; Plutino, A.; Rizzi, A. Spatial–Spectral Evidence of Glare Influence on Hyperspectral Acquisitions. Sensors 2020, 20, 4374. [Google Scholar] [CrossRef]
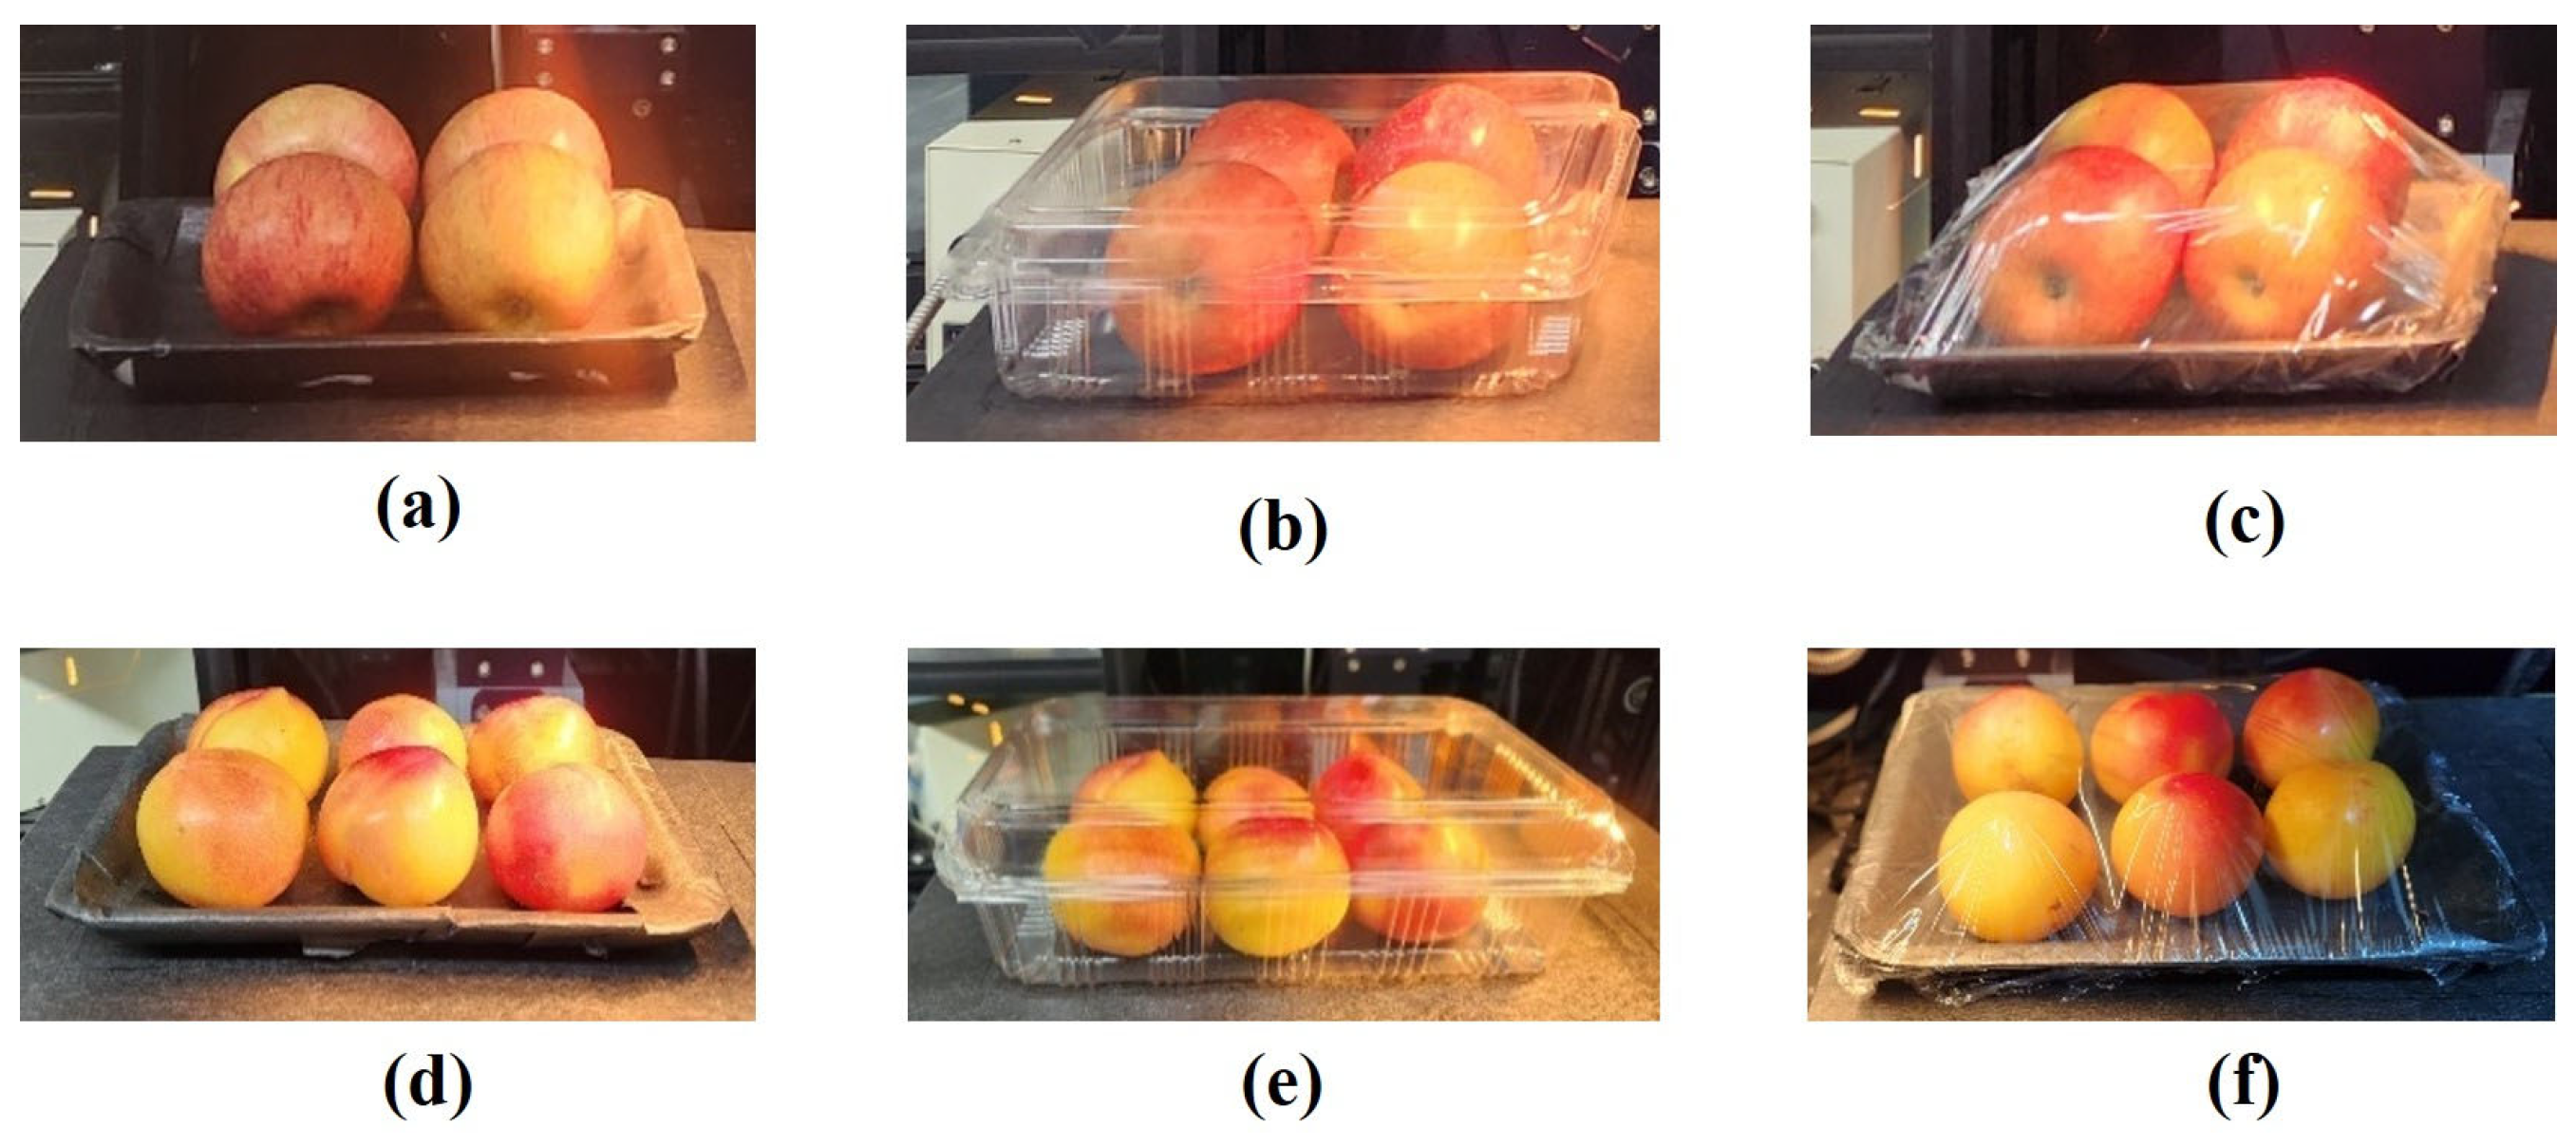
Figure 1. Preparation of apple and plum samples: non-packaged (a,d), polyethylene terephthalate (b,e), and plastic wrap (c,f), respectively.
Agriculture 15 01718 g001
Figure 2. Flow chart of the summarized process used to develop the HSI chemical image.
Agriculture 15 01718 g002
Figure 3. Mean spectra of apples (a) and (b) for Vis-NIR (400–1000 nm) and SWIR (1000–1800 nm) wavelengths, respectively.
Agriculture 15 01718 g003
Figure 4. Mean spectra of plums (a) and (b) for Vis-NIR (400–1000 nm) and SWIR (1000–1800 nm) wavelengths, respectively.
Agriculture 15 01718 g004
Figure 5. PLSR model development plots of predicted against actual values of apple fruit quality attributes (SSC, MC, and pH) for NP, PW, and PET in Vis-NIR range (400–1000 nm).
Agriculture 15 01718 g005
Figure 6. PLSR model development plots of predicted against actual values of apple fruit quality attributes (SSC, MC, and pH) for NP, PW, and PET in SWIR range (1000–1800 nm).
Agriculture 15 01718 g006
Figure 7. PLSR model development plots of predicted against actual values of plum fruit quality attributes (SSC, MC, and pH) for NP, PW, and PET in Vis-NIR range (400–1000 nm).
Agriculture 15 01718 g007
Figure 8. PLSR model development plots of predicted against actual values of plum fruit quality attributes (SSC, MC, and PH) for NP, PW, and PET in SWIR range (1000–1800 nm).
Agriculture 15 01718 g008
Figure 9. Chemical image visualization for apple. (a) SSC, (b) MC, and (c) pH.
Agriculture 15 01718 g009
Figure 10. Chemical image visualization for plum. (a) SSC, (b) MC, and (c) pH.
Agriculture 15 01718 g010
Table 1. Specifications of HSI systems used in the experiment [36].
System ComponentsHSI Vis-NIRHSI SWIR
Light source100 Watt-Quartz tungsten halogen (QTH) line light.100 Watt-Quartz tungsten halogen (QTH) line light (SWIR via quartz fiber bundles).
Imaging spectrograph(Vis-NIR, Headwall Photonics, Fitchburg, MA, USA) with 400–1000 nm wavelength range, and 4.7 nm spectral resolution.(SWIR, Headwall Photonics, Fitchburg, MA, USA) with 1000–2500 nm wavelength range, and 5.9 nm spectral resolution.
Image sensorsElectron multiplying charge-coupled device (EMCCD) with pixels: 1004 × 1002 (Spatial × Spectral channels).A mercury cadmium telluride (MCT; HgCdTe) with Pixels: 320 × 256 (Spatial × Spectral channels).
Objective lensFocal length: 23 mm, f/1.4Focal length: 25 mm, f/1.4
Table 2. Statistical results of all parameters measured.
FruitParametersSample NumbersMean ± SDMinimumMaximum
AppleSSC (%)20013.49 ± 1.2011.0315.80
MC (%)20086 ± 28091
Ph2004.14 ± 0.203.744.75
PlumSSC (%)20010.52 ± 1.64714
MC (%)20090 ± 28793
pH2003.48 ± 0.163.553.95
SD: Standard deviation.
Disclaimer/Publisher’s Note: The statements, opinions and data contained in all publications are solely those of the individual author(s) and contributor(s) and not of MDPI and/or the editor(s). MDPI and/or the editor(s) disclaim responsibility for any injury to people or property resulting from any ideas, methods, instructions or products referred to in the content.