Article

Spatial Analysis of Soil Acidity and Available Phosphorus in Coffee-Growing Areas of Pichanaqui: Implications for Liming and Site-Specific Fertilization

1
Dirección de Supervisión de Servicios Estratégicos Agrarios, en las Estaciones Experimentales Agrarias, Instituto Nacional de Innovación Agraria (INIA), Av. La Molina 1981, Lima 15024, Peru
2
Dirección de Supervisión de Servicios Estratégicos Agrarios, en las Estaciones Experimentales Agrarias—INIA, Av. Marginal Km 74, Pichanaqui 12865, Peru
3
Jefatura Técnica de Nutrición Vegetal, Gerencia de Desarrollo, Grupo Silvestre, Lima 15067, Peru
4
Facultad de Ciencias Ambientales, Universidad Científica del Sur (UCSUR), Lima 15067, Peru
*
Author to whom correspondence should be addressed.
Agriculture 2025, 15(15), 1632; https://doi.org/10.3390/agriculture15151632
Submission received: 12 June 2025 / Revised: 19 July 2025 / Accepted: 20 July 2025 / Published: 28 July 2025
(This article belongs to the Section Agricultural Soils)

Abstract

Soil acidity is one of the main limiting factors for coffee production in Peruvian rainforests. The objective of this study is to predict the spatial acidity variability for recommending site-specific liming and phosphorus fertilization treatments. We analyzed thirty-six edaphoclimatic variables, eight methods for estimating liming doses, and three geospatial variables from 552 soil samples in the Pichanaqui district of Peru. Multivariate statistics, nonparametric comparison, and geostatistical analysis with Ordinary Kriging interpolation were used for data analysis. The results showed low coffee yields (0.70 ± 0.16 t ha−1) due to soil acidification. The interquartile ranges (IQR) were found to be 3.80–5.10 for pH, 0.21–0.87 cmol Kg−1 for Al+3, and 2.55–6.53 mg Kg−1 for available P, which are limiting soil conditions for coffee plantations. Moreover, pH, Al+3, Ca+2, and organic matter (OM) were the variables with the highest accuracy and quality in the spatial prediction of soil acidity (R2 between 0.77 and 0.85). The estimation method of liming requirements, MPM (integration of pH and organic material method), obtained the highest correlation with soil acidity-modulating variables and had a high spatial predictability (R2 = 0.79), estimating doses between 1.50 and 3.01 t ha−1 in soils with organic matter (OM) > 4.00%. The MAC (potential acidity method) method (R2 = 0.59) estimated liming doses between 0.51 and 0.88 t ha−1 in soils with OM < 4.00% and potential acidity greater than 0.71 cmol Kg−1. Regarding phosphorus fertilization (DAP), the results showed high requirements (median = 137.21 kg ha−1, IQR = 8.28 kg ha−1), with high spatial predictability (R2 = 0.74). However, coffee plantations on Ferralsols, with Paleogene parental material, mainly in dry forests, had the lowest predicted fertilization requirements (between 6.92 and 77.55 kg ha−1 of DAP). This research shows a moderate spatial variation of acidity, the need to optimize phosphorus fertilization, and an optimal prediction of liming requirements using the MPM and MAC methods, which indicate high requirements in the southwest of the Pichanaqui district.

1. Introduction

Coffee has been one of the most demanded agricultural products in the world throughout history [1]. It is considered the second most traded merchandise after oil, generating an international business due to its cultivation in 80 nations [2]. Countries such as Brazil, Colombia, and Ethiopia are the largest coffee producers worldwide. Across continents, Latin America was the largest producing region during the 2021–2022 agricultural season, despite having suffered its worst drop in production in almost 20 years [3].
In Peru, coffee is one of the most economically important products, ranking fifth in Arabica coffee production worldwide and third in South America [3]. According to the latest national agricultural census, this crop represents the largest cultivated area in Peru [4], with 743,000 hectares distributed across 19 regions, leading in cultivated area by the San Martín, Junin, Cajamarca, Amazonas, and Cusco departments, representing more than 289,000 Peruvian coffee producers [5]. This highlights the ecosystem diversity that provides the conditions for coffee production nationwide [6].
In Junin, the Chanchamayo province stands out for its cultivated area and number of coffee producers; standing out are the districts of Pichanaqui, Perené, and San Luis de Shuaro, while the former (Pichanaqui) reaches a total of 40,352 hectares cultivated [5]. The Pichanaqui district is considered a model forest due to its wide variety of natural resources and ecosystems. However, there is a need to solve problems such as soil acidity and prevent conflicts over natural resource use [7].
Agriculture worldwide is largely carried out on acidic soils, which involve approximately 40% of the global plowland and 52% in South America [8,9]. Acidic soils are characterized by a pH value below 5.5 for most of the year, low levels of exchangeable cations, reduced potential fertility, and high aluminum toxicity [10,11].
Aluminum toxicity is the primary constraint on crop performance in acidic soils [8], manifesting as a pronounced inhibition of root growth—particularly in the distal transition zone of the apex—through reduced mitotic activity, cytoskeletal disruption, impaired plasmodesmatal transport, and decreased cell-wall extensibility [12,13,14,15,16,17]. In roots, Al3+ accumulates in the apoplast via binding to cell-wall exchange sites [18,19], interacts with the plasma membrane to compromise its stability, permeability, and nutrient uptake [8], and induces oxidative stress that provokes lipid peroxidation and protein modification [1,20], ultimately degrading root integrity and diminishing crop yield potential.
Soil pH plays a key role in the element’s solubility, with phosphorous (P) being highly reactive in different pH ranges [21,22]. In the soil–soil solution–plant system, there are three phosphorus pools: non-labile P, labile P, and P in solution. Labile P, which is available for plant uptake in the ionic form of H2PO4- and HPO4-2, must be poured into the solution for root uptake [23]. The concentration of P in solution, its replenishment capacity, and its availability to plants are regulated by soil pH, as it affects the degree and rate of plants physiological reactions [24]. In acidic soils, inorganic phosphorus (Pi) precipitates as a secondary mineral of Fe and Al and/or is adsorbed onto the surfaces of 1:1 clay minerals and Fe and Al oxides, which limit its availability to plants [25]. Surface adsorption of P occurs readily at low pH, which increases its fixation. However, the dissolution of aluminum hydroxide (AlOH3) reduces the surface area available for P adsorption, although it provides Al+3 to the solution, promoting its precipitation in the form of aluminum phosphate [23,26].
Liming with calcium- and magnesium-rich soil amendments is a common practice to reduce soil acidity and thus improve the productivity of various crops [27,28]. This practice lessens the solubility of potentially toxic elements such as aluminum (Al+3) and manganese (Mn+2) [29,30,31], increases the availability of essential nutrients such as calcium (Ca), phosphorus (P), and molybdenum (Mo), and improves nutrient uptake efficiency [30,32]. It also promotes nitrogen fixation [33] and increases the exchangeable Ca+2 and Mg+2 contents of the soil [30,32]. Reducing soil acidity also affects microbial biomass and population, as well as the production of greenhouse gases such as nitrous oxide (N2O) and carbon dioxide (CO2) [34,35,36]. However, liming has contradictory effects on yield, depending on whether it is applied in excessive amounts [37]. It can lead to the loss of exchangeable ammonium (NH4+) from the soil through its volatilization [38]. Furthermore, overuse of dolomite can lead to magnesium toxicity and reduce the availability of other essential nutrients [39,40]. In particular, excessive liming in acidic soils can induce zinc deficiency, as its solubility decreases 100-fold for each unit increase in pH [41]. Therefore, it is essential to prepare the right dosage estimation to avoid acidity without negatively affecting nutrient availability.
In this context, soil fertility maps are essential for efficient and localized planning of agricultural practices. Their elaboration using geostatistical techniques allows modeling the spatial variability of edaphic properties and defining fertilization and liming doses more accurately [42]. In particular, the Ordinary Kriging method has proven to be effective in generating continuous estimates in unsampled areas, assuming a constant but unknown mean within the study area [43]. This assumption is suitable for heterogeneous agricultural systems where no global spatial trend is observed, as in the coffee plantations of the Peruvian rainforest. Moreover, Kriging provides an explicit measure of the prediction uncertainty, which is critical for informed decision-making in precision agriculture [44].
The present study employs Ordinary Kriging interpolation to model and map the spatial heterogeneity of liming and phosphorus fertilizer requirements for coffee plantations in Pichanaqui District (Chanchamayo Province, Junín Department), generating high-resolution characterization maps of soil acidity and plant-available phosphorus. Additionally, we seek to identify the edaphic and climatic drivers most strongly associated with acidity development and phosphorus deficiency by applying multivariate statistical techniques—including Spearman’s rank correlations, principal component analysis of 32 soil and climate variables, and nonparametric comparisons—to elucidate the key factors governing nutrient dynamics in these coffee-producing soils.

2. Materials and Methods
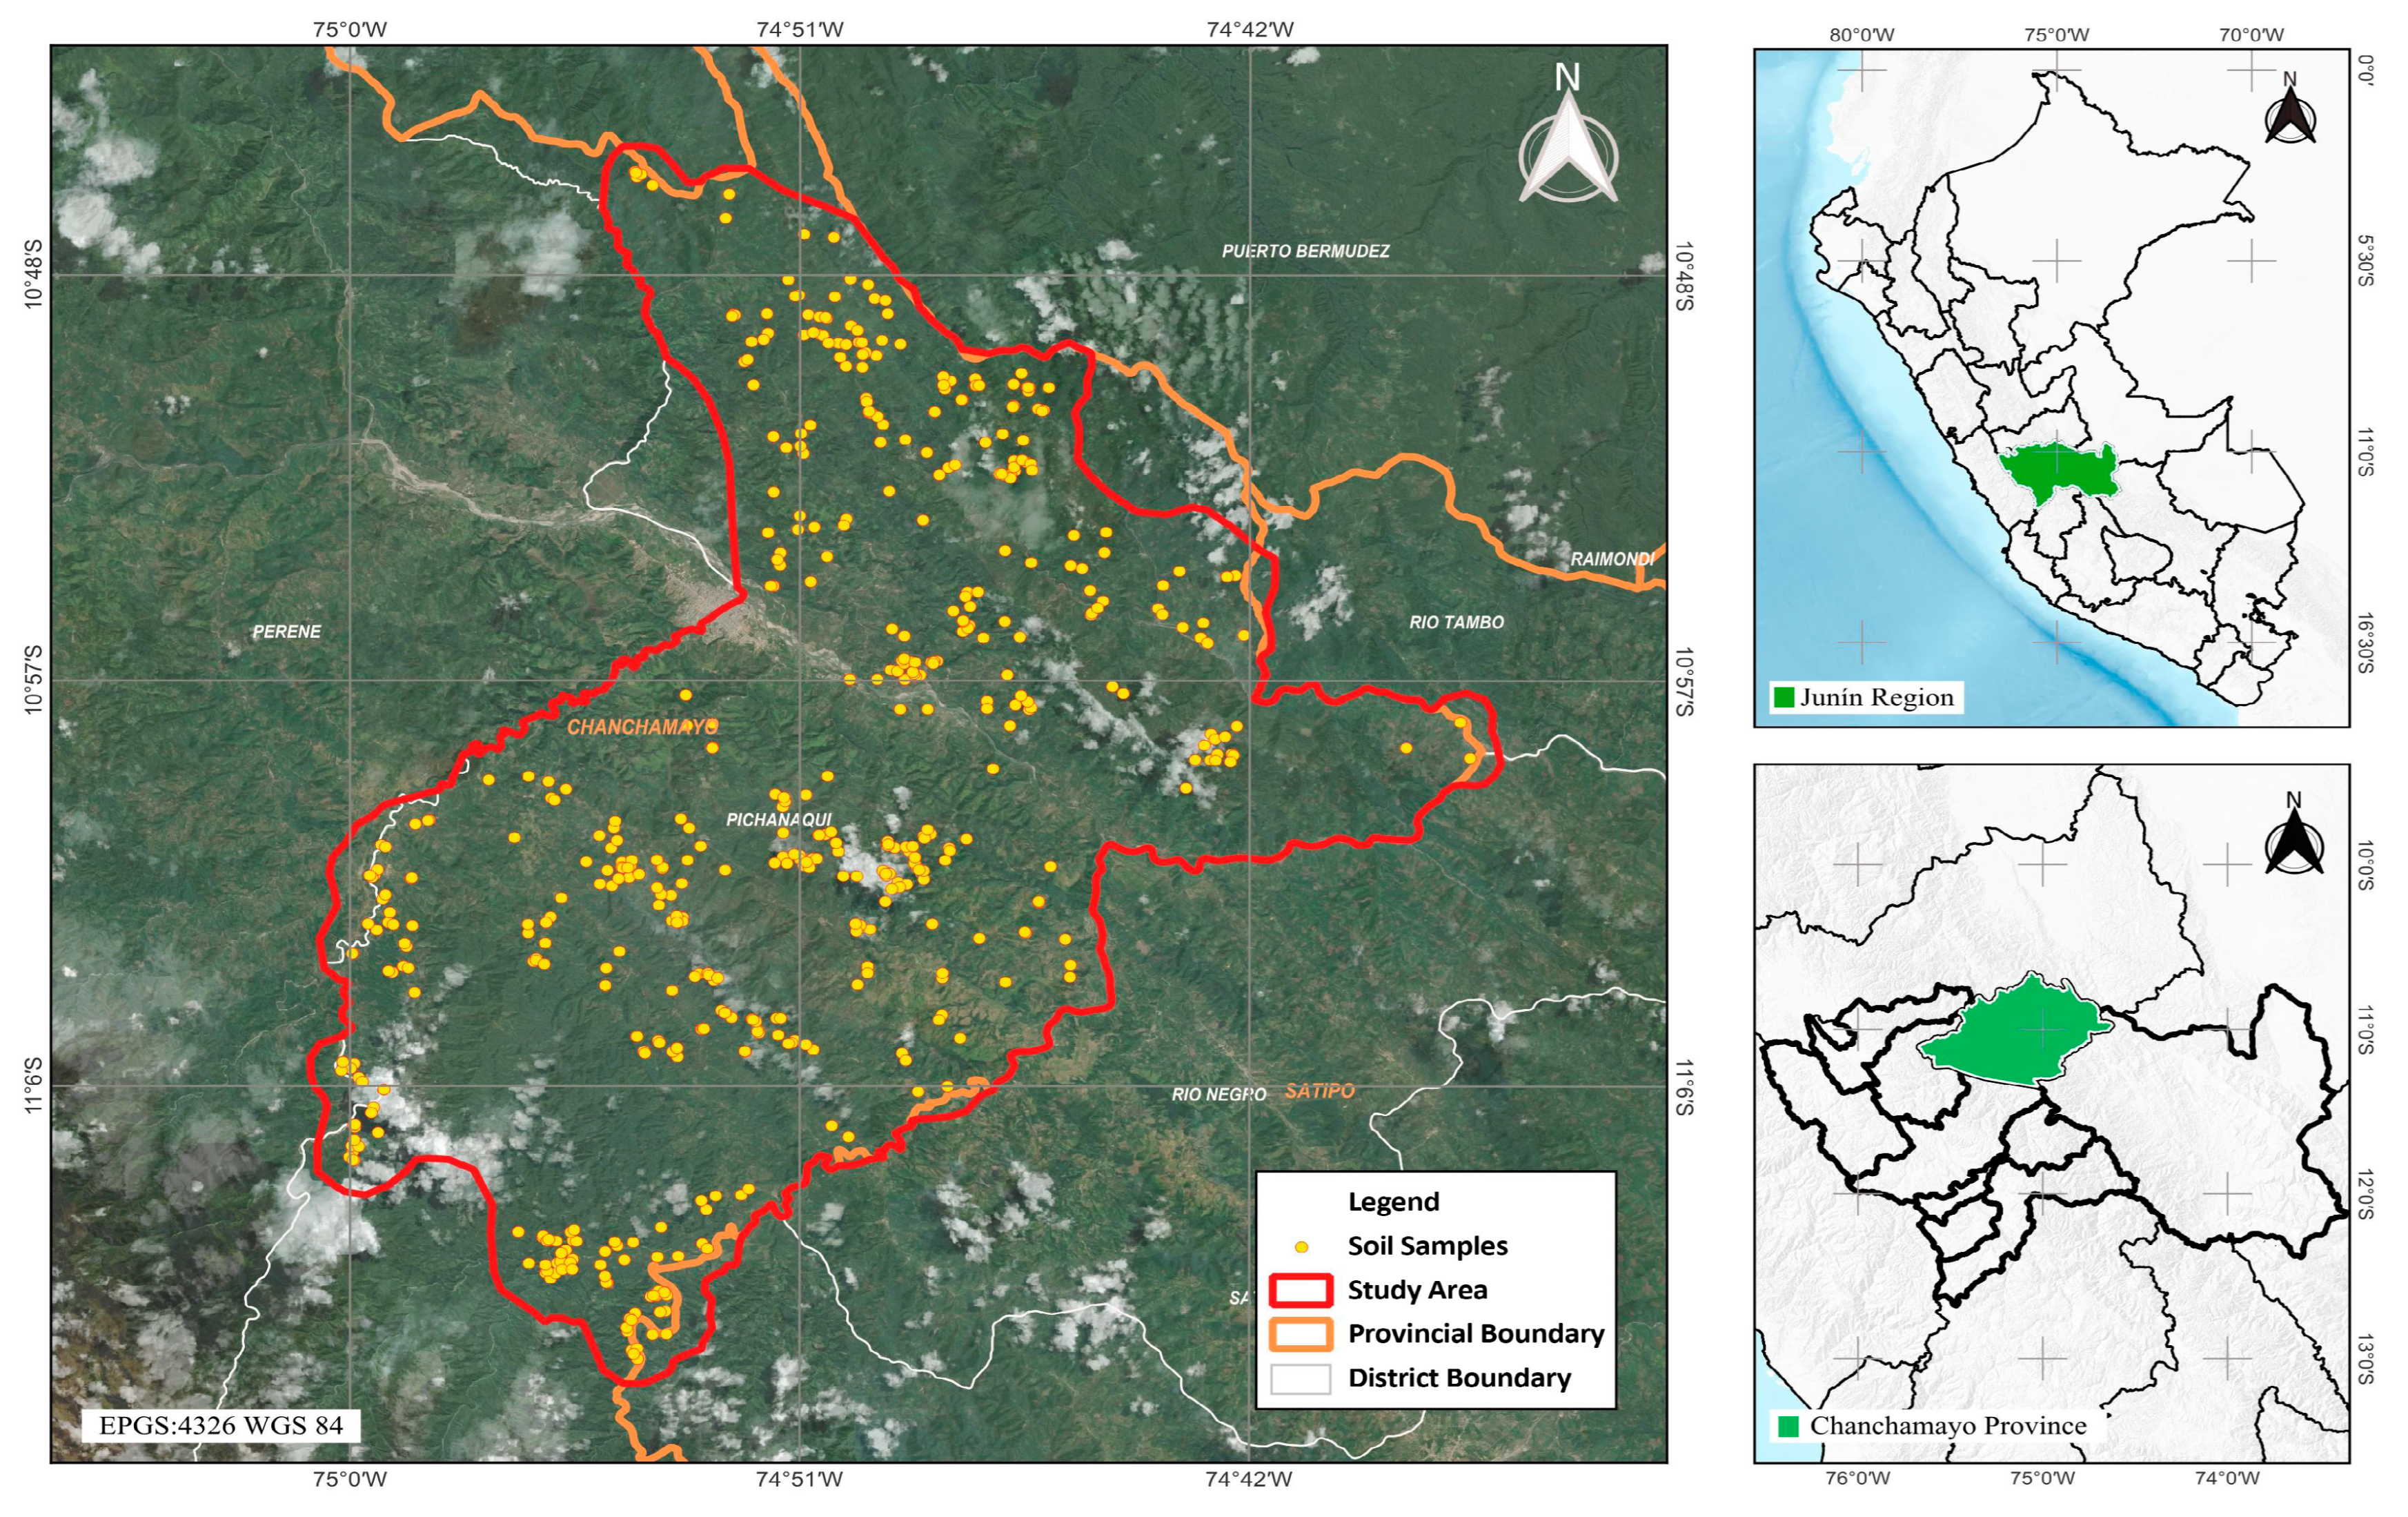
2.1. Study Area

The study area was located in Pichanaqui district, province of Chanchamayo, Junin region-Peru (Figure 1), this zone has an average annual precipitation of 1558.27 mm; a mean annual relative humidity of 73.24%; minimum temperatures between 14.05 °C (January) and 11.73 °C (June); and maximum temperatures between 26.72 °C (July) and 28.77 °C (October) (Figure 2). Historical averages were calculated based on information from the WorldClim v2.1—Climate Global Data climate database [45].

2.2. Soil Sampling

We adopted the soil sampling model proposed by Havlin et al. [37], in which each soil sample represents an agricultural unit with similar crop, topographic, and agronomic management characteristics. The sampling units (SUs) were defined according to different boundaries. The slope boundary provided a distinction between hillside and flat areas. The soil boundary divided areas with different textural classes and soil colors. The crop boundary divided areas with different rootstocks and planting ages. Finally, the area boundary ensured a maximum of 10 hectares per soil sample. After identifying the SUs, the sampling design was implemented, considering five coffee trees per homogeneous lot, with the trees being representative and randomly distributed throughout the plantation. An approximately 1 Kg sample per homogeneous batch was placed in an impermeable bag to avoid external contamination. Finally, the collection of the soil samples consisted of taking one subsample of soil per tree within the canopy projection at a depth of 0–30 cm. A total of 552 soil samples were collected from different coffee plantations in the Pichanaqui district (Figure 1).

2.3. Analysis of Soils

Soil samples were analyzed in the network of Soil, Water, and Foliar Laboratories of the National Institute of Agrarian Innovation (LABSAF-INIA). Before the physical-chemical analysis, the samples were pretreated, air-dried (temperature < 40 °C), and a fraction smaller than 2 mm was obtained, according to the procedure of the International Organization for Standardization [46]. The variables analyzed as part of the characterization analysis included the following parameters and reference methodologies: percentage of sand, silt, and clay, using the Bouyoucos-type densimeter methodology [47]; pH with a soil–water ratio of 1:1 [48]; electrical conductivity (EC) in aqueous extract with a soil–water ratio of 1:5 [49]; organic matter by Walkey and Black’s method [47]; total N by micro Kjeldahl [50]; available P for neutral and acid soils according to Bray and Kurtz’s method [47]; available K [51] and the concentration of exchangeable bases (Ca+2, Mg+2, K+, and Na+) with ammonium acetate as extractant; and exchangeable acidity (H+ and Al+3) with potassium chloride as extractant [47]. The effective cation exchange capacity (CICe) was obtained by adding the exchangeable bases plus the exchangeable acidity. Bulk density (BD) and total CIC at pH 7 were obtained from the system for global digital soil mapping, Soil Grids [52], with a spatial resolution of 250 m, considering the depth of 15–30 cm, by downloading a file in TIFF format and extracting the values in QGIS.

2.4. Extraction and Processing of Geospatial Variables

In addition to the physicochemical parameters determined in the laboratory and based on a literature review and other research, the geological age (GE), obtained at 1:100,000 from the national geological map (from sheet 21h to 27l), was selected as a possible driving factor related to the spatial pattern of soil acidity and phosphorus. The geological age provides the level of detail necessary to determine important lithological differences. The soil type (TS), with a resolution of 250 m (approx. 1:250,000) obtained from Soil Grids [53], reflects general edaphic conditions well adapted to the regional analysis. The life zone (LZ), at 1:100,000 from the life zone map [54], summarizes broad ecological factors such as climate and altitude.

2.5. Crop Description

The study area corresponds to 552 coffee plantations with predominant characteristics according to variety, plantation framework, and altitude (Figure 3). Catimor is the predominant variety, with a 71% frequency in the Pichanaqui district, followed by Catuai and Costa Rica 95. In addition, the most frequent planting frame in the installation (68%) is 2 m between rows and 1 m between plants, equivalent to 5000 plants per hectare. Regarding the altitudinal location of the plantations, 81% are located between 900 and 1500 m above sea level. According to the [55], the soils are predominantly classified as Ferralsols, followed by Cambisols, with a smaller proportion identified as Andosols. Likewise, the average yield of the sampled plantations was 700.68 ± 160.97 kg ha−1.

2.6. Estimation of Liming Requirement of Soils

The liming requirement was determined by the application of 8 different methods, according to the physical-chemical parameters such as the pH, organic matter, clay, exchangeable acidity, exchangeable bases, effective CEC, and total CEC of the soil, which are described in Table 1:

2.7. Estimation of Phosphorus Fertilization Requirements

The estimation of the required dose of phosphorus was carried out using the nutrient balance method, which consists of determining the difference between the total extraction of the crop and the contribution of the soil [64]. The contribution of P2O5 (Kg ha−1) of the soil was estimated according to that proposed by [65,66] using Formulas (1)–(6):
T S W t   h a 1 = B D t m 3 × 0.3 m × 10,000 m 2
P k g   h a 1 = T S W t   h a 1 × P b r a y g t 1 1000
P 2 O 5 s o i l k g   h a 1 = P k g   h a 1 × A f × A c × 2.29
where TSW: topsoil weight, BD: bulk density, Af: availability factor, and Ac: assimilation coefficient. Besides, Af is 0.08 if the pH ≤ 4.5; 0.1 if the pH ≤ 5; 0.15 if the pH ≤ 6; 0.3 if the pH ≤ 7; and 0.15 if the pH is higher than 7.
Total P extraction from the crop was estimated considering a removal coefficient (Rc) of 3.29, according to [67], and a phosphorus removal by the harvest (Prem) of 5.18 kg t−1 of almond coffee, according to [68]. Thus, the P2O5 requirement in kg ha−1 was estimated using the following formulas for a yield of 1 t ha−1 of almond coffee:
P 2 O 5 r e q k g   h a 1 = Y i e l d t   h a 1 × P r e m k g t 1 × R c × 2.29
P 2 O 5 n e c k g   h a 1 = P 2 O 5 r e q k g   h a 1 P 2 O 5 s o i l k g   h a 1
Finally, the dose of diammonium phosphate (DAP) was estimated considering the crop requirement (P2O5nec), the richness of the fertilizer (R) (46%), and the fertilizer use efficiency (FUE) (25%), using the following formula:
D A P k g   h a 1 = ( P 2 O 5 n e c k g   h a 1 × 100 ) / R × F U E

2.8. Multivariate Statistical Analysis

R software version 4.4.1 was used, with various tools and libraries to generate graphs that facilitate the statistical analysis of soil properties. Nonparametric bivariate correlations between numerical variables were evaluated using Spearman’s correlation coefficient, using the rcorr function from the Hmisc package (version 5.2-0). Spearman’s correlation coefficient (r), since it does not assume normality in the distribution of variables or linearity in the relationships, is particularly appropriate given the typically heterogeneous and asymmetric nature of soil data. The correlation matrix (r) and the corresponding p-value matrix were obtained from a matrix transformation of the numerical data. The corrplot function was used for visualization. Only statistically significant correlations (p < 0.01) were displayed, while non-significant ones were omitted. To reduce dimensionality and explore multivariate patterns in the evaluated soil variables, principal component analysis (PCA) was applied using the FactoMineR package and visualized using factoextra. Categorical variables were previously eliminated, and only standardized numerical data were used. Categorical study factors were transformed into factor-type variables for visualization and grouping purposes. The variances explained by each principal component (eigenvalues) and the individual contributions of the variables were evaluated. The quality of representation (cos2) and the distribution of individuals in the factor space were graphed, considering groupings according to the previously defined factors. Likewise, biplots with confidence ellipses were generated to explore possible latent structures associated with soil classes and texture types. All graphical analysis was performed using ggplot2 (version 3.4.3).

2.9. Non-Parametric Comparative Statistical Analysis

Differences in available P concentrations between groups defined by geological age and life zones were assessed using nonparametric statistical tests, given the absence of assumptions of normality and homogeneity of variance. First, the Kruskal–Wallis test was applied to detect overall differences in the median available P content between groups. In the case of significant results (p < 0.05), multiple comparisons were performed using Dunn’s test with Bonferroni adjustment to control type I error, using the dunnTest function from the FSA package (version 0.9.6). These analyses make it possible to specifically identify which pairs of groups presented significant differences. To represent the detected differences, letters of significance were assigned to each level of the study factors, using the multcompLetters function from the multcompView package, based on the adjusted p-values. The visualization of the distribution of available P by group was performed using box plots enriched with scatter of individual points (jitter), using ggplot2.

2.10. Geostatistical Interpolation

Understanding spatial variability through the use of the semivariogram geostatistical model is essential for mapping and delineating the spatial variability of soil fertility and for optimizing fertilization programs [69]. From georeferencing, soil analysis results from the Pichanaqui district in Chanchamayo province, corresponding to bulk density, percentage of sand, silt, and clay, pH, electrical conductivity (EC), organic matter (OM), available P and K, effective and total cation exchange capacity (CEC), exchangeable cation concentration (H+, Al+3, Ca+2, Mg+2, K+, and Na+), and P fertilization and liming requirements, were used for the geostatistical analysis. Interpolations were performed using the Ordinary Kriging (OK) method. The spatial and geostatistical tools of SAGA version 9.4 software, such as variogram (7) evaluation and the implementation of the Ordinary Kriging model (8), were used to ensure accurate and efficient estimation [70]. Consequently, the interpolation maps were exported using QGIS version 3.34 software, in order to analyze and visualize the spatial data [71].
(a)
Semivariogram Equation
γ h = 1 2 N ( h ) l = 1 N ( h ) [ Z ( x i ) Z ( x j ) ] 2
where γ(h) is the semivariance for lag distance h; Z (xi) and Z (xj) are the observed values at locations xi and xj, respectively; and N(h) is the number of data point pairs separated by distance h. This function allows fitting theoretical models (spherical, exponential, Gaussian, etc.) to characterize the spatial continuity of the variable.
(b)
Ordinary Kriging Interpolation
Kriging estimates the value at an unknown location (ẑ(x0)) as a weighted average of known data points:
Z ^ x 0 = l = 1 N ( h ) λ i · Z ( x i )
where ẑ(x0)) is the predicted value at location x0; λ i are the Kriging weights assigned to each known value; and Z ( x i ) is the value of the attribute at known location x i . The weights are derived from the spatial structure defined by the semivariogram and the distances between x 0 and the sampled points.

2.11. Model Assessment

The nugget (C0), the sill (C0 + C), the range (R), and the Sill–Nugget ratio (PSV) (9) are key parameters in the semivariogram analysis, all of which describe the spatial autocorrelation of the data and are obtained from the adjustment of the semivariogram model for geostatistical interpolation [72].
P S V = S i l l N u g g e t S i l l = C C 0 + C
The selection of the semivariogram model is based on criteria such as the root mean square error (RMSE), mean absolute error (MAE), and the coefficient of determination (R2) [73]. Ideally, the chosen model should result in values close to zero for RMSE (10) and MAE (11) and close to one for R2 (12) because this indicates the model’s accuracy and quality, respectively [74]. The Kriging interpolations for each soil property were cross-validated using the leave-one-out method [75].
R M S E = 1 n l = 1 n [ Z 1 ( x i ) Z 2 ( x i ) ] 2
M A E = 1 n l = 1 n Z 1 ( x i ) Z 2 ( x i )
R 2 = 1 l = 1 n [ Z 1 ( x i ) Z 2 ( x i ) ] 2 l = 1 n [ Z 1 ( x i ) Z 1 ] 2
where n represents the number of samples, and Z1(xi) and Z2(xi) show the values observed and predicted at the i site, respectively.

3. Results

3.1. Analysis Interpretation in the Pichanaqui District

The physicochemical analysis of the soils (Table 2) revealed high variability in acidity-related parameters across agricultural areas of the Pichanaqui district. Soil pH ranged from 3.40 to 7.30, with a mean of 4.54 ± 0.90 and a leptokurtic, positively skewed distribution (skewness = 1.08; kurtosis = 0.45), indicating a concentration of values in the acidic range (3.50–5.00). Exchangeable acidity percentage (EAP) averaged 25.75 ± 21.95%, with a high coefficient of variation (CV = 85.37%), highlighting strong heterogeneity in potential acidity. The distribution showed moderate positive skewness (0.40) and platykurtosis (−1.14), with most values falling in the low-to-intermediate range. This distribution pattern supports the need for localized liming interventions, as no sharp clustering justifies large-scale homogeneous treatment.
Regarding active acidity, exchangeable H+ had a low mean value (0.21 ± 0.52 cmol kg−1) but an extremely skewed and peaked distribution (skewness = 21.21; kurtosis = 478.46), suggesting the presence of highly acidic microenvironments, though not widespread. Similarly, exchangeable Al3+—responsible for 71.6% of total soil acidity—showed a mean of 0.53 ± 0.43 cmol kg−1 and high variability (CV = 80.73%), with a positively skewed (1.61) and leptokurtic distribution (kurtosis = 9.47). This indicates that while most samples had low Al3+ concentrations, there were isolated cases exceeding 2.0 cmol kg−1, which could be toxic to crops and thus warrant specific attention.
As for fertility indicators, available phosphorus (P) averaged 4.74 ± 3.80 mg kg−1, classified as low, while effective cation exchange capacity (CEC) also fell into the low category (5.46 ± 4.87 cmol kg−1) according to the Mexican Official Standard. Organic matter (OM) content was moderate (mean = 3.62 ± 1.93%), with values ranging from 0.40 to 11.10%, and moderate variability. The exchangeable base percentage (EBP) ranged from 15.06% to 100%, with a mean of 74.20 ± 22.04%, indicating wide variability in base saturation and degradation due to acidity. Together, these results demonstrate significant geochemical and edaphic heterogeneity, reinforcing the need for site-specific soil management strategies to improve fertility and mitigate acidification.

3.2. Spearman Correlation Analysis of Soil Physical-Chemical Variables and Their Relationship with Acidity and Available Phosphorus

The Spearman correlation analysis (Figure 4) revealed strong associations between soil pH and several base-related variables, including exchangeable base percentage (EBP), basicity, and exchangeable Ca2+ percentage (ECP), all showing positive correlations (R > 0.70). In contrast, pH had strong negative correlations with variables linked to soil acidity, such as exchangeable acidity percentage (EAP), exchangeable Al3+, and total acidity. EAP also showed strong negative correlations with basicity, ECP, effective CEC, and exchangeable Mg2+, indicating that soils with low cation exchange capacity and base saturation tend to accumulate higher potential acidity. These results support management strategies focused on increasing Ca2+ and Mg2+ to reduce acidity stress.
Phosphorus (P-Bray) exhibited weak and inconsistent correlations with both acidity- and fertility-related variables (|R| < 0.70), reflecting its complex behavior in tropical soils. Organic matter (OM) also showed weak correlations but tended to associate positively with acidity variables and negatively with base saturation. Notably, OM showed a moderate positive correlation with sand content, suggesting a potential interaction in regulating soil acidity. Climate variables played a key role: temperature was positively associated with pH, clay content, and bulk density, while precipitation and altitude correlated positively with EAP and OM and negatively with pH and basicity (Figure A1). These patterns highlight the significant influence of climatic and textural factors on soil acidity dynamics and the performance of liming requirement models.

3.3. Principal Component Analysis of Edaphoclimatic Variables of the Coffee Agroecosystem in Pichanaqui

Principal component analysis (PCA) was performed on 17 selected variables. pH, EAP, Al+3, basicity, and P-bray as variables related to soil acidity hazard. The percentage of sand, clay, organic matter (OM), and bulk density (BD) as modulating variables of soil acidity. Likewise, mean temperature (Tme), mean annual precipitation (Pan), and altitude (Alt) were added as environmental factors with some degree of influence on soil acidity. Finally, the phosphate fertilization requirement (DAP) and the MG5A, MPM, MAC, and MACM liming requirement formulas were selected, according to the correlation and collinearity reduction analysis.
Figure 5 shows that the variance explained by the first two components is 61.9%. The biplot graph shows that the variables that contribute most to the variance explained by component I are pH, EAP, Al+3, basicity (Ca+2 + Mg+2 + K+ + Na+), and liming requirement determined by the MAC, MACM, and MPM methods. Likewise, the variables that contribute most to the variance explained by component II are mean temperature (Tme), altitude (Alt), clay percentage, bulk density (BD), mean annual precipitation (Pan), and sand percentage.

3.4. Estimation of Liming Requirements for Coffee Plantation

The statistical analysis of liming requirements using eight different methods across 552 coffee plantation soils in the Pichanaqui district revealed substantial differences in both the frequency and magnitude of dose estimations (Figure A2; Table 3). Methods such as MPM, MX, MAC, and MACM provided liming recommendations for over 75% of samples, while others like NM, MG5A, MC, and MSB generated results for fewer than half. Most methods exhibited non-normal distributions, characterized by positive skewness and leptokurtosis, indicating a general concentration of low-dose recommendations but with sporadic, extreme high-dose outliers. This variability reflects inconsistent spatial expression of soil acidity and highlights the challenge of establishing standardized lime recommendations across diverse microenvironments.
Among all methods, MSB showed the highest skewness (2.2) and one of the highest kurtosis values (4.58), with most values clustered around 0.00 t ha−1 but a maximum dose reaching 7.55 t ha−1. Similarly, MACM and MG5A displayed high dose ranges, though MG5A had a platykurtic distribution (−1.37), suggesting a more even spread of data with fewer extreme values. In contrast, MPM and MX methods showed moderate skewness and meso- to slightly leptokurtic distributions, yielding more stable and centralized dose estimates around 0.79–0.91 t ha−1. These findings underscore the need to select lime recommendation methods not only for accuracy in average dose but also for consistency and reliability. Avoiding extreme over- or underestimation is critical, as excessive liming can impair nutrient availability in acid soils.

3.5. Evaluation of the of Phosphorous Fertilization Requirement in Coffee Crops

Figure A3 presents a violin plot with a box-and-whisker plot overlay, which synthesizes the distribution of the diammonium phosphate requirement (DAP) in 552 coffee soil samples at Pichanaqui. The kernel density estimate (violin) reveals a clear negative asymmetry (skewness = −2.39), with a narrow central peak and heavy tail to the left of the distribution, confirming the observed leptokurtosis (kurtosis = 6.50). The box, whose median stands at 137.21 kg ha−1 with an IQR of 8.28 kg ha−1, demonstrates that a large proportion of soil samples are dispersed in a narrow range between 131.30 (P25) and 139.58 kg ha−1 (P75). However, the points beyond the whiskers indicate extreme outliers, which present edaphological systemic support and are not random results. The mean (133.30 ± 10.64 kg ha−1, CV = 7.98%) is offset from the median (137.21 kg ha−1) due to the lower tail. The Shapiro–Wilk test (W = 0.72, p < 0.001) corroborates the significant deviation from normality in the dataset, justifying the use of robust nonparametric statistical metrics and methods.
The analysis revealed marked spatial variability in available phosphorus across the study area, indicating the presence of both low and high availability zones. This heterogeneity underscores the need to tailor phosphorus fertilization strategies based on local soil conditions rather than applying uniform doses. Such site-specific management can improve nutrient use efficiency and reduce environmental impacts from over-fertilization.
The Kruskal–Wallis test confirmed statistically significant differences in phosphorus fertilization requirements among soils developed on different geological formations in the Pichanaqui district (Figure 6). Post hoc Dunn’s test showed that soils derived from Paleogene formations had significantly lower phosphorus requirements (median: 131.05 kg ha−1) compared to those from Triassic, Jurassic, Devonian, Quaternary, and Cretaceous origins, which had higher medians ranging from 137.5 to 139.2 kg ha−1 (p < 0.05 to p < 0.0001). These findings suggest that younger parent materials may enhance phosphorus cycling and reduce fertilization needs, while older formations are more prone to phosphorus depletion or fixation. This supports the implementation of differential fertilization regimes adapted to the geological background of the soils.
The analysis of phosphorus fertilization requirements across six Holdridge life zones in the Pichanaqui district revealed highly significant global differences (Figure 7). The transitional life zone from tropical dry forest to subtropical humid forest exhibited the lowest phosphorus requirement (median: 117.05 kg ha−1). In contrast, higher requirements were observed in more humid and cooler zones such as tropical low montane rainforest (138.47 kg ha−1), tropical premontane rainforest (137.59 kg ha−1), tropical premontane moist forest (135.30 kg ha−1), and tropical premontane very moist forest (136.00 kg ha−1), with statistical significance ranging from p < 0.05 to p < 0.0001.
These differences suggest that phosphorus availability tends to decrease with elevation and increasing humidity, consistent with Holdridge’s life zone progression toward colder, wetter conditions. In warmer, drier environments, higher mineralization rates enhance phosphorus availability, resulting in lower fertilization needs. This edaphoclimatic interpretation highlights the importance of incorporating both climatic and geological factors into phosphorus management strategies, ensuring that fertilization practices are properly adapted to each life zone’s environmental context.

3.6. Spatial Variation of Soil Acidity and P Deficiency in the District of Pichanaqui

The spatial modeling of 25 soil physicochemical properties using variogram functions revealed that the exponential model was the most frequently fitted (14 variables), followed by spherical, Gaussian, and linear models (Table 4). This indicates that most variables exhibited gradual spatial continuity typical of agricultural soils. The analysis showed a consistent spatial range (31.8 km) across variables due to the homogeneous land use (coffee plantations). Properties such as bulk density, silt percentage, and exchangeable K+ displayed a high degree of spatial dependence (PSV > 0.70), suggesting they are strongly influenced by deterministic soil processes and can be reliably predicted through Kriging. In contrast, variables like available P and exchangeable Mg+2 had low spatial dependence (PSV < 0.40), limiting their spatial predictability and indicating greater microscale heterogeneity.
Cross-validation results supported these findings, with high spatial prediction accuracy (R2 > 0.70) observed for pH, exchangeable K+, Al+3, OM, Ca+2, and bulk density—these also had low RMSE and MAE values, further confirming their predictive strength. Conversely, variables such as available K, available P, and EMP exhibited poor model fit (R2 < 0.40) and low spatial continuity, likely due to local heterogeneity or random variation. The nugget and sill values revealed marked differences in microscale and total variance among properties, with EMP showing high spatial heterogeneity. These results justify the application of geostatistical tools in designing site-specific soil management plans in coffee plantations, prioritizing variables with strong spatial structure and high predictive accuracy. Spatial variability maps (Figure 8) provide visual support for precision agriculture interventions.

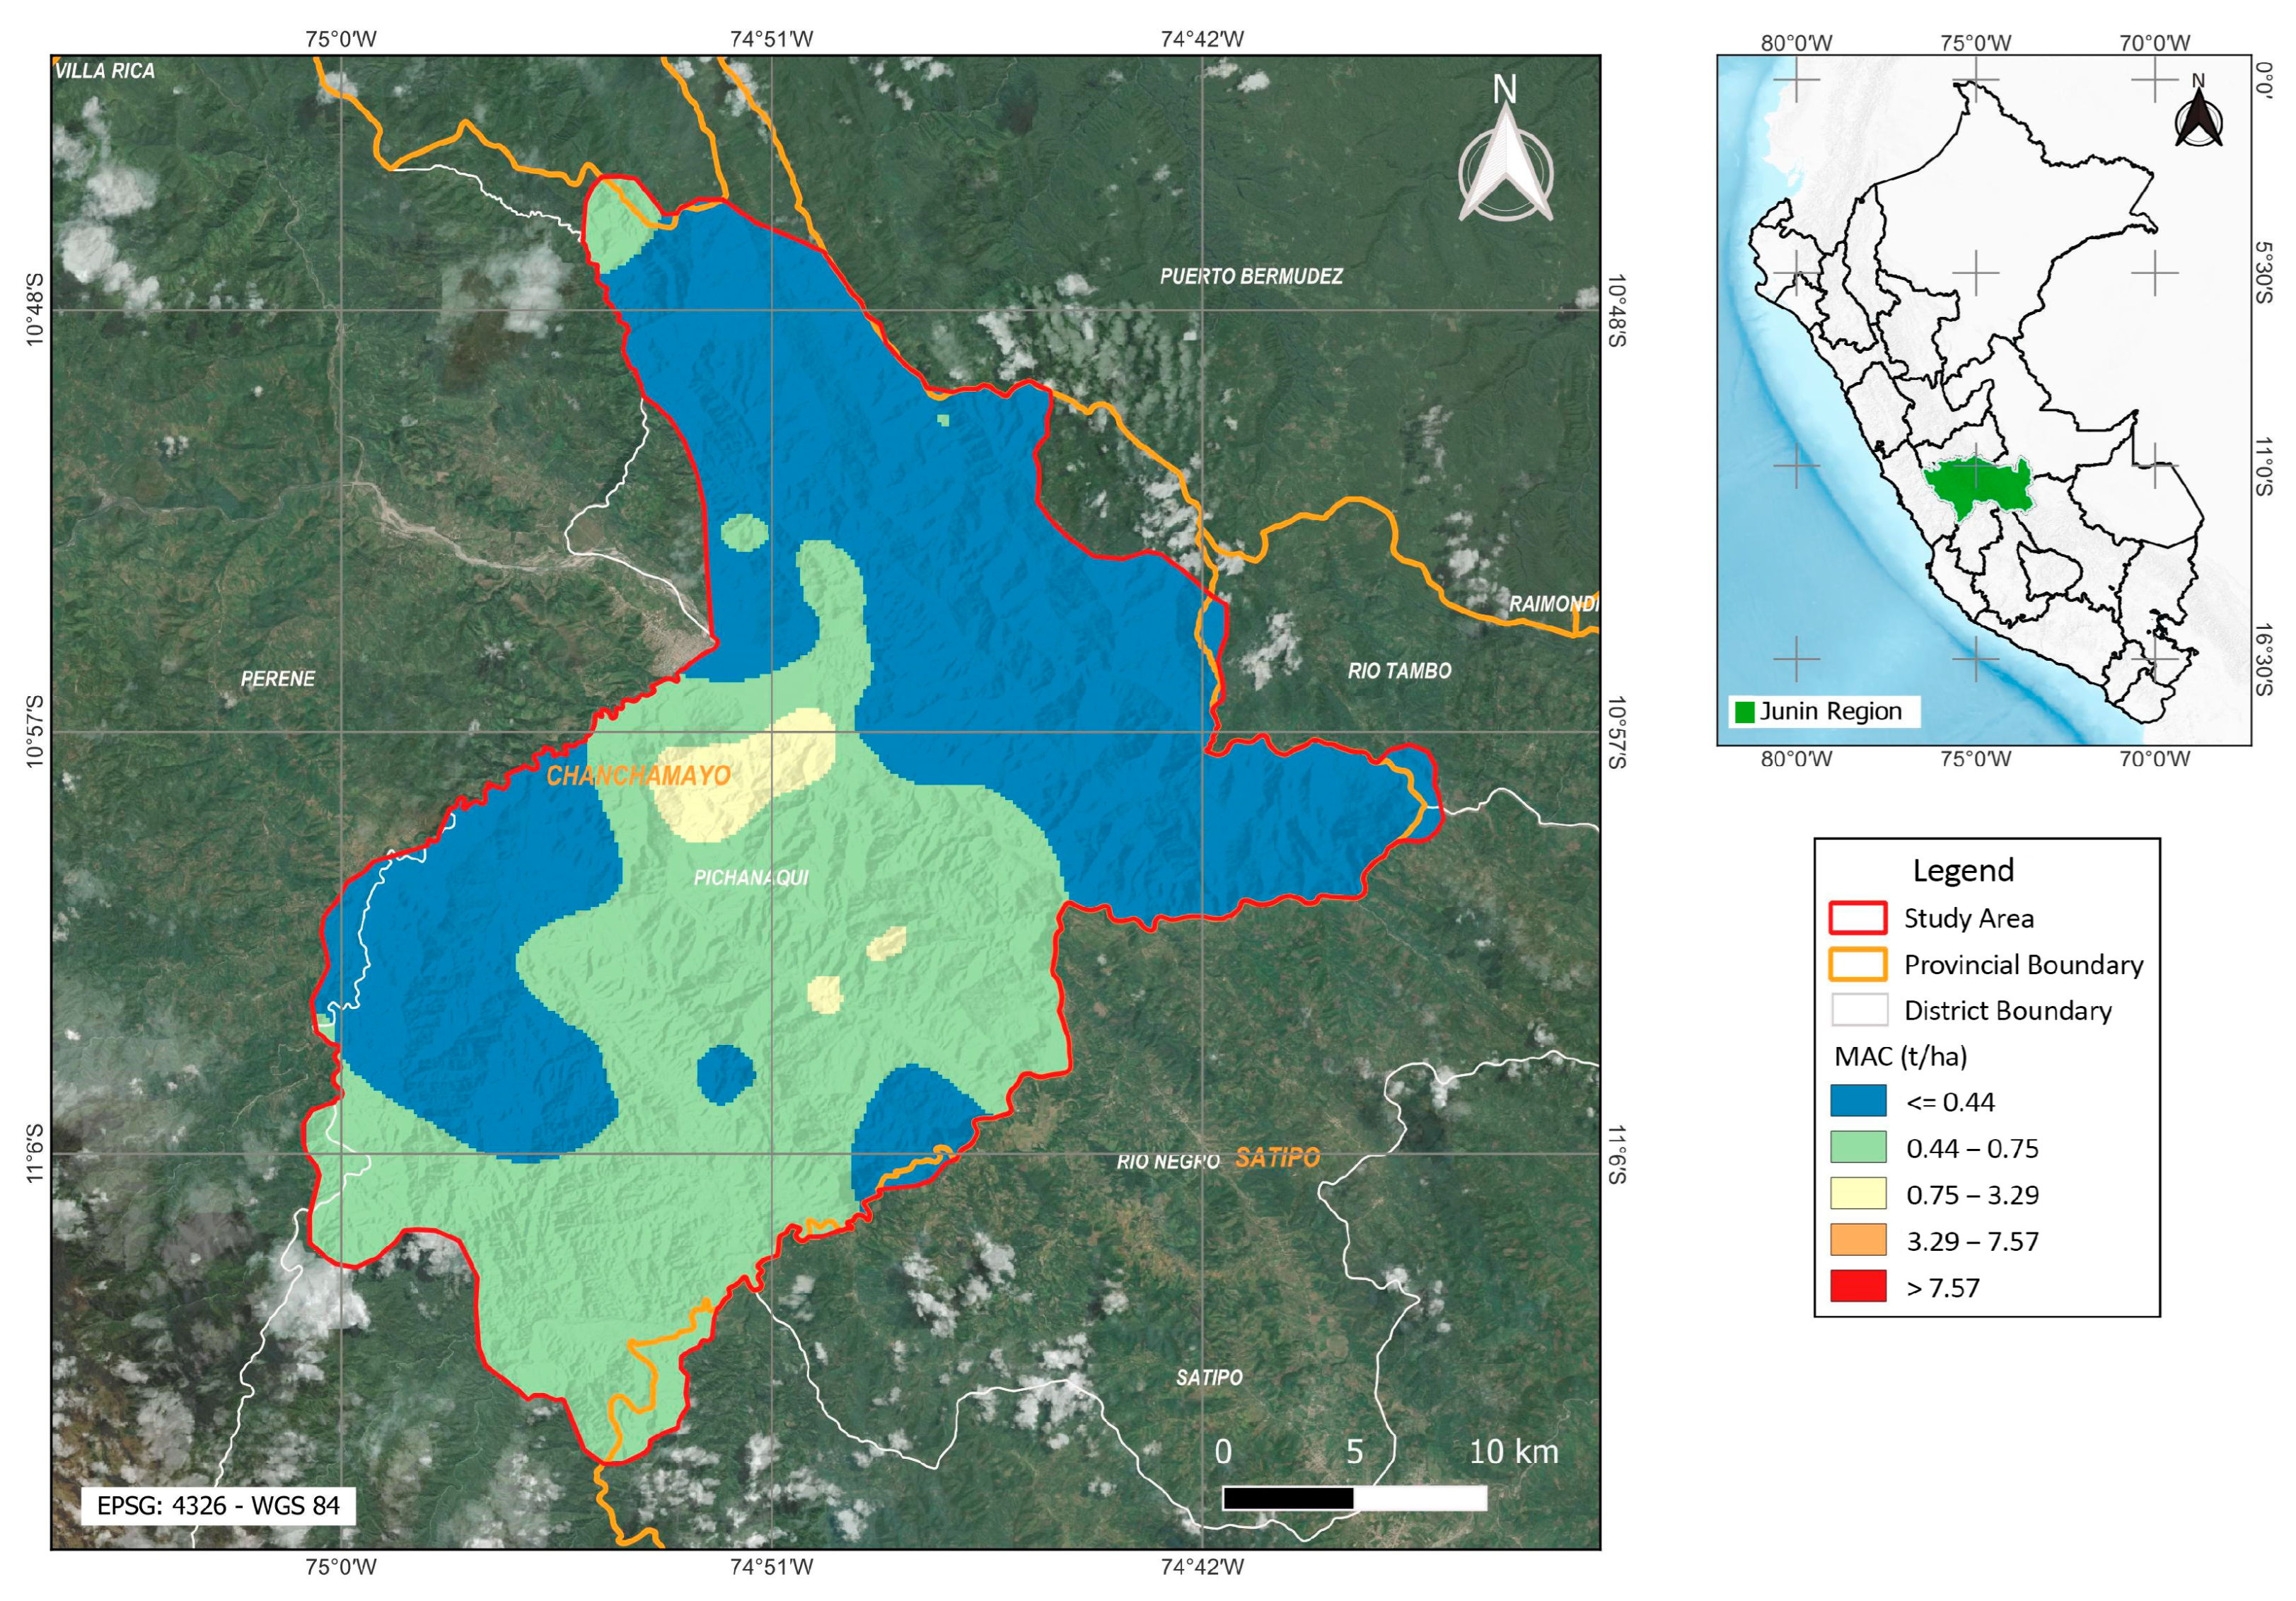
3.7. Spatial Variation of Liming and Phosphorus Fertilization Requirements in the Coffee Crop in Pichanaqui

Spatial variation and lime requirements of the Pichanaqui district are shown by Figure 9 and Figure 10, where MPM and MAC methods have R2 values of 0.79 and 0.59, respectively. These R2 values present a higher adjustment fit among observed and predicted values (Table 5). Likewise, the maps of spatial variation of both methods indicate that the southwestern zone of the district requires the highest doses of liming. In contrast, the phosphorus fertilization requirement (DAP) shows a total absence of spatial structure; however, it presents R2 = 0.74 and reduced errors (RMSE = 0.60 kg ha−1; MAE = 0.37 kg ha−1), indicating a high accuracy of the predicted doses (Figure 11).

4. Discussion

4.1. Critical Acidity Indicators and Their Impact on Coffee Agronomic Management in Pichanaqui Soils

Soil pH in coffee plantations in the Pichanaqui district shows a marked concentration between 3.80 and 5.10 (median = 4.20), with a moderate positive skewness (skewness = 1.08), i.e., a high concentration of soils is very strongly acidic [76]. This acidity level is below the optimal pH range for coffee cultivation (5.0 and 5.5) [10,77]. In acidic soils, Al+3 toxicity is the main stress factor, causing root cell death due to oxidative stress [78]. In Pichanaqui soils, exchangeable Al+3 presents a high spatial variability (CV = 80.73%), with the central 50% between 0.21 and 0.87 cmol kg−1, up to a maximum of 4.23 cmol kg−1. These results exceed the tolerance limit for coffee cultivation (1 cmol kg−1) [68,77,79,80]. Al+3 toxicity impairs normal root growth, nutrient uptake, and the overall development of the plant [81].
However, despite the high variability of pH and exchangeable Al+3, they exhibit a good spatial structure, are moderately defined (PSV = 0.50 and 0.41, respectively), and have high-accuracy spatial prediction (R2 = 0.85 and 0.81; RMSE = 0.10 and 0.01, respectively), which makes them key indicators for the agronomic management of acidity in Pichanaqui coffee plantations.
The exchangeable H+ values show high variability (CV = 248.69%), higher than pH and exchangeable Al+3, indicating different spatial patterns between variables. Likewise, it presents extreme values of skewness (21.21) and leptokurtosis (478.46), with a central 50% concentration between 0.10 and 0.25 cmol kg−1, and the presence of extremes of up to 12 cmol kg−1. These areas with an excess of exchangeable H+ limit nitrogen availability by reducing the nitrification of soils with a pH < 6 and totally inhibiting nitrifying microorganism activity when the pH < 4.5 [34]. Likewise, ammonification is kept active, generating NH4+ ion accumulation, which acidifies the rhizosphere and competes with other ions such as K+ [34]. Furthermore, high H+ concentrations alter ionic transport across the root, causing loss of K, Ca, and organic matter, as well as the subsequent inhibition of K uptake [82]. However, H+ presented a low spatial structure (PSV = 0.33) and a limited fit for its prediction (R2 = 0.50).
The exchangeable acidity percentage (EAP) has a median of 20.98%, an interquartile range between 5.04 and 44.68%, and extreme values up to 84.94%, which justify the targeted intervention of liming requirements. These percentages outnumber the desirable range for most plants (10–25%) [19], generating toxicity [83], reduced nutrient absorption, and decreased root growth [84,85], which directly impact the quantity and size of coffee beans [86].
The high level of soil acidity is due to the fact that 82% of the samples analyzed correspond to the Ferralsols, highly weathered soils with low base content and high concentrations of iron and aluminum oxides that naturally favor acidic conditions [87]. Furthermore, 98% of the agricultural area is located in humid or pluvial life zones, according to Holdridge [88], where high humidity and constant rainfall favor the leaching of exchangeable bases and the leaching of essential nutrients such as Ca+2, Mg+2, and K+ [89,90]. Additionally, most of the territory is located in very humid climates (B(r)A’ and B(r)B’, according to SENAMHI), which increases the solubilization of Al3+, aggravating root toxicity and limiting nutrient uptake [84,91,92].

4.2. Pedogenetic and Edaphoclimatic Factors That Limit P Availability in Coffee Plantations in Pichanaqui

The available P content determined by the Bray method showed a median of 3.70 mg kg−1 (interquartile range: 2.55–6.53 mg kg−1), classified as low according to the Mexican standard (<15 mg kg−1) [47] and below the critical level for coffee (20 and 30 mg kg−1) [93]. This deficiency can cause chlorosis, leaf necrosis, and a reduction in photosynthetic area, affecting cup quality [83]. This low availability is attributed to Ferralsols (82% of the area) and acidic and weathered soils rich in Fe oxides (goethite, lepidocrocite) and Al (gibbsite), where P is immobilized by sorption, precipitation, and complexation processes [55,94].
The main fixation process is the specific adsorption of phosphates on the goethite surfaces and in gibbsite, which, at acidic pH (4.5 and 5.5), are protonated as ≡Fe–OH2+ and ≡Al–OH2+ [95]. Regarding the phosphate anions (H2PO4 and HPO4−2), electrostatic adsorption occurs (outer-sphere complex), which evolves into an inner-sphere complex by a ligand–ligand exchange mechanism [16,89]. In this step, phosphate displaces –OH or H2O groups from the surface of the minerals, forming complexes through covalent stable (Fe–O–P or Al–O–P) [95]. These can be monodentate or bidentate, the latter being very stable and responsible for the strong P fixation in Ferralsols [96].
Sequentially, once the inner-sphere adsorption sites in goethite and gibbsite are saturated and a critical P load is exceeded (3–5 mmol P g−1), secondary precipitation of amorphous aluminum phosphate begins [97]. At an acidic pH (3.0–5.0), the partial dissolution of amorphous hydroxide releases Al+3 which, upon reaction with H2PO4, forms amorphous AlPO4-nH2O particles [98]. These phases, which lack a defined crystalline order, have an extremely low solubility (Ksp ≈ 10−15) and aggregate as nanoparticles that trap phosphorus, making it difficult to extract by the Bray or Olsen methods [97].
In our results, P showed a negative correlation with exchangeable Al+3 (R = −0.32) and a positive correlation with pH (R = 0.29), with high significance (p-value < 0.01). Furthermore, the requirement for phosphorus fertilization was significantly higher (p-adj < 0.001) in soils of older geological age, e.g., of Devonian and Triassic origin, compared to less evolved soils of Paleogene origin. Less weathered soils keep a more efficient recycling of P and a lower fixation, in accordance with the transformation model [99]. Likewise, the oldest geological formations, having suffered prolonged weathering, exhibit mineral depletion, an increase in the oxides of Fe and Al, and, therefore, greater fixation of inorganic P [23].
The available P shows a positive correlation with the sum of exchangeable bases (R = 0.35), Ca+2 (R = 0.31), and Mg+2 (R = 0.35). Likewise, the principal component analysis encloses a strong influence of basicity on the variance explained by component I (42.5%), which the exchangeable acidity percentage (EAP) and Al+3. This trend suggests that increasing the exchangeable base content in acidic soils could favor phosphorus availability by reducing the fixation sites associated with the presence of H+ and Al+3, as reported in different crops and soil types [100,101,102,103].
Additionally, the analysis comparing medians between life zones shows that montane rainforests have a higher requirement than tropical dry forests (p-adj < 0.001). In the drier and warmer life zones, evaporation exceeds precipitation, reducing base leaching [89]. Otherwise, in humid and cold zones, high precipitation intensifies base loss and promotes the formation of hydrated Fe and Al oxides that adsorb inorganic P, reducing the Bray fraction and increasing the required fertilization rates [104]. Furthermore, climate influences the weathering rate and the ionic balance of the soil [105]. Under the warm and humid conditions typical of transitional
In tropical dry forests, organic matter mineralization is fast, releasing orthophosphate ions [99]. In contrast, in montane rainforests, the slow decomposition and the continuous leaching of cations promote soil acidification.

4.3. Spatial Analysis of Liming Requirement in Pichanaqui Coffee Plantations

The liming requirement—the amount of amendment necessary to raise soil pH from naturally acidic levels to those optimal for plant growth—has long been estimated by a spectrum of approaches, from simple empirical base saturation models [59] to more elaborate laboratory buffer and incubation techniques [106]. In the heterogeneous soils of tropical Latin America—including 2:1 clays (montmorillonite, vermiculite, illite), red Ultisols and Oxisols rich in Fe and Al oxides, and volcanic Andisols—no single method universally applies [107]. While buffer methods deliver the most precise estimates, their reagent costs and time demands often relegate practitioners to empirical shortcuts such as the Base Saturation Method (BSM), despite documented mismatches between its predictions and field outcomes [108].
To address these complexities, four principal soil-incubation protocols have been developed [104]. The Shoemaker–McLean–Pratt (SMP) method [109] is particularly well suited to high-organic-matter Alfisols with 2:1 clay mineralogy, whereas the Adams–Evans procedure [110] targets low-CEC, kaolinitic soils. The original Ultisol buffer approach [111], though conceived for moderately to strongly weathered soils, has demonstrated robust performance across diverse edaphoclimatic contexts. Nevertheless, the logistical burden of buffer assays means that empirical algorithms retain their appeal for agronomic management, provided their limitations are acknowledged.
Additionally, we implemented eight empirical lime-requirement algorithms (Table 1), each parameterized directly from soil analyses—including pH, organic matter content, total and effective CEC, aluminum saturation, clay fraction, and base saturation—to compare their predictive outputs. These comprise the Base Saturation Method (BSM), SMP, Adams–Evans, the classic Ultisol buffer method, the acidity potential (MAC) approach, the integrated pH–OM model (MPM), and two hybrid formulas that blend physicochemical parameters. This comprehensive suite allowed us to evaluate how each algorithm responds to the specific soil profiles of Pichanaqui and to benchmark their spatial prediction quality under real-world conditions.
In our Pichanaqui dataset, the BSM exhibited the weakest alignment with key acidity indicators—showing a negative correlation with pH (R = −0.67) and a modest positive relationship with exchangeable Al3+ (R = 0.65)—and produced liming recommendations for fewer than half of the samples, hinting at underestimation in highly acidic, aluminum-rich soils. By contrast, the SMP method’s pronounced positive skewness (2.20) and leptokurtosis (4.58) revealed a tendency toward high-dose outliers and overestimation. These findings underscore the necessity of tailoring lime-requirement models to the specific physicochemical traits of each soil [112].
Recent advances have yielded integrated empirical formulas that combine pH, base saturation, aluminum saturation, clay content, total and effective CEC, and organic-matter content [113]. Notably, the pH–organic-matter model (MPM) delivered high spatial predictive accuracy (R2 = 0.79; RMSE = 0.35), estimating doses in over 80% of sites (median = 0.76 t ha−1; IQR 0.33–1.32 t ha−1), though it may over-predict in soils with <4% OM. In Pichanaqui, where the 75th percentile of OM reaches 4.63% (max 11.10%), MPM-derived doses (1.50–3.01 t ha−1) exhibited excellent fit. Conversely, the potential acidity (MAC) method proved ideal for low-OM (<4%) soils with high acidity potential (>0.71 cmol kg−1), covering more than 75% of samples (median = 0.44 t ha−1; IQR 0.17–0.75 t ha−1) and matching incubation-based estimates [113], while maintaining robust spatial performance (R2 = 0.59; RMSE = 0.34) in Al-rich, low-OM contexts.

4.4. Spatial Analysis of Phosphorus Fertilization Requirements in Pichanaquis’ Coffee Plantations

The extractable phosphorus prediction model (Bray-1) achieved a moderate coefficient of determination (R2 = 0.63) with an RMSE (0.51 mg kg−1) higher than the MAE (0.41 mg kg−1), demonstrating the existence of some atypical predictions with high deviations. Meanwhile, the estimation of phosphorus fertilization requirements showed a more robust fit (R2 = 0.74) and shrank errors (RMSE = 0.60 kg ha−1; MAE = 0.37 kg ha−1), reflecting high accuracy in the predicted doses. The RMSE/MAE ratio > 1 in both cases confirms the presence of specific outliers, although the low relative value of the RMSE for the dose supports its suitability for guiding differentiated fertilization strategies based on geology and climatic zoning. In this regard, the map of spatial variation in P fertilization (Figure 11) identified that a large part of the territory can be represented by the average liming dose, while areas with Paleogene soils (transitional dry forest) require lower doses (6.92–77.55 kg ha−1 DAP).
The variability in P requirements is consistent with previous studies in coffee systems. Ref. [89] mentions that phosphorus fertilization should be adjusted based on soil analysis, shade level, and planting density, suggesting the following values: 10–60 kg ha−1 of P2O5 (22–130 kg ha−1 of DAP). In addition, Ref. [114] recommend a dose of 30 kg ha−1 of P2O5 in soils with levels below 30 mg kg−1 of P Mehlich-1. Likewise, Ref. [115] recommend a dose of 75 kg ha−1 of P2O5 for soils with a pH between 5.5 and 6.5. Our results showed an average of 133.30 ± 10.64 kg ha−1 of DAP (CV = 7.98%) in soils with low Bray P values (P75 = 6.53 mg Kg−1), which supports the need to consider the use of multiple edaphoclimatic and management factors to define optimal doses.
A combination of P fertilization and liming is a very important practice for coffee plants. It has been shown to reduce acidity, increase soil CEC, increase the availability of Ca+2 and Mg+2, and improve the efficiency of P fertilization under various study conditions [32,116,117,118,119]. Likewise, the technique of applying lime in bands, under the canopy, improves coffee yield by more than 40% and increases sensory quality [86,120]. In Ethiopia, this combination increased root biomass by 30% [121]. However, the high spatial variability detected justifies the adoption of precision liming and phosphorus fertilization, adjusted to edaphoclimatic maps generated from dense sampling, similar to the studies carried out by [122].
Finally, it is recommended to integrate co-Kriging to further refine spatial predictions and to develop interactive digital platforms that can scale and validate this framework across diverse coffee-growing regions. This would enable the adaptation of intervention thresholds to local edaphoclimatic conditions. These actions would strengthen the precision of site-specific management and contribute to resilient and sustainable coffee plots.

5. Conclusions

The present investigation successfully employs Ordinary Kriging to model and map, at high resolution (R2 = 0.77–0.85), the spatial heterogeneity of liming and phosphorus requirements for coffee plantations in Pichanaqui District. Characterization maps revealed pronounced acidity (pH 3.8–5.1) and low available phosphorus (2.6–6.5 mg kg−1) micro-zones, which correlate with the observed low yields (0.70 ± 0.16 t ha−1). Comparative evaluation of eight liming algorithms identified the pH–organic matter model (MPM) as the most precise predictor (R2 = 0.79; RMSE = 0.35) in high-organic-matter soils (>4% OM), whereas the acidity potential method (MAC) provided conservative, spatially robust lime doses (0.51–0.88 t ha−1) in low-OM contexts. Phosphorus demand averaged 137 kg ha−1 of diammonium phosphate but decreased to 7–78 kg ha−1 in Paleogene-derived, dry-forest soils, underscoring the importance of edaphoclimatic specificity in fertilizer recommendations.
Multivariate analyses (Spearman’s correlations and principal component analysis of 32 soil and climate variables, plus nonparametric comparisons) pinpointed soil pH, organic matter content, and parent-material attributes as the principal drivers of acidity development and phosphorus deficiency. Site-specific management informed by these findings could reduce lime and fertilizer inputs by up to 30% while enhancing coffee bean yield and quality and—by minimizing nutrient leaching and associated greenhouse gas emissions—promote agronomic efficiency and environmental sustainability.

Author Contributions

Conceptualization, K.Q., A.A. and N.H.; methodology, K.Q., A.A., N.H., L.E.R.-C., E.O. and S.M.; software, K.Q., L.E.R.-C. and S.M.; validation, R.S.A., K.Q., N.H. and E.O.; formal analysis, K.Q., N.H. and S.M.; investigation, R.S.A., K.Q., S.M. and N.H.; data curation, R.S.A., K.Q., E.O., A.A., N.H. and S.M.; writing—original draft preparation, K.Q., N.H., A.A., L.E.R.-C. and E.O.; writing—review and editing, R.S.A., K.Q. and N.H.; visualization, K.Q. and S.M.; supervision, R.S.A. and K.Q. All authors have read and agreed to the published version of the manuscript.

Funding

This research was funded by the Instituto Nacional de Innovación Agraria—INIA, Peru, project CUI 2487112, “Mejoramiento de los servicios de investigación y transferencia tecnológica en el manejo y recuperación de suelos agrícolas degrada-dos y aguas para riego en la pequeña y mediana agricultura en los departamentos de Lima, Áncash, San Martín, Cajamarca, Lambayeque, Junín, Ayacucho, Arequipa, Puno y Ucayali”.

Data Availability Statement

The data presented in this study are available on request from the corresponding author.

Acknowledgments

We express our sincere gratitude to Viky Patty De La Cruz Canales, Elizabeth Guerra Curi and Gloria Diana Rojas Cervantes for their valuable work in the soil analysis of the samples evaluated in this study. We also thank Miguel Alvarez Escalante, for his valuable support in the improvement of the figures.

Conflicts of Interest

The authors declare that they have not known competing financial interests or personal relationships that could have appeared to influence the work reported in this paper.

Appendix A

Figure A1. Spearman correlation analysis of the soil variables with the greatest influence on soil acidity and phosphorus, climatic variables, and liming requirement using eight methods and the phosphate fertilization requirement of 552 soil analysis assays in coffee plantations in the district of Pichanaqui. The degree of correlation was determined by a p-value > 0.01.
Agriculture 15 01632 g0a1
Figure A2. Frequency of estimation of liming doses using eight different methods in 552 coffee plantations in the district of Pichanaqui.
Agriculture 15 01632 g0a2
Figure A3. Box-and-whisker plot with a violin plot overlay of the estimated diammonium phosphate requirement (DAP) in kg ha−1 in 552 coffee plantations in Pichanaqui. The gray violin shows the density of the distribution; the box spans the interquartile range (IQR) of 8.28 kg ha−1, with the median at 137.21 kg ha−1 (dashed line). The whiskers go up to P25 − (1.5 × IQR) and P75 + (1.5 × IQR). Dots outside indicate outliers. Statistics: mean = 133.30 ± 10.64 kg ha−1 (CV = 7.98 %), skewness = −2.39, kurtosis = 6.50, and Shapiro–Wilk test W = 0.72, p < 0.001.
Agriculture 15 01632 g0a3

References

  1. Pancsira, J. International Coffee Trade: A Literature Review. J. Agric. Inform. 2022, 13. [Google Scholar] [CrossRef]
  2. Murthy, P.S.; Madhava Naidu, M. Sustainable Management of Coffee Industry By-Products and Value Addition—A Review. Resour. Conserv. Recycl. 2012, 66, 45–58. [Google Scholar] [CrossRef]
  3. International Coffee Organization. Coffee Development Report 2022-23: Beyond Coffee—Towards a Circular Coffee Economy; International Coffee Organization: London, UK, 2023. [Google Scholar]
  4. National Institute of Statistics and Informatics. Caracteristicas Sociodemograficas Del Productor Agropecuario En El Peru, IV Censo Nacional Agropecuario 2012; INEI: Lima, Peru, 2012; Available online: https://www.inei.gob.pe/media/MenuRecursivo/publicaciones_digitales/Est/Lib1057/libro.pdf (accessed on 10 April 2025).
  5. Integrated Agricultural Statistics System. El Agro En Cifras 2024 [Boletín Estadístico Mensual]; Ministerio de Desarrollo Agrario y Riego, Dirección General de Estadística, Seguimiento y Evaluación de Políticas (DGESEP): Lima, Peru, 2024. [Google Scholar]
  6. Torrez, V.; Benavides-Frias, C.; Jacobi, J.; Speranza, C.I. Ecological Quality as a Coffee Quality Enhancer. A Review. Agron. Sustain. Dev. 2023, 43, 19. [Google Scholar] [CrossRef] [PubMed]
  7. Latin American Model Forest Network Pichanaki. 2015. Available online: https://imfn.net/regional-networks/pichanaki-model-forest/ (accessed on 10 May 2025).
  8. Kochian, L.V. Cellular Mechanisms of Aluminum Toxicity and Resistance in Plants. Annu. Rev. Plant Physiol. Plant Mol. Biol. 1995, 46, 237–260. [Google Scholar] [CrossRef]
  9. FAO Suelos Ácidos|Portal de Suelos de La. Available online: https://www.fao.org/soils-portal/soil-management/manejo-de-suelos-problematicos/suelos-acidos/es/ (accessed on 29 May 2025).
  10. Sadeghian, S. La acidez del suelo, una limitante común para la producción de café. Av. Téc. Cenicafé 2016, 1–12. Available online: https://www.cenicafe.org/es/publications/avt0466.pdf (accessed on 11 June 2025).
  11. Zhang, Y.; Zhou, J.; Ren, H.; Chen, H. Characterization of Forest Soil Acidification in Wenzhou Daluoshan and Zhejiang Wuyanling National Nature Reserve. Sustainability 2024, 16, 7051. [Google Scholar] [CrossRef]
  12. Barceló, J.; Poschenrieder, C. Fast Root Growth Responses, Root Exudates, and Internal Detoxification as Clues to the Mechanisms of Aluminium Toxicity and Resistance: A Review. Environ. Exp. Bot. 2002, 48, 75–92. [Google Scholar] [CrossRef]
  13. Blancaflor, E.B.; Jones, D.L.; Gilroy, S. Alterations in the Cytoskeleton Accompany Aluminum-Induced Growth Inhibition and Morphological Changes in Primary Roots of Maize1. Plant Physiol. 1998, 118, 159–172. [Google Scholar] [CrossRef] [PubMed]
  14. Doncheva, S.; Amenós, M.; Poschenrieder, C.; Barceló, J. Root Cell Patterning: A Primary Target for Aluminium Toxicity in Maize. J. Exp. Bot. 2005, 56, 1213–1220. [Google Scholar] [CrossRef] [PubMed]
  15. Ma, J.F. Syndrome of Aluminum Toxicity and Diversity of Aluminum Resistance in Higher Plants. In International Review of Cytology; Elsevier: Amsterdam, The Netherlands, 2007; Volume 264, pp. 225–252. ISBN 978-0-12-374263-6. [Google Scholar]
  16. Sit, I.; Young, M.A.; Kubicki, J.D.; Grassian, V.H. Distinguishing Different Surface Interactions for Nucleotides Adsorbed onto Hematite and Goethite Particle Surfaces through ATR-FTIR Spectroscopy and DFT Calculations. Phys. Chem. Chem. Phys. 2023, 25, 20557–20566. [Google Scholar] [CrossRef] [PubMed]
  17. Sivaguru, M.; Fujiwara, T.; Šamaj, J.; Baluška, F.; Yang, Z.; Osawa, H.; Maeda, T.; Mori, T.; Volkmann, D.; Matsumoto, H. Aluminum-Induced 1→3-β-d-Glucan Inhibits Cell-to-Cell Trafficking of Molecules through Plasmodesmata. A New Mechanism of Aluminum Toxicity in Plants. Plant Physiol. 2000, 124, 991–1006. [Google Scholar] [CrossRef] [PubMed]
  18. Eticha, D.; Staß, A.; Horst, W.J. Localization of Aluminium in the Maize Root Apex: Can Morin Detect Cell Wall-Bound Aluminium? J. Exp. Bot. 2005, 56, 1351–1357. [Google Scholar] [CrossRef] [PubMed]
  19. López Báez, W.; Castro Mendoza, I.; Salinas Cruz, E.; Reynoso Santos, R.; López Martínez, J. Propiedades de Los Suelos Cafetaleros En La Reserva de La Biósfera El Triunfo, Chiapas, México. Rev. Mex. Cienc. Agríc. 2016, 7, 607–618. [Google Scholar]
  20. Demidchik, V. Reactive Oxygen Species and Oxidative Stress in Plants. In Plant Stress Physiology; Shabala, S., Ed.; CABI: Wallingford, UK, 2012; pp. 24–58. ISBN 978-1-84593-996-0. [Google Scholar]
  21. Kochian, L.V.; Hoekenga, O.A.; Piñeros, M.A. How do crop plants tolerate acid soils? mechanisms of aluminum tolerance and phosphorous efficiency. Annu. Rev. Plant Biol. 2004, 55, 459–493. [Google Scholar] [CrossRef] [PubMed]
  22. Duputel, M.; Devau, N.; Brossard, M.; Jaillard, B.; Jones, D.L.; Hinsinger, P.; Gérard, F. Citrate Adsorption Can Decrease Soluble Phosphate Concentration in Soils: Results of Theoretical Modeling. Appl. Geochem. 2013, 35, 120–131. [Google Scholar] [CrossRef]
  23. Penn, C.; Camberato, J. A Critical Review on Soil Chemical Processes That Control How Soil pH Affects Phosphorus Availability to Plants. Agriculture 2019, 9, 120. [Google Scholar] [CrossRef]
  24. McDowell, R.W.; Sharpley, A.N. Phosphorus Solubility and Release Kinetics as a Function of Soil Test P Concentration. Geoderma 2003, 112, 143–154. [Google Scholar] [CrossRef]
  25. Olibone, D.; Rosolem, C.A. Phosphate Fertilization and Phosphorus Forms in an Oxisol under No-Till. Sci. Agric. 2010, 67, 465–471. [Google Scholar] [CrossRef]
  26. Rheinheimer, D.D.S.; Anghinoni, I. Distribuição Do Fósforo Inorgânico Em Sistemas de Manejo de Solo. Pesqui. Agropecuária Bras. 2001, 36, 151–160. [Google Scholar] [CrossRef]
  27. Kunhikrishnan, A.; Thangarajan, R.; Bolan, N.S.; Xu, Y.; Mandal, S.; Gleeson, D.B.; Seshadri, B.; Zaman, M.; Barton, L.; Tang, C.; et al. Functional Relationships of Soil Acidification, Liming, and Greenhouse Gas Flux. In Advances in Agronomy; Elsevier: Amsterdam, The Netherlands, 2016; Volume 139, pp. 1–71. ISBN 978-0-12-804773-6. [Google Scholar]
  28. Slattery, W.; Coventry, D. Response of Wheat, Triticale, Barley, and Canola to Lime on Four Soil Types in North-Eastern Victoria. Aust. J. Exp. Agric. 1993, 33, 609. [Google Scholar] [CrossRef]
  29. Thomas, G.W.; Hargrove, W.L. The Chemistry of Soil Acidity. In Agronomy Monographs; Adams, F., Ed.; American Society of Agronomy, Crop Science Society of America, Soil Science Society of America: Madison, WI, USA, 1984; pp. 3–56. ISBN 978-0-89118-207-8. [Google Scholar]
  30. Fageria, N.K.; Nascente, A.S. Management of Soil Acidity of South American Soils for Sustainable Crop Production. In Advances in Agronomy; Elsevier: Amsterdam, The Netherlands, 2014; Volume 128, pp. 221–275. ISBN 978-0-12-802139-2. [Google Scholar]
  31. Haynes, R.J.; Ludecke, T.E. Effect of Lime and Phosphorus Applications on Concentrations of Available Nutrients and on P, Al and Mn Uptake by Two Pasture Legumes in an Acid Soil. Plant Soil 1981, 62, 117–128. [Google Scholar] [CrossRef]
  32. Li, Y.; Cui, S.; Chang, S.X.; Zhang, Q. Liming Effects on Soil pH and Crop Yield Depend on Lime Material Type, Application Method and Rate, and Crop Species: A Global Meta-Analysis. J. Soils Sediments 2019, 19, 1393–1406. [Google Scholar] [CrossRef]
  33. Slattery, J.F.; Coventry, D.R.; Slattery, W.J. Rhizobial Ecology as Affected by the Soil Environment. Aust. J. Exp. Agric. 2001, 41, 289. [Google Scholar] [CrossRef]
  34. Wang, Y.; Yao, Z.; Zhan, Y.; Zheng, X.; Zhou, M.; Yan, G.; Wang, L.; Werner, C.; Butterbach-Bahl, K. Potential Benefits of Liming to Acid Soils on Climate Change Mitigation and Food Security. Glob. Chang. Biol. 2021, 27, 2807–2821. [Google Scholar] [CrossRef] [PubMed]
  35. Khaliq, M.A.; Khan Tarin, M.W.; Jingxia, G.; Yanhui, C.; Guo, W. Soil Liming Effects on CH4, N2O Emission and Cd, Pb Accumulation in Upland and Paddy Rice. Environ. Pollut. 2019, 248, 408–420. [Google Scholar] [CrossRef] [PubMed]
  36. Royer-Tardif, S.; Whalen, J.; Rivest, D. Can Alkaline Residuals from the Pulp and Paper Industry Neutralize Acidity in Forest Soils without Increasing Greenhouse Gas Emissions? Sci. Total Environ. 2019, 663, 537–547. [Google Scholar] [CrossRef] [PubMed]
  37. Hénault, C.; Bourennane, H.; Ayzac, A.; Ratié, C.; Saby, N.P.A.; Cohan, J.-P.; Eglin, T.; Gall, C.L. Management of Soil pH Promotes Nitrous Oxide Reduction and Thus Mitigates Soil Emissions of This Greenhouse Gas. Sci. Rep. 2019, 9, 20182. [Google Scholar] [CrossRef] [PubMed]
  38. Fenn, L.B.; Kissel, D.E. Ammonia Volatilization from Surface Applications of Ammonium Compounds on Calcareous Soils: IV. Effect of Calcium Carbonate Content. Soil Sci. Soc. Am. J. 1975, 39, 631–633. [Google Scholar] [CrossRef]
  39. Lalande, R.; Gagnon, B.; Royer, I. Impact of Natural or Industrial Liming Materials on Soil Properties and Microbial Activity. Can. J. Soil Sci. 2009, 89, 209–222. [Google Scholar] [CrossRef]
  40. Barber, S.A. Liming Materials and Practices. In Agronomy Monographs; Adams, F., Ed.; American Society of Agronomy, Crop Science Society of America, Soil Science Society of America: Madison, WI, USA, 2015; pp. 171–209. ISBN 978-0-89118-207-8. [Google Scholar]
  41. Buni, A. Effects of Liming Acidic Soils on Improving Soil Properties and Yield of Haricot Bean. J. Environ. Anal. Toxicol. 2014, 5. [Google Scholar] [CrossRef]
  42. Chen, S.; Lin, B.; Li, Y.; Zhou, S. Spatial and Temporal Changes of Soil Properties and Soil Fertility Evaluation in a Large Grain-Production Area of Subtropical Plain, China. Geoderma 2020, 357, 113937. [Google Scholar] [CrossRef]
  43. Henríquez, C.; Killorn, R.; Bertsch, F.; Sancho, F. La Geostadística En El Estudio de La Variación Espacial de La Fertilidad Del Suelo Mediante El Uso Del Interpolador Kriging. Agron. Costarric. 2005, 29, 73–81. [Google Scholar] [CrossRef]
  44. Hengl, T. A Practical Guide to Geostatistical Mapping; Office for Official Publications of the European Communities: Luxembourg, 2009; ISBN 978-90-90-24981-0. [Google Scholar]
  45. Fick, S.E.; Hijmans, R.J. WorldClim 2: New 1-km Spatial Resolution Climate Surfaces for Global Land Areas. Int. J. Climatol. 2017, 37, 4302–4315. [Google Scholar] [CrossRef]
  46. ISO 11464 Soil Quality—Pretreatment of Samples for Physico-Chemical Analysis. Available online: https://www.iso.org/standard/37718.html (accessed on 2 April 2025).
  47. NOM-021-RECNAT-2000 NOM-021-RECNAT-2000; Specifications of Fertility, Salinity, and Soil Classification. Study, Sampling and Analysis 2002. Natural Resources and Environment Secretary. Mexican Official Standard: Ciudad de Mexico, Mexico, 2000.
  48. United States. Environmental Protection Agency. Office of Solid Waste and Emergency Response. Method 9045D: Soil and Waste pH. In Test Methods for Evaluating Solid Waste, Physical/Chemical Methods; Soil Waste PH; US Environmental Protection Agency, Office of Solid Waste and Emergency Respons: Washington, DC, USA, 2004; pp. 1–5. [Google Scholar]
  49. ISO 11265 Soil Quality—Determination of Specific Electrical Conductivity. Available online: https://www.iso.org/es/contents/data/standard/01/92/19243.html (accessed on 2 April 2025).
  50. ISO 11261 Soil Quality—Determination of Total Nitrogen—Modified Kjeldahl Method. Available online: https://www.iso.org/standard/19239.html (accessed on 2 April 2025).
  51. Bazán Tapia, R. Manual de Procedimientos de los Análisis de Suelos y Agua con Fines de Riego; Instituto Nacional de Innovación Agraria: La Molina District, Peru, 2017. [Google Scholar]
  52. Hengl, T.; Mendes De Jesus, J.; Heuvelink, G.B.M.; Ruiperez Gonzalez, M.; Kilibarda, M.; Blagotić, A.; Shangguan, W.; Wright, M.N.; Geng, X.; Bauer-Marschallinger, B.; et al. SoilGrids250m: Global Gridded Soil Information Based on Machine Learning. PLoS ONE 2017, 12, e0169748. [Google Scholar] [CrossRef] [PubMed]
  53. ISRIC World Soil SoilGrids250m 2.0. Available online: https://soilgrids.org/ (accessed on 28 May 2025).
  54. Aybar-Camacho, C.; Lavado-Casimiro, W.; Sabino, E.; Ramírez, S.; Huerta, J.; Felipe-Obando, O. Atlas de Zonas de Vida Del Perú-: Guía Explicativa; Servicio Nacional de Meteorología e Hidrología del Perú: Lima, Peru, 2017. [Google Scholar]
  55. IUSS Working Group. WRB World Reference Base for Soil Resources 2014, Update 2015: International Soil Classification System for Naming Soils and Creating Legends for Soil Maps, 4th ed.; Roma, Italy, 2014. Available online: https://openknowledge.fao.org/server/api/core/bitstreams/bcdecec7-f45f-4dc5-beb1-97022d29fab4/content (accessed on 19 July 2025).
  56. Yost, R.; Uehara, G.; Wade, M.; Sudjadi, M.; Widjaja-adhi, I.P.G.; Li, Z.-C. Expert Systems in Agriculture: Determining Lime Recommendations for Soils of the Humid Tropics; Hawaii, USA, 1988. Available online: https://www.ctahr.hawaii.edu/oc/freepubs/pdf/RES-089.pdf (accessed on 17 May 2025).
  57. Cate, R.B.; Nelson, L.A. A Rapid Method for Correlation of Soil Test Analyses with Plant Response Data; International Soil Testing series; N.C. State University Agricultural Experiment Station: Raleigh, NC, USA, 1965. [Google Scholar]
  58. Osmond, D.L.; Smyth, T.J.; Yost, R.S.; Hoag, D.L.; Reid, W.S.; Branch, W.; Wang, H. Nutrient Management Support System (NuMaSS), Version 2.2; CRSPs: Delhi, India, 2007. [Google Scholar]
  59. Van Raij, B.; Cantarella, H.; Cangiani, F.A. Recomendações de Adubação e Calagem Para o Estado de São Paulo. Camp. Inst. Agronômico 1997, 2, 285. [Google Scholar]
  60. Alvarez, V.V.H.; Ribeiro, A.C. Recomendações Para o uso de Corretivos e Fertilizantes em Minas Gerais: 5. Aproximação; SBCS: Viçosa, Brazil, 1999. [Google Scholar]
  61. Defelipo, B.; Braga, J.; Spies, C. Comparação Entre Métodos de Determinação Da Necessidade de Calcário de Solos de Minas Gerais. Viçosa 1972, 13, 111–136. [Google Scholar]
  62. Teixeira, W.G.; Reis, J.; Freitas, J.; Alvarez, V. Determinação Da Necessidade de Calagem Para o Cafeeiro Considerando a Acidez Potencial. In Proceedings of the 20th Congreso Latinoamericano 16th Congreso Peruano de la Ciencia del Suelo, Cuzco, Peru, 9–15 November 2014; pp. 9–15. [Google Scholar]
  63. Quispe, K.; Mejía, S.; Carbajal, C.; Alejandro, L.; Verástegui, P.; Solórzano, R. Spatial Variability of Soil Acidity and Lime Requirements for Potato Cultivation in the Huánuco Highlands. Agriculture 2024, 14, 2286. [Google Scholar] [CrossRef]
  64. Khalajabadi, S.S. Manejo integrado de nutrientes para una caficultura sostenible. Suelos Ecuat. 2014, 44, 74–89. [Google Scholar]
  65. McFarland, M.L.; Haby, V.A.; Redmon, L.A.; Bade, D.H. The Texas A&M University System. 2024. Available online: https://forages.tamu.edu/wp-content/uploads/sites/26/legacy-files/PDF/scs2001-05.pdf (accessed on 19 July 2025).
  66. Redmon, L.A.; McFarland, M.L.; Haby, V.A.; Bade, D.H. The Texas A&M University System. 2024. Available online: https://soiltesting.tamu.edu/soiltesting/wp-content/uploads/sites/13/2023/05/SCS-2001-06.pdf (accessed on 19 July 2025).
  67. Malavolta, E. Nutrição Mineral e Adubação Do Cafeeiro; Associacao Brasileira para Pesquisa da Potassa e do Fosfato (Piracicaba) y itora Agronômica Ceres: Sao Paulo, Brazil, 1990; ISBN 85-318-0005-6. [Google Scholar]
  68. Sadeghian, S. Nutrición de Cafetales; Cenicafé: Chinchiná, Colombia, 2013. [Google Scholar]
  69. Tunçay, T. Comparison Quality of Interpolation Methods to Estimate Spatial Distribution of Soil Moisture Content. Commun. Soil Sci. Plant Anal. 2021, 52, 353–374. [Google Scholar] [CrossRef]
  70. Bock, M.; Böhner, J.; Köthe, R.; Conrad, O.; Ringeler, A. Methods for Creating Functional Soil Databases and Applying Digital Soil Mapping with SAGA GIS. RC Sci. Tech. Rep. Off. Off. Publ. Eur. Communities Luxemb. 2007, 1, 31–37. [Google Scholar]
  71. Martínez, C.R. Modelado Geoestadístico de Fertilidad de Un Terreno Agrícola Mediante Mapas de Kriging Que Interpolan Los Datos de Análisis Químico de Suelos. Prod. Agropecu. Desarro. Sosten. 2020, 9, 63–84. [Google Scholar] [CrossRef]
  72. Villatoro, M.; Henríquez, C.; Sancho, F. Comparación de los interpoladores IDW y Kriging en la variación espacial de pH, Ca, CICE y P del suelo. Agron. Costarric. 2008. [Google Scholar] [CrossRef]
  73. Bromberg, F.; Pérez, D.S. Interpolación Espacial Mediante Aprendizaje de Máquinas en Viñedos de la Provincia de Mendoza, Argentina. In Proceedings of the XIII Argentine Symposium on Artificial Intelligence (ASAI 2012), La Plata, Argentina, 27–28 August 2012. [Google Scholar]
  74. Beltrán Rodríguez, A.; Cebrián Guajardo, A.C.; Castillo-Mateo, J. Estadística Espacial para datos punto Referenciados; Universidad de Zaragoza: Zaragoza, Spain, 2023. [Google Scholar]
  75. Fernández Villafañez, S. Métodos de Regresión y Clasificación Basados en Árboles; Universidad de Valladolid: Valladolid, Spain, 2022. [Google Scholar]
  76. Soil Science Division Staff. Soil Survey Manual; Ditzler, C., Scheffe, K., Monger, H.C., Eds.; U.S. Department of Agriculture Handbook 18; Government Printing Office: Washington, DC, USA, 2017. [Google Scholar]
  77. Sadeghian, S.; Díaz Marín, C. Corrección de la acidez del suelo: Alteraciones químicas del suelo. Rev. Cenicafé 2020, 7–20. [Google Scholar] [CrossRef]
  78. Takala, B. Soil Acidity and Its Management Options in Western Ethiopia. J. Environ. Earth Sci. 2019, 9, 2224–3216. [Google Scholar]
  79. Valencia Aristizabal, G.; Carrillo Pachon, I.; Estrada Hoyos, L. Fertilización Cafetal Según Análisis Suelos. In 50 años de Cenicafé 1938 1988: Conferencias Conmemorativas; 1989; pp. 97–103. Available online: https://biblioteca.cenicafe.org/bitstream/10778/713/1/1%2050%20a%C3%B1os%20de%20Cenicaf%C3%A9%201938%201988.pdf (accessed on 19 July 2025).
  80. Sadeghian, S. Fertilidad del suelo y nutrición del café en Colombia: Guía práctica. Bol. Téc. Cenicafé 2008, 32, 1–44. [Google Scholar] [CrossRef]
  81. Cenicafé. Composición elemental de frutos de café y extracción de nutrients. 2006. Available online: https://www.cenicafe.org/es/publications/arc057(04)251-261.pdf (accessed on 2 April 2025).
  82. Foy, C.D. Physiological Effects of Hydrogen, Aluminum, and Manganese Toxicities in Acid Soil. In Agronomy Monographs; Adams, F., Ed.; American Society of Agronomy, Crop Science Society of America, Soil Science Society of America: Madison, WI, USA, 1984; pp. 57–97. ISBN 978-0-89118-207-8. [Google Scholar]
  83. Rosas Arellano, J.; Escamilla Prado, E.; Ruiz Rosado, O. Relación de los nutrimentos del suelo con las características físicas y sensoriales del café orgánico. Terra Latinoam. 2008, 26, 375–384. [Google Scholar]
  84. Bojórquez-Quintal, E.; Escalante-Magaña, C.; Echevarría-Machado, I.; Martínez-Estévez, M. Aluminum, a Friend or Foe of Higher Plants in Acid Soils. Front. Plant Sci. 2017, 8, 1767. [Google Scholar] [CrossRef] [PubMed]
  85. Eekhout, T.; Larsen, P.; De Veylder, L. Modification of DNA Checkpoints to Confer Aluminum Tolerance. Trends Plant Sci. 2017, 22, 102–105. [Google Scholar] [CrossRef] [PubMed]
  86. Wintgens, J.N. Coffee—Growing, Processing, Sustainable Production: A Guidebook for Growers, Processors, Traders and Researchers; John Wiley & Sons: Hoboken, NJ, USA, 2012; ISBN 978-3-527-33253-3. [Google Scholar]
  87. Kollie, W.S.; Byalebeka, J.; Basamba, T.A. Effects of Liming on Acid Ferrasols for Sustainable Crop Production in Uganda—A Review. Int. J. Plant Soil Sci. 2023, 35, 111–124. [Google Scholar] [CrossRef]
  88. Sabino Rojas, E. Servicio Nacional de Meteorología e Hidrología del Perú; SENAMHI: Lima, Peru, 2019. [Google Scholar]
  89. Weil, R.; Brady, N. The Nature and Properties of Soils; Pearson: London, UK, 2017; Volume 1104. [Google Scholar]
  90. Von Uexküll, H.R.; Mutert, E. Global Extent, Development and Economic Impact of Acid Soils. Plant Soil 1995, 171, 1–15. [Google Scholar] [CrossRef]
  91. Auler, A.C.; Caires, E.F.; Pires, L.F.; Galetto, S.L.; Romaniw, J.; Charnobay, A.C. Lime Effects in a No-Tillage System on Inceptisols in Southern Brazil. Geoderma Reg. 2019, 16, e00206. [Google Scholar] [CrossRef]
  92. Aviles, D.; Berglund, K.; Wesström, I.; Joel, A. Effect of Liming Products on Soil Detachment Resistance, Measured with a Cohesive Strength Meter. Acta Agric. Scand. Sect. B Soil Plant Sci. 2020, 70, 48–55. [Google Scholar] [CrossRef]
  93. Huisa Altamirano, D. La Calidad del Suelo en Campos de Agricultura Intensiva de Café (Coffea arabica) VAR. CATIMOR en el Anexo Alto Pitocuna del Distrito de Río Negro. Satipo. 2018; Universidad Continental: Huancayo, Peru, 2020. [Google Scholar]
  94. Liao, W.; Xu, R.; Stone, A.T. Adsorption of Phosphorus Oxyanions at the FeOOH(Goethite)/Water Interface: The Importance of Basicity. Environ. Sci. Technol. 2021, 55, 14389–14396. [Google Scholar] [CrossRef] [PubMed]
  95. Tanada, S.; Kabayama, M.; Kawasaki, N.; Sakiyama, T.; Nakamura, T.; Araki, M.; Tamura, T. Removal of Phosphate by Aluminum Oxide Hydroxide. J. Colloid Interface Sci. 2003, 257, 135–140. [Google Scholar] [CrossRef] [PubMed]
  96. Ganta, P.B.; Morshedizad, M.; Kühn, O.; Leinweber, P.; Ahmed, A.A. The Binding of Phosphorus Species at Goethite: A Joint Experimental and Theoretical Study. Minerals 2021, 11, 323. [Google Scholar] [CrossRef]
  97. Wang, X.; Phillips, B.L.; Boily, J.-F.; Hu, Y.; Hu, Z.; Yang, P.; Feng, X.; Xu, W.; Zhu, M. Phosphate Sorption Speciation and Precipitation Mechanisms on Amorphous Aluminum Hydroxide. Soil Syst. 2019, 3, 20. [Google Scholar] [CrossRef]
  98. Van Emmerik, T.J.; Sandström, D.E.; Antzutkin, O.N.; Angove, M.J.; Johnson, B.B. 31 P Solid-State Nuclear Magnetic Resonance Study of the Sorption of Phosphate onto Gibbsite and Kaolinite. Langmuir 2007, 23, 3205–3213. [Google Scholar] [CrossRef] [PubMed]
  99. Walker, T.W.; Syers, J.K. The Fate of Phosphorus during Pedogenesis. Geoderma 1976, 15, 1–19. [Google Scholar] [CrossRef]
  100. Nishigaki, T.; Tsujimoto, Y.; Rakotoson, T.; Rabenarivo, M.; Andriamananjara, A.; Asai, H.; Andrianary, H.B.; Rakotonindrina, H.; Razafimbelo, T. Soil Phosphorus Retention Can Predict Responses of Phosphorus Uptake and Yield of Rice Plants to P Fertilizer Application in Flooded Weathered Soils in the Central Highlands of Madagascar. Geoderma 2021, 402, 115326. [Google Scholar] [CrossRef]
  101. Fink, J.R.; Inda, A.V.; Bayer, C.; Torrent, J.; Barrón, V. Mineralogy and Phosphorus Adsorption in Soils of South and Central-West Brazil under Conventional and No-Tillage Systems. Acta Sci. Agron. 2014, 36, 379. [Google Scholar] [CrossRef]
  102. Grand, S.; Lavkulich, L.M. Potential Influence of Poorly Crystalline Minerals on Soil Chemistry in P Odzols of Southwestern C Anada. Eur. J. Soil Sci. 2013, 64, 651–660. [Google Scholar] [CrossRef]
  103. Díaz Poveda, V.C.; Sadeghian, S. Phosphorus Fixation and Its Relationship with Soils Chemical Properties of the Coffee Zone of Huila, Colombia. Coffee Sci. 2023, 18, e182122. [Google Scholar] [CrossRef]
  104. Havlin, J.L.; Tisdale, S.L.; Nelson, W.D.; Beaton, J.D. Soil Fertility and Fertilizers: An Introduction to Nutrient Management, 6th ed.; Pearson Education India: Noida, India, 2016; Volume 8, ISBN 978-93-325-7034-4. [Google Scholar]
  105. Jenny, H. Factors of Soil Formation: A System of Quantitative Pedology; Courier Corporation: Chelmsford, MA, USA, 1994; ISBN 978-0-486-68128-3. [Google Scholar]
  106. Van Lierop, W. Soil pH and Lime Requirement Determination. In SSSA Book Series; Westerman, R.L., Ed.; Soil Science Society of America: Madison, WI, USA, 2018; pp. 73–126. ISBN 978-0-89118-862-9. [Google Scholar]
  107. Alvarado, A.; Molina, E.; Cabalceta, G. Acidez y encalado de suelos. In Tecnología de Suelos: Estudio de Casos; Prensas de la Universidad de Zaragoza: Zaragoza, Spain, 2010; pp. 69–99. ISBN 978-84-92774-97-5. [Google Scholar]
  108. Teixeira, W.G.; Víctor Hugo Alvarez, V.; Neves, J.C.L.; Paulucio, R.B. Evaluation of Traditional Methods for Estimating Lime Requirement in Brazilian Soils. Rev. Bras. Ciênc. Solo 2020, 44, e0200078. [Google Scholar] [CrossRef]
  109. Shoemaker, H.E.; McLean, E.O.; Pratt, P.F. Buffer Methods for Determining Lime Requirement of Soils With Appreciable Amounts of Extractable Aluminum. Soil Sci. Soc. Am. J. 1961, 25, 274–277. [Google Scholar] [CrossRef]
  110. Adams, F.; Evans, C.E. A Rapid Method for Measuring Lime Requirement of Red-Yellow Podzolic Soils. Soil Sci. Soc. Am. J. 1962, 26, 355–357. [Google Scholar] [CrossRef]
  111. Mehlich, A. New Buffer pH Method for Rapid Estimation of Exchangeable Acidity and Lime Requirement of Soils. Commun. Soil Sci. Plant Anal. 1976, 7, 637–652. [Google Scholar] [CrossRef]
  112. Nolla, A.; Anghinoni, I. Métodos Utilizados Para a Correção Da Acidez Do Solo No Brasil. Fac. Agron. Universidade Fed. Rio Gd. Sul 2004, 6, 97–111. [Google Scholar]
  113. Teixeira, W.G.; Víctor Hugo Alvarez, V.; Neves, J.C.L. New Methods for Estimating Lime Requirement to Attain Desirable pH Values in Brazilian Soils. Rev. Bras. Ciênc. Solo 2020, 44, e0200008. [Google Scholar] [CrossRef]
  114. Reis, T.H.P.; Guimarães, P.T.G.; Furtini Neto, A.E.; Guerra, A.F.; Curi, N. Soil Phosphorus Dynamics and Availability and Irrigated Coffee Yield. Rev. Bras. Ciênc. Solo 2011, 35, 503–515. [Google Scholar] [CrossRef]
  115. Siman, F.C.; Andrade, F.V.; Stauffer, E.; Mendonça, E.D.S. Reservoirs of P and Fertilizer with Technology on the Path to Sustainability in Coffee Production. Front. Sustain. Food Syst. 2024, 8, 1403744. [Google Scholar] [CrossRef]
  116. Villamagua, M.A.; Castillo, M.G.G.; Sarango, R.d.C.R.; Vásquez, E.; Manosalvas, C.A.V.; Erraez, R.M.M. Efecto del encalado sobre la acidez del suelo, la disponibilidad de nutrientes y el crecimiento del cafeto (Coffea arabica L.) en Pueblo Nuevo, cantón Loja, Ecuador. Bosques Latid. Cero 2021, 11, 166–180. [Google Scholar]
  117. Teshale, E.; Kufa, T.; Regassa, A. Effects of Lime on Phosphorus Availability and Nutrient Uptake of Hybrid Coffee (Coffea arabica L.) Seedlings Under Acidic Nursery Soil. Agric. For. Fish. 2021, 10, 21. [Google Scholar] [CrossRef]
  118. Benevenute, P.A.N.; Pereira, F.A.C.; Barbosa, S.M.; Da Silva, R.F.; Domingues, M.I.S.; Marques Filho, A.C.; De Oliveira, G.C.; Silva, B.M. Deep Soil Tillage in the Coffee Planting Furrow Has Long-Lasting Benefits for Improving Soil Physical Quality and Enhancing Plant Vigor in Dense Soils. Soil Tillage Res. 2025, 248, 106448. [Google Scholar] [CrossRef]
  119. Abruña, F.; Vicente-Chandler, J.; Becerra, L.A.; Bosque Lugo, R. Effects of Liming and Fertilization on Yields and Foliar Composition of High-Yielding Sun-Grown Coffee in Puerto Rico. J. Agric. Univ. P. R. 1965, 49, 413–428. [Google Scholar] [CrossRef]
  120. Parecido, R.J.; Soratto, R.P.; Perdoná, M.J.; Gitari, H.I.; Dognani, V.; Santos, A.R.; Silveira, L. Liming Method and Rate Effects on Soil Acidity and Arabica Coffee Nutrition, Growth, and Yield. J. Soil Sci. Plant Nutr. 2021, 21, 2613–2625. [Google Scholar] [CrossRef]
  121. Teshale, E. Lime and Phosphorus Rates Response on Dry Matter Production and Partitioning of Hybrid of Coffee. Am. J. Heterocycl. Chem. 2021, 7, 1. [Google Scholar] [CrossRef]
  122. Silva, E.R.O.D.; Silva, T.L.D.; Wei, M.C.F.; Souza, R.A.D.; Molin, J.P. Spatial and Temporal Variability Management for All Farmers: A Cell-Size Approach to Enhance Coffee Yields and Optimize Inputs. Plants 2025, 14, 169. [Google Scholar] [CrossRef] [PubMed]
Figure 1. Locations of the monitoring soils in Pichanaqui district, Chanchamayo province, Junin, Peru.
Agriculture 15 01632 g001
Figure 2. Average temperature and average precipitation in study area.
Agriculture 15 01632 g002
Figure 3. (a) Predominant coffee varieties in the district of Pichanaqui. (b) Planting distances in the area under study. (c) Altitude ranges of the coffee plots. (d) Soil taxonomic categories.
Agriculture 15 01632 g003
Figure 4. Spearman correlation analysis of 26 physical-chemical variables from 552 soil samples analyzed in coffee plantations in the district of Pichanaqui; the degree of correlation was determined with p-value > 0.01.
Agriculture 15 01632 g004
Figure 5. Principal component analysis (PCA) of the physicochemical properties of the soil in Ferralsols, Cambisols, and Andosols of Pichanaqui, Junin, Peru. Tme: mean annual temperature; BD: bulk density; OM: organic matter percentage; Pan: mean annual precipitation; Alt: altitude; EAP: exchangeable acidity percentage; MAC: potential acidity method; MACM: modified potential acidity method; MG5A: Minas Gerais 5A method; and MPM: pH and organic matter integration method.
Agriculture 15 01632 g005
Figure 6. Comparison of the diammonium phosphate requirement (DAP) between different geological ages of the parent material of soils cultivated with coffee in the district of Pichanaqui. The results are according to the post hoc Dunn’s test, applied after Kruskal–Wallis, with Bonferroni correction for multiple comparisons. Different letters indicate statistically significant differences between soil types.
Agriculture 15 01632 g006
Figure 7. Comparison of the diammonium phosphate requirement (DAP) between different Holdridge life zones of soils cultivated with coffee in the district of Pichanaqui. These results are according to the post hoc Dunn’s test, applied after a Kruskal–Wallis test with Bonferroni correction for multiple comparisons. Different letters indicate statistically significant differences between soil types.
Agriculture 15 01632 g007
Figure 8. Spatial distribution maps of soil pH, exchangeable Al3+, K+, Ca2+ (cmol·kg−1), bulk density (g·cm−3), and organic matter (%) in coffee plantations of Pichanaqui, Chanchamayo, generated using Ordinary Kriging.
Agriculture 15 01632 g008
Figure 9. Map of spatial variability of soil liming requirement in the Pichanaqui district by the pHOM method (MPM in t ha−1).
Agriculture 15 01632 g009
Figure 10. Soil liming requirement map for the Pichanaqui district by the potential acidity method (MAC in t ha−1).
Agriculture 15 01632 g010
Figure 11. Phosphorus fertilizer requirement map (Kg ha−1) in the Pichanaqui district.
Agriculture 15 01632 g011
Table 1. Liming requirement estimation methods based on different formulas that integrate physicochemical characteristics of the soil related to acidity.
MethodFormulaDetailReference
Combined Method L R = 1.5 × ( E A P P A S )   ×   ( E C E C / 100 ) Estimate just a liming dose if EAP > PAS[56]
Mx+ Method L R = A l + 3 × 1.5 Without restriction[57]
NuMaSS Method L R = F [ ( E A P P A S ) × ( E C E C / 100 ) ] Estimate a liming dose when EAP > PAS; in addition, when ECEC > 4.5, F value is 2.5, otherwise it is 1.3[58]
Method of Bases Saturation L R = ( 60 E B P ) × ( C E C / 100 ) It is applied when EBP < 60%[59]
Method of Minas Gerais 5 A B = ( 0.0302 + 0.06235 × C l a y ) ( 0.000257 × C l a y 2 ) Buffer power is estimated according to clay percentage[60]
L R = B [ 0.25 × E C E C ] It is applied when the EAP is higher than 25% and Ca+2 + Mg+2 is higher than 3.5 cmol Kg
L R = B [ 0.25 × E C E C ] + [ 3.5 ( C a + 2 + M g + 2 ) ] It is applied when the PAS is higher than 25% and Ca+2 + Mg+2 is less than 3.5 cmol Kg−1
pHOM Method L R = 0.16 × ( 6 p H ) × O M It is applied just when the pH is less than 6[61]
Method of potential acidity L R = 0.086 + 0.7557 ( A l + 3 + H + ) Without restriction[62]
Method of potential acidity modified L R = [ ( E A P P A S ) × E C E C × T S W × 2.8 ] / 550 It is applied when EAP is less than 25%[63]
Note: LR: Liming Requirements in t ha−1; EAP: Exchangeable Acidity Percentage; PAS: Permissible Acidity Saturation; ECEC: Effective Cation Exchange Capacity; CEC: Cation Exchange Capacity (at pH = 7); EBP: Exchangeable Bases Percentage; B: Buffer Index; OM: Organic Matter Percentage; and TSW: Topsoil Weight.
Table 2. Descriptive statistics of the physicochemical properties of the soil in the study area.
VariableUnitsMeanSDVarCVSkewnessKurtosisMinMaxP25MedianP75Shapiro
Sand%58.9415.95254.3627.06−0.02−0.698.0091.5047.4858.1570.550.00
Silt%24.6912.09146.0548.950.370.341.5084.2015.7024.6032.600.00
Clay%16.378.2467.8450.311.241.321.8048.5010.6013.8020.800.00
ECdS m−11.022.466.07241.539.2091.110.0129.450.400.630.890.00
pHunit4.540.900.8219.931.080.453.407.303.804.205.100.00
OM%3.621.933.7253.331.040.960.4011.102.203.204.630.00
N%0.180.100.0152.721.040.980.020.560.110.160.230.00
Pavmg kg−14.743.8014.4680.166.2774.710.0757.012.553.706.530.00
Kavmg kg−176.7246.912200.2761.141.624.2018.90373.8042.3063.75104.700.00
Ca+2cmol kg−13.554.2518.06119.872.357.310.0331.970.781.784.960.00
Mg+2cmol kg−11.011.101.20108.572.378.440.028.720.260.641.370.00
K+cmol kg−10.160.120.0177.511.563.950.010.920.070.130.230.00
Na+cmol kg−10.010.020.00343.714.7726.140.000.160.000.000.000.00
Basicitycmol kg−14.725.1226.23108.562.236.750.2536.971.242.666.900.00
EBP%74.2521.99483.3429.61−0.40−1.1415.06100.0055.3379.0394.960.00
Al+3cmol kg−10.530.430.1880.731.619.470.004.230.210.460.870.00
H+cmol kg−10.210.520.27248.6921.21478.460.0012.000.100.180.250.00
Aciditycmol kg−10.740.710.5095.847.99123.050.0012.180.340.711.100.00
EAP%25.7521.99483.3485.370.40−1.140.0084.945.0420.9844.680.00
ECECcmol kg−15.464.8823.8489.492.327.430.8136.972.303.477.380.00
CECcmol kg−116.831.562.429.240.46−0.1713.0022.4015.6816.7017.800.00
CEC-ECECcmol kg−111.385.3828.9147.26−1.955.90−21.5720.399.2412.8714.940.00
ECP%52.4121.54464.0841.10−0.03−1.120.6293.0433.4352.3371.600.00
EMP%17.4910.74115.3361.411.704.931.2183.3310.3115.0022.000.00
EPP%4.234.0116.1094.952.408.280.1728.841.563.095.470.00
ESP%0.120.520.27419.776.1242.310.004.760.000.000.000.00
CMKunit44.2261.693805.60139.513.4616.711.20545.509.5722.0649.120.00
CMunit4.323.8314.6588.633.1914.770.0132.142.143.355.090.00
MKunit10.3615.05226.50145.273.5017.320.22141.502.254.7111.670.00
BDg cm−31.110.060.005.20−0.04−0.490.951.281.071.111.160.00
Table 3. Estimation of liming requirement (t ha−1) using eight different methods on 552 soil samples from coffee plantations in Pichanaqui, Peru.
MethodNameMeanSDVarCVSkewnessKurtosisMinP25MedianP75MaxShapiro
CombinedMC0.180.280.08158.951.561.720.000.000.000.331.40.00
Cate and NelsonMX0.790.600.3675.920.590.070.000.320.691.313.230.00
NuMaSSNM0.290.460.21158.091.531.610.000.000.000.552.340.00
Bases SaturationMSB0.711.381.90194.152.204.580.000.000.000.787.550.00
Minas Gerais 5AMG5A1.041.361.86130.890.66−1.370.000.000.002.584.250.00
Integration of pH and organic materialMPM0.910.760.5783.031.050.740.000.330.761.323.690.00
Potential acidityMAC0.470.400.1478.751.205.540.000.170.440.753.290.00
Modified potential acidityMACM1.060.830.6978.300.863.920.000.411.041.767.160.00
Table 4. The semivariogram models of soil properties in the Pichanaqui district.
Soil PropertyModelNuggetSillRangePSVCross-Validation
C0C0 + Cm(C/C0 + C)1 R22 RMSE3 MAE
Clay (%)Exponential0.130.2831,826.720.540.360.410.33
Silt (%)Exponential0.110.4631,826.720.770.490.500.40
Sand (%)Exponential0.080.1531,826.720.470.350.090.07
pHSpherical0.320.6431,826.720.500.850.100.08
OM (%)Exponential2.324.5631,826.720.490.780.400.32
EC (dS m−1)Exponential0.220.4931,826.720.550.490.150.12
P Bray (mg kg−1)Linear5.846.9431,826.720.160.630.520.41
K (mg kg−1)Gaussian0.730.8131,826.720.100.620.270.22
N (%)Gaussian0.010.0131,826.720.380.780.070.06
H+ (mEq 100 g−1)Spherical0.010.0231,826.720.330.500.210.17
Al+3 (mEq 100 g−1)Spherical0.090.1531,826.720.410.810.010.00
CECe (mEq 100 g−1)Exponential0.410.9431,826.720.560.270.680.54
Ca+2 (mEq 100 g−1)Gaussian0.370.6331,826.720.410.770.230.18
Mg+2 (mEq 100 g−1)Linear0.530.6731,826.720.220.630.270.21
K+ (mEq 100 g−1)Spherical0.000.0131,826.72 0.730.820.030.03
Na+ (mEq 100 g−1)Spherical0.020.0331,826.720.390.540.160.13
BD Exponential0.020.1831,826.720.870.710.040.03
AcidityExponential0.672.1231,826.720.680.350.090.07
BasicityExponential0.130.2231,826.720.410.370.380.31
EAP (%)Exponential0.662.0731,826.720.680.500.980.79
ECP (%)Exponential0.180.2731,826.720.350.260.440.36
EMP (%)Exponential44.7669.2331,826.720.350.621.671.33
EPP (%)Exponential6.749.2131,826.720.270.831.661.33
ESP (%)Exponential0.030.0731,826.720.600.220.230.18
1 coefficient of determination; 2 root mean square error; 3 mean absolute error.
Table 5. Semivariogram models of liming and phosphorus fertilization requirements in coffee plantations in the district of Pichanaqui.
Lime and DAP RequirementModelNuggetSillRangePSVCross-Validation
C0C0 + Cm(C/C0 + C)1 R22 RMSE3 MAE
MC (t ha−1)Exponential0.020.0731,826.720.740.260.250.19
MX (t ha−1)Exponential0.060.1231,826.720.530.350.270.22
NM (t ha−1)Exponential0.090.1631,826.720.450.320.380.30
MSB (t ha−1)Exponential0.220.3131,826.720.270.260.480.38
MG (t ha−1)Exponential0.891.7331,826.720.490.530.930.83
MPM (t ha−1)Exponential0.040.9531,826.720.960.790.350.41
MAC (t ha−1)Gaussian0.050.1731,826.720.730.590.340.30
MACM (t ha−1)Spherical0.201.0831,826.720.810.560.840.60
DAP (Kg ha−1)Spherical0.150.1531,826.720.000.740.370.60
1 coefficient of determination; 2 root mean square error; 3 mean absolute error.
Disclaimer/Publisher’s Note: The statements, opinions and data contained in all publications are solely those of the individual author(s) and contributor(s) and not of MDPI and/or the editor(s). MDPI and/or the editor(s) disclaim responsibility for any injury to people or property resulting from any ideas, methods, instructions or products referred to in the content.

