Article

Improving Dehydration Efficiency and Quality in Highbush Blueberries via Combined Pulsed Microwave Pretreatment and Osmotic Dehydration

by
Shokoofeh Norouzi
1,
Valérie Orsat
1,* and
Marie-Josée Dumont
2
1
Bioresource Engineering Department, McGill University, Macdonald Campus, 21111 Lakeshore Road, Sainte-Anne-De-Bellevue, Montreal, QC H9X 3V9, Canada
2
Chemical Engineering Department, Université Laval, 1065 Avenue de la Médecine, Québec, QC G1V 0A6, Canada
*
Author to whom correspondence should be addressed.
Agriculture 2025, 15(15), 1602; https://doi.org/10.3390/agriculture15151602
Submission received: 22 May 2025 / Revised: 17 July 2025 / Accepted: 20 July 2025 / Published: 25 July 2025

Abstract

The impact of processing time, temperature, and sample on solution ratio parameters, along with pulsing microwave pretreatment, was assessed in the osmotic dehydration of waxy skin highbush blueberries. Fresh blueberries were pre-treated with 20% microwave power for 90 s before being subjected to osmotic dehydration for 8 h in a 60 °Brix sucrose solution, with three different sample to solution ratios (1:4, 1:7, and 1:10). Changes in water loss, solid gain, total anthocyanin content, total phenolic content, and total soluble solid content during osmotic dehydration, as well as color and texture changes, were investigated at four temperature levels (room temperature, 60 °C, 65 °C, and 70 °C). The highest rate of reduction in the total soluble solid content in the osmotic solution was observed during the initial hours (0–4 h) of the process. The most effective combination for reducing the total soluble content of the osmotic agent involved the microwave-pretreatment of the blueberries at 70 °C, using a sample to solution ratio of 1:4, resulting in a decrease of 11.98%, compared to 7.83% for non-pretreated samples. The solid gain was found to be affected by the sample to solution ratio × temperature × pretreatment at a 1% probability level (p ≤ 0.01). The temperature, osmotic solution ratio, and microwave pretreatment interacted together to affect the quality parameters of the osmotically dehydrated blueberries, including total anthocyanin content, total phenolic content, and color. Higher temperatures, along with microwave pretreatment, showed the worst effects on the quality characteristics mentioned. Microwave pretreatment did not change the texture significantly in comparison with non-pretreated blueberry samples. The enhancing effect of microwave pretreatment and higher temperatures on the efficiency of the osmotic dehydration process was obvious. An optimized microwave pretreatment can reduce both the required processing time and temperature for the osmotic dehydration of waxy skinned blueberries, which in turn can lead to the higher quality preservation of processed blueberries and lower energy consumption. This could be especially useful for the large-scale processing of waxy skinned berries.

1. Introduction

Blueberry (Vaccinium corymbosum L.) is a native fruit of North America that thrives in both wild and cultivated forms. In the past two decades, the global demand for blueberries has grown steadily due to their nutritional value and widely recognized health benefits. While North America and Europe have long been major producers, countries like China and India have recently entered the market through partnerships with established growers. Blueberries are now the second most economically significant soft fruit worldwide [1] and are widely promoted as a “superfood” [1,2]. According to the Global Blueberry Industry Status Report 2022 by the International Blueberry Organization (IBO), China leads global blueberry production with 69,036 hectares under cultivation and a total output of over 477,000 metric tons [3]. The latest Report (IBO, 2023) further confirms that China remains the top producer, followed by the United States and Peru [2]. Blueberries are generally classified into two categories: lowbush (wild) and highbush (cultivated) varieties. Highbush blueberries, known for their balanced sweet–tart flavor [4], have seen remarkable growth in both production and global consumption. In the United States, for instance, per capita blueberry consumption has surged by over 300% since 2005, reaching a record high of approximately 0.9 kg per person. Worldwide, blueberry production has more than doubled over the past decade. Within the Vaccinium genus, several species hold commercial importance, but V. corymbosum is the predominant cultivated species. It is typically categorized into northern and southern highbush varieties, which differ in their chilling requirements and adaptability to winter conditions [4].
Some studies have shown that highbush blueberries contain up to 75 bioactive compounds [5]. These include anthocyanidins, ascorbic acid, chlorogenic acid, pyruvic acid, and other phytochemicals known to contribute to human health. They serve as effective protection against chronic illnesses including but not limited to memory loss, cancer, heart diseases, diabetes, vision issues, and the aging process [6,7,8].
However, the deficiency of electrons in anthocyanins renders the isolated compounds very unstable and reactive, making them prone to degradation when exposed to light, heat, and oxygen. This susceptibility limits their suitability for fresh consumption [6,9]. Furthermore, the limited seasonal availability of blueberries restricts their consumption in their natural fresh state. To address this, various processing techniques have been employed to make blueberries available year-round.
Osmotic dehydration (OD) is a non-thermal widely recognized method employed to prolong the shelf life of a variety of fruits and vegetables by partial removal of water from them prior to processes such as drying, canning, and freezing. It is especially beneficial for food materials that are abundant in antioxidants, vitamins, and phenolic acids, as these components are significantly impacted by thermal processing and thus should be limited [10]. This approach can lower the water activity of fruits and vegetables, simultaneously acting to prevent enzymatic browning, mitigate flavor loss caused by heat treatment, minimize alterations in color, and reduce overall energy consumption. Consequently, it enhances the overall quality of the final product [10]. In essence, the food matrix is submerged in a concentrated hypertonic solution, typically a sugar solution for fruits and a salt solution for vegetables (or a mix of the two). As a result of the osmotic pressure variance between the fruit cell wall and the surrounding solution, water is drawn out of the fruits into the sucrose solution, while sugar is transported into the fruits during this process [11]. However, the mass transfer (MT) in the OD process occurs at a slow pace, sometimes taking up to a week to achieve the desired moisture content [9]. Consequently, it becomes essential to optimize key parameters such as temperature, osmotic agent concentration, process duration, and agitation to expedite MT during the procedure.
The waxy skin of blueberries, which acts as a barrier to both heat and MT processes, emphasizes the importance of employing pretreatments [12,13]. These pretreatments are vital for reducing operational costs by diminishing processing time while preserving the natural attributes of the fruit. In recent years, various pretreatment methods, including high hydrostatic pressure [14], pulsed electric fields [9], microwaves [12], ultrasound [15], centrifugal force [16,17], and ohmic heating [18], have been explored to enhance the rate of MT by increasing cell membrane permeability.
Out of the techniques mentioned, MW pretreatment stands out as a promising method in food processing. This is primarily due to its minimal environmental impact, which results from the use of clean energy, low energy consumption, shorter processing times, and space efficiency [19].
Because there is plenty of water in food, MWs can heat it up by interacting with the water molecules inside. This causes the water to evaporate throughout the product. Specifically, the application of MW energy enhances MT by inducing rapid internal heating. As moisture within the product absorbs MW energy and begins to evaporate, vapor pressure builds up inside. This buildup, governed by the resistance of the fruit’s structural matrix to moisture movement, creates a steeper pressure gradient. The combination of elevated internal vapor pressure and external osmotic pressure intensifies the driving force for moisture transport, thereby accelerating the dehydration process [11,12]. However, as dehydration progresses and moisture content decreases, the ability of molecules to interact diminishes, especially when the moisture level drops below 70% [20].
Sharif et al. [12] pretreated wild blueberries using MW for varying durations (30, 45, and 60 s) before subjecting them to OD (three different sugar concentration levels at different temperatures and sample to solution ratio) and investigated the effects of the process on the phenolic, flavonoid, and anthocyanin contents. Their findings indicated that MW pretreated samples exhibited improved water loss (WL) during OD. In another study, Zielinka et al. [21] examined the efficiency of microwave-vacuum pretreatments at power levels of 100, 500, and 800 W, in comparison with freeze drying, microwave-vacuum drying, and osmo-microwave-vacuum drying pretreatments before the OD of cranberry (Vaccinium macrocarpon) samples. These pretreatments were conducted as a part of the drying process for whole cranberries, which encompassed the OD process and microwave-vacuum drying techniques. Furthermore, they investigated how this pretreatment conditions influenced the content of bioactive compounds in the cranberries. They found that regardless of the MW power level used, MT accelerated during the OD of cranberries. The most noteworthy retention of phenolic compounds, along with high antioxidant activity and appealing color, was observed at low MW power (100 W) pretreatments. As a general understanding, MW energy, with frequencies ranging from 300 MHz to 300 GHz, induces rapid volumetric heating through dipolar rotation and ionic conduction in dielectric materials. This mechanism accelerates moisture movement and compound diffusion within plant tissues [13]. Recent studies highlight that high-power pulsed MW generates short, periodic bursts of electromagnetic energy, which increase molecular orientation and promote mutual polarization between molecules through instantaneous and intermittent action. Compared to continuous MW, pulsed MW treatment during OD has been shown to enhance WL while maintaining better control over solid gain (SG) [14]. As demonstrated in previous studies, the interaction between pulsed MW pretreatment and OD leads to a progressive improvement in MT. Pulsed MW exposure initiates rapid internal heating, generating vapor pressure and disrupting cellular structures. This creates a strong internal pressure gradient that primes the fruit tissue for more effective moisture movement. When followed by OD, the external osmotic pressure sustains and completes the water removal process. This synergistic mechanism, internal moisture mobilization by MW and external extraction by OD, could result in more efficient dehydration than either method alone. Additionally, several studies on waxy-skinned fruits, such as cranberries and blueberries, indicate that microwave-vacuum pretreatment triggers structural transformations that extend beyond simple heating effects [15,16]. This “puffing effect,” caused by outward steam pressure, also limits excessive shrinkage seen in conventional drying. Microscopic observations have confirmed that such pretreatments result in greater porosity, internal cell deformation, and a thinner outer barrier, enabling more effective diffusion during OD [15]. Furthermore, cell damage and skin breakage caused by microwave-vacuum exposure can lead to irreversible structural changes, which in turn promote the diffusion of bioactive compounds, particularly polar polyphenols, from the skin to the osmotic solution, enhancing overall MT and compound extraction efficiency [17]. The rapid internal vapor generation during MW exposure creates mechanical stress that can exceed the tensile strength of fruit tissue, particularly when shrinkage is uneven. This leads to surface cracking, which reduces resistance to moisture and solute exchange [16]. These advantages support the rationale behind selecting pulsed MW as a pretreatment step in our study, aiming to improve both dehydration efficiency and quality retention. Although optimal conditions, such as a temperature of 40 °C, an osmotic agent concentration of 40 °Brix, and a duration of approximately 132 min, have been identified for many fruits and vegetables [22], it remains essential to define the ideal processing parameters specifically for blueberries.
Therefore, the present study investigated the effect of pulsed MW pretreatment prior to the OD of highbush blueberries. Experiments were conducted at three temperatures (60, 65, and 70 °C) and various sample-to-solution ratios over an 8 h period to determine optimal processing conditions. In addition, the study aimed to provide a detailed analysis of total soluble solids (TSS) in blueberries before and after OD, as well as in the osmotic solution throughout the dehydration process.

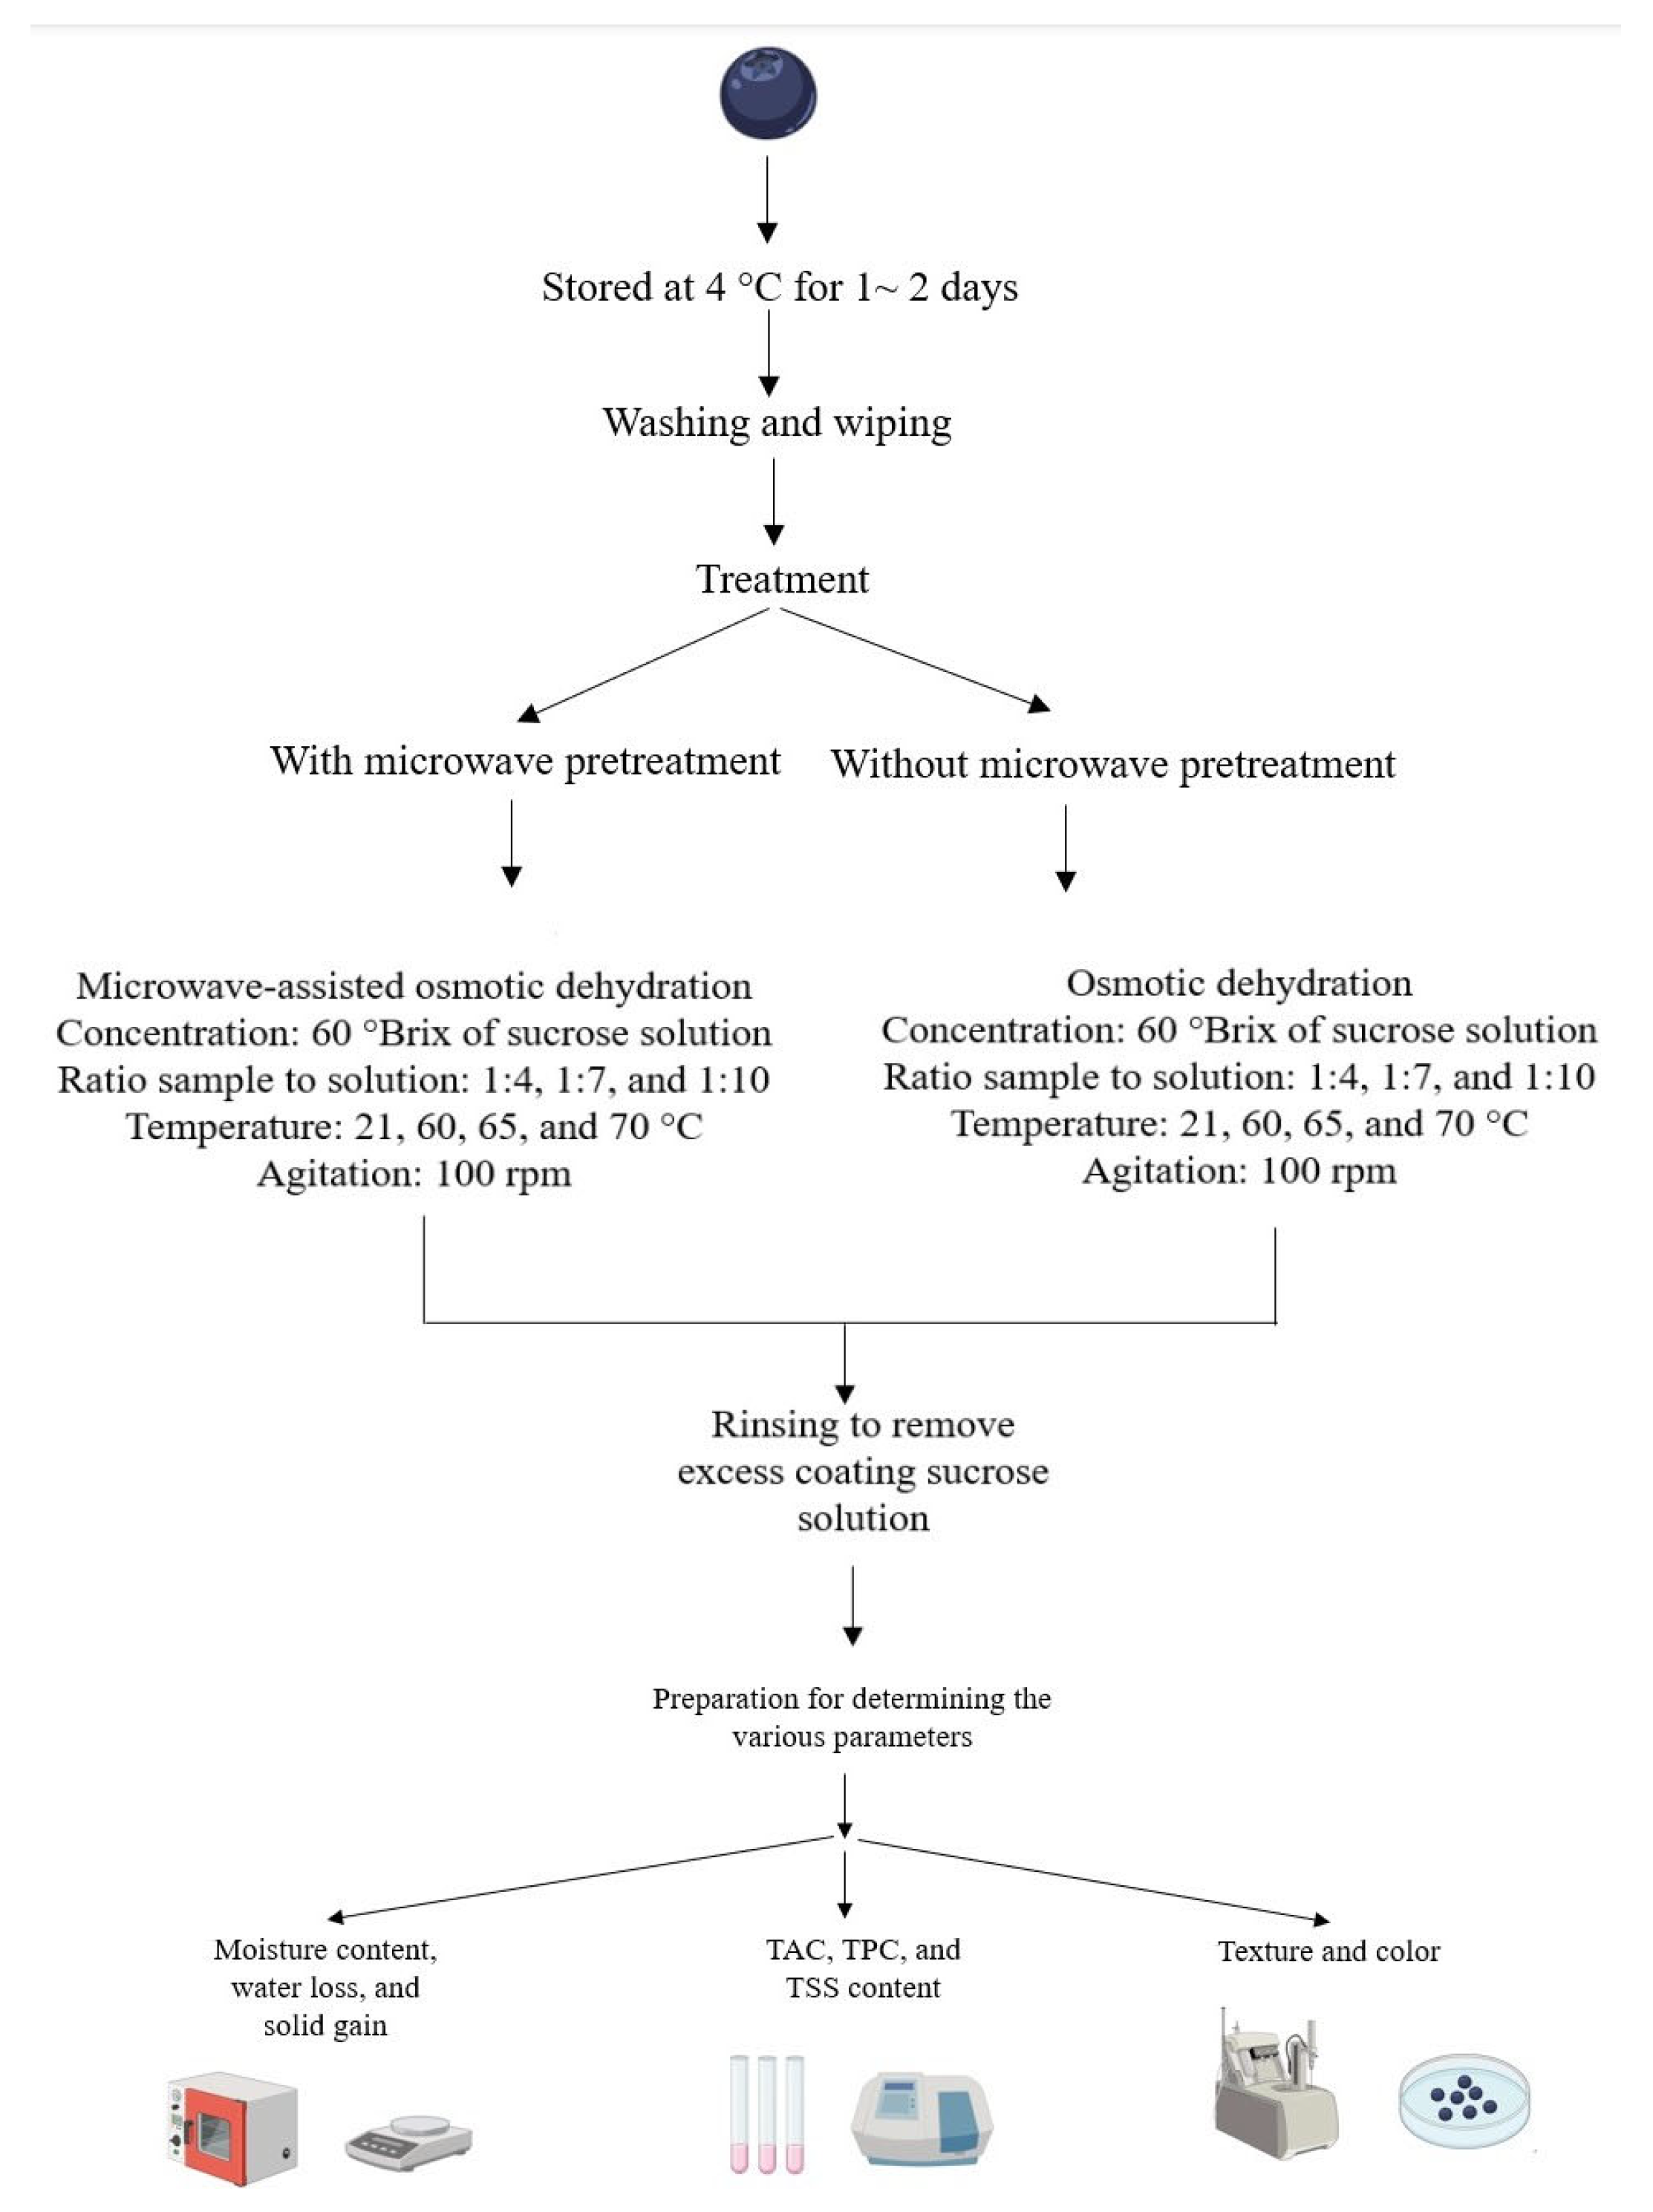
2. Materials and Methods

2.1. Samples

To ensure constant freshness, fresh blueberries (Vaccinium corymbosum) labeled as a product from Chile were supplied from a Canadian grocery store, kept in a refrigerator at 4 °C, and used within 1~2 days. Experiments were conducted between 2023 and 2024. For the experiments, fresh blueberries within a diameter range of approximately 14–16 mm were visually sorted, ensuring they were undamaged and ripe. Before commencing the experiments, fresh blueberries were washed with tap water and subsequently gently dried using a paper towel to eliminate any excess moisture from their surface. The average initial moisture content and the TSS contents of fresh blueberries were measured to be 86.45%, and 13.59 °Brix, respectively. The blueberry samples were taken out of the refrigerator and left to equilibrate at room temperature for 30 min prior to pretreatment and osmotic processing.

2.2. Chemicals

The following chemicals were purchased from Sigma Aldrich (St. Louis, MO, USA): Folin–Ciocalteu reagent, gallic acid, hydrochloric acid, sodium acetate trihydrate (CH3CO2Na∙3H2O), methanol, potassium chloride, and sulfuric acid. Additionally, sodium carbonate and sucrose 99% were obtained from Thermo Fisher Scientific (Waltham, MA, USA).

2.3. Microwave Pretreatment

The selected blueberries (totaling 50 g) were weighed using an electronic balance (Model Practum 2102-1S, Sartorius AG, Göttingen, Germany) and placed in a 500 mL conical flask in preparation for MW pretreatment. The MW treatment was conducted using a household microwave oven (Panasonic NN-SC64MW, 1200 W, 120 V, 60 Hz, Panasonic Corporation, Kadoma, Osaka, Japan; sold via Panasonic Mississauga, ON, Canada). Samples were subjected to pulsed MW exposure for a total of 90 s (three 30 s “on” intervals, alternated with two 30 s “off” periods), at 20% of full power (approximately 240 W, or 14.4 kJ total energy input). These parameters were optimized through preliminary trials to enhance cellular permeability without compromising fruit quality. This approach was selected to balance dehydration efficiency and minimize thermal degradation, as higher MW powers (>30%) have been associated with increased MT but potential deterioration in color and sensory characteristics [18].

2.4. Osmotic Solution Preparation and Dehydration Procedure

Sucrose solution, with a concentration of 60 °Brix, was prepared by dissolving the necessary quantity of sucrose in distilled water. The °Brix value of the hypertonic solution was monitored post-preparation using a handheld digital refractometer (Cole-Parmer, 0–95% Brix, RI range: 1.3330–1.5400, Vernon Hills, IL, USA), ensuring consistent sugar concentration across all experiments. The ratios of sample to solution were selected as 1:4, 1:7, and 1:10 to prevent substantial dilution of the medium due to water removal. This precaution aimed at preventing a localized decrease in the osmotic driving force throughout the process. Dehydration experiments were duplicated, and the results were presented as the means of six duplications.
Following the pretreatment, the prepared osmotic agent was promptly put into the conical flasks. Subsequently, the flasks containing blueberries and sucrose solution were placed in a water bath shaker (New Brunswick Scientific Reciprocal Water Bath Model R76, Edison, NJ, USA), where continuous agitation at a moderate speed (100 rpm) was maintained. This approach aimed at preventing the formation of a dilute solution film around the blueberry samples throughout the treatment. The conical flasks were wrapped with parafilm during the OD process to prevent evaporation. All the experiments in the water bath shaker were conducted under constant conditions at four different temperature levels (room temperature/~21.1 ± 0.2 °C, 60 °C, 65 °C, and 70 °C) for 8 h. During the whole process, the solution concentration was monitored hourly with the hand-held refractometer to acquire comprehensive insights into the behavior of both the samples and the solution. Furthermore, to compare the impact of various temperatures across all desired sample to solution ratios, experiments were carried out at room temperature as a control. Upon the designated dehydration period, the treated blueberries were separated from the osmotic solution by a sieve. They were then delicately rinsed with distilled water to eliminate surplus coating solution, blotted with a paper towel, and allowed to surface moisture dry at ambient temperature for 15 min before MT determination. The dehydrated blueberries were analyzed in terms of moisture content, WL, SG, TSS content, color, texture, total anthocyanin content (TAC), and total phenolic content (TPC). The complete procedure of the experimental design flowchart is illustrated in Figure 1.

2.5. Calculation of Process Efficiency Parameters

Moisture content (MC: wet basis), solid gain (SG: g total solids/g initial dry matter), and water loss (WL, g water/g initial dry matter) were assessed gravimetrically using the oven drying method. Fresh and treated blueberry samples were weighed and then dried in a Fisher Scientific Gravity Oven (Model 51030520, Thermo Electron LED GmbH, 63505 Langenselbold, Germany) at 105 °C for 24 h, following standard protocols [23]. The MC was calculated as the percentage of water lost during drying relative to the initial fresh weight of the sample. The calculations used equations provided below [23]:
M C = M 0 m 0 M 0
W L = M 0 m 0 ( M m ) m 0
S G = m m 0 m 0
where M 0 represents the initial weight of blueberries prior to undergoing osmotic treatment, M is the weight of samples after OD, m is the dry weight of samples after OD, and m 0 is the initial dry weight of samples.
All measurements were conducted for all samples subjected to osmotic treatment, including both those with and without pretreatment.

2.6. Physical and Chemical Quality Properties

2.6.1. Color Analysis

The surface color of osmotically dehydrated samples with or without pretreatment was measured using a chromameter (model CR-300, Minolta, Osaka, Japan). Each reading provided a value for the coordinates, L* (lightness or whiteness), a* (greenness/redness), and b* (blueness/yellowness) on the CIE L*a*b* scale. The average color parameters of the untreated fresh samples were L*: 31.517, a*: –4.052, and b*: 2.2059. As previously mentioned (Section 2.1), fresh highbush blueberries were purchased prior to each experimental trial and used within 1–2 days to ensure consistent freshness and quality. The total color changes (ΔE) were expressed according to Equation (4) [24]:
Δ E = ( ( L L 0 ) 2 + ( a a 0 ) 2 + ( b b 0 ) 2 ) 1 2
where ΔE is the total color change, and L , a , and b are the color attributes of the samples after the microwave-osmotic dehydration (MWOD) process. The subscript “0” indicates the color readings from fresh blueberries. Fresh blueberries were used as the reference and a larger ΔE explains greater color change from the reference material. All measurements were conducted with eighteen replicates. The color parameter values, both before and after the MWOD process, were subjected to comparison using a paired Student’s t-test based on the following equation [25]:
t = d ¯ M d ¯ s d ¯
where d ¯ represents the average of the differences between the two observations of all pairs, M d ¯ is the mean difference in population, and s d ¯ stands for the standard error of the mean difference. An analysis of variance (ANOVA) was conducted to compare fresh and treated samples in terms of ΔE which serves as an indicator of color change.

2.6.2. Texture Analysis

Texture is an additional parameter that directly impacts consumers’ preferences while purchasing a food product. Texture, which is connected to the rheological and structural properties of food, can be assessed using various mechanical measures like firmness, adhesiveness, cohesiveness, gumminess, and viscosity [21]. The firmness of both fresh and treated samples was assessed by determining the maximum force using a texture analyzer (EZ Test, Shimadzu, Kyoto, Japan; equipped with US-made SM-100N-168 transducer). The samples were allowed to reach equilibrium at room temperature to reduce the impact of temperature on the textural outcomes. The measurements were conducted at a consistent distance and speed of 10 mm and 10 mm/min, employing a cylindrical flat-head probe with a diameter of 50 mm.

2.6.3. Blueberry Extraction

A spectrophotometric approach was used to quantify the TAC and the TPC based on the method described by [26] with slight modifications. For TAC and TPC analyses, blueberry extractions were performed through grinding both fresh and treated blueberry samples using a mortar and pestle. For extraction purposes, 1 g of samples was combined with 10 mL of a concentrated methanol/water/HCl mixture (90:10:1 v/v) within a 50 mL test tube, a commonly accepted acidified methanol system known to preserve pigment stability during extraction [26]. The mixture was then homogenized in a shaker water bath at a temperature of 20 °C for a duration of 2 h. The resulting supernatant was filtered into new 15 mL test tubes. The solid residue remaining in the 50 mL test tube was subjected to a second round of homogenization using a mixture of concentrated H2SO4 and methanol (1:10, v/v), carried out in a shaker water bath at 50 °C for 20 h, in order to recover phenolic compounds potentially bound within the cellular matrix [27]. Afterward, the sample was centrifuged at 5500× g for 10 min at a temperature of 4 °C. The separated supernatant was then collected and utilized for further analysis.

2.6.4. Total Anthocyanin Content (TAC)

The total anthocyanin content (TAC) was assessed through a pH differential method. To prepare the pH 1.0 buffer reagent, 1.86 g of KCl was weighed and placed in a beaker. Distilled water was then added until reaching a volume of 980 mL. The pH of the solution was carefully adjusted to 1.0 ± 0.05 by using HCl. This buffer solution was transferred into a 1 L volumetric flask and subsequently diluted to its final volume with distilled water.
For the pH 4.5 buffer reagent, 54.4 g of CH3CO2Na∙3H2O was weighed out and placed into a beaker. Distilled water was added up to 960 mL, and the pH was precisely adjusted to 4.5 ± 0.05 using HCl. This adjusted buffer solution was then transferred into a 1 L volumetric flask and diluted further to reach the desired volume.
For each extracted sample, two separate portions were prepared. One portion consisted of 1.0 mL of the sample combined with 4 mL of pH 1.0 buffer solution, while the other contained 1.0 mL of the sample mixed with 4 mL of pH 4.5 buffer solution [9,26]. After gently mixing these mixtures, their absorbance was measured at wavelengths of 700 nm and 520 nm using a UV–Vis spectrophotometer (UV-1600PC, Mapada, Shanghai, China) against a blank reference. Each test was performed in triplicate to ensure accuracy and consistency. The subsequent calculations were carried out employing the following equation:
Total   Anthocyanin   Content   ( cyanidin - 3 - glucoside ,   mg / L )   =   A × M W × D F × 10 3 ε × 1
where A = ( A 520 nm A 700 nm ) pH 1.0 ( A 520 nm A 700 nm ) pH 4.5, MW (molecular weight) = 449.2 g/mol for cyanidin-3-glucoside, DF = dilution factor, 1 = path length in cm, ε = molar extinction coefficient (26,900) in L m o l 1 c m 1 for cyanidin-3-glucoside, and 103 = factor for conversion g to mg. The results were expressed as mg cyanidin-3-glucoside equivalent per 100 g fresh sample.

2.6.5. Total Phenolic Content (TPC)

The total phenolic content (TPC) present in blueberry was determined using the Folin–Ciocalteu method [28]. To initiate the analysis, a mixture comprising 200 μL of the filtered extract, 1800 μL of deionized water, 250 μL of Folin–Ciocalteu reagent, and 500 μL of a 7.5% sodium carbonate solution was prepared. Following a 30-min incubation in darkness at room temperature, the absorbance was measured using spectrophotometry at 765 nm with a calibration curve with gallic acid as the standard. The results were expressed as µg of gallic acid equivalents (GAE) per g (GAE/g d.b).

2.7. Statistical Analysis

All experimental data were obtained from at least triplicate samples. The significance between treatments was evaluated using analysis of variance (ANOVA). Duncan’s multiple range test, at 5% (α = 0.05), was used to estimate the significant differences between means. Analysis of variance (ANOVA) and means comparison analysis was carried out using SAS® (SAS Institute Inc., Cary, NC, USA). All graphs were generated using R software (version 4.2.1), and Origin software 2021b (OriginLab Corporation, Northampton, MA, USA).

3. Results and Discussions

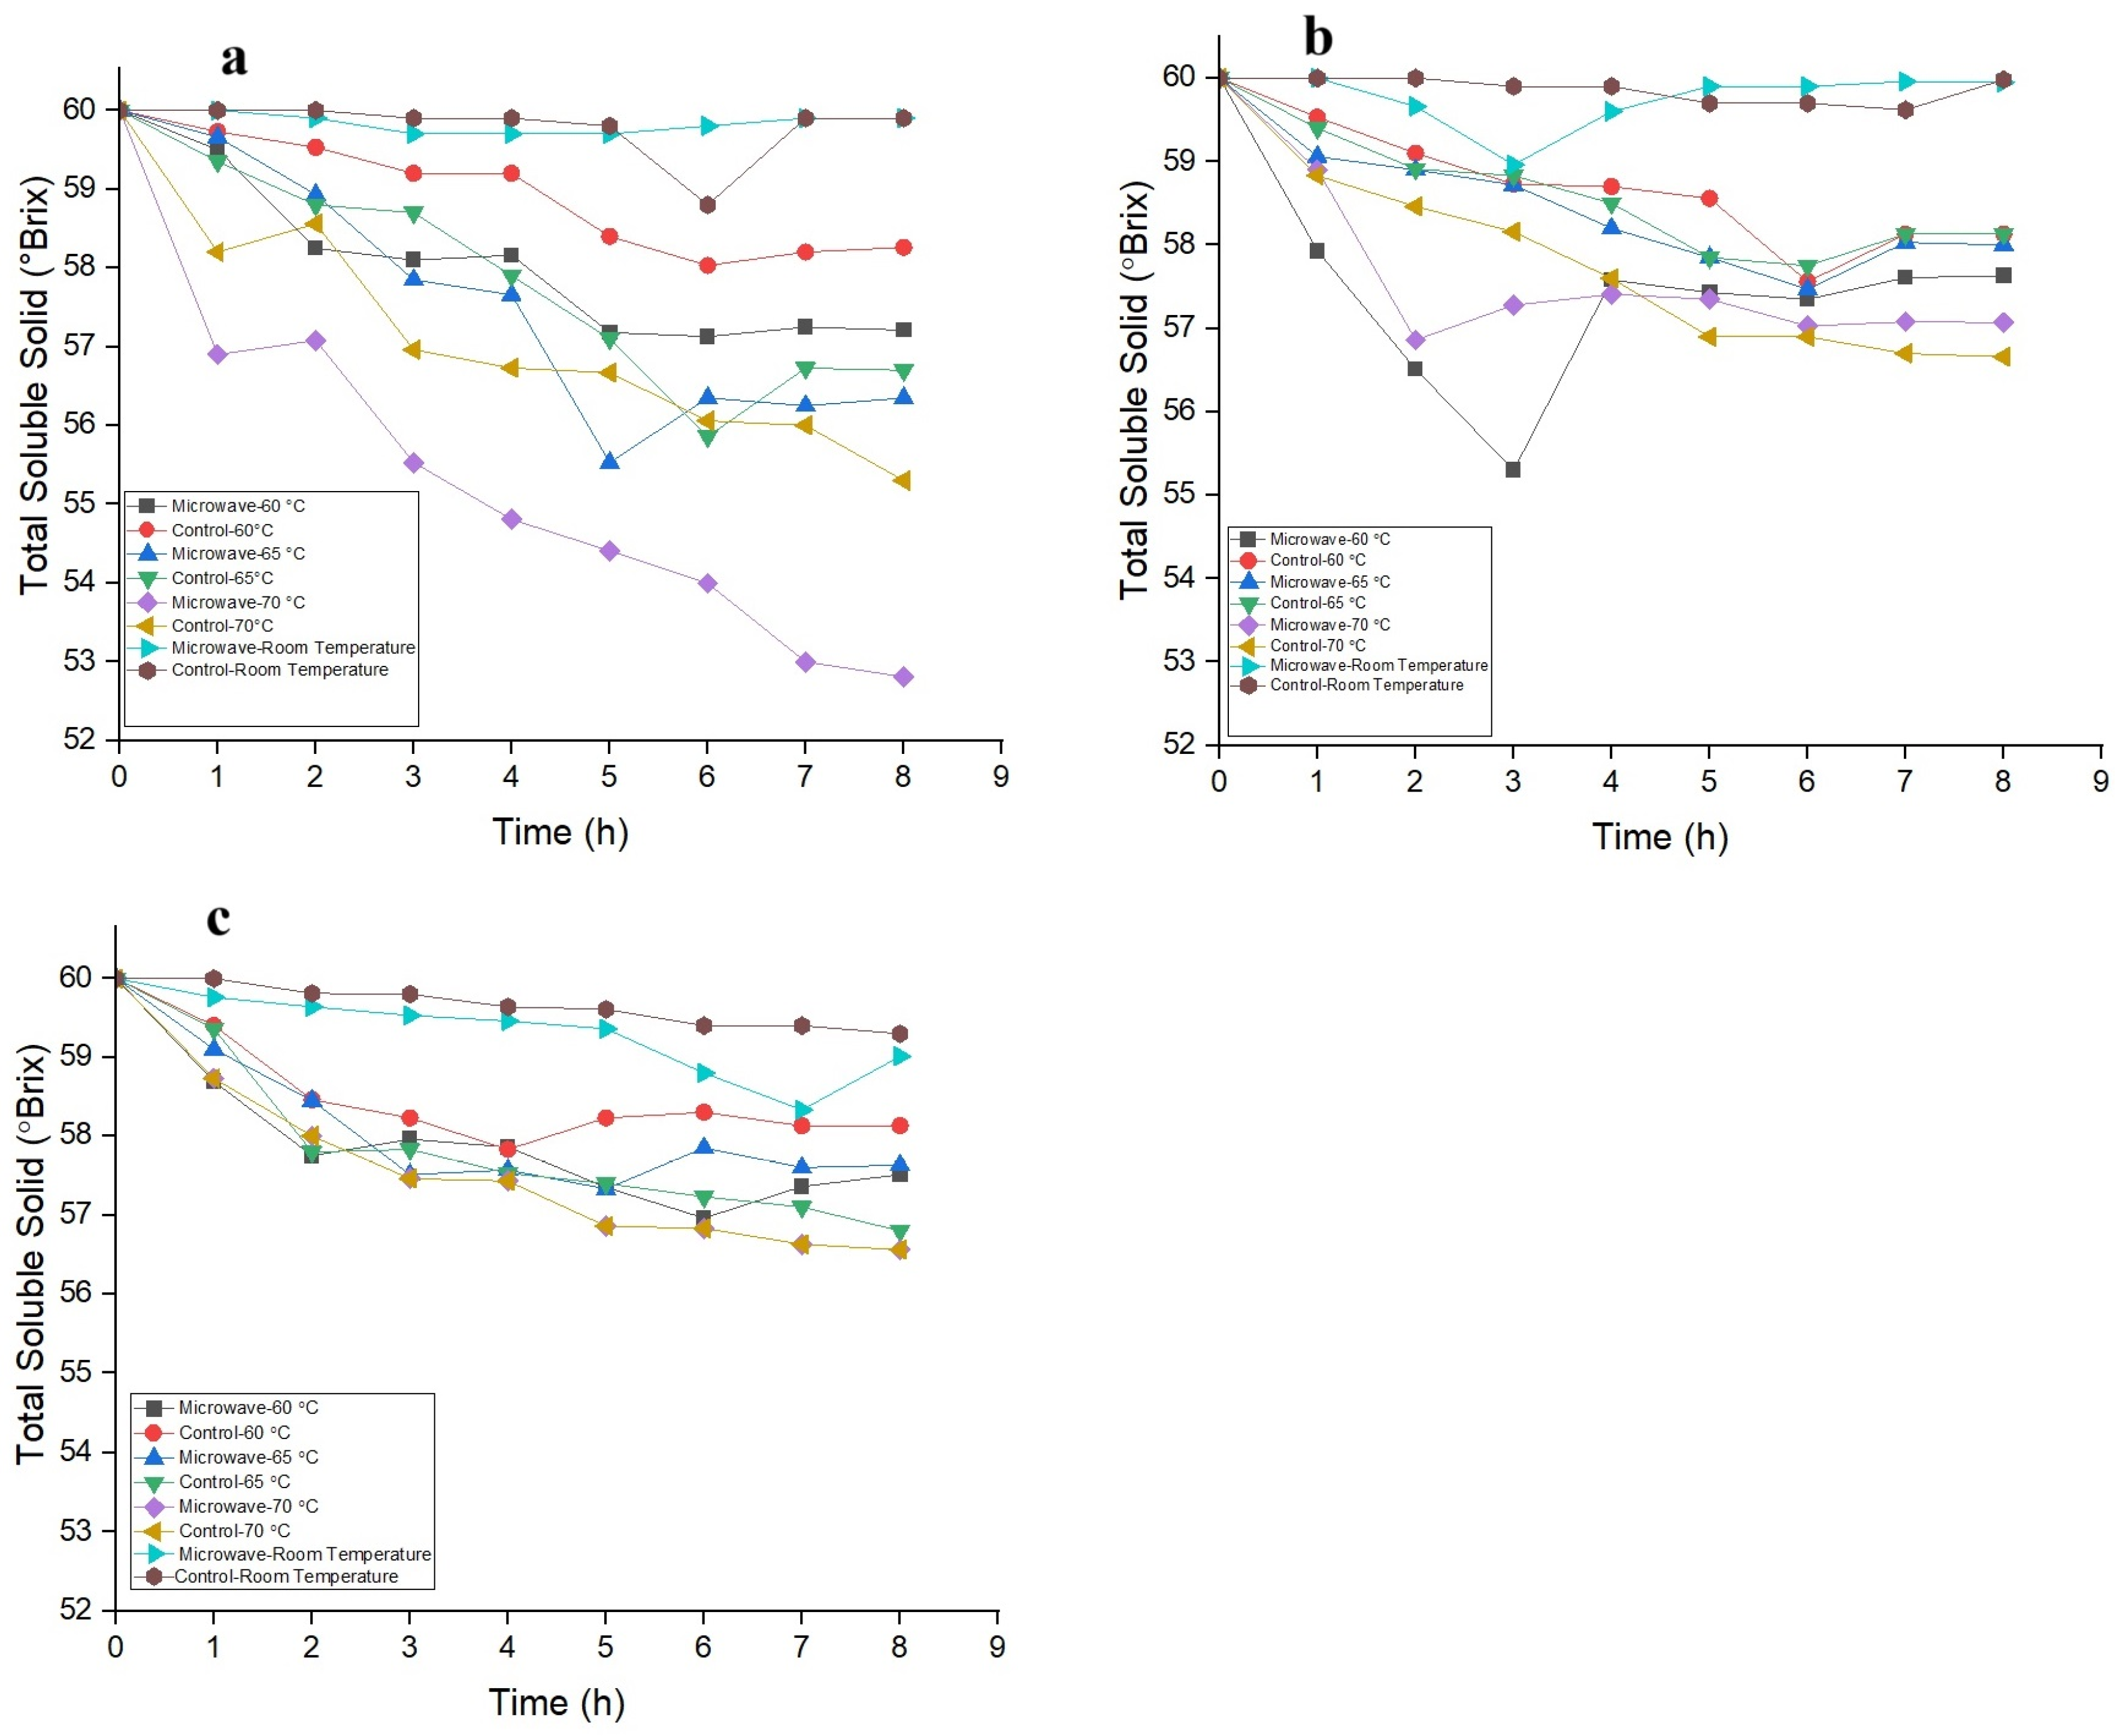
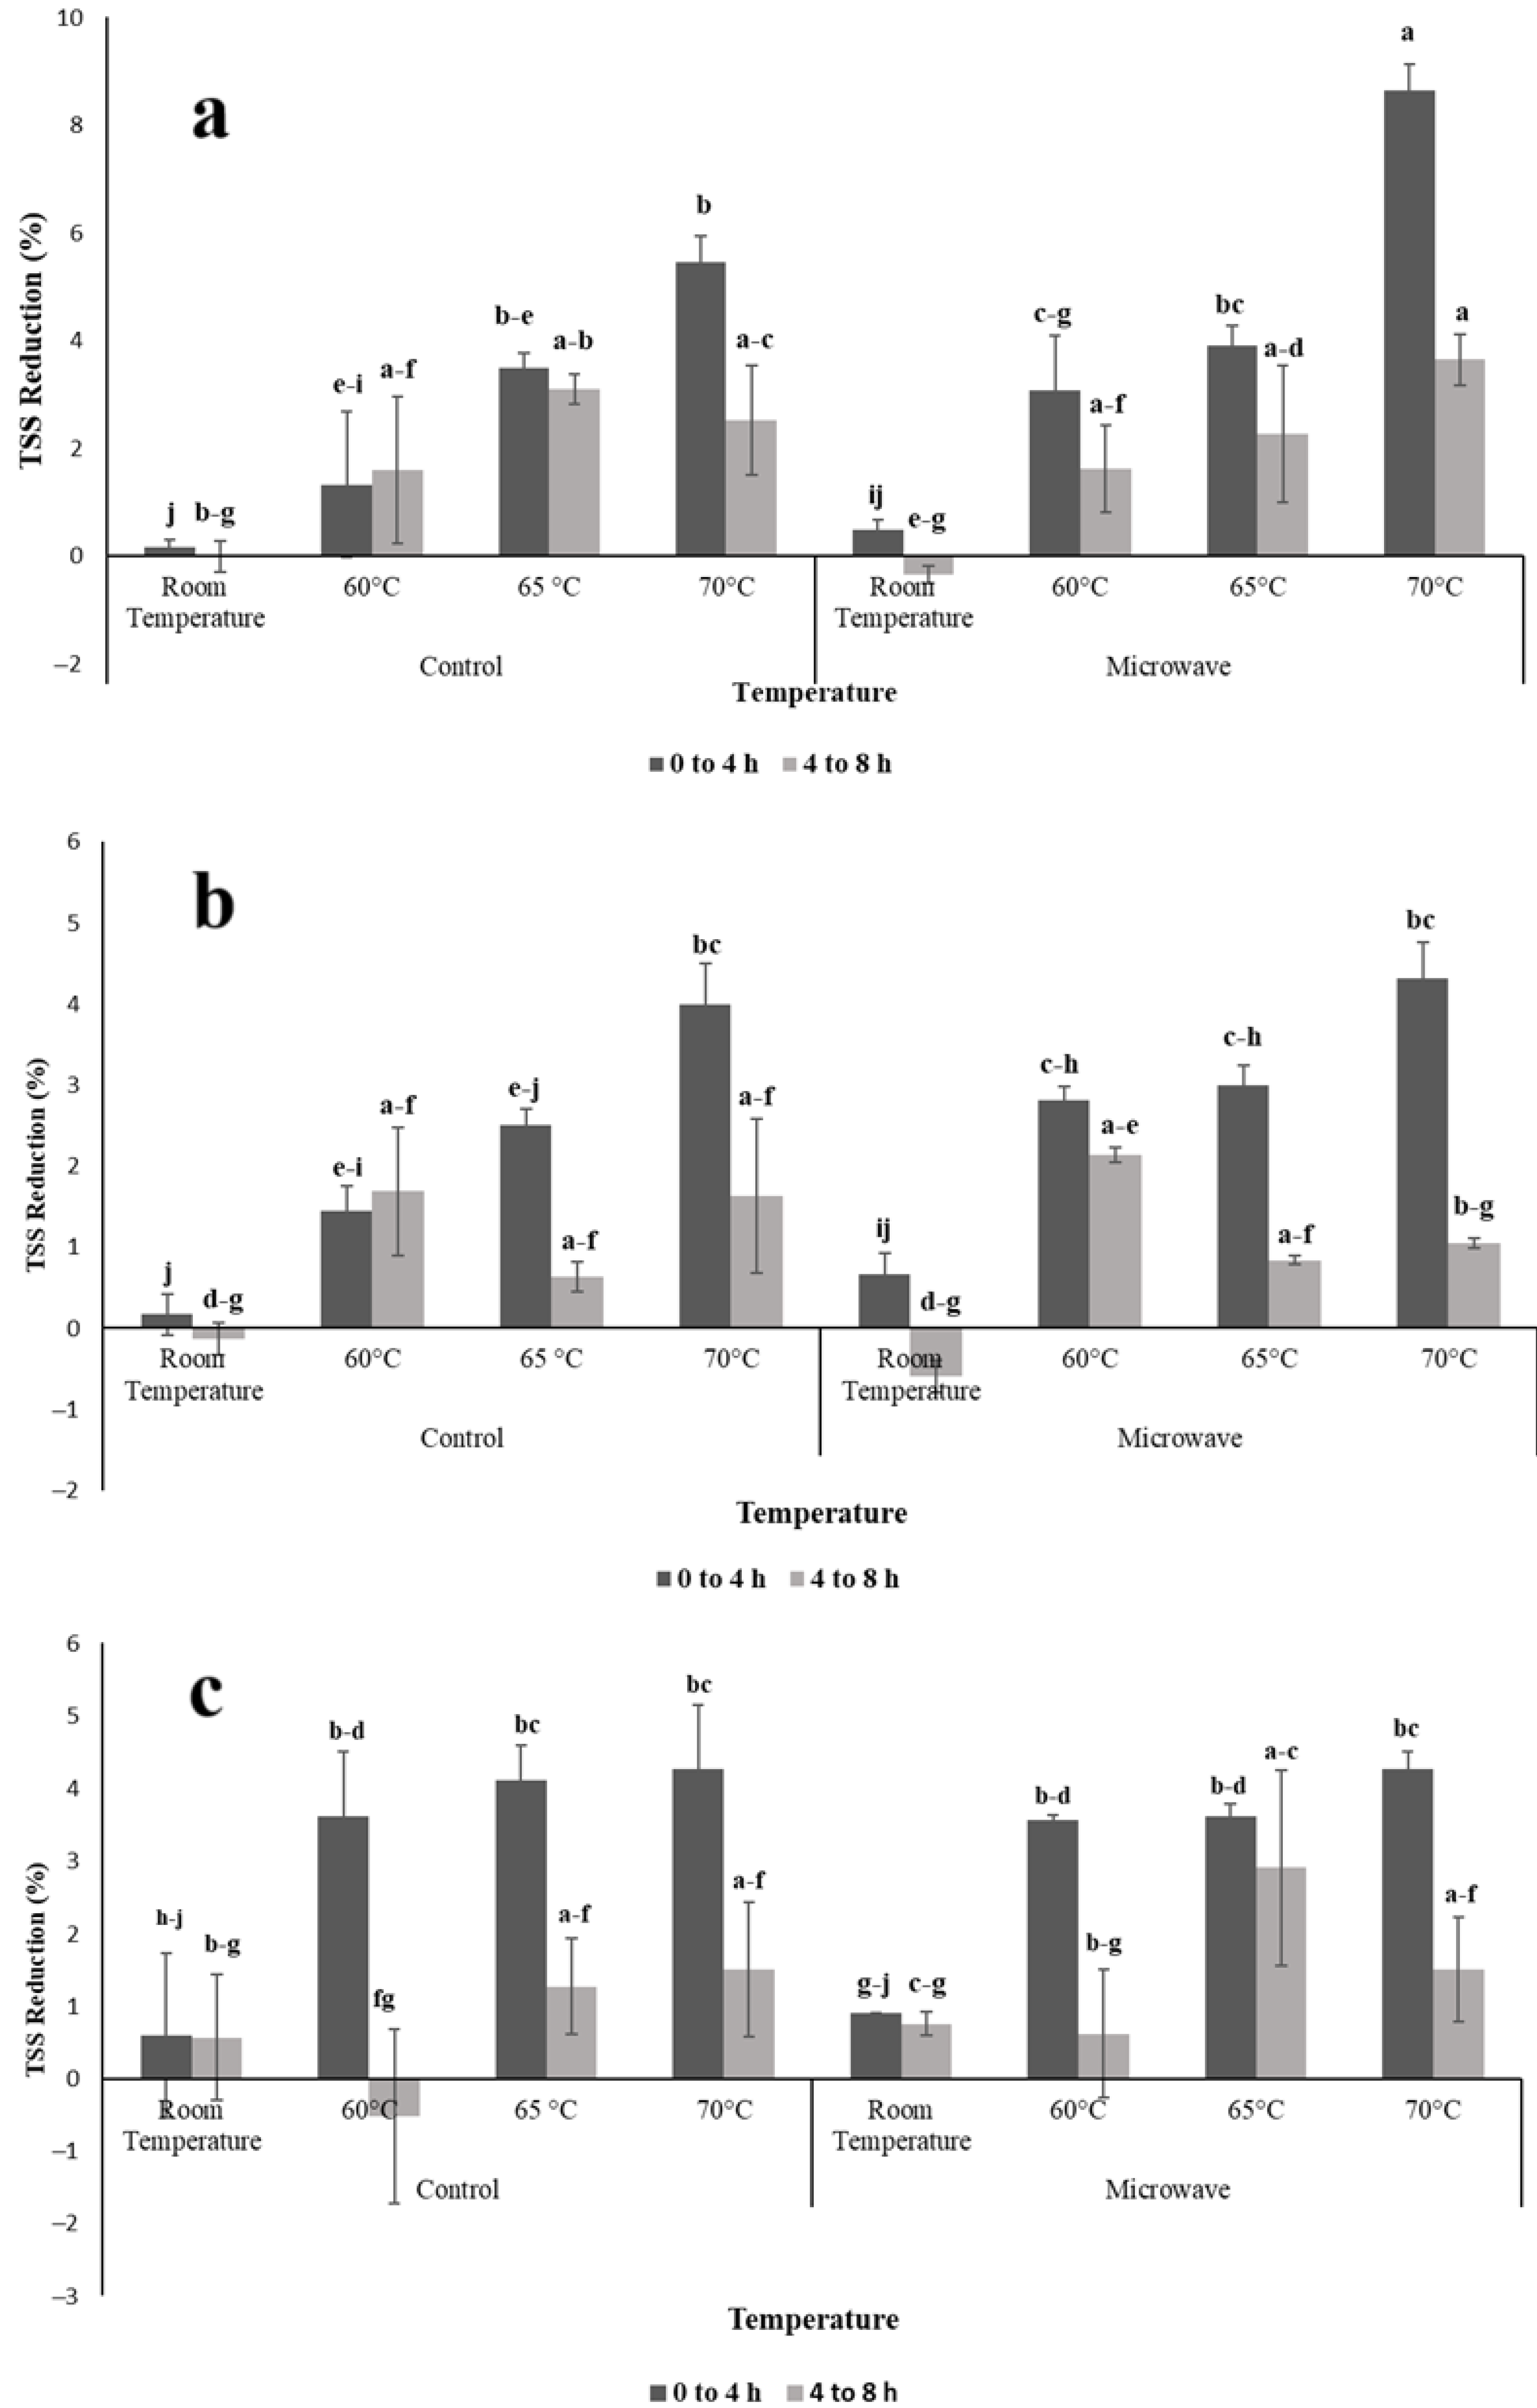
3.1. Effects of OD Parameters and Pretreatments on TSS Content of Osmotic Agent

The TSS content of the osmotic solutions showed considerable variation over the OD processing time depending on temperature, pretreatment, and osmotic solution ratio (Figure 2a–c). At room temperature (~21.1 ± 0.2 °C), no significant changes in TSS content were observed across any ratio (1:4, 1:7, or 1:10), indicating minimal water migration under low thermal energy (Figure 2a–c). As demonstrated in studies on papaya, MT rates, including WL and SG, were substantially lower at the lowest temperatures (35 °C), with significantly greater efficiency observed at higher temperatures such as 55 °C. This behavior is attributed to reduced molecular mobility and higher osmotic solution viscosity at lower temperatures, which hinders diffusion [29].
In contrast, higher temperatures (60 °C, 65 °C, and 70 °C) led to a pronounced decrease in TSS, especially at 70 °C, where the most substantial reduction occurred for the 1:4 solution ratio (11.98% decrease; from 60 to 52.81 °Brix). This reduction suggests an enhanced water transfer from the fruit into the solution under elevated thermal gradients. At elevated temperatures, cell structure degradation can reduce membrane selectivity and increase permeability, promoting solute leaching into the osmotic solution [30]. An effect also reported in strawberries, where higher temperatures improved dehydration efficiency by increasing membrane permeability and decreasing solution viscosity [31].
However, at temperatures of 60 °C and 65 °C, a different behavior during the final three hours of the process was observed. After 5 h, the TSS content in the osmotic agent began to either rise or maintain a constant trend, following a peak. In the latter phases, water transport becomes increasingly challenging due to the buildup of sucrose on the surface of the fruit and its resulting reduced difference in osmotic potential. As reported in potato studies, such surface saturation can diminish the osmotic gradient and pose additional resistance to mass exchange, thereby slowing water loss during extended dehydration [32].
Regardless of the applied temperatures, samples that underwent MW pretreatment prior to OD consistently showed greater reductions in TSS content of the osmotic solution compared to non-pretreated samples under the same OD conditions (Figure 2a–c). This effect may be attributed to the initial microstructural modifications induced by MW pretreatment, which enhanced the efficiency of subsequent dehydration, likely by increasing membrane permeability and facilitating water transport during OD. This is supported by microscopic observations in cranberries, where non-pretreated or mildly pretreated samples (e.g., freezing/thawing or ultrasonication) exhibited less structural alteration and, consequently, lower dehydration efficiency [23]. For example, in the 1:4 solution ratio, TSS content reductions in MW-pretreated blueberries were 11.98%, 7.45%, and 4.70% at 70 °C, 65 °C, and 60 °C, respectively. In comparison, the corresponding values for non-pretreated samples were 7.83%, 6.90%, and 3.28% (Figure 2a). A similar trend was observed for the 1:7 solution, where the MW-pretreated samples at 60 °C showed the greatest reduction in TSS content during the initial 3 h. However, this maximum reduction was not sustained in the later stages of the process (Figure 2b).
While the MW pretreatment was applied identically to all blueberry samples, the variation in TSS content reduction across temperatures and solution ratios reflects the interaction between the pretreatment and the OD conditions rather than the effect of MW alone. The underlying mechanism may be attributed to thermal stress from MW irradiation, which causes rapid cell wall degradation, resulting in more open tissue structures and improved water diffusivity [29]. These changes facilitate MT during OD. Pretreatment of the food matrix is one of the efficient strategies to enhance water removal from the samples during their immersion in an osmotic solution [30]. However, it is important to note that such effects are fruit-specific and depend on cellular composition and tissue resistance to thermal stress. To support the observed effects of temperature, solution concentration, and MW pretreatment on TSS content during OD, additional statistical analyses have been conducted and are presented in the Supplementary Materials. Table S1 summarizes the results of the analysis of variance (ANOVA) across different time intervals, while Table S2 provides the mean comparison analysis of TSS content. These tables offer a clearer understanding of treatment-related differences, enabling comparisons between control and MW-pretreated samples, as well as among various temperatures and solution ratios.
The combined influence of temperature and MW pretreatment was evident in all tested solution ratios. MW pretreatment amplified the temperature effect, resulting in significantly greater TSS content reductions across conditions. Similar findings were reported in a study on MW-pretreated wild blueberries [12], where the treatment led to enhanced WL compared to other pretreatment methods. The combination of 70 °C × MW was the most effective in reducing TSS content in the 1:4 and 1:10 ratios, while 60 °C × MW yielded the highest reduction in the 1:7 solution (Figure 2a–c).

3.2. Optimum Processing Time

As observed in the previous section, the most significant changes in the TSS content of the osmotic solution occurred during the initial hours of the process, while subsequent changes happened to a lesser degree (Figure 2a–c). Similar findings were reported by [31], who found a significant increase in moisture loss and sugar gain at the beginning of the OD process for blueberries, followed by a slower increase, and eventually reaching a stable point when everything balances out. Arballo and Campanone [19], observed a similar declining trend in food WL, which can be divided into two periods: (1) the initial two hours of the process, characterized by the highest water reduction, and (2) a period from 2 to 6 h, marked by a decreasing rate of water reduction. The slower slope of soluble solid reduction with increasing process time might be ascribed to the blockage of capillaries within the samples, resulting from the accumulation of a highly concentrated osmotic solution on the sample surface during solid absorption. During the initial stage of the osmotic treatment, WL is more pronounced because there is a significant osmotic driving force between the fresh fruit and the osmotic agent [33]. Numerous studies have explored the OD of various types of blueberries, including lowbush, highbush, and rabbiteye, utilizing various OD parameters and pretreatments. These investigations have encompassed exposure durations spanning from 5 to 1800 min [5,8,14,17,22,23,24,34]. None of the mentioned studies have reported the optimal processing time for the OD of blueberries. It is commonly acknowledged that a longer processing time leads to a greater reduction in WL. However, increasing the duration of immersion may lead to more significant damage to the blueberry membrane’s permeability, thereby significantly decreasing the resistance to moisture diffusion [35]. The extended processing time can have drawbacks from both commercial and environmental perspectives due to increased energy consumption. From an energy consumption perspective, it is essential to determine whether extending the processing time significantly enhances MT while yielding a satisfactory product. Furthermore, an extended exposure period can elevate the risk of losing bioactive compounds, essential nutrients, and certain water-soluble vitamins, such as vitamin C [4]. This risk is particularly significant when combined with other influential factors like higher temperatures, which can result in substantial losses of valuable compounds and unfavorable alterations in the texture and taste of the final product [13]. Since the processing time is a crucial variable in the OD process [27], we assessed the variation in TSS reduction percentage during two distinct processing intervals: 0–4 h and 4–8 h. At the 1:4 sample-to-solution ratio, the most pronounced reduction occurred during the first 4 h. In control treatments, the TSS dropped significantly at 70 °C (5.45%) and 65 °C (3.50%), with more modest reductions at 60 °C (1.45%) and room temperature (0.17%). Reductions between 4 and 8 h were consistently lower, indicating a tapering effect in MT. The microwave-assisted samples followed a similar pattern but with a more intense initial reduction, particularly at 70 °C (8.65%), reinforcing the efficiency of early-phase dehydration (Figure 3a).
For the 1:7 ratio, this trend remained consistent. During the 0–4 h stage, the most substantial decline was at 70 °C (4.00%) in control samples, followed by 65 °C (2.50%) and 60 °C (1.45%). The second interval (4–8 h) exhibited far less TSS loss, with near-plateau behavior at room temperature. In microwave-assisted treatments, rapid TSS content decline was again most evident within the first 4 h (e.g., 4.32% at 70 °C), after which the rates of reduction slowed significantly (Figure 3b).
At the 1:10 ratio, both control and MW groups showed their steepest TSS content reductions in the early stage (0–4 h), especially at 70 °C and 65 °C. For instance, in microwave-treated samples at 70 °C, the TSS content dropped by 4.28% in the first 4 h, compared to only 1.51% in the second half of the process (Figure 3c).
Across all ratios and conditions, the first 4 h of processing accounted for the majority of solute transfer, with diminishing returns thereafter, consistent with findings reported in previous studies. This highlights the 0–4 h window as the most critical and efficient phase for OD, particularly when higher temperatures or MW assistance are applied (Figure 3a–c).

3.3. Moisture Content and Total Soluble Solid of Osmotically Dehydrated Blueberry

Paired Student’s t-test was used to investigate the effect of applied OD parameters on moisture content and TSS content of blueberries by comparing paired observations (before and after) within the same treatment. Although some studies have combined the oven-drying method with complementary techniques such as water activity measurements to monitor moisture-related changes in fruits [32,36], the use of oven drying at 105 °C for 24 h remains a widely accepted and standard method for determining moisture content. This approach continues to be used as a reliable basis for interpreting related parameters dehydration kinetics in fruit processing research [9,23,37,38].
The results of the means comparison analysis showed that the moisture content of blueberry was significantly reduced after OD at room temperature, 65 °C, and 70 °C (Figure 4a). Paired comparison showed a reduction in moisture content with applied osmotic solution ratios. The moisture content of osmotically dehydrated blueberries changed significantly (at 1% probability level) using 1:4 and 1:7 ratios of sample to solution; however, this characteristic was changed to 5% probability level with the 1:10 ratio of sample-to-solution (Figure 4b). Both control and MW pretreatment led to the significant reduction in moisture content of blueberry at 1% and 5% probability level, respectively (Figure 4c). The TSS content of osmotically dehydrated blueberries at room temperature was not changed significantly; however, the TSS content was significantly increased when the blueberries were osmotically dehydrated at 60 °C, 65 °C, and 70 °C (Figure 4d). Temperature is a critical factor that has a substantial influence on the MT kinetics in an OD process. Higher temperatures (70 °C) induced detrimental alterations in cell membrane structure, leading to the loss of their selective properties and an acceleration in diffusion flow rate. Conversely, lower temperatures (34 °C) presented the challenge of a slow dehydration process, such as low moisture diffusivity [29]. Kucner et al. [13] reported that the OD process for highbush blueberries at temperatures between 30 and 50 °C did not achieve a sufficient degree of dehydration.
The ratios of 1:4 and 1:7 of osmotic solution led to a significant increase in total soluble solid of the blueberries at 1% probability level, while the increased level of TSS content with 1:10 ratio was significant at 5% probability level (Figure 4e).
The results of paired T-test analysis revealed that TSS content of non-pretreated and MW-pretreated blueberries was significantly changed at 1% and 5% probability levels, respectively (Figure 4f).
The effects of the interaction between temperature, solution ratio, and pretreatment method (MW vs. control) on moisture content and TSS content in osmotically dehydrated blueberries were analyzed using paired t-tests. The results of the pairwise comparisons are summarized in Table 1. Significant differences (p ≤ 0.05 or p ≤ 0.01) were observed in several treatment combinations, particularly at higher temperatures (65 °C and 70 °C), indicating the influence of MW pretreatment and solution concentration on both moisture content and TSS content levels. The most notable changes in TSS content were seen in MW-pretreated samples at 70 °C and a 1:10 ratio (t = 101.67, p ≤ 0.01), while significant changes in moisture content were also recorded across multiple combinations. Treatments with non-significant differences are indicated as “ns” in the table.

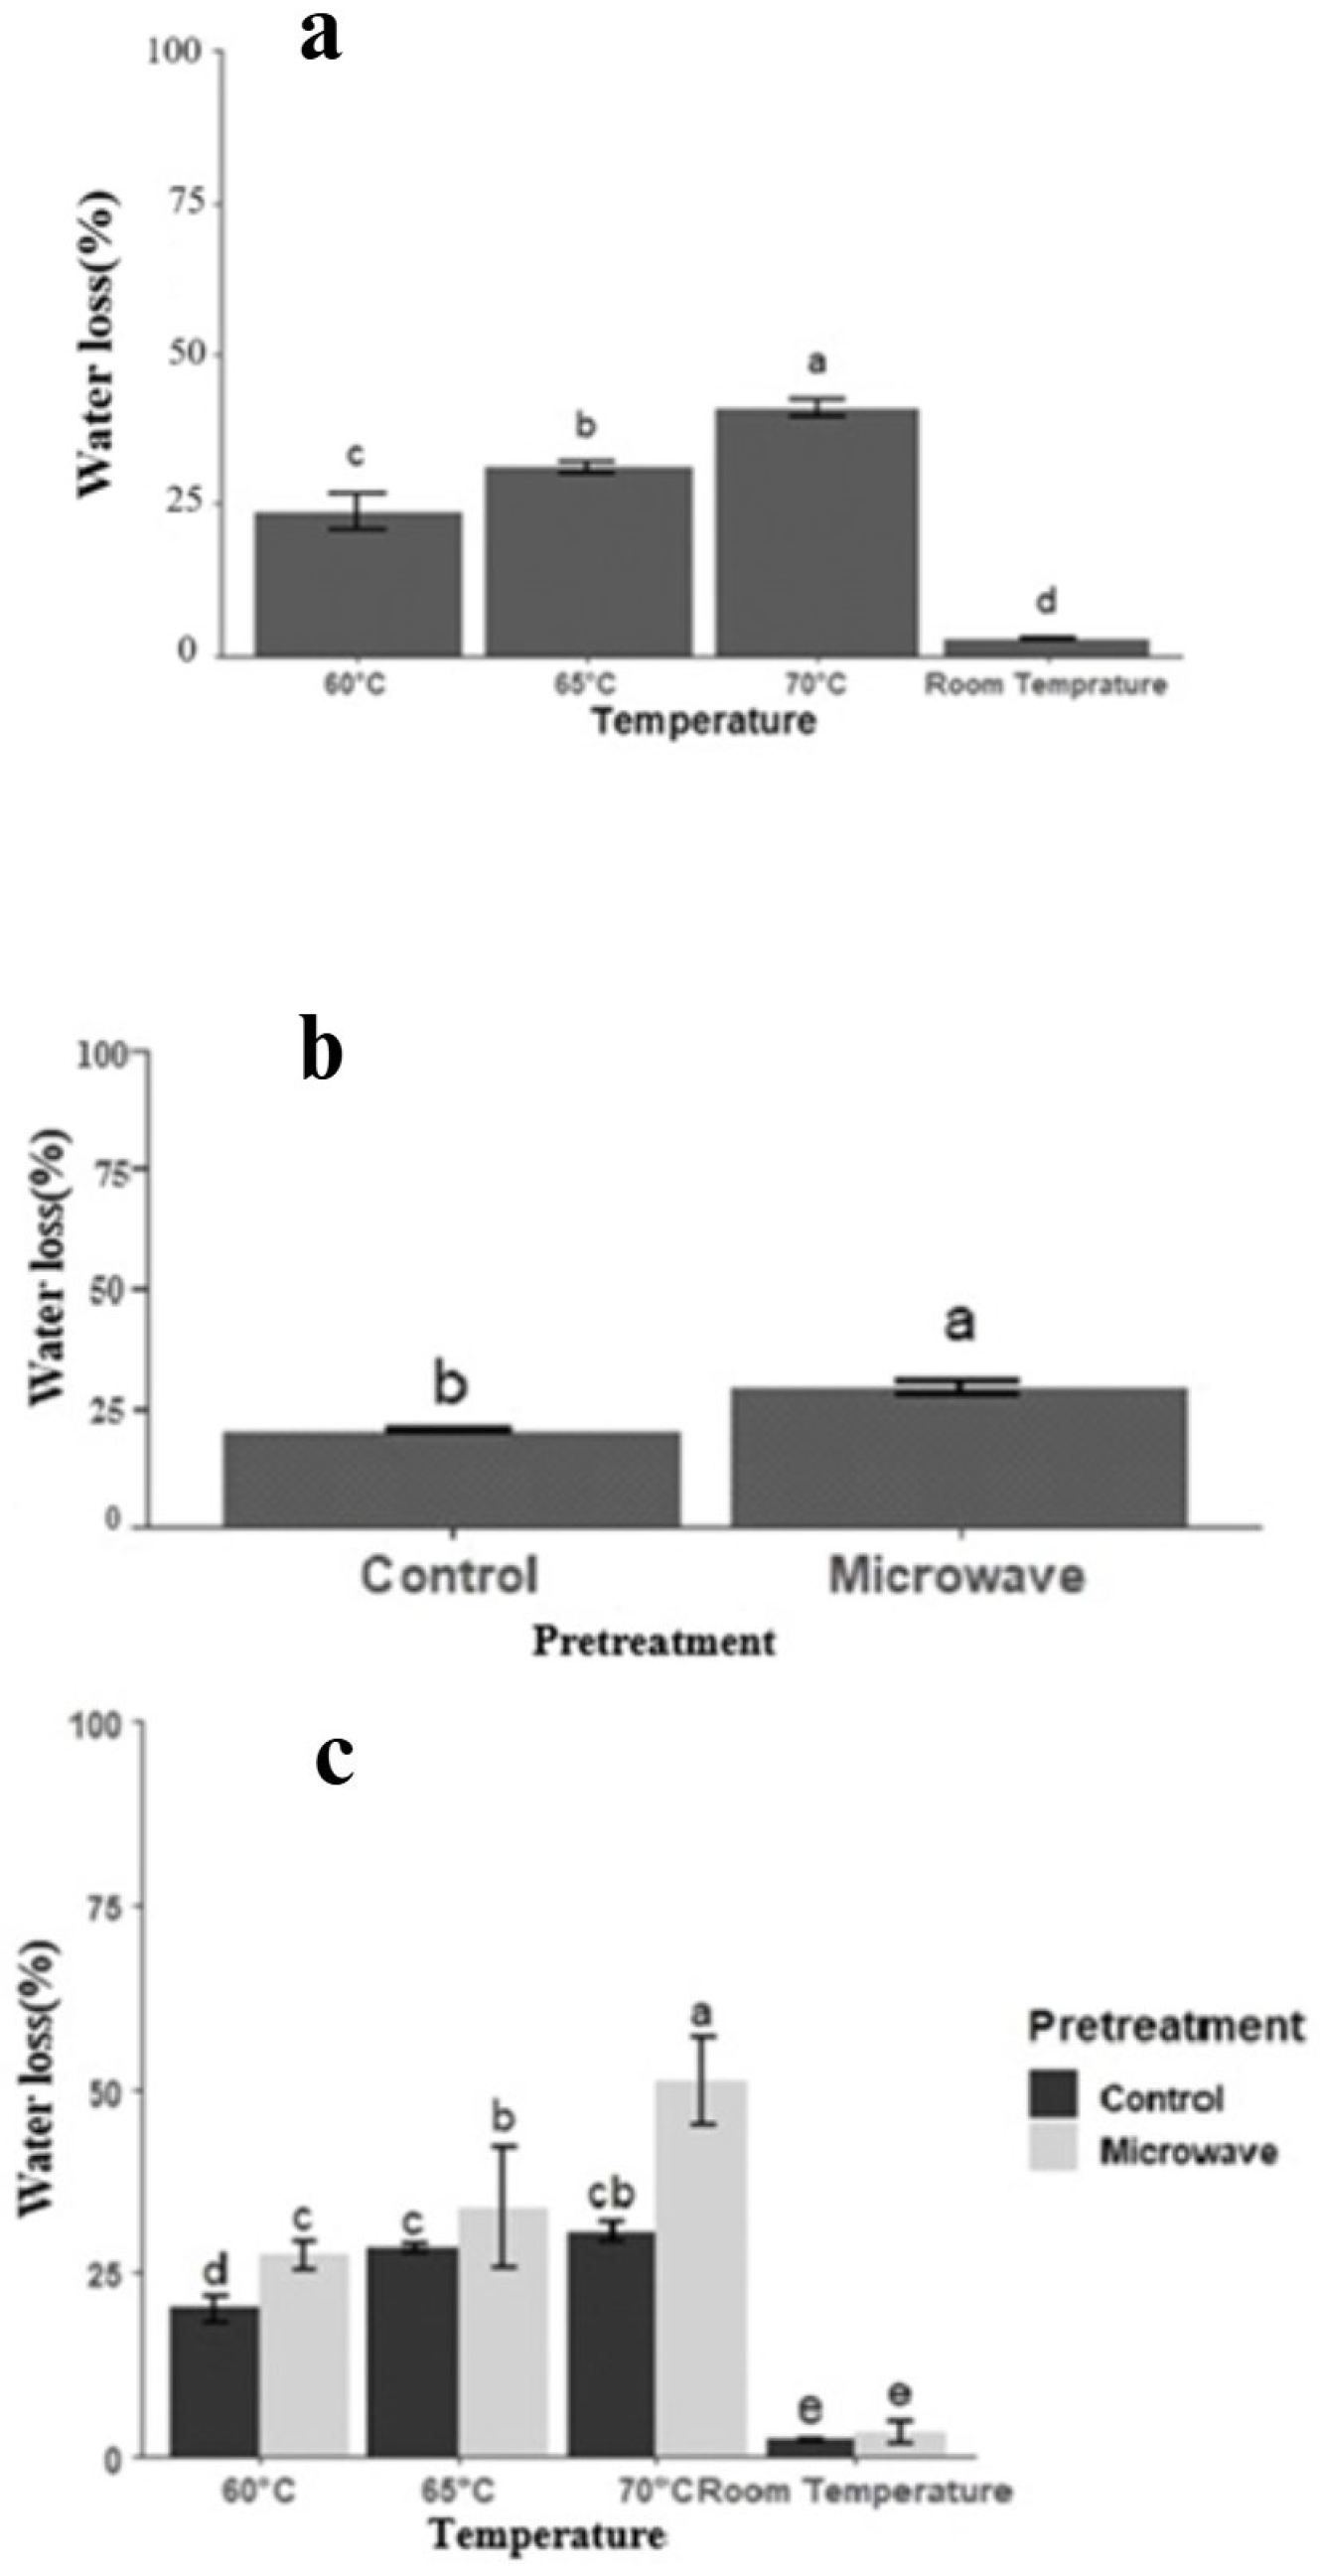
3.4. Water Loss, Solid Gain, and Quality Aspects of Osmotically Dehydrated Blueberry

3.4.1. Water Loss and Solid Gain Aspect

The results of the analysis of variance showed that the main interaction effects of temperature, pretreatment, and temperature × pretreatment on WL were significant at 1% probability level (p ≤ 0.01). The effect of the ratio and its interactions with temperature and pretreatment on WL was not significant (Table 2). The solid gain of blueberry was affected by the main and interaction effects of temperature, ratio, temperature × ratio, temperature × pretreatment, ratio × pretreatment, and temperature × ratio × pretreatment at 1% probability level (p ≤ 0.01) (Table 2). It is obvious that OD is a multivariable process and finding the best combination(s) of parameters is very important to reach satisfying results.
The results of means comparison analysis, using multiple ranges Duncan’s test at 5% probability level, showed that 70 °C and room temperature were the most and least efficient temperatures for water loss percentage, respectively (Figure 5a).
Means comparison of pretreatments showed that MW was significantly more efficient than the control without pretreatment for water loss percentage (Figure 5b). Mass transfer during OD is influenced by variations in osmotic pressure, porosity, and the apparent modulus of elasticity. As a result, this difference may be attributed to the porosity or minor scratches on the sample’s skin induced by MW power [34]. This is consistent with the observed results of the TSS content found in the osmotic solution (Figure 2). In a broader context, Zielińska and Markowski [23] addressed structural barriers to MT, such as the waxy cuticle of cranberries, which creates a resistance against the movement of heat and water during dehydration. They tested multiple advanced drying methods, including microwave-vacuum (MV) pretreatment. MV treatment significantly reduced initial MC from 7.77 ± 0.02 to 6.15 ± 0.02 g water/g dry basis, while conventional freezing showed no comparable effect. The enhanced efficiency was largely credited to the pressure and microcracks induced by microwave energy under vacuum, which facilitated improved permeability.
The significantly higher WL observed in MW-pretreated samples (Figure 5c) reflects the enhanced permeability of fruit tissues following MW exposure. The thermal and structural effects induced by pulsed MW likely reduced cellular resistance to MT, allowing water to diffuse more readily during osmotic treatment. This increase in tissue reactivity to the osmotic gradient may explain the enhanced WL observed under microwave-assisted treatments.
The unique impact of MW pretreatment on mass and heat transfer phenomena during OD has been consistently highlighted across several studies. Layeghinia et al. [39] investigated the effect of MW power and immersion time on OD-treated quince slices and observed that MW energy significantly influenced both color parameters and drying time. This was attributed to the volumetric heating mechanism of MWs, which accelerates internal moisture evaporation, boosts the drying rate, and shortens overall processing time. This mechanism contrasts with surface-dominant heating in conventional systems and suggests that MW effects extend beyond simple thermal input.
Similar findings were observed in a reported study on the microwave-assisted osmotic dehydration (MWOD) of apple cubes at a constant temperature. MWOD exhibited better results in water loss compared to the conventional osmotic dehydration method, with a 49.5% reduction in MWOD compared to 24.5% in conventional osmotic dehydration. More specifically, the samples treated with MWOD and a 60 °Brix sucrose solution showed the highest rate of WL after 160 min of immersion [34]. These enhancements were attributed to the generation of internal vapor pressure by microwaves, which accelerates water transport through cellular structures, an effect linked to the volumetric and electromagnetic nature of MW energy rather than heat alone. MWOD also resulted in improved rehydration ability, higher porosity, greater dehydration coefficient (ML/SG), and reduced drying time and shrinkage [34].
Supporting this distinction, Sharif et al. [12] compared four different pretreatments, boiling water immersion, ultrasound water bath, ultrasound probe, and MW, applied to wild blueberries before OD. Among them, MW pretreatment resulted in the highest WL (37.71 g/100 g fresh fruit), outperforming all other methods, including thermal treatments. Furthermore, blueberries subjected to MW pretreatment retained significantly higher levels of phenolics, flavonoids, and anthocyanins after OD. Notably, to isolate the effect of MWs, the authors examined MW treatment alone, confirming that the enhanced antioxidant retention was directly attributable to MW exposure, further suggesting non-thermal or structure-specific interactions.
In the present study, the specific duration and power intensity of the MW exposure were determined through a trial-and-error process to identify the optimal power input, ensuring avoidance of sample deformation and potential explosions. There is no doubt that increasing the MW power by more than 30% leads to a higher diffusion coefficient (ML/SG). However, it is worth noting that higher MW power can have a negative impact on fruit quality, particularly with regard to color characteristics [34]. Collectively, these findings indicate that the benefits of MW pretreatment stem not only from thermal effects but also from distinctive mechanisms inherent to MW energy, including internal pressure buildup, cell wall disruption, and enhanced solute mobility. While our study did not include a temperature-time equivalence analysis between MW and conventional heating methods, these cited works strongly suggest that MW-specific phenomena play a critical role. This distinction should be considered in future comparative studies to disentangle thermal versus electromagnetic contributions in MW-assisted dehydration processes.
The highest mean percentage of solid gain was achieved by two of the 24 treatments (70 °C × 1:10 × control and 70 °C × 1:7 × control) (Figure 6a). Similar results were reported in the OD of unripe plantain, where the sample-to-solution ratio had a significant influence on MT efficiency. Among the evaluated conditions, a 1:10 (w/v) sample-to-solution ratio resulted in the highest WL and SG when using a 50% low-calorie sugar solution at ambient temperature (25 ± 2 °C) [40].
At lower temperatures (60 °C, 65 °C, and room temperature), higher percentages of SG were obtained by the samples with MW pretreatment and an osmotic solution with the ratio of 1:10 (Figure 6a). In addition, the present findings show that the values of SG were lower than that of WL (Figure 5 and Figure 6a). The lower magnitudes of SG compared to WL can be attributed to the difference in molecular size between water and solid, as well as the selectivity of the membrane. In some reported experiments, negative values for SG were observed, suggesting that the sample lost soluble solids to the surrounding liquid medium [32].

3.4.2. Quality Aspects

Changes in Total Anthocyanin and Phenolic Content (TAC, TPC)
The TAC of osmotically dehydrated blueberries was affected by main, two- and three-way interaction effects of temperature, ratio, and pretreatment parameters at 1% probability level (p ≤ 0.01) (Table 2). The TPC of osmotically dehydrated blueberries was significantly affected by the main and interaction effects of ratio, temperature × ratio, and temperature × ratio × pretreatment parameters at 1% probability level (p ≤ 0.01). The main effects of temperature and pretreatment were significant on the TPC of osmotically dehydrated blueberries at 5% probability level (p ≤ 0.05) (Table 2).
In a reported study, a substantial loss of approximately 60% in anthocyanins and phenolic content was reported for rabbiteye blueberries when osmo-concentration was applied for 12 h [41]. Blueberries are widely recognized as abundant dietary reservoirs of various phytonutrients, encompassing anthocyanins, phenolic acids, and flavonols. Nonetheless, the stability of anthocyanins is notably influenced by factors such as pH, enzyme activity, oxygen, light, sugar degradation products, and temperature, while temperature being a prominent factor among these influences [42]. The positive effects of combining MW power before the OD, such as improved WL values, come at the cost of a reduction in TAC and TPC compared to untreated blueberries. The highest and lowest means of TAC were obtained by room temperature × 1:7 × control and 70 °C × 1:7 × MW (Figure 6b).
The means comparison analysis indicated that the highest TPC was observed in the treatment combining room temperature, a 1:4 sample-to-solution ratio, and MW pretreatment. However, this treatment was not significantly different (p > 0.05) from several others, including: 60 °C with 1:4 (control and MW), 60 °C with 1:7 (control), 65 °C with 1:4 (control and MW), 65 °C with 1:10 (control and MW), 70 °C with 1:4 (control), 70 °C with 1:10 (control), and 70 °C with 1:7 (MW), as well as room temperature with 1:4 and 1:7 (control and MW) (Figure 6c).
The total polyphenol content in highbush blueberries was significantly influenced by the dehydration process, with its extent primarily reliant on both the process temperature and duration [13]. Results from the present study indicated that the OD process led to a reduction in TAC and TPC, when compared with the initial levels of TAC (82.87 mg/100 g sample) and TPC (372.52 GAE/g d.b). There is a widely acknowledged consensus that exposing anthocyanins to high-temperature conditions could lead to significant damage, resulting in a substantial reduction in their content [42,43,44]. Meanwhile, it has been shown that heat treatments led to notable reductions in TAC ranging from 28% to 59% in blueberry products [45].
Physical Properties (Texture, Color)
The individual, two- and three-way interaction effects of all investigated parameters were not significant for the texture of osmotically dehydrated blueberries (Table 2). While our findings show that MW pretreatment did not significantly change blueberry texture compared to control samples under the same osmotic conditions, it is important to consider pectin-related microstructural effects. Studies involving microwave-vacuum pretreatment (e.g., Zielińska et al. [21]) have demonstrated that rapid internal heating can generate microcracks, cell deformation, and increased porosity, features often associated with pectin solubilization or degradation. Microwave-assisted processes have also been shown to reduce shrinkage and enhance porosity in various fruits, suggesting that cell wall loosening via pectin modification may contribute to improved texture and rehydration [46]. Under our low-power, pulsed MW conditions, these effects were likely minimized, explaining why no significant textural differences were observed.
The purchasing preference of consumers for a product is significantly influenced by color, making color a crucial determinant. One of the primary color parameters used to quantify the difference in color between processed and unprocessed food is the total color change [47]. The ΔE characteristic was extremely variable depending on the interaction of applied parameters of the OD process. Specifically, the ΔE characteristic of osmotically dehydrated blueberries was significantly affected by the individual factors, two- and three-way interaction effects of temperature, ratio, and pretreatment parameters at 1% probability level (p ≤ 0.01) (Table 2).
The highest means of ΔE were obtained with 70 °C × 1:10 × MW and 70 °C × 1:7 × MW treatments, while the lowest mean of ΔE was obtained with 65 °C × 1:7 × MW (Figure 6d). Chaguri et al. [48] reported that the color difference in green banana slices, treated at 25 °C with varying concentrations of the osmotic agent ranging from 40 to 60 g/100 g for up to 6 h, changed from 2.7 to 15.8. The total color change value of goji berries exhibited a significant increase after applying OD (from initial times) (p < 0.05), and this trend persisted throughout the process (beyond 15 min up to the end) [46].
Obtained results of the present study indicated the destructive effect of high temperature on the quality properties of osmotically dehydrated blueberries and the additive effect of MW pretreatment with temperature treatment. Although a lower temperature reduces the efficiency of the dehydration, higher ones can lead to substantial losses of valuable compounds and unfavorable changes in the texture and taste of the final product [13]. However, it is documented that when ΔE is below 4, the observer will perceive no distinctive changes in the color between processed items and their fresh counterparts [48].
In this situation, an efficient pretreatment, like MW can be effective with lower temperatures, not only to eliminate the damaging effect of high temperatures but also to reduce the duration of the process.
Figure 6. Effect of osmotic dehydration parameters on blueberry quality attributes. (a) Solid gain (%), (b) Total anthocyanin content, (c) Total phenolic content, (d) ΔE, under the combined effects of temperature, solution ratio, and pretreatment. Values represent mean ± standard error (n = 3). Different letters indicate statistically significant differences (p < 0.05). A factorial design was used with 24 treatment combinations, each replicated three times.
Agriculture 15 01602 g006
More specifically, regarding color-related parameters, the results of means comparison analysis of the chromatic parameters of a, b, and L, using paired Student’s t-test is presented in Table 3. Parameter a was significantly changed by 60 °C and 65 °C at 1% and 5% probability levels, respectively (Table 3). This parameter was significantly changed with 1:4 and 1:7 ratios of osmotic solution at 1% probability levels (Table 3). Parameter a of both non-pretreated and MW-pretreated blueberries was significantly changed after OD at 1% probability levels (Table 3). A notable rise (p < 0.05) was observed in chromatic coordinates following both MW-assisted OD and conventional OD of apple cubes. This change could be linked to an elevation in solution concentration and the application of MW power [34].
A considerable increase in parameter a was also reported, along with a more substantial change in parameter b, during both microwave-assisted and conventional osmotic dehydration of apple cubes at consistent temperature of 45 °C [34].
Among the investigated temperatures, the only one that led to a significant change in parameter b of blueberry color was 65 °C (Table 3). None of the investigated osmotic solution ratios caused a significant change in the parameter b color of blueberry. The parameter b was significantly changed in non-pretreated blueberries at 1% probability level; however, this parameter was not changed after OD of MW-pretreated samples (Table 3). The L parameter was significantly changed after OD at room temperature and 70 °C at 1% and 5% probability levels, respectively (Table 3). Among the investigated osmotic solution ratios, ratios of 1:7 and 1:10 led to a significant change in parameter L at 5% probability level (Table 3). The L parameter of both non-pretreated and MW-pretreated samples was significantly changed at 5% probability level (Table 3). It could be attributed to the loss of water during the OD process [49], irrespective of pretreatment.
Obtained results showed that lower temperatures (room temperature, 60 °C and 65 °C) led to significant changes in one of the a, b, and L parameters; however, the highest investigated temperature (70 °C) led to the significant changes in a and L parameters. Similar findings confirm that both pulsed electric field and OD influenced the color parameters (a, b values for all samples and under all treatment conditions) of air-dried goji berries [46]. Our results show that MW pretreatment has no significant effect on a, b, and L color parameters of blueberry. Similarly, Kutlu [50] reported that the effect of holding time and MW power on MW drying of quince samples pretreated by ohmic heating assisted OD was found to be statistically insignificant regarding the b value.

4. Conclusions

The osmotic dehydration of blueberries was influenced by key process variables such as temperature, the sample-to-solution ratio, and MW pretreatment. In microwave pretreatment, particularly under elevated temperatures, modified dehydration behavior and helped overcome some of the MT limitations posed by blueberry with waxy skin. Temperature and ratio levels played important roles in water removal and solute uptake, with notable interactions observed among the variables. While MW treatment improved the process efficiency in certain cases, it also introduced trade-offs in terms of quality retention, especially at higher temperatures. Therefore, optimizing processing conditions is essential to balance dehydration performance with the preservation of phenolic compounds, anthocyanins, and color attributes.
Microwave-assisted osmotic dehydration is a multifactorial process and identifying the optimal condition that maximizes WL and SG while minimizing losses in quality attributes is inherently complex. Based on our findings, the combination of MW pretreatment at 65 °C with a 1:4 sample-to-solution ratio offered a more favorable balance, delivering effective dehydration while better preserving anthocyanin content, color, and total phenolics. This condition is recommended as the most effective overall for optimizing both processing efficiency and product quality in highbush blueberries.
While this study primarily focused on SG and WL as key indicators of OD performance, future work should incorporate kinetic modeling to enhance scientific and industrial understanding. Additionally, although viscosity was not measured in this study, its potential influence on MT remains an open question. Future research is recommended to investigate the role of solution viscosity and sucrose concentration in solute uptake and water removal efficiency during the OD process.

Supplementary Materials

The following supporting information can be downloaded at: https://www.mdpi.com/article/10.3390/agriculture15151602/s1, Table S1: Analysis of variance of total soluble solid of osmotically dehydrated blueberry during different times of osmotic dehydration process. Table S2: Mean comparison analysis of TSS content (°Brix) of osmotically dehydrated blueberry during different times of osmotic dehydration process.

Author Contributions

Conceptualization, S.N. and V.O.; methodology, S.N.; software, S.N.; validation, S.N., V.O. and M.-J.D.; formal analysis, S.N.; investigation, S.N. and V.O.; resources, V.O.; data curation, S.N.; writing—original draft preparation, S.N.; writing—review and editing, V.O. and M.-J.D.; visualization, S.N.; supervision, V.O.; project administration, V.O.; funding acquisition, V.O. All authors have read and agreed to the published version of the manuscript.

Funding

Research funding enabled by Natural Sciences and Engineering Research Council of Canada (NSERC, RGPIN2016-04714), Research and Innovation Transformation Agrifood, and Fruit d’Or Company.

Institutional Review Board Statement

Not applicable.

Data Availability Statement

Data available on request from the corresponding author.

Acknowledgments

Financial support for this research was provided by the Natural Sciences and Engineering Research Council of Canada (NSERC), Research and Innovation Transformation Agrifood, and Fruit d’Or Company.

Conflicts of Interest

The authors declare that the research was conducted in the absence of any commercial or financial relationships that could be construed as a potential conflict of interest.

References

  1. Rashwan, A.K.; Osman, A.I.; Karim, N.; Mo, J.; Chen, W. Unveiling the Mechanisms of the Development of Blueberries-Based Functional Foods: An Updated and Comprehensive Review. Food Rev. Int. 2024, 40, 1913–1940. [Google Scholar] [CrossRef]
  2. Qi, J.; Sun, S.; Zhang, L.; Zhu, Y.; Zhou, H.; Gan, X.; Li, B.; Chen, Y.; Li, W.; Li, T.; et al. Seasonal Variation of Antioxidant Bioactive Compounds in Southern Highbush Blueberry Leaves and Non-Destructive Quality Prediction in Situ by a Portable near-Infrared Spectrometer. Food Chem. 2024, 457, 139925. [Google Scholar] [CrossRef]
  3. Li, C.; Pan, Y.; Yang, X.; Cai, D.; Pan, W.; Anwar, A.; Song, S.; Chen, R. Heterogeneous Fruiting Phenomenon of Southern Highbush Blueberry Differentiated by Branches under Efficient Cultivation Mode. Hortic. Environ. Biotechnol. 2025. [Google Scholar] [CrossRef]
  4. Ferrão, L.F.V.; Azevedo, C.; Benevenuto, J.; Mengist, M.F.; Luby, C.; Pottorff, M.; Casorzo, G.I.P.; Mackey, T.; Lila, M.A.; Giongo, L.; et al. Inference of the Genetic Basis of Fruit Texture in Highbush Blueberries Using Genome-Wide Association Analyses. Hortic. Res. 2024, 11, uhae233. [Google Scholar] [CrossRef]
  5. Jakubczyk, E.; Tryzno-Gendek, E.; Kot, A.; Kamińska-Dwórznicka, A.; Nowak, D. Pre-Treatment Impact on Freeze-Drying Process and Properties of Dried Blueberries. Processes 2025, 13, 537. [Google Scholar] [CrossRef]
  6. Celli, G.B.; Dibazar, R.; Ghanem, A.; Brooks, M.S.-L. Degradation Kinetics of Anthocyanins in Freeze-Dried Microencapsulates from Lowbush Blueberries (Vaccinium angustifolium Aiton) and Prediction of Shelf-Life. Dry. Technol. 2016, 34, 1175–1184. [Google Scholar] [CrossRef]
  7. Miller, K.; Feucht, W.; Schmid, M. Bioactive Compounds of Strawberry and Blueberry and Their Potential Health Effects Based on Human Intervention Studies: A Brief Overview. Nutrients 2019, 11, 1510. [Google Scholar] [CrossRef]
  8. Routray, W.; Orsat, V. Microwave-Assisted Extraction of Flavonoids: A Review. Food Bioproc. Technol. 2012, 5, 409–424. [Google Scholar] [CrossRef]
  9. Yu, Y.; Jin, T.Z.; Fan, X.; Xu, Y. Osmotic Dehydration of Blueberries Pretreated with Pulsed Electric Fields: Effects on Dehydration Kinetics, and Microbiological and Nutritional Qualities. Dry. Technol. 2017, 35, 1543–1551. [Google Scholar] [CrossRef]
  10. Kumar Dash, K.; Sundarsingh, A.; BhagyaRaj, G.V.S.; Kumar Pandey, V.; Kovács, B.; Mukarram, S.A. Modelling of Ultrasonic Assisted Osmotic Dehydration of Cape Gooseberry Using Adaptive Neuro-Fuzzy Inference System (ANFIS). Ultrason. Sonochem. 2023, 96, 106425. [Google Scholar] [CrossRef]
  11. Yang, H.; Min, S.; Lee, S.Y.; Yang, J.; Lee, M.; Park, S.; Eun, J.; Chung, Y. Influence of Salt Concentration on Kimchi Cabbage (Brassica rapa L. Ssp. Pekinensis) Mass Transfer Kinetics and Textural and Microstructural Properties during Osmotic Dehydration. J. Food Sci. 2023, 88, 1610–1622. [Google Scholar] [CrossRef]
  12. Sharif, I.; Adewale, P.; Dalli, S.S.; Rakshit, S. Microwave Pretreatment and Optimization of Osmotic Dehydration of Wild Blueberries Using Response Surface Methodology. Food Chem. 2018, 269, 300–310. [Google Scholar] [CrossRef]
  13. Kucner, A.; Klewicki, R.; Sójka, M. The Influence of Selected Osmotic Dehydration and Pretreatment Parameters on Dry Matter and Polyphenol Content in Highbush Blueberry (Vaccinium corymbosum L.) Fruits. Food Bioproc. Technol. 2013, 6, 2031–2047. [Google Scholar] [CrossRef]
  14. Nuñez-Mancilla, Y.; Pérez-Won, M.; Uribe, E.; Vega-Gálvez, A.; Di Scala, K. Osmotic Dehydration under High Hydrostatic Pressure: Effects on Antioxidant Activity, Total Phenolics Compounds, Vitamin C and Colour of Strawberry (Fragaria vesca). LWT Food Sci. Technol. 2013, 52, 151–156. [Google Scholar] [CrossRef]
  15. Spinei, M.; Oroian, M. The Influence of Osmotic Treatment Assisted by Ultrasound on the Physico-Chemical Characteristics of Blueberries (Vaccinium myrtillus L.). Ultrasonics 2021, 110, 106298. [Google Scholar] [CrossRef]
  16. Barman, N.; Badwaik, L.S. Effect of Ultrasound and Centrifugal Force on Carambola (Averrhoa carambola L.) Slices during Osmotic Dehydration. Ultrason. Sonochem. 2017, 34, 37–44. [Google Scholar] [CrossRef]
  17. Amami, E.; Fersi, A.; Vorobiev, E.; Kechaou, N. Osmotic Dehydration of Carrot Tissue Enhanced by Pulsed Electric Field, Salt and Centrifugal Force. J. Food Eng. 2007, 83, 605–613. [Google Scholar] [CrossRef]
  18. Moreno, J.; Gonzales, M.; Zúñiga, P.; Petzold, G.; Mella, K.; Muñoz, O. Ohmic Heating and Pulsed Vacuum Effect on Dehydration Processes and Polyphenol Component Retention of Osmodehydrated Blueberries (Cv. Tifblue). Innov. Food Sci. Emerg. Technol. 2016, 36, 112–119. [Google Scholar] [CrossRef]
  19. Arballo, J.R.; Campañone, L.A. Application of Microwave Processing in the Food Industry. In Emerging Thermal Processes in the Food Industry; Elsevier: Amsterdam, The Netherlands, 2023; pp. 165–226. [Google Scholar]
  20. Norouzi, S.; Orsat, V.; Yeasmen, N.; Dumont, M.-J. Osmotic Dehydration of Waxy Skinned Berries—A Review. Dry. Technol. 2024, 42, 1270–1294. [Google Scholar] [CrossRef]
  21. Zielinska, M.; Zielinska, D. Effects of Freezing, Convective and Microwave-Vacuum Drying on the Content of Bioactive Compounds and Color of Cranberries. LWT 2019, 104, 202–209. [Google Scholar] [CrossRef]
  22. Yadav, A.K.; Singh, S.V. Osmotic Dehydration of Fruits and Vegetables: A Review. J. Food Sci. Technol. 2014, 51, 1654–1673. [Google Scholar] [CrossRef]
  23. Zielinska, M.; Markowski, M. Effect of Microwave-Vacuum, Ultrasonication, and Freezing on Mass Transfer Kinetics and Diffusivity during Osmotic Dehydration of Cranberries. Dry. Technol. 2018, 36, 1158–1169. [Google Scholar] [CrossRef]
  24. Norouzi, S.; Fadavi, A.; Darvishi, H. The Ohmic and Conventional Heating Methods in Concentration of Sour Cherry Juice: Quality and Engineering Factors. J. Food Eng. 2021, 291, 110242. [Google Scholar] [CrossRef]
  25. Rosner, B. A Generalization of the Paired T-Test. Appl. Stat. 1982, 31, 9. [Google Scholar] [CrossRef]
  26. Zia, M.P.; Alibas, I. Influence of the Drying Methods on Color, Vitamin C, Anthocyanin, Phenolic Compounds, Antioxidant Activity, and in Vitro Bioaccessibility of Blueberry Fruits. Food Biosci. 2021, 42, 101179. [Google Scholar] [CrossRef]
  27. Vitali, D.; Dragojević, I.V.; Šebečić, B. Effects of Incorporation of Integral Raw Materials and Dietary Fibre on the Selected Nutritional and Functional Properties of Biscuits. Food Chem. 2009, 114, 1462–1469. [Google Scholar] [CrossRef]
  28. Liu, S.; Li, S.; Li, S.; Wang, Y.; Fan, L.; Zhou, J. Effects of High Power Pulsed Microwave on the Enhanced Color and Flavor of Aged Blueberry Wine. Food Sci. Biotechnol. 2024, 33, 33–45. [Google Scholar] [CrossRef]
  29. Islam, M.Z.; Das, S.; Monalisa, K.; Sayem, A.S.M. Influence of Osmotic Dehydration on Mass Transfer Kinetics and Quality Retention of Ripe Papaya (Carica papaya L.) during Drying. AgriEngineering 2019, 1, 220–234. [Google Scholar] [CrossRef]
  30. Abrahão, F.R.; Corrêa, J.L.G. Osmotic Dehydration: More than Water Loss and Solid Gain. Crit. Rev. Food Sci. Nutr. 2023, 63, 2970–2989. [Google Scholar] [CrossRef]
  31. Prosapio, V.; Norton, I. Influence of Osmotic Dehydration Pre-Treatment on Oven Drying and Freeze Drying Performance. LWT 2017, 80, 401–408. [Google Scholar] [CrossRef]
  32. Goula, A.M.; Kokolaki, M.; Daftsiou, E. Use of Ultrasound for Osmotic Dehydration. The Case of Potatoes. Food Bioprod. Process. 2017, 105, 157–170. [Google Scholar] [CrossRef]
  33. Azarpazhooh, E.; Ramaswamy, H.S. Microwave-Osmotic Dehydration of Apples Under Continuous Flow Medium Spray Conditions: Comparison with Other Methods. Dry. Technol. 2009, 28, 49–56. [Google Scholar] [CrossRef]
  34. Manzoor, A.; Khan, M.A.; Mujeebu, M.A.; Shiekh, R.A. Comparative Study of Microwave Assisted and Conventional Osmotic Dehydration of Apple Cubes at a Constant Temperature. J. Agric. Food Res. 2021, 5, 100176. [Google Scholar] [CrossRef]
  35. An, K.; Fu, M.; Zhang, H.; Tang, D.; Xu, Y.; Xiao, G. Effect of Ethyl Oleate Pretreatment on Blueberry (Vaccinium corymbosum L.): Drying Kinetics, Antioxidant Activity, and Structure of Wax Layer. J. Food Sci. Technol. 2019, 56, 783–791. [Google Scholar] [CrossRef]
  36. Bélafi-Bakó, K.; Cserjési, P.; Beszédes, S.; Csanádi, Z.; Hodúr, C. Berry Pectins: Microwave-Assisted Extraction and Rheological Properties. Food Bioproc. Technol. 2012, 5, 1100–1105. [Google Scholar] [CrossRef]
  37. Ciurzyńska, A.; Lenart, A.; Gręda, K.J. Effect of Pre-Treatment Conditions on Content and Activity of Water and Colour of Freeze-Dried Pumpkin. LWT Food Sci. Technol. 2014, 59, 1075–1081. [Google Scholar] [CrossRef]
  38. Ando, Y.; Okunishi, T.; Okadome, H. Influences of Blanching and Freezing Pretreatments on Moisture Diffusivity and Quality Attributes of Pumpkin Slices During Convective Air-Drying. Food Bioproc. Technol. 2019, 12, 1821–1831. [Google Scholar] [CrossRef]
  39. Layeghinia, N.; Karimi, S.; Abbasi, H.; Silavi, K. Effect of Osmotic Dehydration on Qualitative and Nutritional Characteristics and Kinetics of Microwave Drying of Iranian Quince Slices. J. Agric. Food Res. 2025, 20, 101749. [Google Scholar] [CrossRef]
  40. Eyembe, L.E.; Nde, D.B.; Jean, S. Osmotic Dehydration Kinetics of Plantain (Musa paradisiaca) Using a Low-Calorie Sugar. Discov. Food 2024, 4, 172. [Google Scholar] [CrossRef]
  41. Stojanovic, J.; Silva, J.L. Influence of Osmotic Concentration, Continuous High Frequency Ultrasound and Dehydration on Antioxidants, Colour and Chemical Properties of Rabbiteye Blueberries. Food Chem. 2007, 101, 898–906. [Google Scholar] [CrossRef]
  42. Liu, Y.; Liu, Y.; Tao, C.; Liu, M.; Pan, Y.; Lv, Z. Effect of Temperature and PH on Stability of Anthocyanin Obtained from Blueberry. J. Food Meas. Charact. 2018, 12, 1744–1753. [Google Scholar] [CrossRef]
  43. Lin, Y.-C.; Chou, C.-C. Effect of Heat Treatment on Total Phenolic and Anthocyanin Contents as Well as Antioxidant Activity of the Extract from Aspergillus Awamori-Fermented Black Soybeans, a Healthy Food Ingredient. Int. J. Food Sci. Nutr. 2009, 60, 627–636. [Google Scholar] [CrossRef]
  44. Yue, X.; Xu, Z. Changes of Anthocyanins, Anthocyanidins, and Antioxidant Activity in Bilberry Extract during Dry Heating. J. Food Sci. 2008, 73, C494–C499. [Google Scholar] [CrossRef]
  45. Brownmiller, C.; Howard, L.R.; Prior, R.L. Processing and Storage Effects on Monomeric Anthocyanins, Percent Polymeric Color, and Antioxidant Capacity of Processed Blueberry Products. J. Food Sci. 2008, 73, H72–H79. [Google Scholar] [CrossRef]
  46. Dermesonlouoglou, E.; Chalkia, A.; Dimopoulos, G.; Taoukis, P. Combined Effect of Pulsed Electric Field and Osmotic Dehydration Pre-Treatments on Mass Transfer and Quality of Air Dried Goji Berry. Innov. Food Sci. Emerg. Technol. 2018, 49, 106–115. [Google Scholar] [CrossRef]
  47. Osae, R.; Zhou, C.; Xu, B.; Tchabo, W.; Tahir, H.E.; Mustapha, A.T.; Ma, H. Effects of Ultrasound, Osmotic Dehydration, and Osmosonication Pretreatments on Bioactive Compounds, Chemical Characterization, Enzyme Inactivation, Color, and Antioxidant Activity of Dried Ginger Slices. J. Food Biochem. 2019, 43, e12832. [Google Scholar] [CrossRef]
  48. Chaguri, L.; Sanchez, M.S.; Flammia, V.P.; Tadini, C.C. Green Banana (Musa cavendishii) Osmotic Dehydration by Non-Caloric Solutions: Modeling, Physical-Chemical Properties, Color, and Texture. Food Bioproc. Technol. 2017, 10, 615–629. [Google Scholar] [CrossRef]
  49. Zielinska, M.; Zielinska, D.; Markowski, M. The Effect of Microwave-Vacuum Pretreatment on the Drying Kinetics, Color and the Content of Bioactive Compounds in Osmo-Microwave-Vacuum Dried Cranberries (Vaccinium macrocarpon). Food Bioproc. Technol. 2018, 11, 585–602. [Google Scholar] [CrossRef]
  50. Kutlu, N. Optimization of Ohmic Heating-Assisted Osmotic Dehydration as a Pretreatment for Microwave Drying of Quince. Food Sci. Technol. Int. 2022, 28, 60–71. [Google Scholar] [CrossRef]
Figure 1. The schematic representation of the experimental design conducted for OD of blueberries.
Agriculture 15 01602 g001
Figure 2. Changes in total soluble solids of the osmotic solution during blueberry dehydration at different solid-to-solution ratios: (a) 1:4, (b) 1:7, and (c) 1:10, under varying temperatures and pretreatments. Each data point represents the mean of three replications (n = 3).
Agriculture 15 01602 g002
Figure 3. Changes in total soluble solids in the osmotic solution over time (0–4 h and 4–8 h) at different sample-to-solution ratios: (a) 1:4, (b) 1:7, and (c) 1:10. Treatments with statistically significant differences (p < 0.05) are indicated by different letters.
Agriculture 15 01602 g003
Figure 4. Paired t-test analysis of moisture content and total soluble solids (TSS) in osmotically dehydrated blueberries. (ac) Effects of temperature, solution ratio, and pretreatment on moisture content. (df) Effects of temperature, solution ratio, and pretreatment on TSS content. ** and * indicate significance at 5% and 1% levels; ns: not significant.
Agriculture 15 01602 g004
Figure 5. Mean comparison analysis of water loss percentage in osmotically dehydrated blueberries. (a) Effect of different temperatures. (b) Effect of control and microwave pretreatments. (c) Interaction effect of temperature and pretreatment. Values are expressed as mean ± standard error (n = 3). Different letters indicate statistically significant differences at p < 0.05.
Agriculture 15 01602 g005
Table 1. Paired t-test analysis of moisture content and TSS content (°Brix) of osmotically dehydrated under the interactions of different temperature, solution ratio, and pretreatment conditions.
Treatmentt-Value
Moisture Content (%)TSS content (°Brix)
Room temperature × 1:4 × Control0.72 ns3.24 ns
60 °C × 1:4 × Control2.13 ns2.94 ns
65 °C × 1:4 × Control19.95 **7.45 *
70 °C × 1:4 × Control6.44 *35.92 **
Room temperature × 1:4 × MW1.69 ns1.49 ns
60 °C × 1:4 × MW3.69 ns74 **
65 °C × 1:4 × MW2.98 ns2.97 ns
70 °C × 1:4 × MW4.98 *10.33 **
Room temperature × 1:7 × Control3.66 ns3.42 ns
60 °C × 1:7 × Control18.58 **16.25 **
65 °C × 1:7 × Control7.68 *1.8 ns
70 °C × 1:7 × Control3.81 ns5.5 *
Room temperature × 1:7 × MW14.12 **5.55 *
60 °C × 1:7 × MW2.47 ns3.59 ns
65 °C × 1:7 × MW7.7 *1.59 ns
70 °C × 1:7 × MW17.9 **4.01 ns
Room temperature × 1:10 × Control1.51 ns2.8 ns
60 °C × 1:10 × Control1.68 ns6.18 *
65 °C × 1:10 × Control6.22 *10.29 **
70 °C × 1:10 × Control5.77 *6.7 *
Room temperature × 1:10 × MW3.59 ns1.4 ns
60 °C × 1:10 × MW4.26 ns2.61 ns
65 °C × 1:10 × MW9.74 *3.92 ns
70 °C × 1:10 × MW6.91 *101.67 **
**, * Significant at 1% and 5% probability level, respectively; ns: not significant.
Table 2. Analysis of variance of water loss, solid gain, and quality aspects of osmotic dehydrated blueberry. Three parameters (temperature, ratio, and pretreatment) were explored in a factorial experiment where each of the 24 treatments was replicated three times.
Source of Variationdf aMean Squares
Water LossSolid GainTextureTotal Anthocyanin ContentTotal Phenolic ContentΔE
Temperature34618.97 **138.64 **0.18 ns1543.89 **1563.07 *72.11 **
Ratio238.67 ns13.14 **0.22 ns1540.51 **10660.56 **85.62 **
Pretreatment11330.82 **0.18 ns0.23 ns740.09 **2009.99 *76.54 **
Temperature × Ratio621.19 ns5.41 **0.06 ns1041.76 **4739.91 **32.37 **
Temperature × Pretreatment3308.24 **50.81 **0.19 ns569.64 **967.26 ns122.82 **
Ratio × Pretreatment213.80 ns14.86 **0.33 ns420.00 **1003.92 ns32.83 *
Temperature × Ratio × Pretreatment633.49 ns2.58 **0.11 ns158.95 **4535.67 **57.37 **
Error4819.340.200.205.48446.096.52
Coefficient of Variation (%)17.8510.340.455.566.8633.14
a degree of freedom. **, * Significant at 1% and 5% probability level, respectively; ns: not significant.
Table 3. Paired Student’s t-test analysis of a, b, and L parameters of blueberry color after osmotic dehydration with different levels of temperature, osmotic solution ratio and pretreatment.
Osmotic Dehydration Parameter Color Parameters
abL
TemperatureRoom temperature0.53 ns1.49 ns5.40 **
60 °C5.72 **0.56 ns0.81 ns
65 °C1.01 ns3.52 **0.21 ns
70 °C2.85 *1.15 ns2.71 *
Ratio1:49.78 **3.11 ns0.93 ns
1:72.89 **0.91 ns2.59 *
1:101.26 ns1.08 ns2.15 *
PretreatmentControl3.00 **3.99 **2.11 *
Microwave3.93 **1.00 ns2.73 *
**, * Significant at 1% and 5% probability level, respectively; ns: not significant.
Disclaimer/Publisher’s Note: The statements, opinions and data contained in all publications are solely those of the individual author(s) and contributor(s) and not of MDPI and/or the editor(s). MDPI and/or the editor(s) disclaim responsibility for any injury to people or property resulting from any ideas, methods, instructions or products referred to in the content.

