Article

The Impact of Rural Digital Economy Development on Agricultural Carbon Emission Efficiency: A Study of the N-Shaped Relationship

School of Economics and Management, Beijing Forestry University, No.35, Tsinghua East Road, Haidian District, Beijing 100083, China
*
Author to whom correspondence should be addressed.
Agriculture 2025, 15(15), 1583; https://doi.org/10.3390/agriculture15151583
Submission received: 11 June 2025 / Revised: 20 July 2025 / Accepted: 21 July 2025 / Published: 23 July 2025
(This article belongs to the Section Agricultural Economics, Policies and Rural Management)

Abstract

This study investigates the impact of rural digital economy development on agricultural carbon emission efficiency, aiming to elucidate the intrinsic mechanisms and pathways through which digital technology enables low-carbon transformation in agriculture, thereby contributing to the achievement of agricultural carbon neutrality goals. Based on provincial-level panel data from China spanning 2011 to 2022, this study examines the relationship between the rural digital economy and agricultural carbon emission efficiency, along with its underlying mechanisms, using bidirectional fixed effects models, mediation effect analysis, and Spatial Durbin Models. The results indicate the following: (1) A significant N-shaped-curve relationship exists between rural digital economy development and agricultural carbon emission efficiency. Specifically, agricultural carbon emission efficiency exhibits a three-phase trajectory of “increase, decrease, and renewed increase” as the rural digital economy advances, ultimately driving a sustained improvement in efficiency. (2) Industrial integration acts as a critical mediating mechanism. Rural digital economy development accelerates the formation of the N-shaped curve by promoting the integration between agriculture and other sectors. (3) Spatial spillover effects significantly influence agricultural carbon emission efficiency. Due to geographical proximity, regional diffusion, learning, and demonstration effects, local agricultural carbon emission efficiency fluctuates with changes in neighboring regions’ digital economy development levels. (4) The relationship between rural digital economy development and agricultural carbon emission efficiency exhibits a significant inverted N-shaped pattern in regions with higher marketization levels, planting-dominated areas of southeast China, and digital economy demonstration zones. Further analysis reveals that within rural digital economy development, production digitalization and circulation digitalization demonstrate a more pronounced inverted N-shaped relationship with agricultural carbon emission efficiency. This study proposes strategic recommendations to maximize the positive impact of the rural digital economy on agricultural carbon emission efficiency, unlock its spatially differentiated contribution potential, identify and leverage inflection points of the N-shaped relationship between digital economy development and emission efficiency, and implement tailored policy portfolios—ultimately facilitating agriculture’s green and low-carbon transition.

1. Introduction

Agriculture serves as a critical pillar of the global economic system, playing a vital role in ensuring food security, particularly in developing countries. However, agricultural development poses multifaceted threats to the global environment, including greenhouse gas emissions, water pollution and depletion, soil contamination and degradation, and biodiversity loss, presenting significant challenges to achieving the UN Sustainable Development Goals [1]. In recent years, China has witnessed a continuous expansion in agricultural production, achieving twenty-one consecutive harvests of grain output. Notably, the country’s total grain production reached 706.5 million tons in 2024, making substantial contributions to national food security. Nevertheless, this high-yield paradigm remains characterized by high-input and high-pollution conventional practices [2,3]. Agricultural production is inherently dependent on natural resources and climatic conditions, while ecological deterioration conversely impacts crop yields and product quality. Although the Chinese government has implemented policies to strengthen ecological restoration and promote the agricultural green transition, the persistence of conventional production methods continues to impose substantial constraints, maintaining significant pressure on low-carbon agricultural development [4]. Therefore, it is imperative to extend and refine the analytical framework for conventional agriculture, simultaneously pursuing the dual objectives of maximizing economic output and minimizing carbon emissions. This approach is essential for enhancing agricultural carbon emission efficiency and advancing the green and low-carbon transformation of the sector.
In recent years, the digital economy has developed rapidly, becoming a core driver of economic growth and industrial transformation globally, and agriculture is no exception. In China, alongside the vigorous development of the rural digital economy, its intrinsic goals and logic align closely with improving agricultural carbon emission efficiency. On the one hand, the development of the rural digital economy needs to be oriented towards agricultural low-carbon goals, driving the green transformation of agricultural production methods. On the other hand, enhancing agricultural carbon emission efficiency also relies on the support and empowerment of digital technologies; the integrated development of the two is mutually reinforcing [5]. The rural digital economy empowers the entire agricultural production chain through digitalization. By enabling precision-driven and intelligent production processes, it significantly enhances the resource utilization efficiency and serves as a key driver for carbon emission reduction within agricultural production.
Current research on agricultural carbon emission efficiency primarily focuses on the following aspects: Firstly, analyses of the spatiotemporal evolution characteristics of agricultural carbon emission efficiency. These studies specifically examine these characteristics at the national level (Zhao et al., 2024) [6], regional level (Zhang et al., 2023; Zhang et al., 2022) [7,8], and provincial level (Li et al., 2021; Wang et al., 2019; Guo et al., 2022) [9,10,11], aiming to identify the underlying influencing factors behind the observed patterns. Secondly, investigations into the coupling relationships between agricultural carbon emission efficiency and relevant variables. Examples include exploring the coupling relationships between agricultural carbon emission efficiency and economic growth (Yang et al., 2025) [12], urbanization (Wen et al., 2024) [13], agricultural modernization (Xia et al., 2022) [14], and food security (Liu et al., 2024) [15]. This research aims to promote coordinated development among these factors and facilitate rational resource utilization. Thirdly, empirical analyses of the influencing factors of agricultural carbon emission efficiency. For instance, Liu et al. (2022) [16] investigated the impact of digital economic development on agricultural carbon emission efficiency. Li et al. (2024) [17] and Yao et al. (2024) [18] analyzed the impact mechanisms of agricultural productive services on agricultural carbon emission efficiency. Liu et al. (2023) [19] examined the influence of agricultural technological progress on agricultural carbon emission efficiency. Furthermore, studies by Yu et al. (2022) [20] and Rao et al. (2022) [21], among others, focused on the effect of farmers’ internet use on agricultural carbon emission efficiency.
The existing research has rarely examined the impact of rural digital economy development on agricultural carbon emission efficiency within rural contexts. Furthermore, studies predominantly focus on linear relationships in agricultural carbon emissions, lacking a dynamic evolutionary perspective. This gap has hindered the identification of nonlinear interactions between rural digital economy development and agricultural carbon emission efficiency. This study moves beyond the simplistic paradigm of linear suppression or promotion relationships to reveal complex nonlinear dynamics. We address two core issues: (1) Long-term dynamic relationship: How does the rural digital economy development influence agricultural carbon emission efficiency, and what dynamic patterns characterize their interactions over time? (2) Underlying mechanisms and spatial effects: What potential mechanisms drive this relationship, and what spatial spillover effects might emerge? Investigating these questions will elucidate the intricate nonlinear nexus between digital economy development and agricultural carbon emissions. The findings will provide a theoretical foundation for identifying inflection points in nonlinear relationships and capturing multi-stage evolutionary characteristics. Ultimately, this research aims to enhance the alignment of policy design and its adjustment with practical developmental trajectories.

2. Theoretical Analysis and Research Hypothesis

2.1. Impact of Rural Digital Economy Development on Agricultural Carbon Emission Efficiency

With the acceleration of the rural digital economy development, data elements, digital technologies, and tools have emerged as critical factors of production, permeating the entire agricultural production process and influencing both agricultural outputs and carbon emissions. During the rapid expansion phase of the rural digital economy, improvements in digital infrastructure enable agricultural producers to leverage cloud computing, big data, and information technologies to optimize production layouts, select suitable crops and cultivation models, and formulate optimal production plans. Furthermore, technologies such as the Internet of Things (IoT) and remote sensing facilitate the monitoring of soil conditions, climate data, and crop growth to carry out precise fertilization, irrigation, and pesticide spraying as needed, mitigating the overuse of agricultural inputs. Consequently, carbon emissions associated with the production and application of fertilizers and pesticides are reduced, alongside a decrease in resource wastage. This approach achieves efficient resource allocation and the refined management of agricultural production processes [22,23], thereby minimizing unnecessary energy inputs and the consumption of agricultural materials and further lowering carbon emissions. In livestock farming, precision livestock farming systems adjust feed formulations based on the growth stage and weight of animals, enhancing feed utilization efficiency and reducing methane emissions from manure. Under the influence of the digital dividend, digital tools effectively optimize production processes, eliminate redundant operations, and shorten operational times. Digital platforms assist farmers in making improved production decisions by providing market information, weather alerts, and technical guidance, thereby reducing resource waste and additional carbon emissions stemming from information asymmetry or suboptimal decisions [24]. It is noteworthy that, at this stage, the scope and depth of the adoption of digital technology remain limited. The carbon emissions generated by digital infrastructure are relatively low and have not yet surpassed the carbon reduction benefits derived from the application of these technologies.
During the large-scale development phase of the rural digital economy, digital tools and methodologies have been widely adopted. However, the concomitant promotion of agricultural mechanization, the proliferation of smart devices, and the increased use of energy-intensive equipment contribute to a notable carbonization effect during this stage. This effect tends to decelerate the pace of the improvement of agricultural carbon emission efficiency [25]. While the advancement of digital technologies enhances agricultural production efficiency and reduces unit production costs, it may concurrently stimulate the expansion of the production scale. This expansion in total output may offset the carbon reduction benefits achieved through unit efficiency gains, potentially even triggering a rebound effect. Furthermore, the rapid iteration of digital technologies, coupled with a shortage of skilled IT personnel and an insufficient knowledge base among agricultural producers, increases the cost and complexity of adopting these technologies. These barriers impede the full realization of digital tools’ potential to enhance quality and efficiency within agricultural production processes. Additionally, the application of digital technologies exhibits a threshold effect; significant disparities exist in the capability and extent of digital technology adoption across different regions and among various agricultural producers. In certain areas, this uneven adoption may inadvertently lead to increased agricultural carbon emissions [19], consequently diminishing overall agricultural carbon emission efficiency.
During the in-depth development phase of the rural digital economy, its deep integration with agricultural production processes has been achieved. As the compatibility between production factors and digital economic development improves, technological innovation—following trade-offs between cyclical and adaptive costs—ultimately dominates multi-channel collaboration, resulting in net carbon emission reduction. The in-depth empowerment of agricultural production by artificial intelligence and big data is conducive to achieving minimized input and carbon emission prediction management in complex scenarios, and transforming “carbon sources” into “carbon sinks” [26]. The growing adaptability of digitally skilled personnel and their increased proficiency in applying digital tools and technologies enable technical adjustments and breakthroughs; this elevates production efficiency beyond previous thresholds while reducing undesirable agricultural outputs. Furthermore, under well-established and effectively enforced institutional frameworks—such as ecological conservation redlines and total quantity controls—the synergy of institutional constraints and technological optimization effectively curbs excessive-scale expansion driven solely by efficiency gains. This balance ensures both agricultural productivity and ecological benefits. Consequently, driven by the dual forces of increased desirable agricultural output and decreased undesirable output, agricultural carbon emission efficiency demonstrates a significant upward trajectory. Therefore, this study proposes the first hypothesis.
Hypothesis 1 (H1).
The impact of rural digital economy development on agricultural carbon emission efficiency exhibits a nonlinear “N-shaped” relationship.

2.2. Influence Mechanism of Rural Digital Economy Development on Agricultural Carbon Emission Efficiency

The development of the rural digital economy drives agricultural industrial convergence. In the digital era, data itself possesses significant value and becomes a key factor of production, akin to traditional land, labor, and capital. A major driver of agricultural industrial convergence is the flow and sharing of data across different industries. The establishment of digital platforms is crucial for breaking down information and data silos between industries, accelerating the pace of industrial convergence. Furthermore, the development of the digital economy blurs traditional industrial boundaries, making the distinctions between traditional and modern industries less distinct. This further promotes cross-industry activities, enhances resource sharing and collaborative cooperation among industries, and drives agricultural industrial integration and upgrading [27,28].
Initial stage of agricultural industrial convergence: The initial phase of industrial convergence is primarily characterized by the reduction in barriers to factor mobility and the introduction of new knowledge and technologies. Synergistic integration between agriculture and other sectors begins to advance, blurring traditional industrial boundaries. This facilitates the freer flow and allocation of production factors—such as capital, labor, and technology—both within and across industries. Consequently, it creates broader application opportunities for low-carbon technologies, green innovation, and information services. Furthermore, the enhanced inter- and intra-industry communication and cooperation fostered by convergence facilitate the adoption of novel production methods and technologies. This optimizes agricultural production processes and enhances agricultural productivity. During this phase, certain high-carbon industries and production practices are gradually phased out and replaced. Concurrently, new low-carbon agricultural industries emerge, such as eco-agriculture and agritourism. These not only increase farmers’ income but also help mitigate the rise in carbon emissions associated with excessive agricultural expansion, thereby improving agricultural carbon emission efficiency.
Deepening convergence and challenges: With the accelerated expansion of the rural digital economy and the deepening of agricultural industrial convergence, new challenges emerge. Firstly, the increasing concentration and rapid scaling-up of agricultural production can lead to a deviation from the optimal combination of production factors. The rate of increase in carbon emissions driven by scale expansion may surpass the growth rate of the output. This can offset the carbon reduction effects achieved through technological applications, creating a “Green Paradox” that ultimately reduces the agricultural carbon emission efficiency [29]. Secondly, the extension of agricultural value chains and the multiplication of production and processing stages increase complexity. This often results in management inefficiencies, coordination difficulties, and other manifestations of diseconomies of scale. Consequently, resources are not optimally allocated, leading to implicit wastage. Additionally, the inherent complexity of coordinating extended agricultural value chains and the persistence of path dependency may contribute to slower progress in achieving agricultural carbon emission reductions.
The advancement of the rural digital economy signifies that agricultural industrial convergence has entered a more mature and systematic phase. During this stage, agricultural production becomes more closely integrated with capital and technology, while the extension of agricultural value chains and the diversification of functions generate significant spillover effects. On one hand, the convergence of primary, secondary, and tertiary industries expand the horizontal scale and vertical extension of agricultural sectors, thereby increasing the return on agricultural investments. This synergy facilitates the seamless coordination and sharing of production factors across industries, achieving a Pareto improvement in resource allocation. Consequently, agricultural productivity and expected output rise [30]. On the other hand, agricultural industrial convergence accelerates agricultural green transition through intra-industry restructuring and cross-sectoral integration. Specifically, it leverages agriculture’s multifunctional value—optimizing land-use structures and enhancing ecological, cultural, and tourism services—while catalyzing new business models and operational paradigms. Mature market mechanisms and institutional frameworks further strengthen stakeholders’ commitment to low-carbon practices, steering agricultural development toward sustainability. By simultaneously boosting the expected output and reducing the undesired byproducts, this dual-driver mechanism elevates agricultural carbon emission efficiency. Therefore, the second hypothesis is proposed.
Hypothesis 2 (H2).
Rural digital economy development influences agricultural carbon emission efficiency by promoting agricultural industrial convergence.

2.3. Spatial Spillover Effects of Rural Digital Economy Development on Agricultural Carbon Emission Efficiency

Analyzing the impact of the rural digital economy on agricultural carbon emission efficiency requires consideration not only of the direct effects on local efficiency but also of the spatial spillover effects on neighboring regions. The spatial spillover effects of rural digital economy development on agricultural carbon emission efficiency primarily operate through the following mechanisms:
Firstly, the diffusion effect. The development of the digital economy overcomes geographical distance constraints. Leveraging various digital platforms, it facilitates the cross-spatiotemporal flow of production factors, enhancing the connectivity and sharing of knowledge, information, technologies, and human capital. The dissemination and diffusion of factors across different regions enhance the feasibility and convenience of inter-regional technological collaboration. This significantly mitigates the weakening of technology spillover effects caused by spatiotemporal distance constraints [31]. Consequently, it not only benefits local agricultural green and low-carbon development but also creates favorable conditions for similar development in neighboring regions.
Secondly, the learning and demonstration effect. New concepts and technologies brought about by digital economic development establish regions with advanced rural digital economies as hubs for digital technology applications. On the one hand, the rich experience, knowledge, and technical expertise accumulated by agricultural stakeholders in these regions generate substantial economic and social benefits. This success exerts a stimulating effect and demonstration effect on the surrounding areas, motivating them to adopt proactive measures to enhance the local agricultural carbon emission efficiency. On the other hand, during interregional cooperation and exchange, regions with advanced digital economies promote the dissemination and diffusion of knowledge and technologies through mechanisms such as personnel mobility, technical exchanges, training, and market transactions [32], thereby generating spatial spillover effects on changes in agricultural carbon emission efficiency in adjacent regions. Consequently, the third hypothesis is proposed.
Hypothesis 3 (H3).
The influence of rural digital economy development on agricultural carbon emission efficiency exhibits spatial spillover effects.
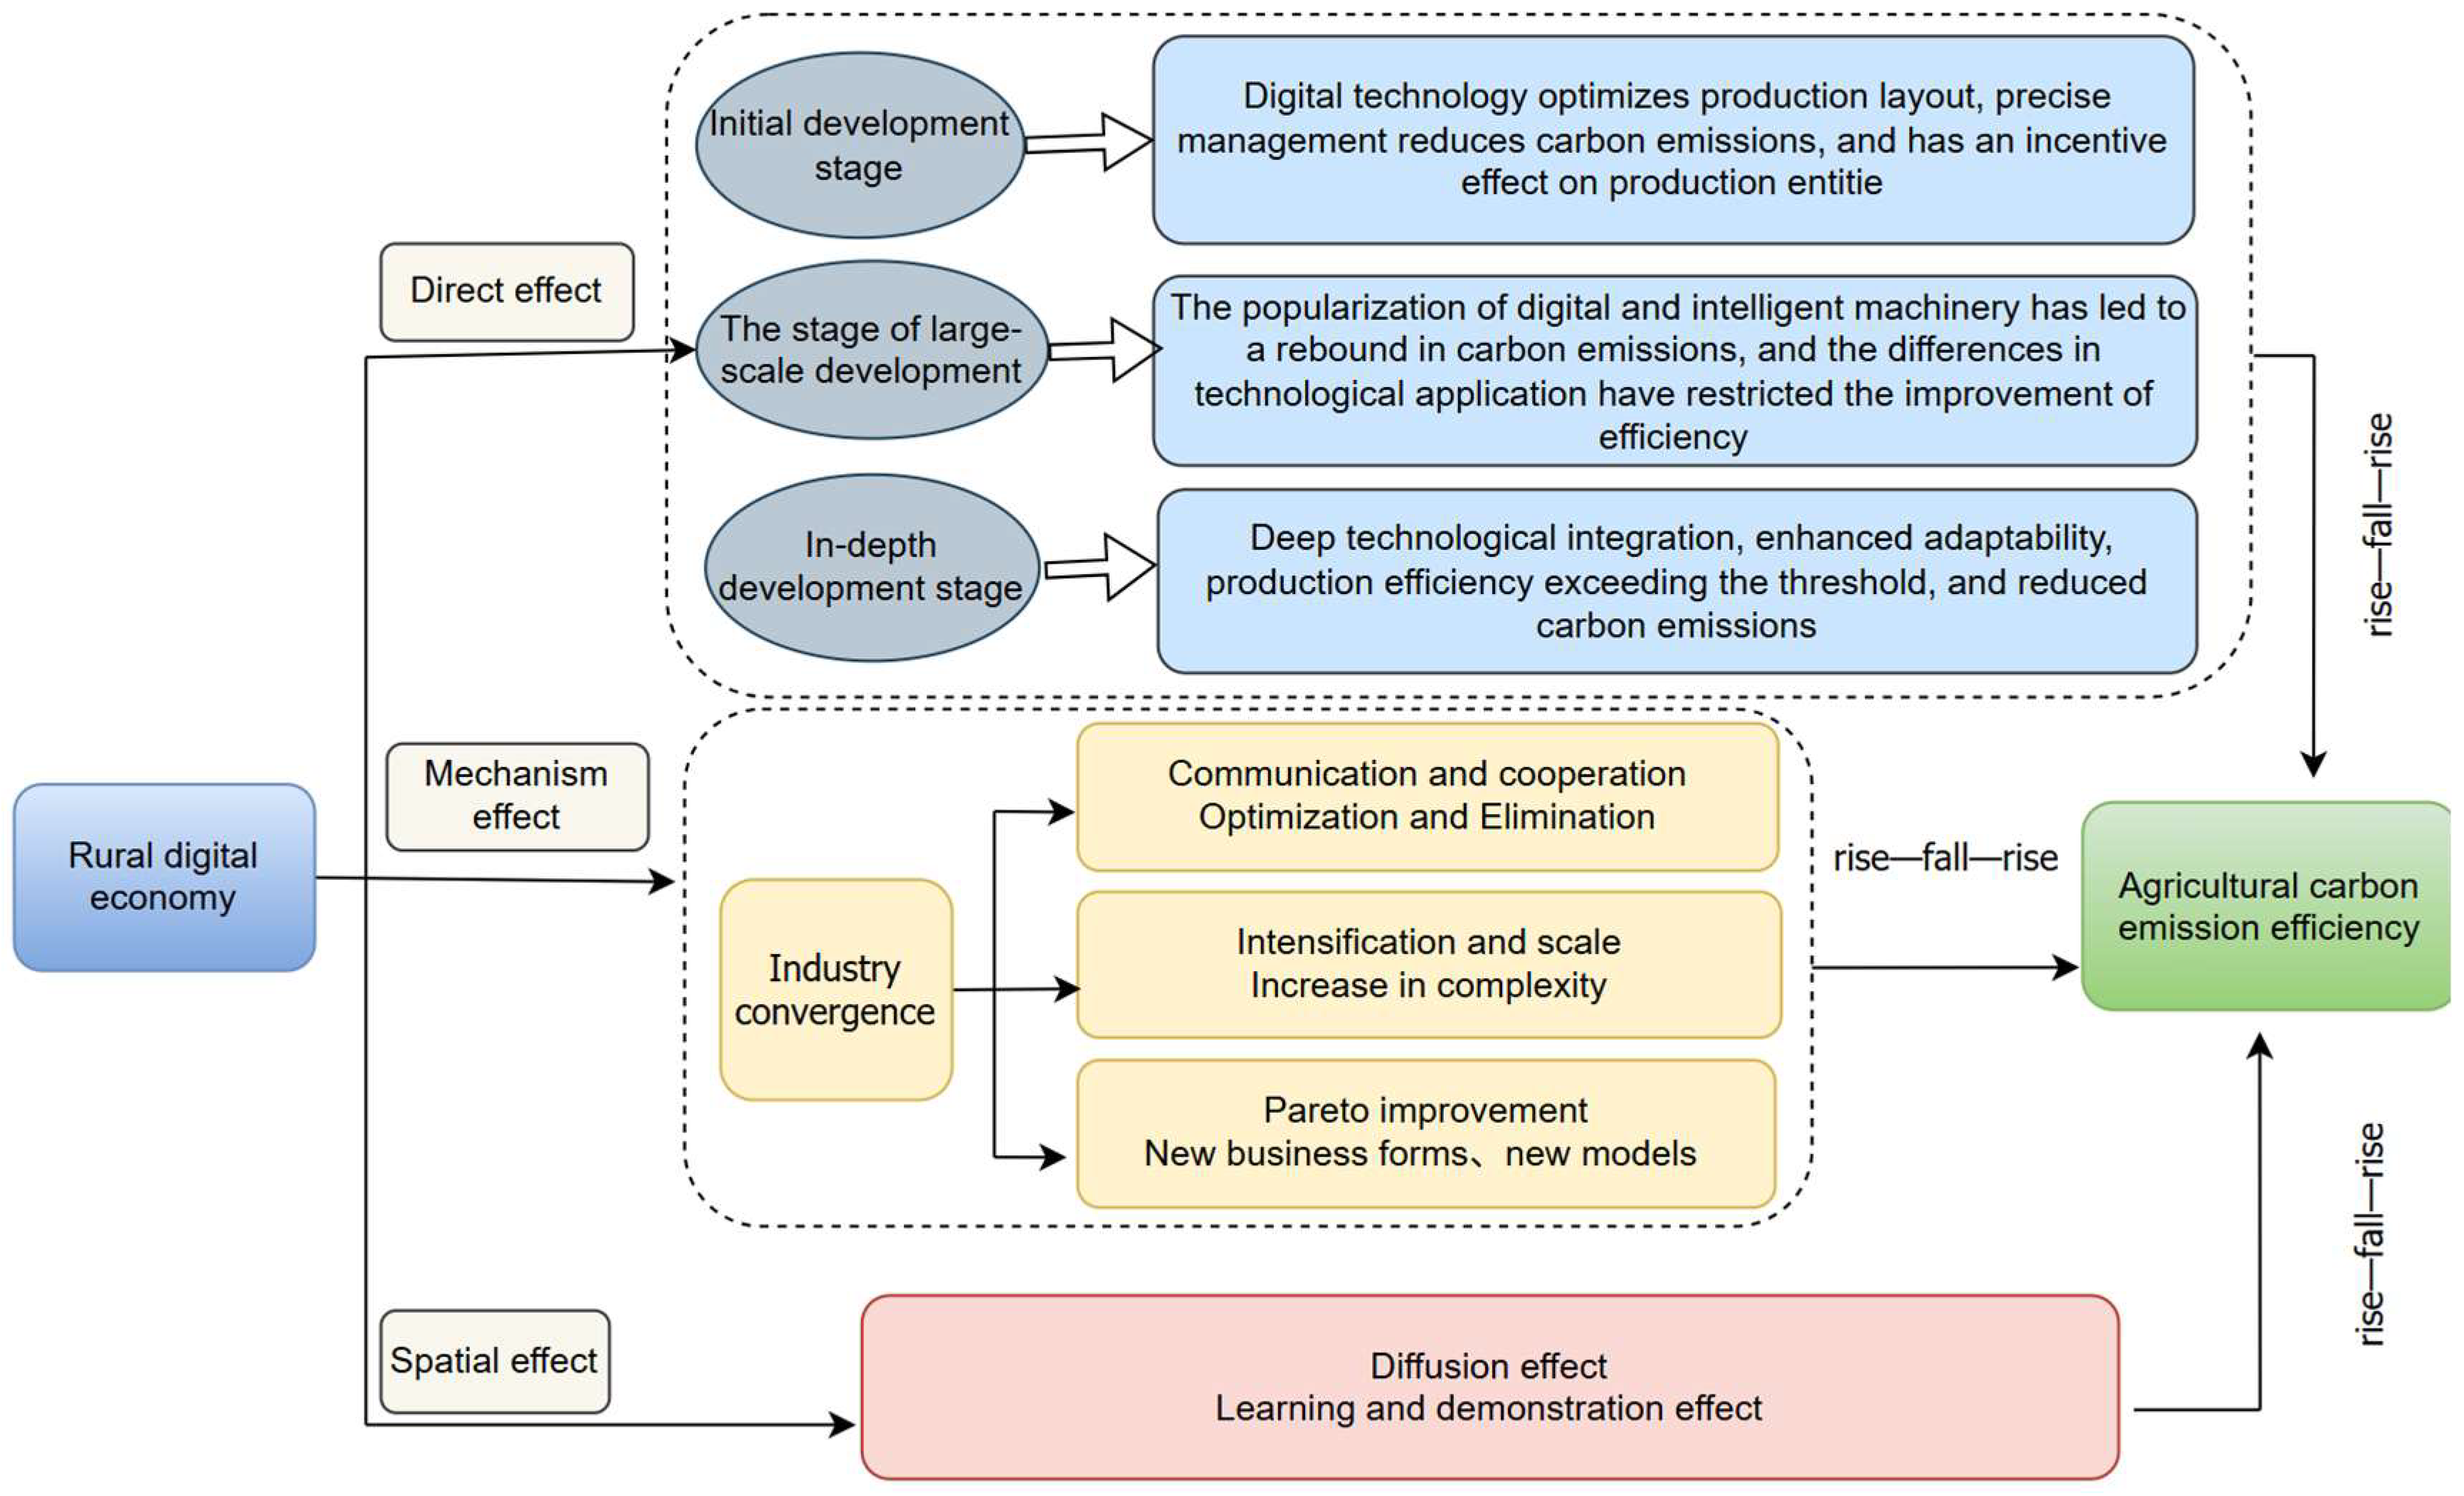
Based on the above theoretical analysis, this paper constructs a mechanism diagram of the impact of rural digital economy development on agricultural carbon emission efficiency, as shown in Figure 1.

3. Methods and Data

3.1. Model Settings

3.1.1. Benchmark Regression Model

This paper adopts bidirectional fixed effects models for analysis. The benchmark model is as follows:
A C E E i t = β 0 + β 1 R D E i t + β 2 R D E i t 2 + β 3 R D E i t 3 + φ k X i t + μ i + μ t + ε i t
where A C E E represents agricultural carbon emission efficiency, R D E   denotes the development level of the rural digital economy, and X represents the vector of the control variables. The subscripts i and t denote province and time, respectively. The terms β m (m = 0, 1, 2, 3) and φ k are the regression coefficients for the constant term, explanatory variables, and control variables, respectively. The terms μ i and   μ t denote province and time fixed effects, respectively, and ε i t is the random error term. A benchmark regression model is employed to analyze the relationship between rural digital economy development and agricultural carbon emission efficiency, thereby testing Hypothesis 1 (H1).

3.1.2. Mediation Effect Model

M i t = b 0 + b 1 R D E i t + b 2 X i t + μ i + μ t + ε i t
A C E E i t = c 0 + c 1 R D E i t + c 2 M i t + c 2 X i t + μ i + μ t + ε i t
To examine the mediating transmission mechanism through which the rural digital economy affects agricultural carbon emission efficiency, and following the approach of Jiang (2022) [33], a “two-step” mediation effect test model was constructed. Let M denote the mediator variable (in this paper, agricultural industrial convergence serves as the intermediary variable). The terms b 0 and c 0 represent the estimated constant terms; b 1 and c 1   denote the estimated coefficients of the core explanatory variable, respectively; b 2 and c 2 represent the coefficients of the control variables; and the meanings of the remaining symbols are consistent with those defined previously. This model examines the mediating role of rural industrial integration in the relationship between rural digital economy development and agricultural carbon emission efficiency, thereby unveiling the “black box” mechanism of the N-shaped relationship and testing Hypothesis 2 (H2).

3.1.3. Spatial Econometric Model

To analyze the spatial effects of the rural digital economy on agricultural carbon emission efficiency, this study first measured the spatial autocorrelation of agricultural carbon emission efficiency using the Global Moran’s I index. Its formula is presented in Equation (4):
I = n n = 1 n j = 1 n w i j A C E E i A C E E ¯ ( A C E E j A C E E ¯ ) i = 1 n j = 1 n W i j i = 1 n ( A C E E i A C E E ¯ ) 2
where I is the Global Moran’s I index; W i j denotes the spatial weight matrix (this study employs a contiguity matrix); A C E E i   ,   A C E E j represent the ACEE values for spatial units i ,   j respectively; and     A C E E ¯ is the mean value of A C E E .
Subsequently, drawing on the methodology of Lee & Yu (2016) [34], a Spatial Durbin Model (SDM) was constructed for analysis. The specific model is specified as follows:
A C E E i t = β 0 + ρ j = 1 n W i j A C E E i t + β 1 R D E i t + β 2 R D E i t 2 + β 3 R D E i t 3 + δ 1 j = 1 n W i j R D E i t + + δ 2 j = 1 n W i j R D E i t 2 + δ 3 j = 1 n W i j R D E i t 3 + φ k X i t + δ 4 j = 1 n W i j X i t + μ i + μ t + ε i t
where β m (m = 0, 1, 2, 3) and δ m (m = 0, 1, 2, 3, 4) are the regression coefficients for the constant term and the corresponding variables, ρ is the spatial autoregressive coefficient, and the meanings of the remaining symbols are consistent with those defined previously. Spatial econometric models are adopted to examine the spatiotemporal linkage between rural digital economy development and agricultural carbon emission efficiency, thus testing Hypothesis 3 (H3).

3.2. Variable Selection and Measurement

3.2.1. Dependent Variable: Agricultural Carbon Emission Efficiency (ACEE)

Drawing on the study by Jiang et al. (2025) [35], this study constructs an evaluation index system for agricultural carbon emission efficiency from two dimensions: “input–output”. The input indicators primarily include the following: agricultural fixed capital stock, number of employees in the primary sector, crop planting area, fertilizer application amount, pesticide usage, agricultural plastic film usage, and agricultural machinery input. Within the output indicators, the desired output is the gross output value of agriculture, forestry, animal husbandry, and fishery, while the undesired output is agricultural carbon emissions [36,37]. The specific indicators are presented in Table 1.
Among these, the agricultural fixed capital stock was calculated using the perpetual inventory method [38]. For the undesirable output of agricultural carbon emissions, this study adopted a relatively broad measurement scope by integrating multiple sources, moving beyond a single-perspective approach. This comprehensive measure includes emissions from agricultural material inputs, agricultural energy consumption, rice cultivation, and livestock breeding, based on the methodologies from Zheng & Maharjan (2024) [39] and Wen et al. (2022) [40]. Specifically, for agricultural materials, emissions from the three main categories—fertilizers, pesticides, and agricultural films—were calculated based on their actual annual usage. Regarding agricultural energy, emissions resulting from diesel fuel consumption, tillage, and irrigation processes were calculated using the actual annual consumption of diesel and the actual sown area for the year, respectively. In rice cultivation, methane (CH4) emissions during production were estimated based on the annual planting area, with a median value of 130 days applied to account for varying growth cycles [41]. For livestock breeding, greenhouse gas emissions, primarily of methane (CH4), from enteric fermentation and manure management, were estimated for the three major livestock types (pigs, cattle, and sheep) using year-end inventory data adjusted according to Huang et al. (2019) [42]. For the convenience of analysis, in this paper, methane, nitrous oxide, etc., are uniformly converted into the corresponding carbon dioxide standards (according to the Fourth Assessment report of the IPCC, the conversion factors for 1 ton of CH4 and N2O are 25 tons and 298 tons of CO2, respectively). The measurement formula for the total agricultural carbon emissions is C i t = C c i t = T c × δ c . The various carbon source factors and their corresponding carbon emission coefficients are shown in Table 2.
This study employed the Super-Efficiency Slack-Based Measure (Super-SBM) model to measure agricultural carbon emission efficiency [47]. This method overcomes the limitations of traditional DEA approaches, which neglect input variables and inadequately address slack variables, while enabling the further decomposition of efficient decision-making units (DMUs) with an efficiency score of 1. Consequently, it facilitates comparisons among efficient DMUs. The model is formulatormulated as follows:
s . t . m i n ρ = 1 m i = 1 m x ¯ x i k 1 r 1 + r 2 ( s = 1 r 1 y d y s k d + q = 1 r 2 y ¯ u y q k u ) x ¯ j = 1 , k n x i j λ j ; y ¯ d j = 1 , k n y s j d λ j ;   y ¯ d j = 1 , k n y q j d λ j ;   x ¯ x k ;   y ¯ d y k d ; y ¯ u y k u ; λ j 0 ;   i = 1 , 2 , , m ;   j = 1 , 2 , , n ;   s = 1 , 2 , , r 1 ;   q = 1 , 2 , , r 2
where ρ   denotes the agricultural carbon emission efficiency; n is the number of decision-making units (DMUs); m represents the number of inputs; r 1 and r 2 denote the quantities of desirable outputs and undesirable outputs, respectively; and x , y d ,   a n d   y u are elements of the input matrix, desirable output matrix, and undesirable output matrix, respectively.

3.2.2. Core Explanatory Variable: Rural Digital Economy Development Level (RDE)

Drawing on the methodologies of Jiang et al. (2022) [48], Zhang et al. (2024) [49], and Chen (2025) [50], this study constructs a comprehensive evaluation index system for rural digital economy development. The system encompasses four dimensions: rural digital infrastructure construction, digitalization of agricultural production, digitalization of rural circulation, and digitalization of rural livelihoods, comprising 16 specific indicators. As detailed in Table 3, all indicators are positive except for the rural postal and telecommunications service level, which is negative. The composite RDE index was quantified using the entropy weight method. Due to space constraints, no detailed elaboration on the entropy weight methodology is provided here.

3.2.3. Mechanism Variable

Agricultural industrial convergence (CON): To measure agricultural industrial convergence, this study constructs a comprehensive Agricultural Industrial Convergence Development Index. Drawing upon the conceptual definition of agricultural industrial convergence and the relevant literature [51], and considering data availability and comparability, the index incorporates eight specific indicators across five key dimensions: agricultural value chain extension, agricultural multifunctionality, the development of new business models, the agricultural technology penetration rate, and the improvement of benefit-sharing mechanisms [52]. The specific indicators comprising the index are detailed in Table 4.

3.2.4. Control Variables

Following existing studies, this study selected the following control variables: (1) Rural living standard (CPI): Measured by the natural logarithm of per capita disposable income. (2) Environmental regulation intensity [53] (ER): Quantified as the proportion of environmental pollution control investment to the GDP. (3) Financial support for agriculture (FSA): Represented by the share of expenditures on agricultural, forestry, and water affairs in the total fiscal expenditure [22]. (4) Agricultural disaster rate (ADR): Calculated as the ratio of affected crop area to the total planted crop area [23]. (5) Urbanization rate (UR): Expressed as the percentage of the urban population relative to the total population [54]. (6) Rural human capital level (EDU): Measured using average years of education among the rural population [55].

3.3. Data Sources

This study examined data from 30 Chinese provinces (excluding Tibet, Hong Kong, Macao, and Taiwan) spanning the period 2011–2022. The primary data sources included the China Statistical Yearbook, China Rural Statistical Yearbook, China Fixed Assets Investment Statistical Yearbook, China Social Statistical Yearbook, reports from the Ali Research Institute, the Peking University Digital Financial Inclusion Index, and relevant research reports. Missing values were addressed through interpolation. To eliminate price distortions, enhance measurement accuracy, and ensure longitudinal comparability, all price-related variables (e.g., gross output value of agriculture, forestry, animal husbandry, and fishery; regional GDP; and rural retail sales) were deflated to constant 2011 prices using corresponding price indices. Descriptive statistics for all variables are presented in Table 5.

4. Empirical Analysis of the Impact of Rural Digital Economy Development on Agricultural Carbon Emission Efficiency

4.1. Analysis of Spatiotemporal Evolution Characteristics of Agricultural Carbon Emissions

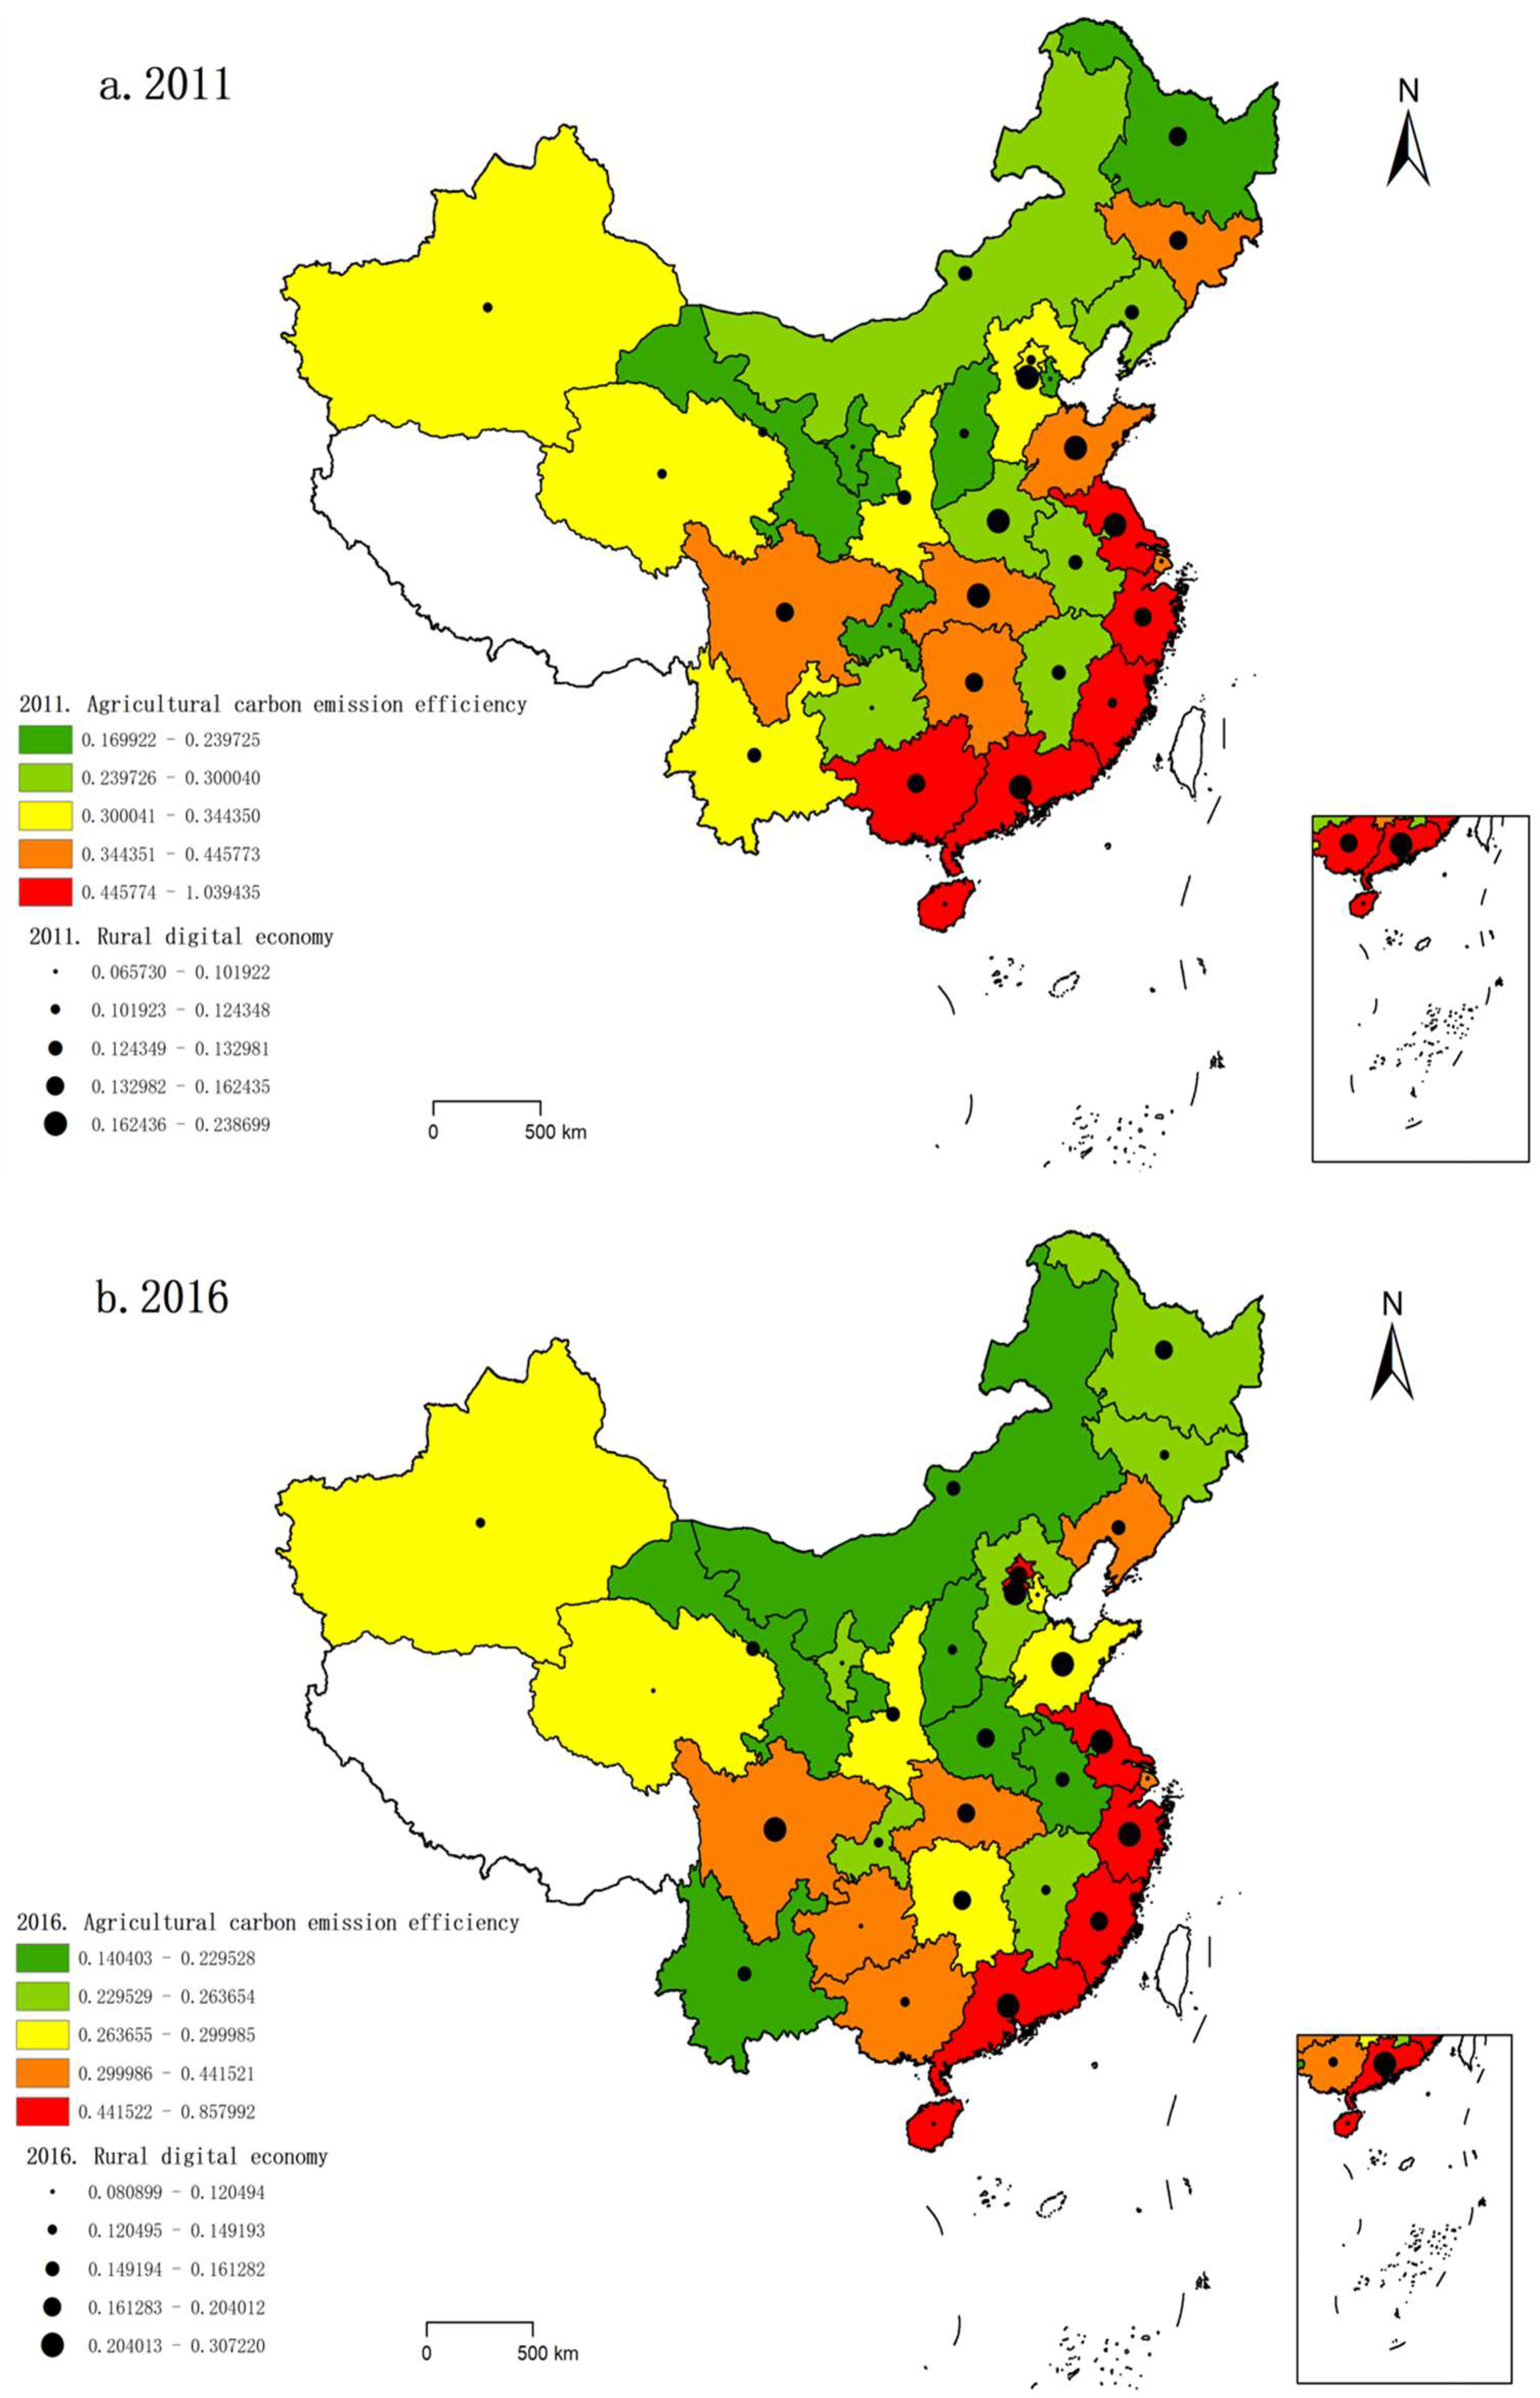
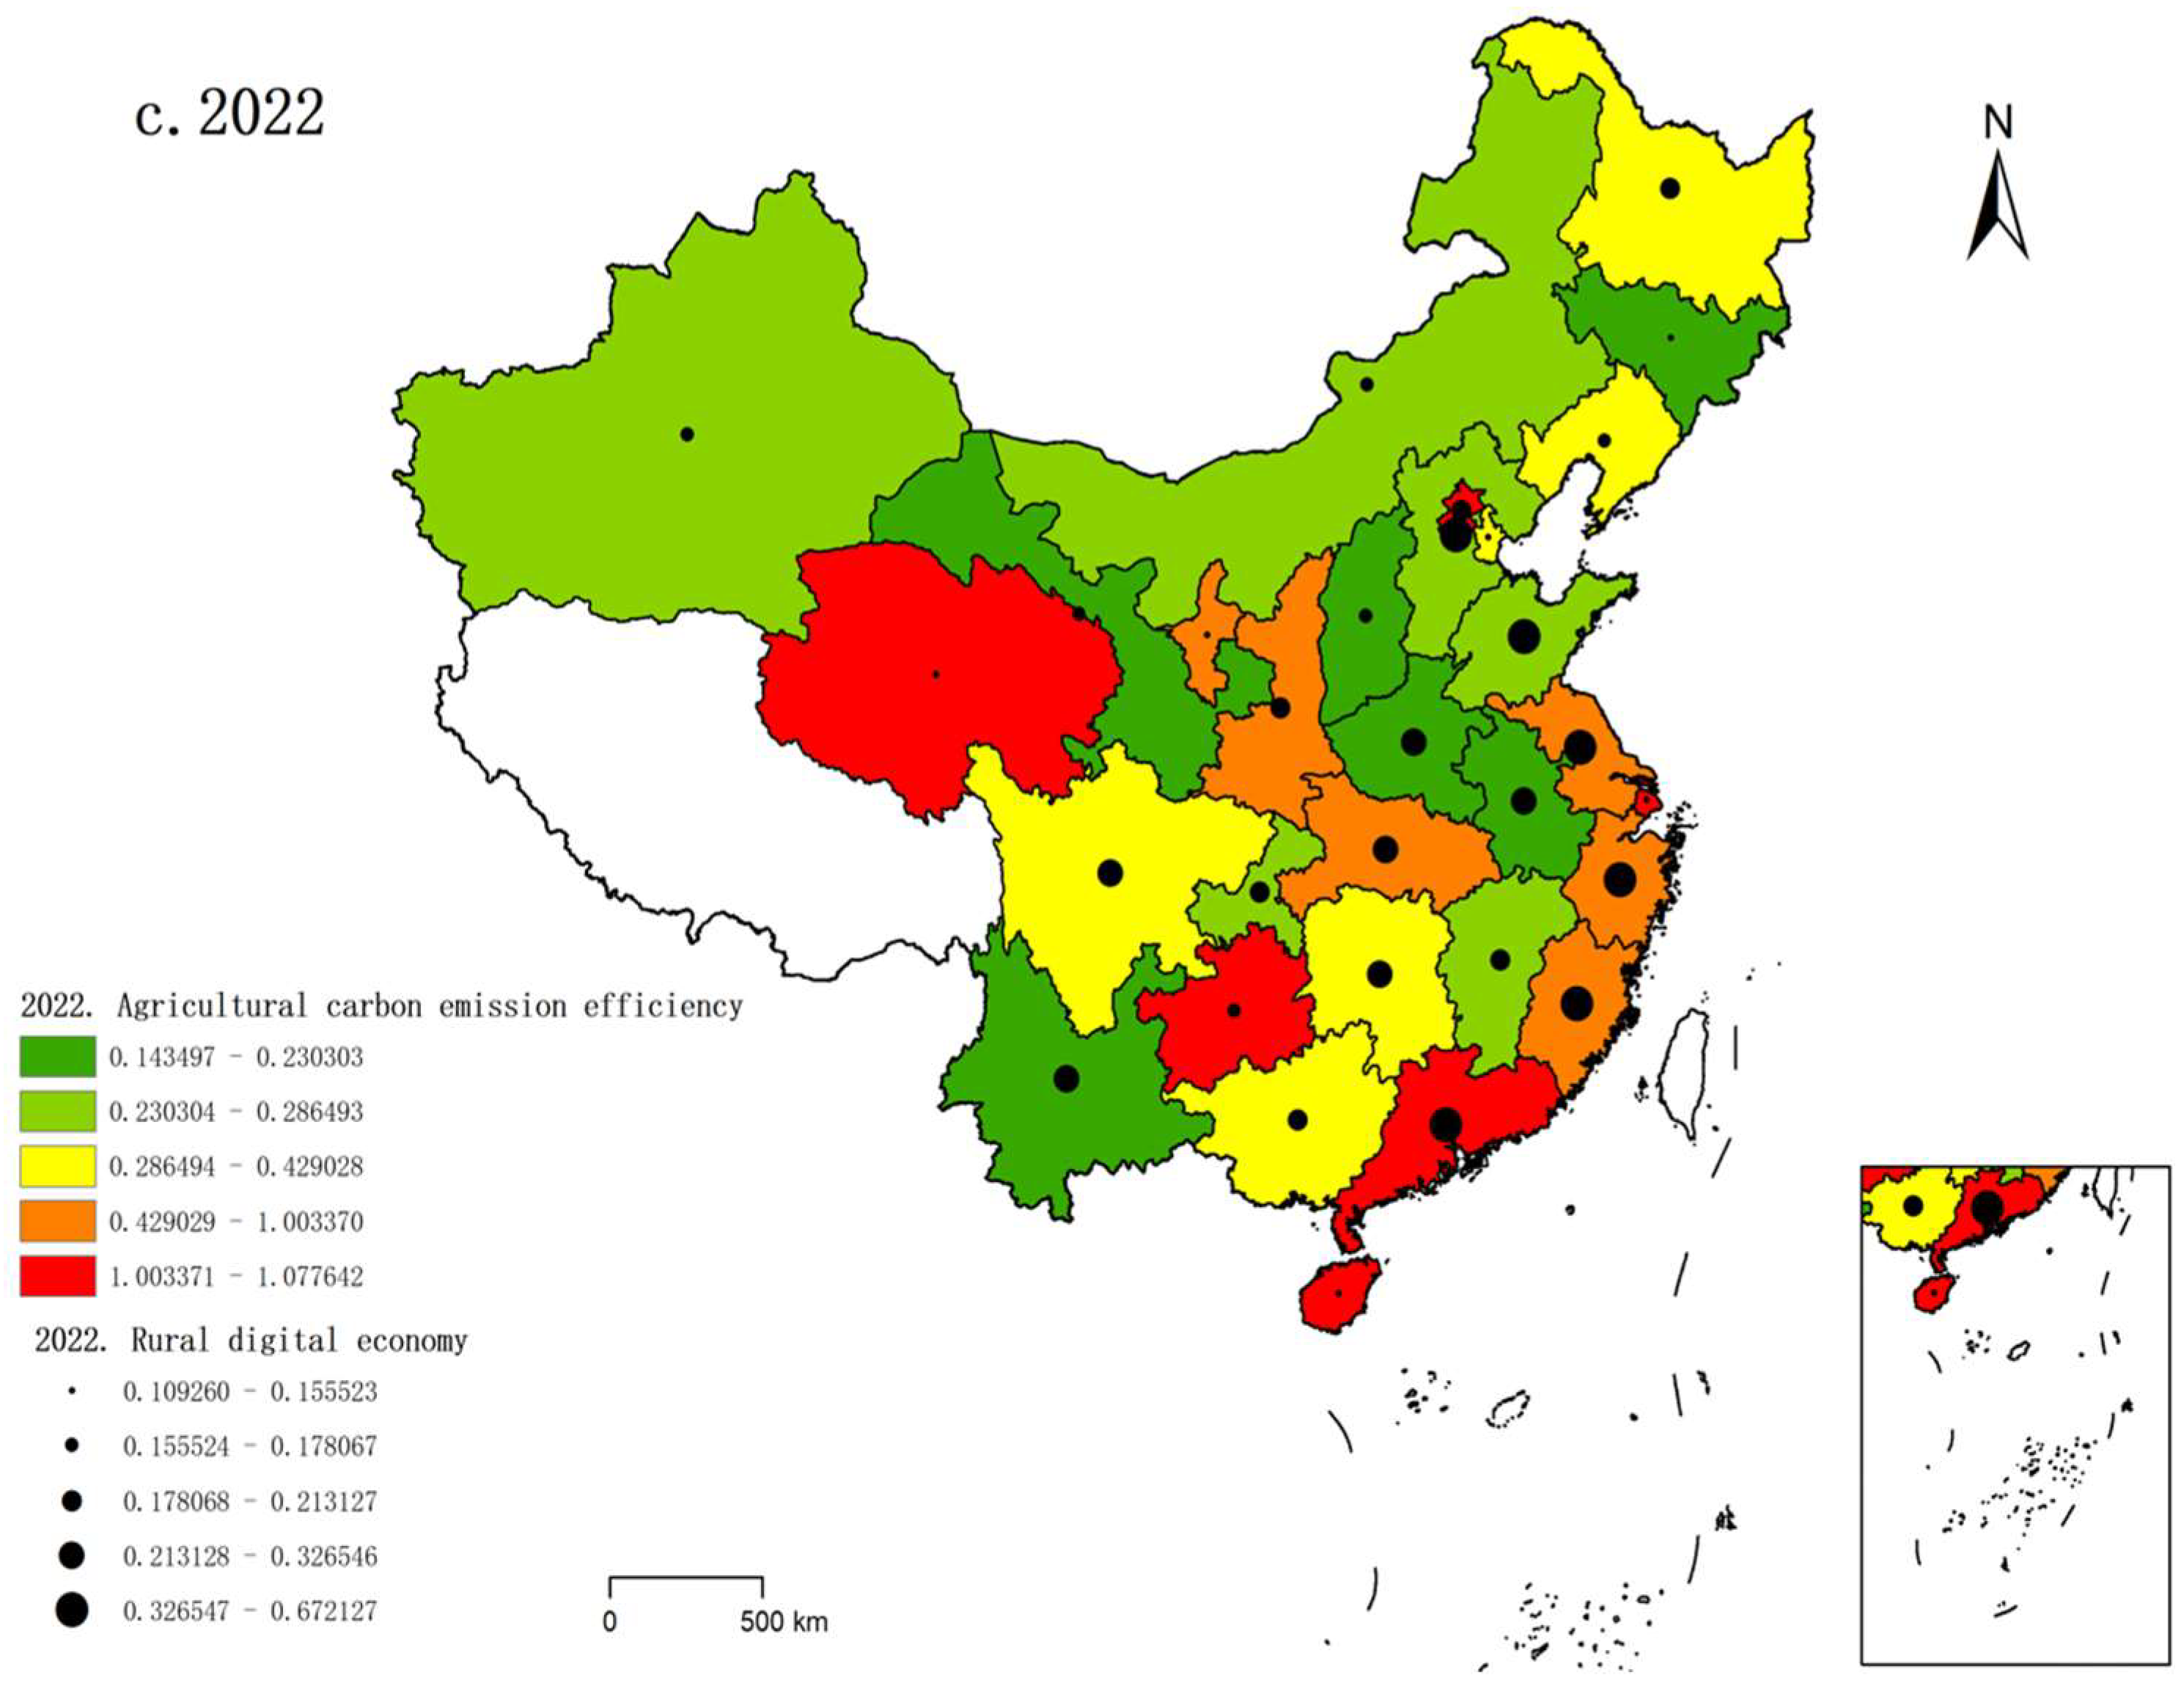
Based on the construction and measurement of indices for the rural digital economy and agricultural carbon emission efficiency, this study employed ArcGIS to visualize the spatial distribution and evolution of provincial-level rural digital economy development and agricultural carbon emission efficiency across China. Due to the large volume of data, spatial patterns are presented for the representative years 2011, 2016, and 2022, categorized using the quantile classification method. The spatial visualizations (Figure 2) reveal the following key findings: (1) Spatiotemporal Distribution: Regions exhibiting higher levels of rural digital economy development and agricultural carbon emission efficiency were predominantly concentrated in eastern and southern China. Temporally, the overall development level of the rural digital economy showed a consistent upward trend over the study period. Conversely, agricultural carbon emission efficiency displayed a distinct non-monotonic trajectory, initially high, then declining, before ultimately increasing again. (2) Evolutionary Dynamics: Initial Stage (a.2011): A discernible positive correlation existed between rural digital economy and agricultural carbon emission efficiency, provinces with higher rural digital economy development levels also generally exhibited higher agricultural carbon emission efficiency; Mid-Term (b.2016): As rural digital economy development progressed, a significant decoupling effect emerged in several provinces, characterized by a misalignment between rural digital economy levels and agricultural carbon emission efficiency. Furthermore, agricultural carbon emission efficiency in some provinces showed a noticeable decline compared to the earlier period; Later Stage (c.2022): The evolving relationship between rural digital economy development and agricultural carbon emission efficiency shifted again, trending towards resynchronized development or positive co-movement in the dynamic evolution process.

4.2. Benchmark Regression Analysis

The regression results obtained using the two-way fixed effects model are presented in Table 6. Column (1) reports estimates without control variables, while Column (2) includes control variables. The results robustly demonstrate a nonlinear impact of the rural digital economy development on the agricultural carbon emission efficiency. Both specifications reveal a positive coefficient for the linear term, a negative coefficient for the quadratic term, and a positive coefficient for the cubic term, indicating an “N-shaped” nonlinear relationship between rural digital economic development and agricultural carbon emission efficiency. As the rural digital economy advances, agricultural carbon emission efficiency evolves through three distinct phases: an initial increase, followed by a decline, and subsequently a renewed increase. This trajectory arises from the dynamic interplay of technological dividends, scale effects, and institutional innovation across developmental stages. The first stage is efficiency improvement. Agricultural carbon emission efficiency rises with initial digitalization. The early adoption of precision digital technologies significantly enhances the utilization efficiency of key agricultural inputs, mitigating the over-application common under traditional extensive management [56]. Digital tools streamline production processes, eliminate redundant operations, and reduce operational time, effectively lowering energy consumption and carbon emissions per unit output. The second stage is efficiency decline. Efficiency decreases as digitalization progresses. This stage is characterized by a surge in the carbon footprint of digital infrastructure itself [57]. Additionally, cost reductions and efficiency gains from digital technologies may stimulate agricultural expansion, where scale-driven output growth outweighs efficiency benefits, resulting in net increases in carbon emissions. The focus often shifts toward yield enhancement and operational convenience rather than deep carbon optimization. The third stage is efficiency rebound. Efficiency rebounds with mature digitalization. Artificial intelligence and big data deeply optimize entire agricultural production chains, enabling the advanced prediction and management of carbon emissions in complex scenarios. Concurrent institutional innovations and constraints (e.g., ecological redlines, emission caps) effectively guide digital technology deployment, curbing negative scale effects and rebound phenomena. Thus, Hypothesis 1 is empirically validated.

4.3. Robustness Analysis

4.3.1. Robustness Tests

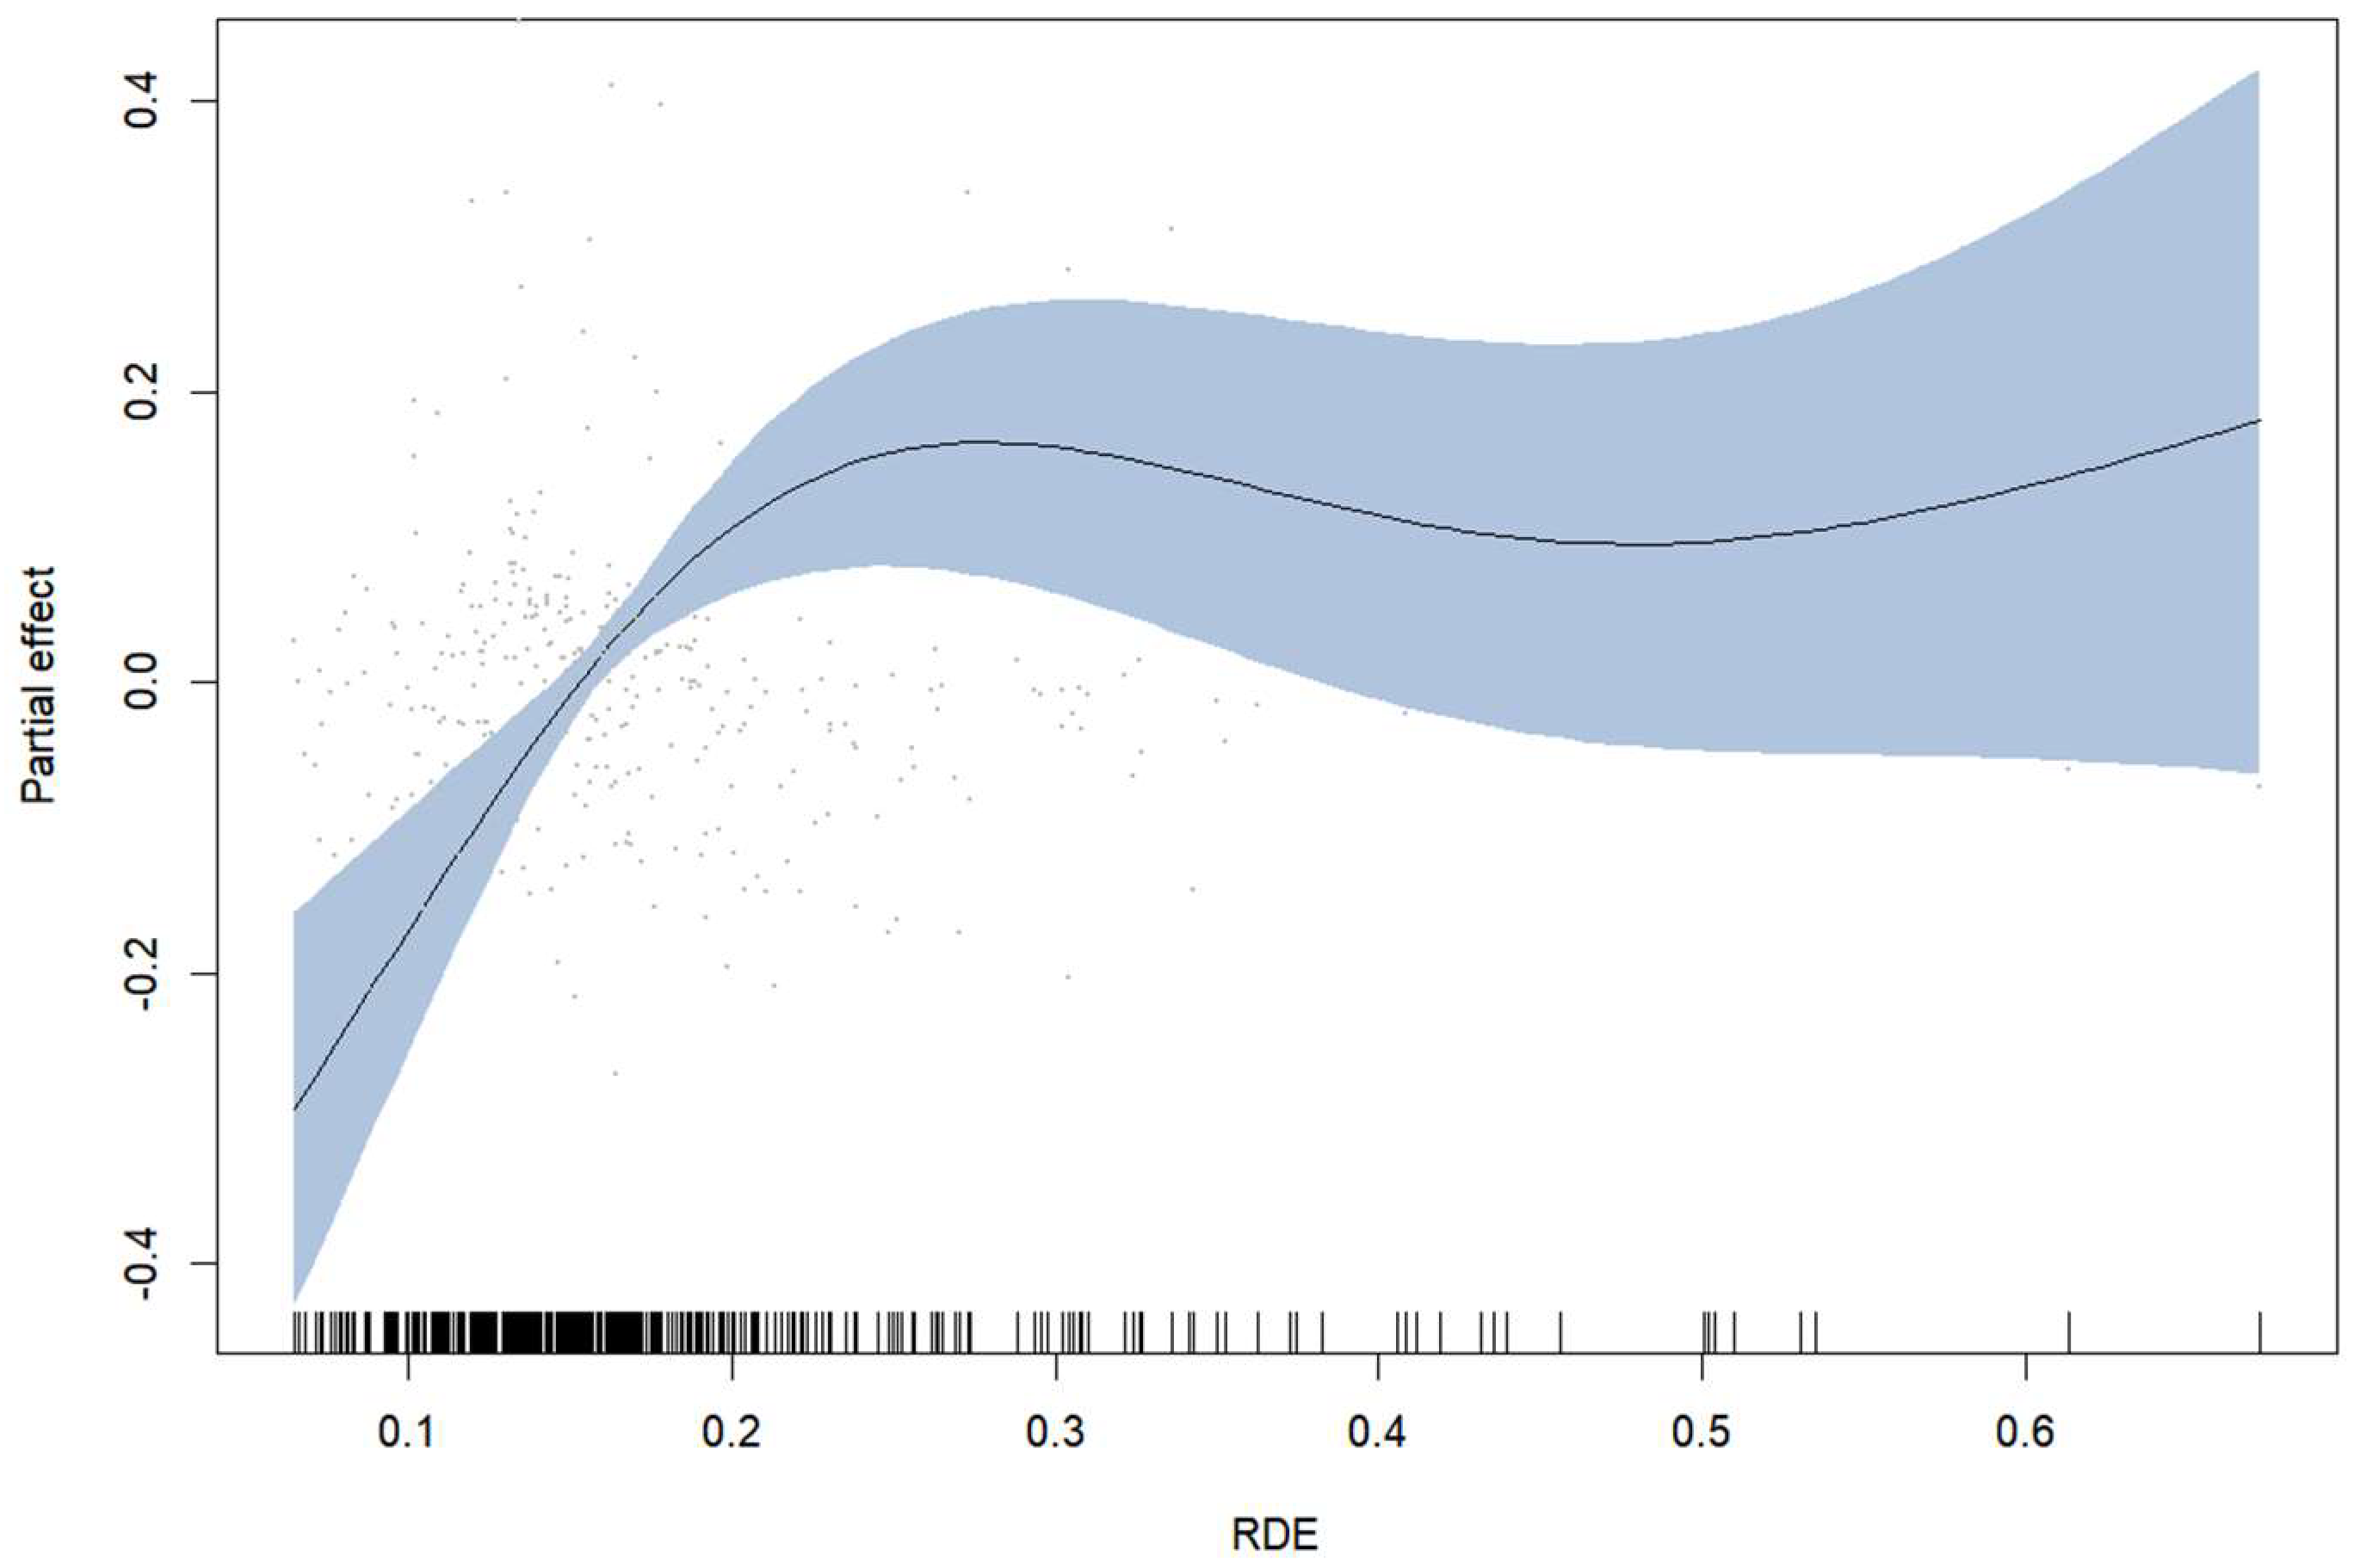
To assess the robustness of the benchmark regression results, this study conducts robustness checks from the following three perspectives: (1) Adjusting the sample period: The State Council’s 2015 release of the Action Outline for Promoting Big Data Development marked the first national-level deployment of agricultural and rural big data, signifying the formal inclusion of digitalization in the top-level design of rural revitalization and the emergence of initial applications of information technology in rural development. Therefore, this study examines the impact of the rural digital economy on agricultural carbon emission efficiency starting from the pivotal year of 2015. As shown in Column (1) of Table 7, the results remain consistent with the benchmark regression. (2) Winsorization: To mitigate the influence of outliers, the top and bottom 1% of the sample data were winsorized. The results, presented in Column (2) of Table 7, remain statistically significant. (3) Adding control variables: Drawing on research by Xu et al. (2022) [58] and Valin et al. (2013) [59], the agricultural industrial structure and agricultural productivity level are also considered to be factors influencing the agricultural carbon emission efficiency. Agricultural industrial structure is measured as the ratio of the combined output value of crop cultivation and animal husbandry to the total agricultural output value. The agricultural productivity level is measured as the ratio of the total agricultural output value to the number of agricultural employees. Regression results incorporating these two additional control variables, shown in Column (3) of Table 7, confirm the robustness of the findings. (4) Given that the core nonlinear relationship was initially captured using a rigid cubic polynomial specification, we thus adopt a more flexible modeling strategy through Generalized Additive Models (GAMs). This approach generates diagnostic plots to visualize partial dependence relationships between the predictors and the response variable, while enabling data-driven identification of potential inflection points. The Generalized Additive Model (GAM) analysis presented in Figure 3 further corroborates an inverted N-shaped relationship between rural digital economy development and agricultural carbon emission efficiency. During the initial phase of digital advancement, agricultural carbon efficiency demonstrates significant improvement; however, as digitalization progresses to approximately 0.25 on the comprehensive index, the sensitivity of carbon efficiency to digital development undergoes a critical reversal—shifting from an upward to downward trajectory. Subsequently, when the digitalization development index reaches the threshold of 0.50, the sensitivity reverses again, with carbon efficiency resuming its upward trajectory. This nonparametric pattern aligns closely with the baseline cubic specification, thereby robustly validating the persistence of this nonlinear dynamic. (5) Principal Component Analysis (PCA): While entropy weighting remains widely adopted, its sensitivity to weight assignment and vulnerability to outliers necessitates complementary validation. To ensure a robust measurement, we employ Principal Component Analysis (PCA) [50] for recalculating the rural digital economy development index. As shown in Column (4) of Table 7, the PCA-derived results corroborate the benchmark regression findings, confirming their statistical resilience.

4.3.2. Endogeneity Test

To address potential endogeneity concerns arising from reverse causality and omitted variables in the relationship between rural digital economy development and agricultural carbon emission efficiency, this study employs an instrumental variable (IV) approach to enhance the robustness of our findings. Following Zhao et al. (2023) [60] and Dou et al. (2022) [61], we use the interaction term between the 1984 postal service volume and the number of internet access ports in the same year as the instrumental variable. This selection satisfies the relevance requirement, as telecommunications infrastructure and internet access ports constitute fundamental prerequisites and core components for rural digital economy development. Simultaneously, the exogeneity requirement is met: as digitalization advances, the number of post offices has steadily declined, and traditional postal services are unlikely to directly influence contemporary agricultural carbon emission intensity; likewise, historical internet port availability cannot directly affect current agricultural carbon emissions. Results presented in Column (5) of Table 7 demonstrate that the estimated impact of rural digital economy development on agricultural carbon emission efficiency remains consistent with our baseline findings. Furthermore, the Kleibergen–Paap rk Wald F statistic exceeds 10, and the Kleibergen–Paap rk LM statistic is significant at the 15% level. These tests confirm the absence of underidentification and weak instrument concerns. Consequently, our core conclusions remain robust after controlling for potential endogeneity issues.

4.3.3. Causal Relationship Test

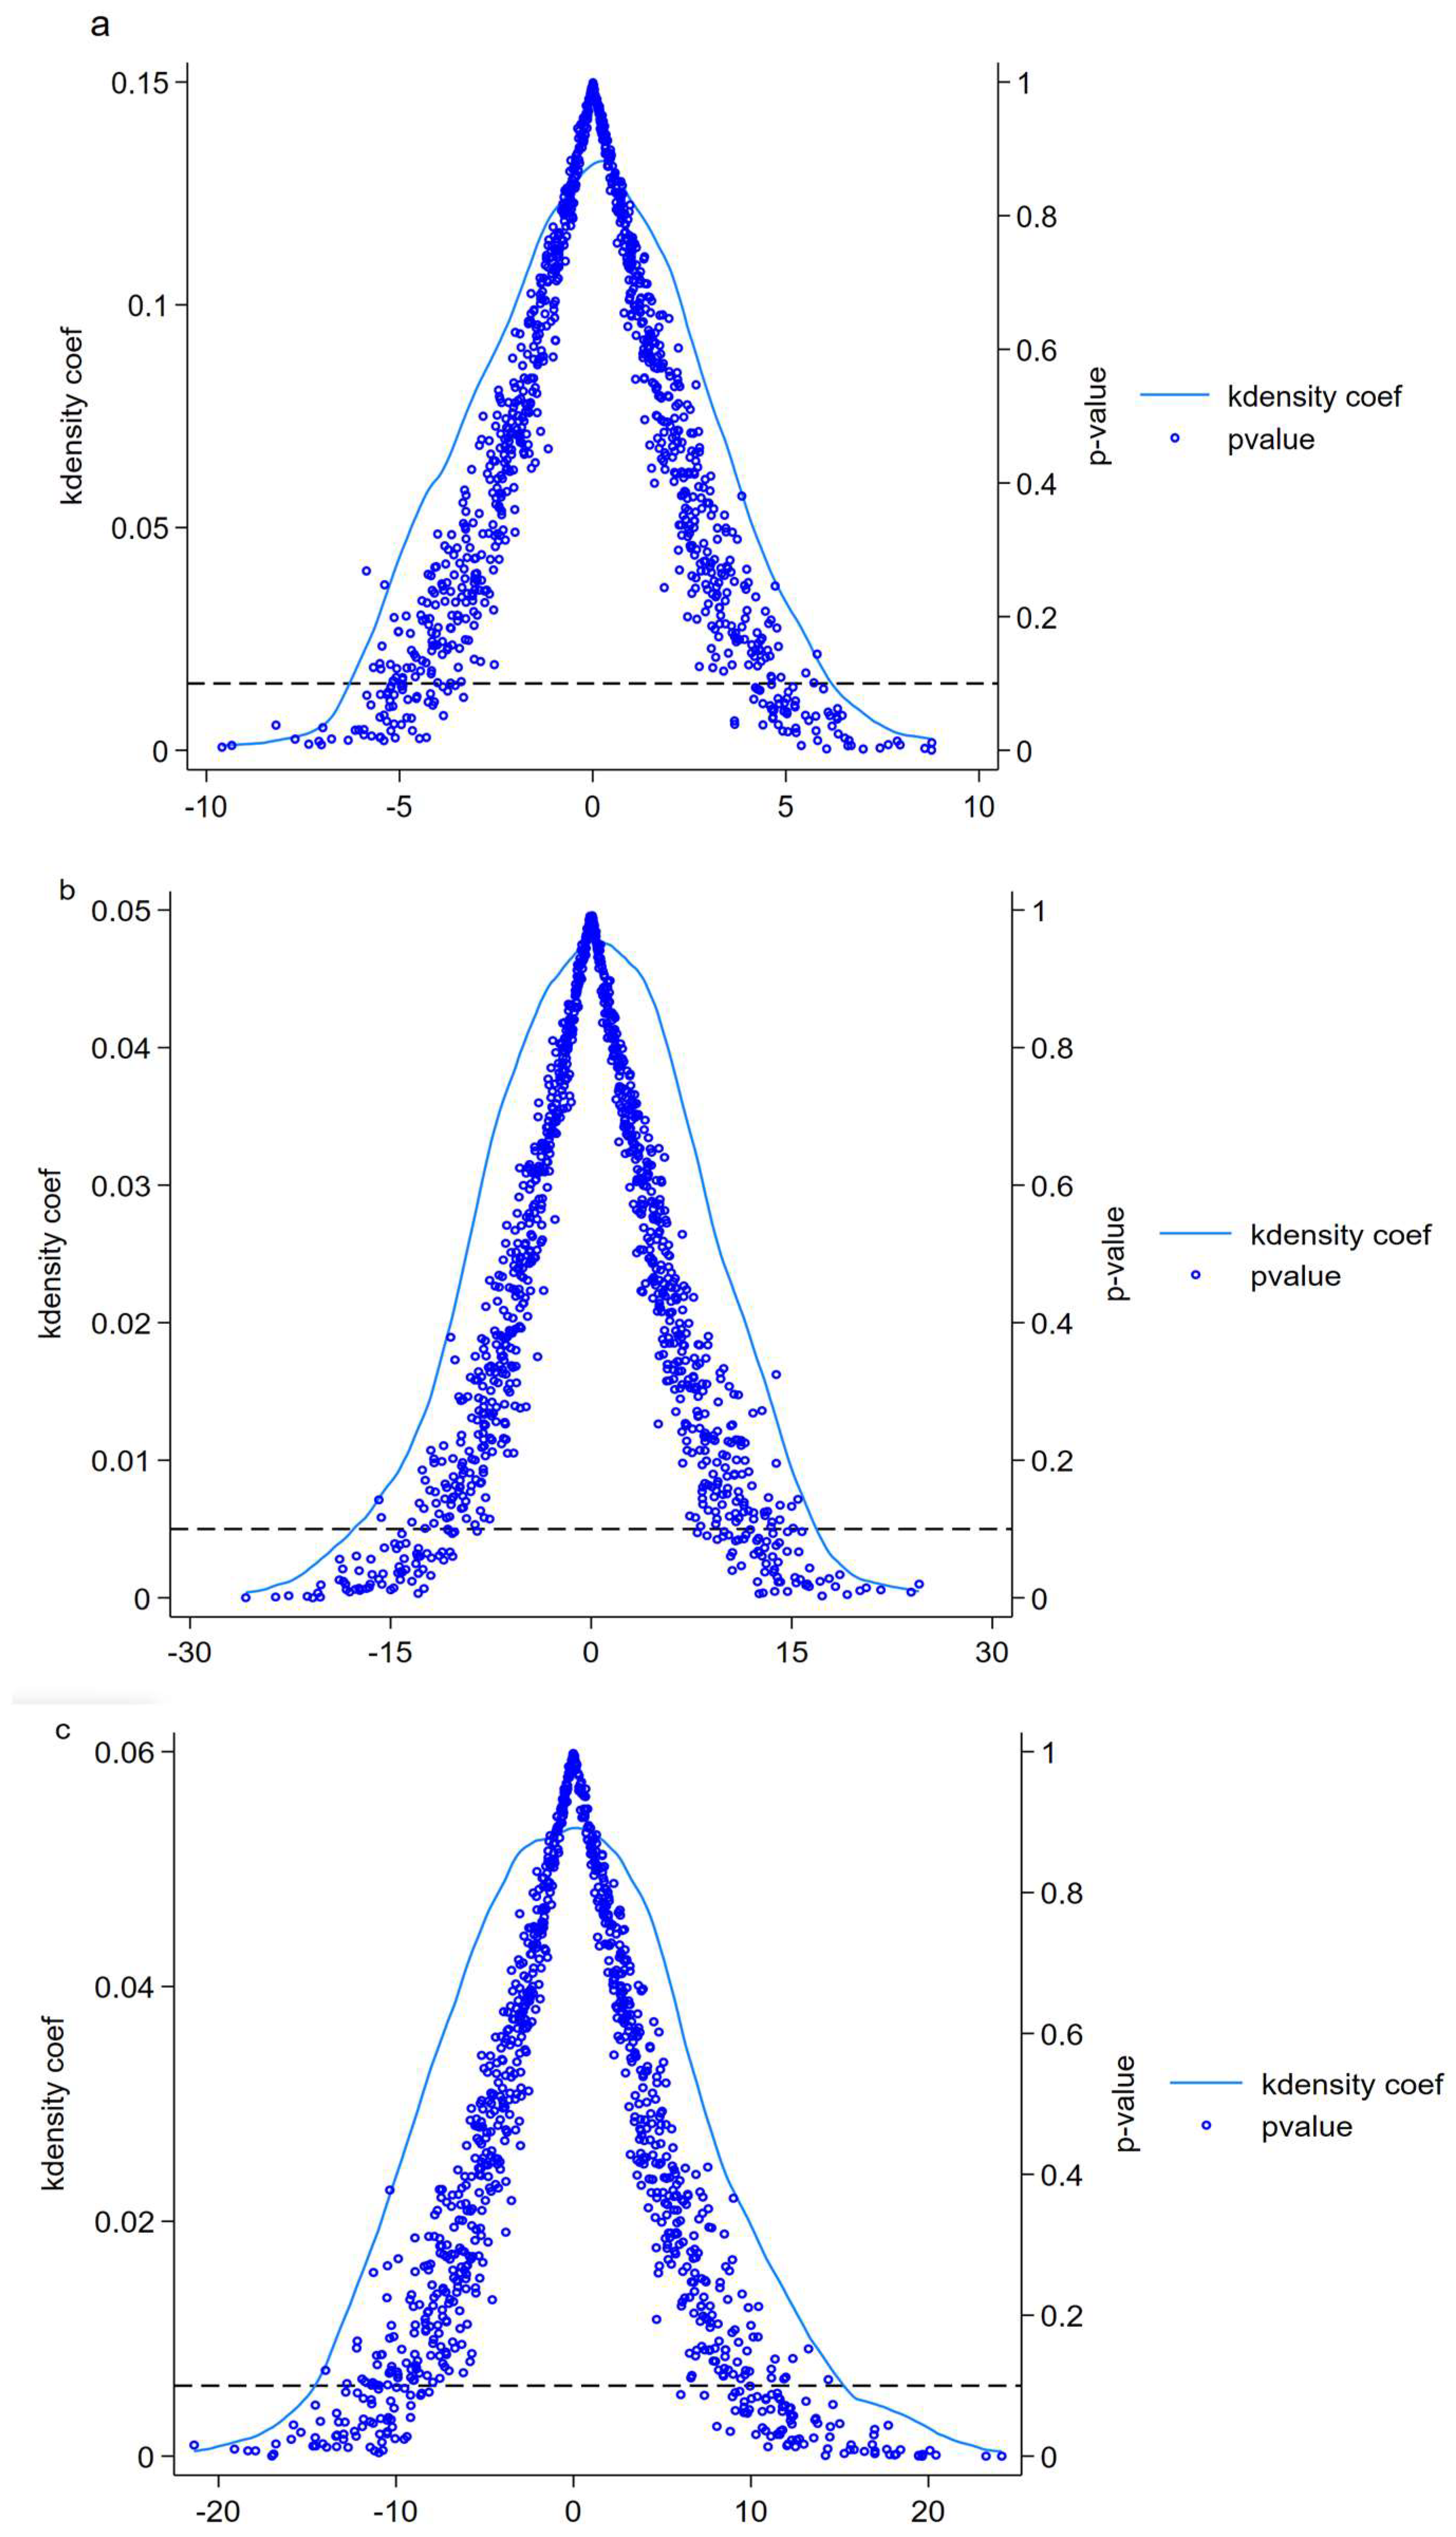
Robustness and endogeneity tests have provided preliminary evidence supporting the reliability of our benchmark regression. Nevertheless, potential bidirectional causality may still raise concerns about spurious regression. To address this issue, we adopt the Monte Carlo simulation approach following Wang et al. (2025) [62], conducting 1000 random simulations to verify causal relationships. Given the cubic polynomial specification in our model, the following three figures (Figure 4), respectively, present Monte Carlo simulation results for the linear (Figure 4a), quadratic (Figure 4b), and cubic terms (Figure 4c). Under random matching conditions, the relationship between rural digital economy development and agricultural carbon emission efficiency demonstrates an approximately normal distribution with statistically insignificant effects. The results in the figure show that they are mainly concentrated around 0, and the influence coefficients basically present a normal distribution. The p values of most fitting results exceed 0.1 (The dashed line represents p = 0.1), indicating that the independent variable has a strong causal relationship with the dependent variable.

4.4. Mechanism Analysis

To investigate the impact mechanism of rural digital economy development on agricultural carbon emission efficiency, this study draws on the analytical framework of the agricultural industrial convergence effects established by Zhang et al. (2023) [27]. The regression results in Table 8 demonstrate that the digital economy development significantly enhances agricultural carbon emission efficiency by promoting agricultural industrial convergence, with all coefficients significant at the 1% level. This validates the following phased mechanism: during the initial phase, agricultural industrial convergence transcends traditional industrial boundaries, facilitating the cross-sectoral flow of resources and technological synergies. Digital technology penetration optimizes resource allocation and production efficiency through industrial convergence, thereby reducing the carbon emissions per unit output [63]. As convergence deepens, the scale expansion effect and potential coordination failures among industries temporarily increase carbon emissions. This occurs because economies of scale may override technological decarbonization benefits, while insufficient inter-industry collaboration impedes optimal resource utilization [64]. At the mature stage, digital technologies drive full-chain coordination, activating scale economies and green innovation. This increases the marginal output of production factors and optimizes agricultural industrial structures. For instance, circular agriculture models leverage agriculture’s multifunctional value, effectively promoting sustainable development and further elevating the agricultural carbon emission efficiency [65]. Thus, Hypothesis 2 is empirically validated.

4.5. Heterogeneity Analysis

This section examines how the impact of rural digital economy development on the agricultural carbon emission efficiency varies across different contexts. (1) Marketization-level heterogeneity: Regions were classified into high- and low-marketization groups based on the Fan Gang Index [66], using the sample mean as the threshold. Columns (1) and (2) of Table 9 reveal a statistically significant inverted “N”-shaped relationship only in regions with high marketization levels. A well-developed market environment facilitates information flow and resource allocation. Digital technologies enable producers to access market information more efficiently, allowing timely adjustments to production decisions and reducing resource idling and waste caused by blind production. Nevertheless, even in advanced markets, potential market failures and unfair competition may initially impede the carbon reduction effectiveness of digital technologies. As the digital economy matures, government guidance and regulation gradually enhance market functionality. This synergy effectively stimulates agricultural innovation and fosters efficient, low-carbon digital solutions for agriculture, ultimately improving the agricultural carbon emission efficiency [67]. (2) Regional heterogeneity: The Hu Huanyong Line demarcates not only China’s southeastern and northwestern regions but also the primary boundaries between crop cultivation and animal husbandry. Columns (3) and (4) of Table 5 indicate a significant inverted “N”-shaped relationship exclusively in the southeastern region, where crop cultivation predominates. This regional disparity likely arises because rural digital economy development is more advanced in southeastern China, allowing for a fuller realization of its benefits. Furthermore, digital technologies currently see broader application in crop cultivation than in animal husbandry, amplifying their impact on agricultural carbon emission efficiency in southeastern regions [68]. (3) Based on the comprehensive metric of the rural digital economy, this study further examines the impact of secondary indicators—rural digital infrastructure, agricultural production digitization, rural circulation digitization, and rural life digitization—on agricultural carbon emission efficiency. The regression results, presented in Columns (1) to (4) of Table 10, reveal a significant inverted “N”-shaped relationship between both agricultural production digitization and rural circulation digitization with agricultural carbon emission efficiency. In contrast, rural digital infrastructure and rural life digitization exhibit no statistically significant effects. This differential impact stems from variations in the coupling degree between different dimensions of agricultural digitalization and the carbon cycle. Digitalization in production and circulation often integrates directly into the core agricultural production processes, making it intrinsically linked to farming operations. In contrast, digital infrastructure and digitalization of rural life are not directly tied to agricultural production activities. Instead, they exert an indirect influence by affecting the overall development level of the rural digital economy, which in turn impacts agricultural production. This distinction accounts for the differential results observed. (4) Regional disparities in digital economy development: Drawing on China’s National Digital Economy Innovation Pilot Zones, this study selects provinces demonstrating both significant digital economy achievements and active participation in provincial rural digital initiatives—specifically Hebei, Zhejiang, Fujian, Guangdong, Sichuan, Jiangsu, Anhui, Henan, and Shandong (excluding Beijing, Shanghai, Tianjin, and Chongqing municipalities)—to represent regions with advanced rural digitalization. This approach enables an examination of how digital economy demonstration zones and high-performing areas influence the agricultural carbon emission efficiency. As shown in Columns (5) and (6) of Table 10, rural digital economy development exerts significant effects on agricultural carbon efficiency in digitally advanced regions, whereas such impacts remain statistically insignificant in other provinces. These findings ground our conclusions in China’s dynamic regional development context, demonstrating that regions with robust digital foundations can fully unlock the digital dividend to accelerate the green and low-carbon agricultural transformation.

5. Further Analysis

5.1. Global Spatial Autocorrelation Test

Existing research suggests significant spatial interdependence between rural digital economy development and agricultural carbon emission efficiency [16]. To ensure robust model specification, we first conducted global spatial autocorrelation tests. Moran’s I index, a well-established measure demonstrating strong robustness for spatial dependence, was employed for this analysis. As presented in Table 11, Moran’s I values for provincial agricultural carbon emission efficiency under the spatial adjacency matrix configuration were consistently positive throughout the period of 2011–2022, achieving statistical significance in most years. These results confirm significant spatial autocorrelation in agricultural carbon emission efficiency across Chinese provinces during the study period, necessitating the application of spatial econometric models for further analysis.

5.2. Spatial Econometric Model Selection

Furthermore, a series of tests were conducted to select a reasonable and effective spatial econometric model, and the results are shown in Table 12. The robust LM test was significant at the 1% level, indicating the potential presence of both spatial error and spatial lag effects. Furthermore, the LR and Wald tests were statistically significant, rejecting the null hypotheses that the Spatial Durbin Model (SDM) simplifies to a Spatial Lag Model (SLM) or a Spatial Error Model (SEM), respectively. Consequently, the SDM was selected for this analysis. Regarding the fixed effects specification, the Hausman test results favored the fixed effects model over the random effects model for more efficient estimation. Subsequent LR tests examining joint significance (LR (both/ind) and LR (both/time)) rejected the specifications containing only time-period fixed effects or only individual fixed effects. Therefore, the SDM with two-way fixed effects was ultimately employed.

5.3. Spatial Spillover Effects of Digital Economy Development on Agricultural Carbon Emission Efficiency

Regression results using the SDM with a spatial adjacency weight matrix are presented in Table 13. The direct effects show coefficients of 7.618 (linear term), −20.06 (quadratic term), and 15.85 (cubic term) for the rural digital economy, all statistically significant at the 1% level. Similarly, the indirect effects exhibit coefficients of 6.999 (linear), −17.79 (quadratic), and 15.49 (cubic), all significant at the 5% level. These results confirm a significant inverted “N”-shaped spatial spillover effect of rural digital economy development on agricultural carbon emission efficiency, thereby validating Hypothesis 3. The inverted N-shaped trajectory manifests through three distinct phases. The initial rise phase reflects agricultural carbon emission efficiency improvements in core digitally advanced areas, stimulating learning and emulation in neighboring regions, where technology diffusion and knowledge sharing strengthen regional connectivity to generate positive spatial spillovers [69]. Subsequently, the decline phase emerges partly because neighboring regions experience agricultural carbon emission efficiency reductions mirroring core “high-ground” areas due to inherent digital economy development patterns. This trend is further exacerbated when rapid expansion in digitally advanced areas creates competitive pressure and resource drainage in adjacent regions, compounded by technological barriers implemented by advanced areas that hinder agricultural carbon emission efficiency improvement in surrounding areas [70]. Ultimately, the renewed increase materializes as regional collaboration intensifies, enabling more sophisticated development mechanisms between advanced areas and neighboring areas that enhance spillover effects. This allows the knowledge transfer of digital-emission-reduction practices from neighboring areas to facilitate the enhancement of the local agricultural carbon emission efficiency [23].

5.4. Discussion

This study advances the understanding of the relationship between the development of the rural digital economy and the agricultural carbon emission efficiency. Previous research on agricultural carbon emissions has predominantly focused on linear relationships [71,72], with primary attention given to total agricultural carbon emissions and emission intensity [73,74]. Departing from this focus, our research broadens the scope by concentrating on agricultural carbon emission efficiency. Agricultural carbon emission efficiency provides a comprehensive measure integrating agricultural production inputs, economic outputs, and total carbon emissions. It emphasizes the synergistic optimization of economic benefits and ecological benefits under emission reduction constraints, aligning more closely with the core objectives of green and low-carbon agricultural transformation. This study breaks away from linear assumptions by investigating the nonlinear relationship between rural digital economy development and agricultural carbon emission efficiency. This approach extends the application of the Environmental Kuznets Curve (EKC) and corroborates the findings of Zhu et al. (2024) [68]. Utilizing provincial panel data, we innovatively employ a cubic model, combined with mediation effects and spatial econometric models, to uncover the nonlinear impact of rural digital economy development on agricultural carbon emission efficiency. Building on the identification and validation of this nonlinear relationship, we further analyze the mediating role of agricultural industrial integration in the RDE-ACEE linkage and quantify cross-regional spillover effects in the spatial dimension. A series of robustness tests confirm the existence of a phased dynamic effect. Furthermore, multi-perspective heterogeneity analysis reveals the varying impacts of rural digital economy development on agricultural carbon emission efficiency across different entities, moving beyond the simplistic linear approaches prevalent in existing agricultural carbon emission efficiency studies [35]. Our findings, which align with long-term dynamic evolutionary patterns and resonate with forward-looking perspectives on the complex environmental effects of digital technologies, offer a more realistic reflection of the dynamic complexity inherent in agricultural systems [24,40]. This research provides robust empirical evidence and valuable references for formulating tailored and inclusive policy frameworks. It also opens avenues for future research to dissect the identified “N-shaped” pattern, accelerate the transition through critical turning points, delve into its underlying micro-mechanisms, and explore the development of dynamic adaptive policy systems grounded in nonlinear relationships.

6. Conclusions and Policy Implications

6.1. Conclusions

While a consensus exists in the literature regarding the impact of rural digital economy development on agricultural carbon emissions, research specifically focusing on agricultural carbon emission efficiency remains limited. Utilizing provincial panel data from 30 Chinese provinces over the period of 2011–2022, this study yields the following key findings: (1) A significant inverted “N-shaped” relationship exists between rural digital economy development and agricultural carbon emission efficiency. In the initial stage, rural digital economy development generates high marginal returns, manifesting as pronounced benefits in income growth and emission reduction. As the rural digital economy’s penetration deepens, however, scale expansion partially counteracts emission reduction gains, diminishing agricultural carbon emission efficiency improvements. With further maturation of the rural digital economy, enhanced coordination among production factors and institutional systems coupled with technological optimization drives a renewed increase in agricultural carbon emission efficiency. (2) Agricultural industrial convergence acts as a crucial mediating mechanism. Rural digital economy development accelerates the formation of the observed “N-shaped” relationship in agricultural carbon emission efficiency by fostering integration between agriculture and other economic sectors. (3) The impact of rural digital economy development on agricultural carbon emission efficiency exhibits significant spatial spillover effects. Within a given region, agricultural carbon emission efficiency demonstrates an “increase → decrease → then increase again” pattern as the rural digital economy develops through different stages. Due to the spatial and geographical proximity relationship, as well as the diffusion, learning, and demonstration effects among regions, neighboring regions also exhibit a similar “N-shaped” agricultural carbon emission efficiency trajectory. (4) The inverted N-shaped impact of rural digital economy development on agricultural carbon emission efficiency is more pronounced in regions with higher marketization levels and demonstrates a more significant statistical relationship in planting-intensive areas of southeastern China. Further analysis reveals that agricultural production digitalization and circulation digitalization similarly exhibit a distinct inverted N-shaped relationship with emission efficiency. Notably, this characteristic pattern proves statistically significant in digital economy pilot zones and demonstration areas.

6.2. Policy Implications

First, leverage the positive role of the rural digital economy in enhancing agricultural carbon emission efficiency. Strengthen digital infrastructure to facilitate the deeper integration of digital technologies with agricultural production, accelerating the digitalization of agricultural production and circulation. Examples include utilizing agricultural IoT systems for the real-time monitoring of humidity, temperature, and crop growth dynamics. These technologies provide data-driven support for agricultural producers, enabling optimized resource allocation and scheduling through data analysis and forecasting. Furthermore, employing automation equipment and precision control technologies can reduce input waste during production processes. Concurrently, enhance education and training in agriculture–digital technology interdisciplinary fields to cultivate professionals with dual expertise, thereby securing the talent foundation for digital technology adoption. Additionally, increased support for digital development in central and western regions is essential to narrow regional and inter-industrial disparities in digitalization levels. This will maximize the contribution of the rural digital economy to improving agricultural carbon emission efficiency.
Second, establish robust integration mechanisms between the digital economy and rural industries. Digitalization should drive structural transformation in agriculture, fostering multi-level and multi-dimensional industrial convergence. Firstly, developing dedicated agricultural industrial convergence platforms can integrate upstream and downstream value chains, facilitating synergy between agriculture and related sectors. This enhances agricultural value, increases economic output, reduces carbon emissions per unit of product through scaled operations, and improves agricultural carbon emission efficiency. Moreover, policy guidance should encourage diverse capital investment in agricultural industrial convergence. Actively promoting digital upgrades among leading agricultural enterprises, cooperatives, and other stakeholders will enhance their compatibility with various capital sources and broaden the dimensions of agricultural–industrial integration.
Third, unlock the spatial contribution potential of digitalization to the agricultural carbon emission efficiency. Establishing designated pilot zones for digital economy policies and technology demonstration areas is recommended. Successful cases generating positive socioeconomic benefits can stimulate knowledge spillover, encouraging neighboring regions to adopt advanced concepts, knowledge, and technologies. This bottom-up diffusion reduces implementation barriers while enhancing the accessibility and application capacity of digital technologies. Cross-regional collaboration in the digital economy should also be fostered. Facilitating inter-regional factor mobility, technology penetration, and resource sharing will promote coordinated regional development and maximize the spatial spillover effects of rural digital economy development.
Fourth, differentiated policy packages should be designed according to the developmental stages of the rural digital economy, targeting the identification and strategic utilization of inflection windows. The inverted N-shaped relationship between digital economy development and agricultural carbon emission efficiency fundamentally stems from the dynamic interplay of technological dividends, scale effects, and institutional innovation across phases. Consequently, policy design and implementation must align with stage-specific characteristics. By identifying and leveraging probable inflection periods through coordinated policy-portfolio deployment, the “trough phase” of the N-curve can be transformed into an “acceleration stage” for green transition.

6.3. Research Limitations and Future Directions

This study has several limitations. Firstly, while this study examines the nonlinear relationship between rural digital economy development and agricultural carbon emission efficiency, constraints in data availability and methodological approaches limit our exploration of inflection points within the inverted N-shaped pattern. The mechanism testing for this relationship remains preliminary, leaving the “black box” of the N-shaped linkage inadequately unpacked. Secondly, although the analysis employed provincial-level panel data spanning 2011–2022, agricultural carbon emission efficiency dynamics are inherently long-term, evolve dynamically, and are closely tied to the micro-level decision-making behaviors of agricultural producers. The reliance on macro-level provincial data precluded deeper micro-level mechanism exploration and validation. Finally, both the rural digital economy and the carbon emission efficiency of agriculture are measured by the comprehensive index method, and the data indicators are relatively broad. Furthermore, the carbon emission coefficients used for different emission sources may exhibit time-dependent variation, potentially introducing discrepancies between the measured indices and actual conditions.
Future research should integrate methodological advancements, particularly models adept at capturing complex nonlinear dynamics, to better identify and understand inflection points. Research content should be deepened by incorporating micro-level datasets to validate findings and explore decision-making mechanisms. Enriching data sources and specificity is crucial, so future work should incorporate more targeted indicators that better reflect core characteristics to enhance measurement techniques and refine the overall indicator system. This includes optimizing the selection and calculation of carbon emission coefficients for improved accuracy and timeliness.

Author Contributions

Y.F.: Conceptualization, Methodology, Software, Validation, Formal analysis, Writing—original draft, Writing—review and editing. S.W.: Resources, Data curation, Writing—review and editing, Investigation. F.C.: Formal analysis, Supervision. All authors have read and agreed to the published version of the manuscript.

Funding

This research was funded by Research on the Impact Mechanism of Rural Digital Economy Development on Agricultural Carbon Emissions from the Perspective of “New Quality Productivity” (grant number YT6000056) and the Hot Topic Tracking Project of Beijing Forestry University (grant number 2018BLCB09) Institutional Review.

Institutional Review Board Statement

Not applicable.

Data Availability Statement

The raw data supporting the conclusions of this article will be made available by the authors on request.

Conflicts of Interest

The authors declare no conflicts of interest.

References

  1. Su, Y.; He, S.; Wang, K.; Shahtahmassebi, A.R.; Zhang, L.; Zhang, J.; Zhang, M.; Gan, M. Quantifying the sustainability of three types of agricultural production in China: An emergy analysis with the integration of environmental pollution. J. Clean. Prod. 2020, 252, 119650. [Google Scholar] [CrossRef]
  2. Yu, J.; Wu, J. The Sustainability of Agricultural Development in China: The Agriculture–Environment Nexus. Sustainability 2018, 10, 1776. [Google Scholar] [CrossRef]
  3. Wang, H.; Liu, C.; Xiong, L.; Wang, F. The spatial spillover effect and impact paths of agricultural industry agglomeration on agricultural non-point source pollution: A case study in Yangtze River Delta, China. J. Clean. Prod. 2023, 401, 136600. [Google Scholar] [CrossRef]
  4. Ji, M.; Li, J.; Zhang, M. What drives the agricultural carbon emissions for low-carbon transition? Evidence from China. Environ. Impact Assess. Rev. 2024, 105, 107440. [Google Scholar] [CrossRef]
  5. Jin, M.; Wang, S.; Chen, N.; Feng, Y.; Cao, F. Can Rural Digitization and the Efficiency of Agricultural Carbon Emissions Be Coupled and Harmonized under the “Dual-Carbon” Goal? Agronomy 2024, 14, 1460. [Google Scholar] [CrossRef]
  6. Zhao, X.; Yang, D.; Duan, X. Temporal and spatial evolution characteristics and decoupling trend of Chinese agricultural carbon emission efficiency. PLoS ONE 2024, 19, e0311562. [Google Scholar] [CrossRef] [PubMed]
  7. Zhang, X.; Zhou, X.; Liao, K. Regional differences and dynamic evolution of China’s agricultural carbon emission efficiency. Int. J. Environ. Sci. Technol. 2023, 20, 4307–4324. [Google Scholar] [CrossRef]
  8. Zhang, X.; Liao, K.; Zhou, X. Analysis of regional differences and dynamic mechanisms of agricultural carbon emission efficiency in China’s seven agricultural regions. Environ. Sci. Pollut. Res. 2022, 29, 38258–38284. [Google Scholar] [CrossRef] [PubMed]
  9. Li, Z.; Sarwar, S.; Jin, T. Spatiotemporal evolution and improvement potential of agricultural eco-efficiency in Jiangsu Province. Front. Energy Res. 2021, 90, 746405. [Google Scholar] [CrossRef]
  10. Wang, S.; Wang, H.; Zhang, L.; Dang, J. Provincial carbon emissions efficiency and its influencing factors in China. Sustainability 2019, 11, 2355. [Google Scholar] [CrossRef]
  11. Guo, X.; Wang, X.; Wu, X.; Chen, X.; Li, Y. Carbon emission efficiency and low-carbon optimization in Shanxi Province under “Dual Carbon” background. Energies 2022, 15, 2369. [Google Scholar] [CrossRef]
  12. Yang, L.; Liu, X.; Kang, X.; Zhu, Y.; Wu, C.; Liu, B.; Li, W. Coupling Agricultural Carbon Emission Efficiency and Economic Growth: Evidence from Jiangxi Province, China. Sustainability 2025, 17, 4246. [Google Scholar] [CrossRef]
  13. Wen, L.; Ma, S.; Su, Y. Analysis of the interactive effects of new urbanization and agricultural carbon emission efficiency. Glob. NEST J. 2024, 26, 1–9. [Google Scholar]
  14. Xia, M.; Zeng, D.; Huang, Q.; Chen, X. Coupling coordination and spatiotemporal dynamic evolution between agricultural carbon emissions and agricultural modernization in China 2010–2020. Agriculture 2022, 12, 1809. [Google Scholar] [CrossRef]
  15. Liu, A.; Yang, S. Study on the spatio-temporal coupling and drivers of agricultural carbon emission efficiency and food security. Front. Environ. Sci. 2024, 12, 1503733. [Google Scholar] [CrossRef]
  16. Liu, L.; Zhang, Y.; Gong, X.; Li, M.; Li, X.; Ren, D.; Jiang, P. Impact of digital economy development on carbon emission efficiency: A spatial econometric analysis based on Chinese provinces and cities. Int. J. Environ. Res. Public Health 2022, 19, 14838. [Google Scholar] [CrossRef] [PubMed]
  17. Li, P.; He, L.; Zhang, J.; Han, H.; Song, Y. Research on the Impact of Agricultural Socialization Services on the Ecological Efficiency of Agricultural Land Use. Land 2024, 13, 853. [Google Scholar] [CrossRef]
  18. Yao, W.; Zhu, Y.; Liu, S.; Zhang, Y. Can Agricultural Socialized Services Promote Agricultural Green Total Factor Productivity? From the Perspective of Production Factor Allocation. Sustainability 2024, 16, 8425. [Google Scholar] [CrossRef]
  19. Liu, J.; Yuan, Y.; Lin, C.; Chen, L. Do agricultural technical efficiency and technical progress drive agricultural carbon productivity? based on spatial spillovers and threshold effects. Environ. Dev. Sustain. 2023, 27, 7701–7725. [Google Scholar] [CrossRef]
  20. Yu, H.; Bai, X.; Zhang, H. Strengthen or weaken? Research on the influence of internet use on agricultural green production efficiency. Front. Environ. Sci. 2022, 10, 1018540. [Google Scholar] [CrossRef]
  21. Rao, P.; Liu, X.; Zhu, S.; Kang, X.; Zhao, X.; Xie, F. Does the Application of ICTs Improve the Efficiency of Agricultural Carbon Reduction? Evidence from Broadband Adoption in Rural China. Int. J. Environ. Res. Public Health 2022, 19, 7844. [Google Scholar] [CrossRef] [PubMed]
  22. Yang, S.; Qiu, S.; Cao, J.; Zhang, Z. The Influencing Mechanism and Spatial Effect of the Digital Economy on Agricultural Carbon Emissions. Sustainability 2025, 17, 3877. [Google Scholar] [CrossRef]
  23. Jiang, Q.; Li, J.; Si, H.; Su, Y. The impact of the digital economy on agricultural green development: Evidence from China. Agriculture 2022, 12, 1107. [Google Scholar] [CrossRef]
  24. Abiri, R.; Rizan, N.; Balasundram, S.K.; Shahbazi, A.B.; Abdul-Hamid, H. Application of digital technologies for ensuring agricultural productivity. Heliyon 2023, 9, e22601. [Google Scholar] [CrossRef] [PubMed]
  25. Lei, X.; Ma, Y.; Ke, J.; Zhang, C. The Non-Linear Impact of the Digital Economy on Carbon Emissions Based on a Mediated Effects Model. Sustainability 2023, 15, 7438. [Google Scholar] [CrossRef]
  26. Ali, Z.A.; Zain, M.; Hasan, R.; Al Salman, H. Circular Economy Advances with Artificial Intelligence and Digital Twin: Multiple-Case Study of Chinese Industries in Agriculture. J. Knowl. Econ. 2024, 16, 2192–2228. [Google Scholar] [CrossRef]
  27. Zhang, Z.; Sun, C.; Wang, J. How can the digital economy promote the integration of rural industries—Taking China as an example. Agriculture 2023, 13, 2023. [Google Scholar] [CrossRef]
  28. Yan, M.; Cao, X. Digital Economy Development, Rural Land Certification, and Rural Industrial Integration. Sustainability 2024, 16, 4640. [Google Scholar] [CrossRef]
  29. Xu, J.; Wang, J.; Wang, T.; Li, C. Impact of industrial agglomeration on carbon emissions from dairy farming—Empirical analysis based on life cycle assessmsent method and spatial durbin model. J. Clean. Prod. 2023, 406, 137081. [Google Scholar] [CrossRef]
  30. Zhou, J.; Chen, H.; Bai, Q.; Liu, L.; Li, G.; Shen, Q. Can the Integration of Rural Industries Help Strengthen China’s Agricultural Economic Resilience? Agriculture 2023, 13, 1813. [Google Scholar] [CrossRef]
  31. Hong, M.; Tian, M.; Wang, J. The impact of digital economy on green development of agriculture and its spatial spillover effect. China Agric. Econ. Rev. 2023, 15, 708–726. [Google Scholar] [CrossRef]
  32. An, Q.; Zheng, L.; Yang, M. Spatiotemporal Heterogeneities in the Impact of Chinese Digital Economy Development on Carbon Emissions. Sustainability 2024, 16, 2810. [Google Scholar] [CrossRef]
  33. Jiang, T. The mediating effect and moderating effect in empirical research on causal inference. China Ind. Econ. 2022, 5, 100–120. (In Chinese) [Google Scholar]
  34. Lee, L.; Yu, J. Identification of spatial Durbin panel models. J. Appl. Econom. 2016, 31, 133–162. [Google Scholar] [CrossRef]
  35. Jiang, W.; Chen, C. The impacts of rural digitization on agricultural carbon emission efficiency: Evidence from 30 provinces in China over 2011–2022. Front. Sustain. Food Syst. 2025, 9, 1593986. [Google Scholar] [CrossRef]
  36. Liu, Y.; Gao, Y. Measurement and impactor analysis of agricultural carbon emission performance in Changjiang economic corridor. Alex. Eng. J. 2022, 61, 873–881. [Google Scholar] [CrossRef]
  37. Huang, X.; Wu, X.; Guo, X.; Shen, Y. Agricultural carbon emissions in China: Measurement, spatiotemporal evolution, and influencing factors analysis. Front. Environ. Sci. 2024, 12, 1488047. [Google Scholar] [CrossRef]
  38. Butzer, R.; Mundlak, Y.; Larson, D.F. Measures of fixed capital in agriculture. In Productivity Growth in Agriculture: An International Perspective; CABI: Wallingford, UK, 2012; pp. 313–334. [Google Scholar]
  39. Zheng, P.; Maharjan, K.L. Does Rural Labor Transfer Impact Chinese Agricultural Carbon Emission Efficiency? A Substitution Perspective of Agricultural Machinery. Sustainability 2024, 16, 5870. [Google Scholar] [CrossRef]
  40. Wen, S.; Hu, Y.; Liu, H. Measurement and Spatial–Temporal Characteristics of Agricultural Carbon Emission in China: An Internal Structural Perspective. Agriculture 2022, 12, 1749. [Google Scholar] [CrossRef]
  41. Yan, X.; Cai, Z.; Ohara, T.; Akimoto, H. Methane emission from rice fields in mainland China: Amount and seasonal and spatial distribution. J. Geophys. Res. Atmos. 2003, 108, 4505. [Google Scholar] [CrossRef]
  42. Huang, X.; Xu, X.; Wang, Q.; Zhang, L.; Gao, X.; Chen, L. Assessment of agricultural carbon emissions and their spatiotemporal changes in China, 1997–2016. Int. J. Environ. Res. Public Health 2019, 16, 3105. [Google Scholar] [CrossRef] [PubMed]
  43. Zou, X.; Li, Y.; Li, K.; Cremades, R.; Gao, Q.; Wan, Y.; Qin, X. Greenhouse gas emissions from agricultural irrigation in China. Mitig. Adapt. Strateg. Glob. Change 2015, 20, 295–315. [Google Scholar] [CrossRef]
  44. Qian, H.; Zhu, X.; Huang, S.; Linquist, B.; Kuzyakov, Y.; Wassmann, R.; Minamikawa, K.; Martinez-Eixarch, M.; Yan, X.; Zhou, F.; et al. Greenhouse gas emissions and mitigation in rice agriculture. Nat. Rev. Earth Environ. 2023, 4, 716–732. [Google Scholar] [CrossRef]
  45. Deng, O.; Ran, J.; Gao, X.; Lin, X.; Lan, T.; Luo, L.; Xiong, Y.; Liu, J.; Ou, D.; Fei, J.; et al. CH4 and CO2 emissions in water networks of rice cultivation regions. Environ. Res. 2023, 218, 115041. [Google Scholar] [CrossRef] [PubMed]
  46. Tang, J.; Liu, T.; Jiang, Y.; Nie, J.; Xing, J.; Zhang, L.; Zhang, W.; Tan, W.; Cao, C. Current status of carbon neutrality in Chinese rice fields (2002–2017) and strategies for its achievement. Sci. Total Environ. 2022, 842, 156713. [Google Scholar]
  47. Zhang, S.; Li, X.; Nie, Z.; Wang, Y.; Li, D.; Chen, X.; Liu, Y.; Pang, J. The Significance of Agricultural Modernization Development for Agricultural Carbon Emission Efficiency in China. Agriculture 2024, 14, 939. [Google Scholar] [CrossRef]
  48. Jiang, Q.; Li, Y.; Si, H. Digital Economy Development and the Urban–Rural Income Gap: Intensifying or Reducing. Land 2022, 11, 1980. [Google Scholar] [CrossRef]
  49. Zhang, H.; Guo, K.; Liu, Z.; Ji, Z.; Yu, J. How has the rural digital economy influenced agricultural carbon emissions? Agricultural green technology change as a mediated variable. Front. Environ. Sci. 2024, 12, 1372500. [Google Scholar] [CrossRef]
  50. Chen, N. The impact of the rural digital economy on China’s new-type urbanization. PLoS ONE 2025, 20, e0321663. [Google Scholar] [CrossRef] [PubMed]
  51. Hao, H.; Liu, C.; Xin, L. Measurement and Dynamic Trend Research on the Development Level of Rural Industry Integration in China. Agriculture 2023, 13, 2245. [Google Scholar] [CrossRef]
  52. Wang, Y.; Huang, H.; Liu, J.; Ren, J.; Gao, T.; Chen, X. Rural Industrial Integration’s Impact on Agriculture GTFP Growth: Influence Mechanism and Empirical Test Using China as an Example. Int. J. Environ. Res. Public Health 2023, 20, 3860. [Google Scholar] [CrossRef] [PubMed]
  53. Zhang, Z.; Shi, K.; Gao, Y.; Feng, Y. How does environmental regulation promote green technology innovation in enterprises? A policy simulation approach with an evolutionary game. J. Environ. Plan. Manag. 2025, 68, 979–1008. [Google Scholar] [CrossRef]
  54. Guo, Y.; Zhu, Y.; Zhang, Y. Study on the Mechanism and Spatial Characteristics of Technological Progress on Industrial Carbon Emission Intensity—An Empirical Analysis Based on Panel Quantile Regression. Bus. Econ. 2020, 39, 71–78. [Google Scholar]
  55. Hou, J.; Zhang, M.; Li, Y. Can digital economy truly improve agricultural ecological transformation? New insights from China. Humanit. Soc. Sci. Commun. 2024, 11, 153. [Google Scholar] [CrossRef]
  56. Huang, X.; Yang, F.; Fahad, S. The impact of digital technology use on farmers’ low-carbon production behavior under the background of carbon emission peak and carbon neutrality goals. Front. Environ. Sci. 2022, 10, 1002181. [Google Scholar] [CrossRef]
  57. Tang, K.; Yang, G. Does digital infrastructure cut carbon emissions in Chinese cities? Sustain. Prod. Consum. 2023, 35, 431–443. [Google Scholar] [CrossRef]
  58. Xu, L.; Jiang, J.; Du, J. The dual effects of environmental regulation and financial support for agriculture on agricultural green development: Spatial spillover effects and Spatio-temporal heterogeneity. Appl. Sci. 2022, 12, 11609. [Google Scholar] [CrossRef]
  59. Valin, H.; Havlík, P.; Mosnier, A.; Herrero, M.; Schmid, E.; Obersteiner, M. Agricultural productivity and greenhouse gas emissions: Trade-offs or synergies between mitigation and food security? Environ. Res. Lett. 2013, 8, 035019. [Google Scholar] [CrossRef]
  60. Zhao, C.; Liu, Z.; Yan, X. Does the Digital Economy Increase Green TFP in Cities? Int. J. Environ. Res. Public Health 2023, 20, 1442. [Google Scholar] [CrossRef] [PubMed]
  61. Dou, Q.; Gao, X. The double-edged role of the digital economy in firm green innovation: Micro-evidence from Chinese manufacturing industry. Environ. Sci. Pollut. Res. 2022, 29, 67856–67874. [Google Scholar] [CrossRef] [PubMed]
  62. Wang, S.; Feng, Y.; Jin, M.; Cao, F. How does farmers lease more agricultural land affect pesticide inputs? Microscopic evidence from Chinese farmers. Environ. Impact Assess. Rev. 2025, 115, 108024. [Google Scholar] [CrossRef]
  63. Qi, J.; Xu, J.; Jin, J.; Zhang, S. Digital Economy—Agriculture Integration Empowers Low-Carbon Transformation of Agriculture: Theory and Empirical Evidence. Sustainability 2025, 17, 2183. [Google Scholar] [CrossRef]
  64. Lai, Y.; Yang, H.; Qiu, F.; Dang, Z.; Luo, Y. Can Rural Industrial Integration Alleviate Agricultural Non-Point Source Pollution? Evidence from Rural China. Agriculture 2023, 13, 1389. [Google Scholar] [CrossRef]
  65. Zhang, H.; Qiu, T.; Li, C.; Ji, Z.; Zhang, B. Digital Economy, Rural Industry Integration, and Agricultural Carbon Emissions. Pol. J. Environ. Stud. 2025. [Google Scholar] [CrossRef] [PubMed]
  66. Wang, X.; Fan, G.; Hu, L. Report on Marketization Index by Province in China (2018); Social Sciences Academic Press: Beijing, China, 2019. (In Chinese) [Google Scholar]
  67. Chen, F.; Jiang, G. The nonlinear relationship between resource endowments and carbon emissions: Threshold effects of marketization degree and urban services agglomeration. Appl. Econ. 2024, 56, 7549–7562. [Google Scholar] [CrossRef]
  68. Zhu, S.; Huang, J.; Li, Y.; Maneejuk, P.; Liu, J. A Non-Linear Exploration of the Digital Economy’s Impact on Agricultural Carbon Emission Efficiency in China. Agriculture 2024, 14, 2245. [Google Scholar] [CrossRef]
  69. Li, J.; Sheng, X.; Zhang, S.; Wang, Y. Research on the Impact of the Digital Economy and Technological Innovation on Agricultural Carbon Emissions. Land 2024, 13, 821. [Google Scholar] [CrossRef]
  70. Li, Z.; Wang, J. The dynamic impact of digital economy on carbon emission reduction: Evidence city-level empirical data in China. J. Clean. Prod. 2022, 351, 131570. [Google Scholar] [CrossRef]
  71. Wang, R.; Zhang, Y.; Zou, C. How does agricultural specialization affect carbon emissions in China? J. Clean. Prod. 2022, 370, 133463. [Google Scholar] [CrossRef]
  72. Ma, S.; Li, J.; Wei, W. The carbon emission reduction effect of digital agriculture in China. Environ. Sci. Pollut. Res. 2022, 1–18, online ahead of print. [Google Scholar] [CrossRef] [PubMed]
  73. Wang, W.; Mei, T. Research on the Effect of Digital Economy Development on the Carbon Emission Intensity of Agriculture. Sustainability 2024, 16, 1457. [Google Scholar] [CrossRef]
  74. Chen, Y.; Li, M. How does the digital transformation of agriculture affect carbon emissions? Evidence from China’s provincial panel data. Humanit. Soc. Sci. Commun. 2024, 11, 713. [Google Scholar] [CrossRef]
Figure 1. The mechanism of the impact of rural digital economic development on agricultural carbon emission efficiency.
Agriculture 15 01583 g001
Figure 2. The spatiotemporal evolution of the rural digital economy development and agricultural carbon emission efficiency. ((a) 2011) Spatial characteristics of rural digital economy and agricultural carbon emission efficiency in 2011; ((b) 2016) Spatial characteristics of rural digital economy and agricultural carbon emission efficiency in 2016; ((c) 2022) Spatial characteristics of rural digital economy and agricultural carbon emission efficiency in 2022.
Agriculture 15 01583 g002aAgriculture 15 01583 g002b
Figure 3. The smooth curve graph of rural digital economy development and agricultural carbon emission efficiency.
Agriculture 15 01583 g003
Figure 4. The result of the causal relationship test (The dashed line represents p = 0.1). (a) The Monte Carlo simulation results of the linear term of the independent variable; (b) The Monte Carlo simulation results of the square term of the independent variable; (c) The Monte Carlo simulation results of the cubic term of the independent variable.
Agriculture 15 01583 g004
Table 1. Evaluation index system for agricultural carbon emission efficiency.
First-Level IndicatorSecond-Level IndicatorUnit
Input IndicatorsAgricultural fixed capital stockCNY 10,000
Crop planting areakha
Employees in the primary sector10,000 persons
Fertilizer application amount10,000 tons
Pesticide usage amount10,000 tons
The usage of agricultural films10,000 tons
Agricultural machinery input10,000 kWh
Desired OutputGross output value of agriculture, forestry, animal husbandry, and fisheryCNY 100 million
Undesired OutputAgricultural carbon emissions10,000 tons
Table 2. Agricultural carbon emission sources and carbon emission coefficients.
Carbon Emission SourceCarbon Emission CoefficientUnitReference Source
Fertilizer0.8956kg C/kgOak Ridge National Laboratory (ORNL), USA
Agricultural Film5.18kg C/kgInstitute of Resources, Environment and Ecosystem of Agriculture (IREEA), Nanjing Agricultural University
Pesticide4.9341kg C/kgOak Ridge National Laboratory (ORNL), USA
Diesel Fuel0.5927kg C/kgIntergovernmental Panel on Climate Change (IPCC)
Tillage312.6kg C/km2College of Agronomy and Biotechnology (IABCAU), China Agricultural University
Irrigation20.476kg C/hm2Zou et al. (2015) [43]
Rice Paddies3.1360g C/(m2·day)Qian et al., (2023) [44], Deng et al., (2023) [45], Tang et al., (2022) [46]
Pigs34.0910kg C/(head/year)Intergovernmental Panel on Climate Change (IPCC)
Cattle415.910kg C/(head/year)Intergovernmental Panel on Climate Change (IPCC)
Sheep35.1918kg C/(head/year)Intergovernmental Panel on Climate Change (IPCC)
Table 3. Evaluation system of rural digital economy development level indicators.
Primary LevelSecondary LevelMeasure (Impact Direction)Unit
Rural Digital InfrastructureInternet Popularity RateRural broadband subscribers/Total rural population (Positive)%
Mobile Phone CoverageNumber of mobile phones per 100 people (Positive)units
Computer PopularityNumber of computers per 100 households at year-end (Positive)units
Optical Fiber Cable LengthLength of optical cable lines per km2 (Positive)km
Fixed Asset Investment in Social Digital IndustryFixed asset investment in information transmission, software, and IT services (Positive)CNY billion
Fixed Asset Investment in Rural Digital ServicesFixed asset investment in rural transportation, warehousing, and postal services (Positive)CNY billion
Agricultural Production DigitizationRural Digital Talent PoolNumber of agricultural technicians (Positive)persons
Agricultural Electrification LevelAgriculture, forestry, animal husbandry, and fishery value added/Total rural electricity consumption (Positive)CNY/kWh
Rural Digital Production BasesNumber of Taobao Villages (Positive)number
Agricultural Environment MonitoringNumber of agro-meteorological observation stations (Positive)number
Rural Circulation DigitizationRural Delivery RoutesLength of postal routes serving rural users (Positive)km
Rural Postal Service AccessibilityAverage population served per rural postal outlet (Negative)10,000 persons
Rural Mail Delivery FrequencyAverage number of deliveries per week in rural areas (Positive)times
Rural Life DigitizationFarmers’ Digital Service ConsumptionPer capita rural resident expenditure on transport and communications (Positive)CNY
Rural Digital Payment PenetrationDigital Inclusive Finance Index (Positive)/
Rural Digital Transaction LevelRural retail sales of consumer goods (Positive)CNY billion
The symbol “/” indicates that this indicator is a comprehensive measurement index without any measurement units.
Table 4. Evaluation system of indicators for the integrated development of rural industries.
Variable NamePrimary IndicatorSecondary IndicatorMeasureProperty
Agricultural Industrial Convergence (CON)Agricultural Value Chain ExtensionPrimary–Secondary Sector IntegrationIncome From Processing of Agricultural Products as Main Business/Gross Output Value of Agriculture, Forestry, Animal Husbandry, and Fishery (%) (+)+
Primary–Tertiary Sector IntegrationOutput Value of Professional and Ancillary Activities in Agriculture, Forestry, Animal Husbandry, and Fishery/Gross Output Value of Agriculture, Forestry, Animal Husbandry, and Fishery (%) (+)+
Agricultural MultifunctionalityRecreational Agricultural DevelopmentAnnual Operating Income of Recreational Agriculture/Total Agricultural Output Value (%) (+)+
Green Agricultural DevelopmentChemical Fertilizer Application per Unit of Cultivated Area (tons/hectare) (−)
Development of New Business ModelsFacility Agricultural LevelFacility Agricultural Area/Total Cultivated Area (%) (+)+
Agricultural Technology Penetration RateAgricultural Mechanization LevelTotal Agricultural Machinery Power/Cultivated Area (kW/hectare) (+)+
Agricultural Labor ProductivityValue Added from Primary Industry/Number of Persons Employed in Primary Industry (CNY/person) (+)+
Improvement of Benefit-Sharing MechanismsNumber of Agricultural Cooperatives per 10,000 PeopleNumber of Agricultural Cooperatives in Rural Areas/Rural Population (number/10,000 persons) (+)+
The symbol “/” indicates that this indicator is a comprehensive measurement index without any measurement units.
Table 5. Descriptive statistics.
VariablesObsMeanSDMinMaxUnit
ACEE3600.3950.2340.1171.078/
RDE3600.1830.1000.0400.730/
TECH3602.9873.1030.03916.65pieces
CPI3609.4450.4398.27110.59CNY
ER3601.1470.7260.2194.240%
EDU3607.8600.6265.87810.11year
ADR36013.911.30.41569.5%
FSA36011.43.374.0420.4%
UR36060.112.035.089.6%
CON3600.0730.0420.0110.391/
The symbol “/” indicates that this indicator is a comprehensive measurement index without any measurement units.
Table 6. Benchmark regression results.
ACEEACEE
(1)(2)
RDE9.175 ***8.598 ***
(1.823)(2.427)
RDE 2−24.518 ***−22.080 ***
(4.783)(6.238)
RDE 320.184 ***17.546 ***
(4.239)(5.348)
Constant−0.501 ***1.527
(0.185)(4.818)
ControlsNoYes
Province FEYesYes
Time FEYesYes
Observations360360
R-Squared0.7670.785
Robust standard errors in parentheses: *** p < 0.01. In RDE 2 and RDE 3, the superscripts 2 and 3 represent their squared and cubic terms respectively.
Table 7. Results of robustness tests.
VariablesModified Sample PeriodApplied 1% WinsorizationIncorporated Additional Control VariablesPCA
(4)
Endogeneity
(5)
(1)(2)(3)
RDE6.182 **12.233 ***5.248 **0.0469 *25.517 ***
(2.745)(2.999)(2.270)(0.0275)(9.781)
RDE 2−15.672 **−35.579 ***−14.954 **−0.0345 ***−64.728 ***
(7.552)(9.538)(5.865)(0.00746)(24.859)
RDE 312.124 *32.998 ***11.888 **0.00436 ***52.320 **
(6.560)(9.941)(5.050)(0.00134)(20.598)
AIS −1.056 ***
(0.307)
AP 0.032 ***
(0.003)
Constant−9.0732.9973.0932.301
(8.527)(4.484)(4.612)(2.154)
ControlsYesYesYesYesYes
Province FEYesYesYesYesYes
Time FEYesYesYesYesYes
Kleibergen–Paap rk LM 10.134
Kleibergen–Paap rk Wald F 10.886
Observations240360360360308
R-Squared0.8070.7920.8350.7780.115
Robust standard errors in parentheses: *** p < 0.01, ** p < 0.05, * p < 0.1. In RDE 2 and RDE 3, the superscripts 2 and 3 represent their squared and cubic terms respectively.
Table 8. Mechanism regression results.
VariablesConACEE
(1)(2)
Con 0.890 **
(0.336)
RDE0.483 **8.169 ***
(0.202)(2.384)
RDE 2−1.264 **−20.956 ***
(0.465)(6.151)
RDE 31.109 ***16.560 ***
(0.381)(5.268)
Constant−0.4361.915
(0.368)(4.645)
ControlsYesYes
Province FEYesYes
Time FEYesYes
Observations360360
R-Squared0.6180.795
Robust standard errors in parentheses: *** p < 0.01, ** p < 0.05. In RDE 2 and RDE 3, the superscripts 2 and 3 represent their squared and cubic terms respectively.
Table 9. Heterogeneity test results (A).
VariablesHeterogeneity by Marketization LevelRegional Heterogeneity
High Marketization
(1)
Low Marketization
(2)
Southeastern Region
(3)
Northwestern Region (4)
RDE3.709 *12.902 *8.516 ***18.944
(2.057)(6.295)(2.007)(19.048)
RDE 2−9.684 **−55.642 *−21.199 ***−124.318
(3.811)(30.727)(5.015)(152.089)
RDE 37.077 **69.44716.467 ***298.661
(2.585)(44.903)(4.183)(389.813)
Constant0.0025.9306.643 *−7.581 ***
(3.479)(6.000)(3.614)(2.570)
ControlsYesYesYesYes
Province FEYesYesYesYes
Time FEYesYesYesYes
Observations180180252108
R-Squared0.8800.7830.8350.543
Robust standard errors in parentheses: *** p < 0.01, ** p < 0.05, * p < 0.1. In RDE 2 and RDE 3, the superscripts 2 and 3 represent their squared and cubic terms respectively.
Table 10. Heterogeneity test results (B).
VariablesDifferent Dimensions of Rural Digital EconomyHeterogeneity in Rural Digital Economy Development Levels
Rural Digital Infrastructure
(1)
Agricultural Production Digitization
(2)
Rural Circulation Digitization
(3)
Rural Life Digitization (4)Representative Provinces
(5)
Other Provinces
(6)
RDE3.9772.987 **66.140 ***13.30 ***6.452 **14.60 *
(4.336)(1.335)(14.262)(4.241)(2.617)(8.521)
RDE 2−45.283−20.337 **−1202.700 ***−126.5 **−13.14 **−71.45
(39.665)(7.878)(374.271)(60.79)(5.975)(48.64)
RDE 3105.65931.907 **6714.240 **374.98.614 *104.5
(126.659)(12.571)(3207.359)(332.4)(4.379)(93.10)
Constant1.150−0.4892.6203.1241.1564.657
(3.192)(3.026)(2.825)(3.134)(3.773)(3.410)
ControlsYesYesYesYesYesYes
Province FEYesYesYesYesYesYes
Time FEYesYesYesYesYesYes
Observations360360360360108204
R-Squared0.7690.7650.8030.7690.9000.775
Robust standard errors in parentheses: *** p < 0.01, ** p < 0.05, * p < 0.1. In RDE 2 and RDE 3, the superscripts 2 and 3 represent their squared and cubic terms respectively.
Table 11. Global Moran’s index statistical values of ACEE from 2011 to 2022.
YearMoran’s Indexp ValueZ Statistical ValueYearMoran’s Indexp ValueZ Statistical Value
20110.4350.0004.05420170.3940.0003.528
20120.4930.0004.55220180.2940.0072.695
20130.5140.0004.78620190.1620.1031.629
20140.5060.0004.77620200.1860.0721.799
20150.3220.0023.11920210.2210.0402.049
20160.4350.0003.97820220.1210.2101.253
Table 12. Test results of LM, LR, Wald, and Hausman.
Test TypeTest ObjectiveTest Statistic
LM TestLM-error15.665 ***
R-LM-error42.512 ***
LM-lag0.851
R-LM-lag27.698 ***
Wald TestWald (sdm sar)26.80 ***
Wald (sdm sem)22.13 ***
LR TestLR (sdm sar)25.55 ***
LR (sdm sem)21.21 ***
Hausman TestProvince64.26 ***
Time366.83 ***
Robust standard errors in parentheses: *** p < 0.01.
Table 13. Test results of spatial spillover effect.
VariablesLR_DirectLR_IndirectLR_Total
(1)(2)(3)
RDE7.618 ***6.999 **14.62 ***
(1.612)(2.909)(2.422)
RDE 2−20.06 ***−17.79 **−37.84 ***
(4.134)(7.608)(6.702)
RDE 315.85 ***15.49 **31.35 ***
(3.642)(6.612)(6.022)
ControlsYesYesYes
Province FEYesYesYes
Time FEYesYesYes
Observations360360360
R-Squared0.0030.0030.003
Robust standard errors in parentheses: *** p < 0.01, ** p < 0.05. The numbers 2, 3 respectively represent the square term and the cubic term of the core explanatory variable.
Disclaimer/Publisher’s Note: The statements, opinions and data contained in all publications are solely those of the individual author(s) and contributor(s) and not of MDPI and/or the editor(s). MDPI and/or the editor(s) disclaim responsibility for any injury to people or property resulting from any ideas, methods, instructions or products referred to in the content.