Abstract
This study aims to characterize the emissions of ammonia (NH3) and methane (CH4) from naturally ventilated dairy barns located in cold regions during the winter season, thereby providing a scientific basis for optimizing dairy barn environmental management. The target barn was selected at a commercial dairy farm in Ulanchab, Inner Mongolia, China. Environmental factors, including temperature, humidity, wind speed, and concentrations of NH3, CH4, and CO2, were monitored both inside and outside the barn. The ventilation rate and emission rate were calculated using the CO2 mass balance method. Additionally, NH3 and CH4 emission prediction models were developed using the adaptive neural fuzzy inference system (ANFIS). Correlation analyses were conducted to clarify the intrinsic links between environmental factors and NH3 and CH4 emissions, as well as the degree of influence of each factor on gas emissions. The ANFIS model with a Gaussian membership function (gaussmf) achieved the highest performance in predicting NH3 emissions (R2 = 0.9270), while the model with a trapezoidal membership function (trapmf) was most accurate for CH4 emissions (R2 = 0.8977). The improved ANFIS model outperformed common models, such as multilayer perceptron (MLP) and radial basis function (RBF). This study revealed the significant effects of environmental factors on NH3 and CH4 emissions from dairy barns in cold regions and provided reliable data support and intelligent prediction methods for realizing the precise control of gas emissions.
1. Introduction
Globally, the rapid development of livestock production has significantly enhanced the supply of animal-derived food. However, this process also raises increasing environmental concerns. Among them, gases such as NH3 and CH4 emitted from livestock production pose a major threat to ecosystems and human health [1]. NH3 is an important precursor to acid rain, eutrophication of water bodies, and soil acidification, and it also contributes to reduced biodiversity. However, CH4, a powerful greenhouse gas, exhibits a significantly higher global warming potential compared to CO2. Livestock contributes about one-third of the total anthropogenic emissions of CH4 [2]. Therefore, accurate estimation and effective control of NH3 and CH4 emissions during livestock production have become a pressing and challenging issue in global environmental science research [3]. Obviously, NH3 and CH4 not only impose environmental burdens on the atmosphere but also present multifaceted challenges to animal welfare (including compromised health [4], reduced milk yield [5], and altered behavior, characterized by decreased lying time [6]) and to the sustainable development of livestock operations. Therefore, an in-depth study of the emission characteristics of NH3 and CH4 from livestock production is of significant theoretical and practical importance. It also helps achieve synergy between environmental protection and sustainable development.
The issue of gas emissions from livestock production has attracted considerable attention from numerous scholars, who have employed a variety of methods (including gas emission measurements, spot air sampling, tracer gas methods, and micrometeorological techniques) to investigate the underlying mechanisms and characteristics [7,8]. For instance, Rodrigues et al. [1] employed the CO2 mass balance method to quantify NH3 and CH4 emissions from naturally ventilated dairy barns. Zhao et al. [9] investigated winter greenhouse gas and NH3 emissions from dairy barns with a leaky floor and a solid floor using an improved CO2 mass balance method for ventilation calculation. Kammer et al. [10] estimated NH3 emission rates using the CO2 mass balance method and analyzed the characteristics of gaseous pollutants in dairy barns by combining online and offline measurement techniques. Tabase et al. [11] assessed the impacts of three different ventilation strategies on NH3 and odor emissions by adjusting ventilation control settings in a pig house. Shi et al. [12] measured the concentrations and emission rates of NH3 in typical dairy barns in central China during summer using Nessler’s reagent spectrophotometric method and analyzed the factors influencing the emissions. These studies have highlighted the complexity and variability of gas emissions from livestock farms through field measurements, which laid the foundation for subsequent model development and application. However, measurement methods, though providing direct and accurate data, are often costly and challenging for long-term continuous monitoring. In contrast, model-based forecasting methods offer rapid and cost-effective solutions through mathematical modeling and data analysis. The accuracy of these methods relies on the quality of input data and the validity of model assumptions. Consequently, scholars have increasingly explored more integrated approaches that combine field measurements with advanced modeling techniques to more accurately predict and control gas emissions.
For example, Xie et al. [13] used the ANFIS model to predict NH3 emissions from fattening pig houses, demonstrating the model’s ability to handle complex environmental data. Rychla et al. [14] developed a comprehensive framework for assessing the costs of NH3 abatement measures by combining the greenhouse gas–air pollution interactions and synergies model with country-specific cost estimation methods. Additionally, Ding et al. [15] developed a predictive model for NH3 emissions by integrating environmental factors, including temperature and relative humidity, in chicken houses using various machine learning methods, namely random forests and other advanced algorithms. They also analyzed the impact of each factor on the model performance. Petersen et al. [2] employed an experimental approach based on in vitro anaerobic incubation and an empirical model (Arrhenius temperature response function) to estimate CH4 emissions from liquid manure management on pig and dairy farms. Xie et al. [16] used a hybrid deep learning model coupled with a health-related ventilation control strategy to estimate the emissions of NH3, CO2, and H2S in pig houses. Hempel et al. [17] coupled multiple mechanistic models to establish a barn-scale model for predicting NH3 emissions from dairy barns, aiming to reduce measurement effort and improve prediction accuracy. Liu and Ni [18] identified and predicted the factors influencing NH3 emissions from pig houses using multivariate regression and panel data analysis. Although existing studies have made significant progress in model development and application, some limitations still exist in the existing studies. Previous studies have predominantly concentrated on swine barns or temperate dairy housing, whereas systematic models for the nonlinear emission dynamics driven by extreme cold and intermittent ventilation in naturally ventilated dairy barns in cold regions remain lacking. This work constitutes the first application of ANFIS coupled with multivariate analysis under −30 °C conditions, thereby addressing the absence of high-accuracy predictive frameworks in this domain.
This study aimed to develop and optimize an ANFIS-based emission prediction model, thereby characterizing wintertime NH3 and CH4 emission patterns in naturally ventilated dairy barns located in cold regions, and to provide a robust modeling framework and scientific basis for precision environmental management of such facilities. Environmental factors were obtained through field monitoring, including temperature, humidity, wind speed, and concentrations of NH3, CH4, and CO2. The ventilation volume and emission rate were calculated using the CO2 mass balance method. The gas emission prediction models were established using the ANFIS method. The effects of different membership functions on model performance were compared to determine the optimal model parameter settings. Additionally, the improved ANFIS model was compared with traditional models (MLP and RBF) to verify its superiority, thereby providing a scientific basis and intelligent prediction tool for optimizing dairy barn environmental management.
2. Materials and Methods
2.1. Targeted Barn and Measurement Points
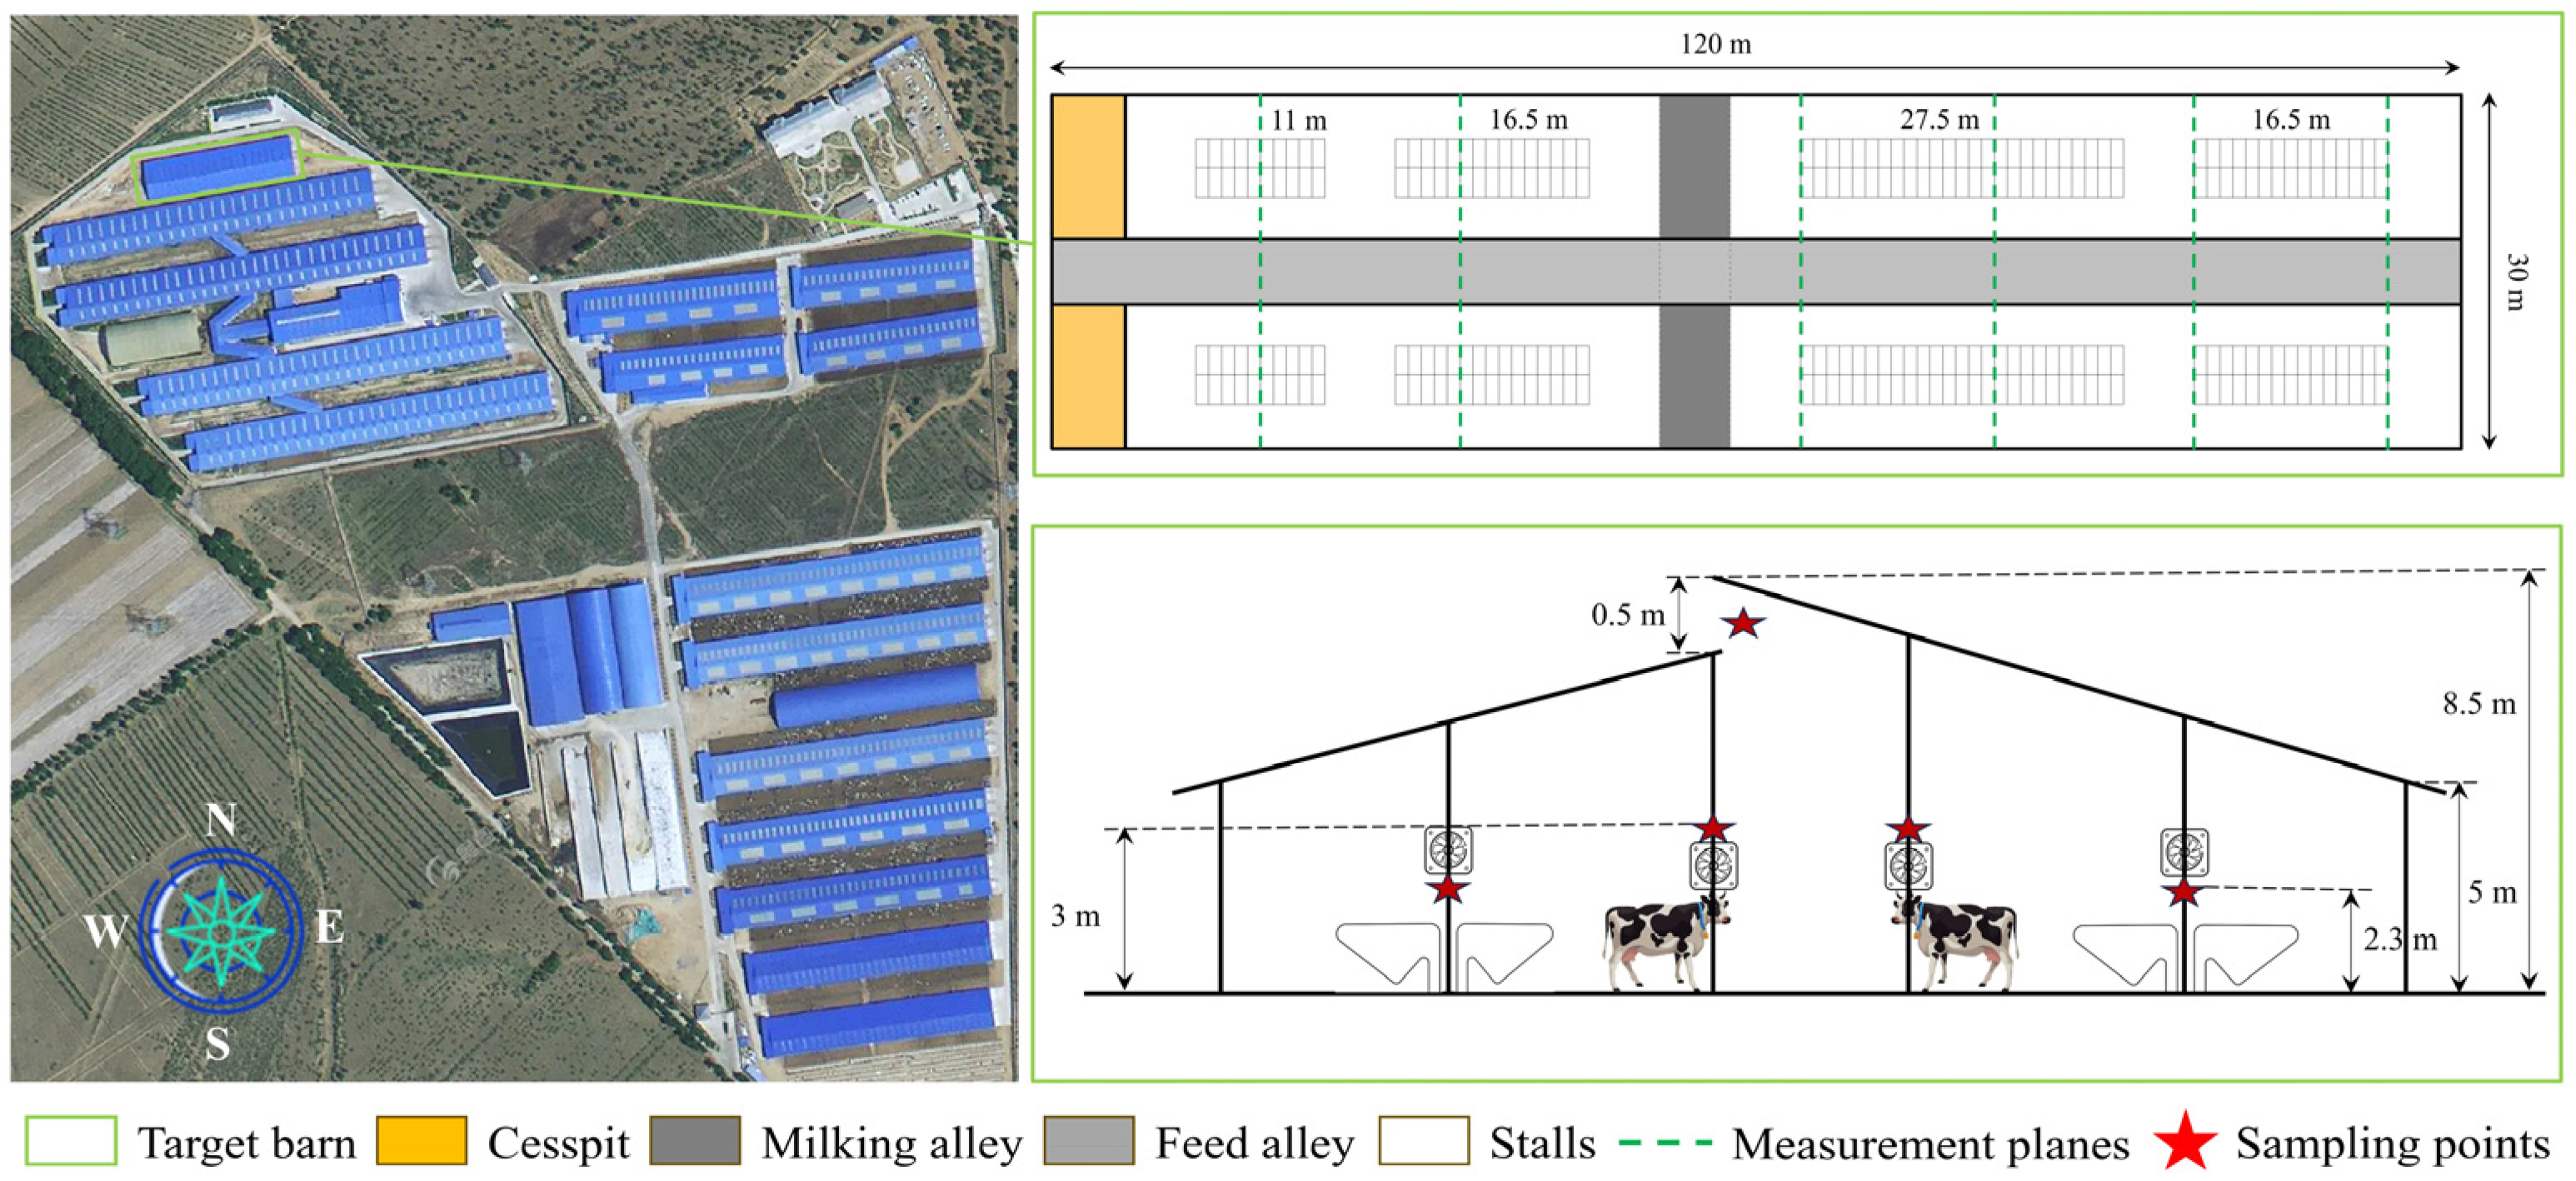
This experiment was conducted on a commercial dairy farm in Ulanqab, Inner Mongolia, China (latitude: 40.5° N, longitude: 112.85° E, altitude: 1333 m). The predominant wind direction at Ulanqab was from northwest to southeast. The average temperature was −12.71 °C, and the average relative humidity was 54.48% during winter. As shown in Figure 1, the target barn was located in the upper left corner of the building complex. The barn was oriented east–west, with a length of 120 m, a span of 30 m, an eave height of 5 m, and a ridge height of 8.5 m. The roof incline typically ranged from 3° to 30° [19]. In this study, the roof inclines were set at 11.3° (north) and 13.5° (south). The barn contained two corrals, each with four resting areas, housing a total of 210 lactating cows. The barn had 260 stall beds, each measuring 2.4 m × 1.1 m × 1.7 m. During the winter months, ventilation openings of 0.3 m were maintained in the south walls. No active ventilation control measures were implemented during the winter. Additionally, all doors were kept closed except for the east and west doors, which were briefly opened during daily feeding, manure removal, and experiment operations.
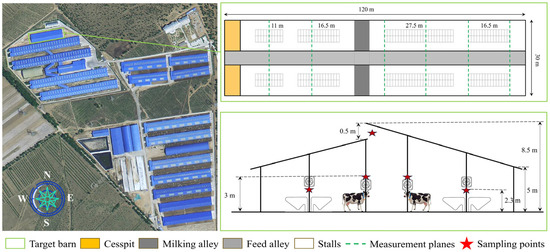
Figure 1.
The target dairy barn and sensor measurement points distribution.
In this study, Holstein and Simmental cows were housed in distinct groups. Cows were categorized into three herds based on days postpartum, body condition score, and milk production level: the newborn cows (up to 30 days postpartum), the high-yielding cows, and the low-yielding cows. The newborn and high-yielding herds were milked three times daily, at 09:00, 17:00, and 03:00. The low-yielding herds were milked twice daily, at 09:00 and 17:00. Manure removal from the barn was conducted three times daily, coinciding with the cows’ milking times. Total mixed ration (TMR) was provided to the dairy cows twice daily, specifically at 09:00 and 17:00. The diet formulations included dried beet pulp, flaked corn, corn silage, whole cottonseed, alfalfa, and concentrate supplements. The concentrate supplement contained corn, soybean meal, vegetable meal, dry distiller’s grains with solubles (DDGS), expanded soybeans, calcium fatty acids, baking soda, and premixes [20]. Note that, during the trial, lactation stage, age, and body condition score remained stable across groups; therefore, these parameters were not included as additional covariates. The associated variation was accounted for by the fixed group assignment and the proxy variable of daily milk yield. Descriptive statistics for parity, days in milk, and daily milk yield per group can be provided upon request.
The distribution of monitoring points for environmental factors in the target dairy barns is shown in Figure 1. The instruments used for measurement included a meteorological station (Shandong Renke Measurement and Control Technology Co., LTD), air temperature inside the barn (range: −40 to 80 °C; accuracy: ±0.5 °C), relative humidity inside the barn (range: 0 to 95% RH; accuracy: ±3% RH), CO2 concentration inside the barn (range: 0 to 5000 ppm; accuracy: ±3% of the measured value), NH3 concentration inside the barn (range: 0 to 50 ppm; accuracy: ±8% of the measured value), CH4 concentration inside the barn (range: 0 to 500 ppm; accuracy: ±5% of the measured value), and air quality PM2.5/PM10 (range: 0 to 1000 μg m−3; accuracy: ±3% of the measured value). Six cross-sections in the east–west direction were selected for temperature, humidity, and air quality sensor measurement points (green dashed lines in Figure 1). Sampling points were placed above the north and south stall beds, on both sides of the feed alley, and below the ridge vents, totaling 30 measurement points. Gas concentration sensors for NH3, CH4, and CO2 were positioned above the stall beds in the middle four sections, with eight measurement points in each section. The sensors above the stall beds were placed at a height of 2.3 m. To prevent interference from the TMR delivery truck, sensors located above the feed alley were installed at a height of 3.0 m. The experiment was conducted from 1 December 2024 to 28 February 2025 and recorded automatically every 5 min. To ensure the accuracy of the monitoring data, all sensors were rigorously calibrated before the experiment. The calibration involved comparing sensor readings with a reference instrument and adjusting the output to match standard values. Calibration was performed semi-monthly to ensure the accuracy of the sensors throughout the experiment. Additionally, calibration data were recorded after each calibration to correct any deviations during data analysis.
2.2. Ventilation Rate and Emission Rate
The CO2 mass balance method, as recommended by CIGR (2002) [21], has been extensively applied to measure ventilation rates in naturally ventilated barns. The method is grounded in the principle that animals are the primary source of CO2 emissions within the barn, while also accounting for CO2 emissions from manure and bedding materials [22]. The ventilation rate is estimated by monitoring CO2 concentrations inside and outside the barn. Therefore, based on the principle of CO2 concentration equilibrium in the barn [23], the ventilation rate of the barn was determined using the following equation:
where VR is the ventilation rate, m3 HPU−1 h−1; CO2,in is the CO2 concentration inside the barn, g m−3; CO2,out is the CO2 concentration outside the barn, g m−3; and PCO2 is the CO2 production per heat production unit (HPU) per hour, g HPU−1 h−1. The manure pit contributes 10% to the total CO2 production per HPU, with PCO2 = 0.2 m3 HPU−1 h−1. HPU is the number of heat production units (1 HPU = 1000 W). a is a constant representing the amplitude of activity relative to the daily average activity (where the 24 h average activity is normalized to 1). hmin is the time of day with minimum activity. h is the current time.
Emission rates were computed by multiplying the ventilation rate by the gas concentration [3]. The gas emission rate was determined using the following equation:
where ER is the target gas emissions, g HPU−1 h−1; Cin is the gas concentration inside the barn, g m−3; and Cout is the gas concentration outside the barn, g m−3. Note that in this study Cin is the average of the gas concentrations inside the barn.
2.3. Preprocessing of Data
The study was conducted from 1 December 2024 to 28 February 2025, encompassing the entire winter period. A total of 25,891 datasets were processed using MATLAB R2023a to address missing values and outliers resulting from sensor failures or production activities. Linear interpolation was employed to impute missing values and to substitute outliers [24]. Outliers were identified using a moving median method with a threshold set at 3 times the standard deviation. Data were recorded at 5 min intervals and subsequently averaged on an hourly and daily basis for analysis. Detailed statistics of the hourly average values of environmental factors during winter are presented in Table 1.

Table 1.
The hourly average results of environmental factors in winter.
2.4. ANFIS Model
To deeply investigate the complex relationships between environmental factors in dairy barns and their effects on NH3 and CH4 emissions, the ANFIS modeling approach was used. ANFIS has a five-layer structure, with each layer representing a different function: an input layer, a membership function layer, a rule layer, a normalization layer, and an output layer. The ANFIS structure is illustrated in Figure 2. In this study, 70% of the dataset was randomly selected as the training set and the remaining 30% as the test set. The model’s input variables were the collected environmental factors, while the output variables were the gas emissions. Training set data were imported into the model, and the grid partition method was used to generate the initial fuzzy inference system. The error tolerance of the model was set to 0, and the number of epochs was set to 100. In the fuzzification process, eight different types of membership functions were selected, including triangular (trimf), trapezoidal (trapmf), generalized bell (gbellmf), Gaussian (gaussmf), two-sided Gaussian (gauss2mf), pi-shaped (pimf), difference of two sigmoidal (dsigmf), and product of two sigmoidal (psigmf). For more details on membership functions, see Yu et al. [25]. For the output variable, the constant membership function was chosen. Specific details of the ANFIS model expression can be found in Xie et al. [13].
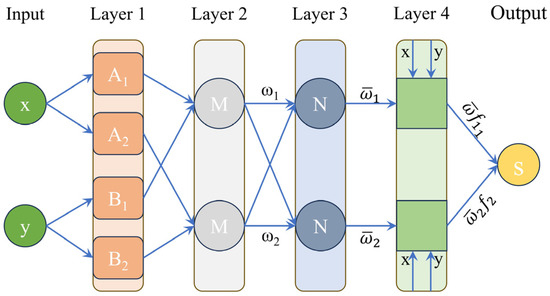
Figure 2.
The ANFIS structure.
2.5. Model Evaluation
The coefficient of determination (R2), normalized root mean square error (NRMSE), and mean absolute percentage error (MAPE) [26] were used as evaluation indicators to compare the prediction performances of different models.
where ai is the measured value, ti is the predicted value, n is the total number of experiments, and is the average of the experimental data.
3. Results
3.1. Monthly and Daily Emissions
3.1.1. NH3 Emissions
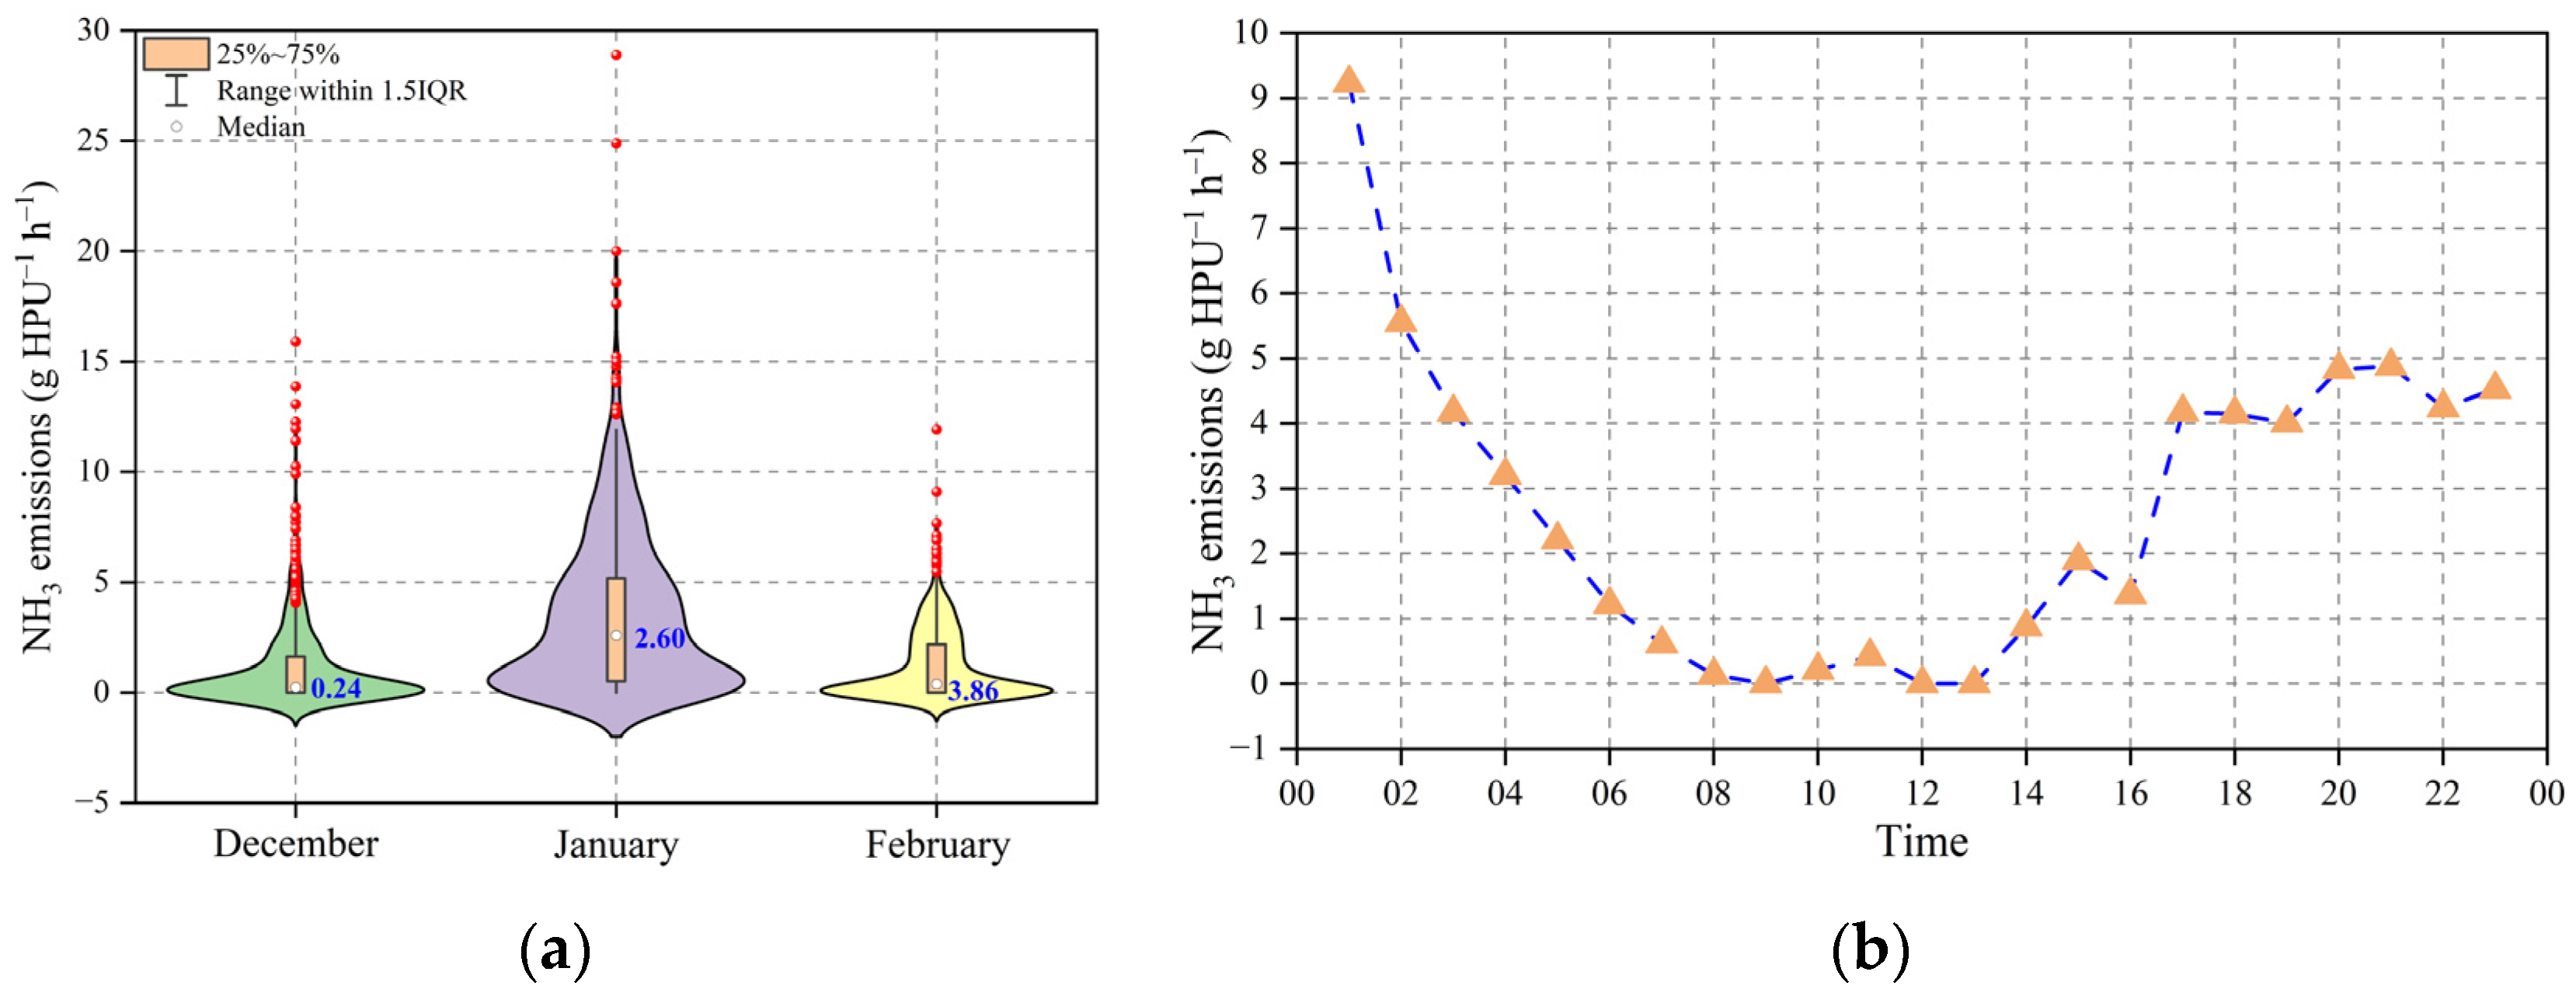
The monthly variations in hourly averaged NH3 emissions from dairy barns are shown in Figure 3a. The median NH3 emissions in December, January, and February were 0.24 g HPU−1 h−1, 2.60 g HPU−1 h−1, and 3.86 g HPU−1 h−1, respectively. Median emissions in January were significantly higher than those in December and February. In contrast, the median emissions for December and February were relatively low and close to each other, indicating more consistent emission levels between these two months. Additionally, the January emissions were more tightly distributed with several outliers (marked by red dots) indicating potential peaks in NH3 emissions under specific conditions. In contrast, the emissions for December and February were more dispersed with fewer outliers, indicating more stable emissions overall. This monthly variation may be closely related to management and environment in the dairy barns. The moisture content of manure and feed, which varies across different months, as well as the application of bedding materials, may also significantly influence NH3 emissions.
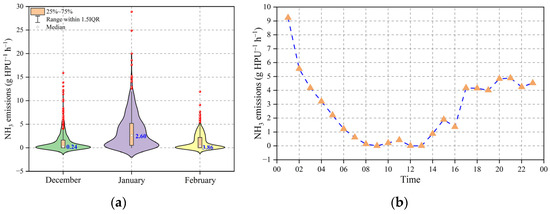
Figure 3.
The monthly and daily variations in hourly averaged NH3 emissions: (a) monthly (b) daily.
The daily variations in hourly averaged NH3 emissions are shown in Figure 3b. NH3 emissions exhibit pronounced fluctuations throughout the day. NH3 emissions peaked at midnight near 9 g HPU−1 h−1. Subsequently, emissions declined rapidly and remained at a low level, around 1 g HPU−1 h−1, between 02:00 and 08:00. This variation is likely attributable to reduced cow activity and fecal production at night. From 08:00 onwards, NH3 emissions began to rise gradually until a sub-peak was reached around 16:00, with emissions of about 4 g HPU−1 h−1. This upward variation may be due to increased cow activity and fecal production during the day. However, emissions did not peak in the early morning hours, which may be related to better ventilation conditions during the day, facilitating NH3 diffusion and dilution. Between 16:00 and 20:00, NH3 emissions once again showed a decreasing trend. However, they began to rise gradually after 20:00 until they reached a relatively high level of about 5 g HPU−1 h−1 at midnight of the next day. This increase in nighttime emissions may be related to poorer ventilation conditions and NH3 accumulation. Overall, the characteristics of NH3 emissions in dairy barns is closely related to cow activity, ventilation rate, and other factors. Emissions are higher in the early morning hours and at night, while daytime emissions are relatively low. This characteristic provides a crucial basis for the development of rational ventilation management measures to reduce NH3 emissions. Enhancing ventilation during peak emission periods can effectively reduce NH3 concentrations, thereby improving the environmental quality of dairy barns.
3.1.2. CH4 Emissions
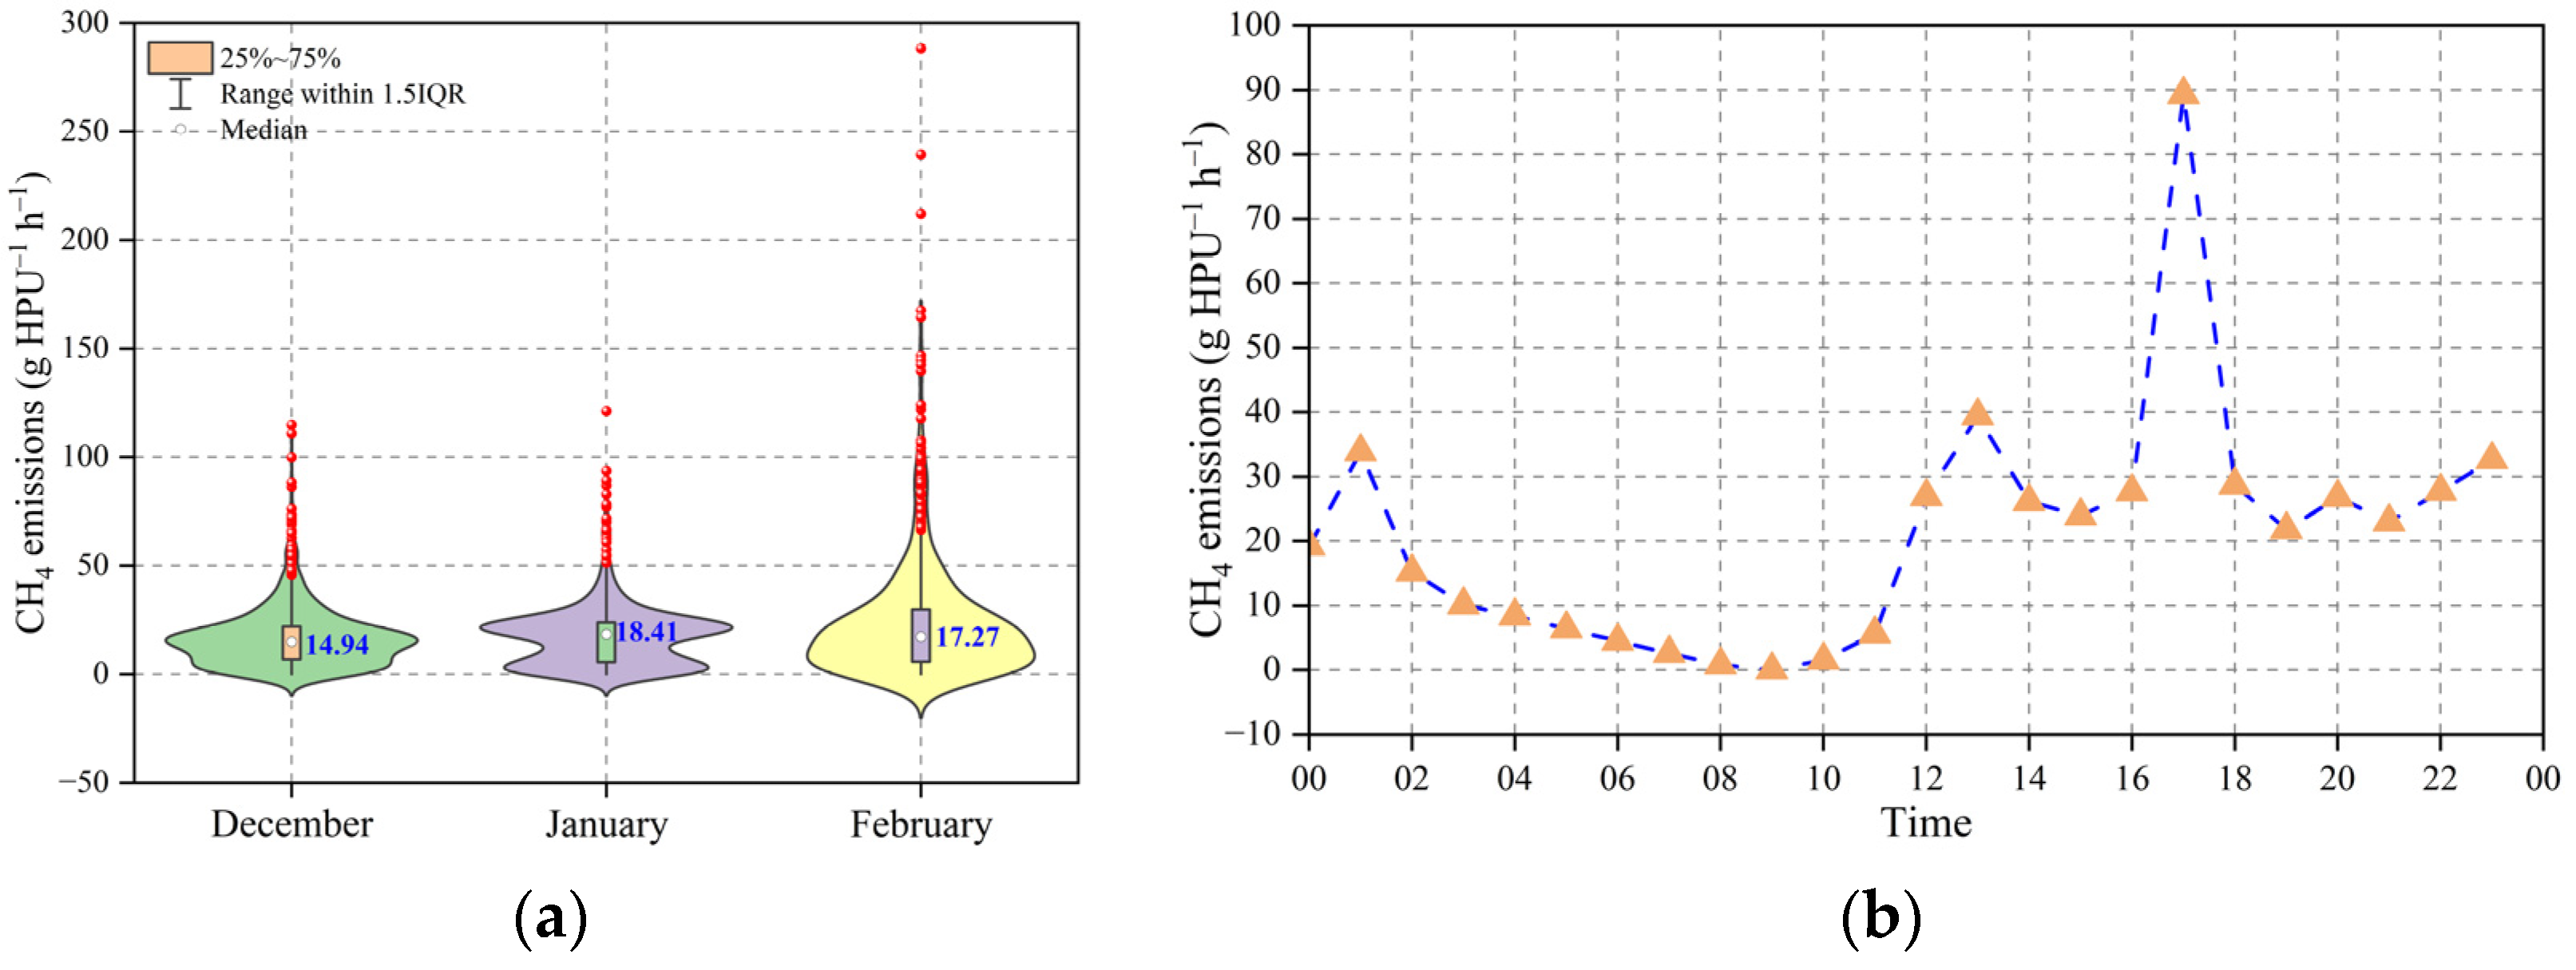
The monthly variations in hourly averaged CH4 emissions from dairy barns are shown in Figure 4a. The analysis revealed that the median CH4 emissions in December, January, and February were 14.94 g HPU−1 h−1, 18.41 g HPU−1 h−1, and 17.27 g HPU−1 h−1, respectively. The median emissions in these three months were relatively consistent, indicating a more stable level of CH4 emissions. The emissions for these three months were more tightly distributed and were accompanied by several outliers (red dots), which may indicate peak CH4 emissions under specific conditions.
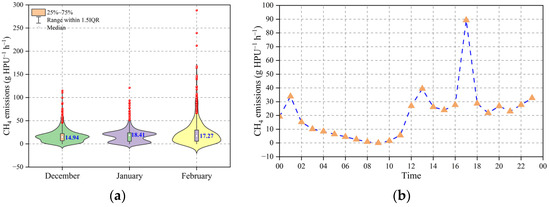
Figure 4.
The monthly and daily variations in hourly averaged CH4 emissions: (a) monthly (b) daily.
The daily variations in hourly averaged CH4 emissions are shown in Figure 4b. CH4 emissions exhibit marked fluctuations throughout the day. At midnight, CH4 emissions started at a relatively low level. This was followed by a small peak around 02:00, with emissions reaching approximately 30 g HPU−1 h−1. After that, the emissions gradually decreased and remained at a low level, close to 0 g HPU−1 h−1, between 06:00 and 10:00. From 10:00 onwards, CH4 emissions began to rise gradually and peaked at around 16:00, reaching nearly 90 g HPU−1 h−1. Emissions then declined, reaching a lower level around 20:00, but showed a slight increase at 22:00. Notably, daily variations in CH4 emissions in this study are in agreement with those reported by Tabase et al. [3] and Rodrigues et al. [1].
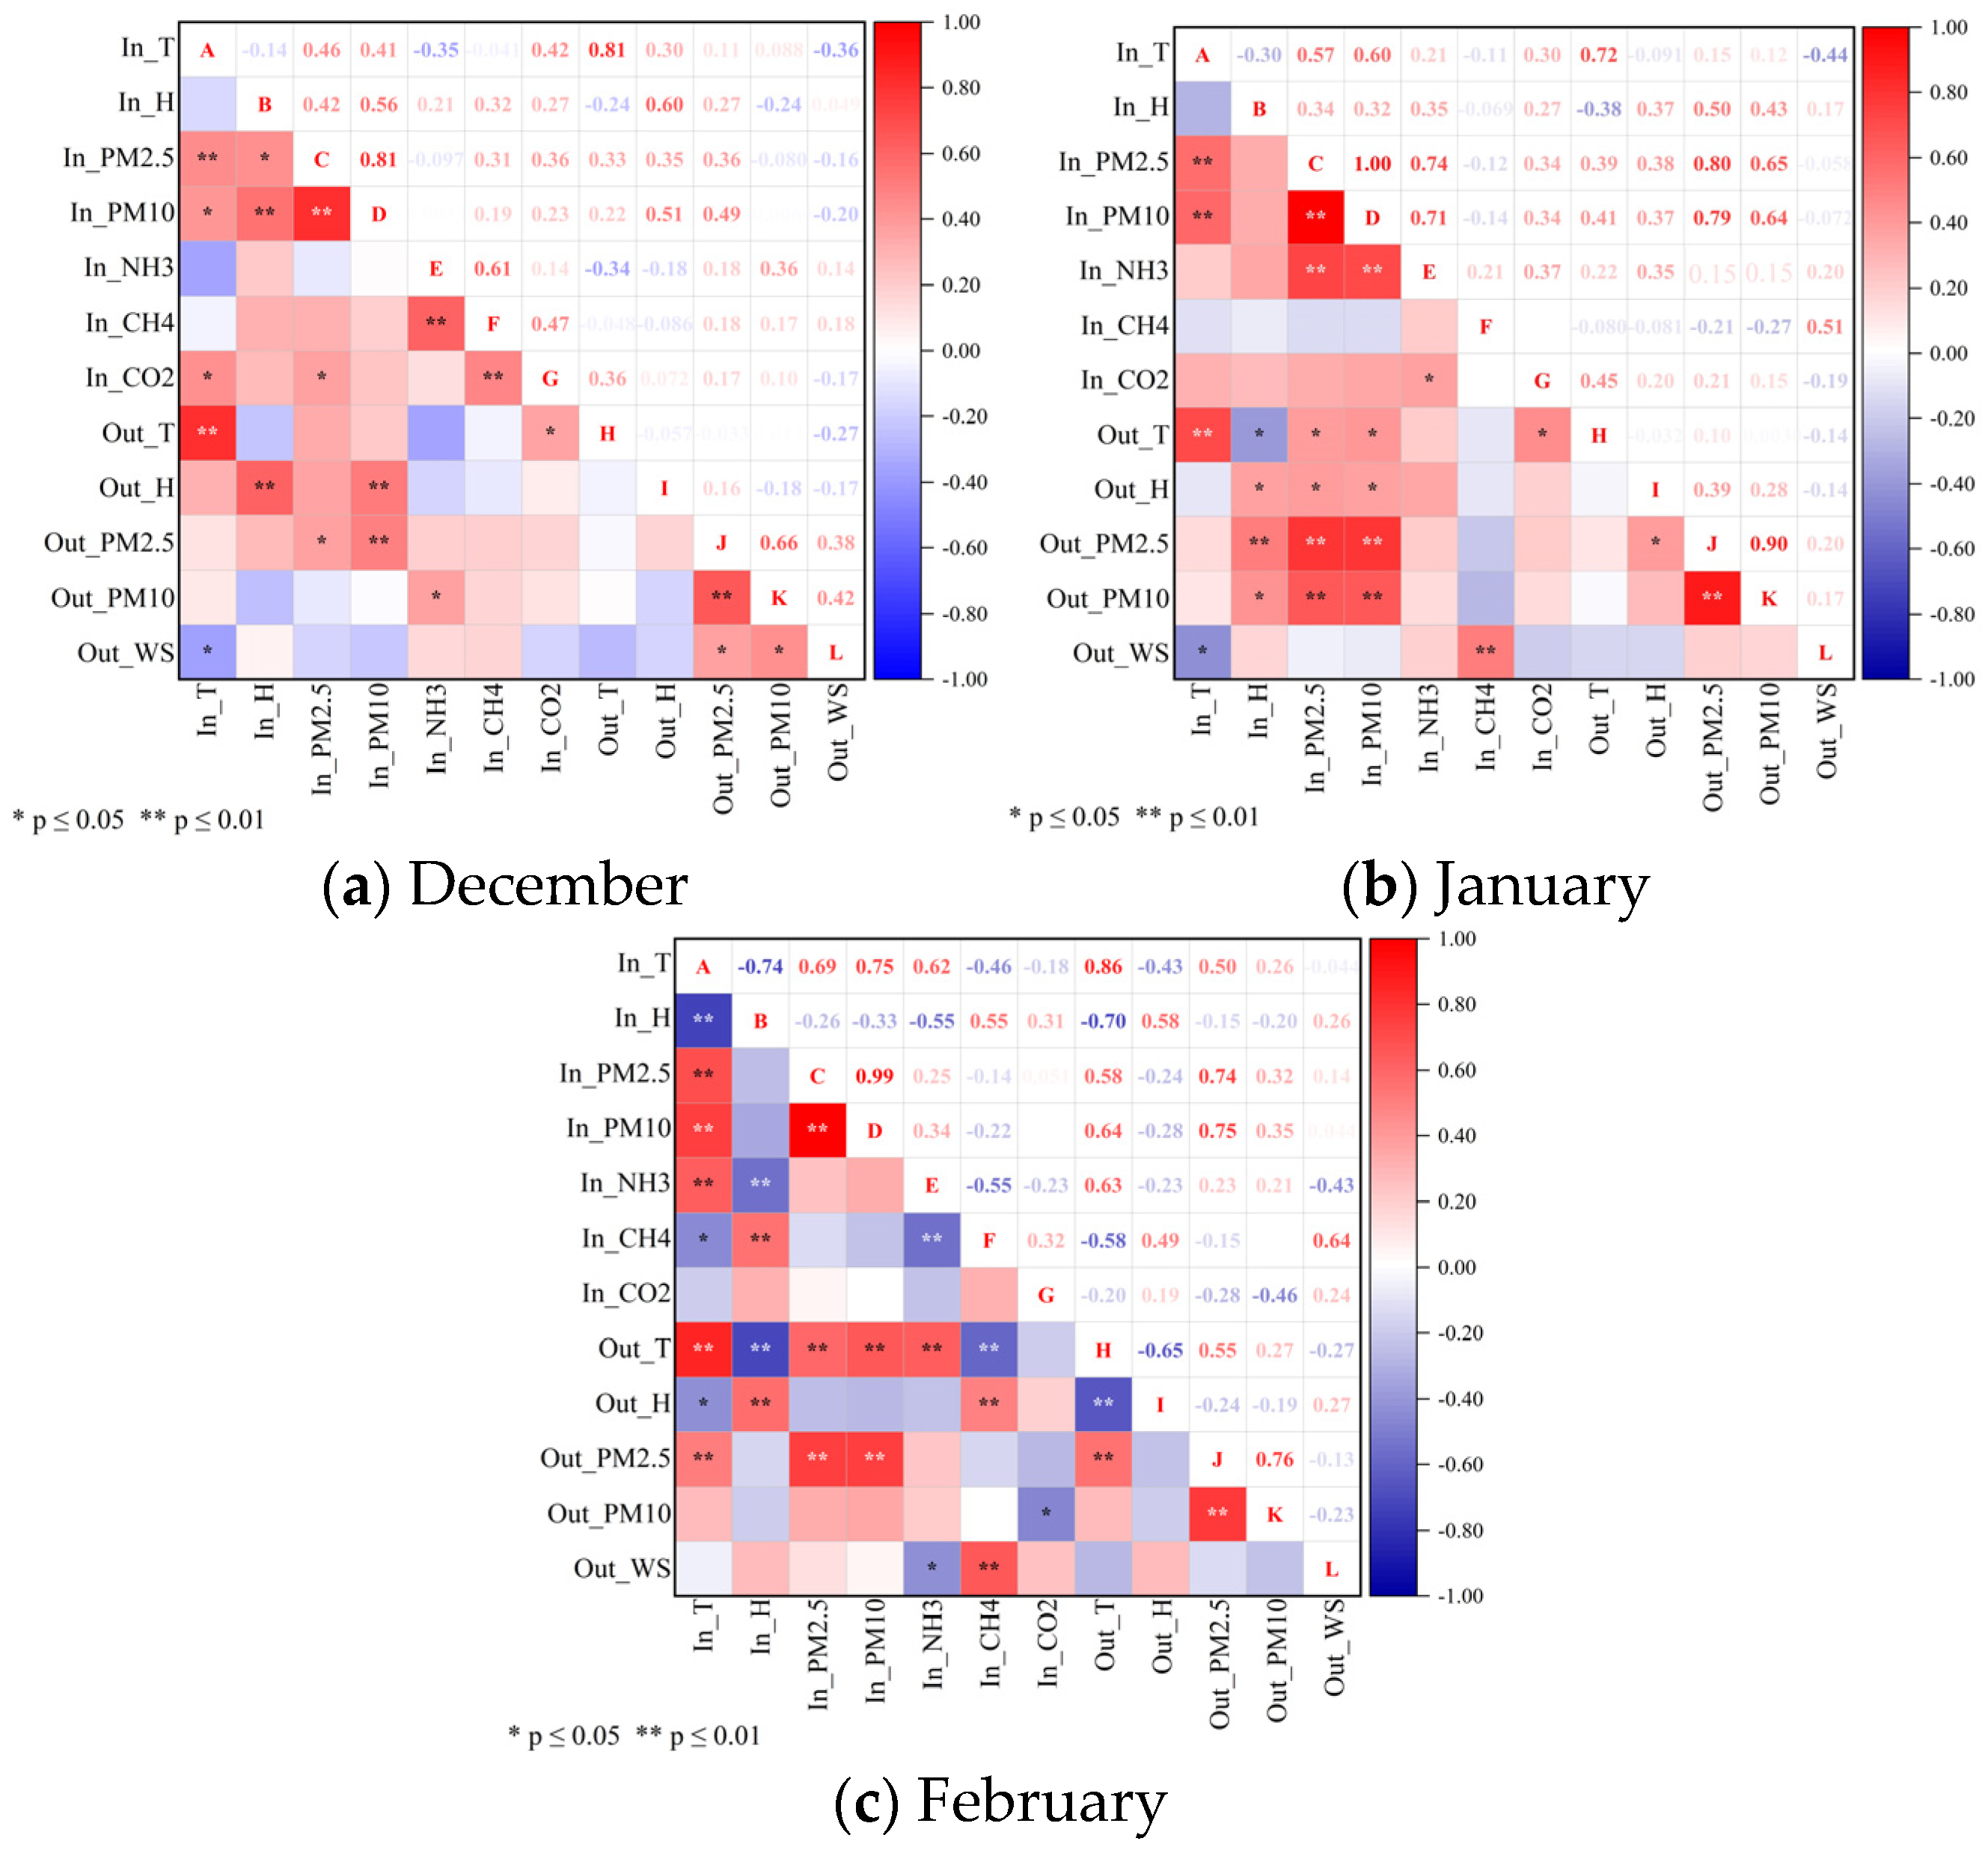
3.2. Pearson Correlation Coefficients
Pearson correlation coefficients were calculated to assess the relationships between environmental factors inside and outside the dairy barn in winter, and the results are shown in Figure 5. The December data (Figure 5a) showed that NH3 concentration had an extremely significant positive correlation with CH4 concentration. In the dairy barn environment, animal excreta are an important source of NH3 and CH4. Animal manure contains a large amount of organic matter, which decomposes in the presence of microorganisms to produce NH3 and CH4. Therefore, when the amount of excreta produced or the degree of accumulation increases, the concentrations of both NH3 and CH4 increase accordingly, showing an extremely significant positive correlation. NH3 concentration had a significant positive correlation with PM10 concentration outside the barn. CH4 concentrations had an extremely significant positive correlation with CO2 concentrations. During respiration, animals inhale oxygen and exhale CO2. Meanwhile, gut microbes produce CH4 as they help animals digest their food. Thus, the respiratory and digestive processes of animals are both important sources of CO2 and one of the major sources of CH4.
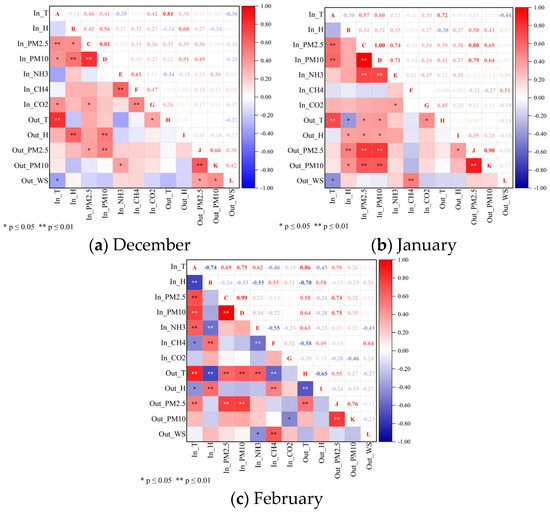
Figure 5.
Spearman correlation coefficient results for different production periods: (a) December; (b) January; (c) February.
The January (Figure 5b) data showed that NH3 concentration had an extremely significant positive correlation with PM2.5 and PM10 concentrations inside barn. NH3 is readily adsorbed by particulate matter and increases in concentration with its diffusion. NH3 concentration had a significant positive correlation with CO2 concentration. Higher CO2 concentration may indicate reduced ventilation and therefore an increase in its concentration. CH4 concentration had an extremely significant positive correlation with wind speed.
The February data (Figure 5c) showed that NH3 concentration had an extremely significant positive correlation with temperature inside and outside the barn. Qu et al. [27] and Sanchis et al. [28] have reported similar findings. In dairy barns, NH3 emissions are significantly influenced by the decomposition of feces on the floor, particularly through the hydrolysis of urease by fecal bacteria. The activity of these bacteria is contingent upon several factors, including pH, temperature, urease content, and the characteristics of the barn floor [29,30]. NH3 concentration had a significant negative correlation with CH4 concentration and NH3 concentration with wind speed. The NH3 concentration had an extremely significant negative correlation with humidity inside the barn. This finding is consistent with that of Hempel et al. [31], who reported that NH3 emissions decrease as humidity increases. This is because NH3 is water-soluble, and higher relative humidity causes more NH3 to dissolve in humid air, thus reducing NH3 production. CH4 concentration had an extremely significant positive correlation with humidity inside and outside the barn and wind speed. CH4 concentration had an extremely significant negative correlation with the temperature outside the barn, NH3 concentration, and a significant negative correlation with temperature inside the barn. Ngwabie et al. [6] demonstrated that CH4 emissions are positively associated with animal activity but negatively correlated with the air temperature inside the barn. Additionally, while research has indicated that intestinal CH4 production in dairy barns exhibits a parabolic relationship with temperature [31], Qu et al. [27] suggested a linear relationship.
In summary, CH4 concentration, PM2.5 concentration inside the barn, PM10 concentration inside the barn, temperature inside and outside the barn, and humidity inside the barn were selected as predictors of NH3 emissions. Meanwhile, humidity inside and outside the barn, CO2 concentration, NH3 concentration, wind speed, and temperature outside the barn were selected as predictors of CH4 emissions.
3.3. Prediction Model
3.3.1. Prediction Model of NH3 Emissions
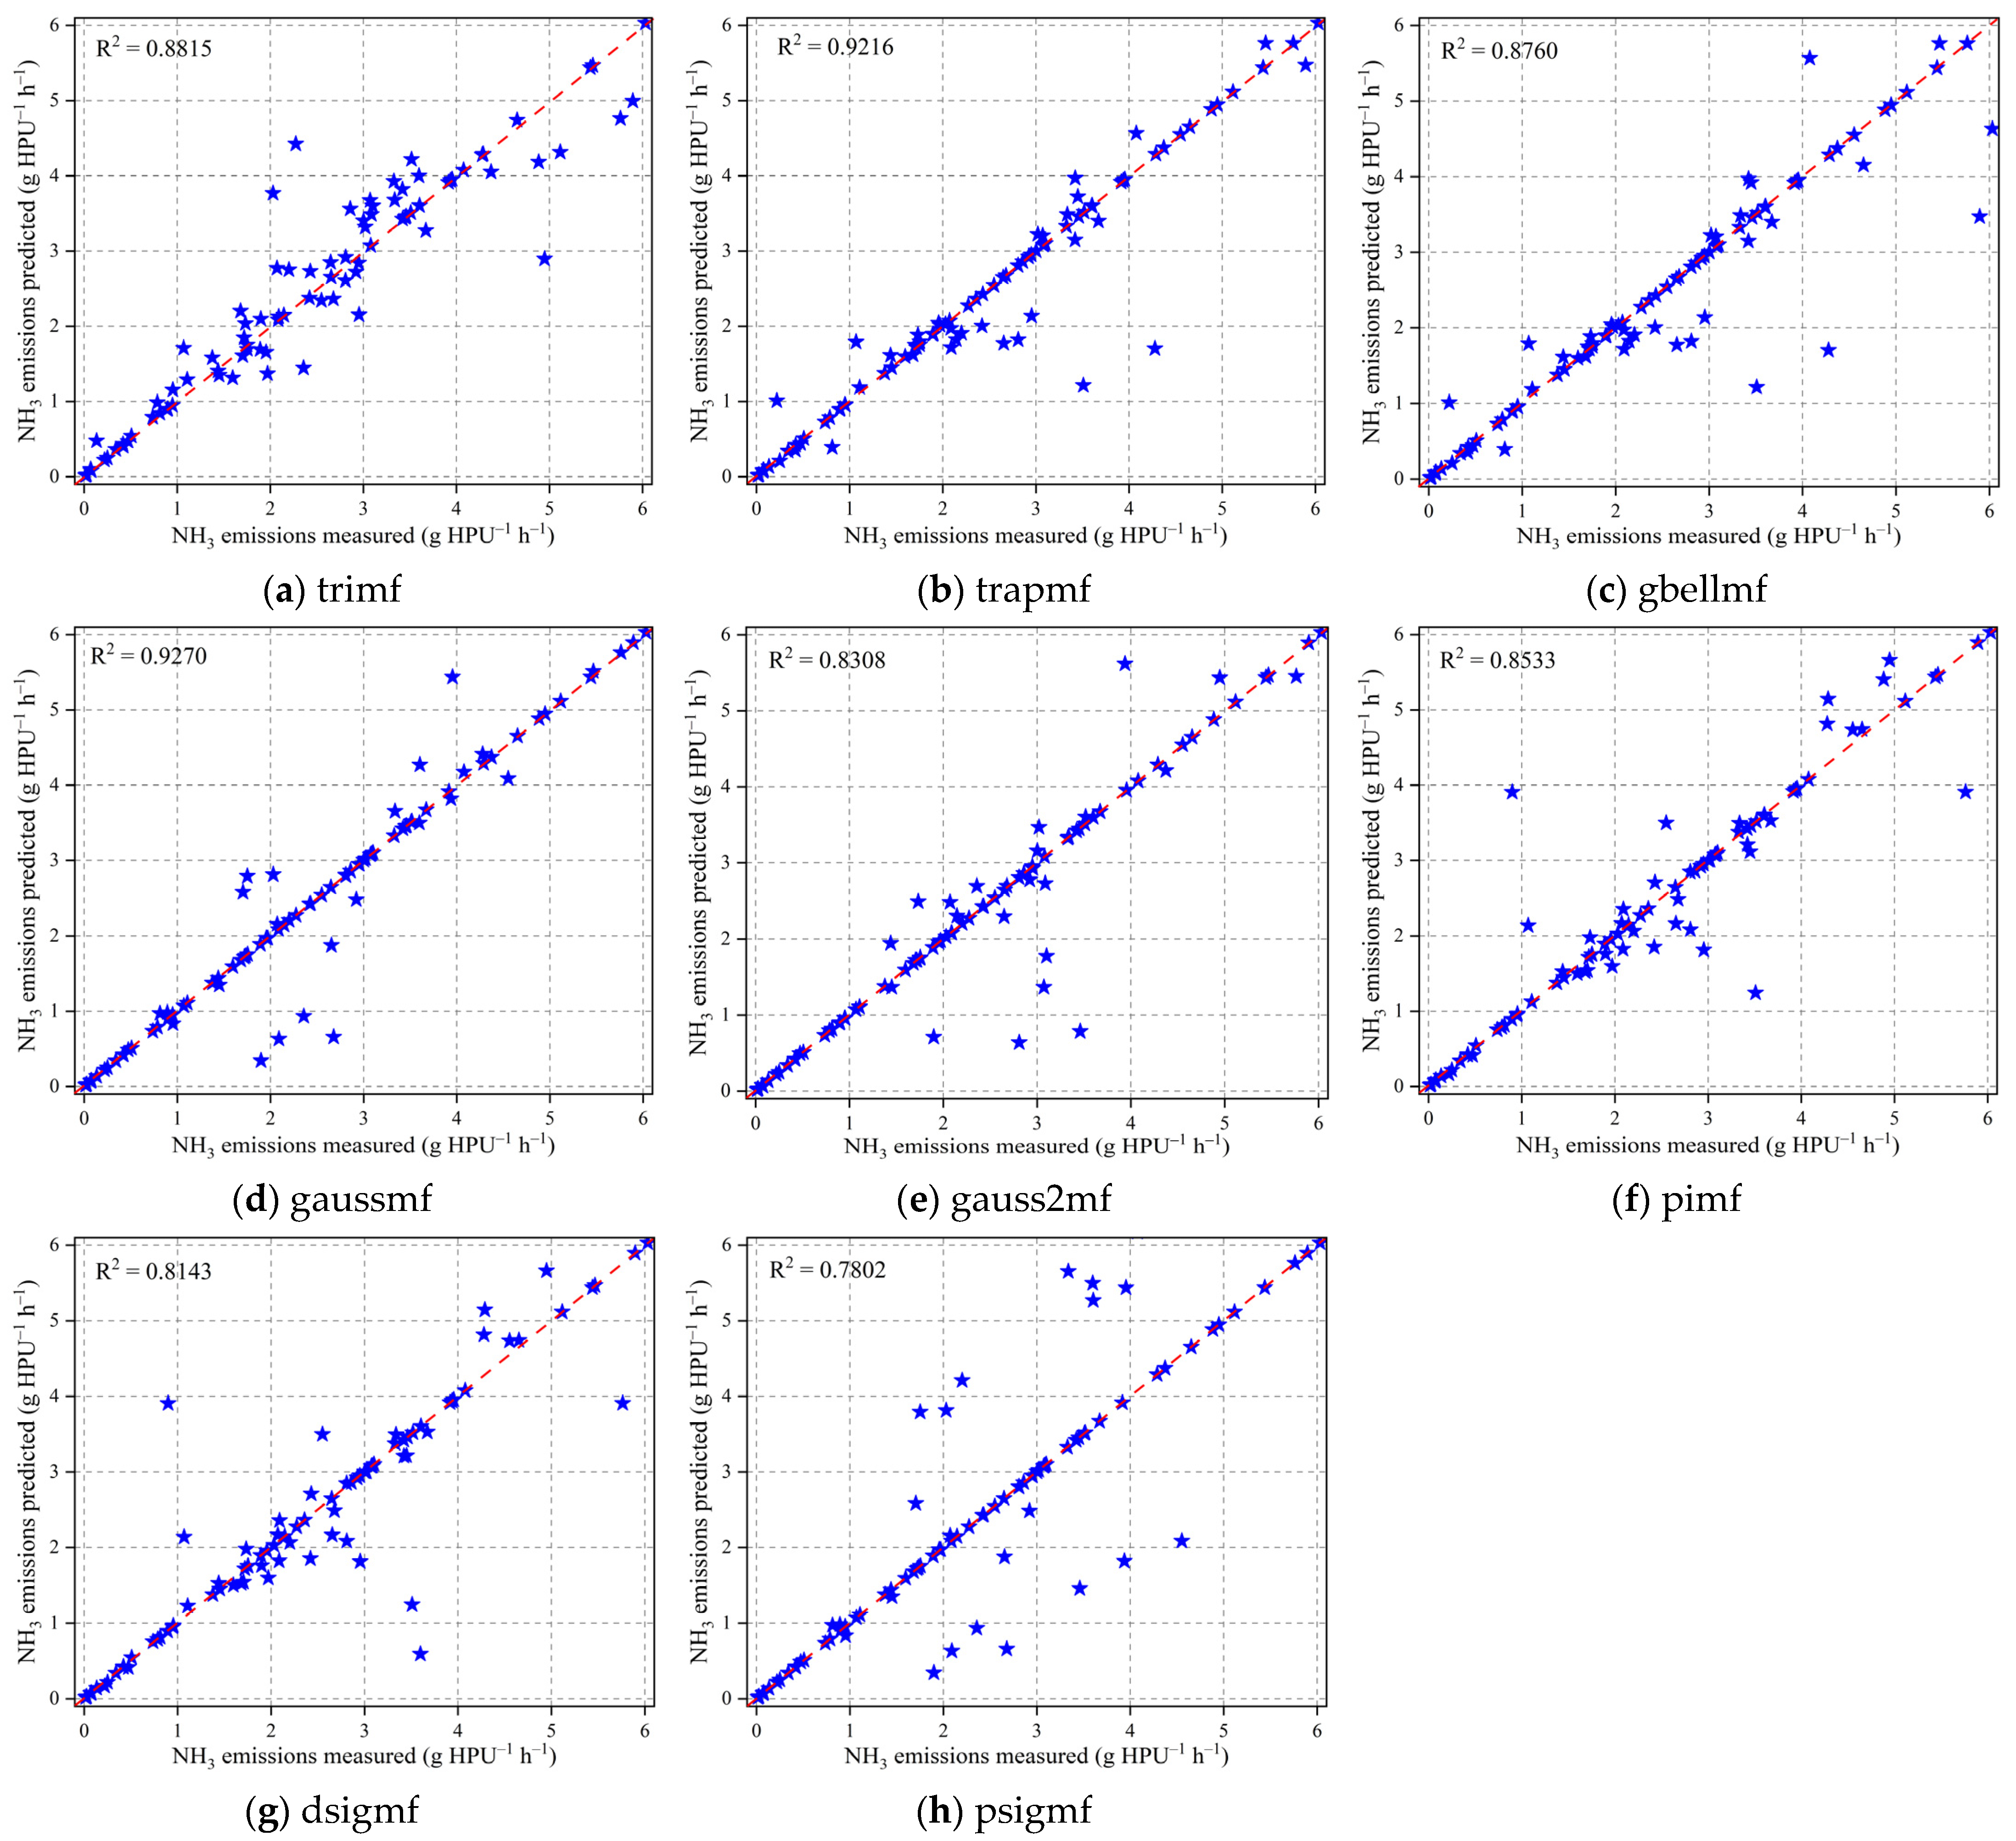
ANFIS models with eight different membership functions were established for predicting NH3 emissions. The correlation between measured and predicted NH3 emissions is shown in Figure 6. In addition, the predictive performances of the CH4 emission models are summarized in Table 2. The results show that ANFIS models with different membership functions exhibit significant differences in key metrics such as R2, NRMSE, and MAPE. This indicates that the choice of membership function has a significant impact on the predictive performance of the ANFIS model. Specifically, the eight membership functions (trimf, trapmf, gbellmf, gaussmf, gauss2mf, pimf, dsigmf, and psigmf) correspond to R2 values of 0.8815, 0.9216, 0.8760, 0.9270, 0.8308, 0.8533, 0.8143, and 0.7802, respectively. Among these, the gaussmf membership function performed the best, with an R2 value of 0.9270. This demonstrates the high feasibility and accuracy of the ANFIS model in predicting NH3 emissions.
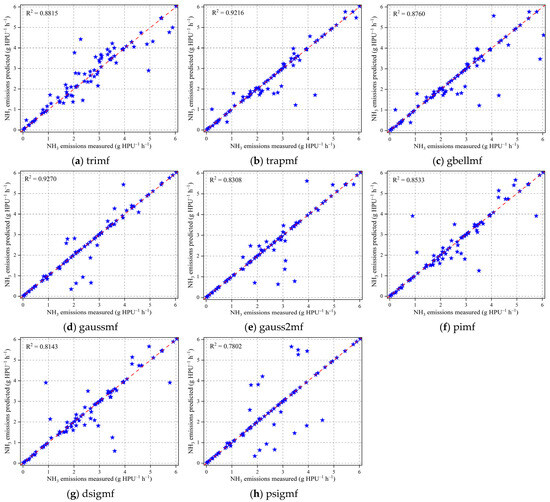
Figure 6.
Correlation between measured and predicted values of NH3 emission models.
Table 2.
The predictive performance of the NH3 emission models.
3.3.2. Prediction Model of CH4 Emissions
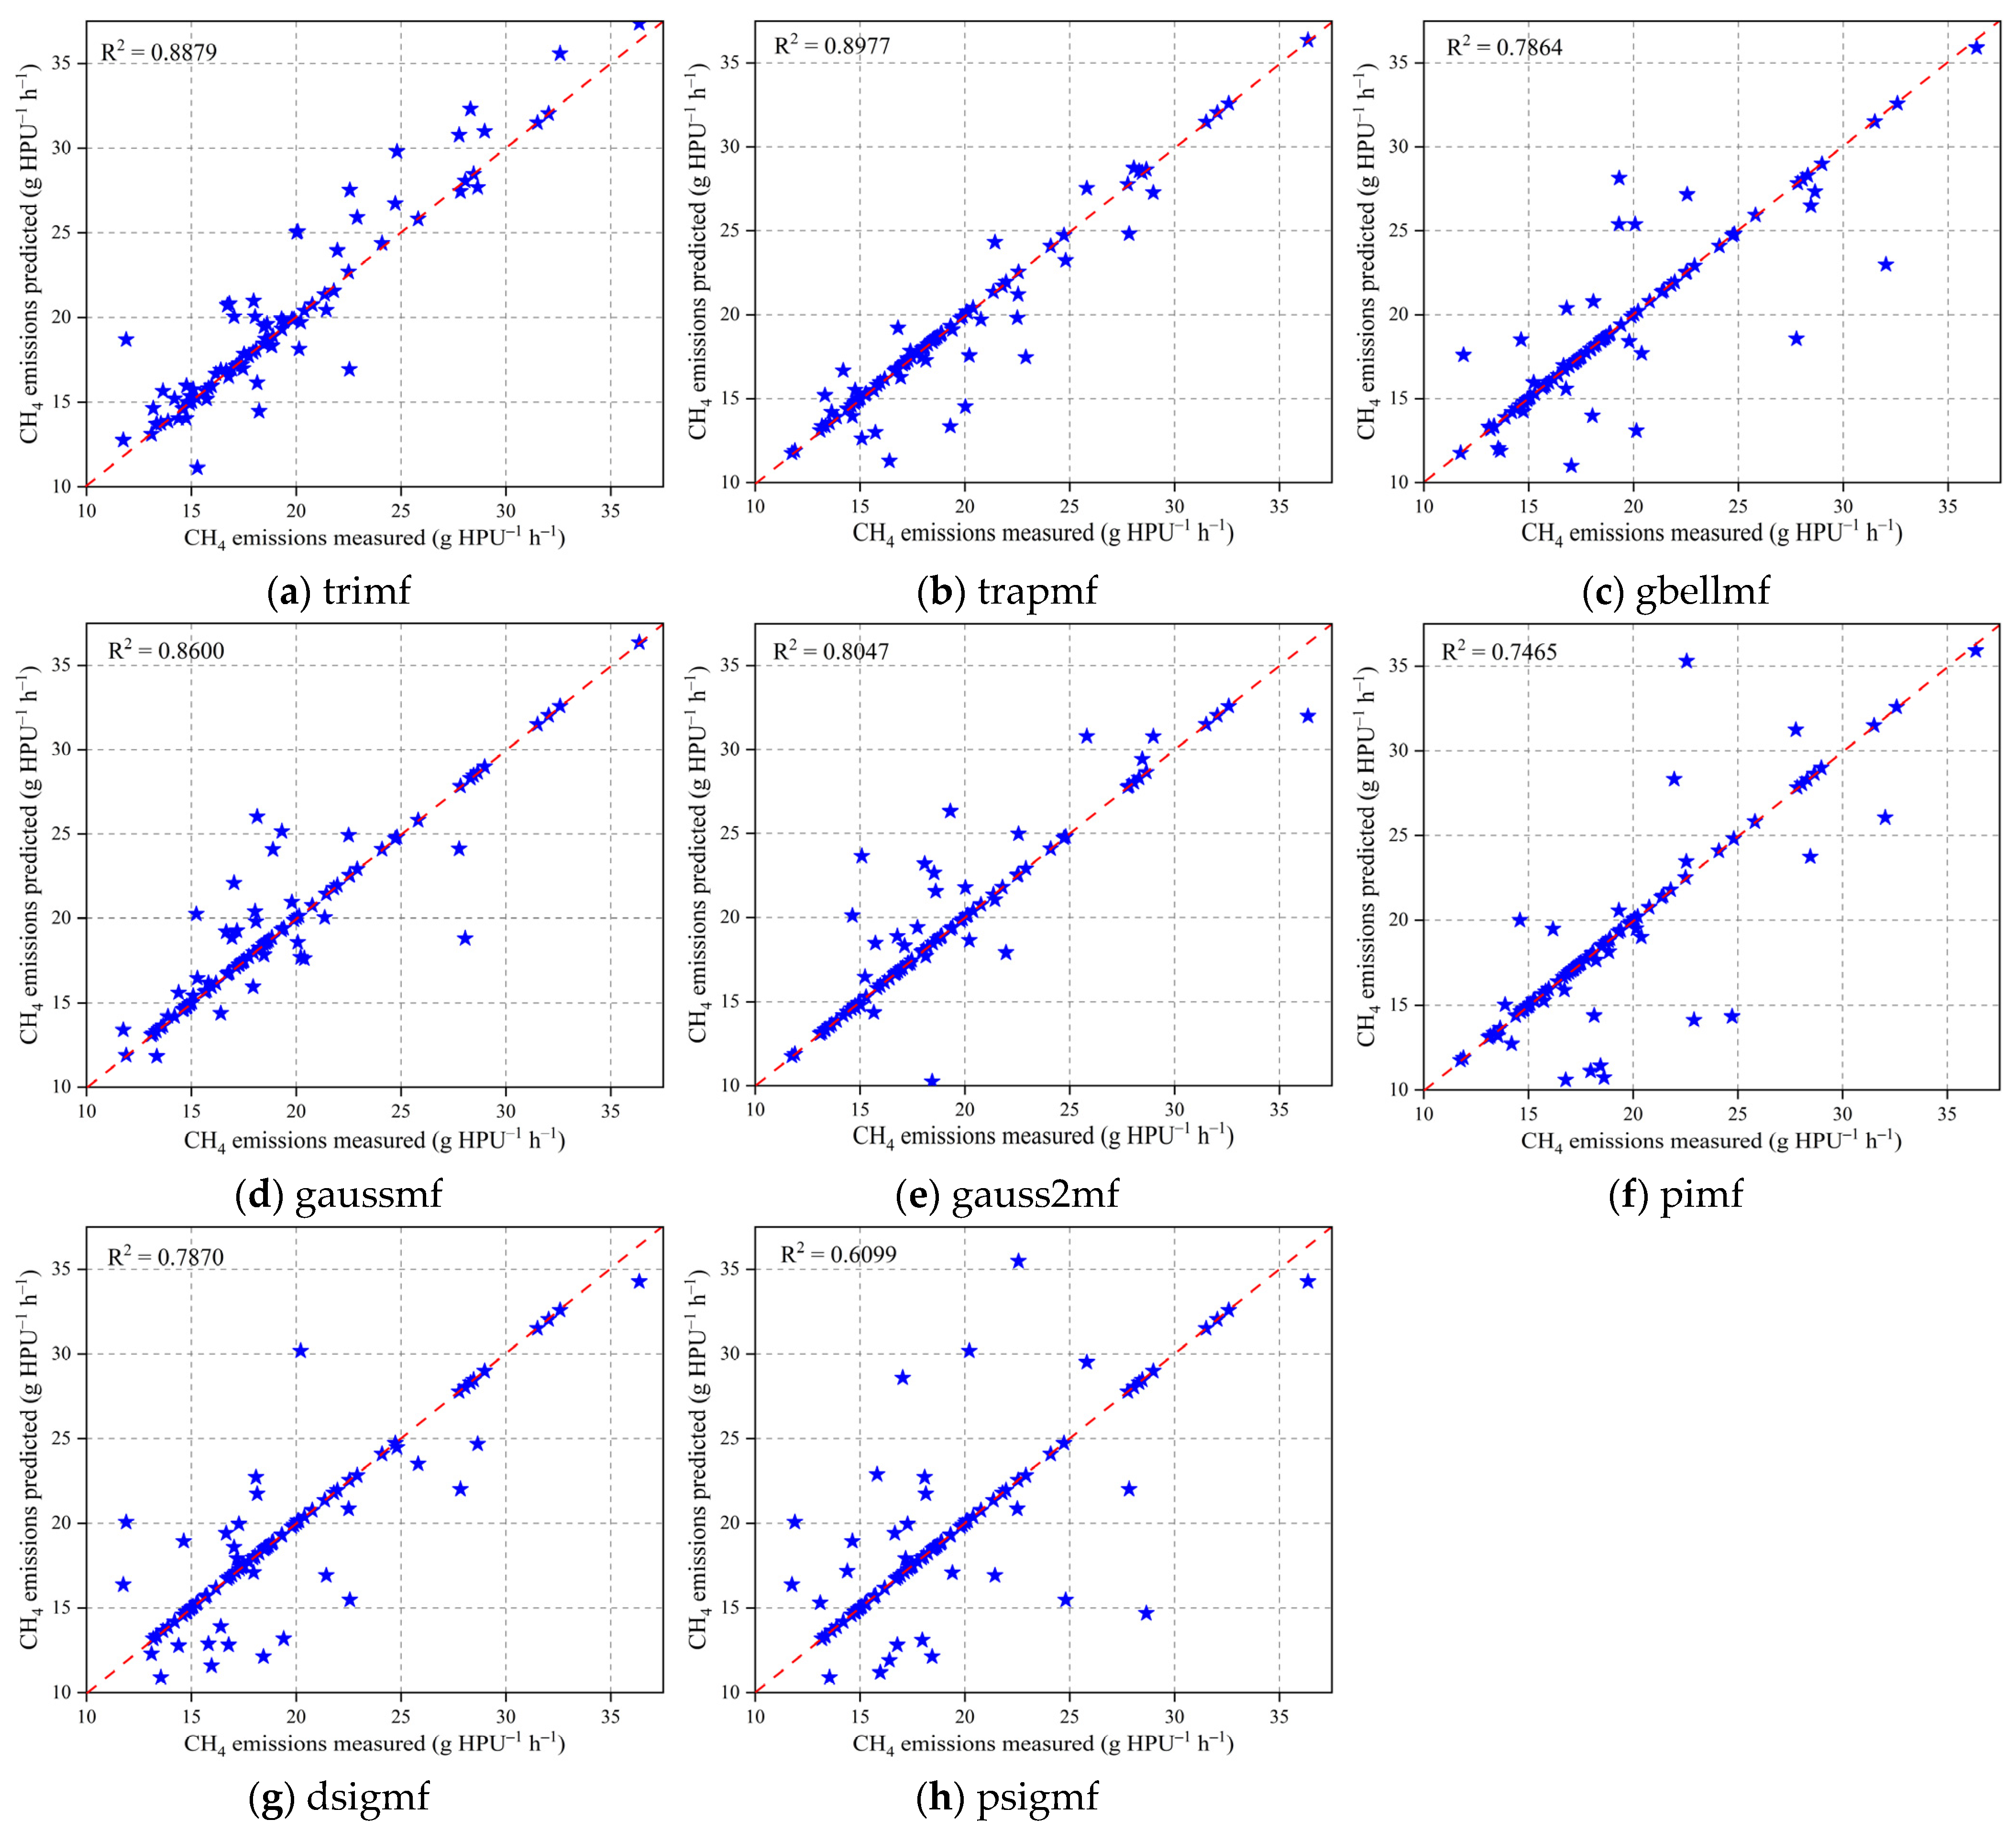
The established model for CH4 emissions is consistent with that for NH3 emissions. The correlation between measured and predicted CH4 emissions is shown in Figure 7. In addition, the predictive performance of the CH4 emission models is summarized in Table 3. The R2 values for the eight membership functions (trimf, trapmf, gbellmf, gaussmf, gauss2mf, pimf, dsigmf, and psigmf) are 0.8879, 0.8977, 0.7864, 0.8600, 0.8047, 0.7465, 0.7870, and 0.6099, respectively. Among these, the trapmf membership function performed the best, with an R2 value of 0.8977. These results demonstrate that the ANFIS model exhibits high feasibility and accuracy in predicting CH4 emissions.
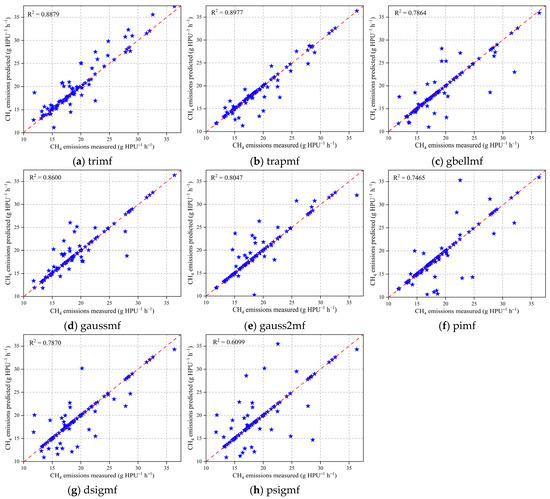
Figure 7.
Correlation between measured and predicted values of CH4 emission models.
Table 3.
The predictive performance of the CH4 emission models.
3.4. Comparison of Different Prediction Models
To further validate the performance of the ANFIS model, multilayer perceptron (MLP) and radial basis function (RBF) neural network models were established using the same input parameters as the ANFIS model. To ensure the robustness of the model training and evaluation process, the experimental data were partitioned into three distinct subsets. Specifically, 70% of the data were designated as the training set to facilitate model learning. The remaining 30% were further divided, with 15% allocated as the test set for assessing the model’s generalization ability and another 15% serving as the validation set to fine-tune the model parameters. The MLP model uses a gradient descent algorithm to adjust the bias and weights. The hidden layer contains 10 neurons. The hidden layer uses the hyperbolic tangent function (tansig), while the output layer uses the linear function (purelin). For more details on the MLP model, see Huang et al. [32]. The RBF model uses a Gaussian function as the activation function in the hidden layer. The centers of the hidden layer neurons were set to 10, with a width (σ = 2). For more details on the RBF model, see Hesami et al. [33].
Table 4 compares the performance of three models (the optimal ANFIS model, MLP model, and RBF model) in predicting NH3 and CH4 emissions. The optimal ANFIS model achieved high R2 values of 0.9270 and 0.8977 for NH3 and CH4 emissions, respectively, indicating excellent agreement with the data. In contrast, the MLP and RBF models achieved slightly lower R2 values of 0.8706 and 0.8364 for NH3, and 0.8314 and 0.8158 for CH4, respectively, thereby highlighting the superior prediction accuracy of the optimal ANFIS model. In terms of NRMSE, the optimal ANFIS model exhibited low values of 0.1751 and 0.0899 for NH3 and CH4, respectively. These values are significantly lower than those of the MLP and RBF models, indicating less prediction error and closer alignment with the true values. The NRMSE values for the MLP and RBF models were 0.2244 and 0.1126 for NH3, and 0.2566 and 0.1192 for CH4, respectively, showing relatively high errors. In terms of MAPE, the optimal ANFIS model had the lowest MAPE values of 7.1837% and 3.9890% for NH3 and CH4, respectively, further confirming its superior predictive accuracy. The MAPE values for the MLP and RBF models were 26.4081% and 8.8648% for NH3, and 22.6251% and 9.1891% for CH4, respectively, indicating larger prediction errors. In summary, the optimal ANFIS model outperformed the MLP and RBF models in predicting NH3 and CH4 emissions, as evidenced by higher R2 values and lower NRMSE and MAPE values.
Table 4.
Comparison between optimal ANFIS models and MLP and RBF models.
4. Discussion
In this study, the prediction models for NH3 and CH4 emissions were successfully developed using ANFIS in winter. The relationship between environmental factors and NH3 and CH4 emissions was clarified by analyzing environmental factors. Significant correlations were found between NH3 concentration and CH4 concentration inside the barn, PM2.5 concentration inside the barn, PM10 concentration inside the barn, temperature inside and outside the barn, and humidity inside the barn. Significant correlations were also found between CH4 concentration and humidity inside and outside the barn, CO2 concentration, NH3 concentration, wind speed, and temperature outside the barn. After comparing different membership functions, it was concluded that the ANFIS model with the gaussmf membership function predicted NH3 emissions optimally (R2 = 0.9270), and the ANFIS model with the trapmf membership function predicted CH4 emissions optimally (R2 = 0.8977). Meanwhile, compared with the MLP and RBF models, the optimal ANFIS model outperformed the MLP and RBF models in terms of R2, NRMSE, and MAPE, demonstrating its high accuracy and reliability in predicting NH3 and CH4 emissions. This study provides an effective tool for environmental management of dairy barns in cold regions.
The hourly average NH3 emission rate was 1.99 g HPU−1 h−1 (range 0 to 28.89 g HPU−1 h−1). This result exceeds those reported by Zhao et al. [9] (0.83 g HPU−1 h−1) and Schrade et al. [34] (1.52 g HPU−1 h−1) but aligns with Tabase et al. [3] (2.20 g HPU−1 h−1) and Pereira et al. [35] (1.82 g HPU−1 h−1); discrepancies are attributable to geographic location, climate, and barn characteristics [36,37]. Emissions peak at midnight when low temperature and ventilation let manure accumulate NH3; they drop at dawn as cattle rest and airflow rises; a 16:00 secondary peak follows the 09:00 feeding after a 4 to 6 h lag. Although elevated humidity (>80% RH) can sorb a fraction of NH3, restricted nocturnal ventilation ensures net accumulation, collectively establishing a “nocturnal build-up—morning purge—daytime re-emission” rhythm.
The hourly average CH4 emission rate was 19.43 g HPU−1 h−1 (0.6 to 288.24 g HPU−1 h−1), with variability driven by climate, barn design, and manure management interacting with local topography [38,39,40]. Diurnal patterns follow three coupled mechanisms: fresh feed at 09:00 and 17:00 stimulates rumen methanogens, peaking 4 to 6 h later (15:00 to 17:00). The nocturnal ruminal pH decline raises the acetate/propionate ratio, enhancing CH4. The milking and cleaning at 09:00, 17:00, and 03:00 increase standing and locomotion, releasing retained gases and creating a secondary nocturnal peak. Concurrently, humidity >80% RH suppresses manure-surface methanotrophs, prolonging CH4 residence and synchronizing the secondary peak with rising nighttime humidity.
This study finds that the optimal membership function for NH3 emissions is the ANFIS model with the gaussmf, whereas CH4 exhibits the highest sensitivity to trapmf. This discrepancy can be interpreted from both mechanistic and data-structure perspectives. Mechanistically, NH3 volatilization is predominantly localized at the feces–urine interface and is driven by instantaneous fluctuations in pH, temperature, and moisture, resulting in pronounced nonlinearity and acute sensitivity to minor perturbations; the smooth, continuous, and differentiable profile of the Gaussian function near the centroid of the input space accurately captures such rapid and intense nonlinear responses. Conversely, CH4 production and release involve a chain of prolonged biochemical stages. These include ruminal fermentation and anaerobic manure, during which concentrations change in a stepwise fashion. The trapezoidal membership function, with its sharp boundary delineation, is well suited to the capturing of such piecewise linear or on/off kinetic patterns. In terms of data structure, NH3 training samples follow a unimodal normal distribution that aligns closely with the geometric form of the Gaussian function, whereas CH4 data exhibit a slight bimodality that can be effectively accommodated by the dual-plateau architecture of the trapezoidal function.
The predictive performance of the proposed ANFIS model was systematically benchmarked against the NH3 and CH4 models for animal barns. For NH3, the ANFIS model with the gaussmf membership function attained an R2 of 0.927, significantly exceeding the driven sequential concentration transport emission model of Xie et al. [16] (R2 = 0.8875) and the ANFIS model of Xie et al. [13] (R2 = 0.6483). For CH4, the ANFIS model with the trapmf membership function achieved an R2 of 0.898, significantly exceeding the multilinear regression model of Petersen et al. [2] (R2 = 0.69). Critically, these superior results were secured under substantially colder conditions (−32.2 to 11.4 °C) relative to the Mediterranean (−2 to 18 °C) and temperate (5 to 25 °C) climates reported in the literature, underscoring the enhanced extrapolative robustness of the developed ANFIS framework.
Although the developed model demonstrated high accuracy and robustness in predicting NH3 and CH4 emissions from wintertime, naturally ventilated dairy barns, several limitations remain that require further refinement in subsequent studies.
- (1)
- The rationale for limiting the present study to wintertime, naturally ventilated dairy barns stems from the unique “natural experimental window” provided by this season: in cold regions, tightly shut windows and doors curtail ventilation to conserve heat, allowing NH3 and CH4 to accumulate rapidly under high stocking densities. This amplifies emission signals and facilitates the accurate identification of key driving factors. Moreover, the relatively stable external meteorological conditions in winter allow the emission baseline to be primarily attributed to indoor variables, thereby minimizing meteorological noise. Future work will extend the scope to mechanically ventilated barns and incorporate continuous measurements across spring, summer, autumn, and multiple years. Under tighter control of meteorological variability, a year-round NH3 and CH4 emission model that is both universally applicable and stable in the long-term will be systematically developed and validated.
- (2)
- This study employs ANFIS to predict and model gas emissions; however, the membership functions are determined predominantly through empirical means and lack explicit physical meaning. When the model is extrapolated to environmental conditions outside the calibration range (e.g., high summer temperatures), its optimal functional form may lose validity. Future work will incorporate an adaptive function selection framework grounded in information theoretic criteria, replacing manual trial-and-error with data-driven optimization to reduce subjective bias. Concurrently, systematic long-term monitoring across seasons and climate zones will be undertaken to build a comprehensive function–environment mapping repository, enhancing model robustness under diverse environmental conditions.
- (3)
- There are limitations in monitoring environmental factors, and although a variety of environmental factors were measured, they did not cover all potential influences. Future studies could introduce more environmental variables and dairy barn management factors to more fully characterize the relationship between the dairy barn environment and gas emissions.
5. Conclusions
Drawing upon continuous measurements conducted from December 2024 to February 2025 at a commercial dairy farm in Ulanqab, an ANFIS-based model was developed to predict NH3 and CH4 emissions within winter housing. The mean hourly emission rates were 1.99 g HPU−1 h−1 for NH3 and 19.43 g HPU−1 h−1 for CH4, with pronounced nocturnal maxima and distinct diurnal variability. NH3 emissions were collectively modulated by in-barn CH4, PM2.5, PM10, temperature, relative humidity, and ambient temperature, whereas CH4 emissions exhibited significant associations with in-barn and ambient humidity, CO2, NH3, air speed, and ambient temperature. Optimization revealed that ANFIS with gaussmf achieved the highest NH3 prediction accuracy (R2 = 0.9270), whereas trapmf excelled for CH4 (R2 = 0.8977). Relative to MLP and RBF networks, these configurations increased the R2 by 6.48 to 11.50% and decreased the NRMSE and MAPE by 20.16 to 72.80%, substantially enhancing predictive accuracy.
Author Contributions
Conceptualization, H.L., W.L. and H.; methodology, H.L. and X.W.; software, T.X. and H.; validation, Q.Z.; formal analysis, T.X.; investigation, H.L.; resources, T.X.; data curation, H.L., W.L. and H.; writing—original draft preparation, H.L.; writing—review and editing, T.; visualization, H.L. and X.W.; supervision, T.; project administration, T. and Q.Z.; funding acquisition, T. and Q.Z. All authors have read and agreed to the published version of the manuscript.
Funding
This research was funded by the Natural Science Foundation of Inner Mongolia Autonomous Region, grant number 2024QN03058 and 2022MS03040; this research was funded by the Postgraduate Scientific Research Innovation Project of Inner Mongolia Autonomous Region, grant number KC2024038B; this research was funded by the First Class Disciplines Research Special Project, grant number YLXKZX-NND-009.
Institutional Review Board Statement
Not applicable.
Data Availability Statement
The raw data supporting the conclusions of this article will be made available by the authors on request.
Conflicts of Interest
Author Tiezhu Xie was employed by the company HAI GAO MU YE Co., Ltd. The remaining authors declare that the research was conducted in the absence of any commercial or financial relationships that could be construed as a potential conflict of interest.
References
- Rodrigues, A.R.; Silva, M.E.; Silva, V.F.; Maia, M.R.; Cabrita, A.R.; Trindade, H.; Fonseca, A.J.; Pereira, J.L. Implications of seasonal and daily variation on methane and ammonia emissions from naturally ventilated dairy cattle barns in a Mediterranean climate: A two-year study. Sci. Total Environ. 2024, 946, 173734. [Google Scholar] [CrossRef] [PubMed]
- Petersen, S.O.; Ma, C.; Hilgert, J.E.; Mjöfors, K.; Sefeedpari, P.; Amon, B.; Aarnink, A.; Francó, B.; Dragoni, F.; Groenestein, K.; et al. In-vitro method and model to estimate methane emissions from liquid manure management on pig and dairy farms in four countries. J. Environ. Manag. 2024, 353, 120233. [Google Scholar] [CrossRef] [PubMed]
- Tabase, R.K.; Næss, G.; Larring, Y. Ammonia and methane emissions from small herd cattle buildings in a cold climate. Sci. Total Environ. 2023, 903, 166046. [Google Scholar] [CrossRef] [PubMed]
- Chen, J.; Chen, S.; Li, G.; Yang, C.; Peng, D.; Zhao, Y.; Han, L.; Wang, Z.; Gu, X. Thermal environment and air quality of in a typical barn of lactating low in Beijing area in spring. J. Domest. Anim. Ecol. 2017, 38, 45–50. [Google Scholar]
- Du, Y.; Wei, Y.; Li, Z.; Yang, H.; Li, H.; Liu, Y.; Liu, R. Analysis of ammonia prevention and control and milk yield in large-scale dairy farms in Xinjiang. Feed. Manag. 2024, 12, 55–61. [Google Scholar]
- Ngwabie, N.M.; Jeppsson, K.H.; Gustafsson, G.; Nimmermark, S. Effects of animal activity and air temperature on methane and ammonia emissions from a naturally ventilated building for dairy cows. Atmos. Environ. 2011, 45, 6760–6768. [Google Scholar] [CrossRef]
- Tedeschi, L.O.; Abdalla, A.L.; Álvarez, C.; Anuga, S.W.; Arango, J.; Beauchemin, K.A.; Becquet, P.; Berndt, A.; Burns, R.; De Camillis, C.; et al. Quantification of methane emitted by ruminants: A review of methods. J. Anim. Sci. 2022, 100, skac197. [Google Scholar] [CrossRef] [PubMed]
- Li, T.; Wang, C.; Ji, W.; Wang, Z.; Shen, W.; Feng, Y.; Zhou, M. Cutting-edge ammonia emissions monitoring technology for sustainable livestock and poultry breeding: A comprehensive review of the state of the art. J. Clean. Prod. 2023, 428, 139387. [Google Scholar] [CrossRef]
- Zhao, W.; Xu, L.; Wang, C.; Shi, Z. Greenhouse gas and ammonia emissions of naturally ventilated cowsheds with different floor types in winter. J. China Agric. Univ. 2020, 25, 142–151. [Google Scholar]
- Kammer, J.; Décuq, C.; Baisnée, D.; Ciuraru, R.; Lafouge, F.; Buysse, P.; Bsaibes, S.; Henderson, B.; Cristescu, S.M.; Benabdallah, R.; et al. Characterization of particulate and gaseous pollutants from a French dairy and sheep farm. Sci. Total Environ. 2020, 712, 135598. [Google Scholar] [CrossRef] [PubMed]
- Tabase, R.K.; Millet, S.; Brusselman, E.; Ampe, B.; De Cuyper, C.; Sonck, B.; Demeyer, P. Effect of ventilation control settings on ammonia and odour emissions from a pig rearing building. Biosyst. Eng. 2020, 192, 215–231. [Google Scholar] [CrossRef]
- Shi, Z.; Sun, X.; Lu, Y.; Xi, L.; Zhao, X. Emissions of ammonia and hydrogen sulfide from typical dairy barns in central China and major factors influencing the emissions. Sci. Rep. 2019, 9, 13821. [Google Scholar] [CrossRef] [PubMed]
- Xie, Q.; Ni, J.Q.; Su, Z. A prediction model of ammonia emission from a fattening pig room based on the indoor concentration using adaptive neuro fuzzy inference system. J. Hazard. Mater. 2017, 325, 301–309. [Google Scholar] [CrossRef] [PubMed]
- Rychła, A.; Amon, B.; Hassouna, M.; van der Weerden, T.J.; Winiwarter, W. Costs and effects of measures to reduce ammonia emissions from dairy cattle and pig production: A comparison of country-specific estimations and model calculations. J. Environ. Manag. 2023, 344, 118678. [Google Scholar] [CrossRef] [PubMed]
- Ding, L.; Lv, Y.; Li, Q.; Wang, C.; Yu, L.; Zong, W. Prediction model of ammonia emission from chicken manure based on fusion of multiple environmental parameters. Trans. Chin. Soc. Agric. Mach. 2022, 53, 366–375. [Google Scholar]
- Xie, Q.; Ni, J.Q.; Li, E.; Bao, J.; Zheng, P. Sequential air pollution emission estimation using a hybrid deep learning model and health-related ventilation control in a pig building. J. Clean. Prod. 2022, 371, 133714. [Google Scholar] [CrossRef]
- Hempel, S.; Ouatahar, L.; Janke, D.; Doumbia, E.M.; Willink, D.; Amon, B.; Bannink, A.; Amon, T. Ammonia emission prediction for dairy cattle housing from reaction kinetic modeling to the barn scale. Comput. Electron. Agric. 2022, 199, 107168. [Google Scholar] [CrossRef]
- Liu, S.; Ni, J.Q. Identified factors and predicted unidentified-factors affecting ammonia emissions from a swine building. J. Hazard. Mater. 2023, 453, 131365. [Google Scholar] [CrossRef] [PubMed]
- Liu, H.; Tana; Zhen, Q.; Hurichabilige; Meng, X.; Li, W. Environ-economic assessment of the solar coupled heat pump heating system for dairy barns in severe cold region. Energy Build. 2025, 328, 115166. [Google Scholar] [CrossRef]
- Chao, L. Effects of Different Feeding Times on Daily Behavior of Lactating Cows. Master’s Thesis, Inner Mongolia Agricultural University, Hohhot, China, 2022. [Google Scholar] [CrossRef]
- CIGR. CIGR International Commission of Agricultural Engineering, Section II 4th Report of Working Group Climatization of Animal Houses Heat and Moisture Production; CIGR: Horsens, Denmark, 2002. [Google Scholar]
- Ogink, N.W.; Mosquera, J.; Calvet, S.; Zhang, G. Methods for measuring gas emissions from naturally ventilated livestock buildings: Developments over the last decade and perspectives for improvement. Biosyst. Eng. 2013, 116, 297–308. [Google Scholar] [CrossRef]
- Pedersen, S.; Blanes-Vidal, V.; Jørgensen, H.; Chwalibog, A.; Haeussermann, A.; Heetkamp, M.J.W.; Aarnink, A.J.A. Carbon dioxide production in animal houses: A literature review. Agric. Eng. Int. CIGR J. 2008, X. X, 1–9. [Google Scholar]
- Fan, B. Research on Dairy Farm Precision Management Based on Multiscale Environment Analysis. Ph.D. Thesis, Chinese Academy of Agricultural Sciences, Beijing, China, 2019. [Google Scholar]
- Yu, S.; Liu, Y.; Tang, Y.; Li, X.; Li, W.; Li, C.; Zhang, Y.; Lan, H. Non-destructive quality assessment method for Korla fragrant pears based on electrical properties and adaptive neural-fuzzy inference system. Comput. Electron. Agric. 2022, 203, 107492. [Google Scholar] [CrossRef]
- Ghenai, C.; Al-Mufti, O.A.A.; Al-Isawi, O.A.M.; Amirah, L.H.L.; Merabet, A. Short-term building electrical load forecasting using adaptive neuro-fuzzy inference system (ANFIS). J. Build. Eng. 2022, 52, 104323. [Google Scholar] [CrossRef]
- Qu, Q.; Groot, J.C.; Zhang, K.; Schulte, R.P. Effects of housing system, measurement methods and environmental factors on estimating ammonia and methane emission rates in dairy barns: A meta-analysis. Biosyst. Eng. 2021, 205, 64–75. [Google Scholar] [CrossRef]
- Sanchis, E.; Calvet, S.; Del Prado, A.; Estellés, F. A meta-analysis of environmental factor effects on ammonia emissions from dairy cattle houses. Biosyst. Eng. 2019, 178, 176–183. [Google Scholar] [CrossRef]
- Pedersen, J.; Feilberg, A.; Nyord, T. Effect of storage and field acidification on emissions of NH3, NMVOC, and odour from field applied slurry in winter conditions. J. Environ. Manag. 2022, 310, 114756. [Google Scholar] [CrossRef] [PubMed]
- Fangueiro, D.; Merino, P.; Pantelopoulos, A.; Pereira, J.L.; Amon, B.; Chadwick, D.R. The implications of animal manure management on ammonia and greenhouse gas emissions. In Technology for Environmentally Friendly Livestock Production; Springer: Cham, Switzerland, 2023; pp. 99–136. [Google Scholar]
- Hempel, S.; Saha, C.K.; Fiedler, M.; Berg, W.; Hansen, C.; Amon, B.; Amon, T. Non-linear temperature dependency of ammonia and methane emissions from a naturally ventilated dairy barn. Biosyst. Eng. 2016, 145, 10–21. [Google Scholar] [CrossRef]
- Huang, T.; Rong, L.; Zhang, G. Investigating the feasibility of using computational fluid dynamics based response surface methodology and neural network to model the performance of the individualised ventilation in sow houses. Biosyst. Eng. 2022, 214, 138–151. [Google Scholar] [CrossRef]
- Hesami, M.; Pepe, M.; Monthony, A.S.; Baiton, A.; Jones, A.M.P. Modeling and optimizing in vitro seed germination of industrial hemp (Cannabis sativa L.). Ind. Crops Prod. 2021, 170, 113753. [Google Scholar] [CrossRef]
- Schrade, S.; Zeyer, K.; Mohn, J.; Zähner, M. Effect of diets with different crude protein levels on ammonia and greenhouse gas emissions from a naturally ventilated dairy housing. Sci. Total Environ. 2023, 896, 165027. [Google Scholar] [CrossRef] [PubMed]
- Pereira, J.; Misselbrook, T.H.; Chadwick, D.R.; Coutinho, J.; Trindade, H. Ammonia emissions from naturally ventilated dairy cattle buildings and outdoor concrete yards in Portugal. Atmos. Environ. 2010, 44, 3413–3421. [Google Scholar] [CrossRef]
- D’Urso, P.R.; Arcidiacono, C.; Valenti, F.; Cascone, G. Assessing influence factors on daily ammonia and greenhouse gas concentrations from an open-sided cubicle barn in hot mediterranean climate. Animals 2021, 11, 1400. [Google Scholar] [CrossRef] [PubMed]
- Poteko, J.; Zähner, M.; Schrade, S. Effects of housing system, floor type and temperature on ammonia and methane emissions from dairy farming: A meta-analysis. Biosyst. Eng. 2019, 182, 16–28. [Google Scholar] [CrossRef]
- Huang, D.; Guo, H. Diurnal and seasonal variations of greenhouse gas emissions from a naturally ventilated dairy barn in a cold region. Atmos. Environ. 2018, 172, 74–82. [Google Scholar] [CrossRef]
- Vechi, N.T.; Mellqvist, J.; Scheutz, C. Quantification of methane emissions from cattle farms, using the tracer gas dispersion method. Agric. Ecosyst. Environ. 2022, 330, 107885. [Google Scholar] [CrossRef]
- Hayek, M.N.; Miller, S.M. Underestimates of methane from intensively raised animals could undermine goals of sustainable development. Environ. Res. Lett. 2021, 16, 063006. [Google Scholar] [CrossRef]

Disclaimer/Publisher’s Note: The statements, opinions and data contained in all publications are solely those of the individual author(s) and contributor(s) and not of MDPI and/or the editor(s). MDPI and/or the editor(s) disclaim responsibility for any injury to people or property resulting from any ideas, methods, instructions or products referred to in the content. |
© 2025 by the authors. Licensee MDPI, Basel, Switzerland. This article is an open access article distributed under the terms and conditions of the Creative Commons Attribution (CC BY) license (https://creativecommons.org/licenses/by/4.0/).