Article

Drought Evolution in the Yangtze and Yellow River Basins and Its Dual Impact on Ecosystem Carbon Sequestration

1
College of Soil and Water Conservation, Southwest Forestry University, Kunming 650224, China
2
School of Geographical Science and Tourism, Zhaotong University, Zhaotong 657000, China
3
Faculty of Geography, Yunnan Normal University, Kunming 650500, China
*
Author to whom correspondence should be addressed.
Agriculture 2025, 15(14), 1552; https://doi.org/10.3390/agriculture15141552
Submission received: 2 June 2025 / Revised: 15 July 2025 / Accepted: 17 July 2025 / Published: 19 July 2025
(This article belongs to the Section Ecosystem, Environment and Climate Change in Agriculture)

Abstract

As an extreme event driven by global climate change, drought poses a severe threat to terrestrial ecosystems. The Yangtze River Basin (YZRB) and Yellow River Basin (YRB) are key ecological barriers and economic zones in China, holding strategic importance for exploring the evolution of drought patterns and their ecological impacts. Using meteorological station data and Climatic Research Unit Gridded Time Series (CRU TS) data, this study analyzed the spatiotemporal characteristics of drought evolution in the YZRB and YRB from 1961 to 2021 using the standardized precipitation evapotranspiration index (SPEI) and run theory. Additionally, this study examined drought effects on ecosystem carbon sequestration (CS) at the city, county, and pixel scales. The results revealed the following: (1) the CRU data effectively captured precipitation (annual r = 0.94) and temperature (annual r = 0.95) trends in both basins, despite significantly underestimating winter temperatures, with the optimal SPEI calculation accuracy found at the monthly scale; (2) both basins experienced frequent autumn–winter droughts, with the YRB facing stronger droughts, including nine events which exceeded 10 months (the longest lasting 25 months), while the mild droughts increased in frequency and extreme intensity; and (3) the drought impacts on CS demonstrated a significant threshold effect, where the intensified drought unexpectedly enhanced CS in western regions, such as the Garzê Autonomous Prefecture in Sichuan Province and Changdu City in the Xizang Autonomous Region, but suppressed CS in the midstream and downstream plains. The CS responded positively under weak drought conditions but declined once the drought intensity surpassed the threshold. This study revealed a nonlinear relationship between drought and CS across climatic zones, thereby providing a scientific foundation for enhancing ecological resilience.

1. Introduction

Climate change is recognized as one of the major threats to Earth in the 21st century [1], attracting significant international scholarly attention and posing a critical challenge to sustainable development. The Sixth Assessment Report of the Intergovernmental Panel on Climate Change (IPCC AR6) states that the average global surface temperature increased by approximately 1.09 °C during 2011–2020 compared to 1850–1900 [2]. With this evident global warming trend, extreme weather events occur more frequently [3]. Among them, drought is one of the most persistent and widespread [1] and poses a particularly prominent threat to the carbon sink function of terrestrial ecosystems [4,5]. As global ecological barriers and carbon sink hotspots, the Yangtze River Basin (YZRB) and Yellow River Basin (YRB) are facing increasingly severe drought challenges [6,7]. Studies have indicated that droughts can reduce net ecosystem carbon uptake by inhibiting plant photosynthesis, accelerating respiratory consumption, and altering species composition [8,9], with carbon losses potentially requiring decades to recover [10]. In addition to a range of associated negative impacts on ecosystems, droughts may trigger cascading effects [11], such as losses in crop and plant productivity, biodiversity decline, ecosystem degradation, and increased wildfires [12]. Therefore, investigating the spatial and temporal characteristics of drought and its impact on ecosystems is essential for developing adaptive management strategies and ensuring regional ecological security.
Drought assessment relies on effective quantitative indices [5] that represent characteristics such as intensity, duration, severity, and frequency through a single value [13,14], offering significant advantages in quantifying drought conditions compared to raw data [15]. More than 150 drought indices have been developed [5], with widely used meteorological indices including the Palmer drought severity index (PDSI) [16], standardized precipitation index (SPI) [17], and standardized precipitation evapotranspiration index (SPEI) [18]. However, the PDSI is limited by a strong lag effect and a fixed time scale [19,20], whereas the SPI considers only precipitation and neglects the influence of temperature on water deficits [21,22], which may reduce its effectiveness in assessing drought impacts under intensified temperature-driven hydrological processes [21,22]. In contrast, the SPEI integrates precipitation and potential evapotranspiration [18], provides a more comprehensive measure of water stress under climate change, and is becoming the most widely applied meteorological drought index globally [23,24,25,26]. Notably, the multi-timescale feature of the SPEI effectively captures the dynamic relationship between water deficits during the vegetation growing season and carbon sequestration (CS) fluctuations [27].
Drought exhibits significant spatiotemporal variability and widespread impact, and its monitoring is heavily dependent on long-term data. However, obtaining large-scale, long-term meteorological data through conventional measurements is challenging in regions with complex terrains or limited economic resources. Satellite remote sensing and reanalysis products (e.g., CRU TS and ERA5) have effectively addressed the limitations of traditional observational methods, enabling the monitoring and tracking of large-scale drought events [28,29]. Most studies utilizing reanalysis datasets to calculate drought indices have emphasized precipitation while ignoring the effects of temperature variations [30,31]. With robust quality control and homogenization checks [32], the CRU TS dataset effectively mitigated the issues of sparse regional meteorological stations and variability in the precipitation records. Providing continuous records since 1901, it meets the long-term data requirements (at least 30 years) for basin-scale drought studies and SPEI calculations [33]. Moreover, the CRU TS dataset calculates the potential evapotranspiration (PET) using the Penman–Monteith algorithm [33], thereby overcoming the systematic biases of the Thornthwaite method, which underestimates PET in arid and semi-arid regions and overestimates it in humid areas [34]. Studies have demonstrated the superior performance of CRU TS data in drought monitoring [35,36], and it has been used to assess the reliability of other reanalysis datasets [37,38], rendering it a consistent and relatively reliable source of gridded meteorological data. Nevertheless, owing to the complex topography, diverse climate, and significant seasonal and regional differences in precipitation and temperature distributions, the applicability of CRU TS data in the YZRB and YRB requires further verification and evaluation.
The YZRB and YRB span China’s humid to semi-arid climate zones, serving as typical regions for studying climate–ecosystem interactions. The YZRB is the core distribution area of subtropical forests and wetland ecosystems and exhibits a high CS capacity that is essential for maintaining the regional ecological balance. It is located in an ecologically vulnerable transitional zone that is highly sensitive to drought stress, offering a unique case for understanding the critical thresholds in the carbon cycle. However, in recent decades, the duration and frequency of droughts have increased significantly, exacerbating ecosystem service degradation and economic loss [6,7,39,40]. Beyond threatening carbon sinks, intensifying droughts severely compromise agricultural sustainability in China’s two most critical agricultural production regions, the YZRB and the YRB [41]. These regions frequently experience compound heatwaves and prolonged droughts, leading to substantial crop losses [6,42]. For instance, the severe drought in Southwestern China in 2010, which encompassed much of the YZRB, affected approximately 60 million people and caused billions of dollars in agricultural damage. More recently, the record-breaking drought from July to November 2022 affected 52.5 million people and 60.9 million hectares of crops, resulting in an estimated economic loss of USD 7.5 billion [43,44]. Therefore, analyzing the responses of ecosystem CS to frequent droughts is crucial for developing adaptive management strategies and enhancing ecological resilience.
Existing research has certain limitations. Drought monitoring in complex terrains relies on limited station data, and the regional applicability of reanalysis datasets, such as CRU, has not been systematically validated. In contrast, most studies have focused on a single spatiotemporal scale, lacking multi-level correlation analyses from the pixel to county and city scales, which hinders the understanding of the cross-scale transmission processes of drought ecological effects. Therefore, this study integrated multi-source data and multiscale methods to (1) analyze the applicability of CRU TS data in the YZRB and YRB, which are characterized by complex terrain and significant climatic heterogeneity; (2) explore the spatial and temporal evolution of drought in both basins from 1961 to 2021; and (3) reveal the mechanism of drought impacts on ecosystem CS from the pixel to city scales, providing scientific evidence to enhance ecological resilience in global drought-sensitive regions.

2. Materials and Methods
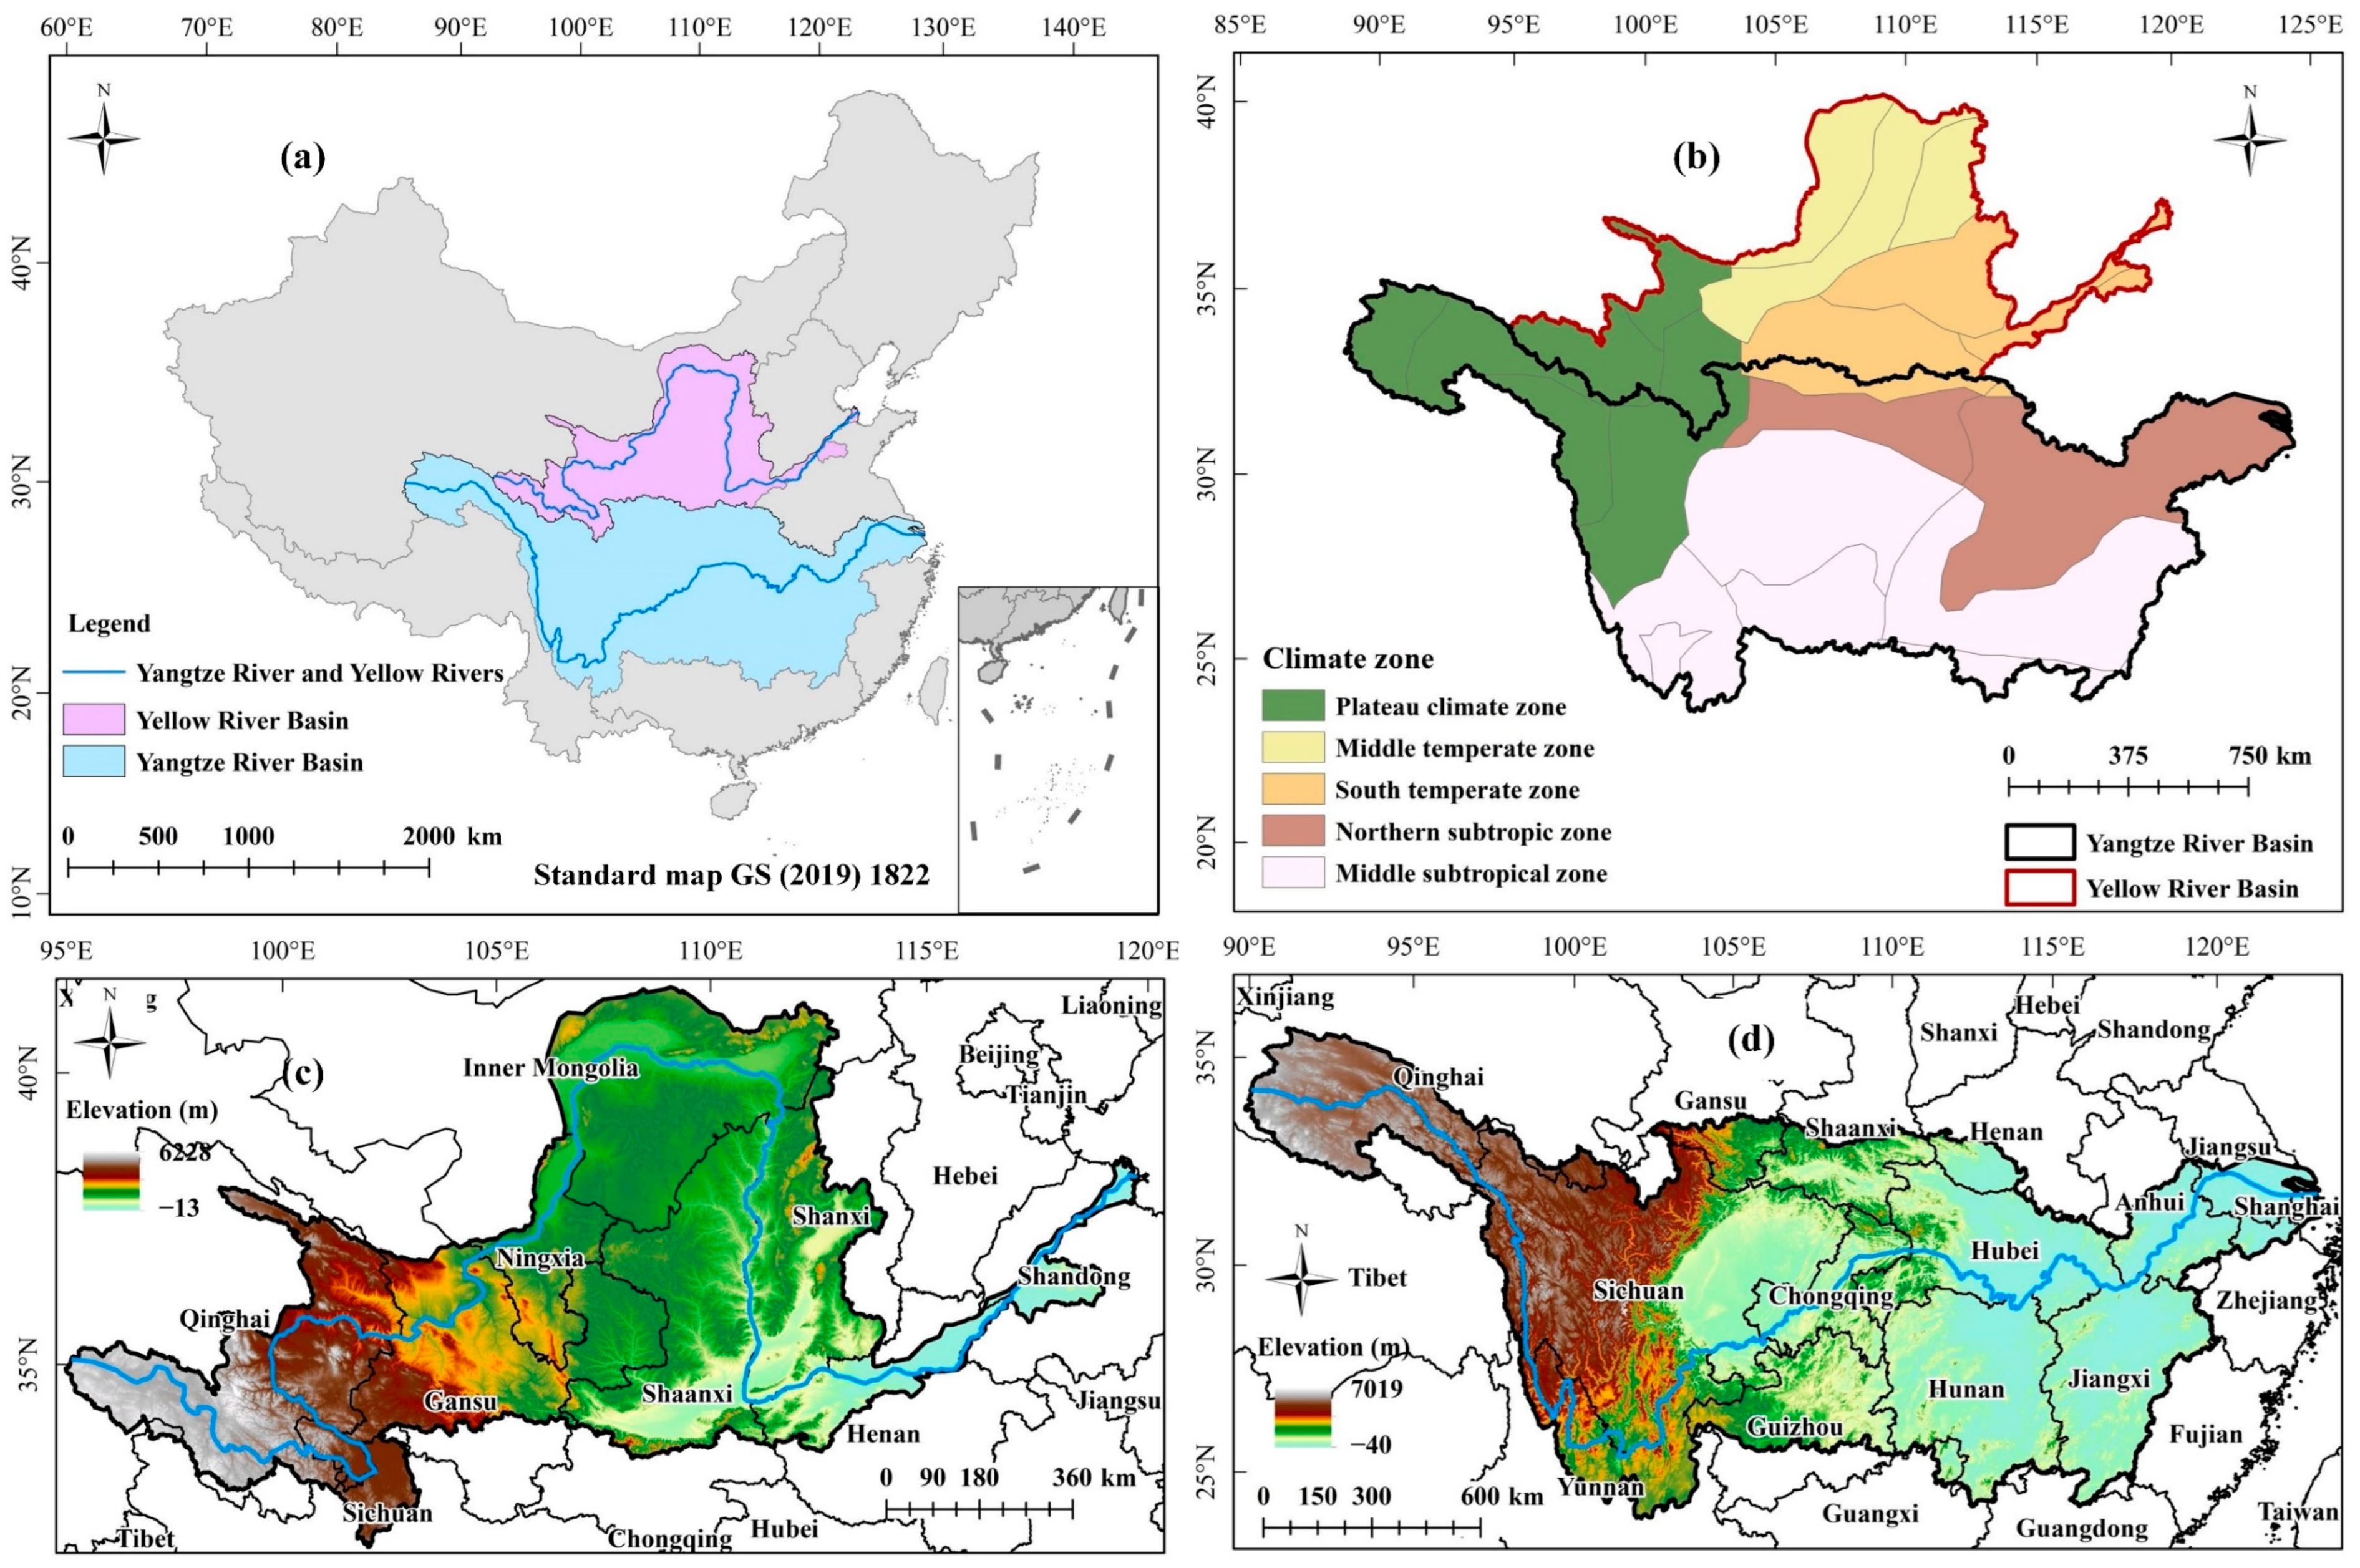
2.1. Study Area

Originating from the Qinghai–Tibet Plateau, the Yangtze and Yellow Rivers are the two longest rivers in China and rank as the third and sixth longest in the world, respectively (Figure 1). The YZRB (24°30′–35°45′ N, 90°33′–122°33′ E) spans China’s western, central, and eastern economic regions, with a total length of 6397 km and a drainage area of 1.8 million km2. The region features highly diverse and complex landforms, with mountains covering approximately 80% of the region. The climate is predominantly subtropical monsoon, which can be characterized by distinct seasonality and regional differences, with hot and humid summers and cold and dry winters. The precipitation and temperature exhibit significant spatial variability across the basin.
The YRB (32°10′–41°50′ N, 95°53′–119°05′ E) covers a total area of 795,000 km2 and extends 5464 km in length. The terrain descends stepwise from west to east, with mountainous regions comprising approximately 70% of the total area. The climate is primarily continental and influenced by atmospheric circulation and monsoonal patterns, resulting in significant spatial variability in precipitation and temperature across the basin.

2.2. Data Sources

(1) The data were obtained from the National Meteorological Information Center (https://www.nmic.cn/, accessed on 1 October 2022) via the China National Surface Meteorological Stations Basic Meteorological Elements Daily Dataset (V3.0), covering 696 national-level surface stations across China. The monthly precipitation and temperature data from 2000 to 2020 were collected, including station codes, latitude and longitude, elevation of observation fields, time, and quality control codes. The precipitation data were divided into three time periods (20:00–08:00, 08:00–20:00, and 20:00–20:00), and the temperature data included the average temperature, daily maximum temperature, daily minimum temperature, and quality control codes. Monthly precipitation and average temperature data from 338 meteorological stations within the two basins and the surrounding areas were analyzed.
(2) CRU TS Version 4.06 (CRU TS4.06), provided by the Climatic Research Unit of the University of East Anglia (https://crudata.uea.ac.uk/cru/data/hrg/, accessed on 12 October 2022), is one of the most widely used near-surface climate datasets globally. The CRU TS4.06 dataset (hereafter referred to as CRU) includes various climate variables such as mean temperature, diurnal temperature range, precipitation, frost days, wet days, vapor pressure, and cloud cover. With extensive temporal coverage from 1901 to 2021, a monthly time resolution, and a spatial resolution of 0.5° × 0.5°, it is appropriate for long-term global- and regional-scale studies. This study adopted CRU data on precipitation, temperature, and potential evapotranspiration from 1961 to 2021. The preprocessing steps, including format conversion (.nc to .tif) and spatial clipping, were conducted to satisfy the study requirements.
(3) The net primary productivity (NPP) dataset was obtained from MOD17A3HGF Version 6.1 (https://search.earthdata.nasa.gov/search, accessed on 9 January 2023) with a spatial resolution of 500 m × 500 m, covering the period from 2001 to 2021. The dataset was preprocessed using HEG V2.15, MATLAB R2020b, and ArcGIS 10.5 for splicing, format conversion, reprojection, and resampling.

2.3. Methods

This study first evaluated the applicability of CRU TS data in the YZRB and YRB using data from 338 meteorological stations, which were assessed using accuracy evaluation indices, such as correlation coefficients and root mean square errors. Second, the SPEI was selected as the drought index, and multi-timescale SPEI values (1-, 3-, 6-, and 12-month) were calculated using the CRU monthly precipitation and potential evapotranspiration data to analyze the SPEI variations across multiple timescales in both basins. The drought characteristics, including the number, duration, intensity, and severity of drought events, were identified using run theory. Finally, ecosystem CS was estimated based on NPP data, and the impact of drought on CS capacity was analyzed across multiple spatial scales, from the pixel to the county and city levels. Figure 2 illustrates the study flow chart, and the spatial resolution of the data was unified to 1 × 1 km when examining the relationship between drought and CS.
(1)
Calculation of Drought Index
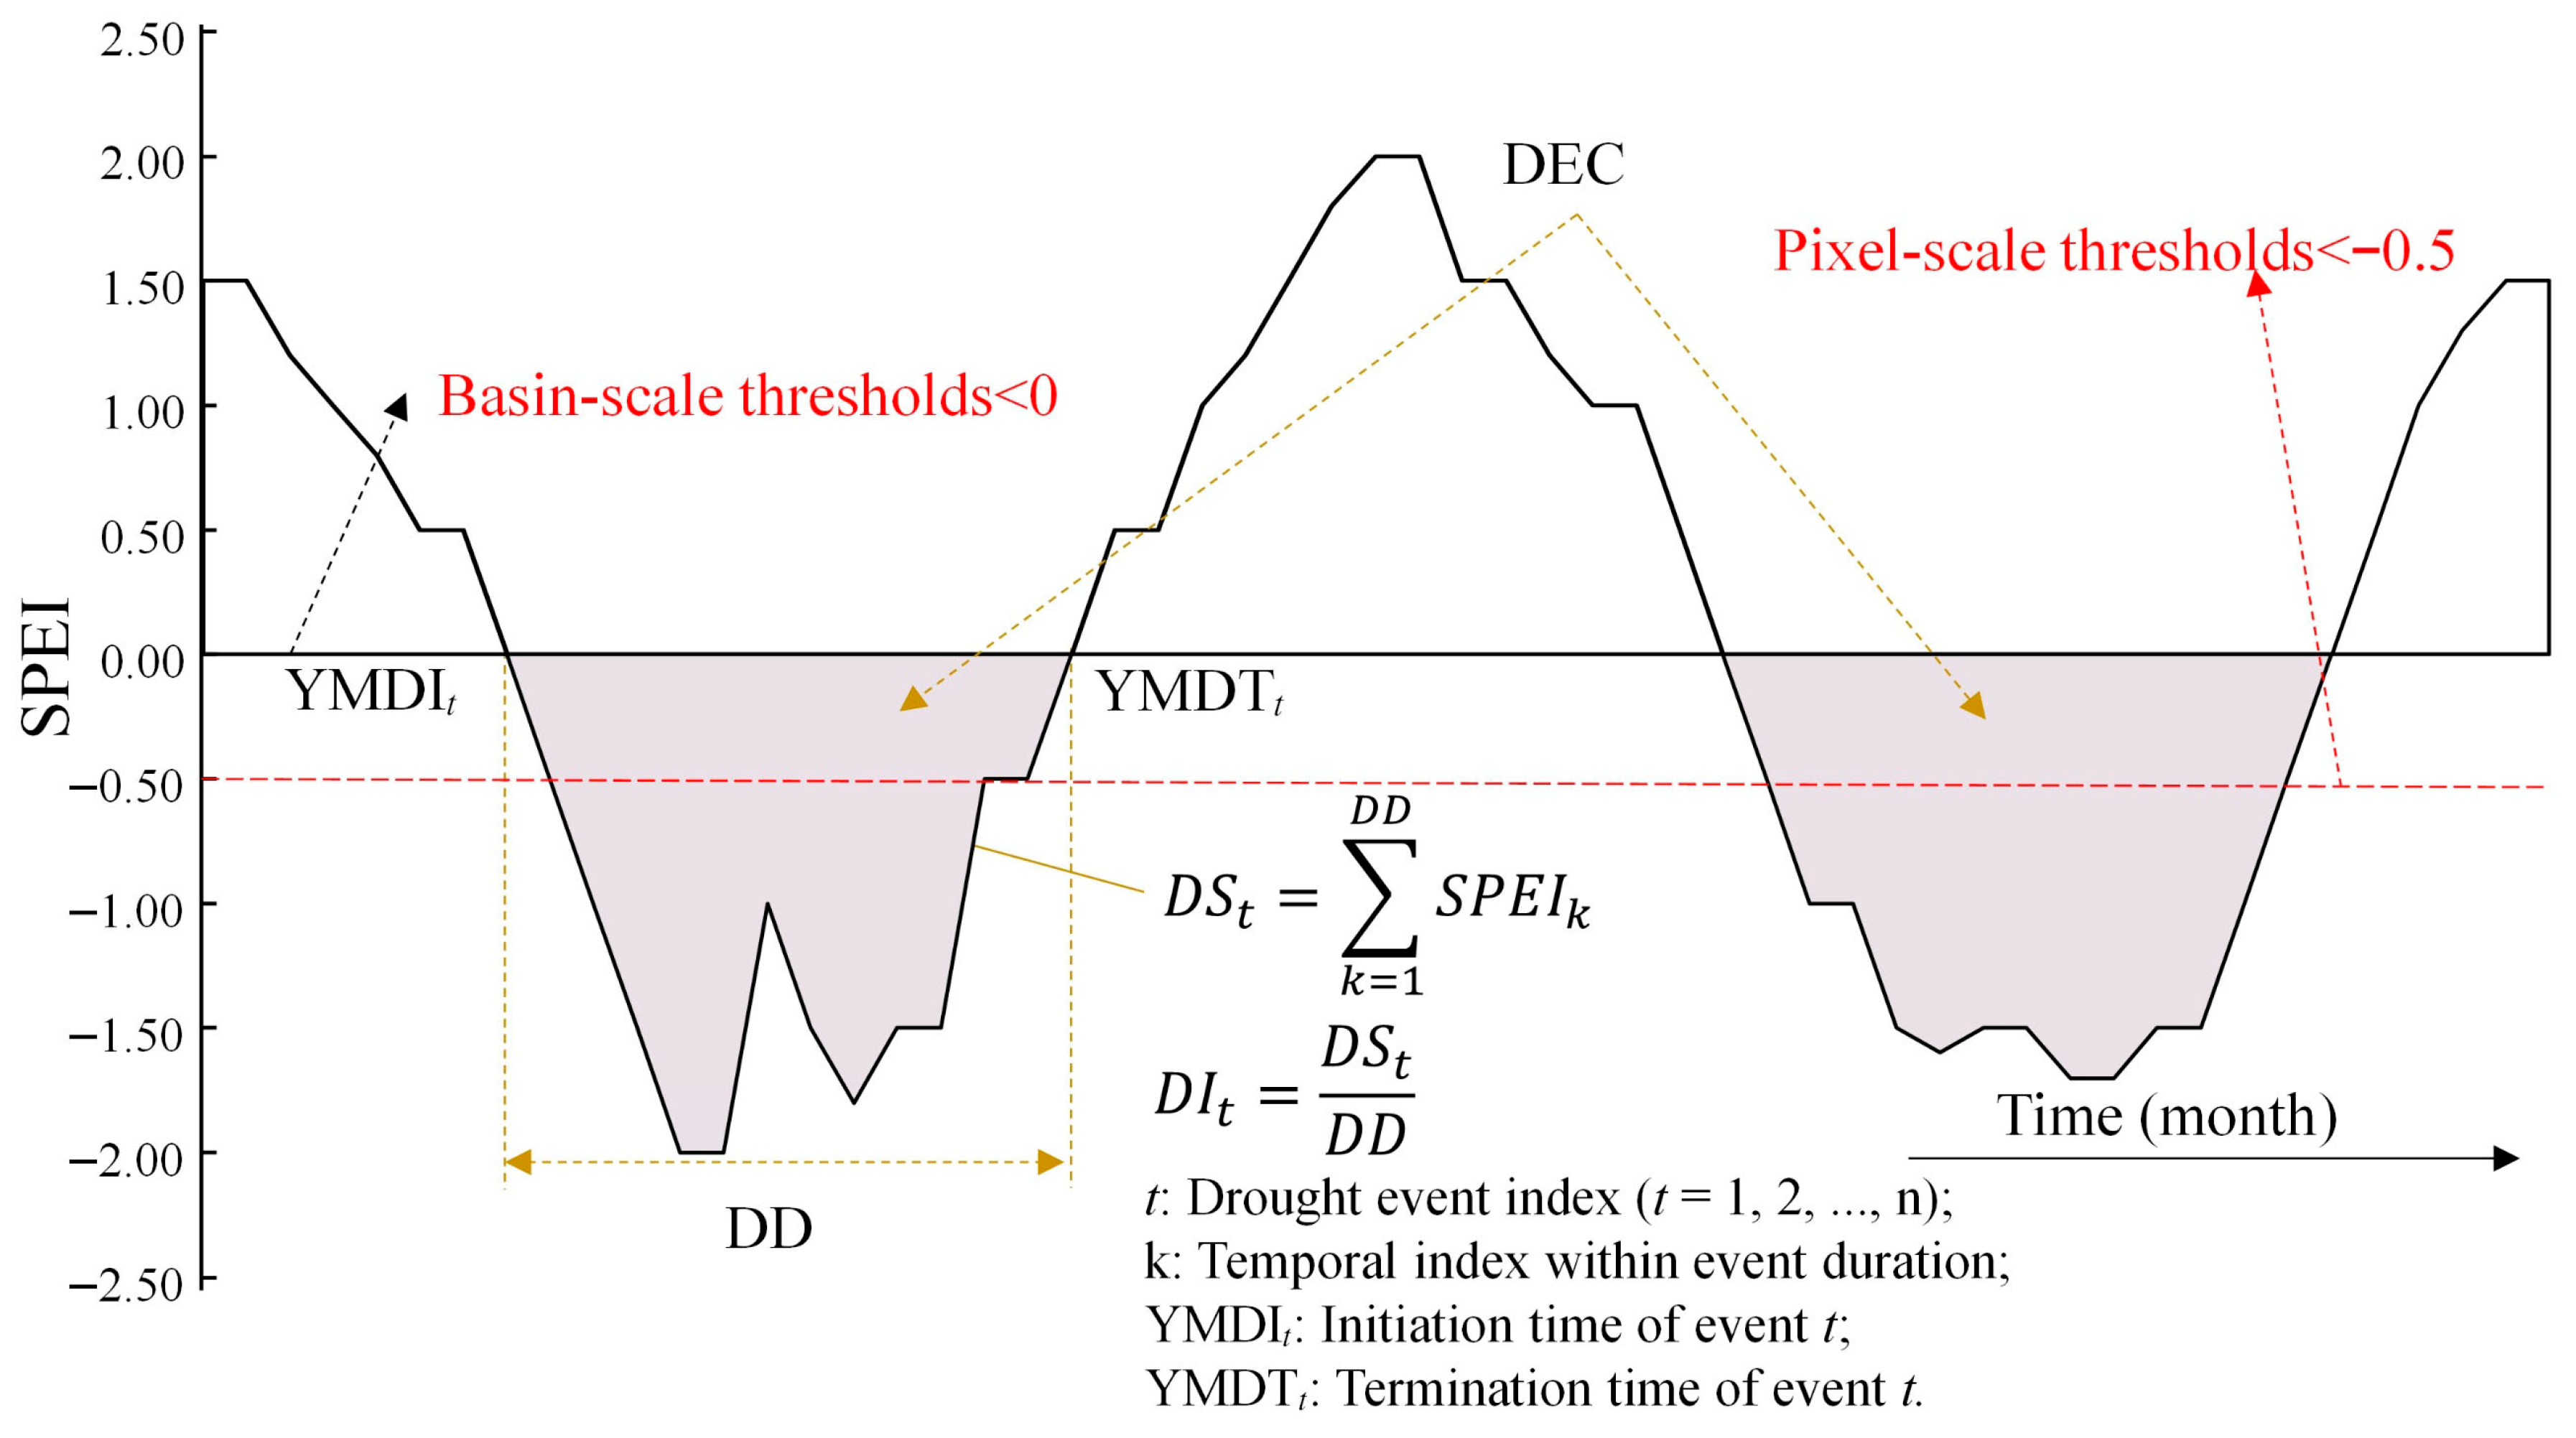
The SPEI [18] is a comprehensive monitoring index that integrates precipitation and temperature to assess water balance and has been widely employed for drought monitoring owing to its robustness and applicability across multiple spatial and temporal scales. The calculation method is as follows:
D i = P i P E T i
S P E I i = W i c 0 c 1 W i + c 2 W i 2 1 + d 1 W i + d 2 W i 2 + d 3 W i 2
W i = 2 ln p ,                               p 0.5 W i = 2 ln ( 1 p ) ,         p > 0.5
where D i represents the difference between precipitation and potential evapotranspiration, P i is the monthly precipitation, P E T i is the monthly potential evapotranspiration, and p is the cumulative probability. The detailed calculation process of the SPEI is provided in reference [18], and the classification of drought levels based on the SPEI is presented in Table 1.
Although the SPEI is widely used in global change studies as a vital drought index, its reliability and accuracy depend mainly on the quality of the input data, including precipitation, temperature, and potential evapotranspiration. Therefore, the applicability of CRU data should be analyzed before performing SPEI calculations to ensure data reliability and result accuracy. In this study, several accuracy assessment metrics were applied to assess SPEI at monthly, seasonal, and annual scales. Seasonal analyses followed the World Meteorological Organization’s standard calendar: spring (March–May), summer (June–August), autumn (September–November), and winter (December–February) (https://wmo.int/, accessed on 1 May 2025). The metrics included Pearson’s correlation coefficient (r), bias (BIAS), root mean square error (RMSE), and mean absolute error (MAE). Specifically, an r-value greater than 0 indicates a positive correlation, whereas an r-value less than 0 indicates a negative correlation, with values closer to 1 representing a stronger correlation. BIAS measures the average deviation between the predicted and observed values, where values closer to 0 indicate better consistency, BIAS < 0 indicates underestimation, and BIAS > 0 indicates overestimation. The RMSE reflects the overall error and deviation between the observed and predicted values, with smaller values indicating a higher similarity. Similarly, smaller MAE values indicate that the predicted values are closer to the observed values.
r = i = 1 n x i x ¯ y i y ¯ i = 1 n x i x ¯ 2 i = 1 n y i y ¯ 2
B I A S = i = 1 n y i i = 1 n x i 1
R M S E = i = 1 n ( y i x i ) 2 n
M A E = i = 1 n ( y i x i ) n
where x i and y i represent the observed and predicted values, respectively; x ¯ and y ¯ are the mean values; i is the observatory identification; and n is the number of observatory sites.
(2)
Identification of Drought Characteristics
The run theory effectively analyzes time series and efficiently captures persistent drought events [46]. Shiau [47] suggested that sustained SPI values below zero could also cause severe drought, supporting the selection of a threshold of 0. Wu et al. [48] proposed that SPI < 0 can represent the precipitation anomalies and can be used for the preliminary identification of drought months. However, owing to the temporal accumulation effect of drought, a drought event can only be defined with SPI < 0 persisting for two or more consecutive months. In this study, run theory was applied to identify drought events using SPEI-1 in the two basins, incorporating metrics such as drought event counts (DECs), year and month of drought initiation (YMDI), year and month of drought termination (YMDT), drought duration (DD), drought severity (DS), and drought intensity (DI). DS represents the cumulative SPEI value for a specific drought event. DI was the average SPEI value throughout the drought, which can be calculated as the ratio of DS to drought duration. Smaller DS and DI values indicate higher drought levels. According to the GB/T 20481-2017 Grades of Meteorological Drought [45], drought conditions are considered to occur when the SPEI falls below −0.5. Therefore, SPEI-1 < 0 was selected as the threshold for identifying drought events at the basin scale, whereas SPEI-1 < −0.5 was used as the criterion for drought identification at the pixel scale (Figure 3). The specific steps for identifying drought events were performed as follows: (1) a drought was recognized when SPEI-1 < 0; (2) the cases where drought lasted only one month were excluded and considered non-drought months; and (3) if only a one-month gap existed between two adjacent drought events, they were merged into a single event.
In addition, drought frequency was utilized to characterize the droughts in the two basins, defined as the ratio of the number of drought events during the study period to the total length of the study period, and was calculated using the following formula:
F i = D i / D t
where F i represents the drought frequency at each grid point, with a range of [0–1]; D i is the number of drought occurrences at each grid point (where SPEI < −0.5 is considered a drought); and D t denotes the total study period.
(3)
Ecosystem Carbon Sequestration (CS) Estimation
Ecosystem CS is an ecological process in terrestrial ecosystems that captures and fixes carbon dioxide and plays a crucial role in climate regulation and sustainable development [49]. Given that vegetation captures an average of 1.63 units of carbon per unit of NPP, NPP can be used to evaluate the function of ecosystem CS services. Notably, a specific relationship exists between NPP and CS [50].
C S = 1.63 × N P P
where CS is the annual ecosystem CS (Units: K g C / m 2 / y r ) and NPP is the MOD17A3HGF NPP data for each year from 2001 to 2021 after resampling (1 km × 1 km).
(4)
Quantification of the Relationship Between Drought and CS
As MOD17A3HGF can only provide data from 2001 onward, this study examined the relationship between drought and CS from 2001 to 2021. A two-tailed Pearson’s correlation was applied to evaluate the relationship between SPEI-12 and annual CS over the 21-year period. To minimize temporal autocorrelation, data were aggregated on an annual scale. Correlation coefficients were investigated at three spatial scales (city, county, and pixel), and statistical significance was assessed at three confidence levels (α = 0.01, 0.05, and 0.1). Moreover, the drought characteristics identified by SPEI-1 during this period were classified through equal-interval reclassification, and changes in ecosystem CS functions under different drought classifications were analyzed.
(5)
Trend Analysis
Sen’s slope [51] and the Mann–Kendall (M–K) [52,53] trend tests were used to identify annual trends and assess the significance of changes in precipitation, temperature, and drought. In Sen’s slope, β >  0 indicates an increasing trend, and β < 0 indicates a decreasing trend. Once trends were identified using Sen’s slope, their statistical significance was tested using the M–K method. The significance of the trends was determined based on the Z-value, that is, |Z| ≥ 1.65, |Z| ≥ 1.96, and |Z| ≥ 2.58, corresponding to significance levels of α = 0.1 (slightly significant), α = 0.05 (moderately significant), and α = 0.01 (highly significant), respectively [54].

3. Results

3.1. Applicability of CRU TS Data

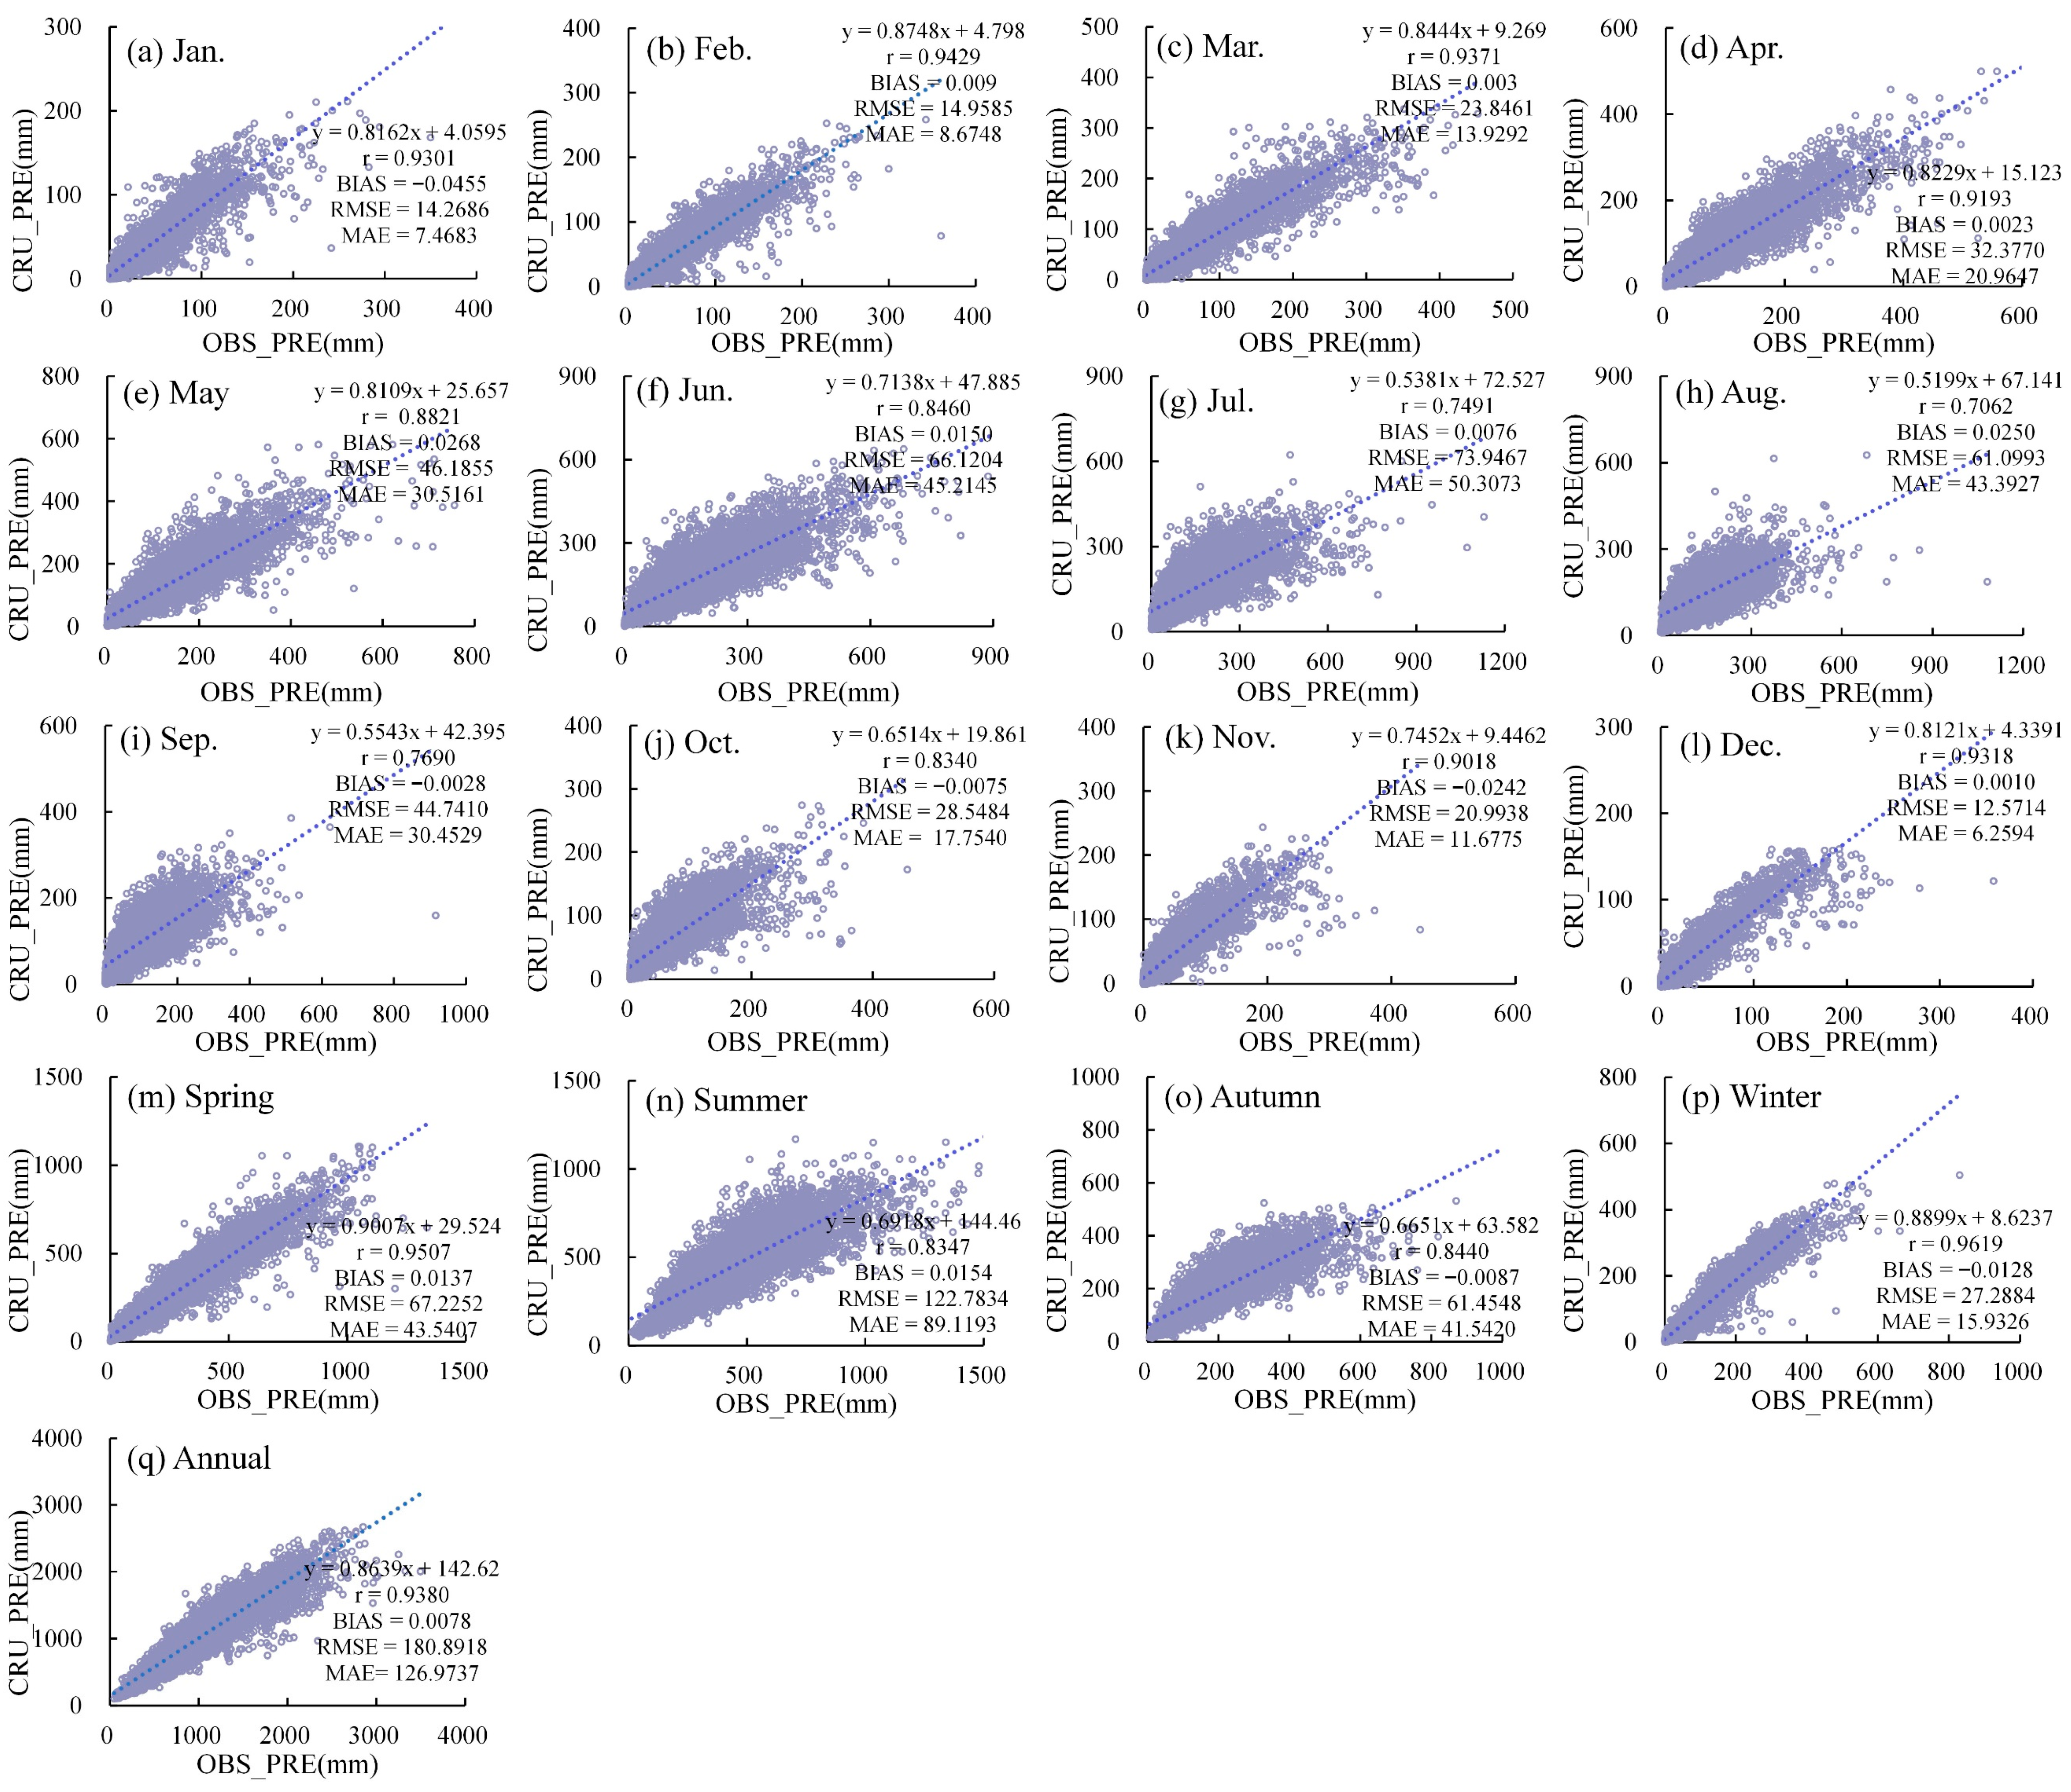
3.1.1. Accuracy Evaluation of CRU Data at Different Time Scales

(1) The applicability analysis of the CRU precipitation data at different timescales (Figure 4) demonstrated that from a monthly accuracy perspective, the r-values for January to December during 2000–2020 were all above 0.71, with the highest values in February and March (0.94) and the lowest in August (0.71). The BIAS values ranged from −0.05 to 0.03, with the CRU precipitation slightly underestimating the actual precipitation in January, October, and November while overestimating it in other months. However, all BIAS values remained close to zero, indicating that the CRU data effectively reflected the precipitation conditions in the two basins. The RMSE and MAE values at the monthly scale exhibited similar trends, initially increasing, peaking in July, and then gradually decreasing, suggesting that the representation accuracy of the CRU data declined as the precipitation levels rose. At the seasonal scale, the r-values were the highest in winter (0.96) and spring (0.95), with slightly lower values in summer and autumn. The CRU data slightly overestimated the precipitation in spring and summer while underestimating it in fall and winter, whereas the absolute BIAS value remained close to zero across all seasons, indicating an accurate seasonal precipitation representation. Furthermore, the RMSE and MAE values were the highest in summer and lowest in winter, highlighting a direct correlation between precipitation levels and error magnitude. Owing to the accumulation of monthly and seasonal errors, the RMSE and MAE values for annual CRU data were slightly higher. Nevertheless, the CRU precipitation data demonstrated a strong ability to characterize precipitation patterns across monthly, seasonal, and annual timescales, accurately reflecting actual precipitation variations.
(2) A suitability analysis of the CRU temperature data at different temporal scales was conducted. On a monthly scale (Figure 5), the CRU temperature data exhibited a strong correlation with the observed temperatures, with all r-values exceeding 0.92. However, deviations were present, with the largest bias occurring in February, underestimation occurring in December and January, and overestimation occurring in the remaining months. The RMSE and MAE indicators followed a pattern of an initial increase, then decrease, and a gradual increase again, with the smallest error observed in September. At the seasonal scale, the r-values were ranked in the order of winter > autumn > summer > spring. The CRU temperature data overestimated the actual temperatures in spring, summer, and autumn, whereas underestimation was observed in winter. On an annual scale, the temperature demonstrated a strong correlation with the actual values with a slight overestimation but an overall close alignment with real conditions. In summary, the CRU temperature data can effectively reflect the actual temperature variations across monthly, seasonal, and annual scales.

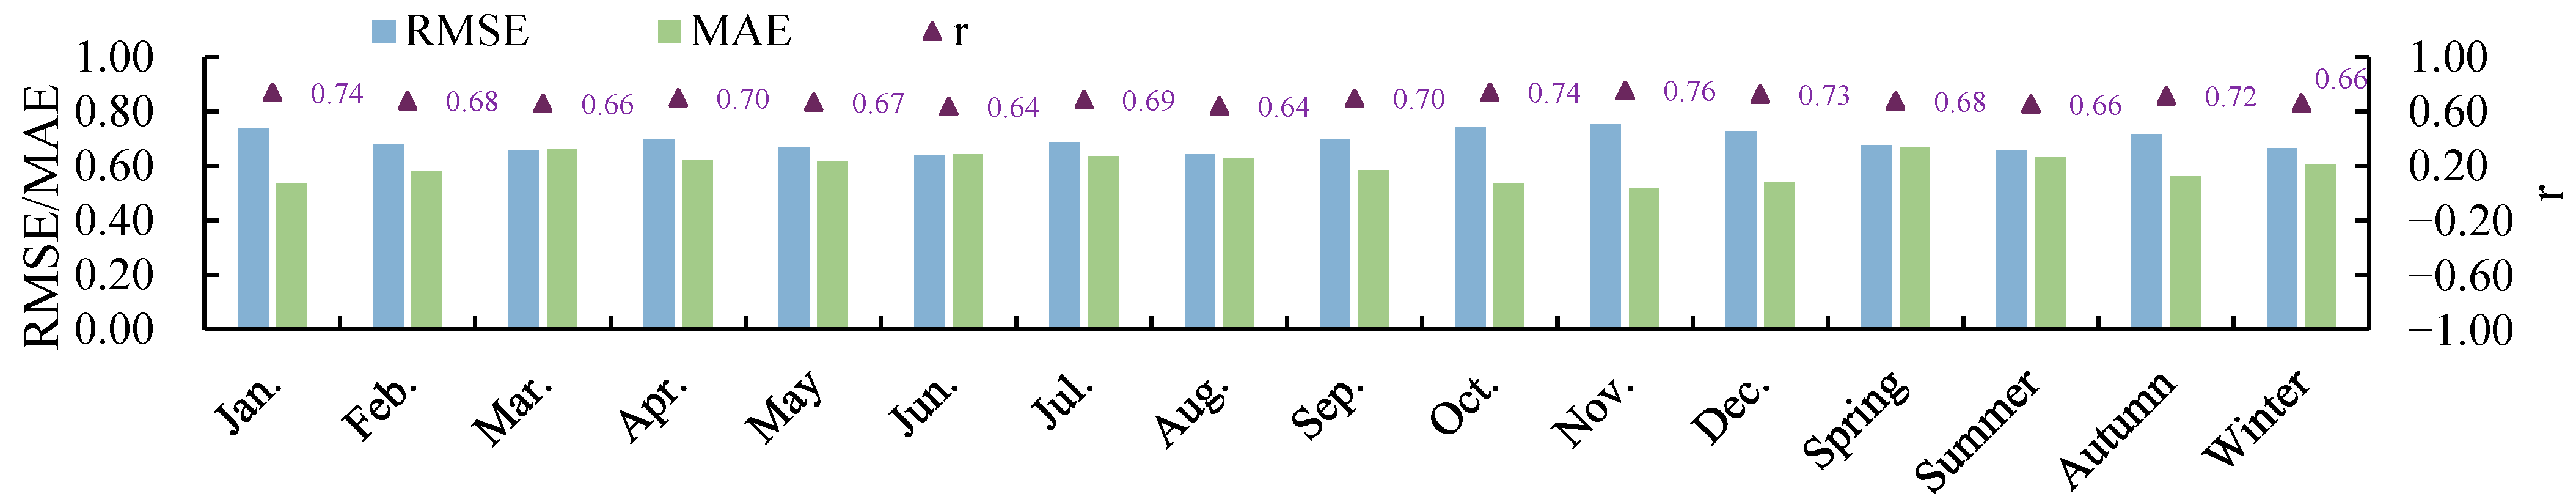
3.1.2. SPEI Characterization of Drought Capacity Based on CRU Data

This study utilized the SPEI of meteorological stations at 1-, 3-, 6-, and 12-month timescales from 2000 to 2020 to assess the applicability of the CRU SPEI during the same period (Table 2). The performance of the CRU SPEI gradually declined as the timescale increased, with SPEI-1 demonstrating the highest effectiveness in characterizing drought, whereas SPEI-12 showed a slightly lower performance than other timescales.
A comprehensive evaluation of CRU SPEI performance was conducted to assess its applicability across months and seasons (Figure 6). Using r, RMSE, and MAE, the monthly performance of SPEI from 2000 to 2020 was identified to be relatively robust, following a pattern of initial decline followed by subsequent improvement. Notably, the CRU SPEI performed best in January, October, November, and December, whereas August exhibited the poorest performance. The seasonal accuracy indicators further revealed that the CRU SPEI demonstrated superior performance in spring and autumn compared to summer and winter.

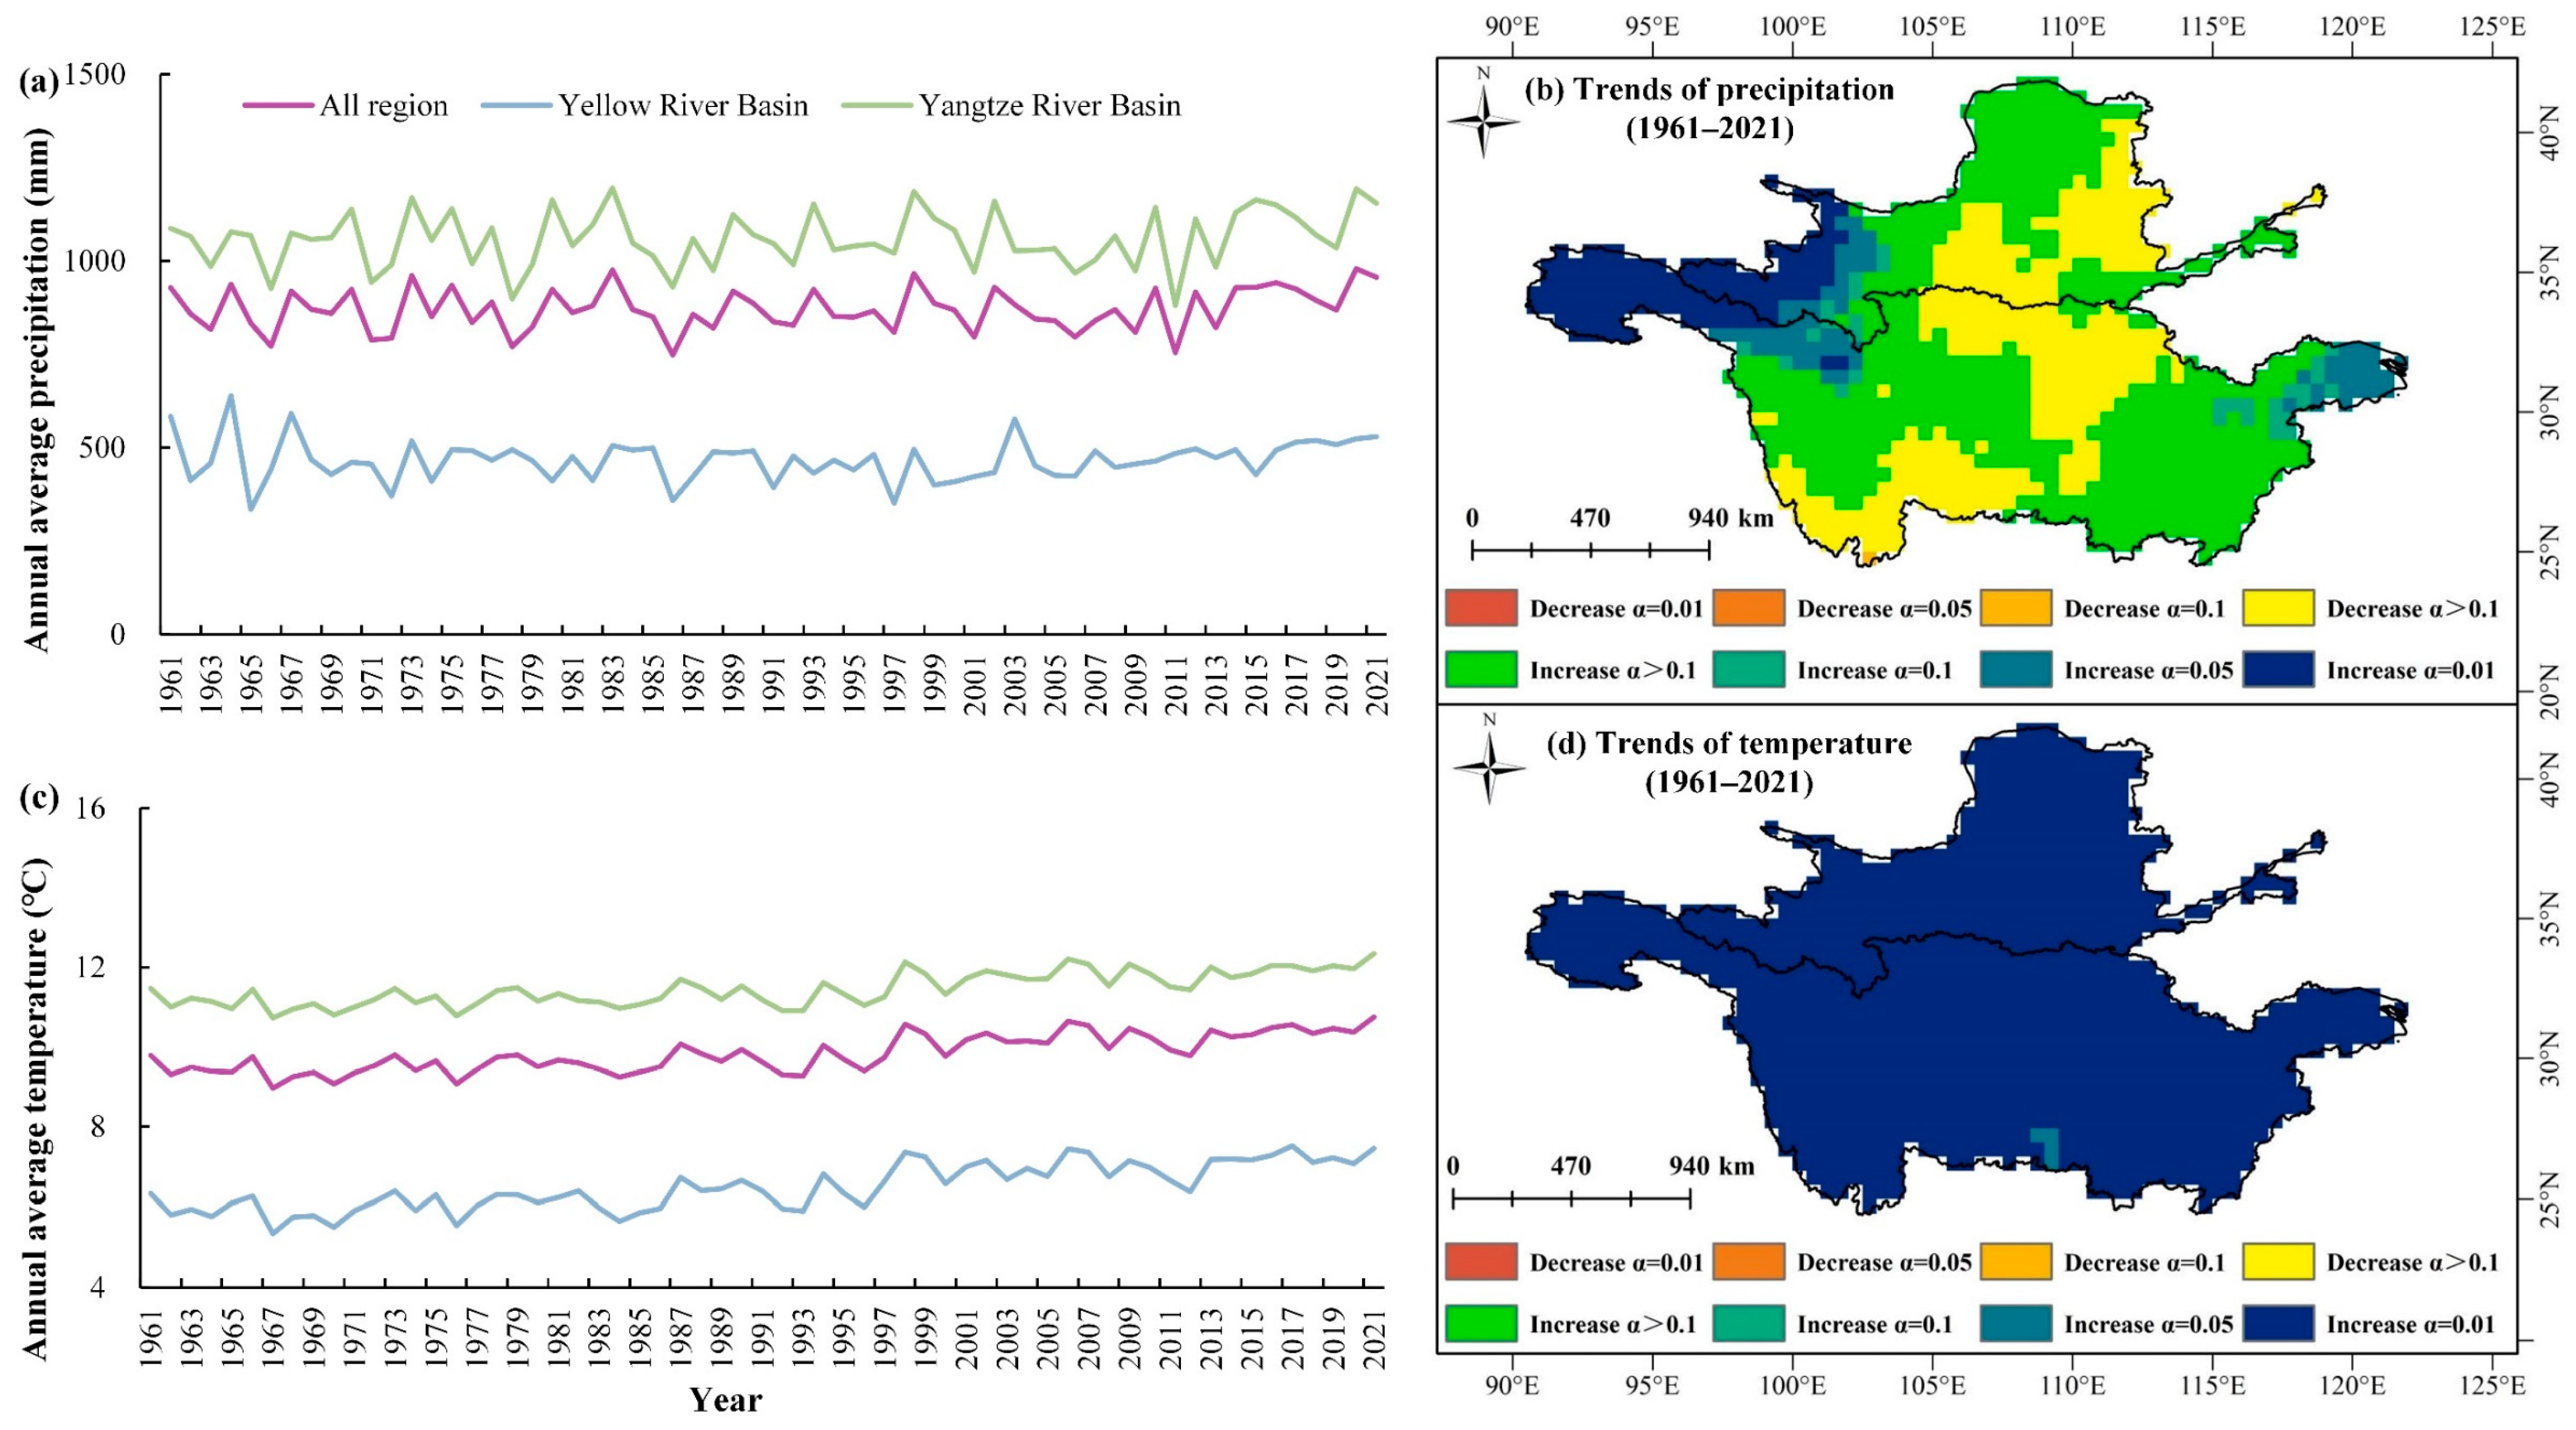
3.1.3. Spatiotemporal Variation in Precipitation and Temperature

The CRU data demonstrated high precision in simulating the precipitation and temperature in both basins (Figure S1), confirming their reliability as a substitute for meteorological station data. The annual precipitation in the two basins exhibited a decreasing spatial distribution from the southeast to northwest, with the overall precipitation in the YRB being lower than that in the YZRB, whereas the annual average temperature presented an increasing spatial distribution from west to east. Analyzing the precipitation and temperature trends from 1961 to 2021 using Sen’s slope and the M-K method [54] (Figure 7) revealed a fluctuating trend in both variables. The YRB consistently recorded significantly lower precipitation than the YZRB, with notable precipitation troughs in 1965, 1972, 1986, 1991, 1997, and 1999, when the average annual precipitation remained below 400 mm. However, since 2001, the precipitation in the YRB has exhibited a notable upward trend. In contrast, while the YZRB experienced fluctuations in annual precipitation, it generally remained at a higher level, with the historical minimum values recorded in 1978 and 2011 at 898.41 mm and 884.13 mm, respectively, while exceeding 900 mm in other years. Both basins exhibited a gradual warming trend in terms of temperature. The long-term average temperature trend in the YZRB aligned with the overall basin pattern, with the highest annual average temperature recorded in 2021 at 12.34 °C, followed by in 2006. The YRB displayed a fluctuating upward trend, with the highest annual average temperatures recorded in 2017, 2021, and 2006 at 7.52 °C, 7.45 °C, and 7.45 °C, respectively.

3.2. Analysis of Multi-Timescale Drought and Its Characteristics over the Past 61 Years

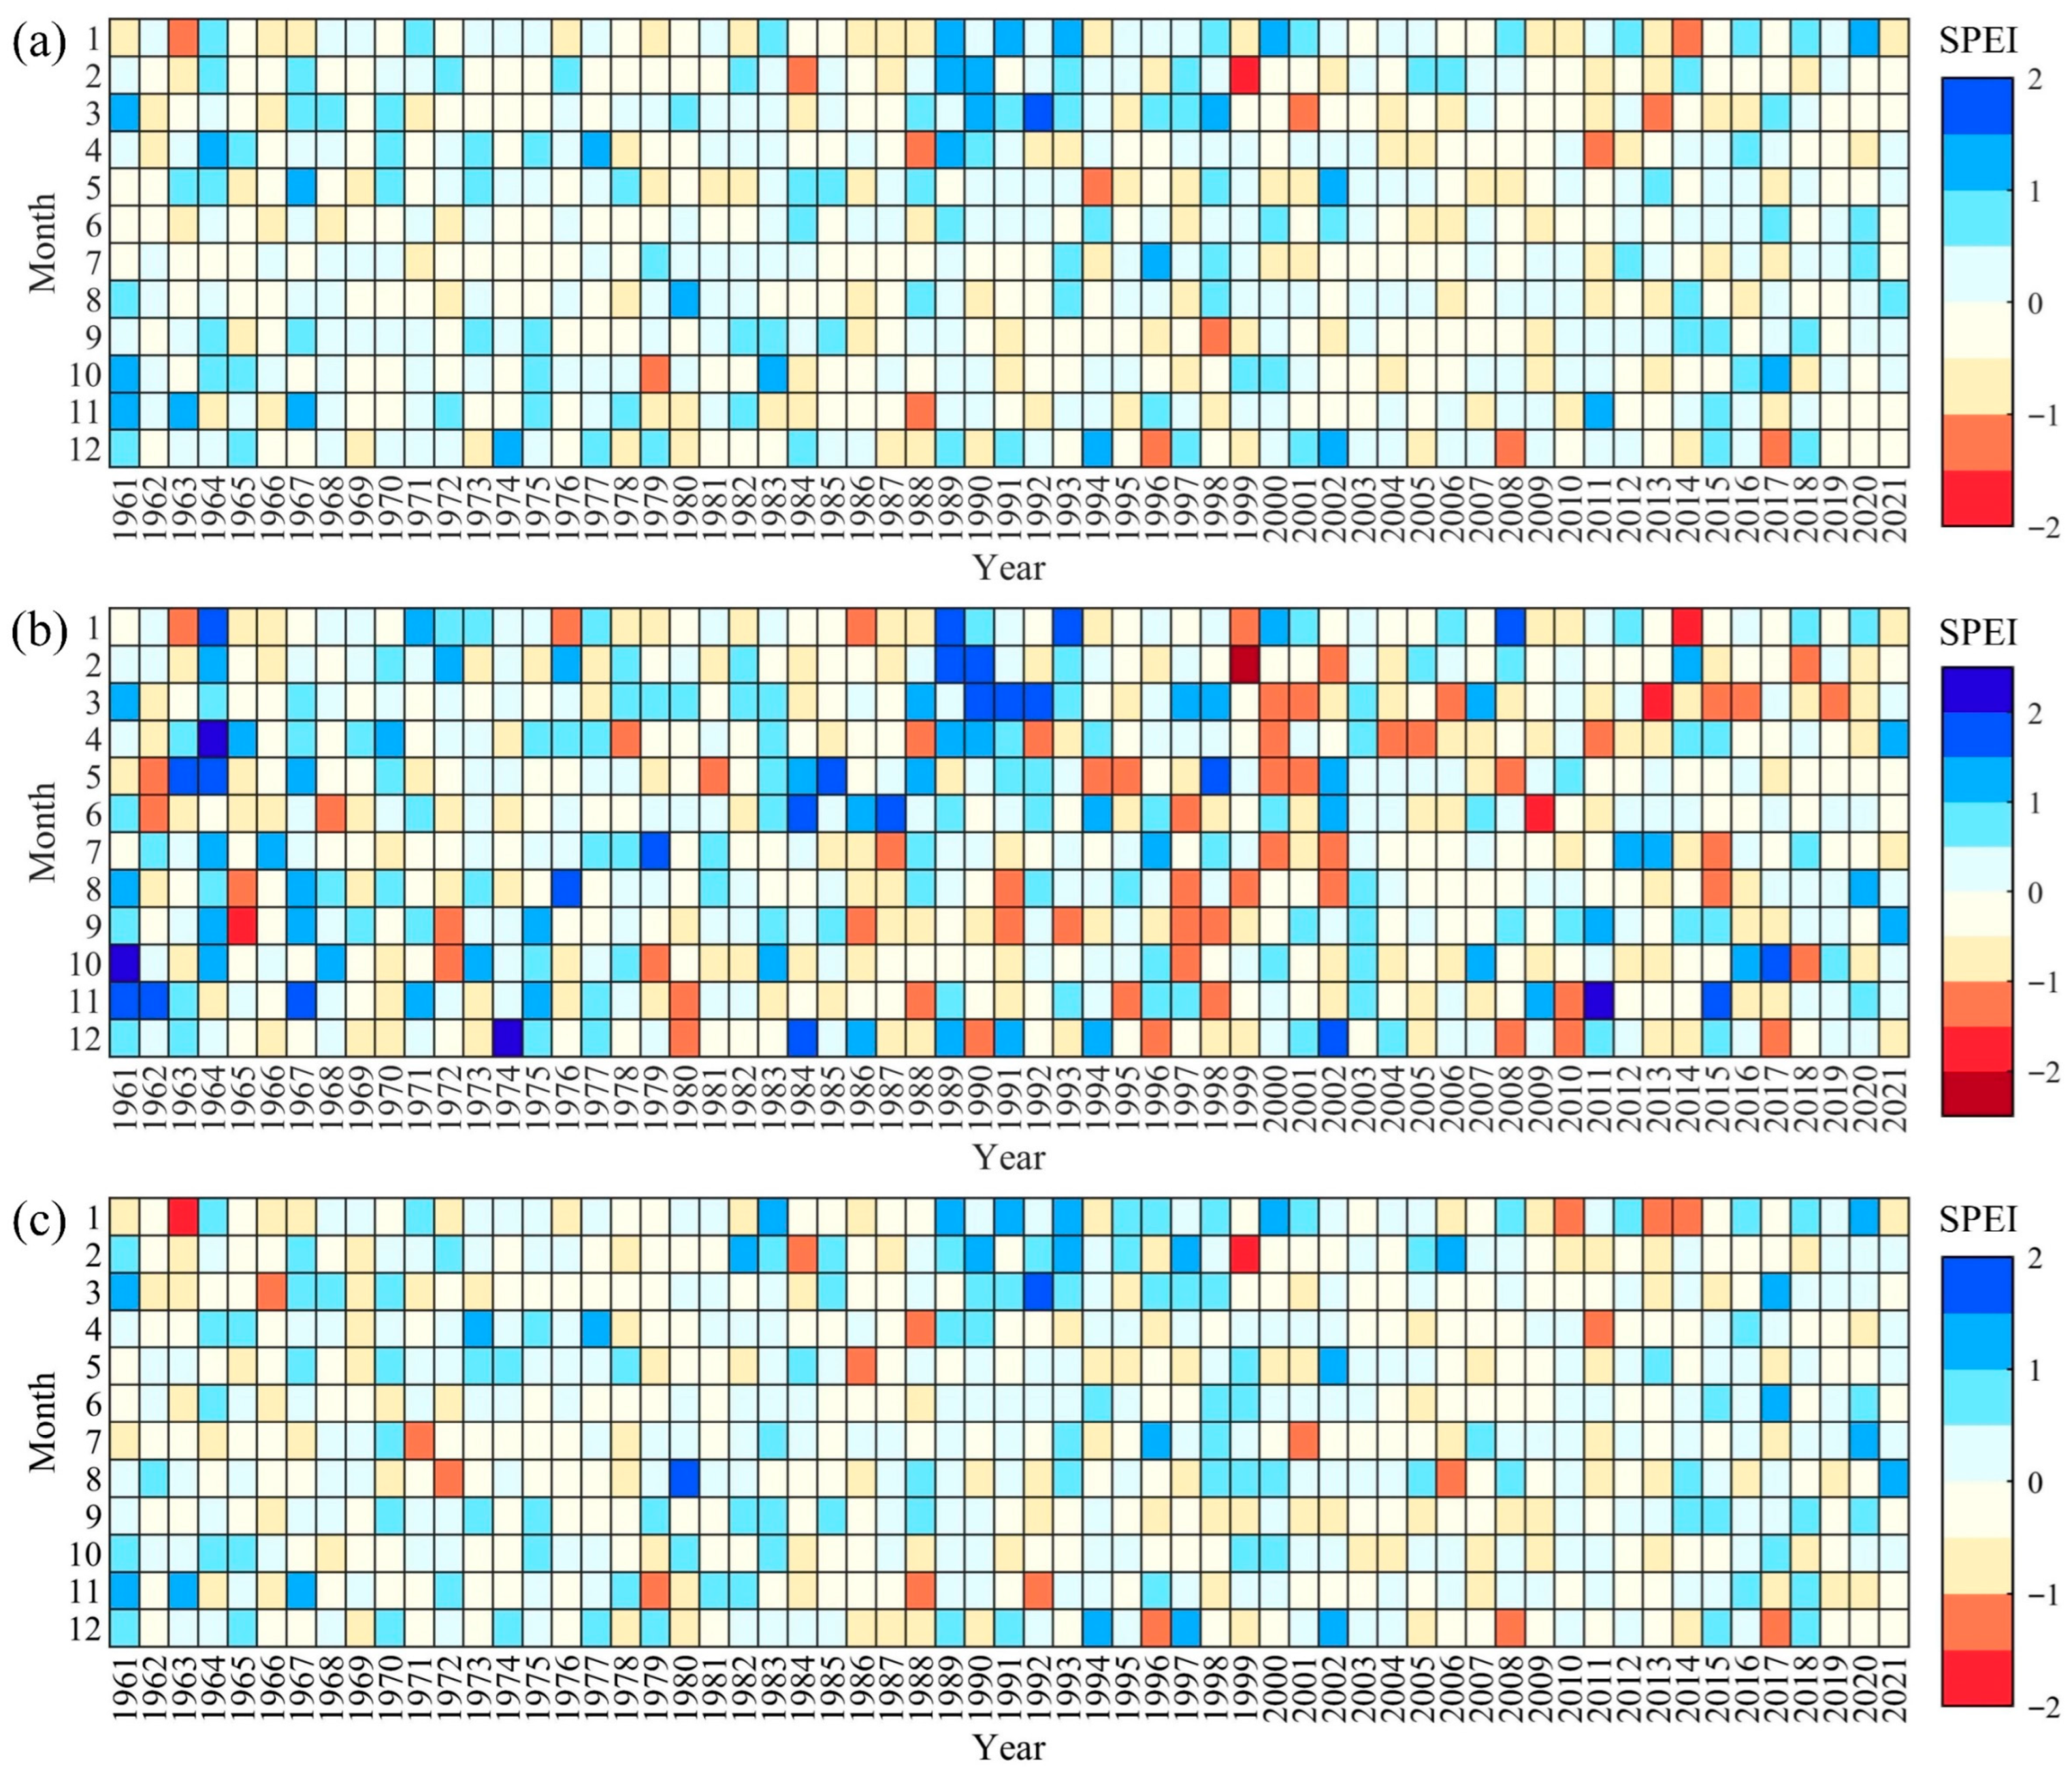
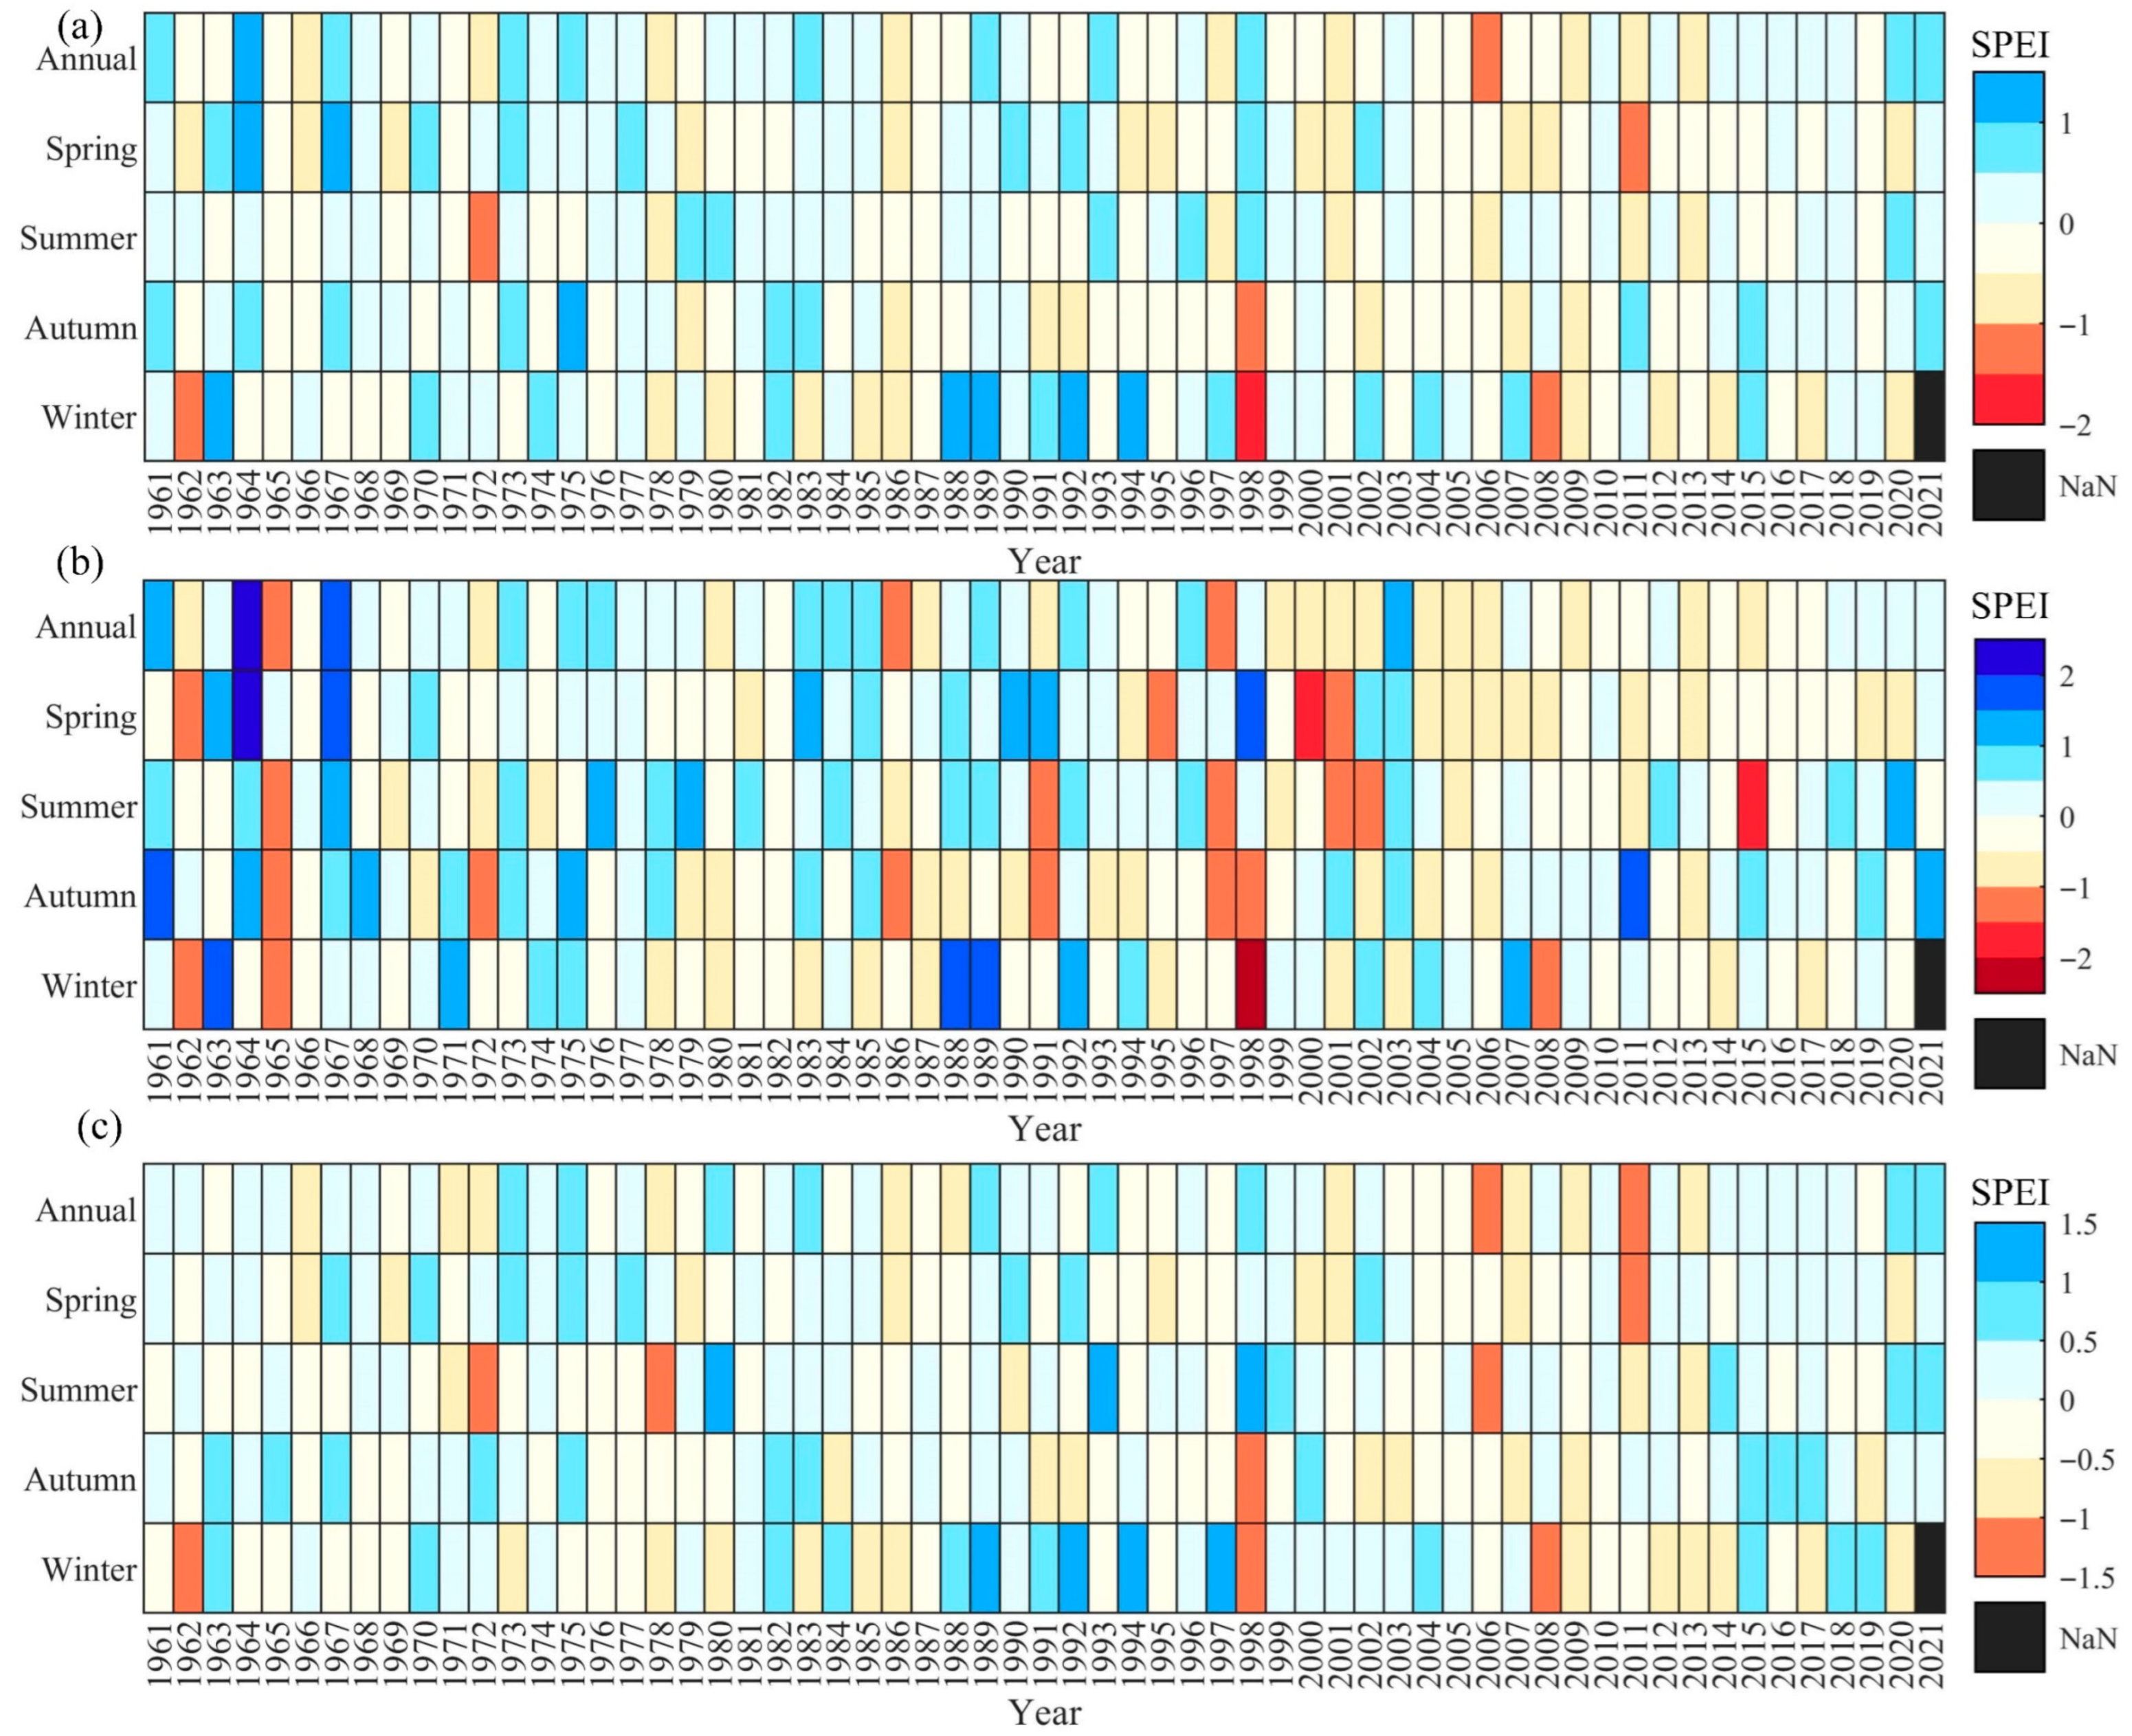
3.2.1. Evolution of Drought at Different Timescales

(1) The monthly drought evolution analysis from 1961 to 2021 (Figure 8) examined the mean SPEI-1 values across the entire region, YZRB, and YRB, revealing that the entire region generally experienced mild drought conditions (−1.0 < SPEI ≤ −0.5), with severe drought (−2 < SPEI ≤ −1.5) occurring only in February 2000. The YRB was primarily affected by mild to moderate droughts, with severe and extreme droughts (SPEI ≤ −2) being relatively rare. However, the moderate-to-severe droughts were recorded over multiple years, including 1965, 1972, 1991, and 1997–2002, with a notable increase in moderate drought months during 1997–2002. Continuous moderate droughts were observed from November to December 2010 and July to August 2015, while drought conditions eased to mild levels between 2020 and 2021. The YZRB generally experienced mild drought conditions, with severe droughts occurring only in January 1963 and February 1999 and there being fewer instances of moderate drought. Compared to the YRB, the YZRB exhibited relatively lower drought intensity, shorter durations, and less severe drought events.
(2) The drought conditions in the entire region and each basin were analyzed using the SPEI-3 (2, 5, 8, and 11 months) and SPEI-12 values from 1961 to 2021 on both seasonal and annual scales (Figure 9). On an annual scale, the region primarily experienced mild drought, with moderate drought only occurring in 2006. Moderate droughts were observed in all seasons, and multi-season consecutive droughts were common, including a year-long drought in 1986 and a moderate-to-severe drought from autumn to winter in 1998. In the YRB, moderate droughts were concentrated in 1965, 1986, and 1997, with multi-season consecutive drought events recorded in most years, such as 1980, 1986, 1987, 1991, 1997, 2001, 2005, and 2011, where the average SPEI indicated droughts lasting two to three consecutive seasons. In the YZRB, mild droughts dominated on an annual scale, with moderate droughts occurring only in 2006 and 2011. However, seasonal consecutive droughts were also observed, including winter–spring droughts in 1978 and 1985, spring–summer droughts in 2011, and autumn–winter droughts in 1998 and 2009.

3.2.2. Analysis of Drought Characteristics

Using SPEI-1, the spatiotemporal characteristics of drought events in the two basins were systematically analyzed based on run theory, considering the number of DECs and the DD, DI, and DS from 1961 to 2021. The results (Figure 10) indicated that 60 drought events occurred in the YRB (Figure 10a), with an average DD of 5.07 months, an average DS of −2.74, and an average DI of −0.47. September and January were the primary starting months for the drought events, with nine and seven occurrences, respectively. Nine drought events had a DD exceeding 10 months, with the longest lasting 25 consecutive months from January 1965 to January 1967, reaching a DS of −8.13 and a DI of −0.33. Other long-duration droughts occurred in 1980, 1986, 1999, 2001, 2005, 2008, 2010, and 2014. The most intense drought event occurred from May to October 1997, with a DI of −0.96, followed by an eight-month drought from September 1998 to April 1999, with a DI of −0.92. Spatially, the downstream region exhibited the highest total DEC and longest total DD, whereas the middle and southern regions of the YRB experienced higher DI and DS.
From 1961 to 2021, 63 drought events occurred in the YZRB (Figure 10b), with an average DD of 4.98 months, an average DS of −1.74, and an average DI of −0.39, indicating generally weaker drought conditions than the YRB. Seven drought events lasted more than 10 months, mainly occurring between 1966 and 2012, most of which were classified as mild droughts. However, two notable droughts with relatively strong severity and intensity lasted seven and eight consecutive months, beginning in September 1998 and February 2011, respectively, with DS values of −4.37 and −4.61 and DI values of −0.62 and −0.58. Spatially, the middle and lower reaches of the YZRB experienced the highest DECs and relatively higher DI.
This study statistically analyzed the spatial variations in drought frequency across different temporal scales for each grid point from 1961 to 2021 (Figure 11). At the monthly scale (SPEI-1), drought frequency increased from west to east in both basins, with higher frequencies observed in the middle and lower reaches than in the upper reaches. On a seasonal scale (SPEI-3), spring exhibited a relatively low drought frequency, whereas summer droughts were concentrated in the middle and upper reaches of the Yellow River and the middle and lower reaches of the Yangtze River. Autumn demonstrated the highest drought frequency, particularly in the middle and lower reaches of the YRB, whereas winter droughts were more prevalent in the upper and lower reaches of both the basins. At the annual scale (SPEI-12), the YRB exhibited a higher average drought frequency than the YZRB. Overall, the drought frequency from 1961 to 2021 followed the spatial differentiation pattern of midstream and downstream areas > upstream areas and autumn and winter > spring and summer.

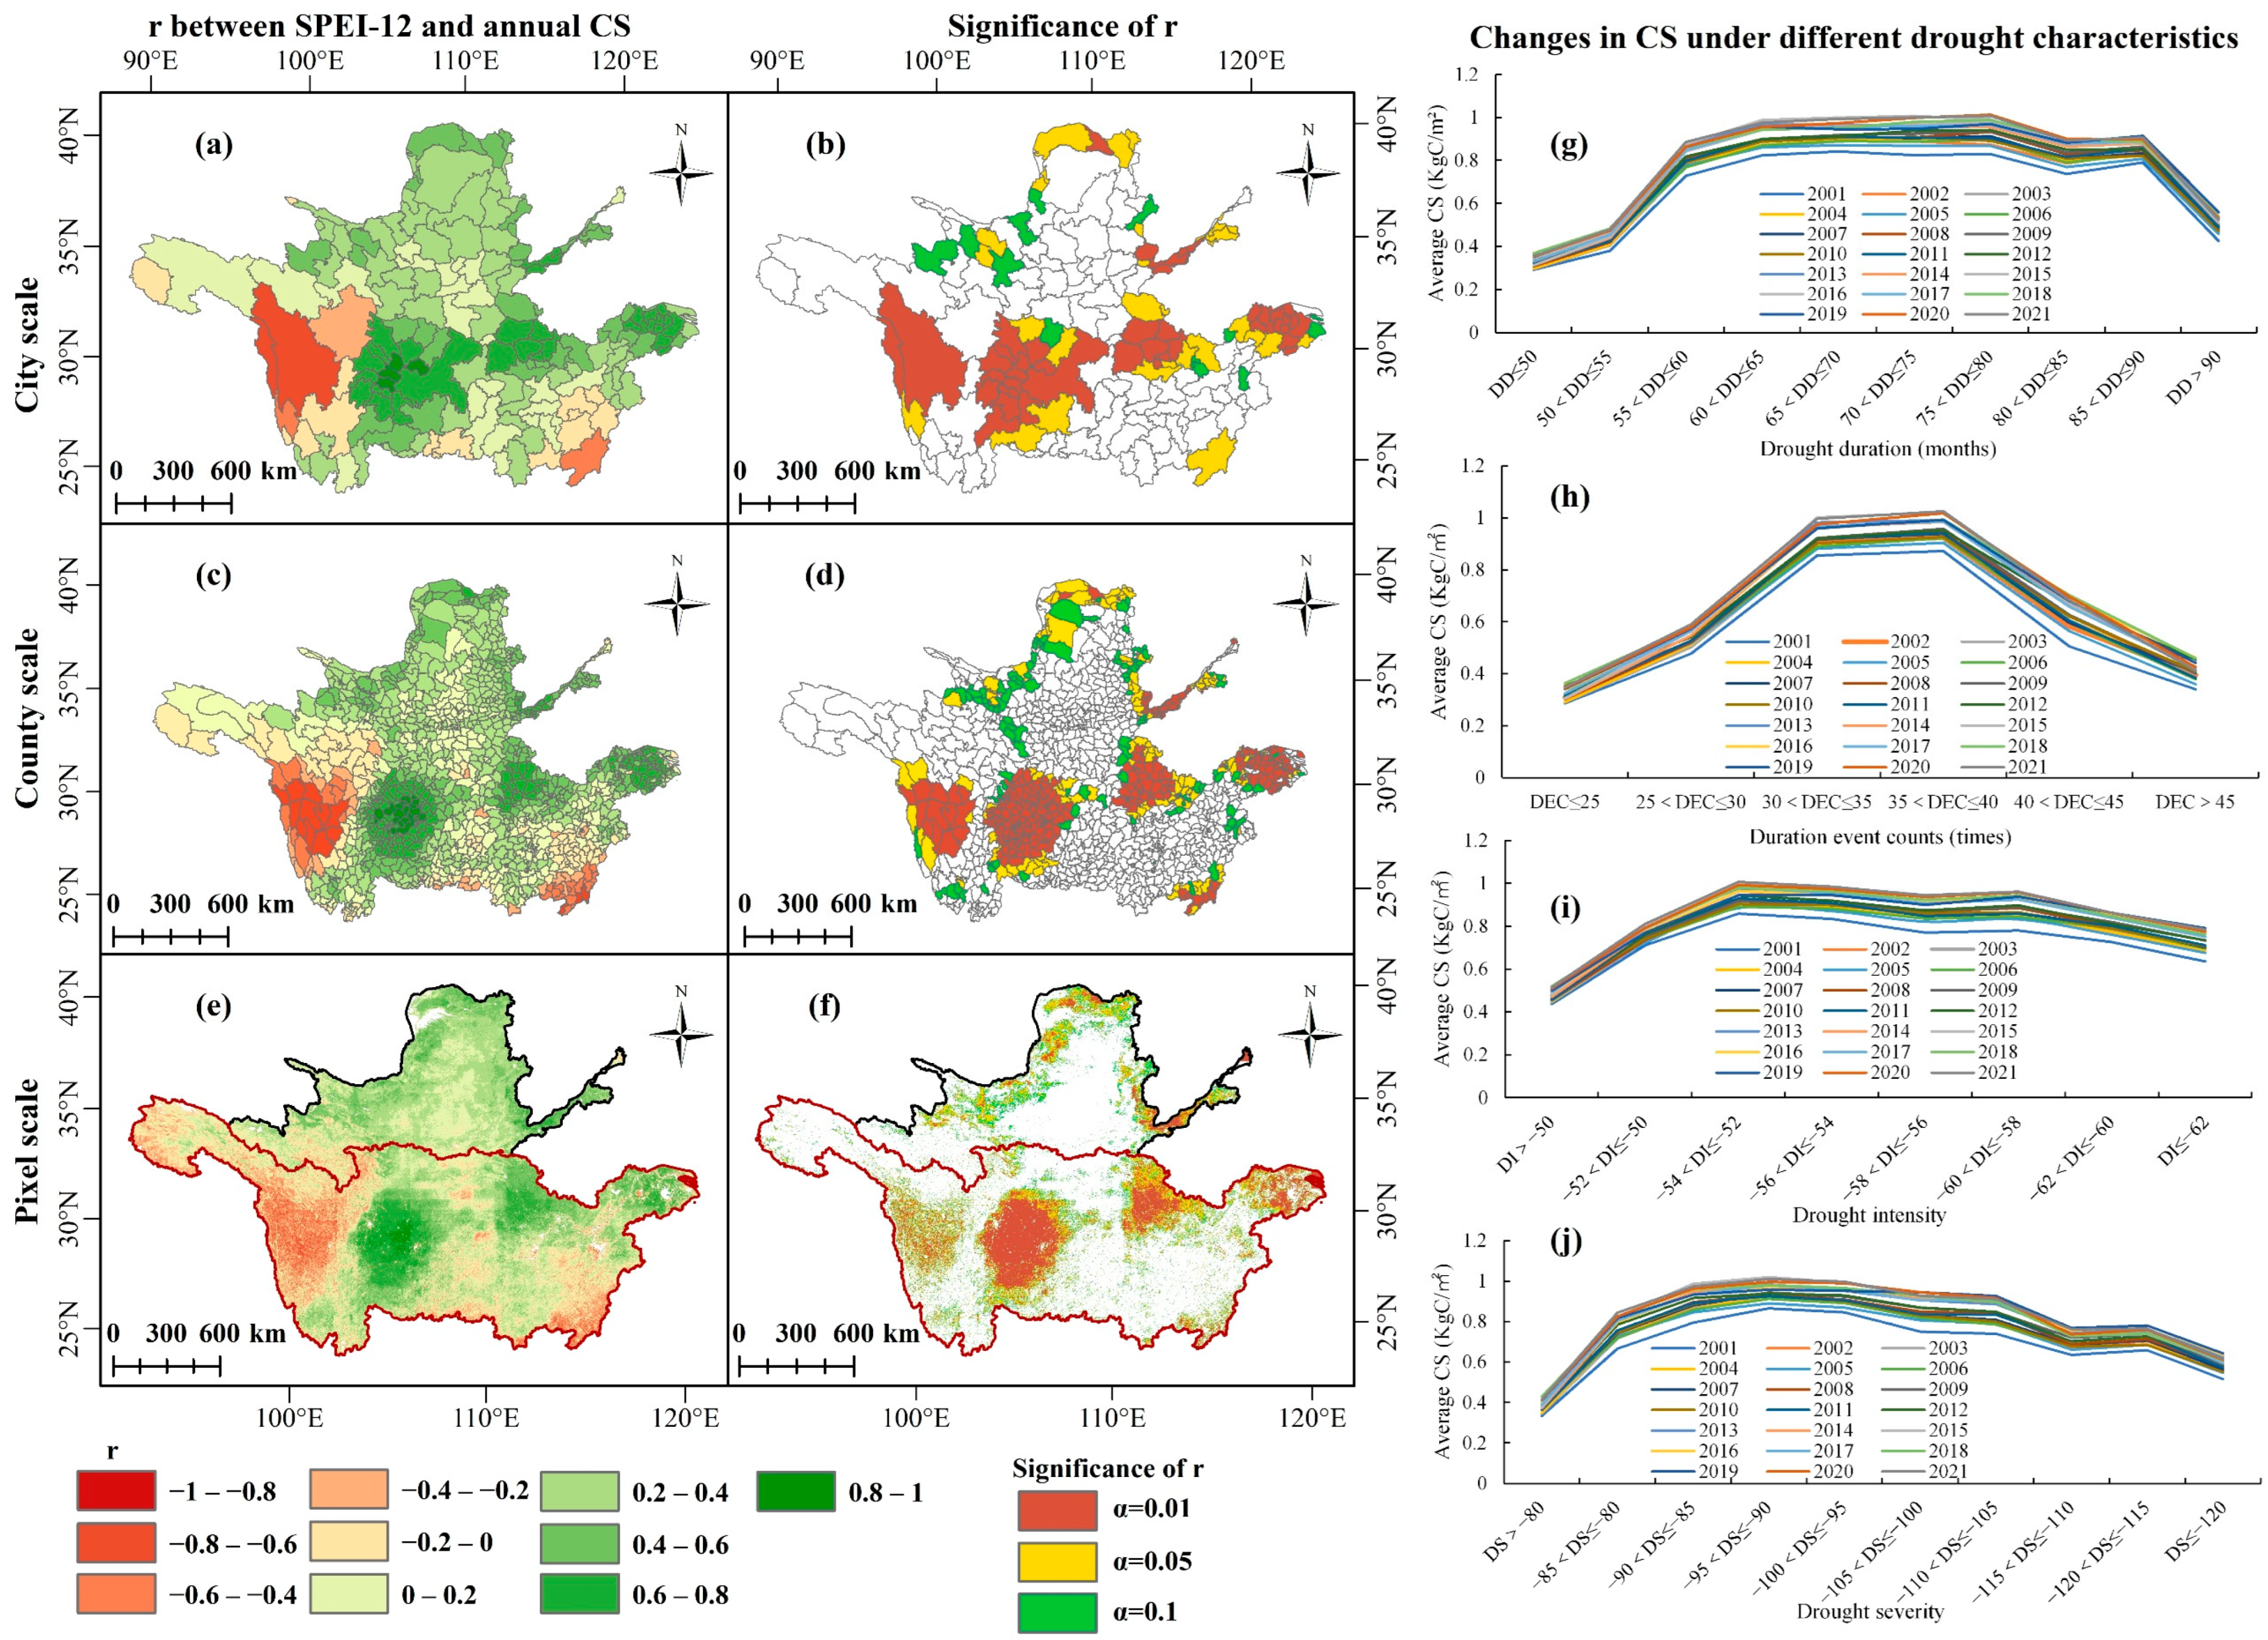
3.3. Impact of Drought on Ecosystem Carbon Sequestration at City–County–Pixel Scales

The CS in the two basins exhibited a fluctuating upward trend (Figure S2). A multiscale analysis of the impact of drought on CS at the city, county, and pixel levels revealed significant spatiotemporal heterogeneity and scale dependence (Figure 12a–f). In western regions, such as Changdu City in the Xizang Autonomous Region, Diqing Prefecture in Yunnan Province, and Ganzhou City in Jiangxi Province, a significant negative correlation was observed, suggesting that intensified drought paradoxically enhanced the CS function. In contrast, most other regions experienced a decline in CS capacity as the drought severity increased. The county-scale analysis further highlighted this contradiction, showing that while CS generally increased as the drought conditions eased, several western counties, including Gongjue, Baiyu, Xinlong, Daofu, Danba, Kangding, Yajiang, Litang, Batang, Xiangcheng, Daocheng, and Muli Tibetan Autonomous County, as well as southeastern counties such as Chongyi, Dayu, Xinfeng, Quannan, Anyuan, and Ruijin, exhibited an extremely significant negative correlation (α = 0.01). The pixel-scale analysis further revealed the complexity of micro-spatial patterns, with most pixels displaying a positive correlation, whereas the areas passing the significance test (α ≤ 0.1) were concentrated in the northern and eastern regions, such as the Hetao Irrigation District, where mild drought alleviation significantly enhanced CS. In contrast, the Hengduan Mountains in the west and hilly regions in the southeast predominantly showed negative correlations, with only a few passing the α = 0.01 significance test.
The effects of different drought characteristics on CS exhibited pronounced nonlinear patterns (Figure 12g–j). When the total drought duration was less than 80 months, CS gradually increased with increasing drought duration, suggesting that shorter droughts could promote plant growth and enhance ecosystem CS. However, when the drought duration exceeded 80 months, the response of CS weakened, indicating a “plateau effect”, where the ecosystem’s carbon sink function reached a tolerance threshold under water stress. The impact of drought frequency on CS followed an initial enhancement, followed by suppression, with drought events exceeding 40 (DEC > 40), increasingly constraining CS functions. Similarly, when the drought intensity (|DI| > 54) and severity (|DS| > 100) surpassed the critical thresholds, CS progressively declined as drought stress intensified. In summary, once drought characteristics exceeded specific thresholds, they began to suppress CS.

4. Discussion

4.1. Comparison of CRU Data Suitability

A comparison of CRU data with meteorological station data indicated that CRU precipitation data exhibited high reliability at both the seasonal and annual scales, effectively reflecting actual precipitation conditions. However, at the monthly scale, precision analysis revealed a slightly weaker performance in capturing higher precipitation values. Figure S3 shows that the r-value for CRU precipitation data ranged from 0.69 to 0.97, with 259 stations (76.6%) recording r ≥ 0.85, and nearly all stations displaying BIAS values within ±0.2. These findings are consistent with numerous studies that have confirmed a strong agreement between CRU precipitation data and meteorological station observations [55,56,57].
The CRU temperature data demonstrated high accuracy at the annual scale and during the spring, autumn, and winter seasons, with relative deviations remaining within 0.5 °C. However, on a monthly scale, a substantial discrepancy was observed in February when the CRU temperature data severely underestimated the actual values, with a relative deviation of nearly 14 °C. As shown in Figure S4, the CRU temperature data exhibited a strong correlation with the meteorological station data, and the r-values exceeded 0.95 for all 338 stations, effectively reflecting the actual temperature conditions. However, previous studies reported significant deviations between CRU temperature data and station-based measurements [58].
The correlation between the SPEI calculated from the CRU data and that derived from the meteorological station data was generally moderate, owing to several factors. (1) Differences in input data duration: The station-based SPEI was calculated using data from 2000 to 2020, whereas the CRU-based SPEI used data from 1961 to 2021. Previous studies have suggested that accurate parameter estimation requires at least 30 years of data, with longer periods yielding results closer to actual conditions [17,59]. (2) Differences in PET calculation methods: PET in CRU data was calculated using the Penman–Monteith formula, recognized by the Food and Agriculture Organization of the United Nations (FAO) as the standard method for PET estimation [60]. However, the station data included only precipitation and air temperature, preventing the application of the Penman–Monteith formula. The Thornthwaite method was applied, potentially leading to an underestimation of the SPEI based on the station data. Yang et al. [61] further demonstrated that with global warming, the PET changes played an increasing role in the global and continental dryland variations, while the Thornthwaite method has become less applicable in the context of climate change. Nevertheless, multiple studies have confirmed the strong applicability of SPEI calculated from CRU data [33,62], as it can more accurately reflect soil moisture variations on shorter timescales and can effectively monitor short-term drought events [63]. Therefore, SPEI remains a reliable validation data source [22,64].

4.2. Comparative Analysis of Drought Trends in the Past 61 Years

Sen’s slope and M-K [54] trend analysis were adopted to examine the SPEI-12 trend from 1961 to 2021 (Figure 13), revealing substantial spatial variations in drought trends between the YZRB and YRB. In the YRB, SPEI-12 exhibited a spatial distribution pattern that decreased from southwest to northeast, indicating a gradual increase in drought intensity, with a clear trend of intensifying droughts over the study period. In the YZRB, the northwestern region exhibited a significant decreasing trend in drought intensity, the central region exhibited a non-significant increasing trend, and the eastern region displayed a predominantly non-significant decreasing trend. However, certain areas in the southwest experienced significant increases in drought intensity.
Drought estimation methods, data sources, indices, and study objectives often lead to significant variations in results, making direct comparisons challenging. Although some studies have suggested that drought in China has eased in recent decades [65], this study indicated that certain areas within the two basins experienced intensifying drought trends. Specifically, in the YRB, the observed drought intensification aligns with existing research. Wang et al. [66] and Wang et al. [67] reported a significant increase in drought since 1961, with the most severe event occurring in 1997. The May–October 1997 episode (peak DI = −0.96) was selected for a spatiotemporal trajectory analysis because it represented the most intense basin-wide event during 1961–2021 (Figure 10a). The centroid trajectory revealed a distinct southeast–northwest–northeast pattern (Figure 14), which aligned with Huang et al. [68], who observed an east–west reverse distribution trend with increased humidity in the upper reaches and greater aridity in the middle and lower reaches. In contrast, studies of drought trends in the YZRB have yielded mixed results. Figure S5 indicates that from February to September 2011, the drought movement trajectory in the YZRB was mainly concentrated in the middle and lower reaches, with the centroid shifting along the east–west axis. Wei et al. [69] identified a non-significant trend of increasing humidity in the YZRB from 1980 to 2019, differing from this study’s findings, likely due to differences in data sources, SPEI calculation methods, study periods, and regional variations. However, most studies agree with these findings. For instance, Jin et al. [70] reported that from 1951 to 2015, the seasonal drought-affected areas in the YZRB expanded with an overall increase in extreme droughts. Furthermore, Liu et al. [71] suggested that the extent of drought impacts has grown in recent decades, particularly between 2001 and 2010, when the multi-year drought frequency was 1.5 times the multi-year average from 1951 to 2018.

4.3. Nonlinear Impact of Drought on Ecosystem Carbon Sequestration

In this study, the selection of drought thresholds (SPEI-1 < 0 and SPEI-1 < −0.5) was guided by both methodological reasoning and ecological relevance. The threshold of SPEI-1 < 0 enables the identification of persistent drought events using run theory [46,47], effectively excluding transient anomalies (e.g., one-month droughts). Meanwhile, SPEI-1 < −0.5 aligns with China’s national standard GB/T 20481–2017 for mild drought, capturing the onset of water stress which is critical to the vegetation response [27]. Under mild drought conditions (|DI| < 54), CS tended to increase (Figure 12), indicating an adaptive response. In contrast, stricter thresholds (e.g., SPEI < −1.0) corresponding to |DI| > 54 would overlook this adaptive phase and instead capture regions where CS declines. Thus, the chosen thresholds were deliberately designed to better capture carbon dynamics across varying drought intensities. Future research could benefit from comparing multiple threshold schemes to further assess more severe drought impacts.
The multiscale analysis further revealed that in certain regions of the two basins, such as the Garzê Tibetan Autonomous Prefecture in Sichuan Province, Changdu City in the Xizang Autonomous Region, and the Diqing Tibetan Autonomous Prefecture in Yunnan Province, the CS capacity exhibited a significant negative correlation with SPEI-12, indicating that intensified drought paradoxically enhanced the CS function. This finding challenges the traditional linear assumption that “drought suppresses CS”. This phenomenon aligns with documented adaptations in natural ecosystems, whereas agricultural systems demonstrate distinct responses, as evidenced by yield decline under drought stress [8,72].
However, recent studies have suggested several potential mechanisms underlying this phenomenon. (1) The optimization of water-use efficiency under drought stress. Vegetation can enhance water-use efficiency through stomatal regulation and root hydraulic redistribution. Wu et al. [73] found that the hydraulic lift during drought increased the total primary productivity across various climate zones in China. (2) Vegetation shifts toward drought-resistant species. Zhao et al. [74] reported that drought could drive the vegetation succession towards drought-tolerant species (e.g., C4 plants and deep-rooted shrubs) with higher water-use efficiency, significantly enhancing the CS capacity. In contrast, agricultural systems lack the capacity for spontaneous species succession [75,76]. (3) Seasonal and temporal dynamics of drought effects. Anderson-Teixeira et al. [77] noted that severe drought during the growing season did not significantly affect the annual ecosystem CS. Although these studies can help explain the “drought-enhanced sequestration” phenomenon in certain regions, the long-term sustainability of this effect remains uncertain. Prolonged drought may eventually cause the physiological collapse of vegetation or irreversible community shifts. For agricultural ecosystems, such collapses manifest as crop failure and soil carbon depletion, particularly in rainfed areas with limited irrigation [78]. Therefore, future research should integrate multiscale observations and modeling approaches to optimize carbon management strategies in drought-affected regions.

4.4. Limitations

Although this study provides valuable insights into the spatiotemporal patterns of drought dynamics in these two basins, several limitations should be acknowledged. The CRU TS4.06 dataset with a spatial resolution of 0.5° × 0.5° may not fully capture small-scale climate variations in complex terrain regions such as the mountainous upstream areas of the basins. Additionally, although the CRU dataset can calculate PET using the Penman–Monteith formula, its accuracy is constrained by the absence of site-level humidity, wind speed, and solar radiation data for validation. These variables may not be fully captured by interpolated gridded data, particularly for mountainous regions. The absence of local validation for radiation and wind components can introduce bias in PET estimates, subsequently affecting SPEI accuracy and drought classification. Future studies are encouraged to integrate higher-resolution or station-calibrated PET datasets where available. Moreover, this study focused solely on meteorological drought (SPEI) without assessing hydrological, agricultural, or ecological droughts, each of which is crucial for effective water resource management and ecosystem resilience. Future research should incorporate higher-resolution datasets (e.g., ERA5-Land and CMIP6 projections) and multidimensional indicators, such as soil moisture, groundwater levels, and vegetation health. Incorporating impact-based early warning systems would also enable a more comprehensive evaluation of drought impacts across agricultural, ecological, and socioeconomic sectors.
The observed negative correlation between ecosystem CS and SPEI-12 may also be influenced by other environmental factors including temperature, CO2 concentration, and human activities. This study did not fully disentangle this, potentially complicating the interpretation of results. Additionally, in the correlation coefficient between SPEI-12 and CS (Figure 12), although many pixel-level correlations were statistically significant, spatial autocorrelation was not explicitly addressed. This may lead to the overestimation of significance due to the similarity between neighboring pixels. Future studies could apply spatial regression, permutation testing, or other spatial adjustment methods to improve accuracy. In this study, a uniform conversion factor of 1.63 was applied to estimate CS from NPP across all land cover types. Although this approach simplifies calculations, it overlooks the variability in carbon allocation among different ecosystems (e.g., forest, cropland, and grassland), which may introduce uncertainty in spatial CS estimations, particularly in agricultural areas, where net carbon balances are highly sensitive to management practices. Additionally, our study did not differentiate CS responses between natural and agricultural ecosystems. Future studies should incorporate land-cover-specific parameters or process-based models to refine CS estimations.

5. Conclusions

Using precipitation and temperature data from meteorological stations (2000–2020), this study assessed the applicability of CRU precipitation and temperature data in the YZRB and YRB using multiple evaluation indicators. The CRU SPEI at the 1-, 3-, 6-, and 12-month scales was then calculated for 1961–2021, and drought events and their characteristics were identified using the run theory method. Finally, the impact of droughts and their characteristics on ecosystem CS were analyzed. The main conclusions are as follows:
(1) By evaluating CRU data against meteorological station records across two topographically complex basins, this study confirmed its strong applicability for characterizing precipitation (annual r = 0.94, BIAS = 0.01) and temperature (annual r = 0.95, BIAS = 0.40 °C) in the two basins, despite significant winter temperature underestimation (BIAS = −2.42 °C). The monthly scale SPEI-1 exhibited optimal accuracy, providing a reliable foundation for drought monitoring.
(2) Analysis of spatiotemporal drought evolution (1961–2021) revealed frequent autumn–winter droughts in both basins, with the YRB experiencing more severe and prolonged events (e.g., a 25-month period from January 1965 to January 1967). Droughts increased in frequency and intensity, particularly in midstream/downstream regions and during autumn–winter periods, consistent with intensified regional warming trends.
(3) CS exhibited spatially divergent responses to drought. In the western regions (e.g., Garzê and Changdu), intensified drought enhanced CS, whereas CS was suppressed in the eastern plains. This pattern was governed by a nonlinear threshold mechanism. Under mild drought stress (DD < 80 months, |DI| < 54), CS increased because of adaptive vegetation responses (e.g., improved water-use efficiency); however, beyond critical thresholds, CS declined across all regions.
Future research should prioritize the following directions: (1) the use of high-resolution datasets (e.g., ERA5-Land) to address topographic limitations in drought monitoring; (2) the integration of multidimensional indicators (e.g., soil moisture and vegetation health) to assess hydrological and agricultural drought impacts; (3) the separation of CO2 and land-use effects on drought–CS relationships using process-based modeling; and 4) the establishment of ecosystem-specific CS parameters to capture differential carbon allocation patterns (e.g., in forests and croplands), replacing the use of a uniform NPP conversion factor.

Supplementary Materials

The following supporting information can be downloaded at: https://www.mdpi.com/article/10.3390/agriculture15141552/s1, Figure S1: Comparison of spatial distribution of multi-year average precipitation (mm) and temperature (°C) in the Yangtze River Basin and Yellow River Basin based on CRU TS4.06 data and meteorological station observations; Figure S2: Interannual variation in ecosystem carbon sequestration (CS) from 2001 to 2021 in the Yangtze River Basin (a) and Yellow River Basin (b); Figure S3: Accuracy assessment of CRU precipitation data at individual meteorological stations (n = 338) from 2000 to 2020; Figure S4: Accuracy assessment of CRU temperature data at individual meteorological stations (n = 338) from 2000 to 2020; Figure S5: Spatial distribution of wet, dry, and drought migration paths in the Yangtze River Basin from February to September 2011.

Author Contributions

Conceptualization, Y.Y. and J.W.; methodology, Y.Y.; software, Y.Y.; validation, Y.Y.; formal analysis, Y.Y.; investigation, Y.Y.; resources, Y.Y.; data curation, Y.Y.; writing—original draft preparation, Y.Y.; writing—review and editing, H.D., S.G. and J.W.; visualization, J.W. and S.G.; supervision, J.W.; project administration, Y.Y.; funding acquisition, Y.Y. All authors have read and agreed to the published version of the manuscript.

Funding

This research was supported by the Project of Doctoral Scientific Research Initiation Foundation of Southwest Forestry University (grant number 01102-110225002) and the Top Disciplines in Soil and Water Conservation and Desertification Control in Yunnan Province, grant number SBK20240003.

Institutional Review Board Statement

Not applicable.

Data Availability Statement

The data presented in this study are contained within the article.

Acknowledgments

We are very grateful for the support of the funds and projects. We are also very grateful to the anonymous reviewers and editors for their thoughtful review comments and suggestions which have significantly improved this article.

Conflicts of Interest

The authors declare no conflicts of interest.

Abbreviations

The following abbreviations are used in this manuscript:
YZRBYangtze River Basin
YRBYellow River Basin
CRU TSClimatic Research Unit Gridded Time Series
SPEIstandardized precipitation evapotranspiration index
CScarbon sequestration
SPIstandardized precipitation index
PDSIPalmer drought severity index
PETpotential evapotranspiration
NPPnet primary productivity
rPearson’s correlation coefficient
BIASbias
RMSEroot mean square error
MAEmean absolute error
DECdrought event count
YMDIyear and month of drought initiation
YMDTyear and month of drought termination
DDdrought duration
DSdrought severity
DIdrought intensity

References

  1. Mishra, A.K.; Singh, V.P. A Review of Drought Concepts. J. Hydrol. 2010, 391, 202–216. [Google Scholar] [CrossRef]
  2. IPCC. Climate Change 2023: Synthesis Report, 1st ed.; Intergovernmental Panel on Climate Change (IPCC): Geneva, Switzerland, 2023. [Google Scholar]
  3. Miao, L.; Ju, L.; Sun, S.; Agathokleous, E.; Wang, Q.; Zhu, Z.; Liu, R.; Zou, Y.; Lu, Y.; Liu, Q. Unveiling the Dynamics of Sequential Extreme Precipitation-Heatwave Compounds in China. npj Clim. Atmos. Sci. 2024, 7, 67. [Google Scholar] [CrossRef]
  4. Reichstein, M.; Bahn, M.; Ciais, P.; Frank, D.; Mahecha, M.D.; Seneviratne, S.I.; Zscheischler, J.; Beer, C.; Buchmann, N.; Frank, D.C.; et al. Climate Extremes and the Carbon Cycle. Nature 2013, 500, 287–295. [Google Scholar] [CrossRef] [PubMed]
  5. de Matos Brandão Raposo, V.; Costa, V.A.F.; Rodrigues, A.F. A Review of Recent Developments on Drought Characterization, Propagation, and Influential Factors. Sci. Total Environ. 2023, 898, 165550. [Google Scholar] [CrossRef] [PubMed]
  6. Huang, L.; Zhou, P.; Cheng, L.; Liu, Z. Dynamic Drought Recovery Patterns over the Yangtze River Basin. CATENA 2021, 201, 105194. [Google Scholar] [CrossRef]
  7. Song, M.; Jiang, X.; Lei, Y.; Zhao, Y.; Cai, W. Spatial and Temporal Variation Characteristics of Extreme Hydrometeorological Events in the Yellow River Basin and Their Effects on Vegetation. Nat. Hazards 2023, 116, 1863–1878. [Google Scholar] [CrossRef]
  8. Zhou, S.; Wu, S.; Gao, J.; Liu, L.; Li, D.; Yan, R.; Wang, J. Increased Stress from Compound Drought and Heat Events on Vegetation. Sci. Total Environ. 2024, 949, 175113. [Google Scholar] [CrossRef] [PubMed]
  9. Frank, D.C.; Poulter, B.; Saurer, M.; Esper, J.; Huntingford, C.; Helle, G.; Treydte, K.; Zimmermann, N.E.; Schleser, G.H.; Ahlström, A.; et al. Water-Use Efficiency and Transpiration across European Forests during the Anthropocene. Nat. Clim. Chang. 2015, 5, 579–583. [Google Scholar] [CrossRef]
  10. Schwalm, C.R.; Anderegg, W.R.L.; Michalak, A.M.; Fisher, J.B.; Biondi, F.; Koch, G.; Litvak, M.; Ogle, K.; Shaw, J.D.; Wolf, A.; et al. Global Patterns of Drought Recovery. Nature 2017, 548, 202–205. [Google Scholar] [CrossRef] [PubMed]
  11. Berdugo, M.; Delgado-Baquerizo, M.; Soliveres, S.; Hernández-Clemente, R.; Zhao, Y.; Gaitán, J.J.; Gross, N.; Saiz, H.; Maire, V.; Lehmann, A.; et al. Global Ecosystem Thresholds Driven by Aridity. Science 2020, 367, 787–790. [Google Scholar] [CrossRef] [PubMed]
  12. Vicente-Serrano, S.M.; Pricope, N.G.; Toreti, A.; Morán-Tejeda, E.; Spinoni, J.; Ocampo-Melgar, A.; Archer, E.; Diedhiou, A.; Mesbahzadeh, T.; Ravindranath, N.H.; et al. The United Nations Convention to Combat Desertification Report on Rising Aridity Trends Globally and Associated Biological and Agricultural Implications. Glob. Change Biol. 2024, 30, e70009. [Google Scholar] [CrossRef] [PubMed]
  13. Hao, Z.; Singh, V.P. Drought Characterization from a Multivariate Perspective: A Review. J. Hydrol. 2015, 527, 668–678. [Google Scholar] [CrossRef]
  14. Alahacoon, N.; Edirisinghe, M. A Comprehensive Assessment of Remote Sensing and Traditional Based Drought Monitoring Indices at Global and Regional Scale. Geomat. Nat. Hazards Risk 2022, 13, 762–799. [Google Scholar] [CrossRef]
  15. Mukherjee, S.; Mishra, A.; Trenberth, K.E. Climate Change and Drought: A Perspective on Drought Indices. Curr. Clim. Chang. Rep. 2018, 4, 145–163. [Google Scholar] [CrossRef]
  16. Palmer, W.C. Meteorological Drought; Weather Bureau; US Department of Commerce: Washington, DC, USA, 1965. [Google Scholar]
  17. Mckee, T.B.; Doesken, N.J.; Kleist, J. The Relationship of Drought Frequency and Duration to Time Scales; American Meteorological Society: Anaheim, CA, USA, 1993; pp. 17–22. [Google Scholar]
  18. Vicente-Serrano, S.M.; Beguería, S.; López-Moreno, J.I. A Multiscalar Drought Index Sensitive to Global Warming: The Standardized Precipitation Evapotranspiration Index. J. Clim. 2010, 23, 1696–1718. [Google Scholar] [CrossRef]
  19. Liu, Y.; Zhu, Y.; Ren, L.; Singh, V.P.; Yang, X.; Yuan, F. A Multiscalar Palmer Drought Severity Index. Geophys. Res. Lett. 2017, 44, 6850–6858. [Google Scholar] [CrossRef]
  20. Zhao, H.; Gao, G.; An, W.; Zou, X.; Li, H.; Hou, M. Timescale Differences between SC-PDSI and SPEI for Drought Monitoring in China. Phys. Chem. Earth Parts A/B/C 2017, 102, 48–58. [Google Scholar] [CrossRef]
  21. Milly, P.C.D.; Dunne, K.A. Potential Evapotranspiration and Continental Drying. Nature Clim. Chang. 2016, 6, 946–949. [Google Scholar] [CrossRef]
  22. Pyarali, K.; Peng, J.; Disse, M.; Tuo, Y. Development and Application of High Resolution SPEI Drought Dataset for Central Asia. Sci. Data 2022, 9, 172. [Google Scholar] [CrossRef] [PubMed]
  23. Monish, N.T.; Rehana, S. Suitability of Distributions for Standard Precipitation and Evapotranspiration Index over Meteorologically Homogeneous Zones of India. J. Earth Syst. Sci. 2019, 129, 25. [Google Scholar] [CrossRef]
  24. Frank, A.; Armenski, T.; Gocic, M.; Popov, S.; Popovic, L.; Trajkovic, S. Influence of Mathematical and Physical Background of Drought Indices on Their Complementarity and Drought Recognition Ability. Atmos. Res. 2017, 194, 268–280. [Google Scholar] [CrossRef]
  25. de Medeiros, F.J.; Gomes, R.D.S.; Coutinho, M.D.L.; Lima, K.C. Meteorological Droughts and Water Resources: Historical and Future Perspectives for Rio Grande Do Norte State, Northeast Brazil. Int. J. Climatol. 2022, 42, 6976–6995. [Google Scholar] [CrossRef]
  26. Li, L.; She, D.; Zheng, H.; Lin, P.; Yang, Z.-L. Elucidating Diverse Drought Characteristics from Two Meteorological Drought Indices (SPI and SPEI) in China. J. Hydrometeorol. 2020, 21, 1513–1530. [Google Scholar] [CrossRef]
  27. Vicente-Serrano, S.M.; Gouveia, C.; Camarero, J.J.; Beguería, S.; Trigo, R.; López-Moreno, J.I.; Azorín-Molina, C.; Pasho, E.; Lorenzo-Lacruz, J.; Revuelto, J.; et al. Response of Vegetation to Drought Time-Scales across Global Land Biomes. Proc. Natl. Acad. Sci. USA 2013, 110, 52–57. [Google Scholar] [CrossRef] [PubMed]
  28. Khan, M.I.; Liu, D.; Fu, Q.; Saddique, Q.; Faiz, M.A.; Li, T.; Qamar, M.U.; Cui, S.; Cheng, C. Projected Changes of Future Extreme Drought Events under Numerous Drought Indices in the Heilongjiang Province of China. Water Resour. Manag. 2017, 31, 3921–3937. [Google Scholar] [CrossRef]
  29. Li, Y.; Lu, H.; Entekhabi, D.; Gianotti, D.J.S.; Yang, K.; Luo, C.; Feldman, A.F.; Wang, W.; Jiang, R. Satellite-Based Assessment of Meteorological and Agricultural Drought in Mainland Southeast Asia. IEEE J. Sel. Top. Appl. Earth Obs. Remote Sens. 2022, 15, 6180–6189. [Google Scholar] [CrossRef]
  30. Keikhosravi-Kiany, M.S.; Masoodian, S.A.; Balling, R.C., Jr.; Darand, M. Evaluation of Tropical Rainfall Measuring Mission, Integrated Multi-Satellite Retrievals for GPM, Climate Hazards Centre InfraRed Precipitation with Station Data, and European Centre for Medium-Range Weather Forecasts Reanalysis v5 Data in Estimating Precipitation and Capturing Meteorological Droughts over Iran. Int. J. Climatol. 2022, 42, 2039–2064. [Google Scholar] [CrossRef]
  31. Yu, Y.; Wang, J.; Cheng, F.; Deng, H.; Chen, S. Drought Monitoring in Yunnan Province Based on a TRMM Precipitation Product. Nat. Hazards 2020, 104, 2369–2387. [Google Scholar] [CrossRef]
  32. Mitchell, T.D.; Jones, P.D. An Improved Method of Constructing a Database of Monthly Climate Observations and Associated High-Resolution Grids. Int. J. Climatol. 2005, 25, 693–712. [Google Scholar] [CrossRef]
  33. Guo, H.; Bao, A.; Liu, T.; Jiapaer, G.; Ndayisaba, F.; Jiang, L.; Kurban, A.; De Maeyer, P. Spatial and Temporal Characteristics of Droughts in Central Asia during 1966–2015. Sci. Total Environ. 2018, 624, 1523–1538. [Google Scholar] [CrossRef] [PubMed]
  34. Chen, H.; Sun, J. Changes in Drought Characteristics over China Using the Standardized Precipitation Evapotranspiration Index. J. Clim. 2015, 28, 5430–5447. [Google Scholar] [CrossRef]
  35. Berihun, M.L.; Tsunekawa, A.; Haregeweyn, N.; Tsubo, M.; Yasuda, H.; Fenta, A.A.; Dile, Y.T.; Bayabil, H.K.; Tilahun, S.A. Examining the Past 120 Years’ Climate Dynamics of Ethiopia. Theor. Appl. Climatol. 2023, 154, 535–566. [Google Scholar] [CrossRef]
  36. Shi, X.; Ding, H.; Wu, M.; Zhang, N.; Shi, M.; Chen, F.; Li, Y. Effects of Different Types of Drought on Vegetation in Huang-Huai-Hai River Basin, China. Ecol. Indic. 2022, 144, 109428. [Google Scholar] [CrossRef]
  37. Mathbout, S.; Martin-Vide, J.; Bustins, J.A.L. Drought Characteristics Projections Based on CMIP6 Climate Change Scenarios in Syria. J. Hydrol. Reg. Stud. 2023, 50, 101581. [Google Scholar] [CrossRef]
  38. Zhao, H.; Ma, Y. Evaluating the Drought-Monitoring Utility of Four Satellite-Based Quantitative Precipitation Estimation Products at Global Scale. Remote Sens. 2019, 11, 2010. [Google Scholar] [CrossRef]
  39. Ma, F.; Yuan, X. When Will the Unprecedented 2022 Summer Heat Waves in Yangtze River Basin Become Normal in a Warming Climate? Geophys. Res. Lett. 2023, 50, e2022GL101946. [Google Scholar] [CrossRef]
  40. Deng, H.; Yin, Y.; Zong, X.; Yin, M. Future Drought Risks in the Yellow River Basin and Suggestions for Targeted Response. Int. J. Disaster Risk Reduct. 2023, 93, 103764. [Google Scholar] [CrossRef]
  41. Zhang, Q.; Gong, J.; Wang, Y. How Resilience Capacity and Multiple Shocks Affect Rural Households’ Subjective Well-Being: A Comparative Study of the Yangtze and Yellow River Basins in China. Land Use Policy 2024, 142, 107192. [Google Scholar] [CrossRef]
  42. Qian, T.; Su, X.; Wu, H.; Singh, V.P.; Zhang, T. An Agricultural Drought Early Warning Threshold Model with Considering Copula Combined with Diminishing Marginal Benefit Theory: A Case Study in the Yellow River Basin. Agric. Water Manag. 2025, 316, 109582. [Google Scholar] [CrossRef]
  43. Liu, Y.; Yuan, S.; Zhu, Y.; Ren, L.; Chen, R.; Zhu, X.; Xia, R. The Patterns, Magnitude, and Drivers of Unprecedented 2022 Mega-Drought in the Yangtze River Basin, China. Environ. Res. Lett. 2023, 18, 114006. [Google Scholar] [CrossRef]
  44. Wei, L.; Jiang, S.; Ren, L.; Hua, Z.; Zhang, L.; Duan, Z. Detection of the 2022 Extreme Drought over the Yangtze River Basin Using Two Satellite-Gauge Precipitation Products. Atmos. Res. 2025, 315, 107929. [Google Scholar] [CrossRef]
  45. GB/T 20481-2017; Grades of Meteorological Drought. National Standardization Administration: Beijing, China, 2017.
  46. Yevjevich, V.M. An Objective Approach to Definitions and Investigations of Continental Hydrologic Droughts; Colorado State University: Fort Collins, CO, USA, 1967; Volume 7. [Google Scholar]
  47. Shiau, J.T. Fitting Drought Duration and Severity with Two-Dimensional Copulas. Water Resour. Manag. 2006, 20, 795–815. [Google Scholar] [CrossRef]
  48. Wu, J.; Chen, X.; Yao, H.; Zhang, D. Multi-Timescale Assessment of Propagation Thresholds from Meteorological to Hydrological Drought. Sci. Total Environ. 2021, 765, 144232. [Google Scholar] [CrossRef] [PubMed]
  49. Yin, C.; Zhao, W.; Ye, J.; Muroki, M.; Pereira, P. Ecosystem Carbon Sequestration Service Supports the Sustainable Development Goals Progress. J. Environ. Manag. 2023, 330, 117155. [Google Scholar] [CrossRef] [PubMed]
  50. Hua, T.; Zhao, W.; Cherubini, F.; Hu, X.; Pereira, P. Sensitivity and Future Exposure of Ecosystem Services to Climate Change on the Tibetan Plateau of China. Landsc. Ecol. 2021, 36, 3451–3471. [Google Scholar] [CrossRef] [PubMed]
  51. Theil, H. A Rank-Invariant Method of Linear and Polynomial Regression Analysis. In Henri Theil’s Contributions to Economics and Econometrics: Econometric Theory and Methodology; Raj, B., Koerts, J., Eds.; Advanced Studies in Theoretical and Applied Econometrics; Springer: Dordrecht, The Netherlands, 1992; pp. 345–381. ISBN 978-94-011-2546-8. [Google Scholar]
  52. Mann, H.B. Nonparametric Tests against Trend. Econometrica 1945, 13, 245–259. [Google Scholar] [CrossRef]
  53. Kendall, M.G. Rank Correlation Methods; Griffin: Oxford, UK, 1948. [Google Scholar]
  54. Yu, Y.; Xiao, Z.; Bruzzone, L.; Deng, H. Mapping and Analyzing the Spatiotemporal Patterns and Drivers of Multiple Ecosystem Services: A Case Study in the Yangtze and Yellow River Basins. Remote Sens. 2024, 16, 411. [Google Scholar] [CrossRef]
  55. Mutti, P.R.; Dubreuil, V.; Bezerra, B.G.; Arvor, D.; de Oliveira, C.P.; Santos e Silva, C.M. Assessment of Gridded CRU TS Data for Long-Term Climatic Water Balance Monitoring over the São Francisco Watershed, Brazil. Atmosphere 2020, 11, 1207. [Google Scholar] [CrossRef]
  56. Gulakhmadov, A.; Chen, X.; Gulakhmadov, M.; Kobuliev, Z.; Gulahmadov, N.; Peng, J.; Li, Z.; Liu, T. Evaluation of the CRU TS3.1, APHRODITE_V1101, and CFSR Datasets in Assessing Water Balance Components in the Upper Vakhsh River Basin in Central Asia. Atmosphere 2021, 12, 1334. [Google Scholar] [CrossRef]
  57. Ogunrinde, A.T.; Adigun, P.; Xue, X.; Koji, D.; Jing, Q. Spatiotemporal Analysis of Drought Patterns and Trends across Africa: A Multi-Scale SPEI Approach (1960–2018). Int. J. Digit. Earth 2025, 18, 2447342. [Google Scholar] [CrossRef]
  58. Rao, Y.; Liang, S.; Yu, Y. Land Surface Air Temperature Data Are Considerably Different among BEST-LAND, CRU-TEM4v, NASA-GISS, and NOAA-NCEI. J. Geophys. Res. Atmos. 2018, 123, 5881–5900. [Google Scholar] [CrossRef]
  59. Son, B.; Park, S.; Im, J.; Park, S.; Ke, Y.; Quackenbush, L.J. A New Drought Monitoring Approach: Vector Projection Analysis (VPA). Remote Sens. Environ. 2021, 252, 112145. [Google Scholar] [CrossRef]
  60. Ullah, S.; You, Q.; Sachindra, D.A.; Nowosad, M.; Ullah, W.; Bhatti, A.S.; Jin, Z.; Ali, A. Spatiotemporal Changes in Global Aridity in Terms of Multiple Aridity Indices: An Assessment Based on the CRU Data. Atmos. Res. 2022, 268, 105998. [Google Scholar] [CrossRef]
  61. Yang, Q.; Ma, Z.; Zheng, Z.; Duan, Y. Sensitivity of Potential Evapotranspiration Estimation to the Thornthwaite and Penman–Monteith Methods in the Study of Global Drylands. Adv. Atmos. Sci. 2017, 34, 1381–1394. [Google Scholar] [CrossRef]
  62. Morsy, M.; Moursy, F.I.; Sayad, T.; Shaban, S. Climatological Study of SPEI Drought Index Using Observed and CRU Gridded Dataset over Ethiopia. Pure Appl. Geophys. 2022, 179, 3055–3073. [Google Scholar] [CrossRef]
  63. Shen, G.; Zheng, H.; Lei, Z. Applicability analysis of SPEI for drought research in Northeast China. Acta Ecol. Sin. 2017, 37, 3787–3795. [Google Scholar] [CrossRef]
  64. Vicente-Serrano, S.M.; Domínguez-Castro, F.; Reig, F.; Tomas-Burguera, M.; Peña-Angulo, D.; Latorre, B.; Beguería, S.; Rabanaque, I.; Noguera, I.; Lorenzo-Lacruz, J.; et al. A Global Drought Monitoring System and Dataset Based on ERA5 Reanalysis: A Focus on Crop-Growing Regions. Geosci. Data J. 2023, 10, 505–518. [Google Scholar] [CrossRef]
  65. Yao, N.; Li, Y.; Lei, T.; Peng, L. Drought Evolution, Severity and Trends in Mainland China over 1961–2013. Sci. Total Environ. 2018, 616–617, 73–89. [Google Scholar] [CrossRef] [PubMed]
  66. Wang, W.; Zhu, Y.; Xu, R.; Liu, J. Drought Severity Change in China during 1961–2012 Indicated by SPI and SPEI. Nat. Hazards 2015, 75, 2437–2451. [Google Scholar] [CrossRef]
  67. Wang, F.; Wang, Z.; Yang, H.; Di, D.; Zhao, Y.; Liang, Q.; Hussain, Z. Comprehensive Evaluation of Hydrological Drought and Its Relationships with Meteorological Drought in the Yellow River Basin, China. J. Hydrol. 2020, 584, 124751. [Google Scholar] [CrossRef]
  68. Huang, C. Drought Driving and Assessment Prediction in the Yellow River Basin. Ph.D. Thesis, Xi’an University of Technology, Xi’an, China, 2022. [Google Scholar]
  69. Wei, J.; Wang, Z.; Han, L.; Shang, J.; Zhao, B. Analysis of Spatio-Temporal Evolution Characteristics of Drought and Its Driving Factors in Yangtze River Basin Based on SPEI. Atmosphere 2022, 13, 1986. [Google Scholar] [CrossRef]
  70. Jin, J.; Xiao, Y.; Jin, J.; Zhu, Q.; Yong, B.; Ji, Y. Spatial-temporal variabilities of the contrasting hydrometeorological extremes and the impacts on vegetation growth over the Yangtze River basin. Adv. Water Sci. 2021, 32, 867–876. [Google Scholar] [CrossRef]
  71. Liu, J.; Yuan, Z.; Xu, J.; Liu, Y.; Cheng, W.; Tian, C.; Miao, H. Meteorological Drought Evolution Characteristics and Future Trends in the Yangtze River Basin. J. Chang. River Sci. Res. Inst. 2020, 37, 28–36. [Google Scholar]
  72. Lobell, D.B.; Schlenker, W.; Costa-Roberts, J. Climate Trends and Global Crop Production Since 1980. Science 2011, 333, 616–620. [Google Scholar] [CrossRef] [PubMed]
  73. Wu, H.; Fu, C.; Wu, H.; Zhang, L. Plant Hydraulic Stress Strategy Improves Model Predictions of the Response of Gross Primary Productivity to Drought Across China. J. Geophys. Res. Atmos. 2020, 125, e2020JD033476. [Google Scholar] [CrossRef]
  74. Zhao, Y.-Y.; Lyu, M.A.; Miao, F.; Chen, G.; Zhu, X.-G. The Evolution of Stomatal Traits along the Trajectory toward C4 Photosynthesis. Plant Physiol. 2022, 190, 441–458. [Google Scholar] [CrossRef] [PubMed]
  75. Swinton, S.M.; Lupi, F.; Robertson, G.P.; Hamilton, S.K. Ecosystem Services and Agriculture: Cultivating Agricultural Ecosystems for Diverse Benefits. Ecol. Econ. 2007, 64, 245–252. [Google Scholar] [CrossRef]
  76. Lin, B.B. Resilience in Agriculture through Crop Diversification: Adaptive Management for Environmental Change. BioScience 2011, 61, 183–193. [Google Scholar] [CrossRef]
  77. Anderson-Teixeira, K.J.; Kannenberg, S.A. What Drives Forest Carbon Storage? The Ramifications of Source–Sink Decoupling. New Phytol. 2022, 236, 5–8. [Google Scholar] [CrossRef] [PubMed]
  78. Lesk, C.; Rowhani, P.; Ramankutty, N. Influence of Extreme Weather Disasters on Global Crop Production. Nature 2016, 529, 84–87. [Google Scholar] [CrossRef] [PubMed]
Figure 1. Study area: (a) geographic location, (b) climatic zones, and (c,d) elevation.
Agriculture 15 01552 g001
Figure 2. Methodological framework of this study. This flowchart illustrates the key steps, including data acquisition, CRU validation, SPEI calculation, drought event identification using run theory, and multiscale analysis of drought impacts on ecosystem carbon sequestration.
Agriculture 15 01552 g002
Figure 3. Identification of drought events using run theory with a dual-threshold method. The black line represents a time series of SPEI values, with shaded areas indicating the drought episodes. Two thresholds were applied: a basin-scale threshold (SPEI < 0) and a pixel-scale threshold (SPEI < −0.5), represented by horizontal lines. A drought event begins when SPEI first falls below the threshold (YMDIₜ) and ends when it returns above the threshold (YMDTₜ).
Agriculture 15 01552 g003
Figure 4. Accuracy evaluation of CRU precipitation data compared with observations (2000–2020). Monthly (al), seasonal (mp), and annual (q) comparisons of Pearson’s correlation coefficient (r), bias (BIAS), root mean square error (RMSE), and mean absolute error (MAE) between CRU and meteorological precipitation data across 338 sites.
Agriculture 15 01552 g004
Figure 5. Accuracy evaluation of CRU temperature data compared with observations (2000–2020). Monthly (al), seasonal (mp), and annual (q) comparisons of Pearson’s correlation coefficient (r), bias (BIAS), root mean square error (RMSE), and mean absolute error (MAE) between CRU and meteorological temperature data across 338 sites.
Agriculture 15 01552 g005
Figure 6. Performance evaluation of CRU-derived SPEI at monthly and seasonal scales. Comparison between CRU-based and station-based SPEI from 2000 to 2020 using Pearson’s correlation coefficient (r), bias (BIAS), root mean square error (RMSE), and mean absolute error (MAE), highlighting accuracy variations across months and seasons.
Agriculture 15 01552 g006
Figure 7. Spatiotemporal changes and trends in annual precipitation and temperature across the study region from 1961 to 2021 based on CRU data. (a,b) Interannual variations in annual average precipitation and temperature for the entire region, the Yangtze River Basin (YZRB), and the Yellow River Basin (YRB). (c,d) Spatial trends in annual precipitation and temperature, respectively, as calculated by Sen’s slope estimator and tested for significance using M–K trend tests.
Agriculture 15 01552 g007
Figure 8. Monthly distribution of SPEI-1 from 1961 to 2021 calculated using CRU monthly data. Positive values (blue) indicate wet conditions, negative values (red) indicate dry conditions, and 0 (yellow) indicates normal values. Panels show the results for (a) the entire region, (b) the Yangtze River Basin (YRB), and (c) the Yellow River Basin (YZRB). The color scale ranges from below −2 (extreme drought) to above +2 (extreme wet).
Agriculture 15 01552 g008
Figure 9. Mean SPEI at annual and seasonal scales from 1961 to 2021 calculated using monthly CRU data. Panels show results for (a) the entire region, (b) the Yangtze River Basin (YRB), and (c) the Yellow River Basin (YZRB). Positive values indicate wet conditions, and negative values indicate dry conditions. Seasonal means include spring (March–May), summer (June–August), autumn (September–November), and winter (December–February).
Agriculture 15 01552 g009
Figure 10. Spatiotemporal distribution of drought event characteristics in the Yellow River Basin (YRB) and Yangtze River Basin (YZRB) from 1961 to 2021. Panels (a,b) illustrate the temporal characteristics of individual drought events identified using SPEI-1 and run theory in the YRB and YZRB, respectively, including start and end times, duration, intensity, and severity. Each bar represents a single drought episode. Panels (cf) show the spatial distribution of cumulative drought metrics at the pixel level across the entire study period.
Agriculture 15 01552 g010
Figure 11. Spatial distribution of drought frequency at different timescales. Maps show drought frequency at (a) monthly, (be) seasonal (spring, summer, autumn, and winter), and (f) annual scales.
Agriculture 15 01552 g011
Figure 12. Multiscale correlation between SPEI-12 and carbon sequestration (CS) and nonlinear CS responses to drought characteristics from 2001 to 2021. Panels (a,c,e) show correlation coefficients between SPEI-12 and CS at city, county, and pixel levels, respectively. Panels (b,d,f) show the corresponding significance levels. Panels (gj) present CS variations in response to drought duration (DD), event count (DEC), intensity (DI), and severity (DS).
Agriculture 15 01552 g012
Figure 13. Long-term trends in SPEI-12 from 1961 to 2021. Spatial trends of annual SPEI-12, with trend magnitude estimated by Sen’s slope and significance tested using the M-K method. A decreasing SPEI indicates intensifying drought, whereas an increasing SPEI reflects drought alleviation over the 61-year period.
Agriculture 15 01552 g013
Figure 14. Spatial distribution of wet, dry, and drought migration paths in the Yellow River Basin from May to October 1997. Panels (af) show the spatial patterns of drought initiation and termination, respectively. Panel (g) illustrates the drought centroid trajectory during this period, and panel (h) provides a local-scale view of the centroid trajectory.
Agriculture 15 01552 g014
Table 1. Drought classification based on SPEI values [18,45].
SPEIDrought CategorySPEIDrought Category
SPEI ≤ −2Extreme drought0.5 < SPEI ≤ 1.0Mild wet
−2 < SPEI ≤ −1.5Severe drought1.0 < SPEI ≤ 1.5Moderate wet
−1.5 < SPEI ≤ −1.0Moderate drought1.5 < SPEI ≤ 2.0Severe wet
−1.0 < SPEI ≤ −0.5Mild droughtSPEI > 2.0Extreme wet
−0.5 < SPE ≤ 0.5Normal
Table 2. Evaluation of CRU SPEI performance at different time scales.
IndicatorSPEI-1SPEI-3SPEI-6SPEI-12
r0.690.680.680.65
RMSE0.780.800.800.84
MAE0.590.610.620.66
Disclaimer/Publisher’s Note: The statements, opinions and data contained in all publications are solely those of the individual author(s) and contributor(s) and not of MDPI and/or the editor(s). MDPI and/or the editor(s) disclaim responsibility for any injury to people or property resulting from any ideas, methods, instructions or products referred to in the content.

