1. Introduction
The culture of genetically modified (GM) cotton in Mexico presents a complex picture, interwoven by agronomic, environmental, and socioeconomic factors. Identifying optimal cotton production areas requires an assessment that includes not only the productive potential but also the compatibility with the areas to be defined as the center of origin and genetic diversity centers of cotton, in addition to environmental and social considerations.
Mexico, like other countries, has implemented several policies to stabilize the cotton sector, as it is necessary to continue moving towards more sustainable production by adopting technology and with better coordination along the value chain to ensure cotton crop viability [
1]. The total market value of cotton in Mexico reached 1227 million dollars in 2023, contributing 0.67% of agricultural exports and 1.67% of imports in 2022 [
2].
Four species of
Gossypium are used in cotton production worldwide:
G. hirsutum, known as Mexican cotton, upland cotton, which accounts for 90% of production;
G. barbadense, also called
pima or Egyptian cotton, which provides 5%; and the remaining 5% is obtained from
G. arboreum and
G. herbaceum.
G. hirsutum was domesticated in Mesoamerica, and there are currently truly wild populations on the Yucatan Peninsula. In Mexico, cotton-producing regions began to be delineated between the nineteenth and twentieth centuries, reaching the largest cultivated area between 1930 and 1950, with planted areas that exceeded one million hectares. However, phytosanitary issues, high production costs, fluctuations in fiber price, and water scarcity have led to a decline in cultivation since the 1960s [
3].
In Mexico, the cultivation of GM cotton started in 1996 as a tool to address crop issues caused by lepidopteran infestations when the crop area was at its historical minimum [
4]. With an initial area of 896.75 hectares of pest-resistant GM cotton crops, biotechnological cotton cultivation began in Mexico in response to the urgent need to control pests that impacted the crop, resulting in a significant reduction in insecticide application. The GM cotton used is resistant to lepidopteran pests by expressing insecticidal proteins from the soil-dwelling bacterium
Bacillus thuringiensis (Bt). Afterward, GM cotton varieties showing tolerance to herbicides were incorporated into crop production, followed by the incorporation of biotechnological varieties that were resistant to pest insects and tolerant to herbicides, allowing more efficient pest and weed control in cotton crops. Since then, GM cotton planting has increased steadily, reaching 241,000 hectares in 2018, mainly in the cotton-growing regions of northern Mexico [
5].
In 2005, the Law on Biosafety of Genetically Modified Organisms (LBOGM, in Spanish) was issued, which establishes that releases of Genetically Modified Organisms (GMOs) in Mexico must first undergo a specific risk assessment for each production area. This process includes experimental and pilot testing phases before market release [
6]. The risk assessment is carried out using the IV-level ecoregion criterion, thus ensuring that the environmental and ecological characteristics of each particular area are considered.
The evolution and consolidation of the regulatory framework on the release of GM cotton varieties in Mexico considers the delimitation of areas corresponding to the center of origin and genetic diversity centers. To define these areas, it is essential to have background information about the crop. One of the main aspects of agroclimatic research is determining the specific requirements of crops and relating them to yield to define optimal production areas.
Climate and soil conditions are important factors that influence plant growth, determining the distribution area of species by setting limits for their survival [
7]. Nobel [
8] proposed relating plant productivity to factors that regulate the efficient use of CO
2, such as radiation, water, and temperature. Net photosynthesis depends on the efficient conversion of radiant energy, which in turn is influenced by the water status of the plant and the ambient temperature. Under adverse conditions, abscission increases in cotton plants, mainly affecting flower buds and small capsules; multiple internal and external factors interact in this process. Sharpley and Willians [
9] showed that it is possible to determine the phenological development of the crop with data on daily temperature and the base temperature specific to the crop, based on the accumulated daily heat units, which spans from planting to harvest, thus determining the heat units necessary for crop maturation and for each phenological development stage.
The main objective of this study was to identify agricultural areas potentially suitable for cotton production, including considerations on GM cotton varieties that are compatible with the areas to be defined as the center of origin or genetic diversity centers of cotton in Mexico, particularly in the states of Chihuahua, Coahuila, Sonora, Sinaloa, Tamaulipas, Durango, and Baja California, which are the states that currently produce most of the GM cotton.
The central hypothesis is that GM cotton is suitable for cultivation across a range of distinct agroecological zones in Mexico, and that these zones can be identified through agroclimatic analysis by quantifying accumulated heat units and rainfall thresholds required for optimal phenological development. The plots that meet this condition in the study area will be evaluated to consider optimal only those areas that comply with biosafety standards in Mexico, particularly in terms of proximity to Protected Natural Areas (PNAs) and those defined as Center of Origin and Genetic Diversity Centers.
The value of this project lies in the systematization of data and the development of a geographic information system (GIS) that facilitates the identification of optimal areas for cultivating cotton (conventional and GM), by integrating agroclimatic, soil, and regulatory factors on a single platform. Based on accumulated heat units and the aforementioned factors, this platform would allow for identifying potential sites for GM cotton cultivation, under the hypothesis that crops grow from the date of planting to the date of harvest (when the accumulated heat units are equal to the potential heat units for the cotton crop), i.e., the phenological development of the crop is based on accumulated daily heat units.
Therefore, this system allows visualizing agricultural areas with the potential to grow GM cotton, identifying the geographic location of optimal sites that ensure maximum cotton productivity, and complying with regulatory requirements. In addition, it contributes to sustainable production and optimizes land-use planning, further reducing any potential impact on biodiversity.
2. Materials and Methods
Identification of optimal areas for GM cotton cultivation involves analyzing a series of key factors for its development, including agroclimatic conditions such as temperature, precipitation, soil type, day length, and water availability. In agroclimatic research, it is essential to determine the requirements of cotton cultivation, relate them to crop yield, and, from this, define optimal production areas. According to Sharpley & Willians [
9] and FAO [
10], climate and soil conditions influence plant growth, thus defining the distribution range of species by setting limits for their survival. Therefore, it is necessary to analyze the temporal sequence of climatic stimuli during the life cycle of the cotton crop, as well as the characteristics of the soil.
Our methodological approach included a literature survey to identify the needs of cotton cultivation and the regulations applicable to GMOs in Mexico. Afterward, an information search was carried out to elaborate climatic (precipitation and temperature), soil, and topographic databases, which were processed to develop a GIS. We used maps and data from various official sources in Mexico, including the National Institute of Statistics and Geography (INEGI) (Acronyms in parenthesis correspond to the name in Spanish [translator’s note]), the Agri-Food and Fisheries Information Service (SIAP), the National Commission for Natural Protected Areas (CONANP), the National Commission for the Knowledge and Use of Biodiversity (CONABIO), the National Biodiversity Information System of Mexico (SNIB), NaturaLista, the National Water Commission (CONAGUA), the Inter-Ministerial Commission on Biosafety of Genetically Modified Organisms (CIBIOGEM), the Global Biodiversity Information System (GBIF), and the World Biodiversity Information Network (REMIB), among others.
We used software with a General Public License (GPL), such as QGIS version 3.36, SQLite version 3.35.2, and open source software (OSS), such as Python version 3.11.
The criteria and agroclimatic conditions used in this study, the sources of information in the databases consulted, and the processes carried out for constructing the GIS to identify potential areas for cultivating GM cotton in Mexico are described below.
2.1. Agroclimatic Conditions Required for Cotton Cultivation
Mexico is home to the center of origin of
Gossypium hirsutum, a tropical perennial plant [
11] managed agronomically as an annual cotton crop. To ensure crop health, compliance with NOM-026-SAG/FITO-2014 [
12] is required.
Next, the main agroclimatic factors that influence the development of Gossypium hirsutum, elements required for optimal productivity, are described.
Temperature. Temperature is a crucial climatic factor for cotton cultivation, with an optimal development range between 12.8 °C and 30 °C, according to Luján Aguirre et al. [
5] and Ruiz Corral et al. [
13]. The necessary base temperature in the soil is set at 15.5 °C, equivalent to approximately 13 °C in the environment [
14]. Germination occurs when the temperature exceeds 14 °C, with 20 °C being the optimal temperature, and the maximum recommended temperature is 30 °C [
15,
16].
For the development of the plant, flowering requires temperatures between 20 °C and 30 °C, while capsule ripening occurs from 27 °C to 30 °C according to the Mexican Cotton technical sheet of the National Agricultural Planning (2017–2030). Furthermore, Pérez et al. [
15] highlight that, for effective photosynthesis, seedlings need temperatures between 25 °C and 30 °C, with 25 °C yielding the best results.
Precipitation. The estimated water requirements of the cotton crop (
Gossypium hirsutum L.) range between 800 mm and 1200 mm, according to Pérez et al. [
15], while Sifuentes et al. [
17] report 500 mm to 869 mm of water between July and January. Ruiz Corral et al. [
13] indicate that the required precipitation varies between 700 mm and 1300 mm, establishing a coincidence point of 800 mm. Under dry weather conditions, irrigation is essential for the production of high-quality fiber, as mentioned by Luján Aguirre et al. [
5]
Solar radiation. Cotton is cultivated in the open air and has specific light and temperature requirements for optimal growth. According to Pérez et al. [
15], it is essential that cotton receives between 50% and 60% hours of light throughout its biological cycle. Furthermore, [
16] this author indicates that this crop needs four to five months with high and constant temperatures to reach its maximum development. Brightness is particularly critical during the initial stages and flowering, as any light deficiency can interfere with proper capsule ripening and opening [
16].
Edaphology. Cotton can grow in different soil textures, preferring those with loamy textures and good aeration. Cotton taproot can reach up to 2 m deep, so it is ideal for sowing in deep soils. It is sensitive to acidity, develops well at a neutral pH (6–8), and is tolerant of an alkaline pH (8–9). Its maximum productive potential is reached in fertile, deep, and well-draining soils, and it is advisable to plant in soils with a flat or slightly sloping slope [
18].
Altitude. Cotton develops its best characteristics in regions between 0 m and 600 m above sea level [
13].
2.2. Database Collection
2.2.1. Temperature and Precipitation Database
The Organization for Economic Cooperation and Development (OECD) and FAO, in their publication Agricultural Outlook 2023–2032, underscore climate change as a factor that could increase the frequency of droughts, floods, and other adverse weather events [
19]. Therefore, it is crucial to use technologies that ensure the availability of timely climate information to assess the study area and determine whether the requirements for optimal cotton development and production, such as temperature and daily precipitation databases, are met.
In Mexico, the National Meteorological System reports 5467 weather stations, many of which have recently started data collection or have incomplete information. In addition, that number of stations leaves some important sites without coverage, and interpolation methods generate inaccurate data.
Data science and Big Data have made it possible to generate precipitation and temperature data worldwide using satellite sensors, correlating the information with field data to make adjustments by applying artificial intelligence models. Successful approaches of TIR (thermal infrared) satellite information and precipitation products similar to those of NOAA (National Oceanic and Atmospheric Administration) are used, as well as precipitation estimates using intelligent interpolation methods, where anomalies are calibrated with ground stations such as those of GPCC (Global Precipitation Climatology Centre) [
20,
21]. On these bases, the Climate Hazards Center at the University of California, Santa Barbara, has infrared precipitation databases with CHIRPS (Climate Hazards Group Infrared Precipitation with Stations) stations [
20] and a CHIRTS (Climate Hazards Group Infrared Temperature with Stations) near-global high-resolution (~5.5 km at the equator) dataset of maximum and minimum temperatures [
22,
23].
CHIRPS produces a preliminary product with two-day latency, followed by one with three-week latency, incorporating data from pluviometers installed at ground-based weather stations (including those in Mexico) and the World Meteorological Organization’s Global Telecommunications System (GTS) to estimate a continuous time series of precipitation from 1979 to the present. Therefore, the precipitation and temperature database used in this study was obtained from the CHIRPS (1983 to 2020) and CHIRTS (1983–2020) databases generated from satellite imagery and observed data with a resolution of ~5.5 km at the equator and daily frequency. These data have proven to be a better alternative to simple interpolation of national stations, particularly in areas where weather stations are widely scattered [
22,
23].
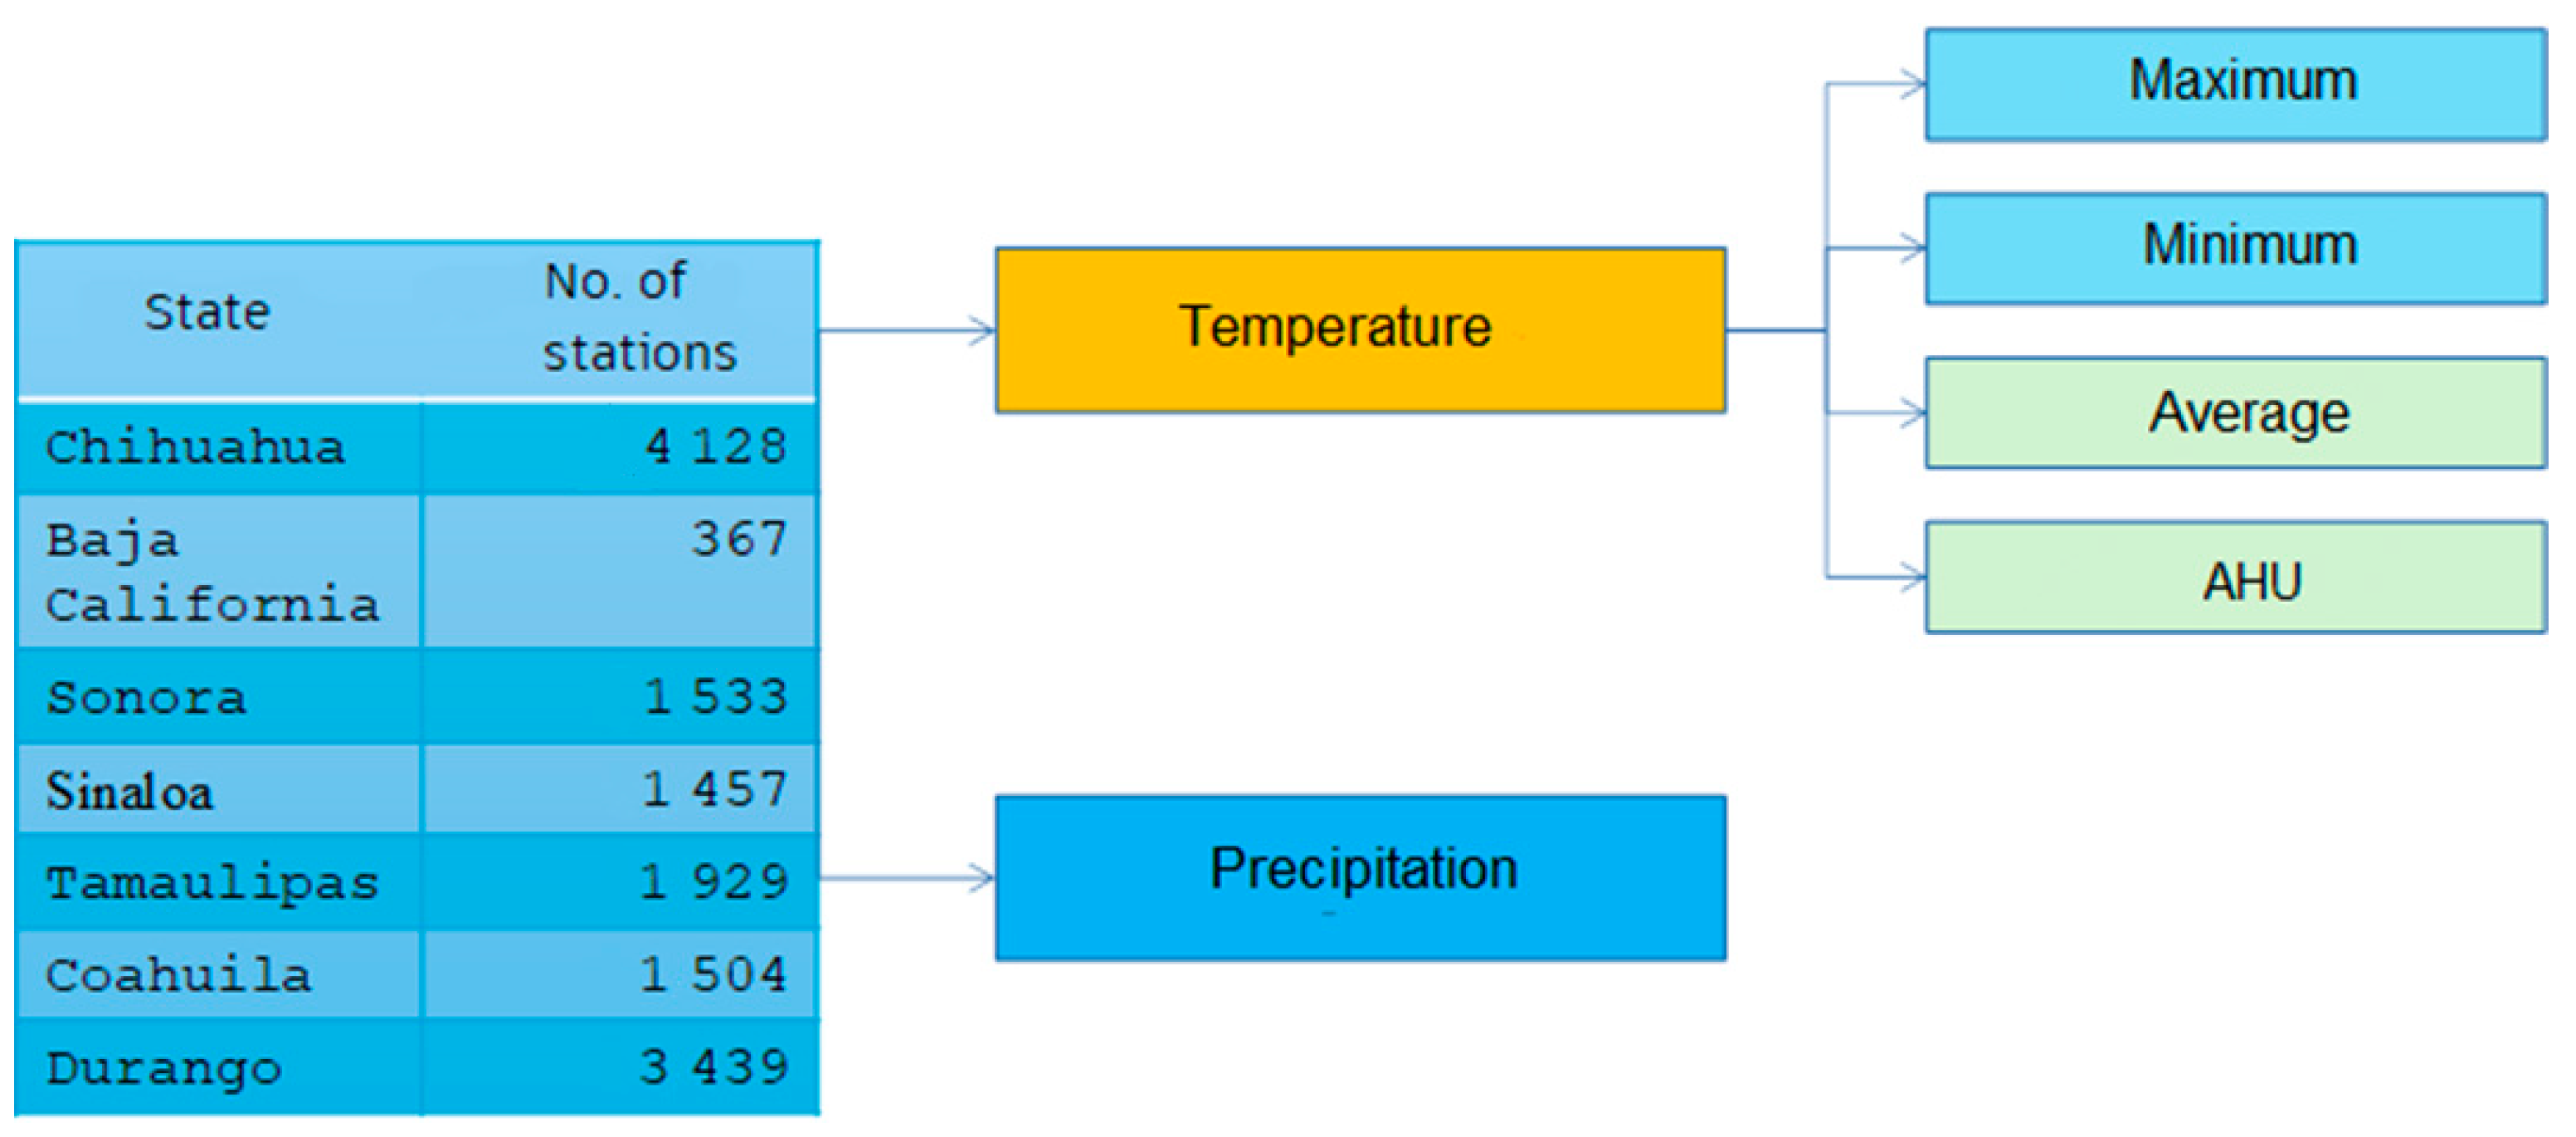
The processing of 10,910 stations with temperature data from the 1983–2020 series (
Figure 1) and 10,910 stations with precipitation data from the 1983–2020 series produced a grid (data matrix) of mean daily maximum temperature (37 years), mean daily minimum temperature (37 years), and mean daily temperature; a grid of mean daily heat units, a grid of accumulated daily heat units, and a grid of mean daily precipitation (37 years), with a spatial resolution of ~5.5 km
2.
2.2.2. Altitude Database
The information used was obtained from the Mexican Elevation Continuum 3.0 (CEM 3.0) of INEGI. This database includes geolocation data defined by Cartesian coordinates (X, Y) and values representing elevations (Z) [
24] with a spatial resolution of 15 m. Cotton develops its best characteristics in regions between 0 and 600 m above sea level [
13].
2.2.3. Edaphic Database
The edaphic database is geospatial information that shows the distribution of the main soil types in the study area, along with their physical and chemical attributes according to FAO’s World Reference Base for Soil Resources “
https://www.fao.org/4/Y1899E/y1899e00.htm#toc (accessed on 15 May 2025)”. This classification indicates the texture or amount of sand, silt, and clay in the soil, the presence of chemical phases such as salinity and sodicity, and physical phases such as rock or cemented strata close to the surface. Although OpenLandMap offers globally consistent edaphic data layers derived from machine learning and remote sensing, the present study relied on INEGI’s Edaphological Series II (2002–2007) because it provides more locally validated and ground-truthed information for Mexican territory. INEGI’s database includes soil classification based on in situ observations and offers polygon-based mapping at a 1:250,000 scale, which remains suitable for regional agroecological analyses [
25].
2.2.4. Agricultural Frontier
The Agricultural Frontier delimits land authorized for agricultural use, whether cultivated or resting, but with evidence of agricultural activity in the previous five years in Mexico [
26]. This layer is freely accessible upon request by email to the Agri-Food and Fisheries Information Service (SIAP, in Spanish). Polygons contain information on the agricultural modality (irrigation or rainfed).
The Agricultural Frontier layer was used as a reference since areas potentially suitable for cotton cultivation must be within agricultural land; therefore, this layer served as an initial screen that ensures that the selected areas are suitable for agriculture by having a license for agricultural land use, to assess whether they show potential for GM cotton cultivation.
2.2.5. Biological and Environmental Considerations for the Issuance of Licenses for the Release of GM Cottons into the Environment
Protected Natural Areas (PNAs): Mexico’s natural protected areas are essential for the conservation of biodiversity and environmental services [
27], including wild cotton species. The location and delimitation of federal PNAs were obtained from the National Commission for Protected Natural Areas website [
28]. Geospatial information corresponding to local PNAs was obtained from the Interministerial Commission on Biosafety of Genetically Modified Organisms website (CIBIOGEM) [
29].
Center of Origin and Genetic Diversity Center: The Law on Biosafety of Genetically Modified Organisms defines the Center of Origin (CO) as the geographic area of Mexico where a given species was domesticated. The Genetic Diversity Center (CDG, in Spanish) is the geographic area where a given species shows morphological and genetic diversity, characterized by housing closely related wild populations that constitute a genetic reservoir [
29]. These centers, defined by the Boards of Agriculture and the Environment, are designated as restricted areas for performing activities involving genetically modified organisms, as is the case for PNAs [
30].
Distribution of wild species of the genus
Gossypium: Mexico is the center of origin of 11 diploid cotton species, including
G. armourianum,
G. lobatum,
G. gossypioides,
G. aridum,
G. laxum,
G. schwendimanii,
G. thurberi,
G. trilobum,
G. davidsonii,
G. turneri, and
G. harknesii, as well as one tetraploid species,
G. hirsutum. The latter is the most predominant species, with the largest number of specimens collected [
31]. To note, the 11 wild cotton species are at some degree of risk according to NOM-059-SEMARNAT-2010, so they are protected [
32].
Cotton shows a low probability of cross-pollination, as 90% of plants are self-pollinating [
3]. Pollination between GM cotton and wild species is very limited and decreases exponentially with distance [
33]. The main risk factor for gene flow between GM cotton and sexually compatible wild species is seed dispersal during the transportation of harvested or deseed products that could situate them in a place where these seeds reach sites with crossbreeding risk [
3].
Of the wild species present in Mexico, the only two species that are sexually compatible are
G. hirsutum and
G. barbadense [
34]. Wild populations of
G. barbadense are distributed in southeastern Mexico [
35], far from crops.
Defining areas that are Centers of Origin or Genetic Diversity Centers for cotton and differentiating them from areas potentially suitable for GM cotton planting are useful measures to prevent crossbreeding. The maps of the potential distribution of wild species were downloaded from the National Biodiversity Information System (SNIB, in Spanish), a joint initiative of CONABIO and REMIB that shares information and resources. The maps used in the project are as follows:
G. aridum. Potential distribution of wild cotton in Mexico [
36].
G. aridum. Potential distribution [
37].
G. aridum. Presence records for the potential distribution map [
37].
G. armourianum. Potential distribution of wild cotton in Mexico [
38].
G. barbadense. Potential distribution of wild cotton in Mexico [
35].
G. davidsonii. Potential distribution of wild cotton in Mexico [
39].
G. gossypioides. Potential distribution of wild cotton in Mexico [
40].
G. hirsutum. Potential distribution of cotton varieties [
41].
G. schwendimanii. Potential distribution [
42].
Terrestrial Ecoregions: Terrestrial ecoregions are distinctive geographic areas of Mexico that are home to characteristic flora, fauna, and ecosystems. These correspond to Level IV of regionalization and were delimited based on a map issued by the Commission for Environmental Cooperation in 1997 [
43]. These regions are used as fundamental units to guide research, evaluation, management, and monitoring of ecosystems and environmental resources [
44]. The Ecoregions layer was obtained from the CONABIO website [
44].
2.2.6. Socioeconomic Considerations: Geographic Database of Indigenous Localities
In the agronomic context under study, the location of sites with an Indigenous population was considered in accordance with the provisions of Article 108 of the LBOGM [
30]. The GIS produced for this project incorporated a layer that allows locating the geographic distribution of the “original Indigenous peoples” of whom there is a record according to the information and databases published by the National Institute of Indigenous Peoples (INPI, in Spanish) and data from the 2020 Population and Housing Census.
2.3. Information Processing
Before integrating the spatial databases into the GIS, they went through a preprocessing step that allowed the spatial reference system to be homogenized by performing the transformation of coordinates (when necessary) to the ITRF2008 coordinate system (International Terrestrial Reference Framework 2008), as specified in the Technical Standard of the National Geodetic System for Mexico (DOF:23/12/2010) “
https://dof.gob.mx/nota_detalle.php?codigo=5172207&fechsa=23/12/2010#gsc.tab=0 (accessed on 15 May 2025)”.
Spatial, temporal, and attribute databases related to the regulations applicable to genetically modified organisms and the basic conditions for cotton development were integrated, with emphasis on heat units. The yield and fiber characteristics depend on heat units; that is, they are a function of the variations in mean daily temperature and the temperature range, since the heat unit index relates plant growth, development, and maturity with air temperature [
8,
9].
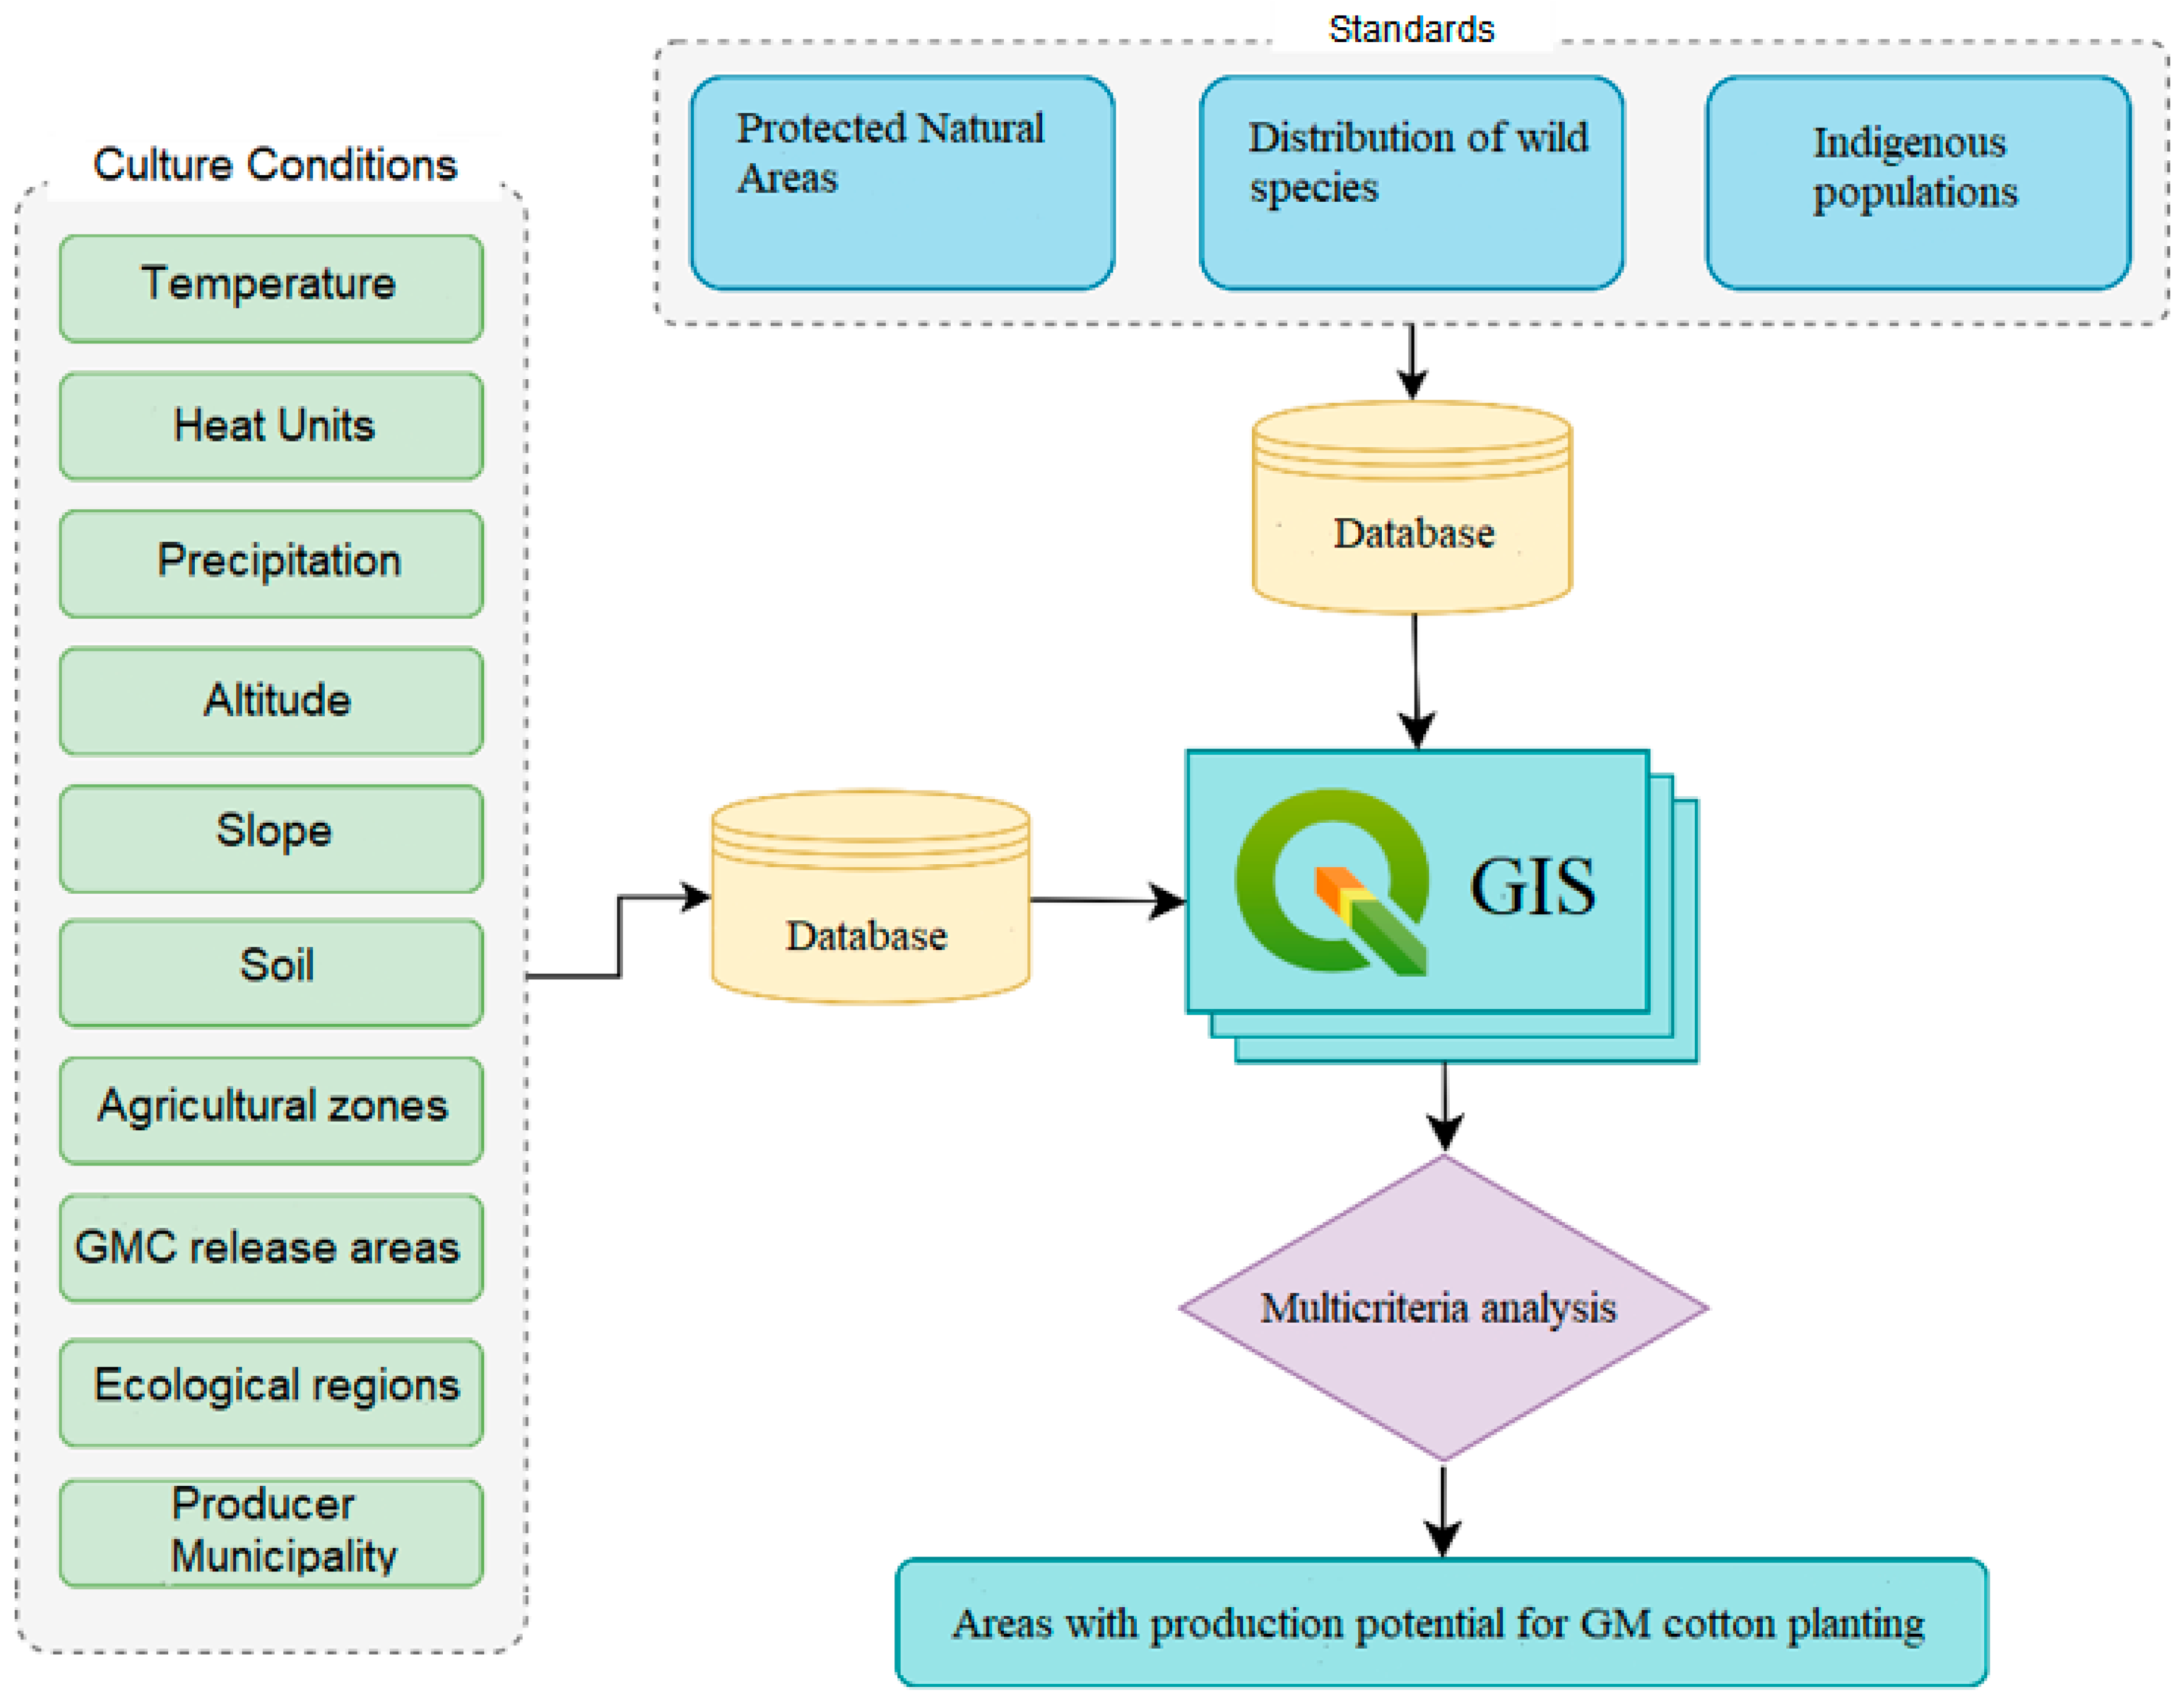
Figure 2 depicts the databases analyzed and calculated to develop the GIS for the present study. The GIS allows the analysis of environmental, geographical, and regulatory conditions to delimit the regions with agricultural potential for GM cotton planting.
2.3.1. Calculation of Heat Units (HUs)
Calculating heat units, also known as degree days of development (DDD), is hugely important, since temperature allows for determining the metabolic rate, so it becomes an accurate predictor of the healthy plant growth stages. In addition, evaluating historical daily heat units in a particular area facilitates estimating the appropriate planting dates, the development cycle, and the harvest period.
Heat units are a valuable measurement tool in agriculture, but obtaining climatological information in Mexico is challenging [
45]. The available meteorological records are incomplete, and their density and location are continuously questioned, since it is one station per 358 km
2 on average, whereas the World Meteorological Organization (WMO) recommends one station per 100 to 250 km
2 in mountainous regions [
46]. In Mexico, the official climatological databases are obtained from the National Meteorological Service (SMN, in Spanish), with a national network of 5467 conventional weather stations, of which only 53% (2926 stations) are currently in operation. Furthermore, the data show major gaps, leading to use deficiencies and becoming one of the main issues for calculating heat units from them. Fortunately, the advances in satellite technology and the development of state-of-the-art atmospheric models allow for producing the so-called meteorological reanalysis data (DMR, in Spanish) or mesh meteorological data (DMM, in Spanish) from globally available observations, which are estimated from the state of the atmosphere and the large-scale land surface. Reanalysis data are considered a promising alternative as an information source to overcome the spatial and temporal limitations of meteorological data, as mentioned by Auerbach et al. [
47], Mollericona et al. [
48], and Verdin et al. [
23].
Since 1999, scientists from the USGS (United States Geological Survey) and the CHC (Climate Hazards Center), with financial support from USAID (United States Agency for International Development), NASA (National Aeronautics and Space Administration), and NOAA (National Oceanic and Atmospheric Administration), have developed techniques to produce precipitation and temperature maps—especially in areas where ground-level data are scarce. These techniques leverage satellite observation resources, such as NASA and NOAA’s grid-based precipitation estimates, to construct high-resolution (0.05°) gridded precipitation climatologies [
49].
The Climate Hazards Group’s Seasoned Infrared Precipitation Dataset (CHIRPS) is a dataset of quasi-global rainfall spanning from 1983 to 2020. The Climate Hazards Center InfraRed Temperature with Stations (CHIRTS) daily temperature data product is a quasi-global, high-resolution gridded dataset. CHIRTS and CHIRPS data are organized in separate text files covering ~5.5 km × ~5.5 km at the equator geographic pixels from which data were recorded daily [
23,
49] and downloaded from the website “
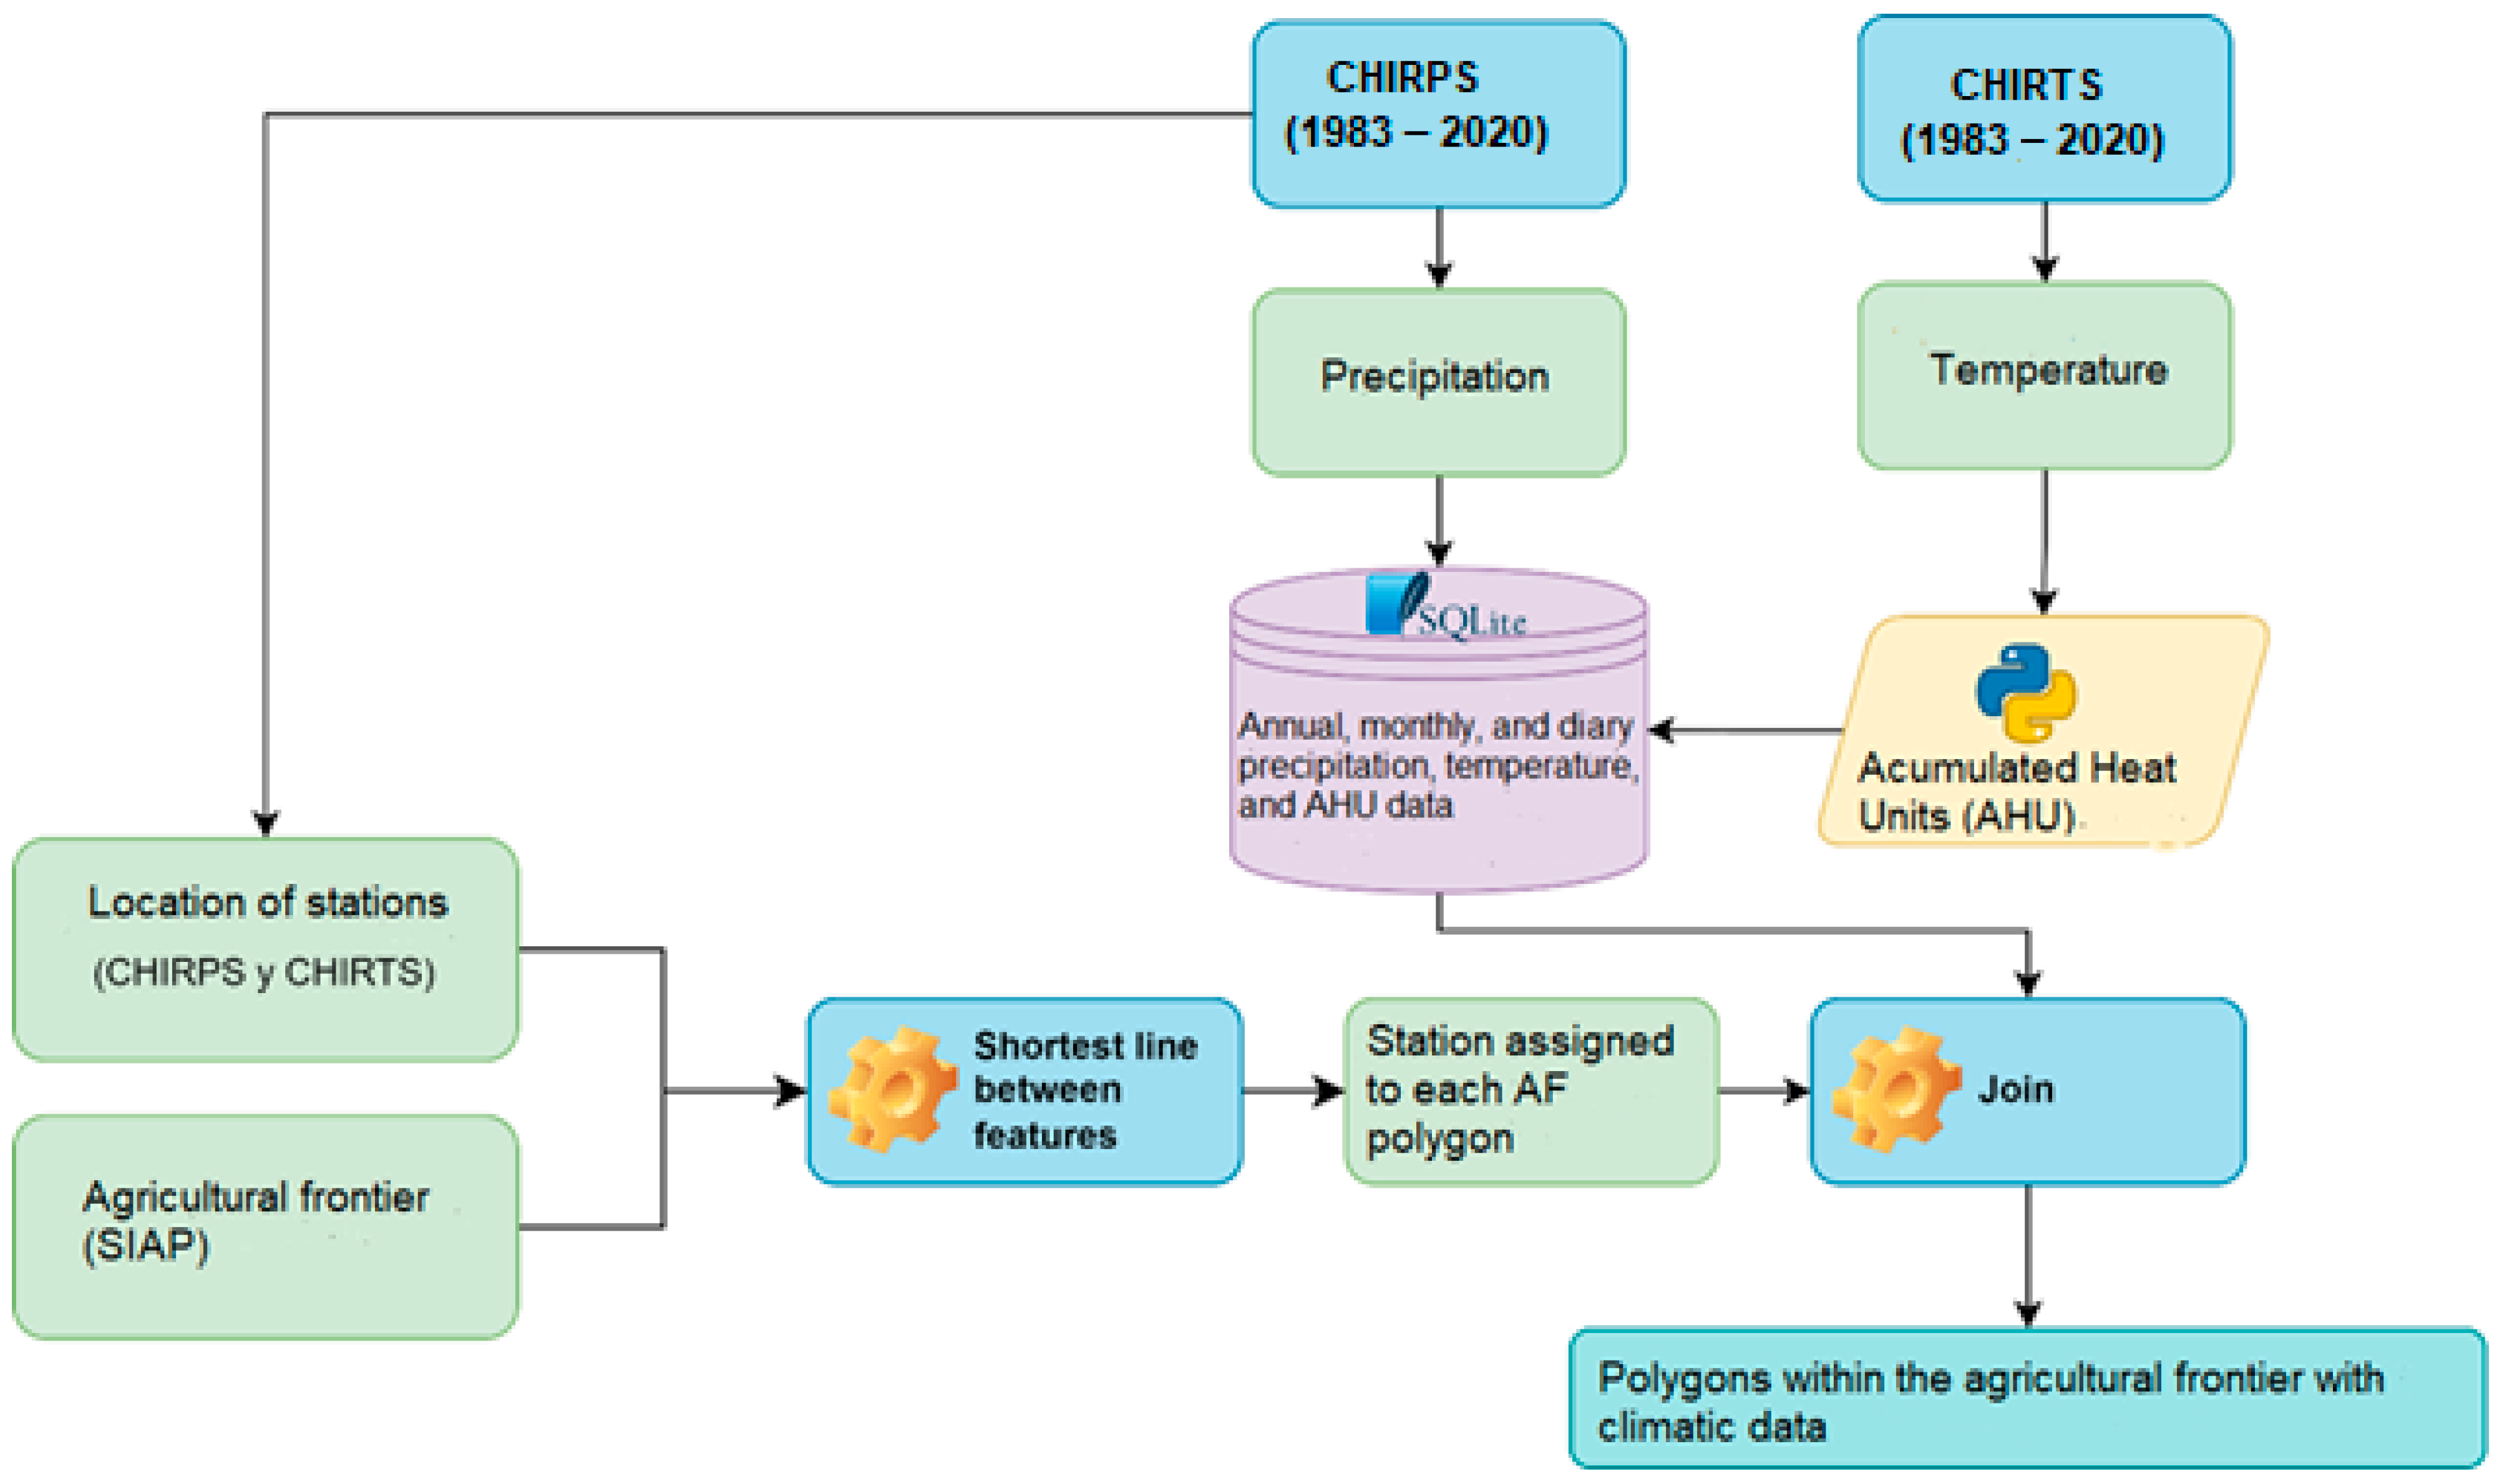
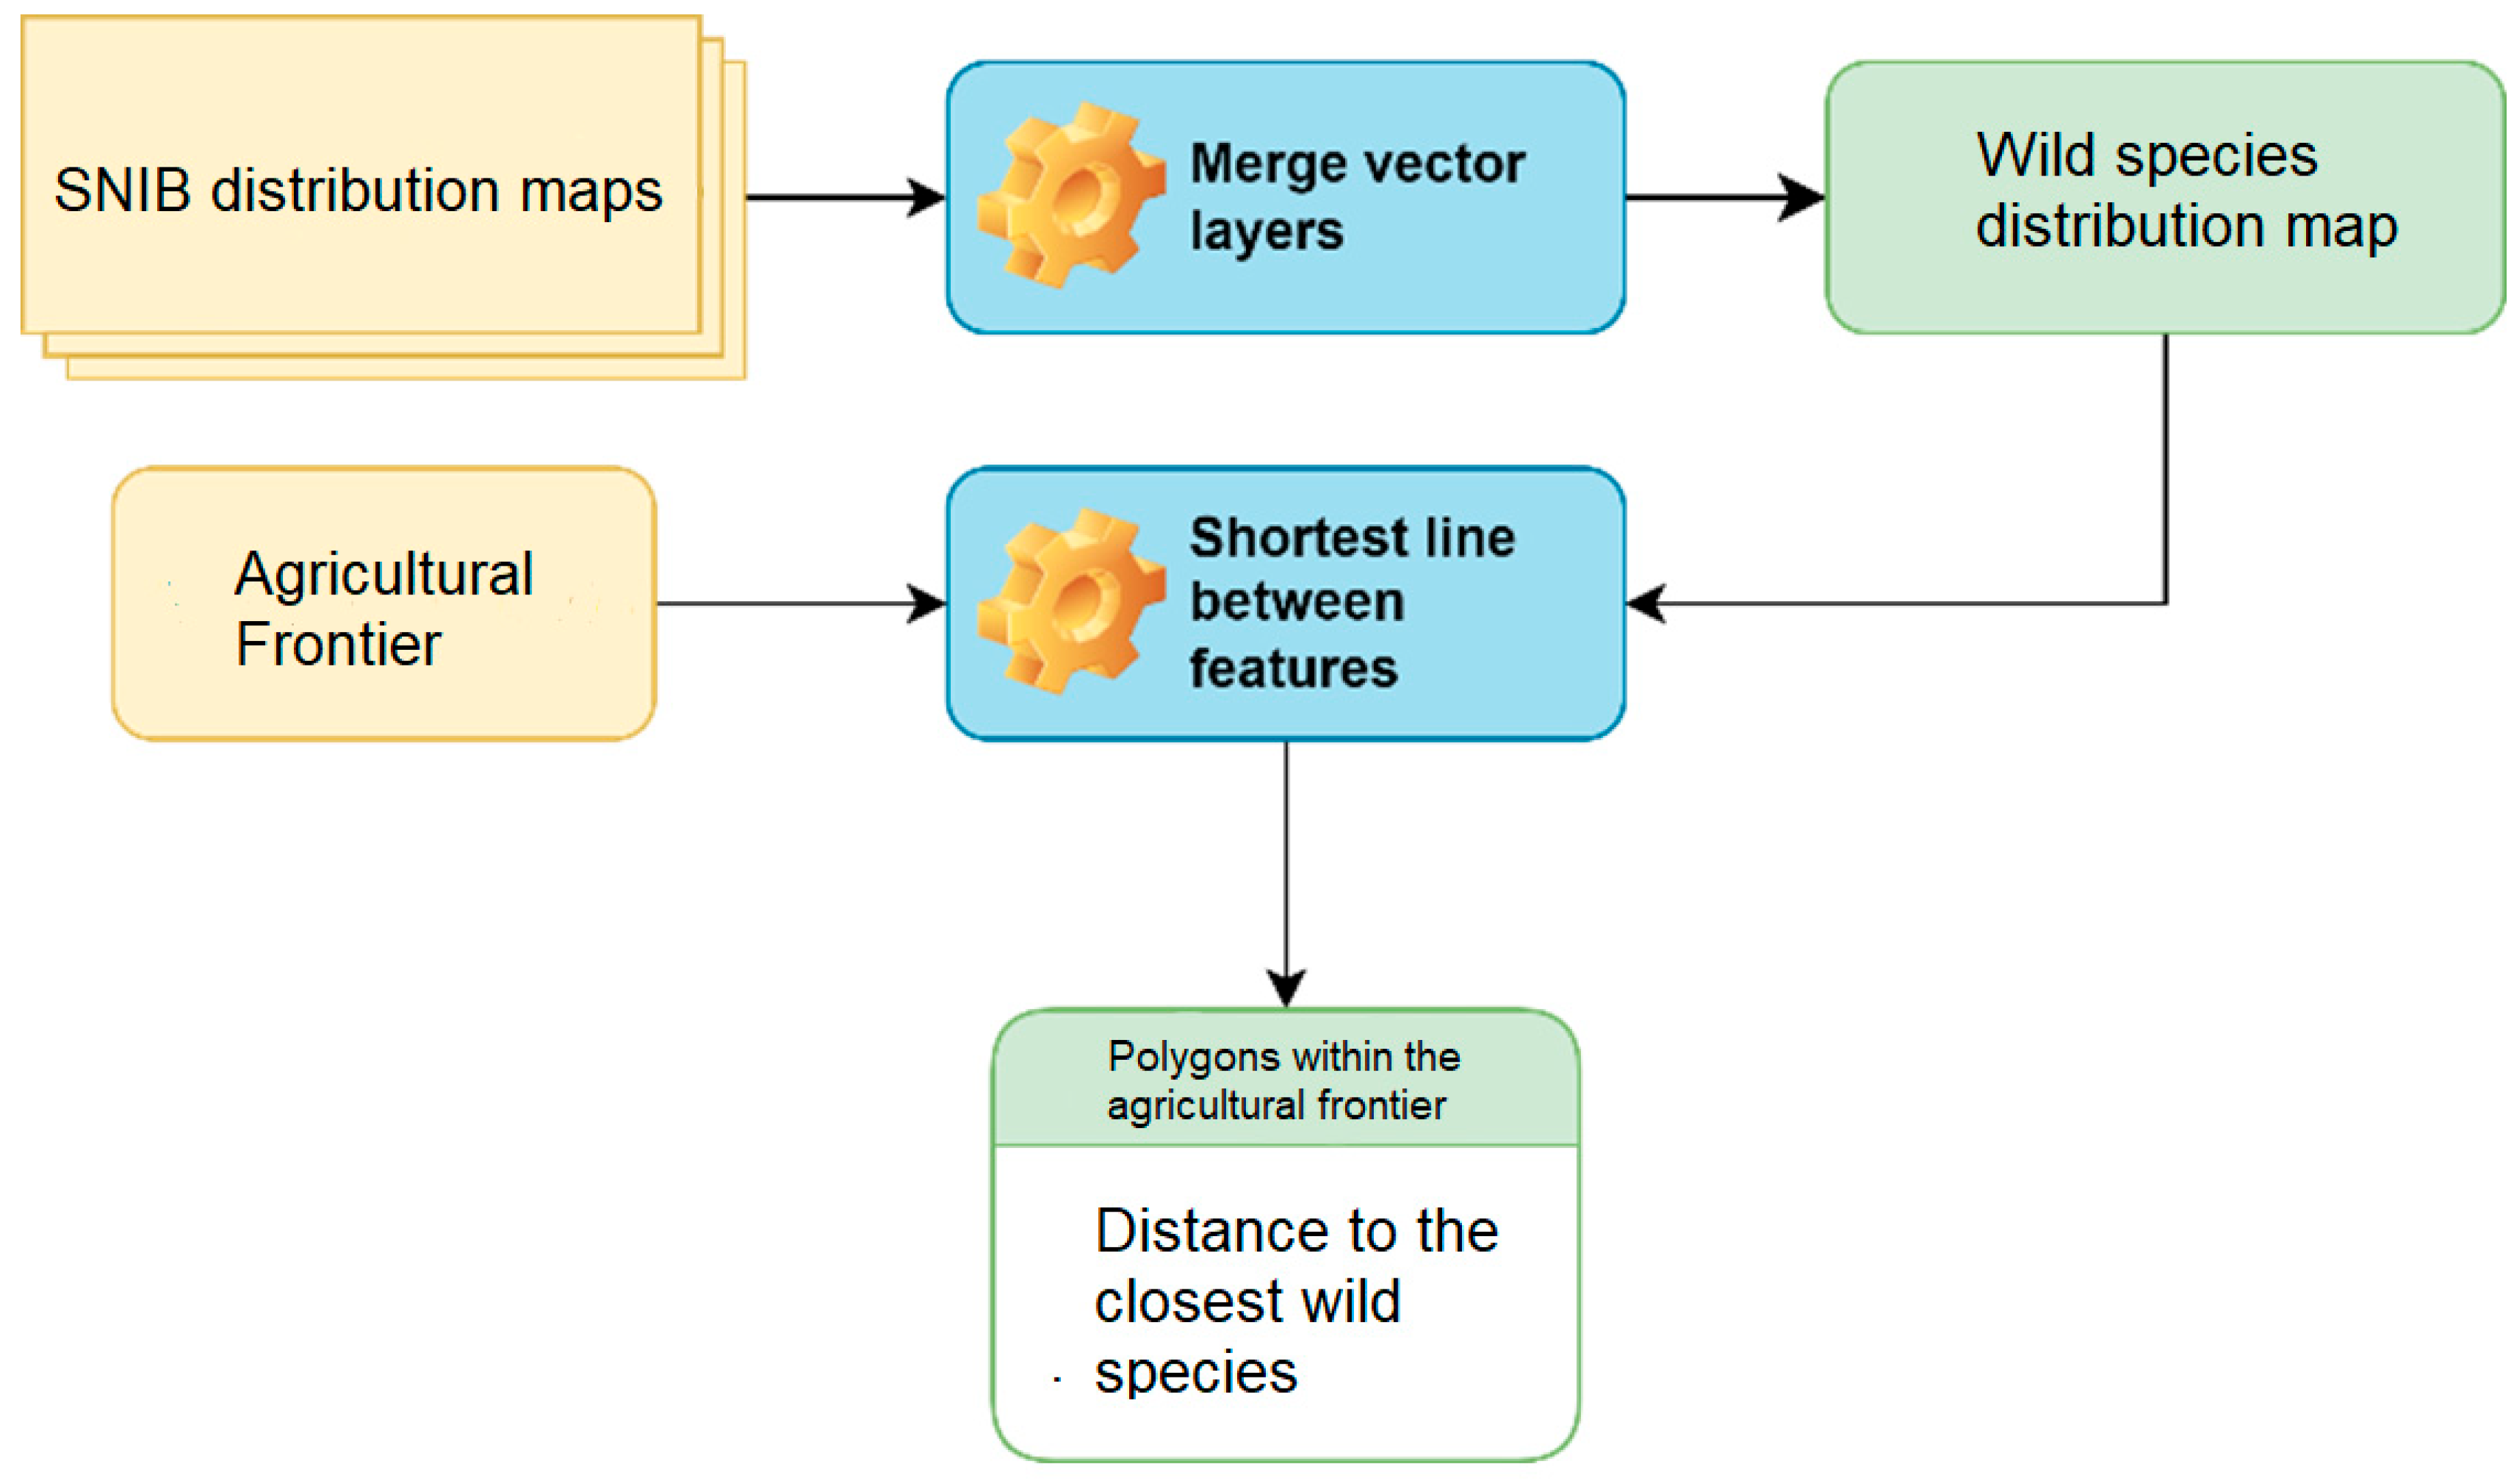
https://swat.tamu.edu/data/chirps-chirts/ (accessed on 1 April 2024). Following the established methodology, we first assigned a station (one pixel) to each polygon within the Agricultural Frontier with precipitation, temperature, and heat units data. This procedure was performed in QGIS using the “Shortest line between features” function, which determines the pixel closest to the plot (see
Figure 3).
It should be noted that the information integrated into the platform does not correspond to fixed weather stations but to 5 km × 5 km pixels, which will be referred to as stations hereafter for better illustration and ease of use. Once the stations were selected, the daily precipitation and temperature files from 1983 to 2020 were processed.
Refs. [
9,
50] showed that temperature plays a crucial role in crop development, being a major factor in each plant growth stage. A specific temperature range is required for optimal development in each phase. For example, Herrera Andrade et al. [
51] mentioned that, to optimize the yield, planting should be carried out within 400 to 700 heat units. López and Gil [
52] demonstrated the importance of weather (minimum and maximum temperature) for the development of the phenological phases. Pérez Solís [
53] analyzed the phenological development of cotton and related the general plant phenology to the accumulated heat units (AHUs), as shown in
Table 1.
Heat units are determined using the crop base temperature, i.e., the lowest temperature that triggers germination and plant development, and the mean daily temperature. In the case of cotton, the base temperature is 15.5 °C in the soil, approximately equivalent to 13 °C in the environment [
14].
To calculate the daily mean temperature (
Tmean) for 1983 to 2020 (obtained from
https://swat.tamu.edu/data/chirps-chirts/ (accessed on 1 April 2024)), the daily maximum temperatures (
Tmax) and the daily minimum temperature (
Tmin) were calculated from the CHIRTS (Climate Hazards Group Infrared Temperature with Stations) climate temperature database. The daily mean temperature was determined using Equation (1) applied for all stations (5 km × 5 km pixels):
Once the daily mean temperature was obtained, the daily heat units (
HUs) and accumulated heat units (
AHUs) were calculated with the following equation:
where
Tmean is the daily mean temperature (°C), base temperature (
Tbase) = 13 °C, δ
i = 1 for
Tmean >
Tbase, δ
i = 0 for
Tmean ≤
Tbase, and
n is the number of days in the period considered.
To facilitate calculations and generate standardized databases with 37 years of records using the methodology described above, a program (script) was generated in Jupyter Notebook version 7 with the Python 3.11 programming language (attached as the
Supplementary File “Unidades Calor Promedio diario 1983–2020.ipynb”).
The resulting databases after running the program (daily maximum temperature, daily minimum temperature, daily mean temperature, daily heat units, and accumulated heat units) in Accii format were exported to an SQLite database and later integrated into the GIS.
The precipitation databases were calculated using the same script and procedure used to calculate the temperature databases mentioned above, also covering 37 years (1983–2020), obtaining daily mean precipitation databases from precipitation files. Databases generated in the Accii format were exported in SQLite.
2.3.2. Altitude and Slope Calculation
The slope of each polygon within the Agricultural Frontier was calculated using the 15 m Digital Elevation Model (DEM) [
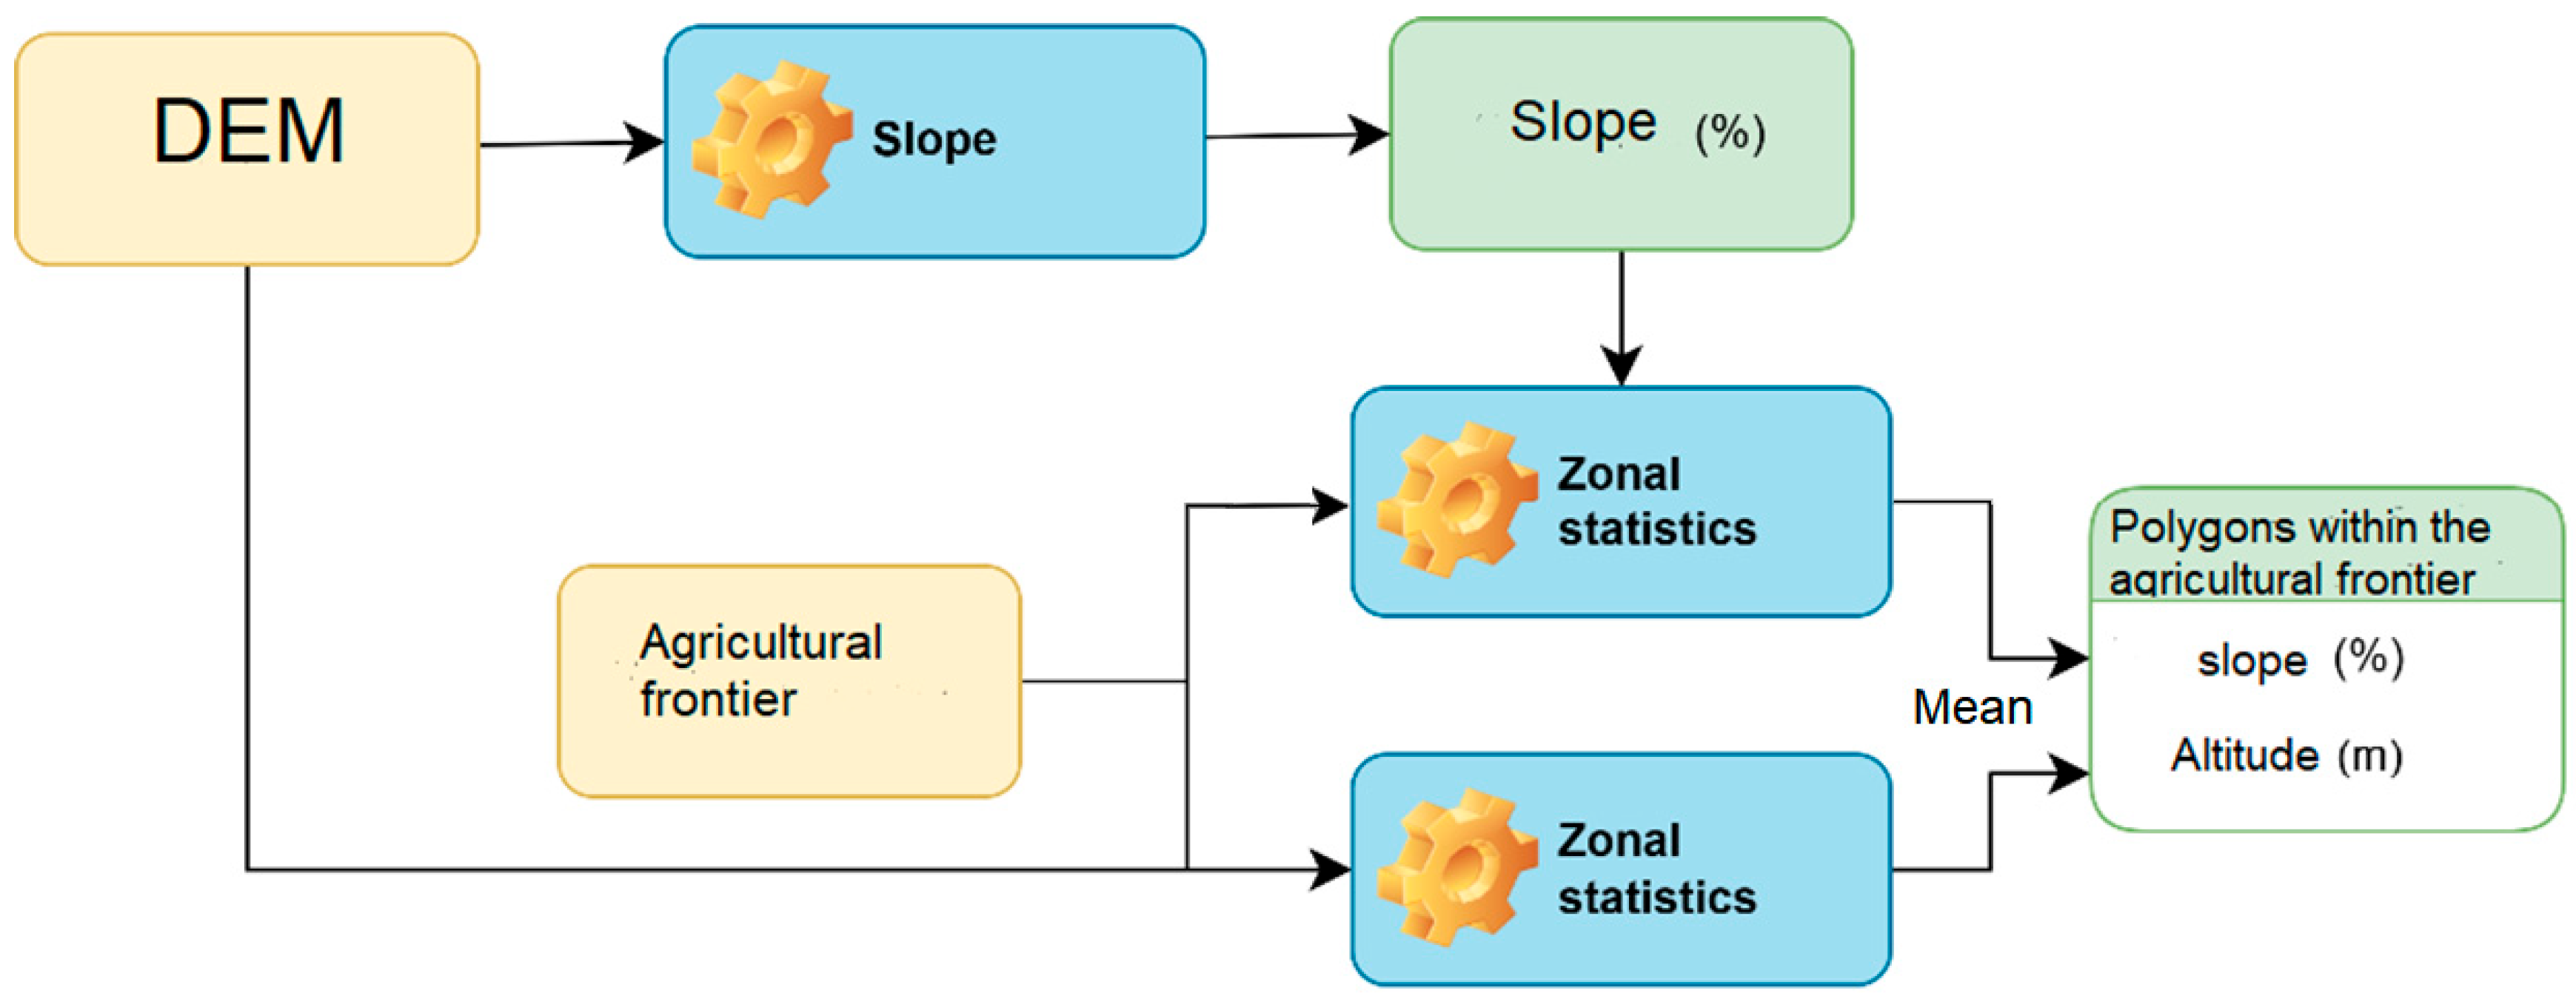
23]. The agricultural plots designated by the Ministry of Agriculture are typically flat or have minimal slopes. Therefore, the hill was no longer a significant factor in the calculation. However, the average slope per plot was calculated to confirm. The raster file, whose geographic coordinates (x, y) of each pixel contain the slope value, was calculated using the methodology outlined in
Figure 4 and the QGIS software. To obtain slope and altitude, zonal statistics were configured to calculate the mean of the pixels contained within each polygon. If the height above sea level is less than 600 m, then it is suitable for cotton cultivation.
2.3.3. Soils
The soil layer represents the main types of soil and their general characteristics. For this analysis, Series II at a 1:250000 scale was used [
25]]. Based on the soil layer and its attributes, the data were associated with each polygon within the Agricultural Frontier following the methodology illustrated in
Figure 5, using the QGIS version 3.36 software.
2.3.4. Calculating Distances Between GM Cotton Planting Polygons and Restriction Zones (PNAs and Wild Cotton Location Zones)
As mentioned above, wild cotton species are under some degree of risk according to NOM-059-SEMARNAT-2010 [
32], so they are subject to protection. One of the protection measures established by the Mexican authorities is the planting of GM cotton only in agricultural areas where the distribution of wild species listed in the SNIB is ruled out.
Cotton planting, including GM cotton, must comply with the sanitary control measures established in NOM-026-SAG/FITO-2014 [
12].
Distances to PNAs were calculated using the QGIS “shortest line between features” algorithm that determines the shortest distance between PNAs and the selected polygon within the Agricultural Frontier (see
Figure 6). If distance is greater than 1000 m, then it is suitable for cotton cultivation.
SNIB maps were processed in QGIS to obtain the distances between distribution maps and crop areas (see
Figure 7). If distance is greater than 1000 m, then it is suitable for cotton cultivation.
The ecoregions to which each polygon within the Agricultural Frontier belongs were derived using the QGIS “Join attributes by location” algorithm (see
Figure 8).
2.3.5. Basemaps Considered in the Geographic Information System
The basemap incorporates several information layers that provide context and facilitate the identification and location of agricultural areas. These layers include detailed geographic information essential for territorial planning and management.
Geostatistical framework [
54].
National Road Network [
55].
National topographic dataset at 1:250 000 scale [
56].
Hydrographic Network, 2nd edition [
58].
Main Dams.
2.3.6. Graphic Design of Productive Potential by Heat Units
Once the previous conditions have been evaluated, obtain the binary map, where one means that it meets the condition requested for each characteristic that defines the requirements for the AGM, and zero indicates that it does not meet. Through the evaluation of heat units, it is determined for each plot along the agricultural border whether genetically modified cotton cultivation is optimal or not.
Before developing the GIS, graphs were designed to evaluate the productive potential for each weather station located near the polygons (5 km × 5 km pixels) within the Agricultural Frontier. Each graph contains the daily temperature (maximum, minimum, mean) averaged from 1983 to 2020. In addition, it contains the accumulated heat units, precipitation, and base temperature, optimal temperature, and phenological phases of the cotton crop according to the DDD or AHU [
9]. This allows a detailed analysis of the average climatic conditions that prevail in each cultivation area, making it easier for the GIS user to analyze each agricultural area.
The programming of the planting date was based on 550 units of heat, an essential indicator for the start of the crop cycle.
For the design of each graph, a program was developed on the Jupyter Notebook platform with Python (attached as the
Supplementary File “Graficas.ipynb”). This program generates a graph for each station with the data mentioned above.
2.3.7. Geographic Information System (GIS)
All vector information was organized and systematized by specific topics within the geographic databases using the *.gpkg format. These tables were stored in SQLite 3.35.2 and the raster layers were saved in *.tif format.
The geographic information system (GIS) was constructed by integrating all these elements into QGIS 3.36. The databases are related in such a way that specific information can be consulted for each polygon within the Agricultural Frontier, including climate, PNAs, ecoregions, soils, Indigenous localities, data from the 2020 population census, historical production data by municipality, and distribution of nearby wild species, among other characteristics.
The process of obtaining potential areas consisted of determining, for each polygon within the Agricultural Frontier, historical values of precipitation, minimum, maximum, and mean temperatures, and heat units; in addition, the downloaded databases were used to estimate the distance between polygons and ecoregions, Protected Natural Areas, State Protected Natural Areas, and wild Gossypium hirsutum.
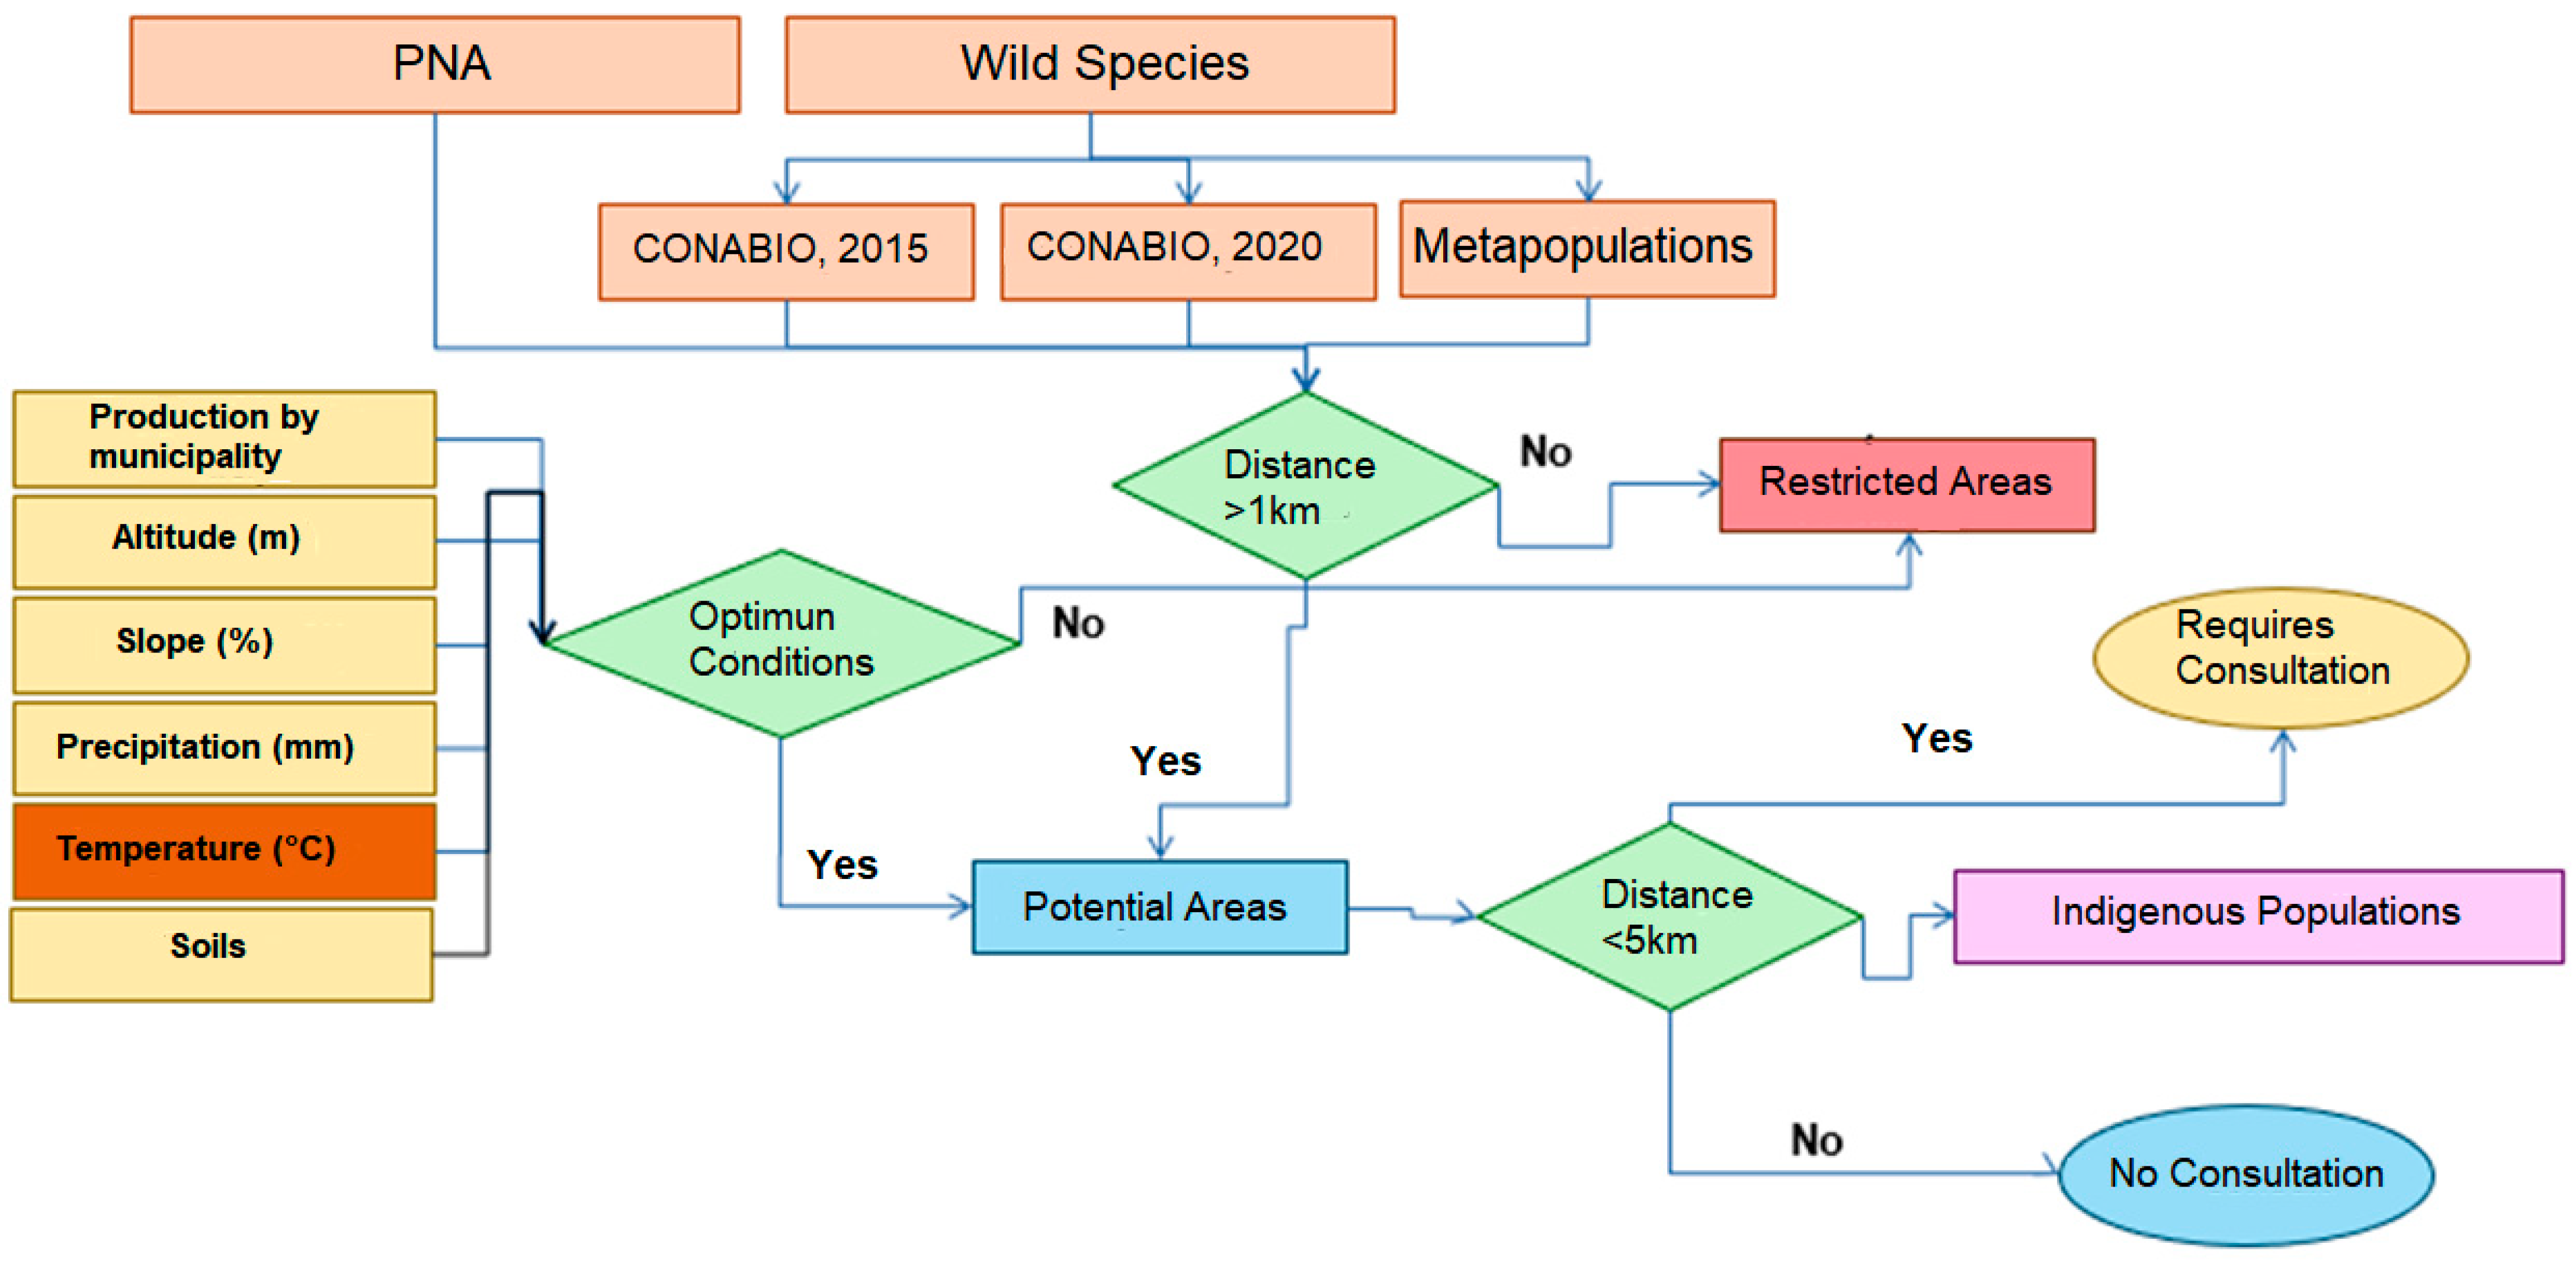
Potential areas were defined using the polygons within the Agricultural Frontier; the spatial information estimated above was accessed and compared with the optimal conditions for cotton development in crops. If the conditions did not meet the optimal needs, that area was discarded and classified as restricted; conversely, if the conditions were met, the areas were classified as potential. To comply with current Mexican regulations, these potential areas were subjected to two screens. The first screen verified whether they are located at a distance greater than one kilometer from PNAs and locations of wild species; if an area does not comply with this restriction, it is shifted from potential to restricted. The regions that passed the first screen (as potential) are now subjected to a second screen, which verified that these areas are separated by a distance greater than five kilometers from any Indigenous people; if this requirement is not met, the region can be considered potential provided that the authorities of the Indigenous peoples are consulted (see
Figure 9 and
Table 2).
2.4. Validation of Optimal Areas
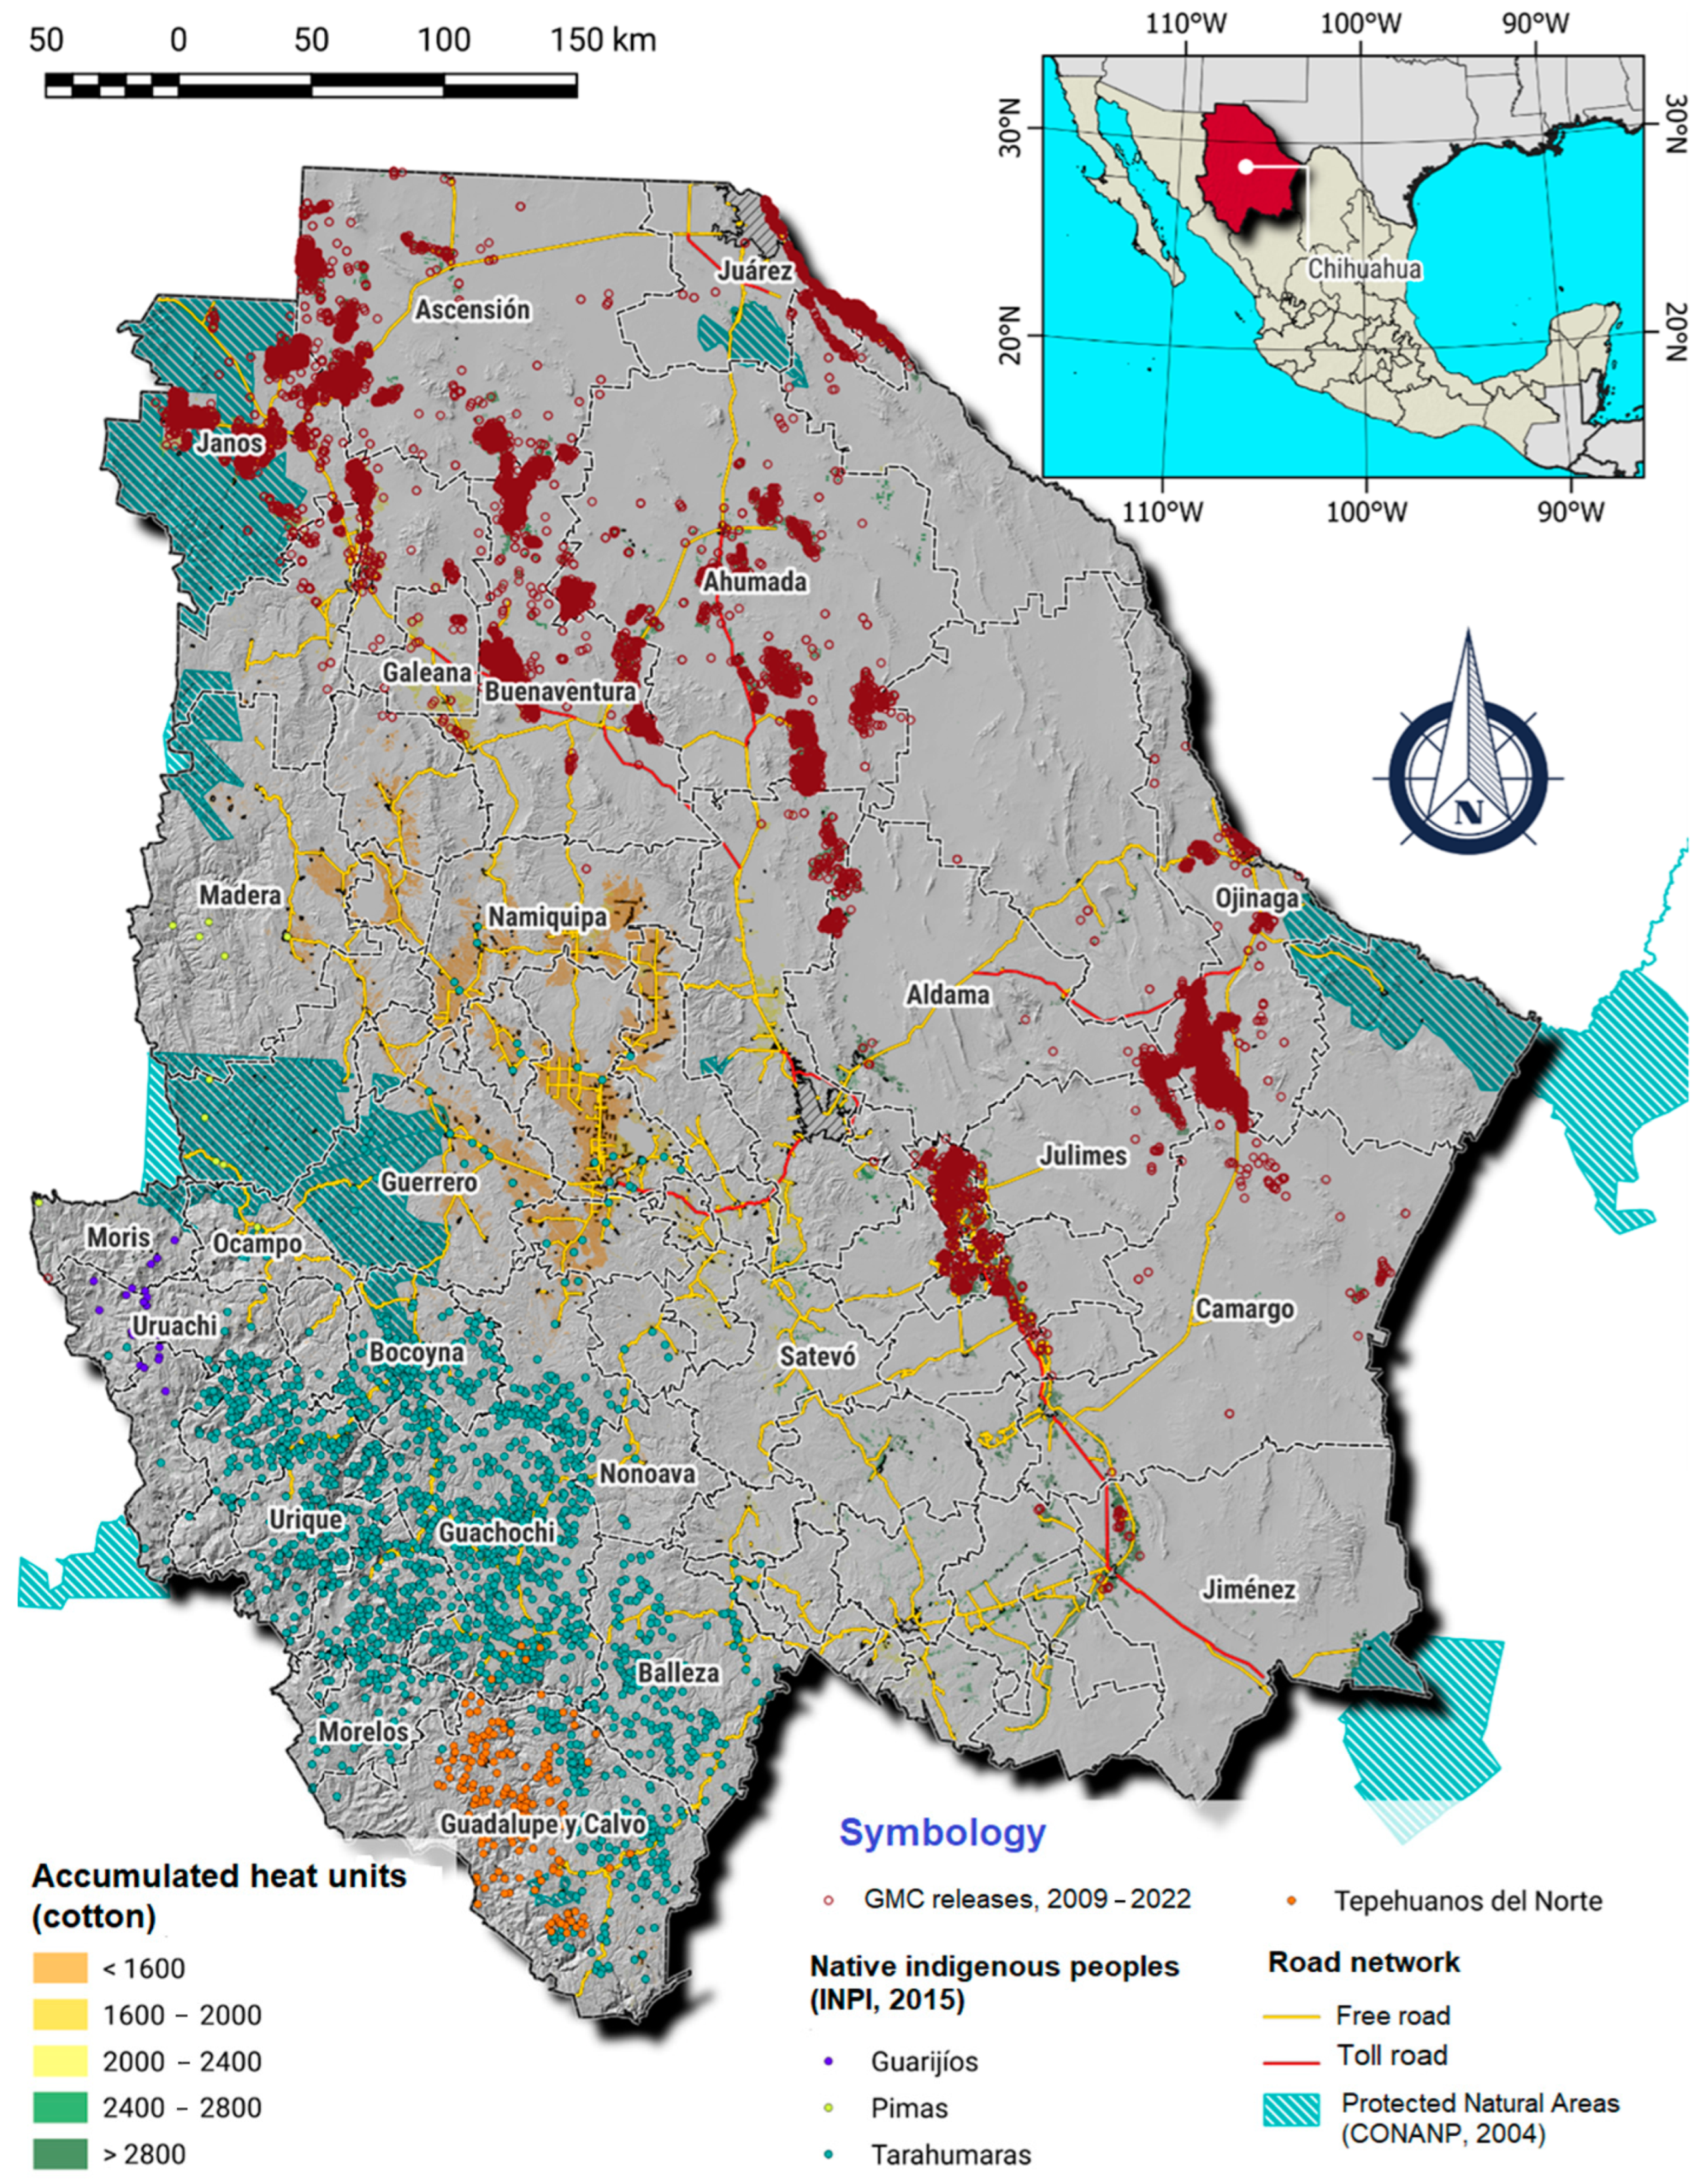
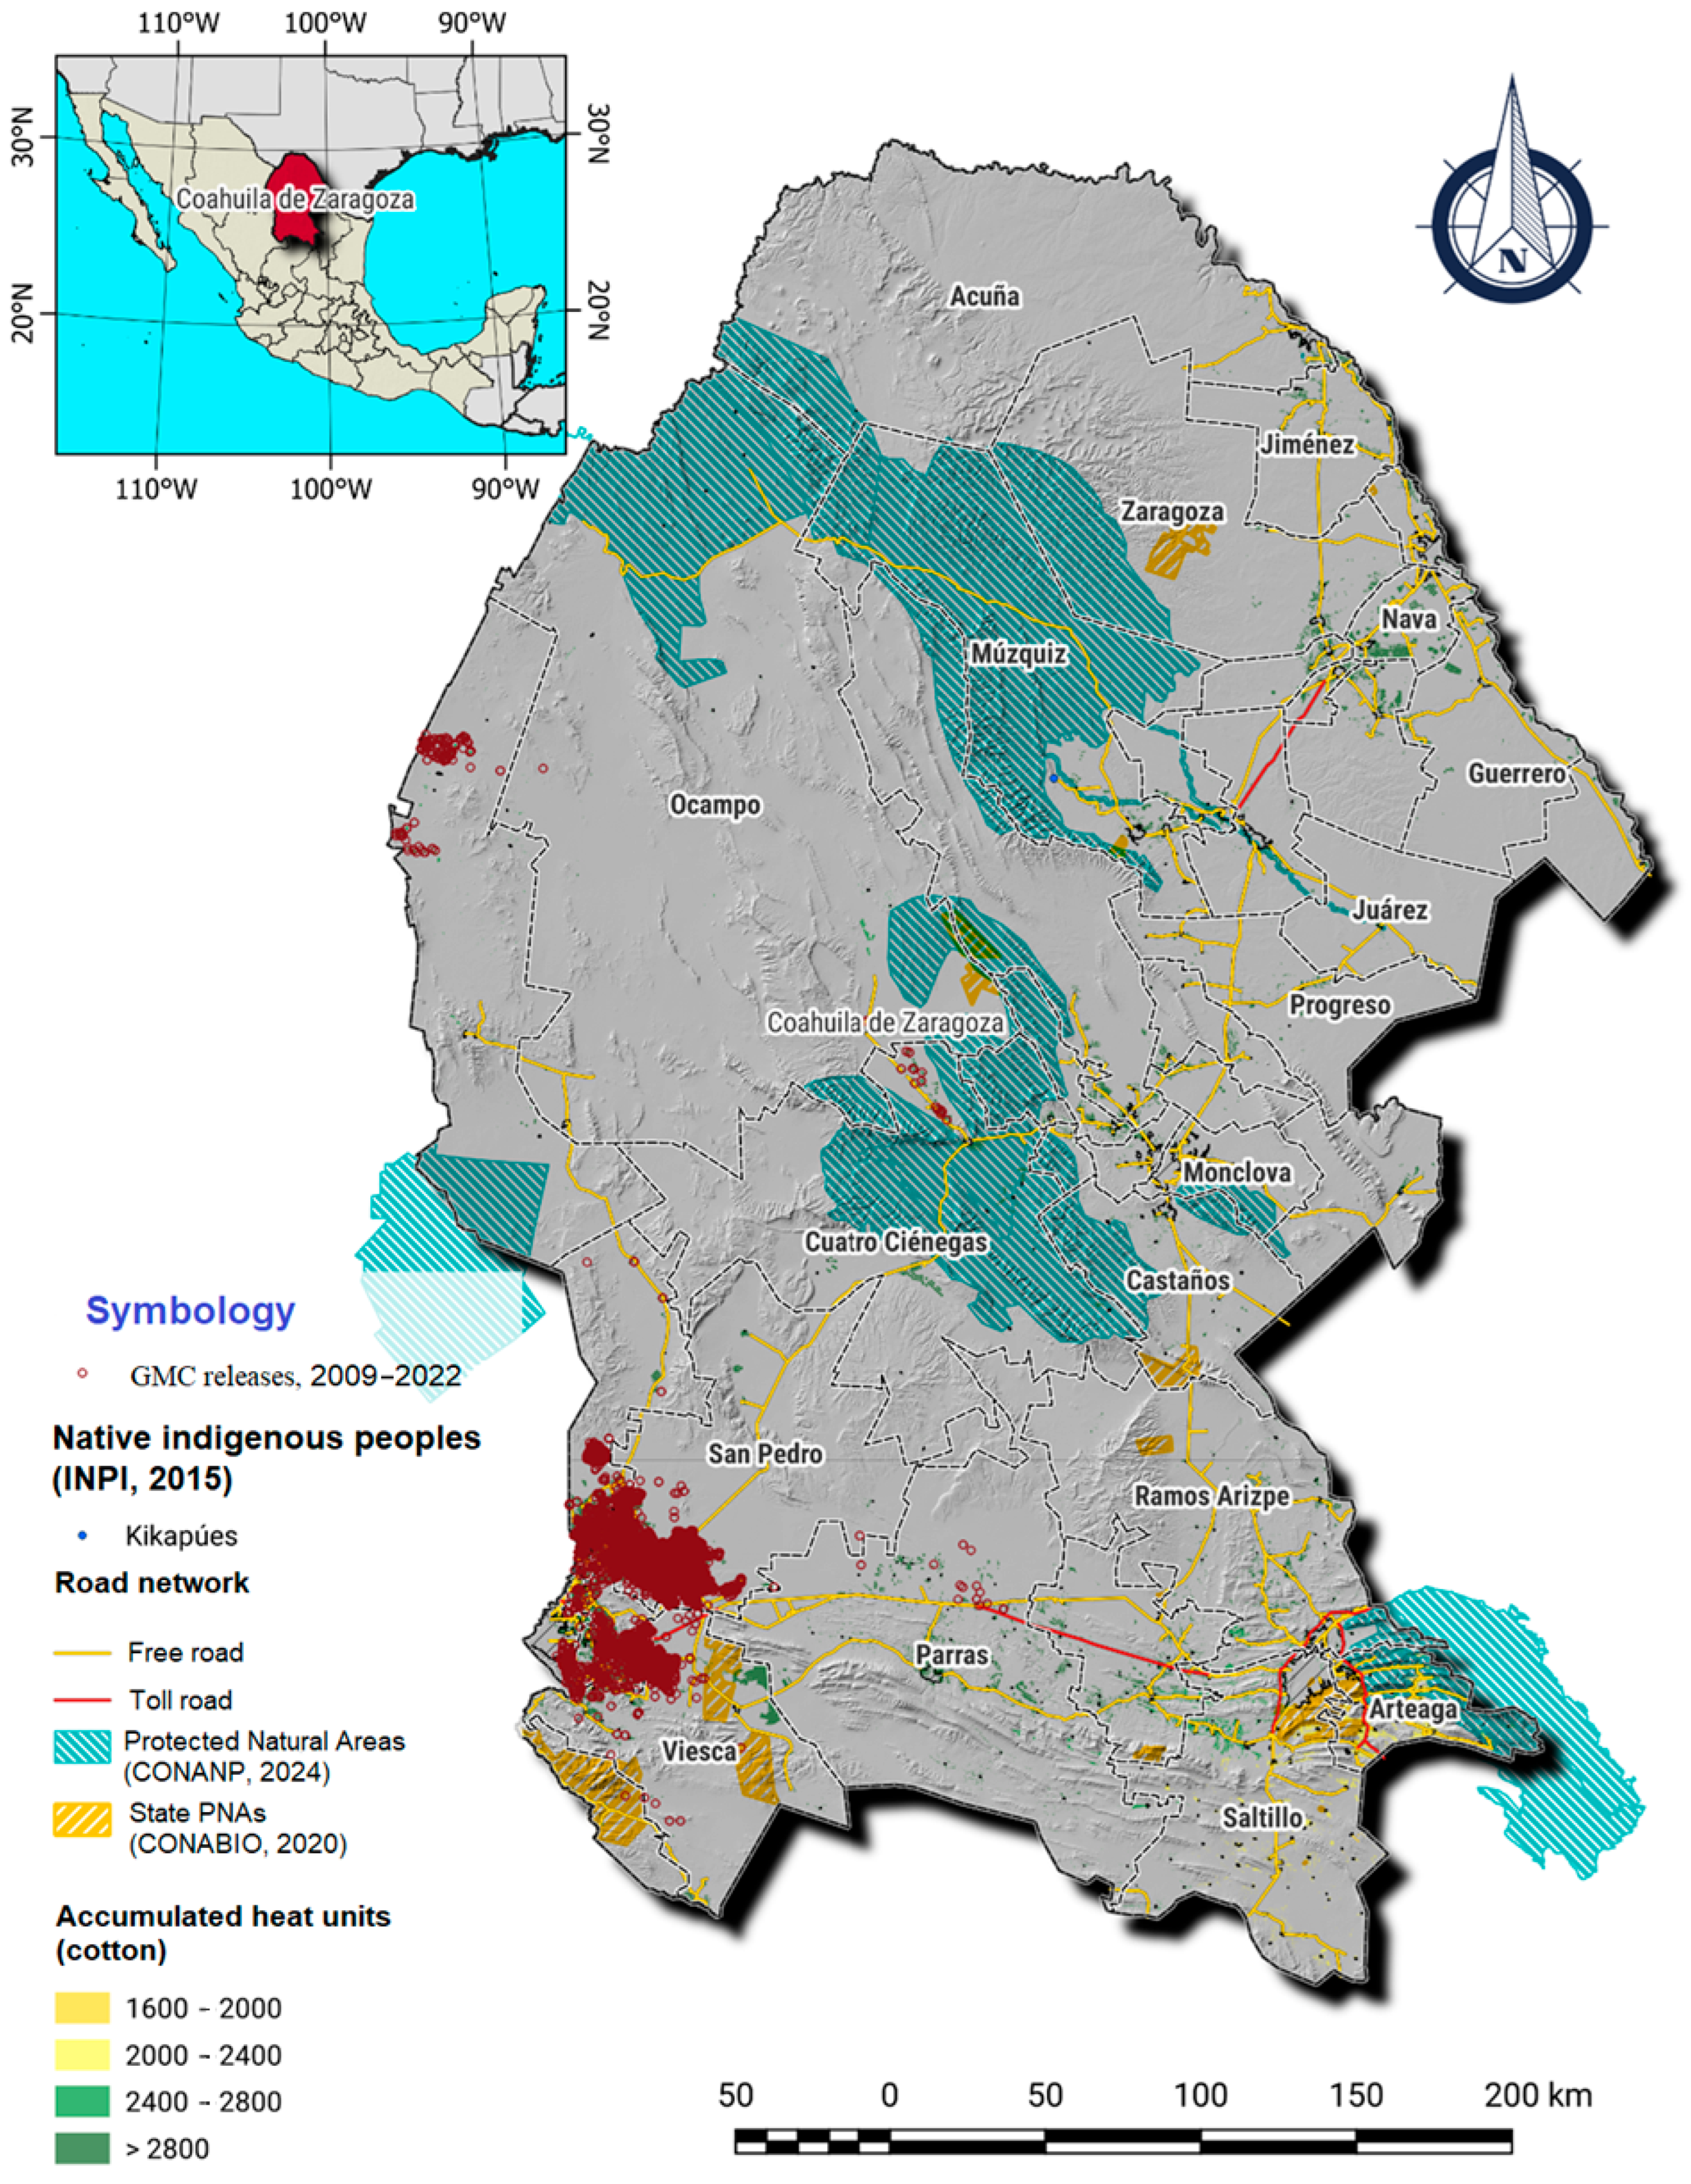
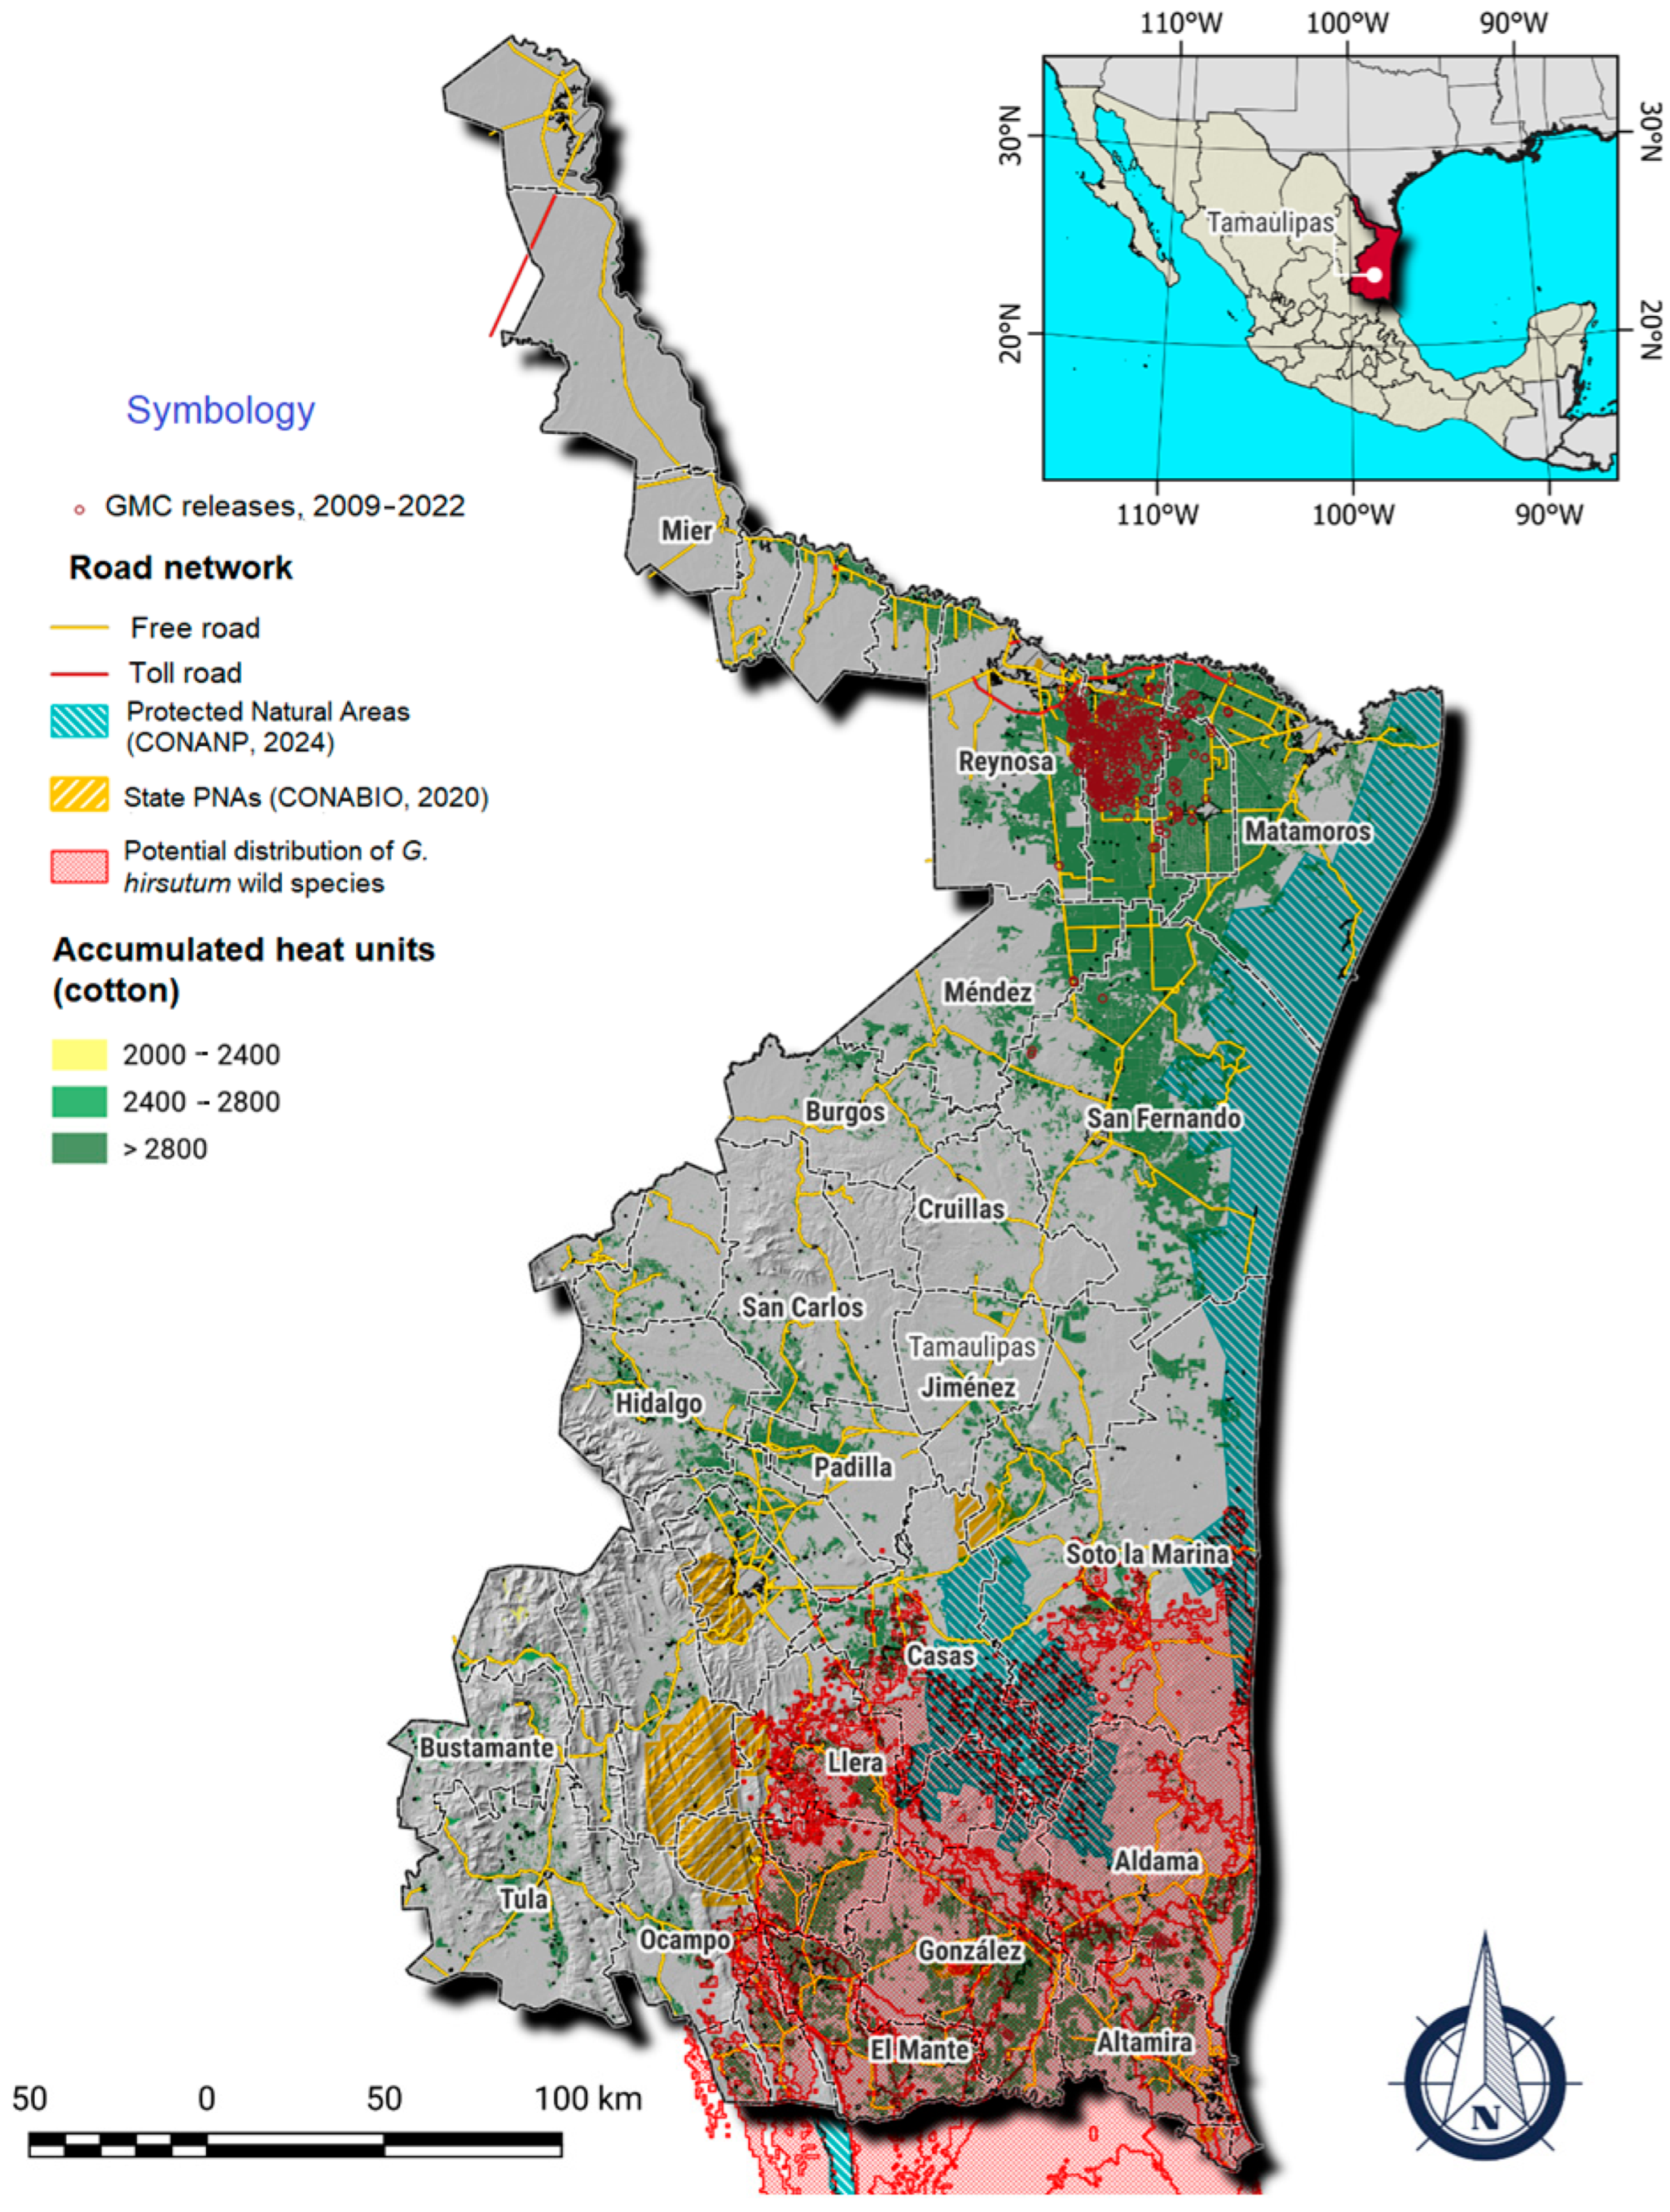
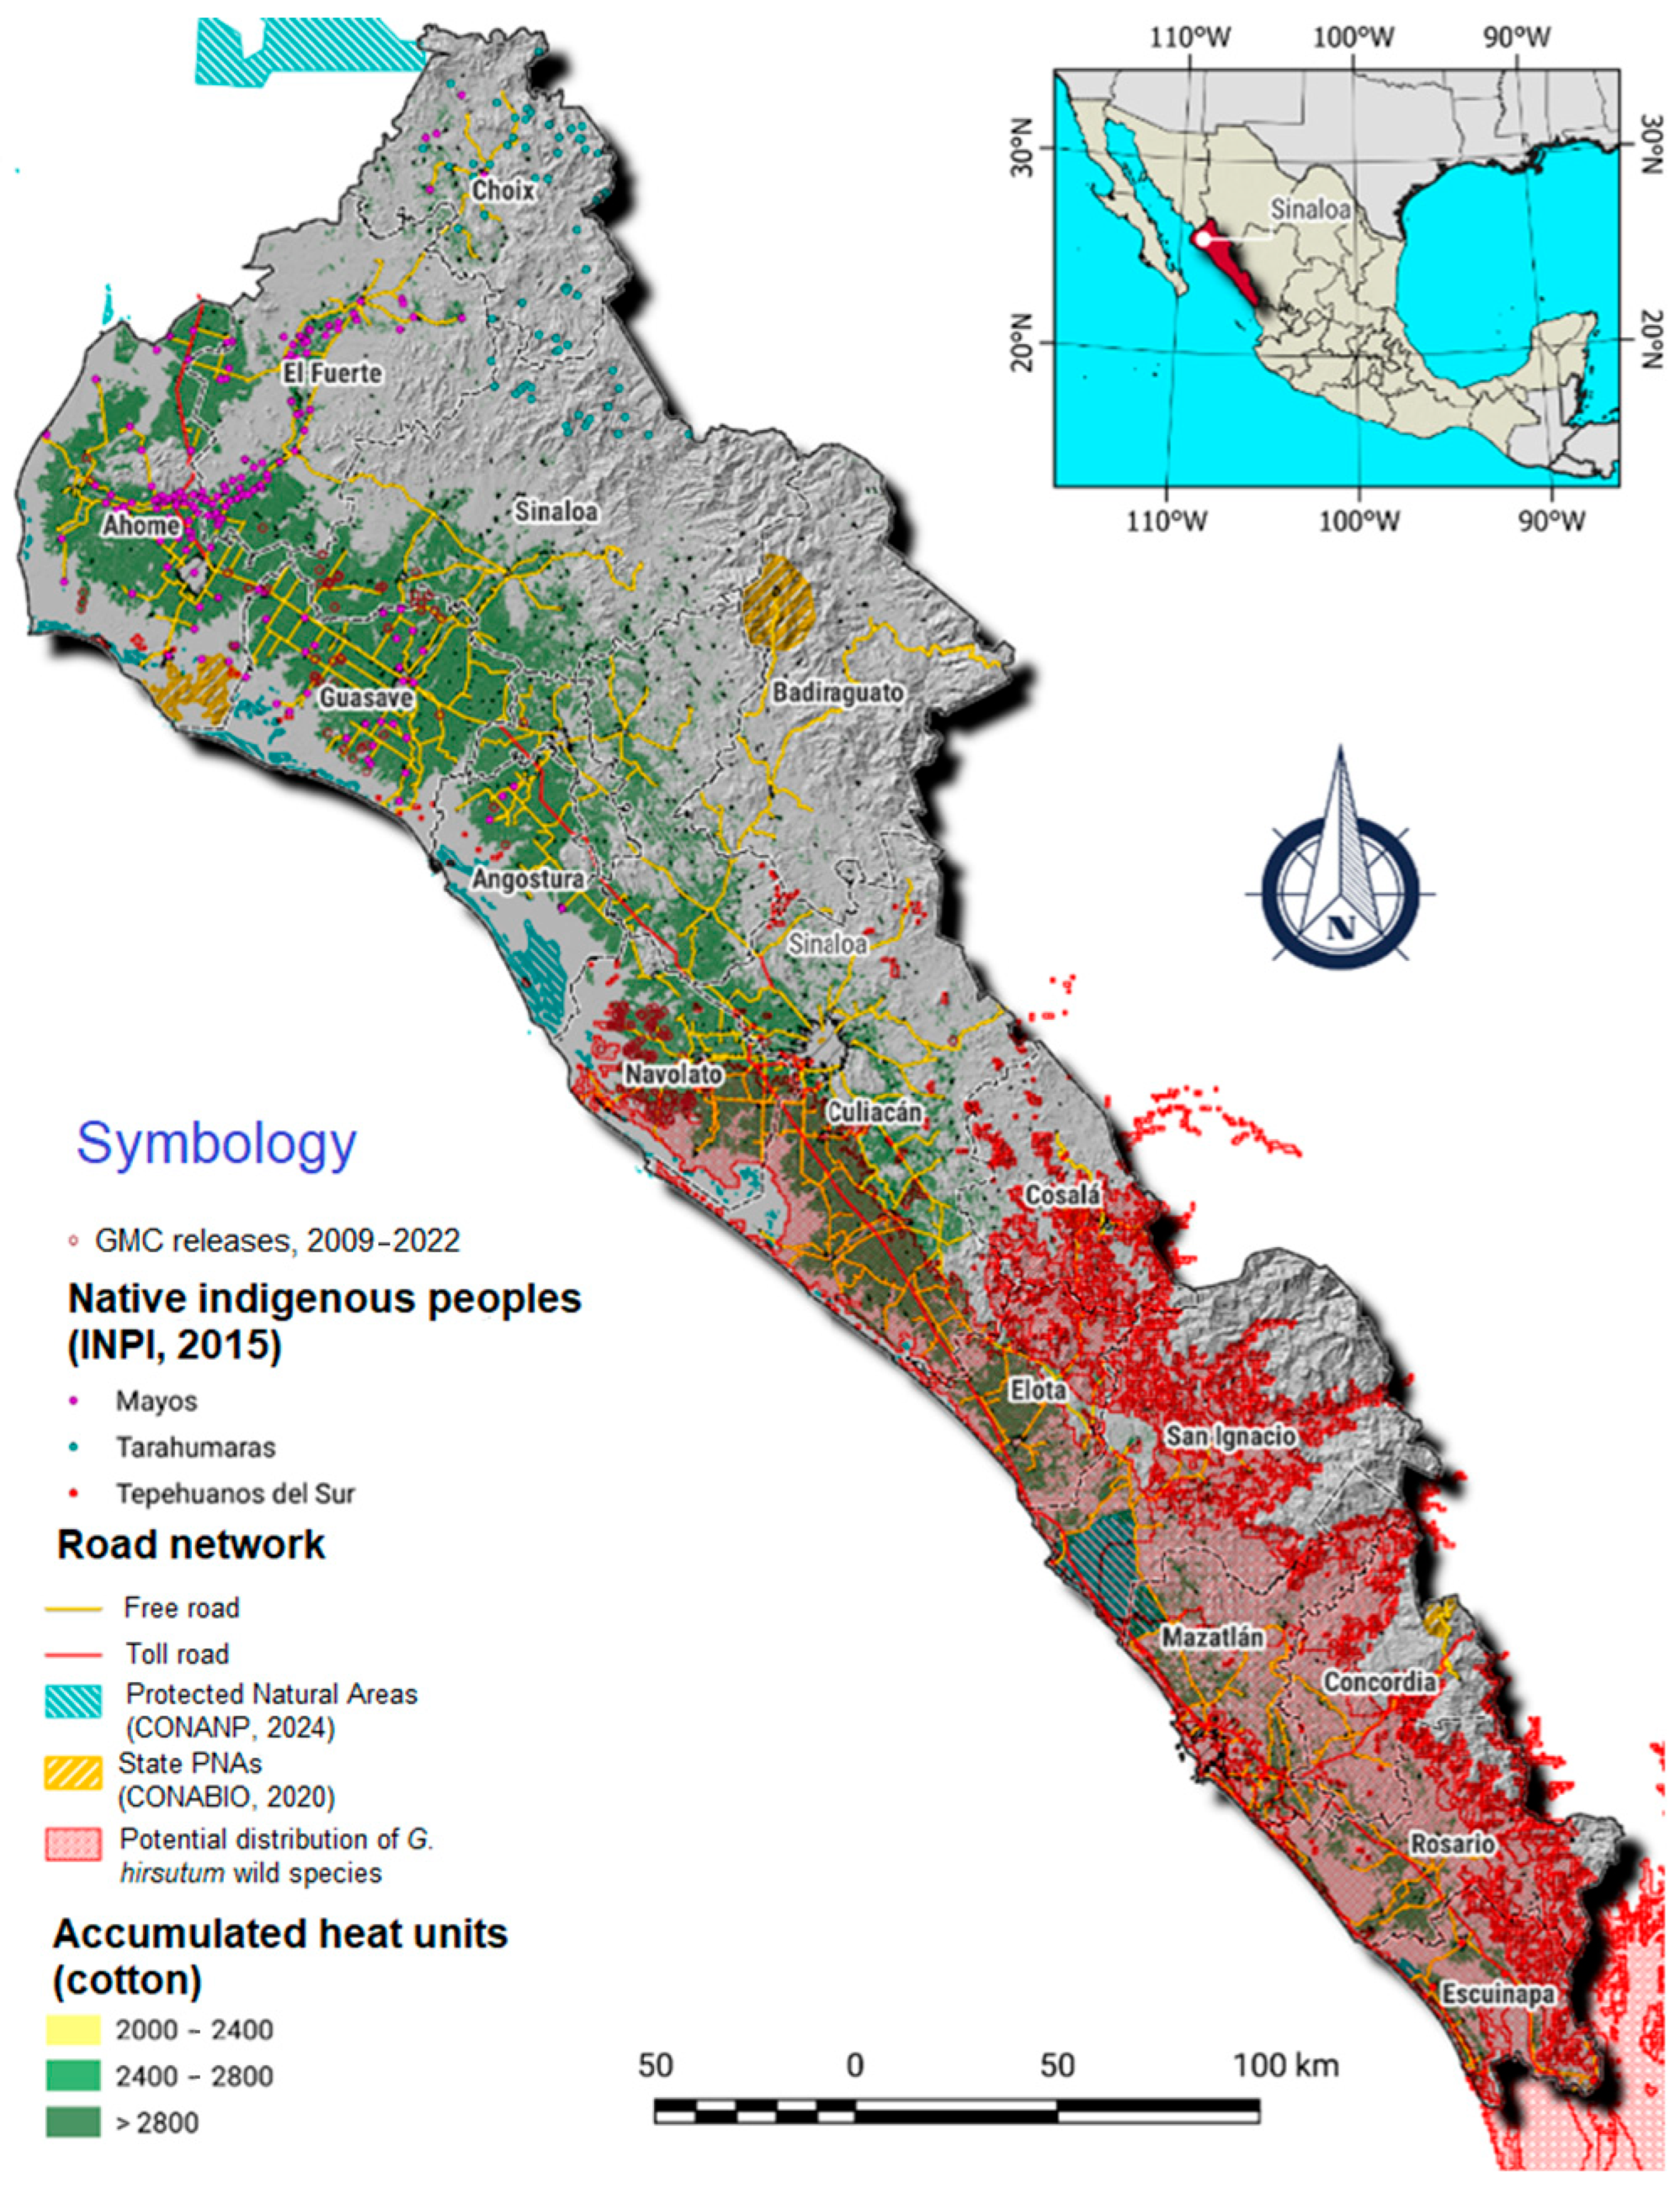
Once the maps of optimal areas for cotton cultivation were determined, the areas classified as potential were compared with the agricultural areas currently cultivated with GM cotton in Mexico [
26], superimposing the areas to assess the degree of overlap. The SIAP layers were also superimposed with mean cotton production data in Mexico, by municipality, yield, and production volume layers, recording a high overlap between the polygons determined as optimal areas and those with the highest yield.
3. Results
The geographic information system resulting from this research allows for identifying the agricultural areas potentially suitable for planting genetically modified cotton in the cotton-production states of Mexico, namely Chihuahua, Coahuila, Sonora, Sinaloa, Tamaulipas, Durango, and Baja California, based on agroclimatic and environmental conditions that are compatible with the biosafety regulations in Mexico (NOM-059-SEMARNAT-2010 and NOM-026-SAG/FITO-2014).
Figure 10 shows the distribution of the main types of soil in the Agricultural Frontier of Mexico, where most soils are Vertisol type, which has between 30% and 90% clay in all horizons up to a depth of 50 cm [
59].
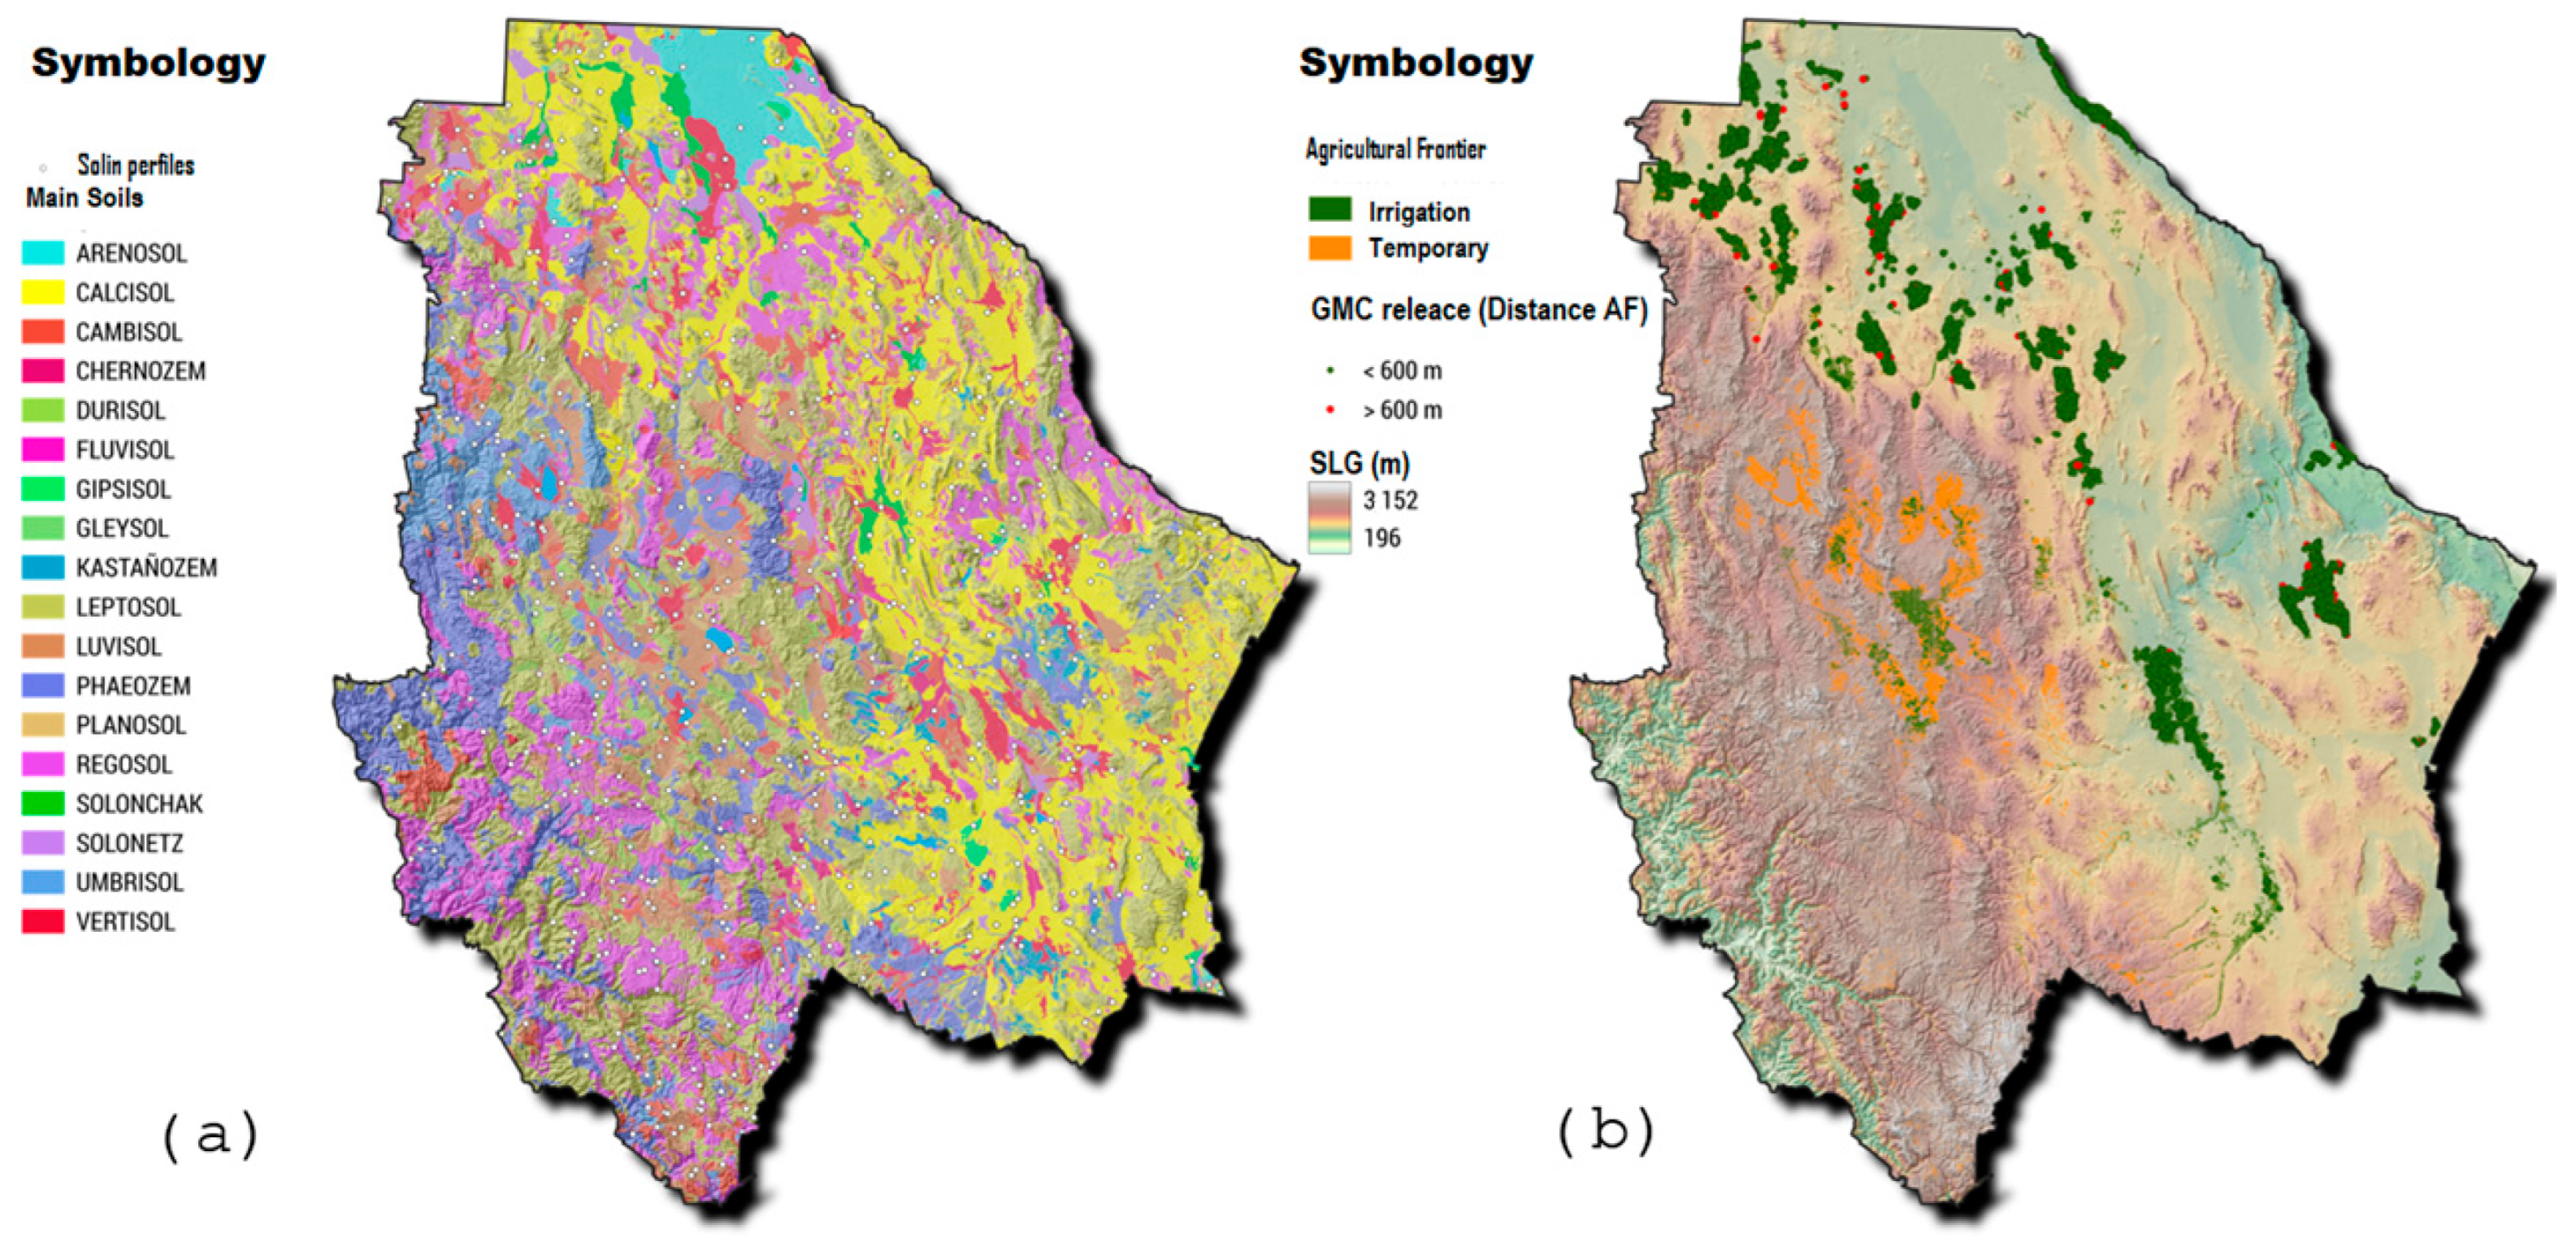
Figure 11a shows the distribution of the soils of the state of Chihuahua, Mexico, and
Figure 11b shows the distribution of the agricultural border.
The GIS allows for consulting and identifying whether the plot is located in an optimal area for planting GM cotton for each pixel within the Agricultural Frontier. When the plot is optimal for cotton cultivation, sowing and harvest dates can also be estimated, among other characteristics, as detailed below.
3.1. GIS Queries on Polygons Within the Agricultural Frontier
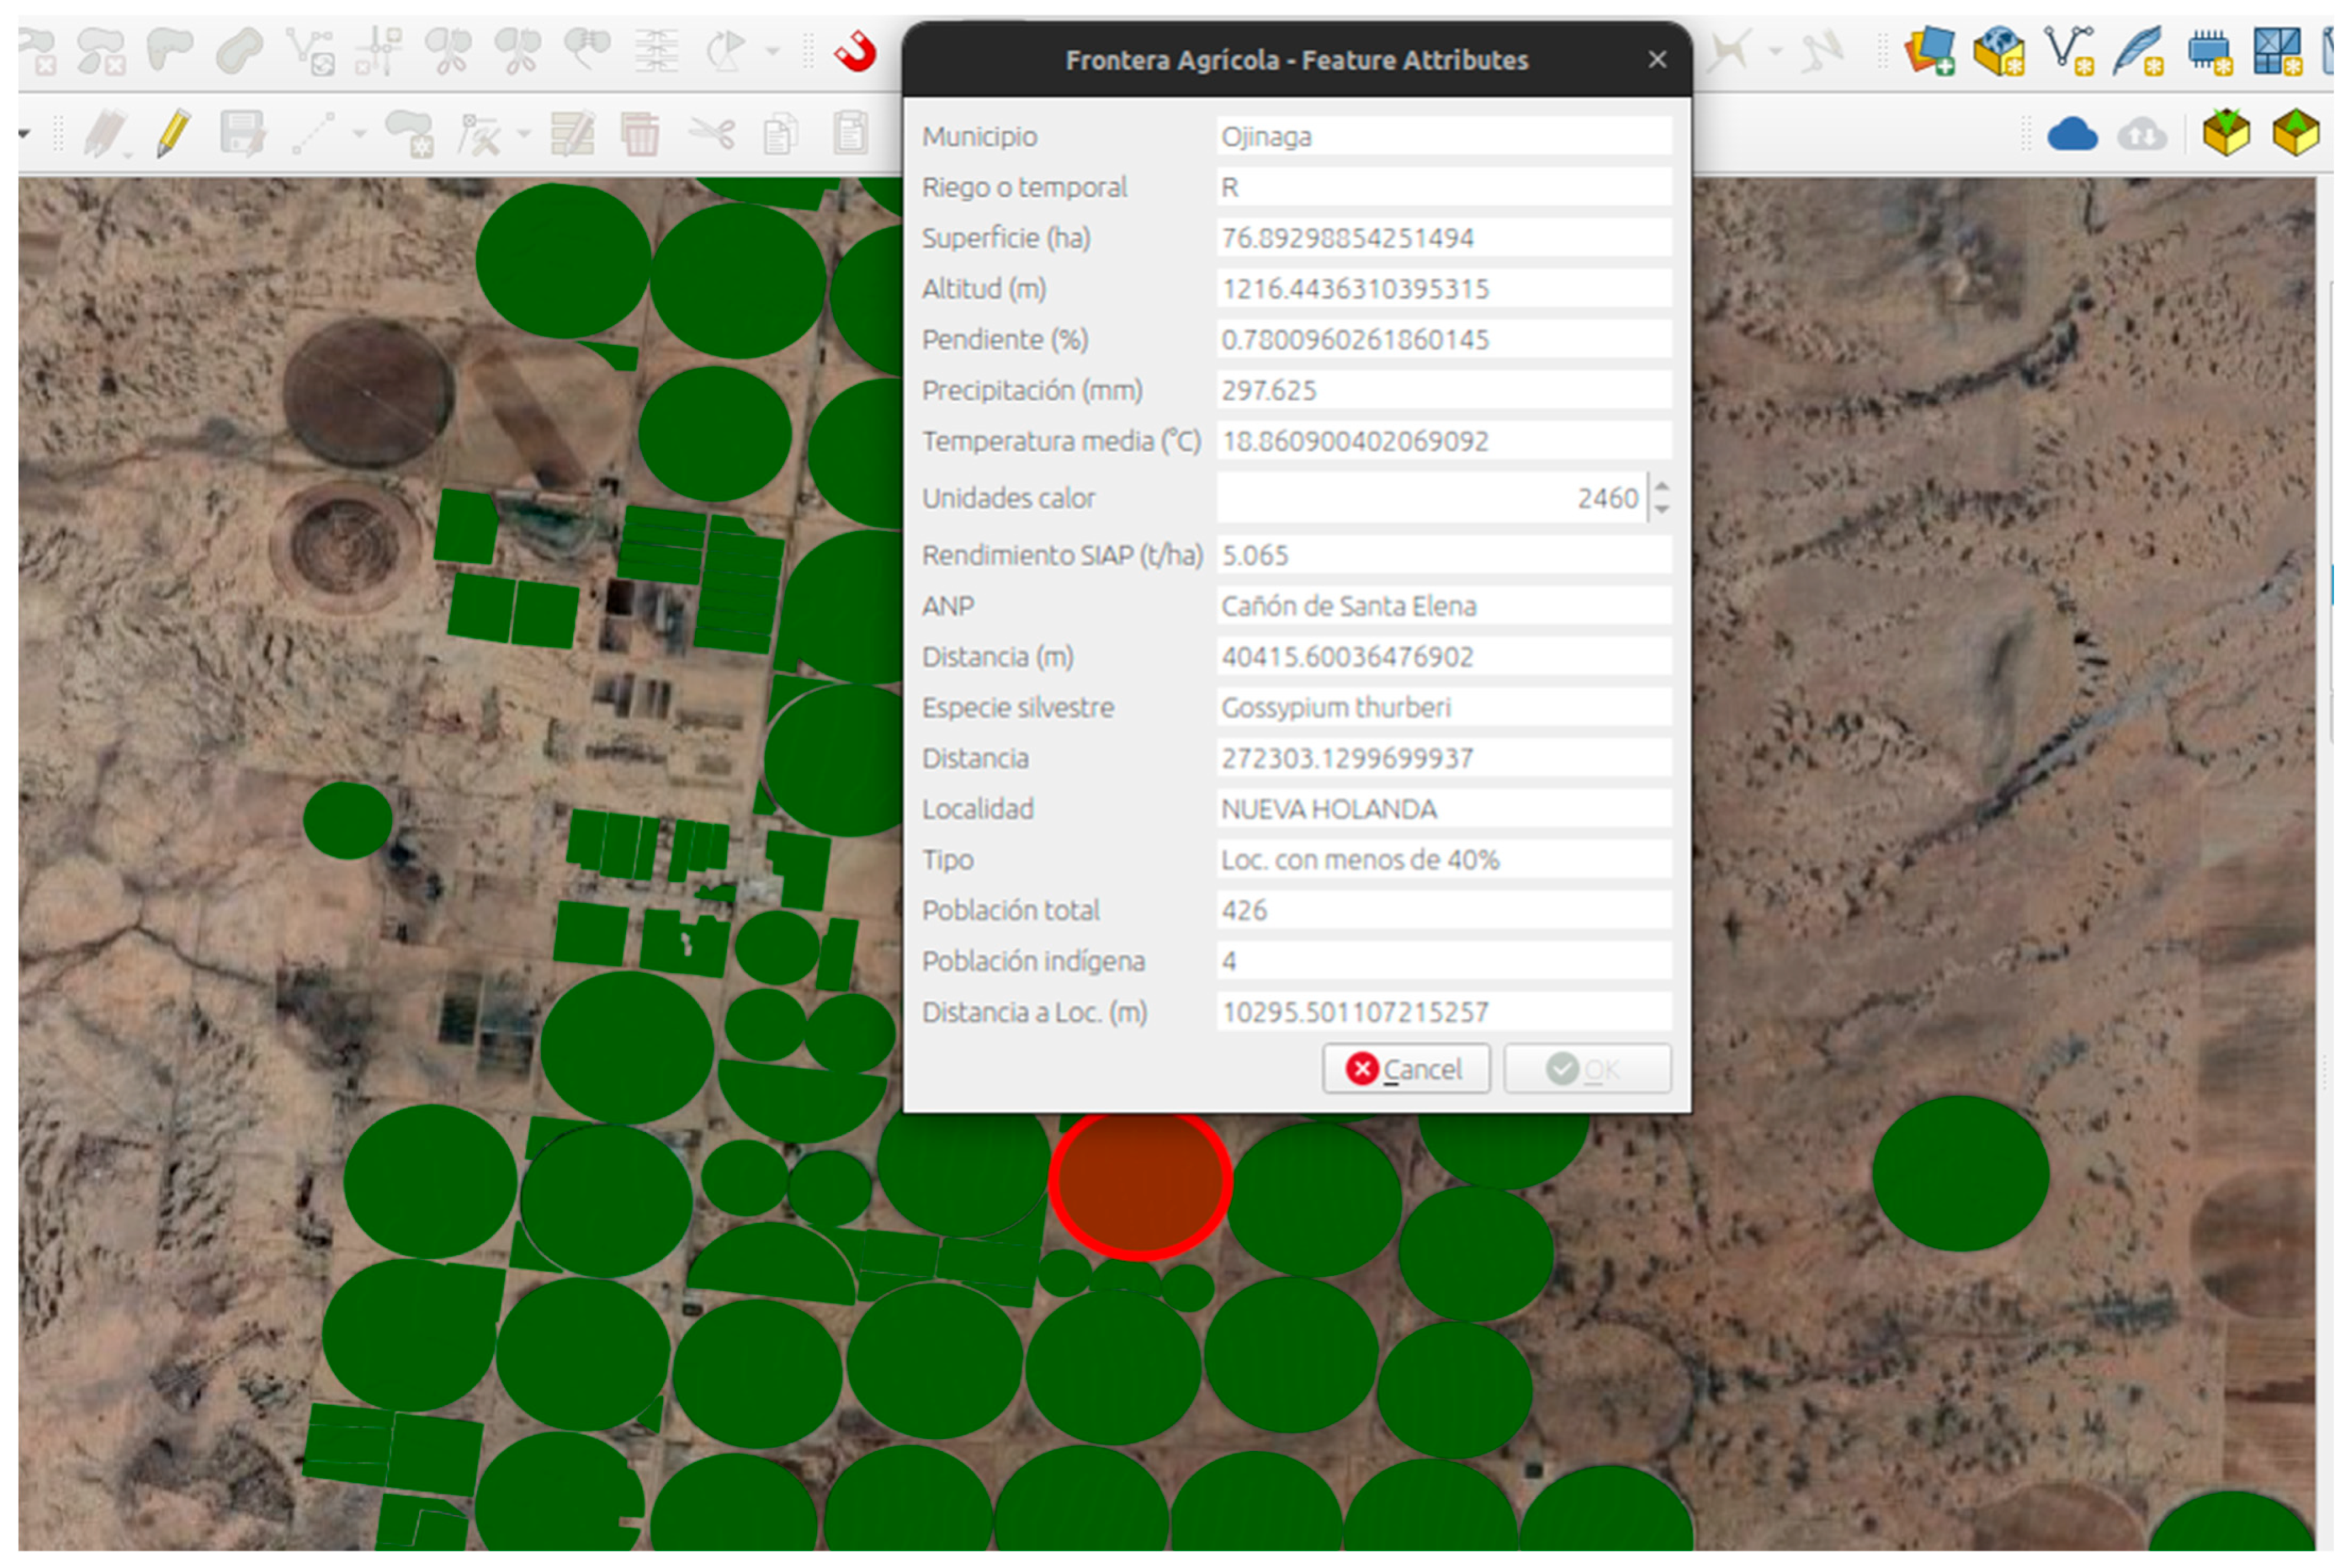
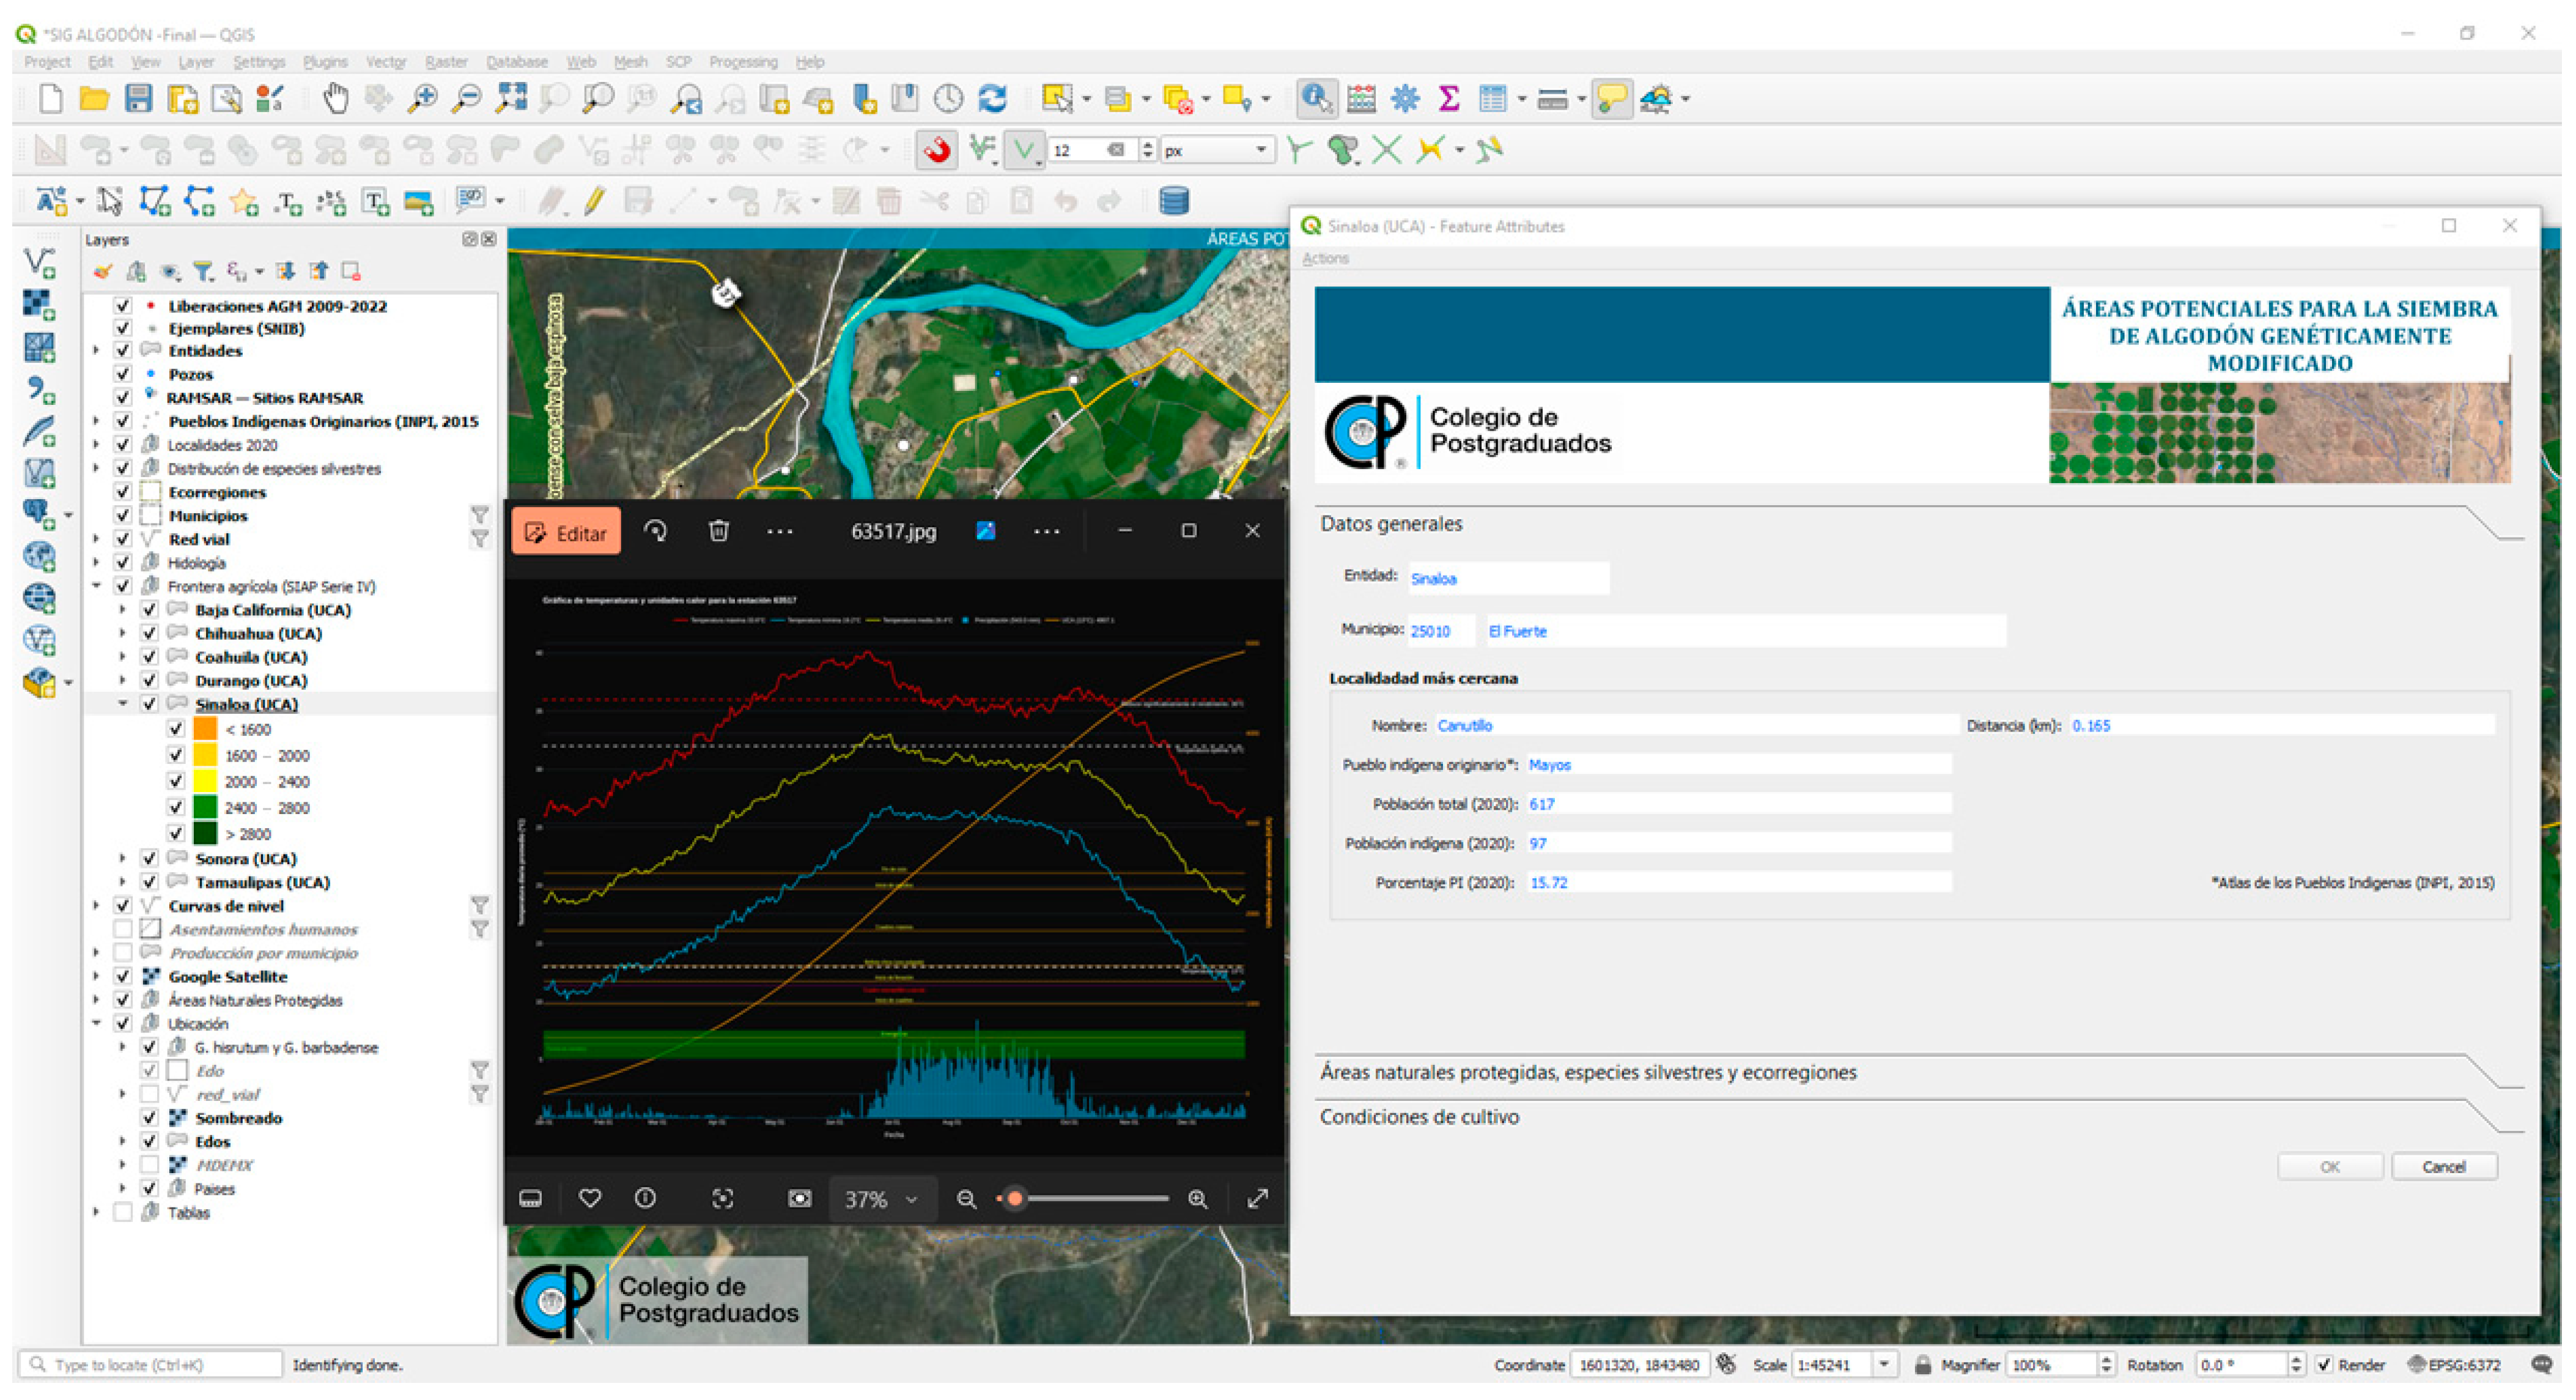
To consult the information in the GIS, select “Agricultural Frontier (SIAP Series IV)” in the layer window and then click on the polygon of interest; this will display a form with the associated information.
Figure 12 shows the polygons of the agricultural border in green and the selected polygon in red. Therefore, the attributes of the superimposed quadrant belong to that polygon.
The information in this form is organized into four main sections: (1) General Data; (2) Protected Natural Areas, Wild Species, and Ecoregions; (3) Cultivation Conditions; and (4) Temperature Graph and Heat Units by Season (~5 km2 pixels).
For each agricultural plot in the “
Agricultural Frontier” layer,
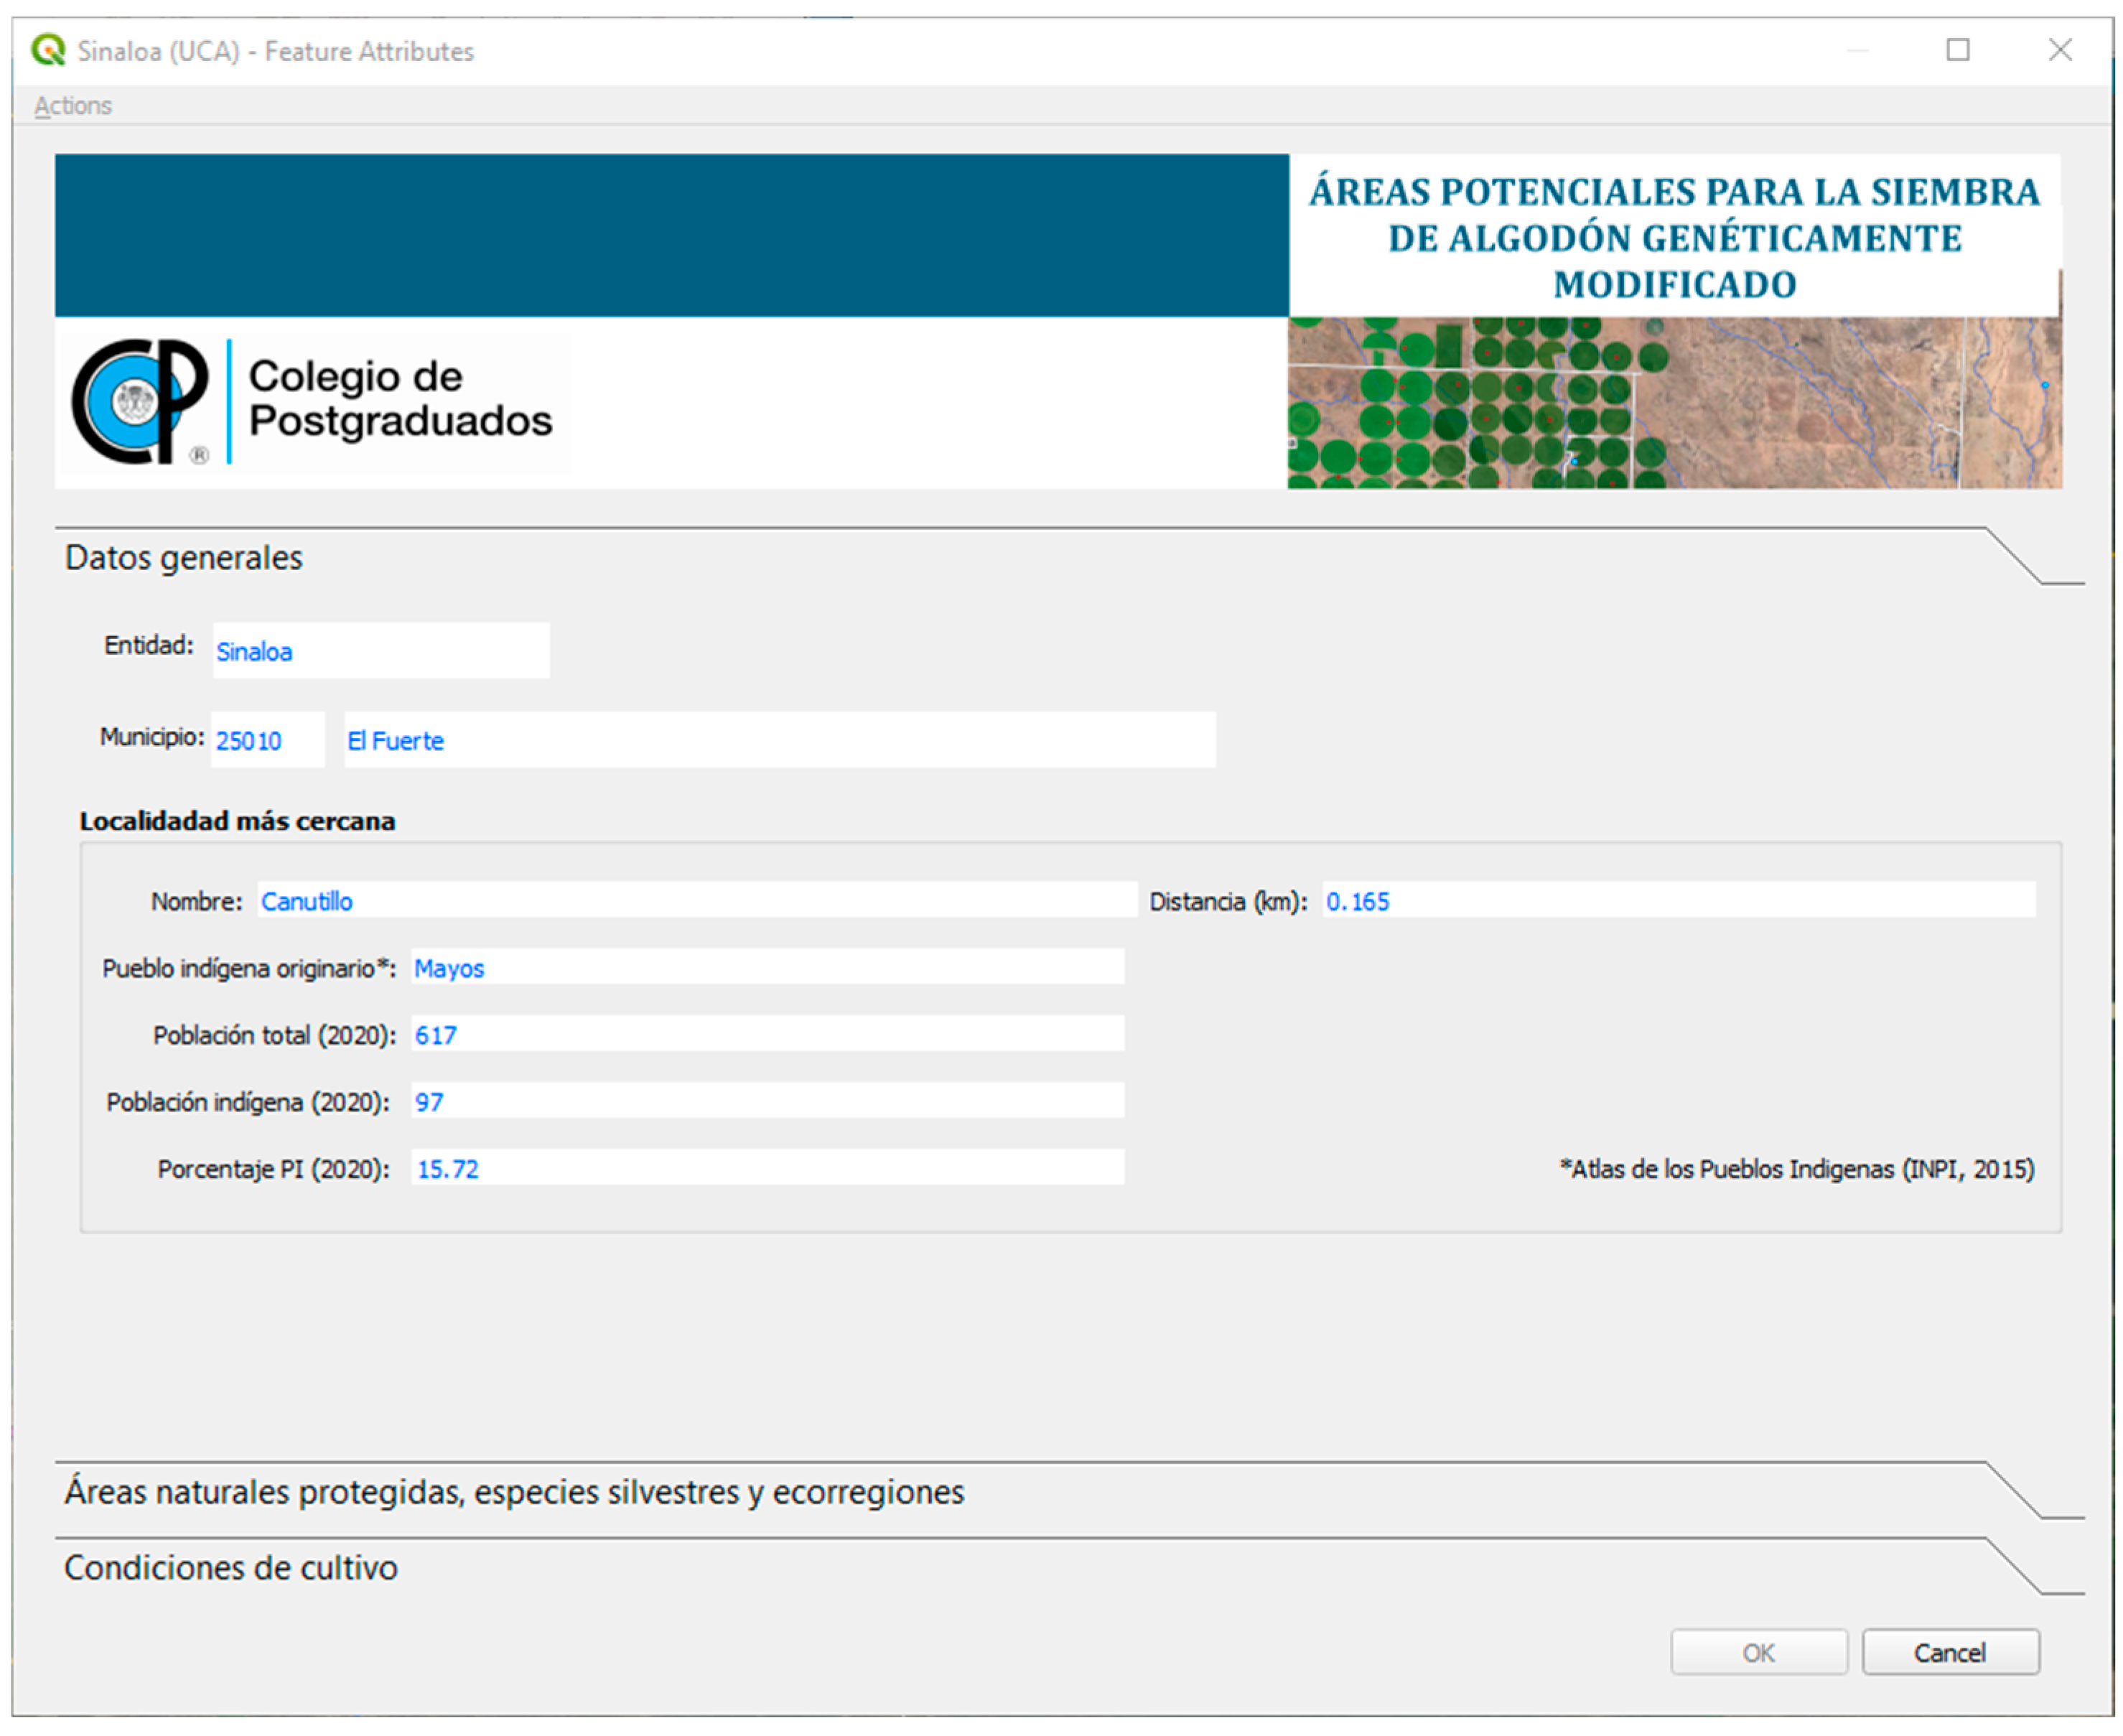
Section 1,
General Data shows the information regarding the location (state, municipality, nearest town, distance to the plot [in km], total population, presence of a native Indigenous town nearby, and its population). See
Figure 13 and
Figure 14.
Section 2,
Protected Natural Areas, Wild Species,
and Ecoregions, contains information on the ecoregion to which the plot belongs (ecoregions classified by levels). The PNAs that are presented correspond to the 2024 CONANP and CONABIO databases. In both layers, the nearest PNA, its management category, and the distance to the plot (in km) are shown, as well as the distance to zones with potential distribution of wild
Gossypium hirsutum (information from CONABIO, grown in 2020 and grown in 2015). See
Figure 15.
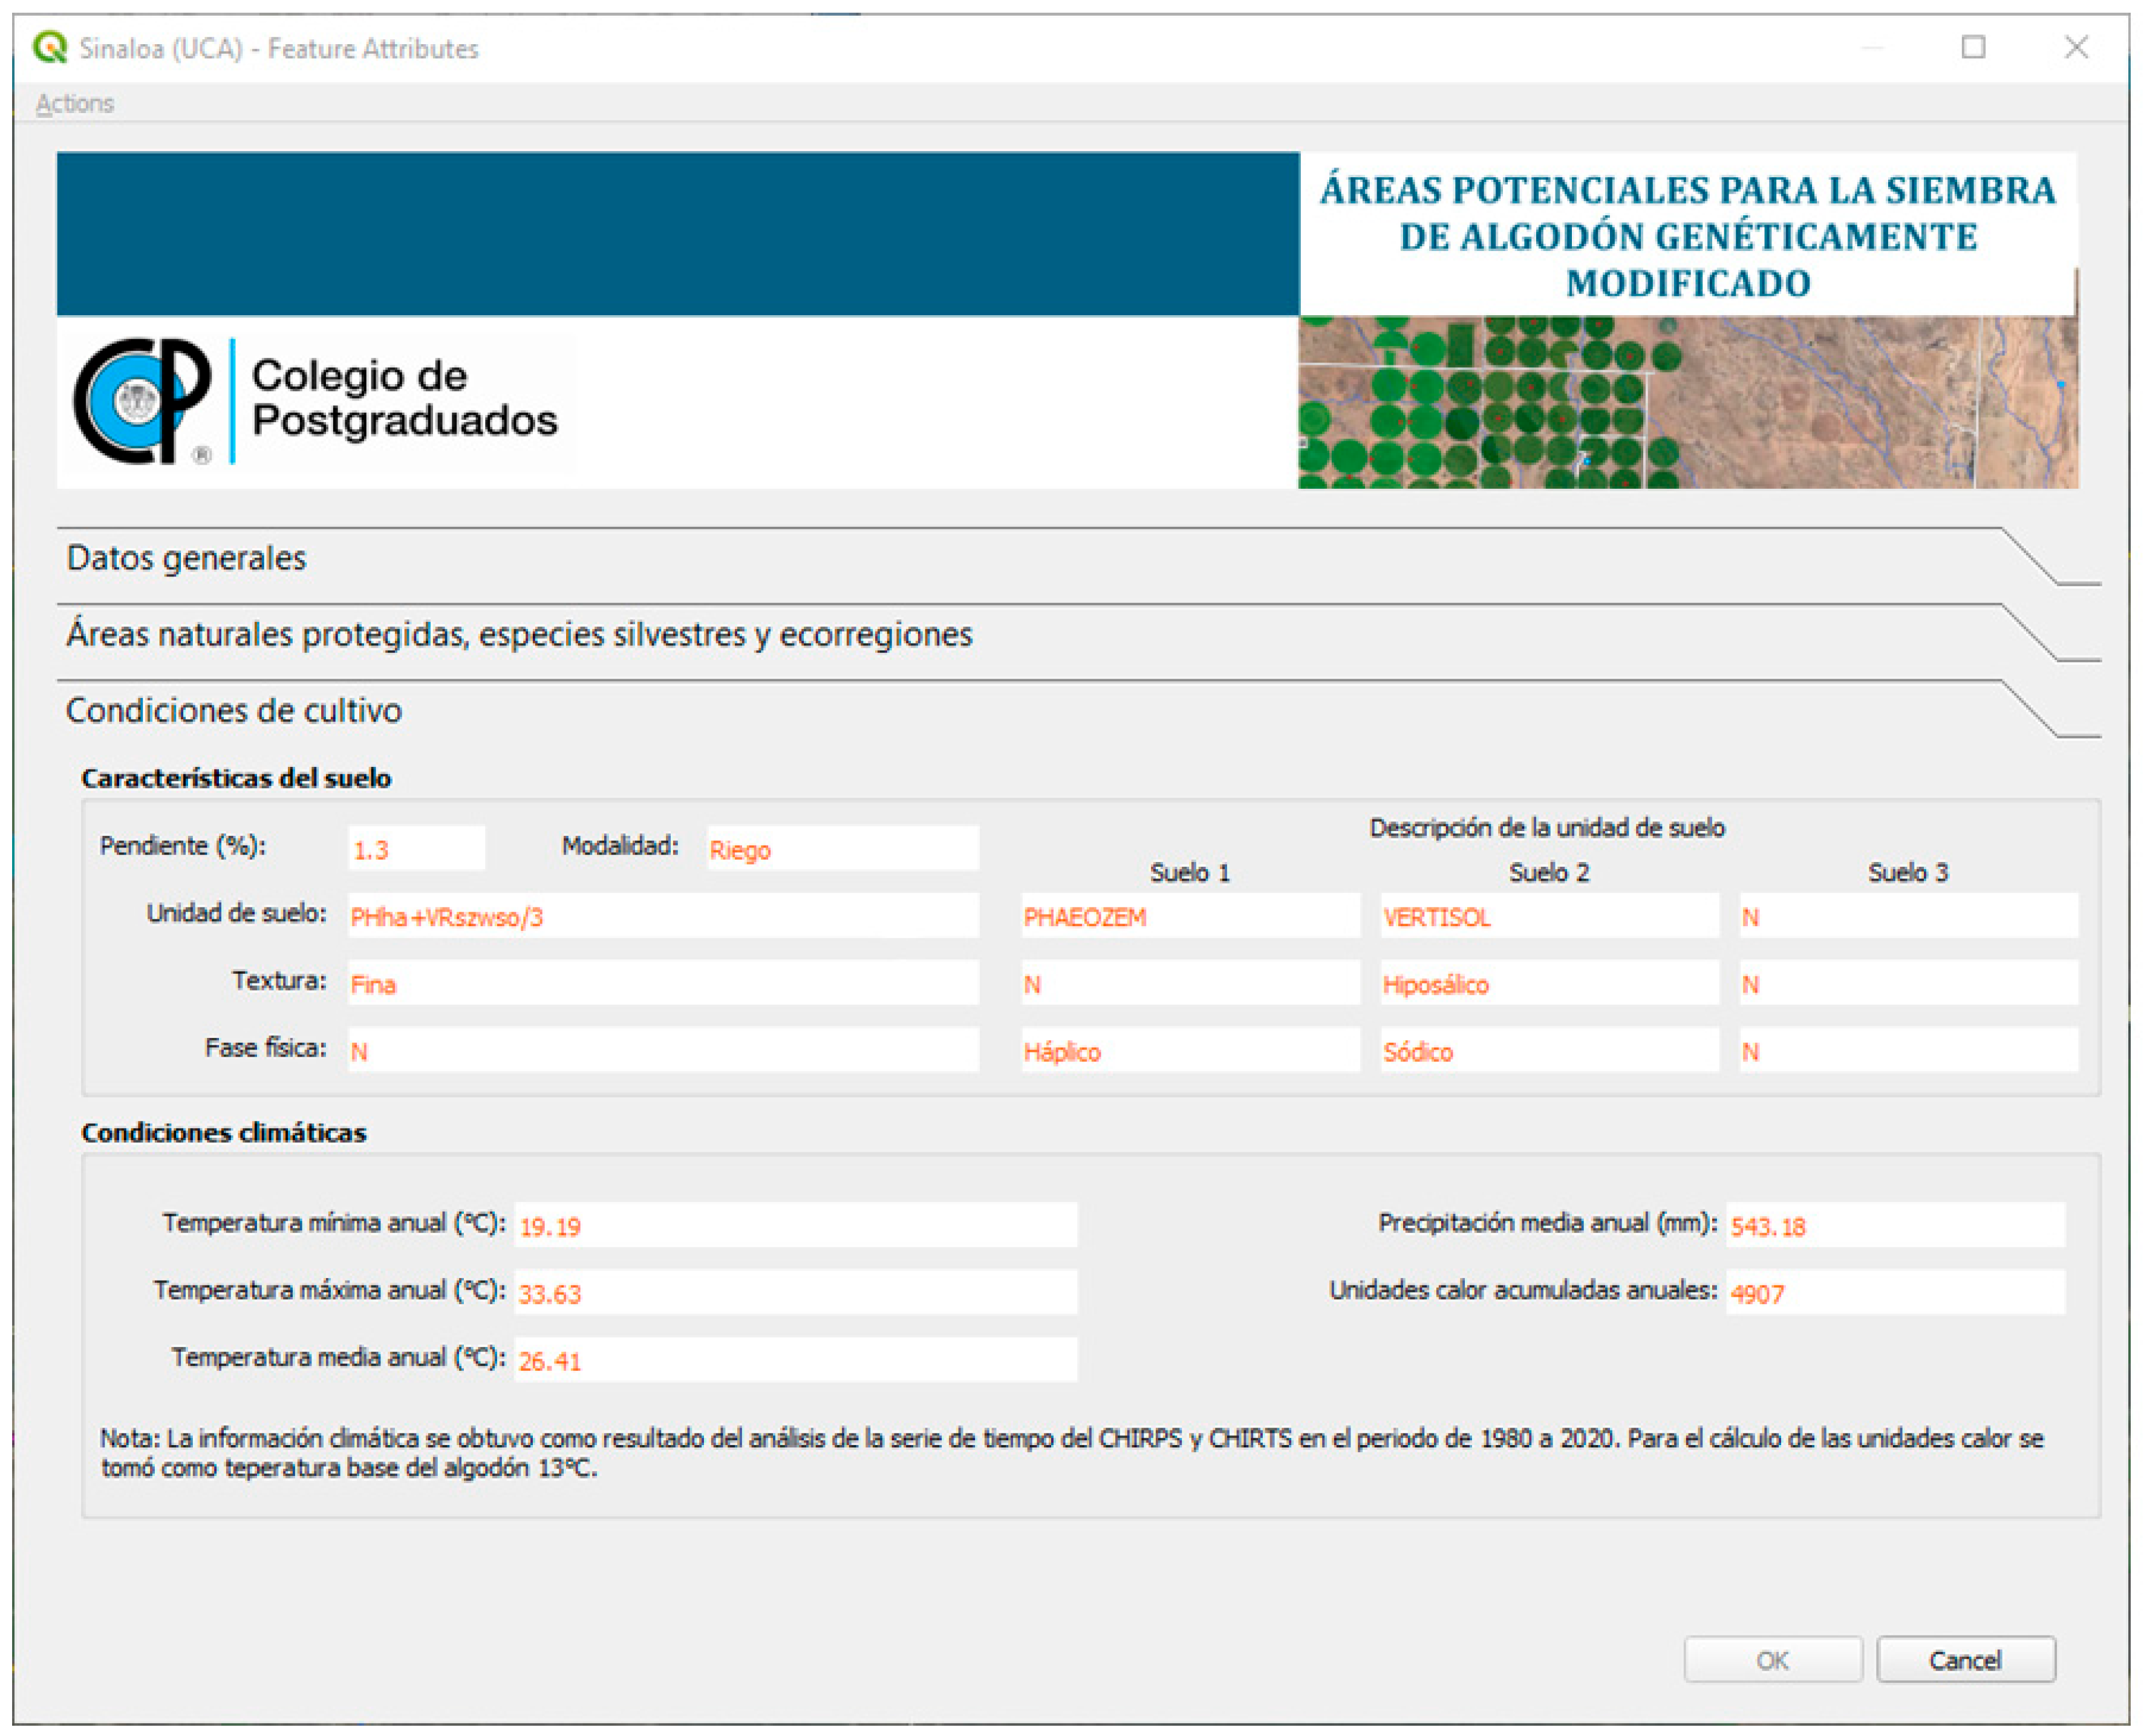
Section 3,
Cultivation Conditions (
Figure 16), shows the main characteristics of the soil, such as slope, soil unit, texture, physical phase, and irrigation or rainfed modality, as well as the description of up to three soil units. In addition, it shows the weather conditions, that is, annual, minimum, maximum, and mean temperature, as well as mean annual precipitation and annual accumulated heat units.
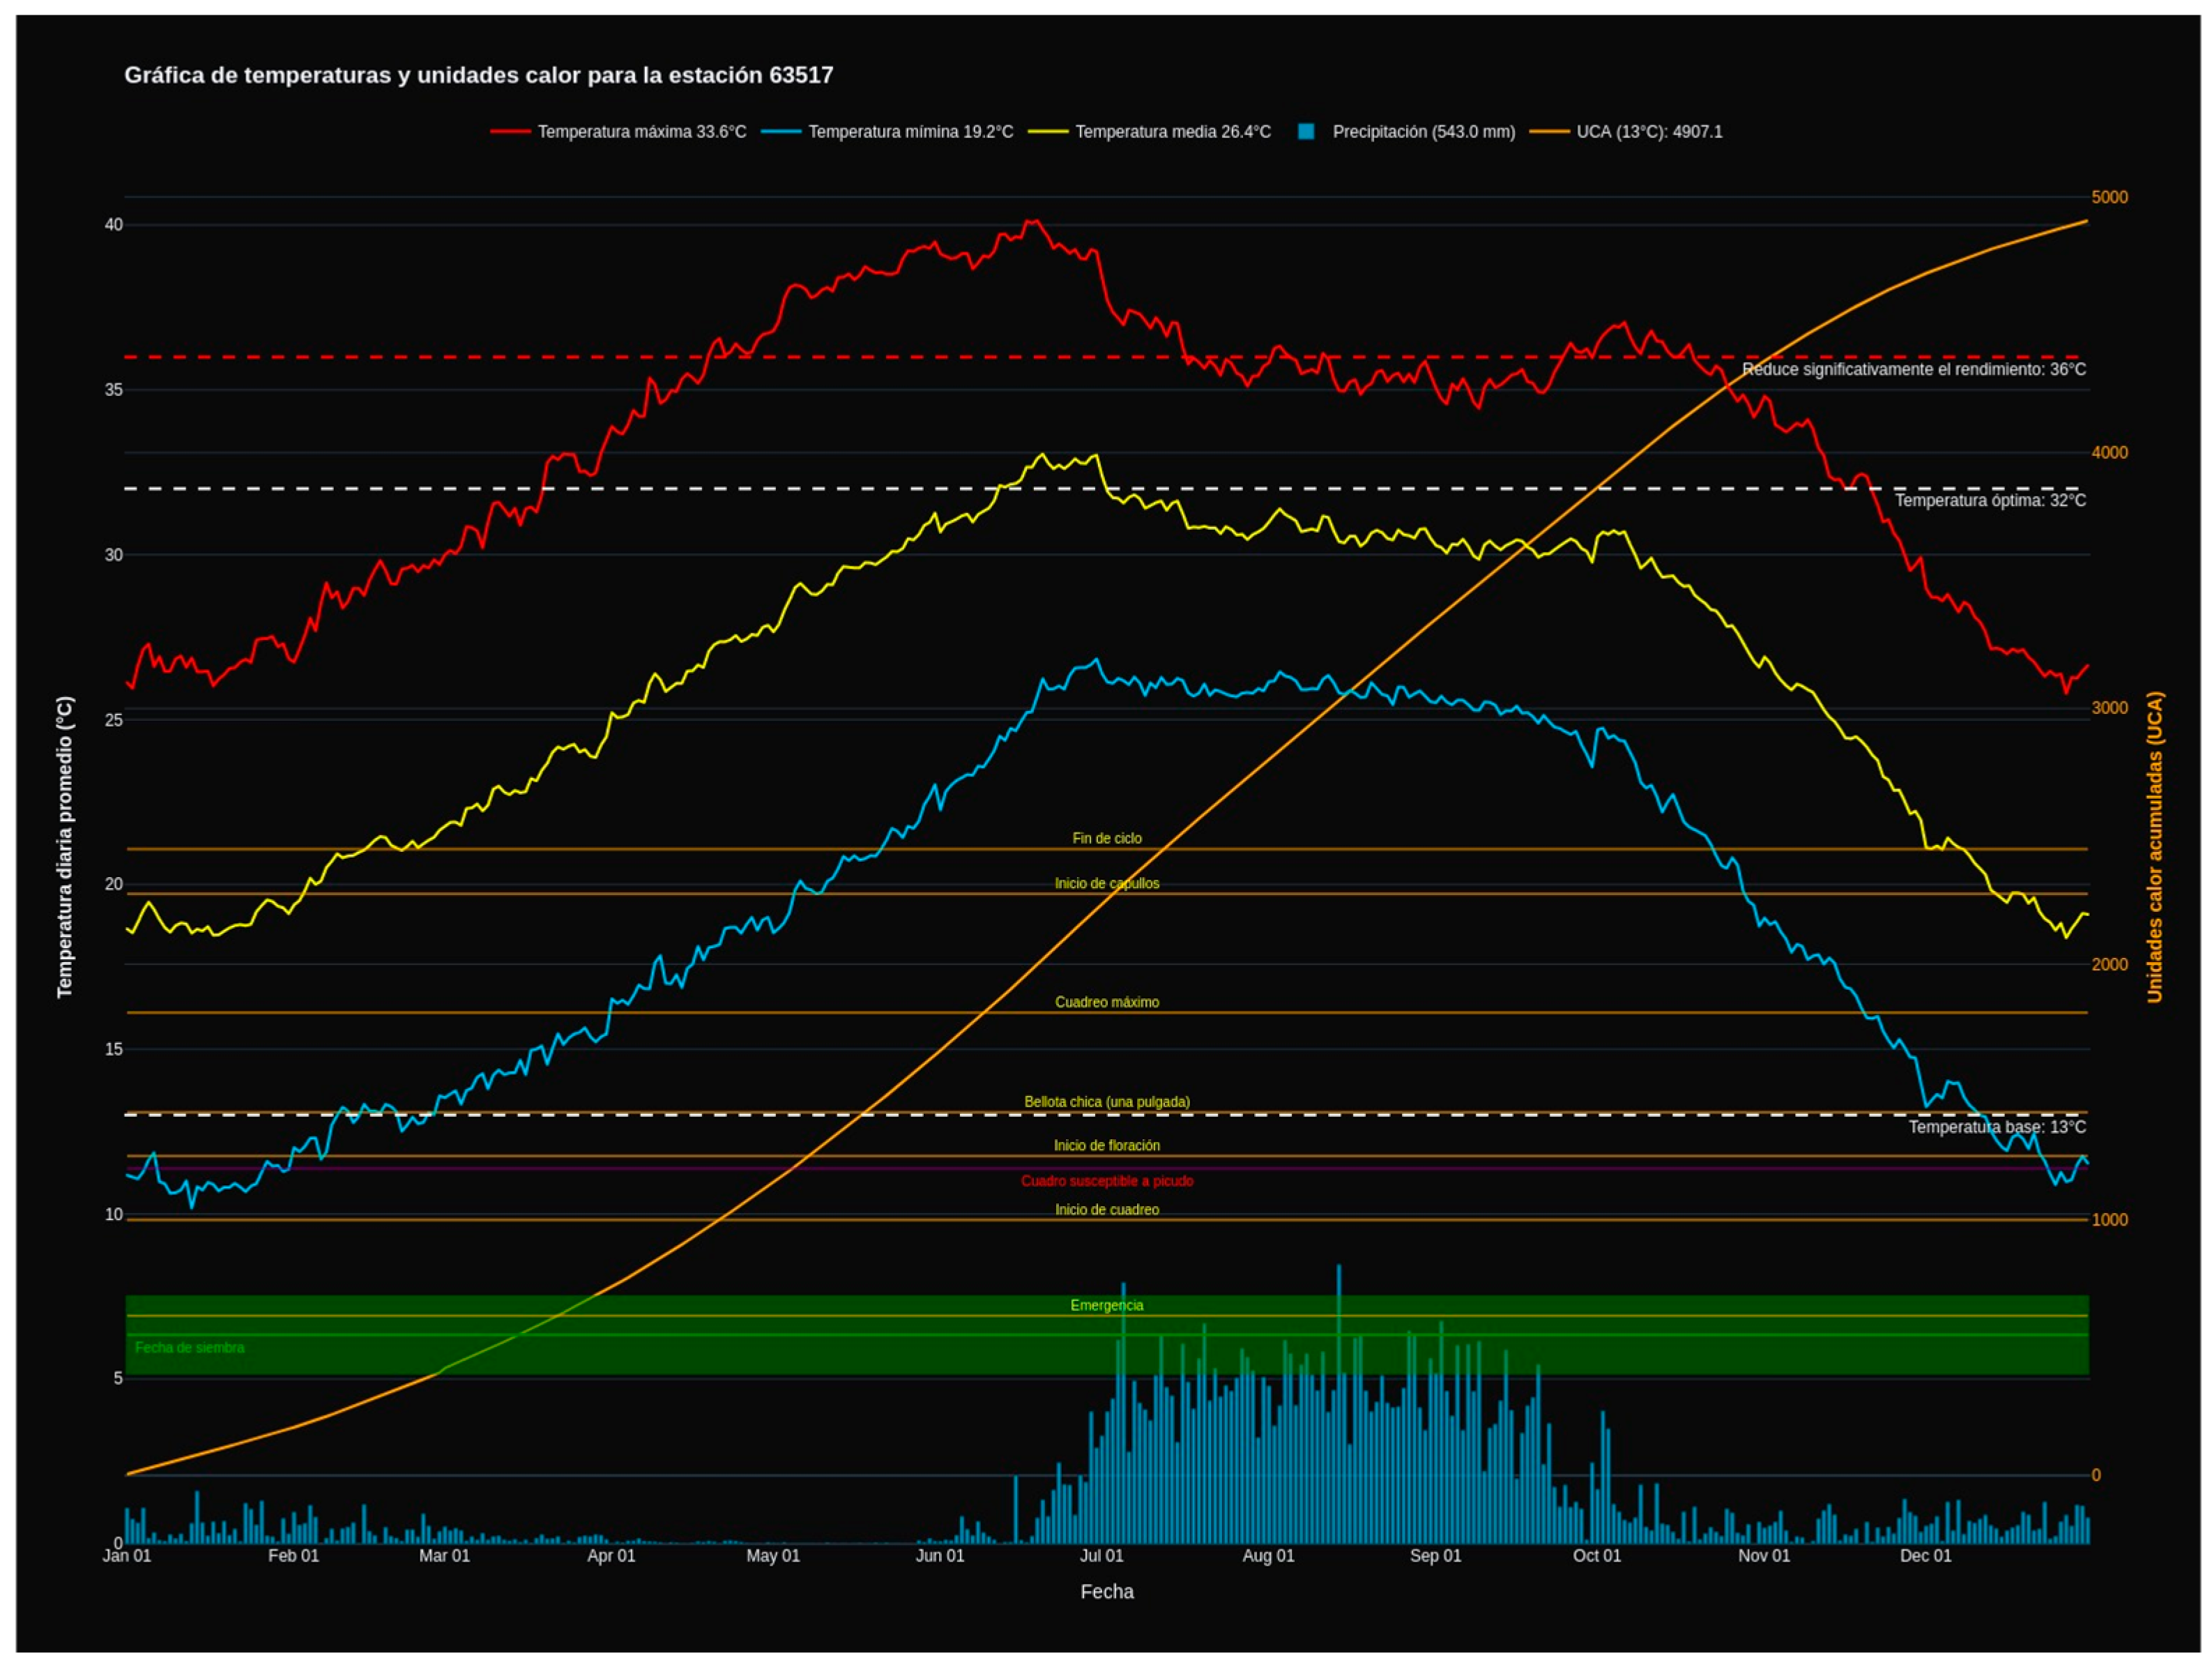
It is worth noting that the “Actions” submenu in the upper left part of the window displays a graph with climate information (
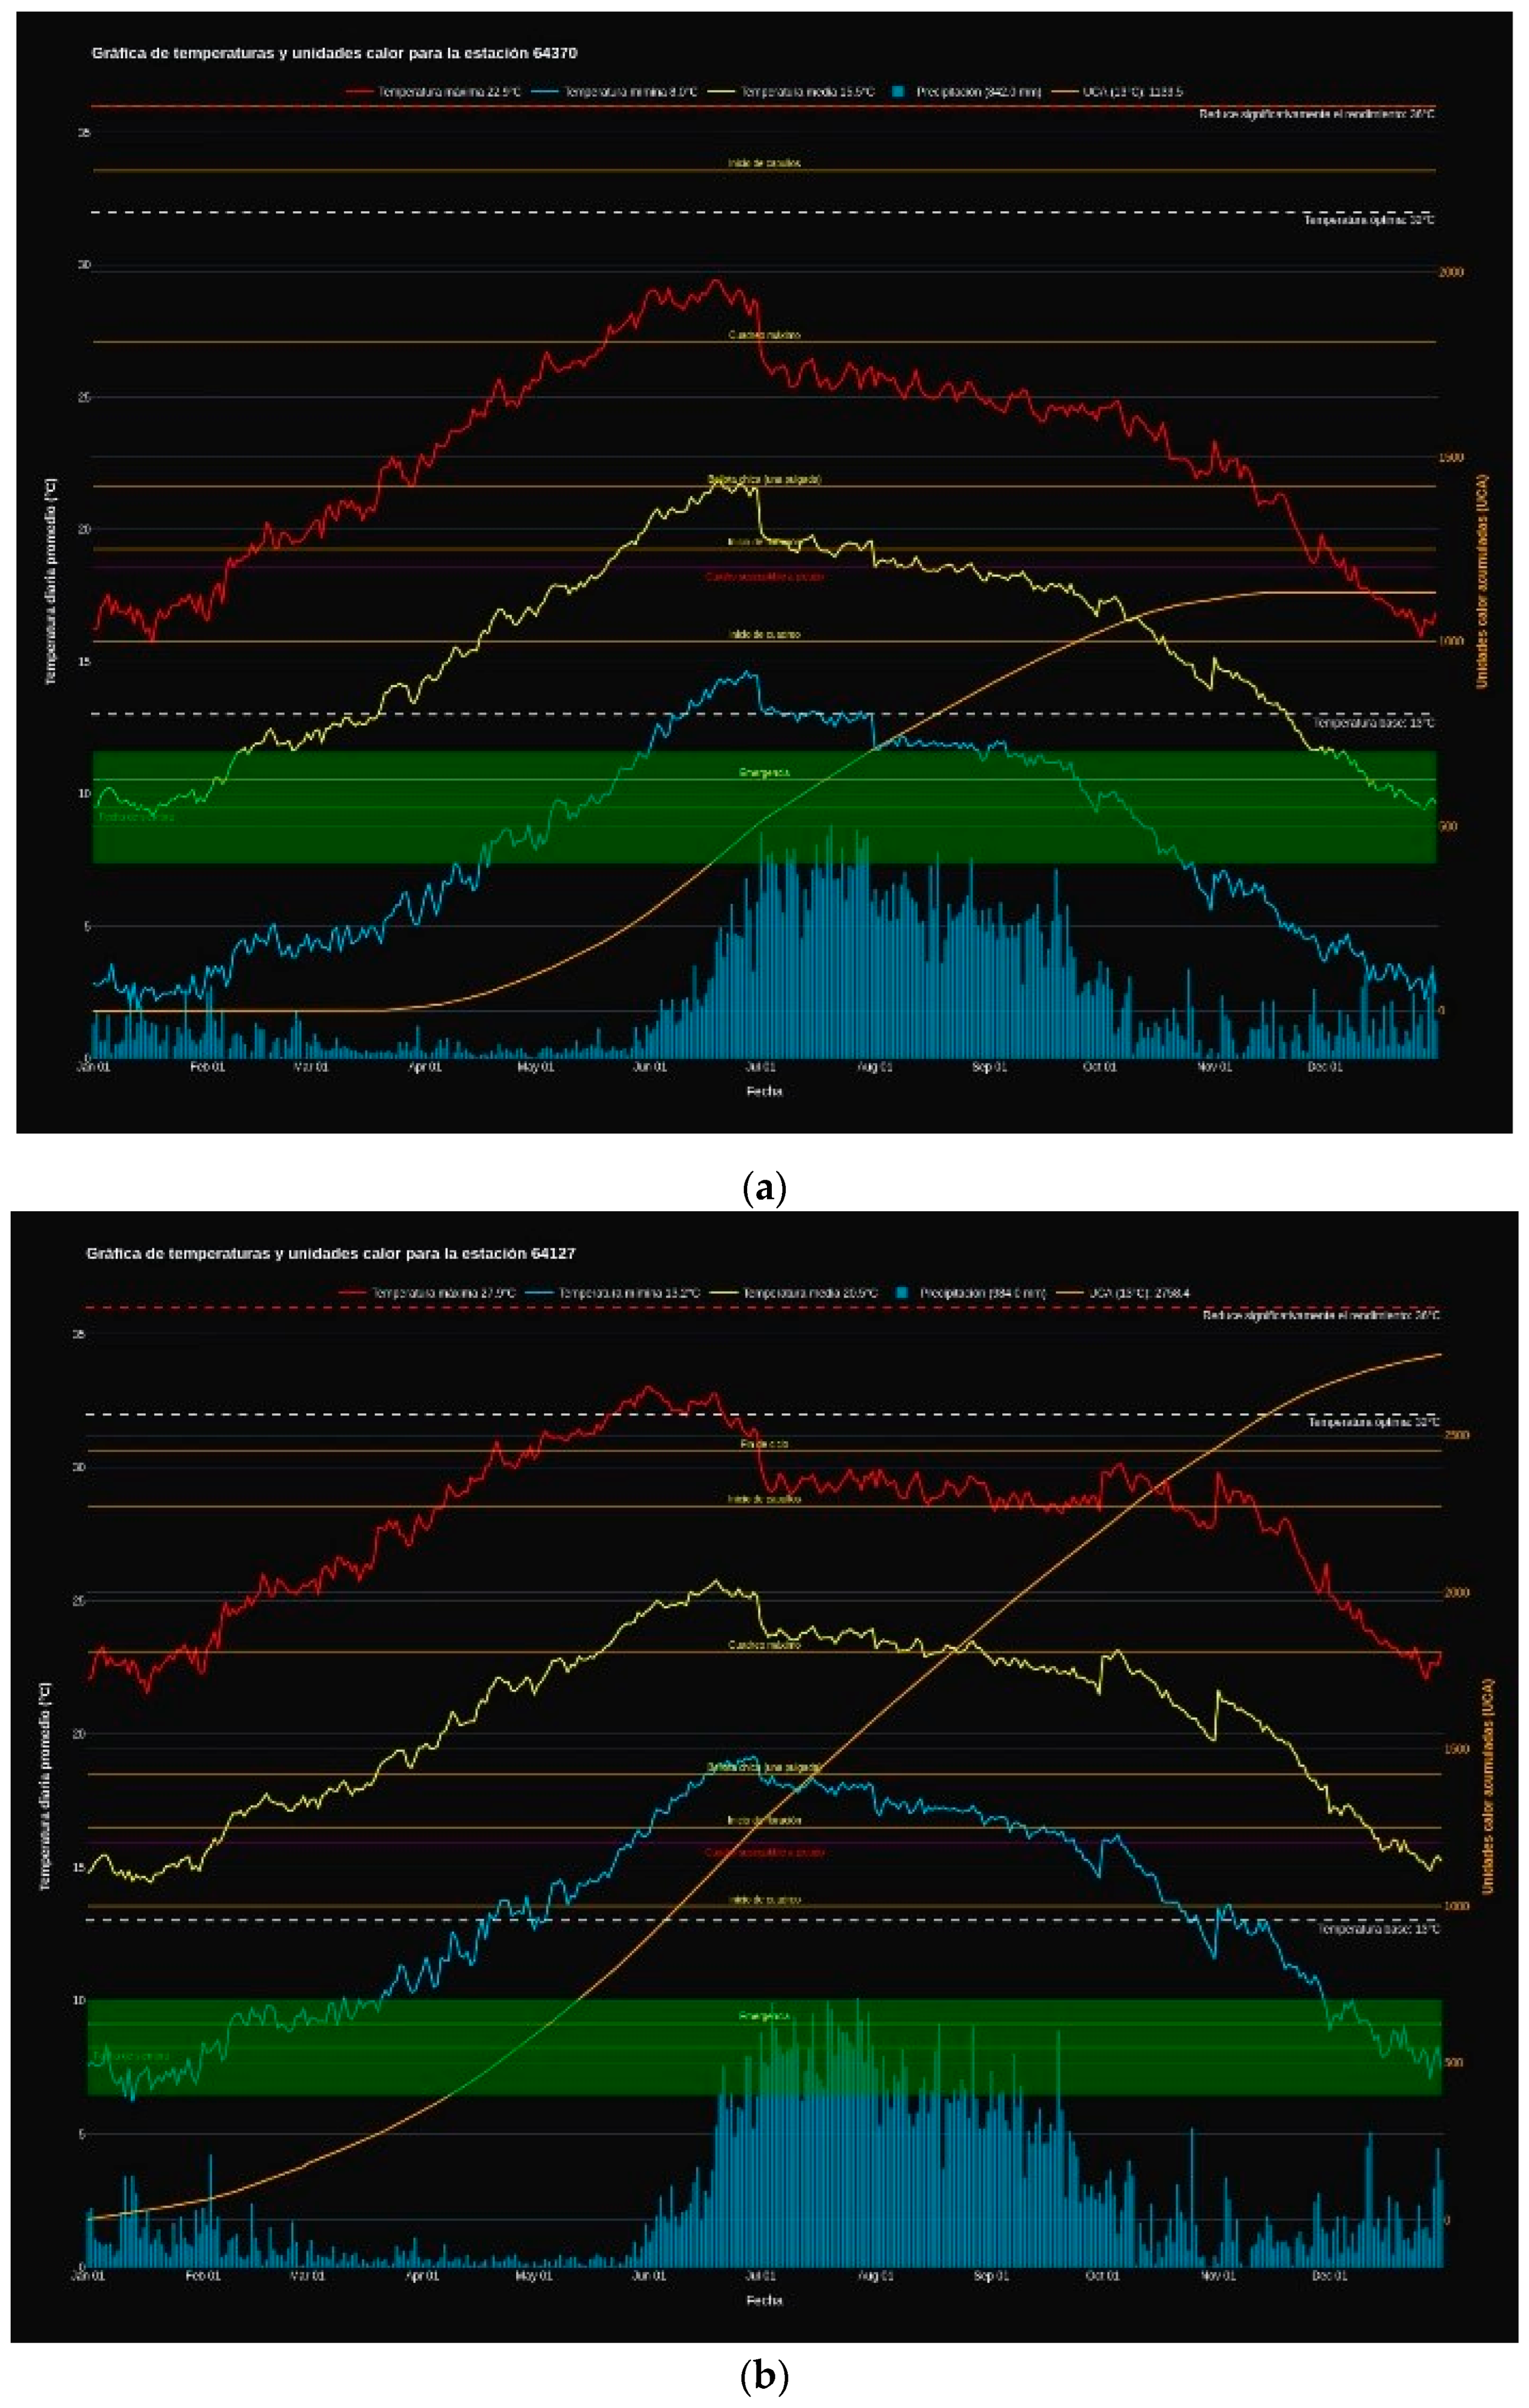
Figure 17). The plotted variables are daily and accumulated heat units, daily temperature (maximum, minimum, mean) averaged from 1983 to 2020, and precipitation, as well as base temperature and optimal temperature for the same period. Temperature (°C) and precipitation (mm) are represented on the left
y-axis, and the accumulated heat units on the right side. The orange horizontal lines indicate the phenological stages of cotton, taking as a reference the time when 550 HU accumulates (green horizontal line).
Figure 18 illustrates two sites under contrasting thermal conditions for cotton cultivation. The graph on the left represents a site that does not meet the demand for cotton development in terms of heat units. Conversely, the graph on the right shows a site with sufficient heat units for cultivation. The legend at the top shows the mean annual data.
3.2. Consulting Cotton Production at the Municipal Level for 2003–2022 in the GIS
To consult historical production data at the municipal level, select the “
Production by municipality” layer, click on the icon, and then click on the municipality of interest on the map (
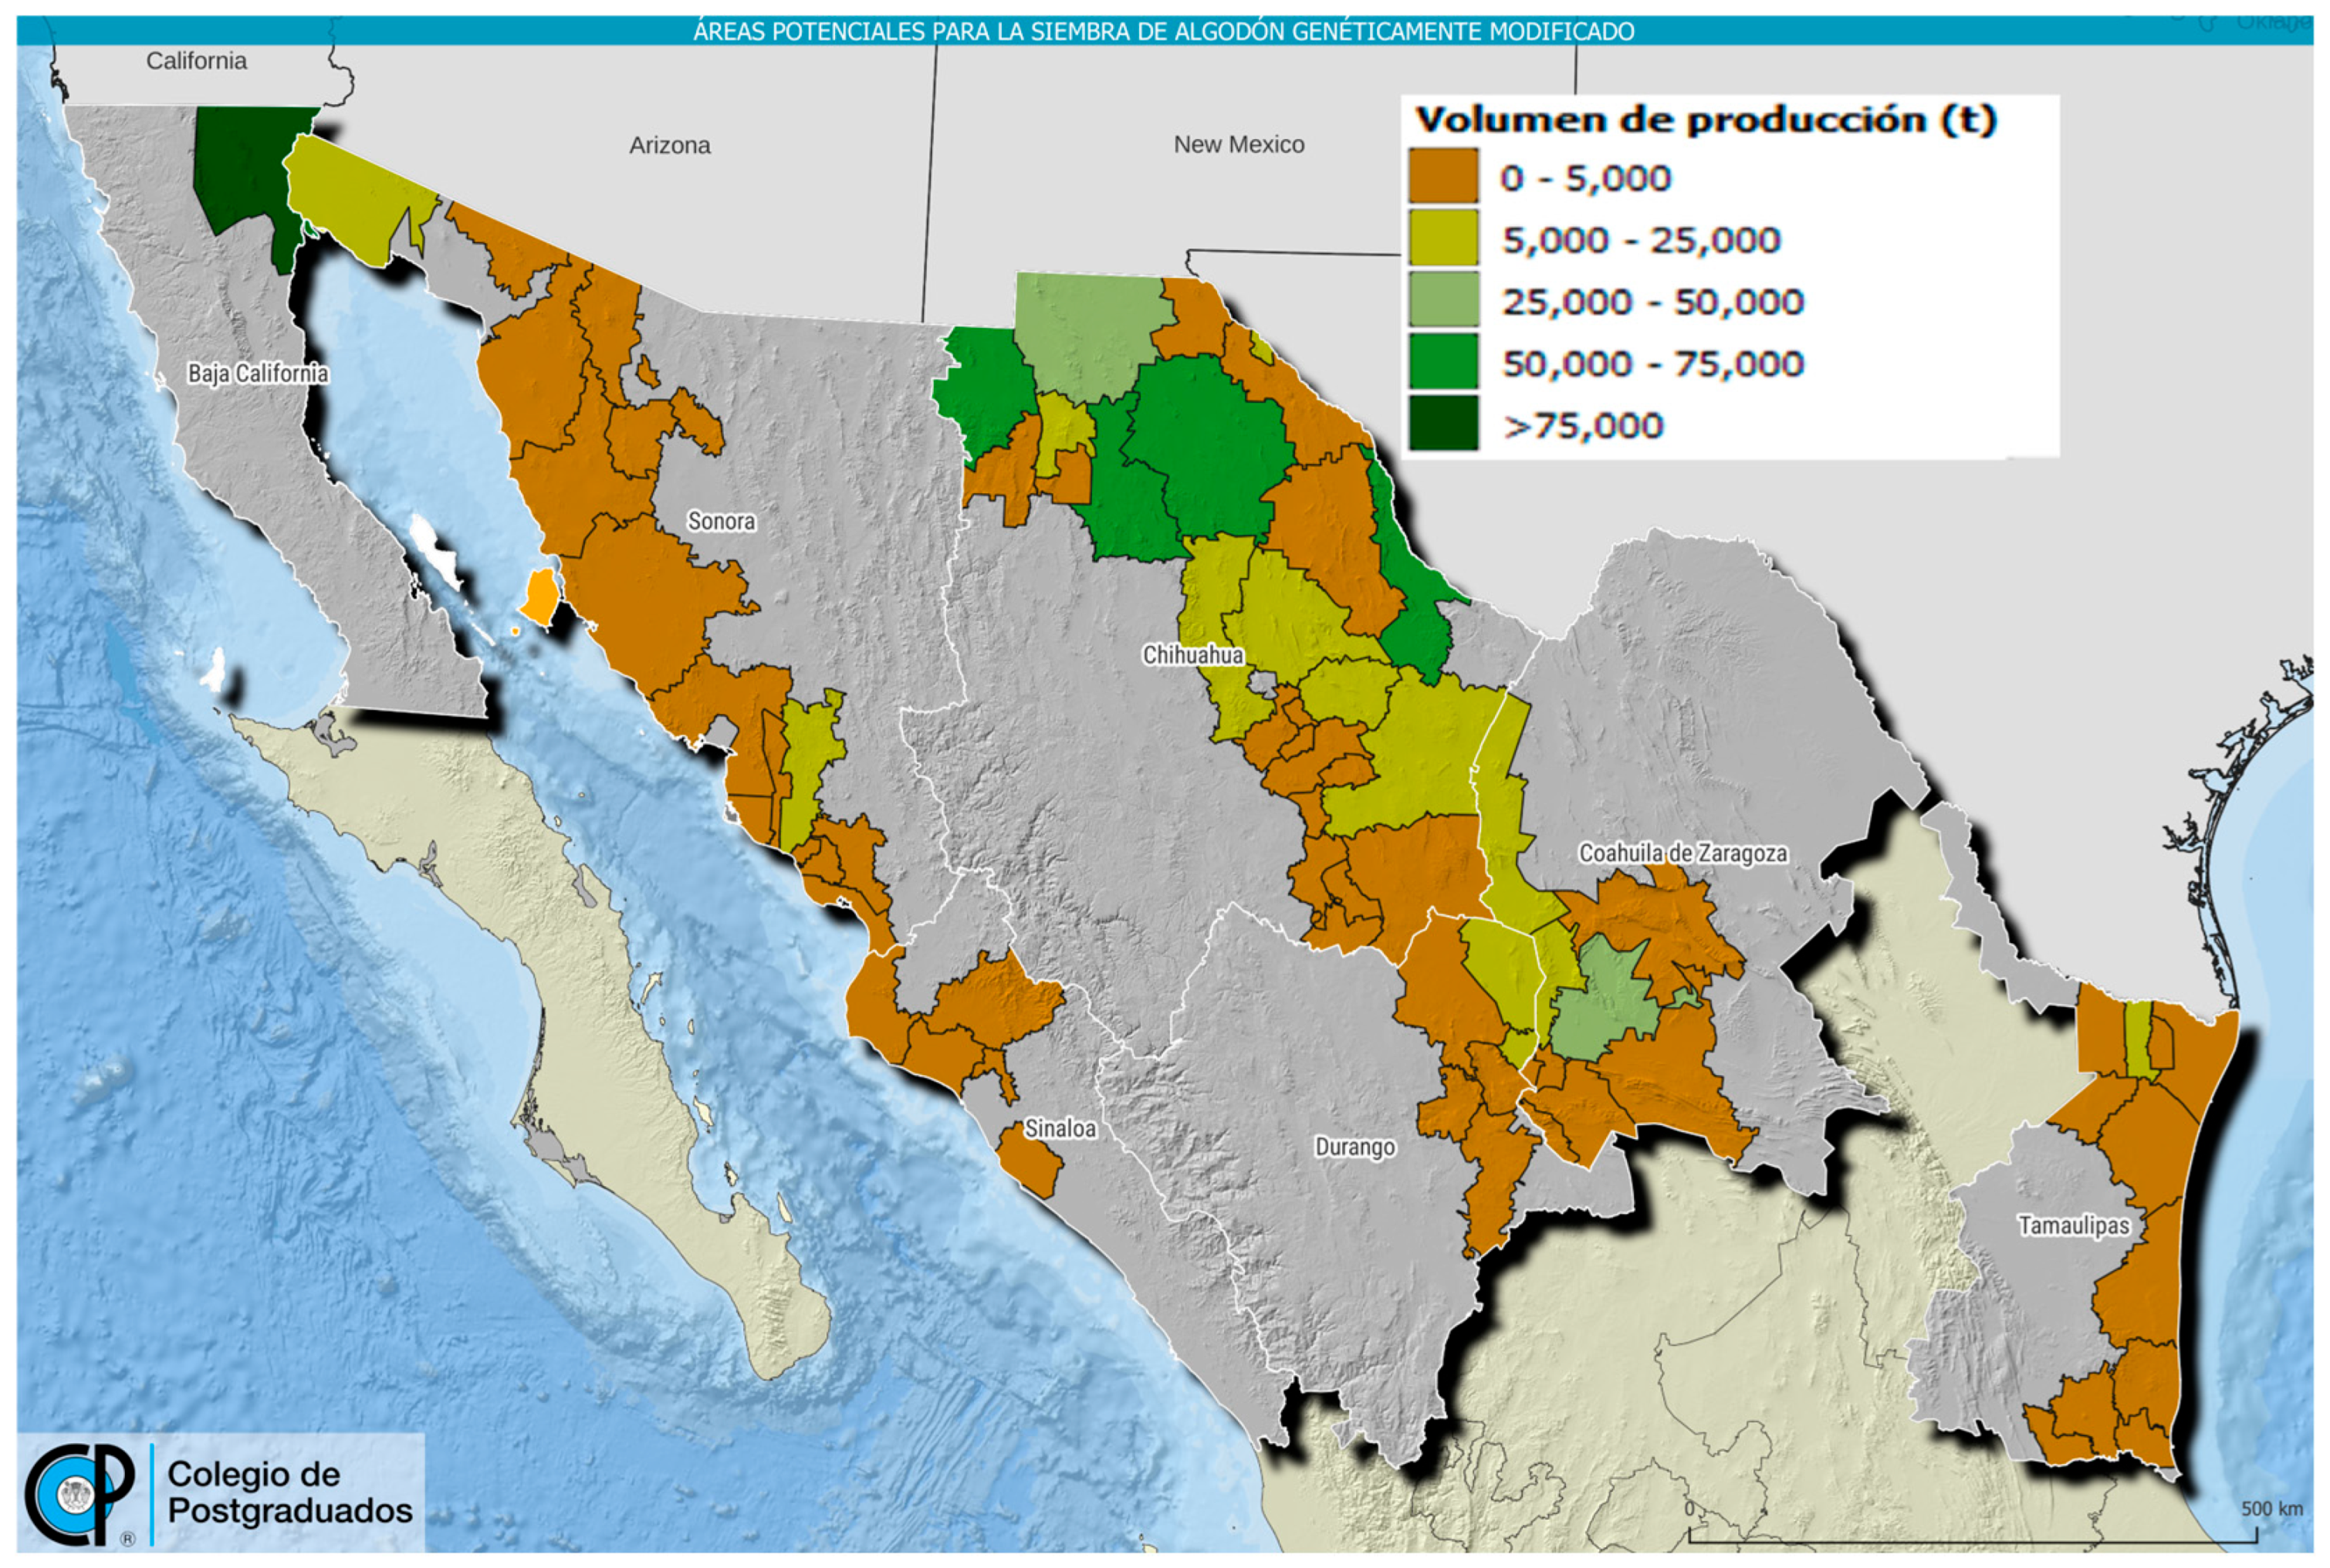
Figure 19) Where the intense green color contains the biggest volume of production. A form is displayed with information on cotton production by municipality from 2003 to 2022 (see
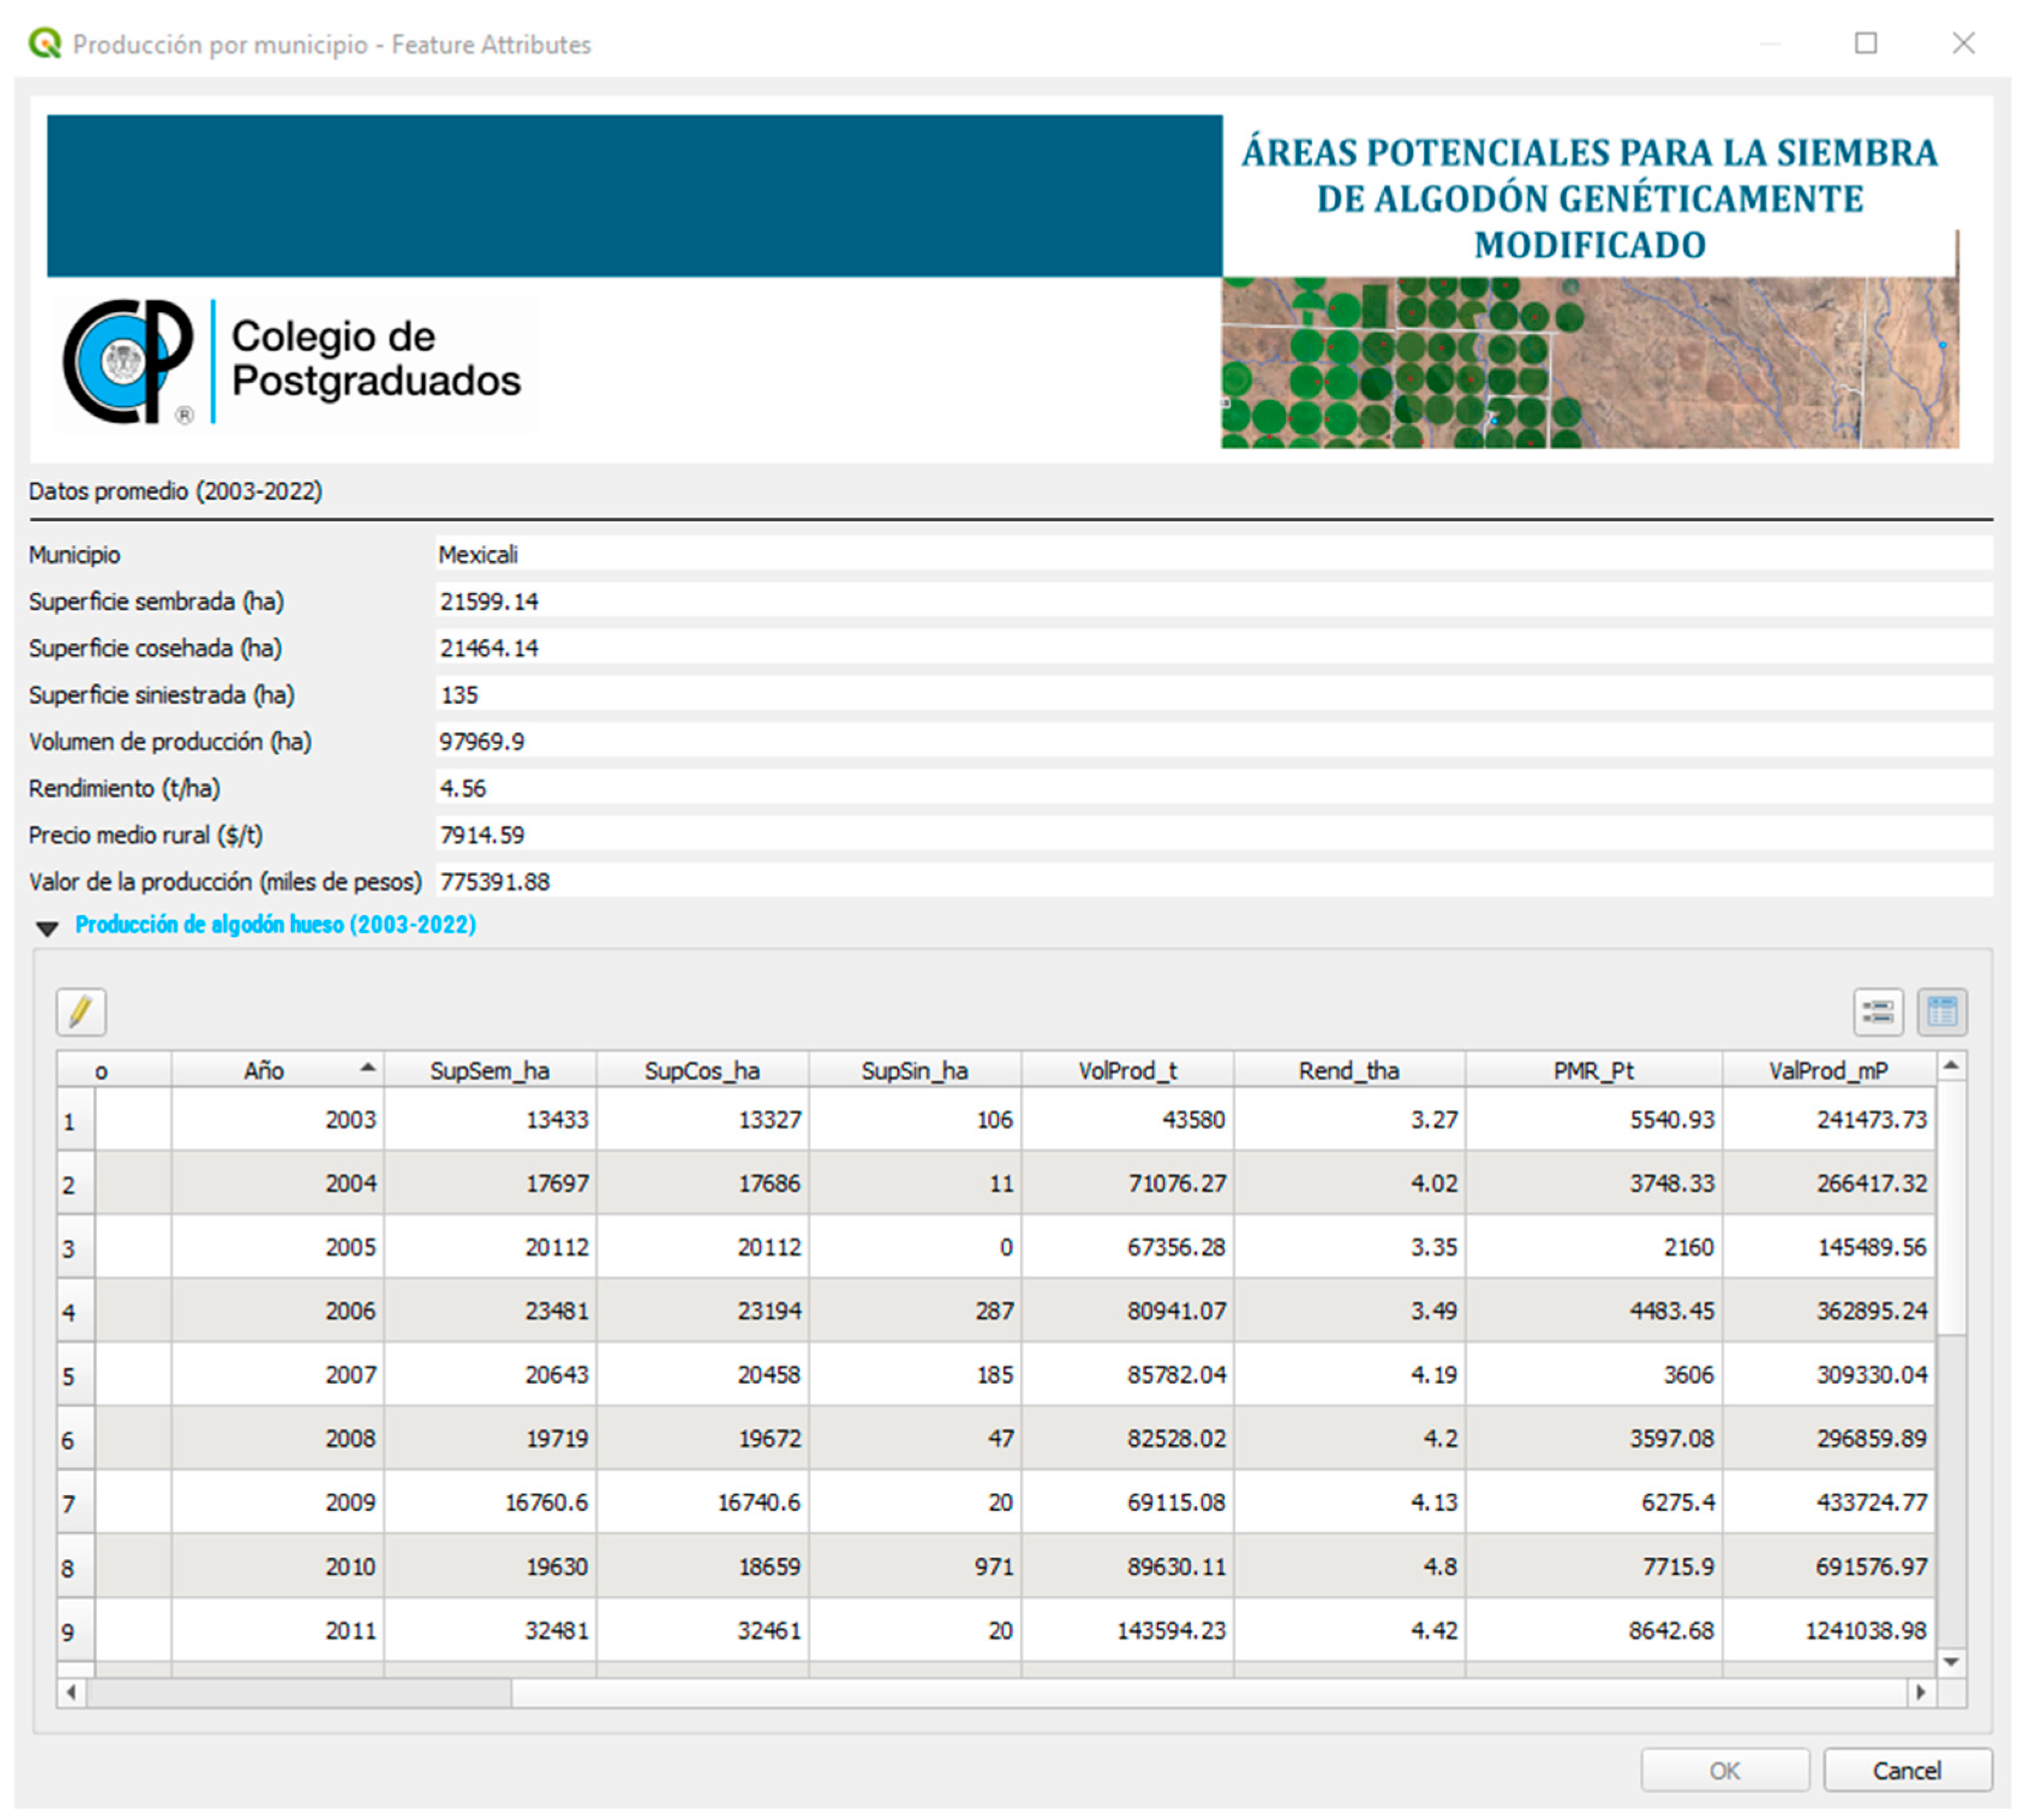
Figure 20).
3.3. Maps of Agricultural Areas Potentially Suitable for GM Cotton Planting
The data obtained and shown in
Figure 12,
Figure 13,
Figure 14,
Figure 15,
Figure 16,
Figure 17,
Figure 18,
Figure 19,
Figure 20,
Figure 21,
Figure 22,
Figure 23,
Figure 24,
Figure 25,
Figure 26,
Figure 27 and
Figure 28 provides the necessary information to determine the optimal areas for cultivating GMC.
Maps of areas potentially suitable for cotton planting were elaborated based on various criteria: as a first criterion to identify a potential zone for the genetically modified cotton cultivation, it is the distance greater than 1 km from the PNAS and the wild cotton species; if an area does not comply with this restriction, it is shifted from potential to restricted. If the first criterion is fulfilled, then verify whether the height above sea level is less than 600 m and if it has irrigation, verify whether it does not have irrigation; if it does not have irrigation, verify whether it has an average annual precipitation greater than 1200 mm. Once the previous conditions have been evaluated, obtain the binary map, where one indicates that it meets the requested condition for each characteristic that defines the requirements for the GMC, and zero indicates that it does not meet. Through the evaluation of heat units, it is determined for each plot along the agricultural border whether genetically modified cotton cultivation is optimal or not.
Additionally, if there are Indigenous communities within a 5 km radius, it will be pertinent to consider social restrictions.
The following figures show agricultural areas potentially suitable for GM cotton cultivation in various states: Baja California (
Figure 21), Sonora (
Figure 22), Chihuahua (
Figure 23), Coahuila (
Figure 24), Tamaulipas (
Figure 25), and Sinaloa (
Figure 26), using accumulated heat units as the primary reference. In
Figure 21 and
Figure 22, suitable areas are highlighted with boundary lines for better visualization, as shown in the examples.
A total of 36 maps were created at 1:250000 scale, distributed as follows: two for the state of Baja California, nine for Chihuahua, six for Coahuila, five for Durango, three for Sinaloa, six for Sonora, and five for Tamaulipas.
Below are
Figure 27,
Figure 28 and
Figure 29, which allow us to show the result of validation using as an example the state of Sinaloa, Mexico.
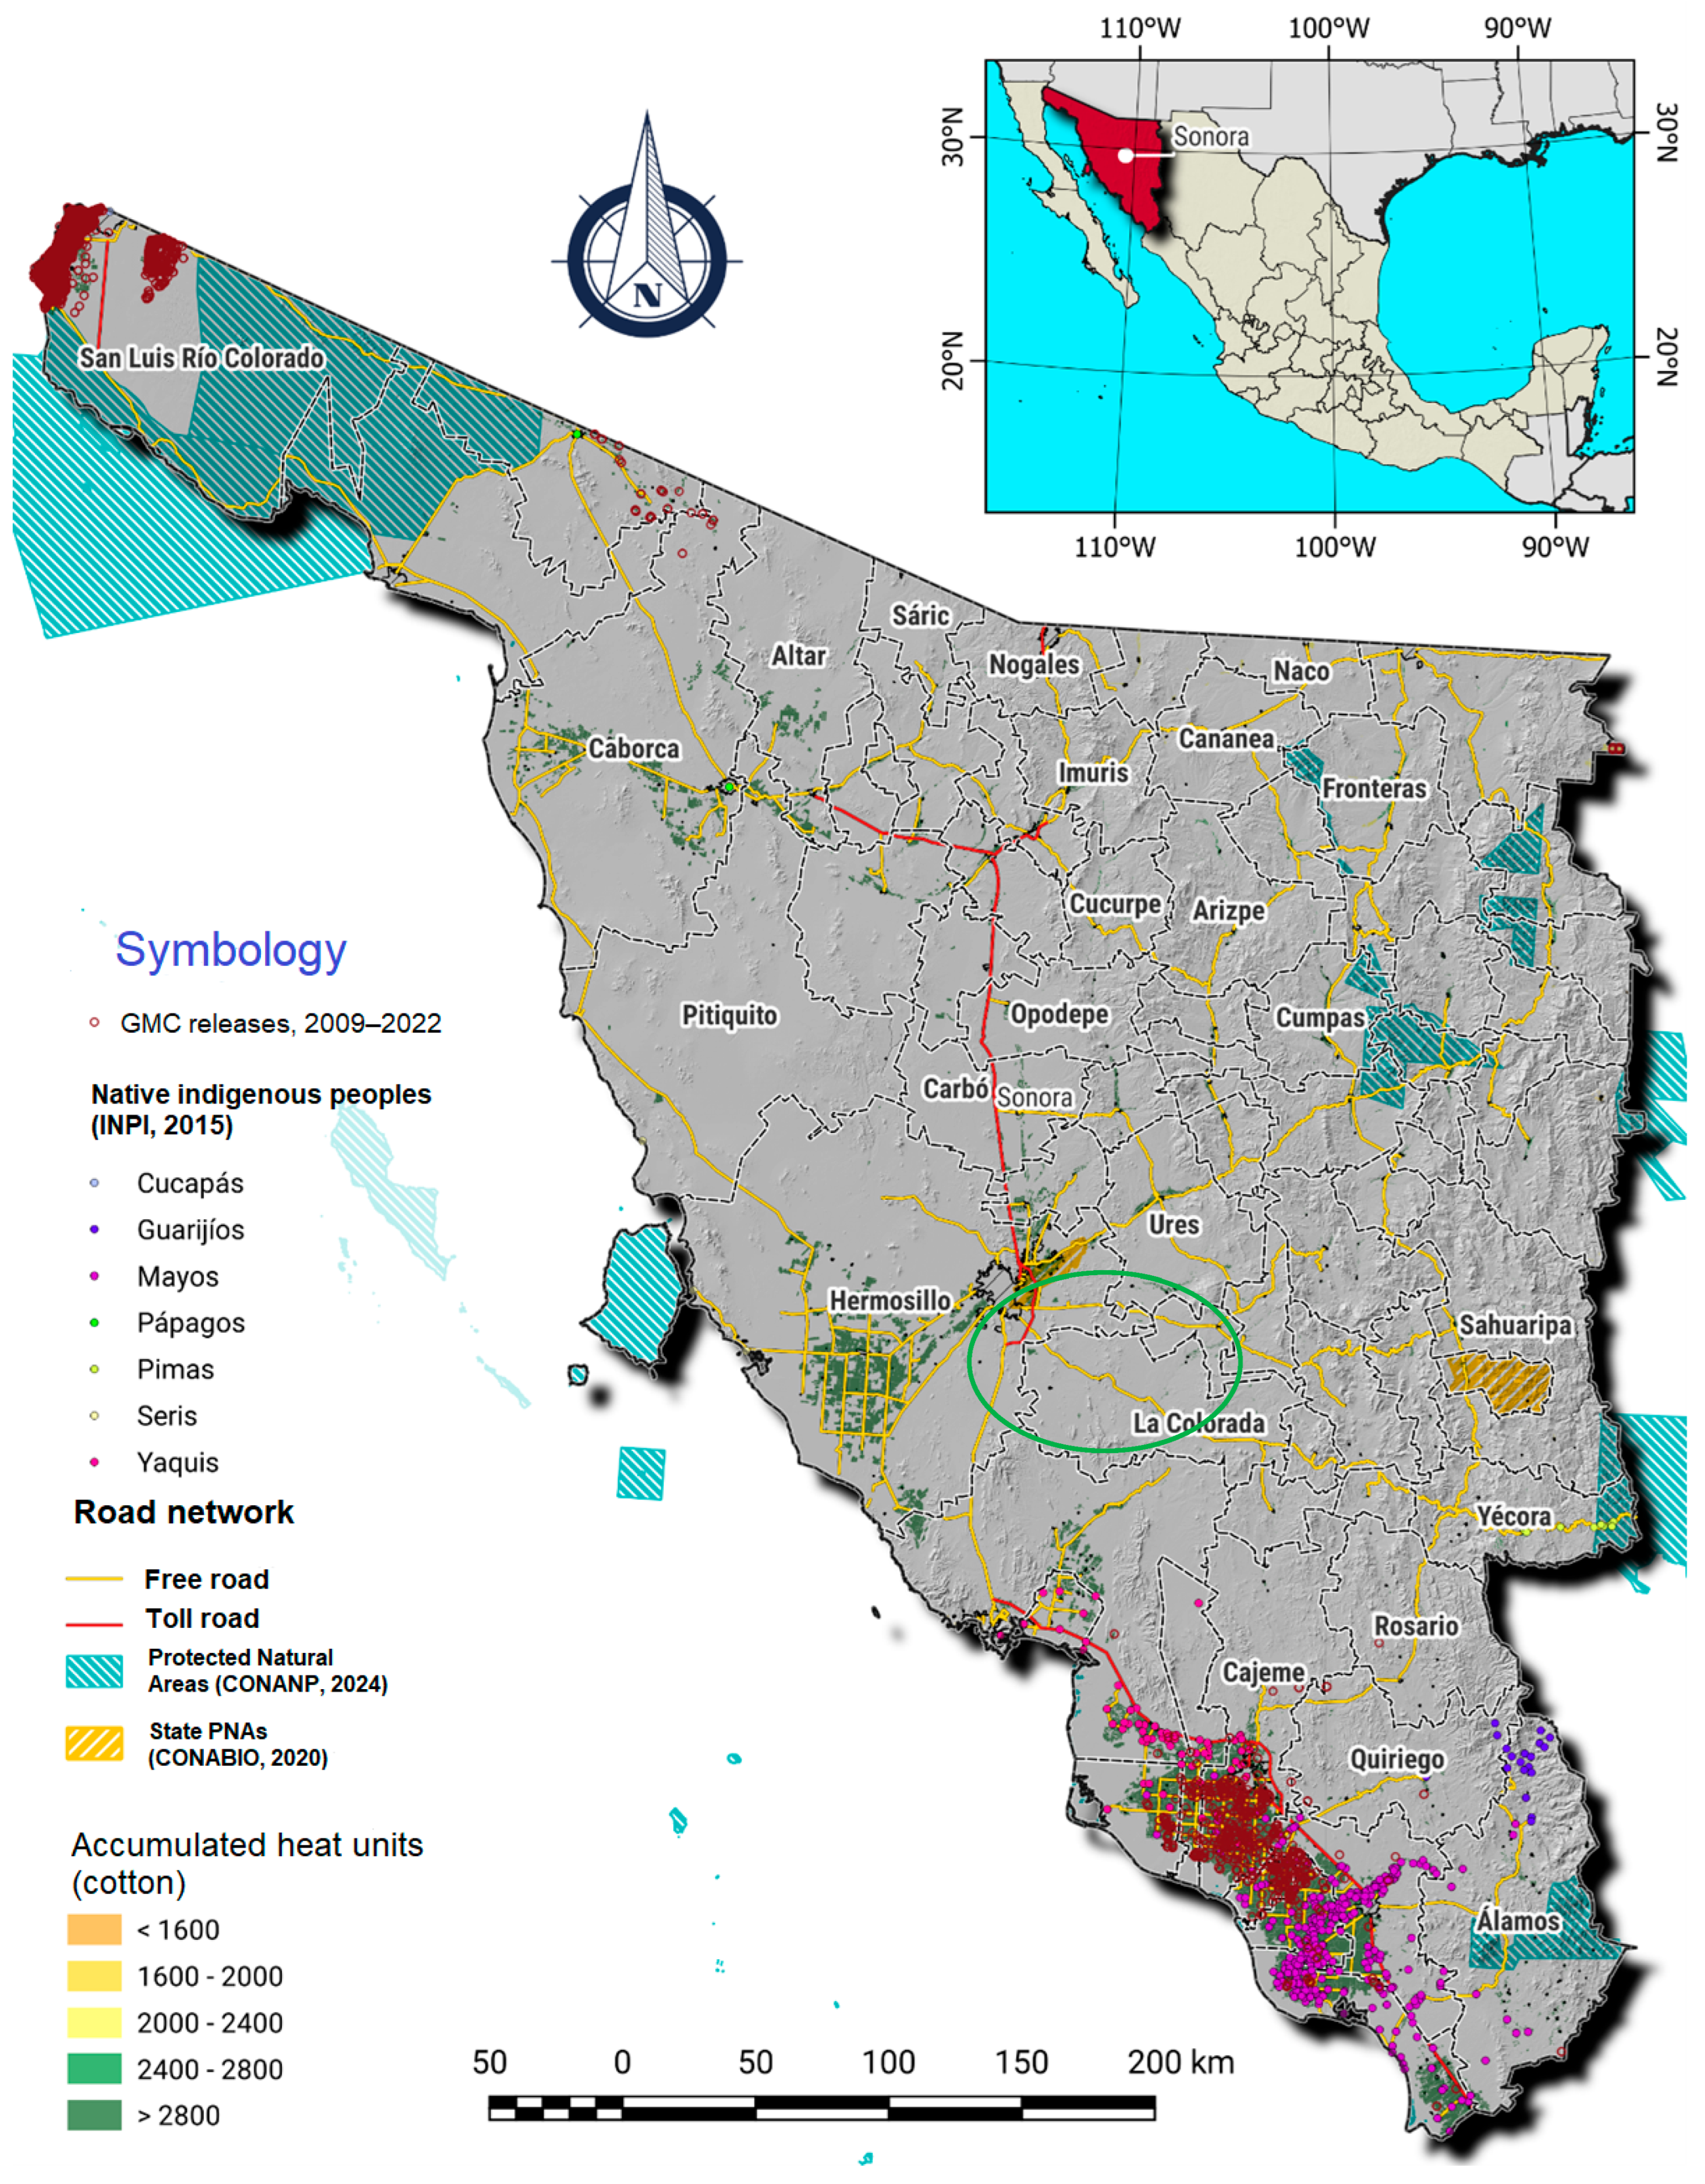
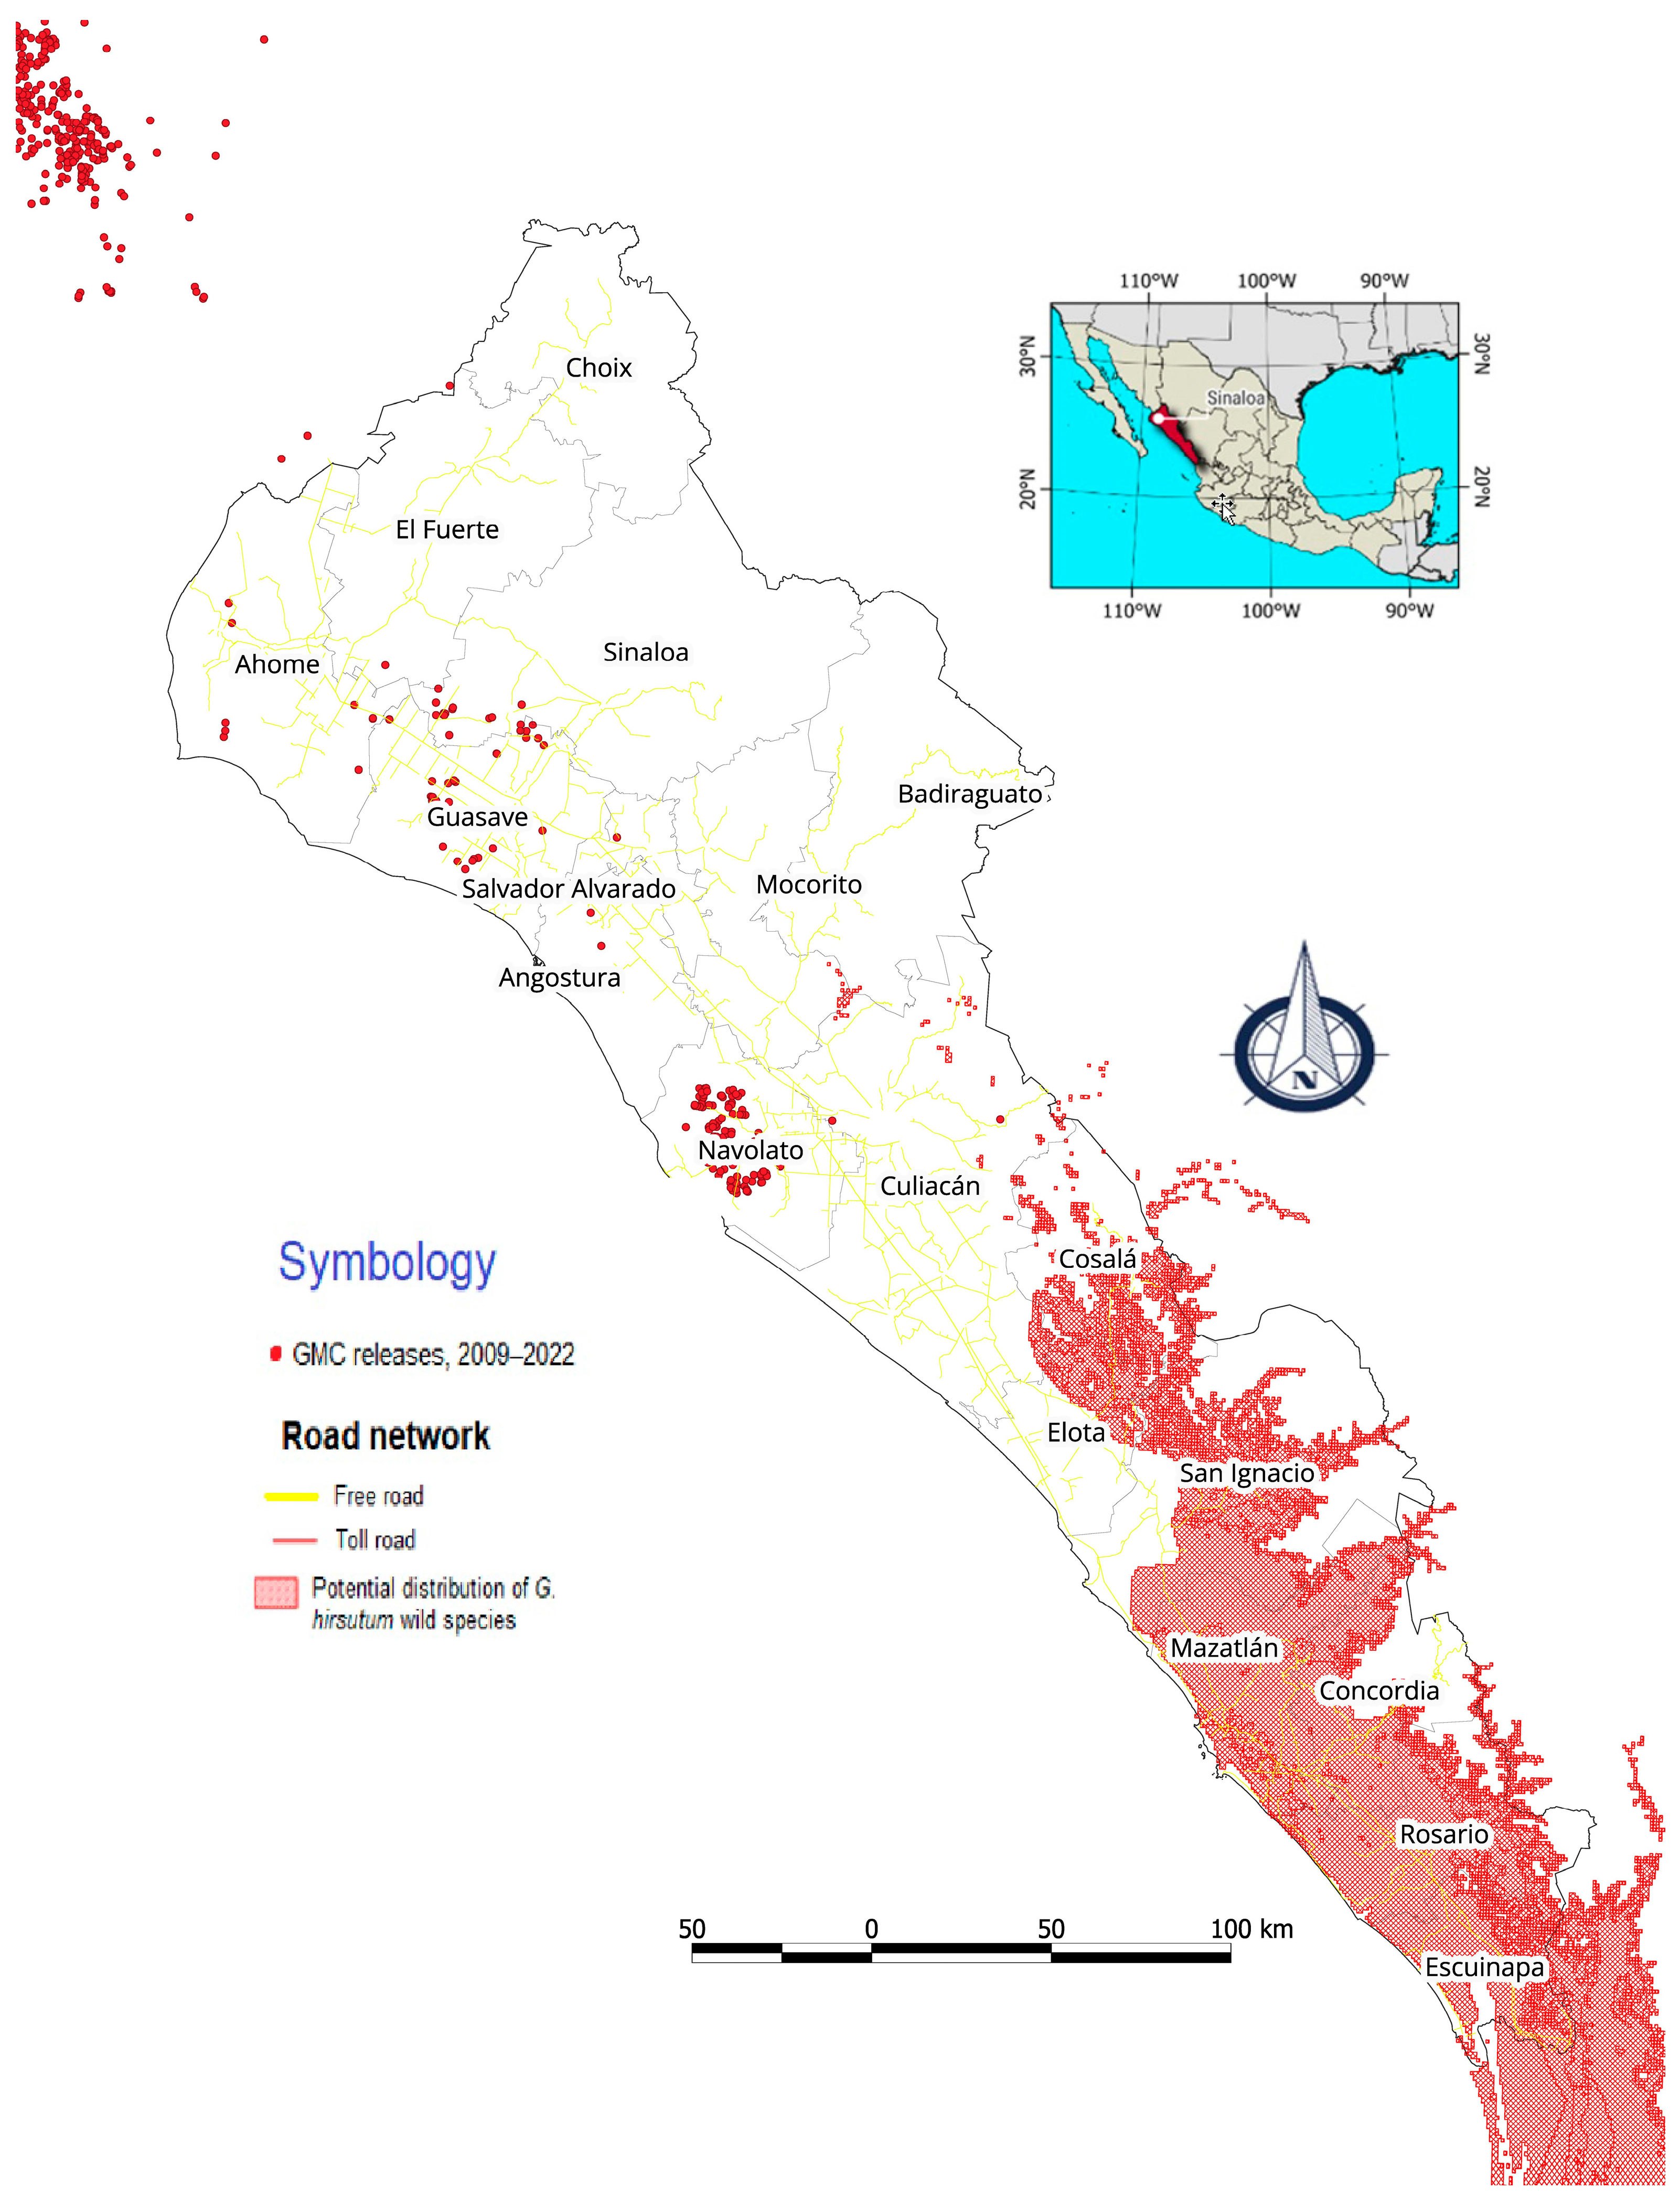
Figure 27 shows a map where the plots grown during the years 2009–2022 with GMC are identified with red points; in
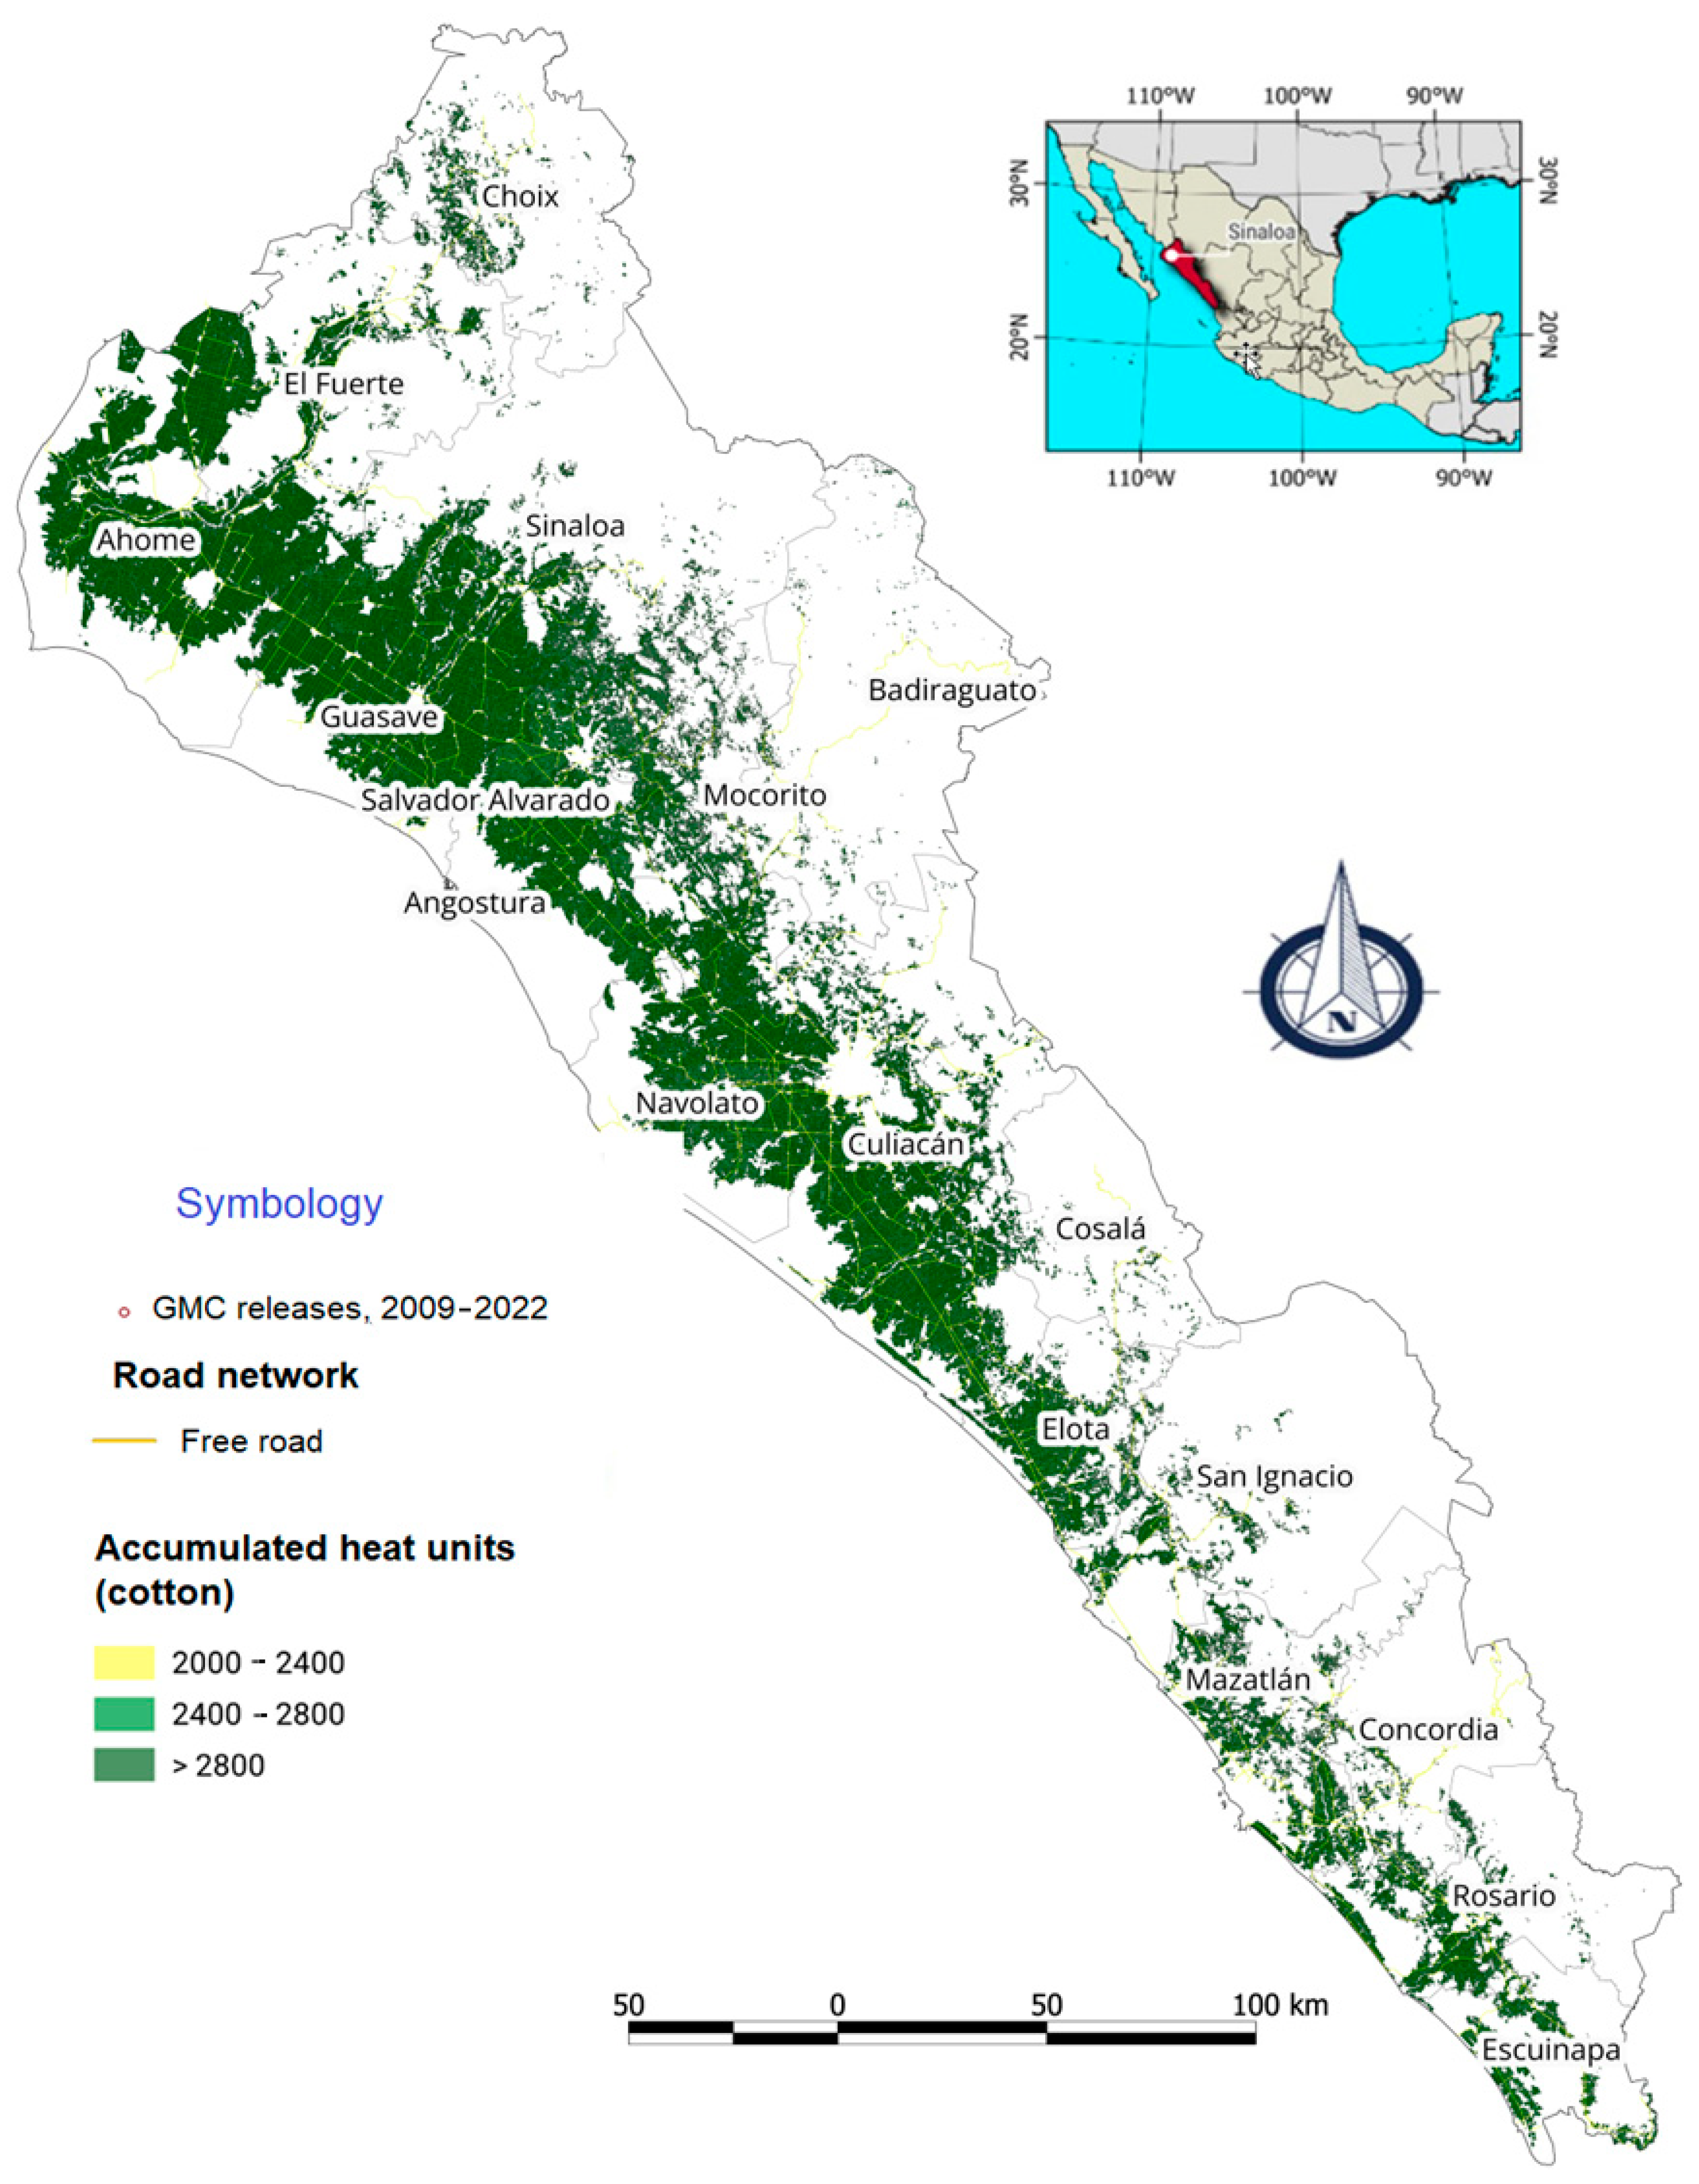
Figure 28, the optimal area, and
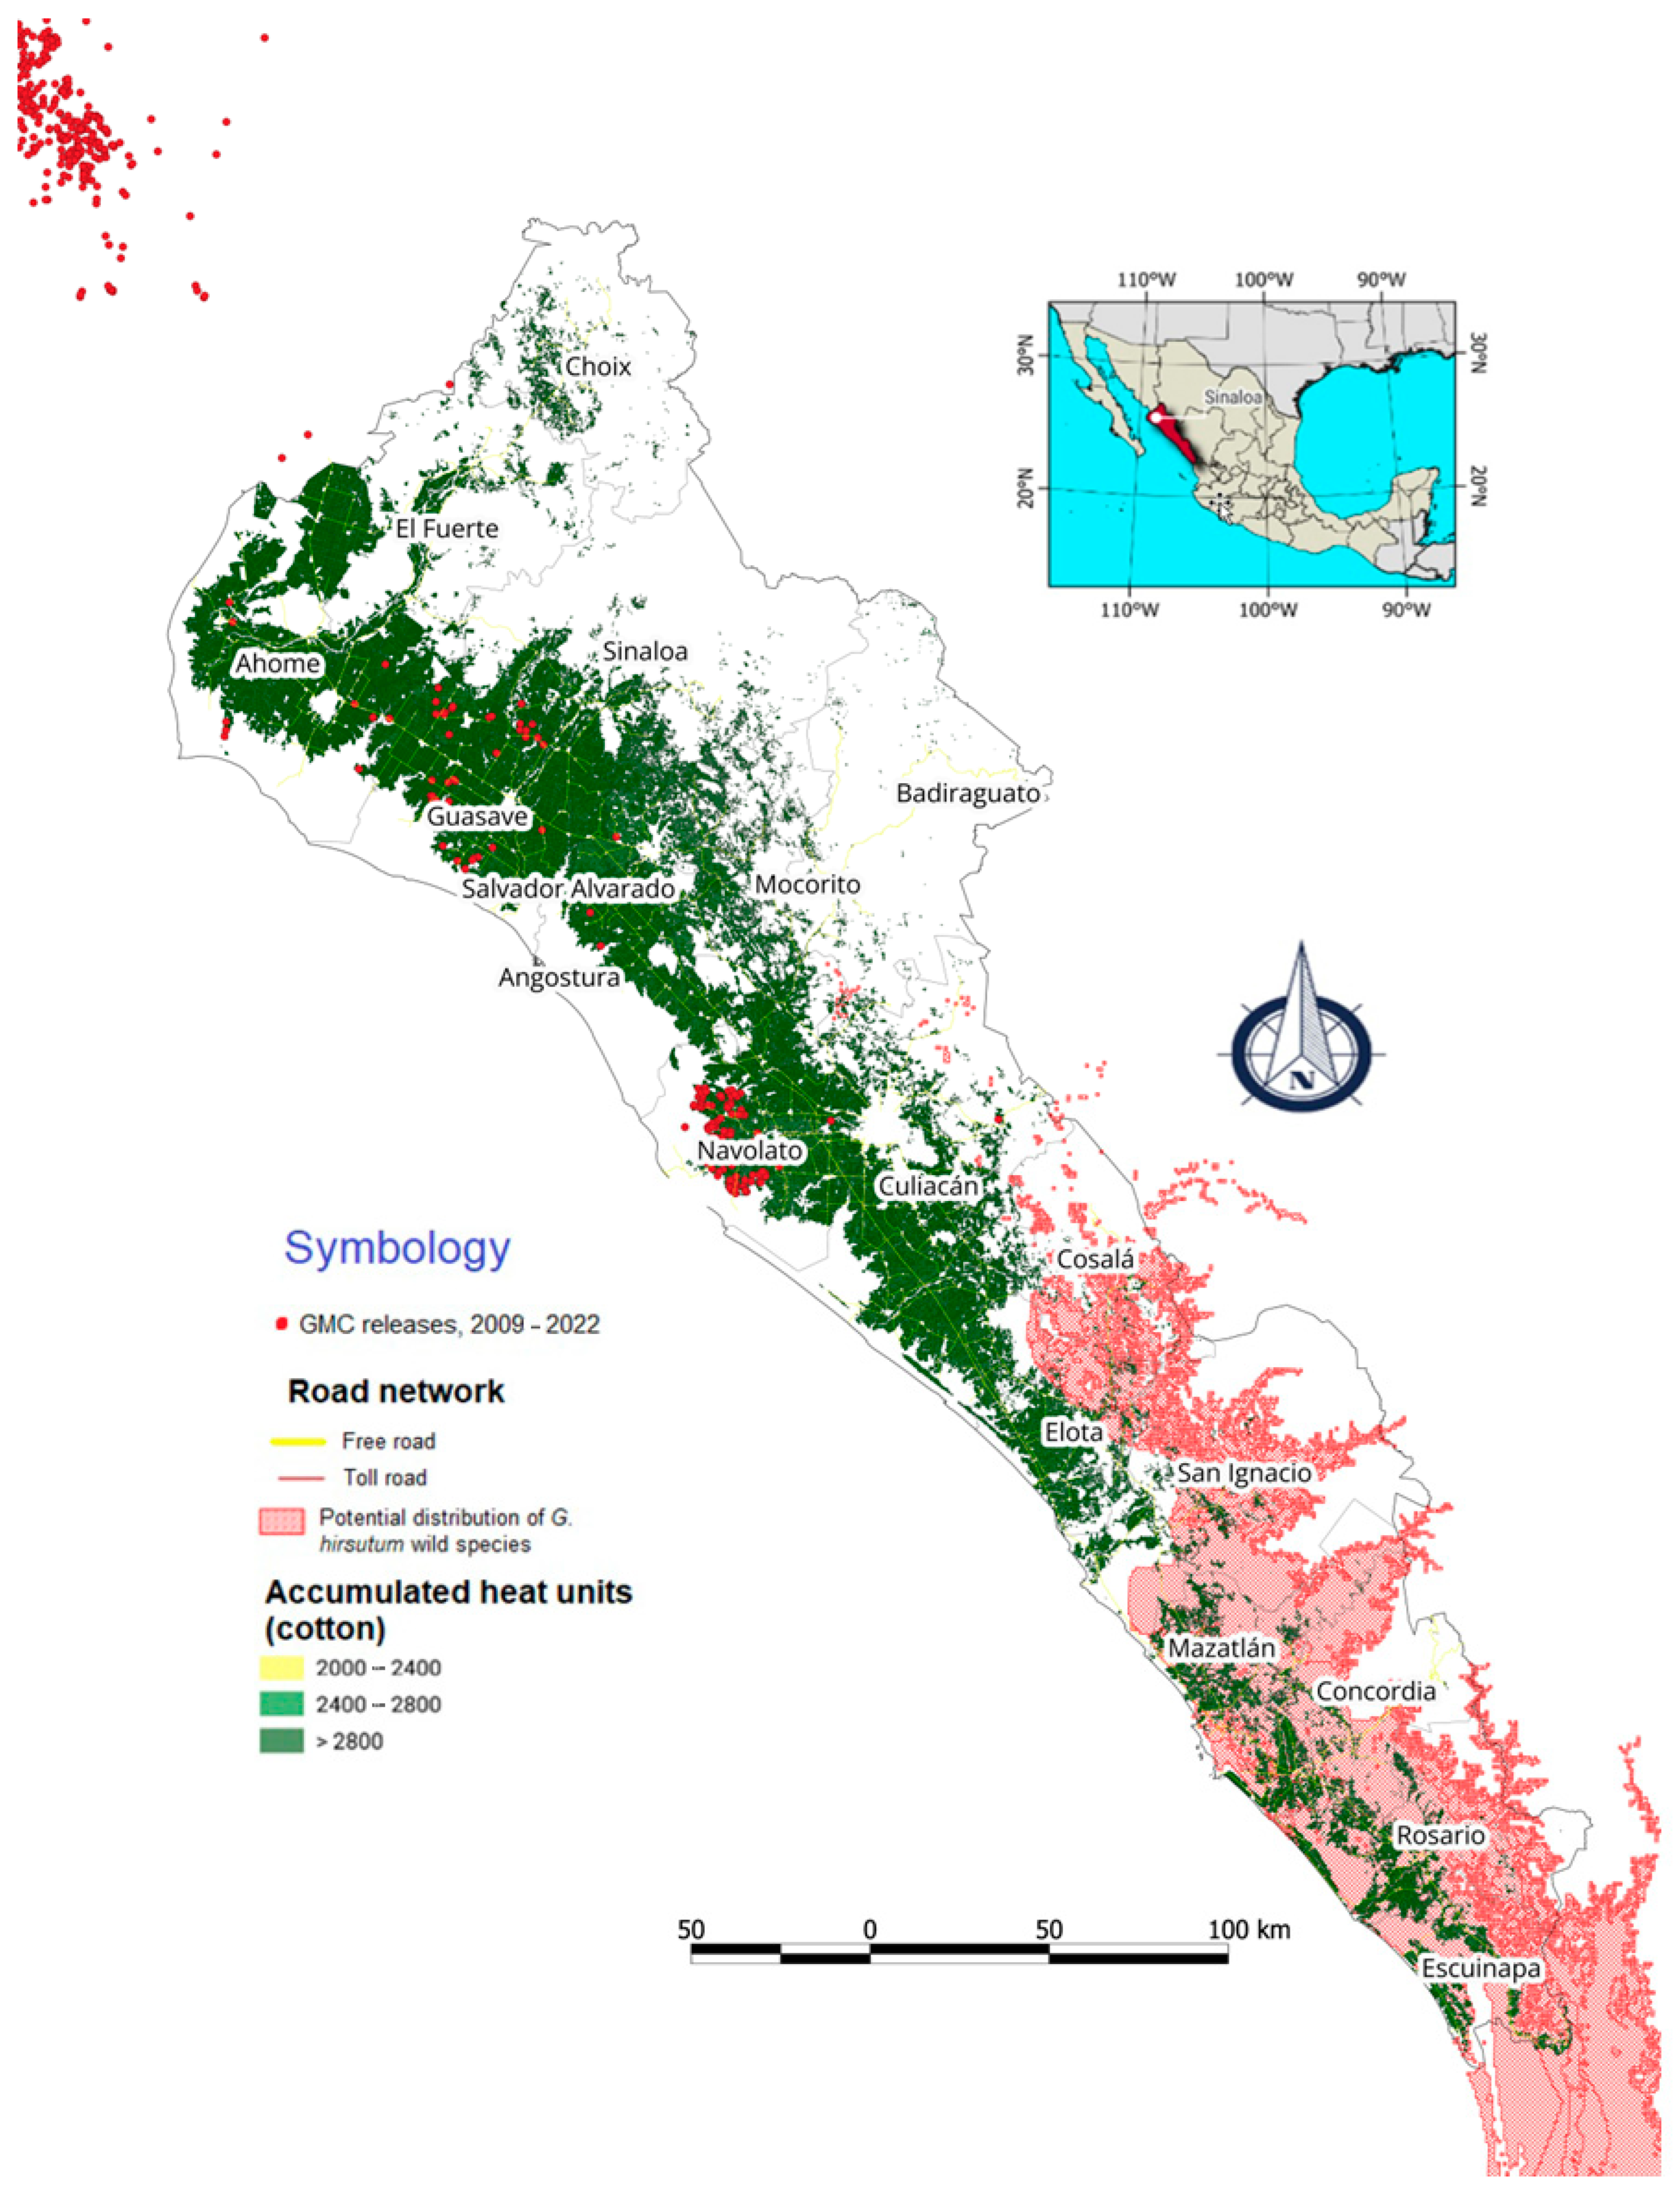
Figure 29 the superimposing the areas to assess the degree of overlap between
Figure 27 (Reference data) and
Figure 28 (Optimal areas).
4. Discussion
The geographic information system presented herein allows for the mapping of potential areas for GM cotton cultivation. The benefits provided by the method include the use of topographic, climatic, and edaphic information that gives it greater precision in the prediction of potentially suitable areas. Regarding this aspect, Rogers et al. [
60] evaluated areas potentially suitable for adapting GM and non-GM cotton crops in Australia using the Climex® V2 Climate Modelling Software with the climate matching function and a climate matching index greater than 0.7 for potential areas. During the model evaluation, these authors superimposed the results on vector layers with information on cultivated areas; to resolve the inconsistencies in the results, they applied refinement processes that consisted of considering new information, such as edaphic characteristics, water availability, and precipitation. Lawson et al. [
61] observed improvements when adding soil data to a model based solely on climate data from Australia. The methodology applied in the present study uses the optimal conditions for GM cotton cultivation (heat units calculated from climatic data [temperature and precipitation]) as decision criteria. It should be noted that the EPIC (Erosion Productivity Impact Calculator) model [
9] also highlights the use of the crop growth model based on accumulated heat units and the base temperature of each crop, with which they define the heat unit index for the growth model, from sowing to harvest. The process is very similar to the one used in the present study that determines cotton phenology [
53].
The GIS developed in the present study considers local precipitation; when local precipitation is below optimal conditions, it is checked whether there is any source of water supply in the area that could maintain the crop during drought seasons. Drought stress can adversely affect the potential of a region, even if other climatic and soil factors are favorable [
60]. In addition to the climatic conditions, the Biological and Environmental Considerations for Issuing GM Cotton Planting Licenses were considered.
The GIS generated was used to assess potential areas for growing GM cotton in seven states in northern Mexico, which are among the main cotton producers nationwide. Two potential areas were identified in the state of Baja California, one corresponding to the coastal area of San Quintín and the other in Mexicali, in the northern part of the state. The rest of the plots analyzed, corresponding to the municipality of Ensenada, lack optimal conditions.
The state of Sonora showed a larger area potentially suitable for cotton production, mainly in the municipalities of San Luis Rio Colorado, Hermosillo, Caborca, Guaymas, and the Yaqui zone, as shown in
Figure 22. Sinaloa has suitable conditions in the coastal area of the state, from Escuinapa to Ahome (
Figure 26). In Durango, the area potentially suitable for cotton production is located mainly in Guadalupe Victoria, Gómez Palacio, Lerdo, Nasas, and Poanas. In Chihuahua, the municipalities where the potential area is concentrated are Delicias, Saucillo, San Francisco de Conchos, Jiménez, López, Meoqui, Ojinaga, Aquiles Serdán, Ascensión, Ahumada, and Praxedis de Guerrero. In Coahuila, most areas suitable for cultivating GM cotton are concentrated in Torreón, Matamoros, San Pedro, Parras, General de Cepeda, and Ramos Arispe. Finally, in Tamaulipas, the municipalities of Reynosa, Rio Bravo, Valle Hermoso, Matamoros, Méndez, and San Fernando have great potential to establish cotton plantations.
5. Conclusions
The GIS developed in the present study using Python-based programming allows processing raster information from the CHIRTS and CHIRPS databases to calculate the daily maximum, minimum, and mean temperatures for each ~5.5 km2 at the equator by pixel (10 910 pixels per year) over a period of 37 years. Likewise, it allows for the calculation of the daily mean precipitation for each 5 km2 pixel (10,910 pixels) in the same period. This information feeds the GIS with the data required to calculate daily heat units, accumulated heat units, and daily and accumulated precipitation.
According to NOM-059-SEMARNAT-2020, it is necessary to protect the environment and native species of wild flora and fauna in Mexico. Therefore, the present study calculated the distances from each agricultural plot to the sites where wild cotton species or PNAs are located. If the distance from the agricultural plot to PNAs or native species is greater than 1 km and meets the agro-climatic and all other parameters, the response is positive.
The graphical representation of daily and accumulated heat units, as well as the minimum, mean, and maximum temperatures, allows for establishing the sowing date and estimating the plant development stages in a more practical way.
The GIS used the generated space weather information, overlaid it with the vector information, and determined potential areas for establishing cotton cultivation with 95 per cent accuracy.
