Article

Comprehensive Analysis of Soil Physicochemical Properties and Optimization Strategies for “Yantai Fuji 3” Apple Orchards

1
Institute of Plant Protection and Resources Environment, Yantai Academy of Agricultural Sciences, 26 Gangcheng West Street, Yantai 265500, China
2
College of Life Sciences, Yantai University, 30 Qingquan Road, Yantai 264005, China
*
Authors to whom correspondence should be addressed.
These authors contributed equally to the work.
Agriculture 2025, 15(14), 1520; https://doi.org/10.3390/agriculture15141520
Submission received: 14 May 2025 / Revised: 5 July 2025 / Accepted: 9 July 2025 / Published: 14 July 2025
(This article belongs to the Section Agricultural Soils)

Abstract

Based on an integrated analysis, this study summarized the current status of soil quality in Yantai apple orchards, developed a multivariate regulation model for key soil physicochemical properties, and proposed optimized fertilization strategies to improve soil quality in the region. The study analyzed the physicochemical properties of the topsoil (0–30 cm) in 19 representative apple orchards across Yantai, including indicators like pH, organic matter (OM), major nutrient ions, and salinity indicators, using standardized measurements and multivariate statistical methods, including descriptive statistics analysis, frequency distribution analysis, canonical correlation analysis, stepwise regression equation analysis, and regression fit model analysis. The results demonstrated that in apple orchards across the Yantai region, reductions in pH were significantly mitigated under the combined increased OM and exchangeable calcium (Ca). Exchangeable potassium (EK) rose in response to the joint elevation of OM and available nitrogen (AN), and AN was also positively influenced by EK, while OM also exhibited a promotive effect on Olsen phosphorus (OP). Furthermore, Ca increased with higher pH. AN and EK jointly contributed to the increases in electrical conductivity (EC) and chloride ions (Cl), while elevated exchangeable sodium (Na) and soluble salts (SS) were primarily driven by EK. Accordingly, enhancing organic and calcium source fertilizers is recommended to boost OM and Ca levels, reduce acidification, and maintain EC within optimal limits. By primarily reducing potassium’s application, followed by nitrogen and phosphorus source fertilizers, the supply of macronutrients can be optimized, and the accumulation of Na, Cl, and SS can be controlled. Collectively, the combined analysis of soil quality status and the multivariate regulation model clarified the optimized fertilization strategies, thereby establishing a solid theoretical and practical foundation for recognizing the necessity of soil testing and formula fertilization, the urgency of improving soil quality, and the scientific rationale for nutrient input management in Yantai apple orchards.

1. Introduction

China is a global leader in both apple cultivation and consumption [1]. Yantai apples are recognized for their unique “crisp and refreshing” texture. In 2022, the brand value of Yantai apples reached RMB 15.837 billion, securing its status as China’s top-ranked fruit brand for 15 consecutive years [2]. However, many orchards depend on empirical fertilization practices, resulting in imbalanced fertilizer structures and decreased economic and environmental efficiency [3,4]. Given the challenges of soil acidification, salinization, compaction, and fertility degradation, coupled with unclear key controlling factors [5], statistical and multivariate analyses of orchard soil physicochemical properties [6], along with fertilization structure optimization [7], can help enhance land resource utilization, improve soil quality, and increase fertilizer efficiency [8]. This approach boosts apple yield and quality [9], supporting safe production and sustainable ecological development [10].
Soil is a critical component in the growth and development of fruit trees [11,12]. Evaluating the abundance–deficiency index of soil nutrients is crucial for evaluating soil quality and developing soil testing and formula fertilization strategies [13,14]. The evaluation system for soil productivity encompasses 115 indicators, such as pH, OM (organic matter), AN (available nitrogen), OP (Olsen phosphorus), EK (exchangeable potassium), Ca (exchangeable calcium), EC (electrical conductivity), Na (exchangeable sodium), SS (soluble salts), and Cl (chloride ions), all of which are critical for assessing soil productivity [15,16]. Macronutrients (N, P, K) in apple orchard soils are crucial for evaluating soil quality and determining fertilization strategies [17,18]. Research has highlighted that calcium deficiency can cause significant problems, including reduced yield and a bitter pit [19,20]. Optimal levels of EC, Na, and SS are vital for maintaining soil structure stability, hydrological properties, and fertility [21,22,23,24,25,26]. Elevated Cl levels may reflect the quantity and quality of agricultural inputs, such as fertilizers, pesticides, and water sources [27,28]. In Yantai apple orchards, over-application and improper use of fertilizers, combined with the natural susceptibility of coastal and mountainous areas to salinization, may lead to primary or secondary salinization. Although these indicators have often been overlooked in traditional soil quality models, they are increasingly recognized for their diagnostic value and practical application potential in orchard ecosystems. All of these indicators have the advantages of simple testing equipment, easy data acquisition, and convenient field measurement, with great potential for widespread application [22], and they offer significant prospects for improving nutrient management [29].
Research on soil fertility in apple orchards primarily focuses on the interconnected framework of changes in yield, quality, soil physicochemical properties, chemical fertilizer reduction, and substitution with organic fertilizers [3]. Statistical methods, including correlation analysis, principal component analysis, and regression analysis, have been employed to evaluate soil quality, examining the interactions among soil fertility, fruit yield and quality, and post-harvest storage [16,30]. Studies by Kai et al. [3], Zhuang et al. [4], Zhang et al. [31,32], and Mota et al. [33] suggest that integrating organic fertilizers with reduced chemical fertilizers and trace elements, such as iron, zinc, and boron, can significantly enhance fruit tree yield and quality. Furthermore, research by Zheng et al. revealed low levels of OM and AN in apple orchard soils in Shaanxi Province [34], whereas Zhang et al. identified total nitrogen deficiencies in orchards on the Loess Plateau [35]. Cao et al. demonstrated a significant correlation between citrus mineral nutrition and soil nutrients in Zhejiang Province [36]. Yildiz et al. found significant relationships between the soil physicochemical properties and the nutrient content of plant leaves in apple orchards [37]. Ganai et al. found that pH exhibited a significant and positive correlation with Ca, while OM showed a positive and significant correlation with AN OP and EK in apple orchards [38]. Nevertheless, systematic research on the evaluation, comprehensive analysis, and optimization of soil physicochemical properties in Yantai apple orchards remains limited; this study fills that gap by incorporating novel indicators (Na, SS, Cl, EC) and constructing a rigorous multivariate analytical framework to support precision soil management.
This study investigates Yantai apple orchards, utilizing standardized measurement methods to analyze soil physicochemical properties, such as pH, OM, AN, OP, EK, Ca, Na, EC, SS, and Cl. Descriptive statistics analysis, frequency distribution, and curve fitting analysis were used to assess multivariate differences among the orchards, followed by a comprehensive evaluation of soil quality standards based on the soil quality classification standard for apple orchards. Correlations between the physicochemical properties were identified (canonical correlation analysis), and regression fitting analysis was conducted to identify key soil properties that significantly influence soil quality (establishment of the regression equation and the regression fitting model). We constructed a logically coherent analytical framework that includes canonical correlation analysis, stepwise regression, regression fit models, and a multivariate regulation model of soil physicochemical properties, and their associations with orchard input indicators facilitated the recognition of critical inputs. Based on this analysis, strategies for optimizing soil quality in Yantai apple orchards were explored, promoting the simultaneous enhancement of economic and environmental benefits and the sustainable growth of the contemporary apple industry.

2. Materials and Methods

2.1. Study Area

Yantai is situated in the northeastern part of the Shandong Peninsula and features a temperate continental climate. It is influenced by the East Asian monsoon, with an annual average temperature of 13 °C, annual precipitation of 722.2 mm, and a frost-free period lasting 210 days. Soil samples were collected from 19 representative “Yantai Fuji 3” apple orchards during their 7th to 9th production years. These orchards are characterized by brown earth soils with a loamy texture and planting densities ranging from 750 to 1200 plants per hectare. The sampling locations included Dayao Street (Muping District); Qishan Town and Fushan Town (Zhaoyuan City); Panshidian Town and Fangyuan Street (Haiyang City); Chengxiang Street and Longwangzhuang Street (Laiyang City); Zhuqiao Town (Laizhou City); Liujiagou Town, Nanwang Street, Xiaomengjia Town, and Heishan Township (Penglai District); Qijia Town, Zhuyouguan Town, and Dongjiang Street (Longkou City); Tangjiabo Town (Qixia City); Zangjiazhuang Town and Gaotuan Town (Fushan District); and Chaoshui Town (Development Zone) (Figure 1).

2.2. Soil Sample Collection

In July 2024, during the early fruit expansion stage, soil samples were collected using an “S”-shaped grid sampling method. Ten grid points were established along the “S”-shaped path within each orchard, and one apple tree was selected at the center of each sampling point. Using professional topsoil samplers (SQ-802C, Global Clearing (Beijing) Technology Co., Ltd., Beijing, China), soil from a depth of 0–30 cm was collected at the drip line of each selected tree. A total of 10 representative apple trees were sampled per orchard, ensuring scientific rigor, systematic spatial distribution, and objectivity in the sampling process. Impurities, such as roots and gravel, were removed, and the quartering method was applied by discarding two opposite quarters and repeating the process until approximately 1 kg of soil was collected, with relevant information marked before returning to the laboratory.

2.3. Soil Physicochemical Property Determination

Air-dried soil samples were passed through a 2 mm sieve for further use. A 5 g subsample was taken and mixed with deionized water at a 2.5:1 soil-to-water ratio, stirred for 5 min, and left to stand for 1 h before filtration, and the pH was measured using a pH meter (PH610, Beijing Wiggens Technology Co., Ltd., Beijing, China) [39]. Soil EC was determined using the electrode method with a 5:1 soil-to-water ratio (DDSJ-308F, Shanghai INASE Scientific Instrument Co., Ltd., Shanghai, China). The suspension was shaken for 30 min, allowed to settle for another 30 min, and then filtered prior to measurement [40]. Additionally, 2 g of samples was analyzed for AN using the alkali-diffusion method, with boric acid (CAS: 10043-35-3, Sinopharm Chemical Reagent Co., Ltd., Shanghai, China) as the absorbent solution titrated by sodium hydroxide (CAS: 1310-73-2, Sinopharm Chemical Reagent Co., Ltd., Shanghai, China) from an alkali burette [41]. Soil OP was extracted using 0.5 mol/L NaHCO3 (pH 8.5) (CAS: 144-55-8, Sinopharm Chemical Reagent Co., Ltd., Shanghai, China), shaken for 30 min, and filtered immediately, followed by determination using the molybdenum blue colorimetric method (UV-1100B, Shanghai ZiQi Laboratory Equipment Co., Ltd., Shanghai, China) [22,42]. Soil EK, Ca, and Na were measured using atomic absorption spectrophotometry with a 1 mol/L CH3COONH4 extractant (CAS: 631-61-8, Sinopharm Chemical Reagent Co., Ltd., Shanghai, China) at pH 7 (TAS-990, Beijing PERSEE General Instrument Co., Ltd., Beijing, China). K and Na extracts were obtained after 30 min of shaking and immediate filtration. For Ca, samples were stirred and centrifuged repeatedly until no calcium ion reaction was detected, followed by filtration and volume adjustment [22,43]. Soil Cl was analyzed from a 5 g sample using the silver nitrate titration method with a 5:1 soil-to-water ratio. Samples were shaken for 30 min, filtered under vacuum, and titrated with a standard AgNO3 solution (CAS: 7697-37-2, Sinopharm Chemical Reagent Co., Ltd., Shanghai, China) [44]. Soil SS was determined using the residue-drying method with a 5:1 soil-to-water ratio. The suspension was shaken for 30 min and filtered under vacuum, and the filtrate was evaporated to dryness [45,46]. Soil OM was analyzed from a 0.2 g sample; to analyze samples in the analyzer, you should ground them smaller than 0.15 mm using the elemental analyzer method (vario MAX cube, Elementar Trading (Shanghai) Co., Ltd., Shanghai, China) [47]. Detailed procedures for instrument operation followed the respective manufacturers’ manuals.

2.4. Soil Quality Classification Standard for Apple Orchards

The second national soil survey conducted in China [48], particularly in Shandong Province [49], serves as a key reference for classifying the physicochemical properties of orchard soils. To account for changes in agricultural practices over time, our study incorporated historical analyses of Yantai orchard soils from various periods, emphasizing regional variations in soil properties [49,50,51]. For the apple orchard soils in Yantai, we relied on our research team’s significant findings and extensive laboratory analysis experience [52,53,54,55,56]. To enhance the quality of apple orchard soils, we developed the “Yantai Apple Orchard Soil Physicochemical Classification Standard” (Table 1). Specifically, soil pH was categorized into seven levels according to Liu et al. [57]. Soil OM, AN, OP, and EK were divided into five levels according to studies by Zhang et al., Zheng et al., and Li et al. [58,59,60,61]. Soil Ca and EC were classified into five levels based on Zhang et al. and Luo et al. [60,62]. Soil SS, Cl, and Na were grouped into two levels according to research by Jiang et al., Bao et al., He et al., Ma et al., Cheng et al., and local standards [63,64,65,66,67,68]. Specific physicochemical indicators, such as AN, OP, EK, and EC, should not be maintained at excessively high levels. Similarly, elevated levels of Na, SS, and Cl are undesirable.

2.5. Data Processing

Standardized data collection methods were applied to ensure data reliability and accuracy. Multivariate statistical analyses comprised frequency distribution analysis, nonlinear frequency fitting, canonical correlation analysis, root mean squared error (RMSE), Akaike Information Criterion (AIC), AIC corrected form (AICc), and establishment of the regression equation and regression fit model. Data processing, statistical analyses, and graph plotting were conducted using OriginPro 2024 (version number: 10.1.0.178) and Microsoft Office Professional Plus 2013 (version number: 15.0.4420.1017), all on a 64-bit Windows platform. Specifically, for the frequency distribution analysis, column plots were created based on the “Bin Center” and “Relative Frequency” columns. For nonlinear frequency fitting analysis, the peak function option was set to “Gauss”. Canonical correlation analysis used Pearson correlation coefficients to assess linear relationships between variables. In the establishment of the regression equation, the “Parameters” and “ANOVA” table data were used for outputting “Regression Equations.” The univariate 2D linear regression fitting model was developed by creating scatter plots for different physicochemical properties and filling in the corresponding “Confidence Bands” The bivariate 3D plane regression fitting model selects “Nonlinear Surface Fit” in the analysis and then manually inputs the corresponding bivariate linear equation in the “Function Body” section before proceeding with the fitting process.

3. Results

3.1. Descriptive Statistics Analysis of Soil Physicochemical Properties in Yantai Apple Orchards

The pH, OM, AN, OP, EK, Ca, EC, SS, and Cl in the topsoil were measured, and descriptive statistical analysis was conducted (Table 2). A quality assessment based on the mean values of each indicator showed that the overall soil pH was slightly acidic, OM was at a moderate to low level, AN was relatively high, OP and EK were at the highest levels, Ca was low, EC was moderate, Na was relatively high, SS was at a moderately low level, and Cl was low in Yantai apple orchards. The coefficient of variation (CV) for soil physicochemical properties in the Yantai region was found to be relatively high (ranging from 14.0% to 149.64%), and the variability ranking of the ten indicators was as follows: pH < Na < SS < Ca < AN < OM < OP < EK < EC < Cl. Based on the standard error (SE) and amplitude of variation (AV), a broad distribution of soil quality grades was observed, and the soil quality in some orchards was relatively low. This condition was characterized by acidic pH, elevated levels of Na, SS, and Cl, and insufficient levels of AN, OP, EK, OM, and Ca. The importance of promoting awareness of soil testing and formula fertilization in Yantai apple orchards to minimize differences in soil quality was underscored by these findings.

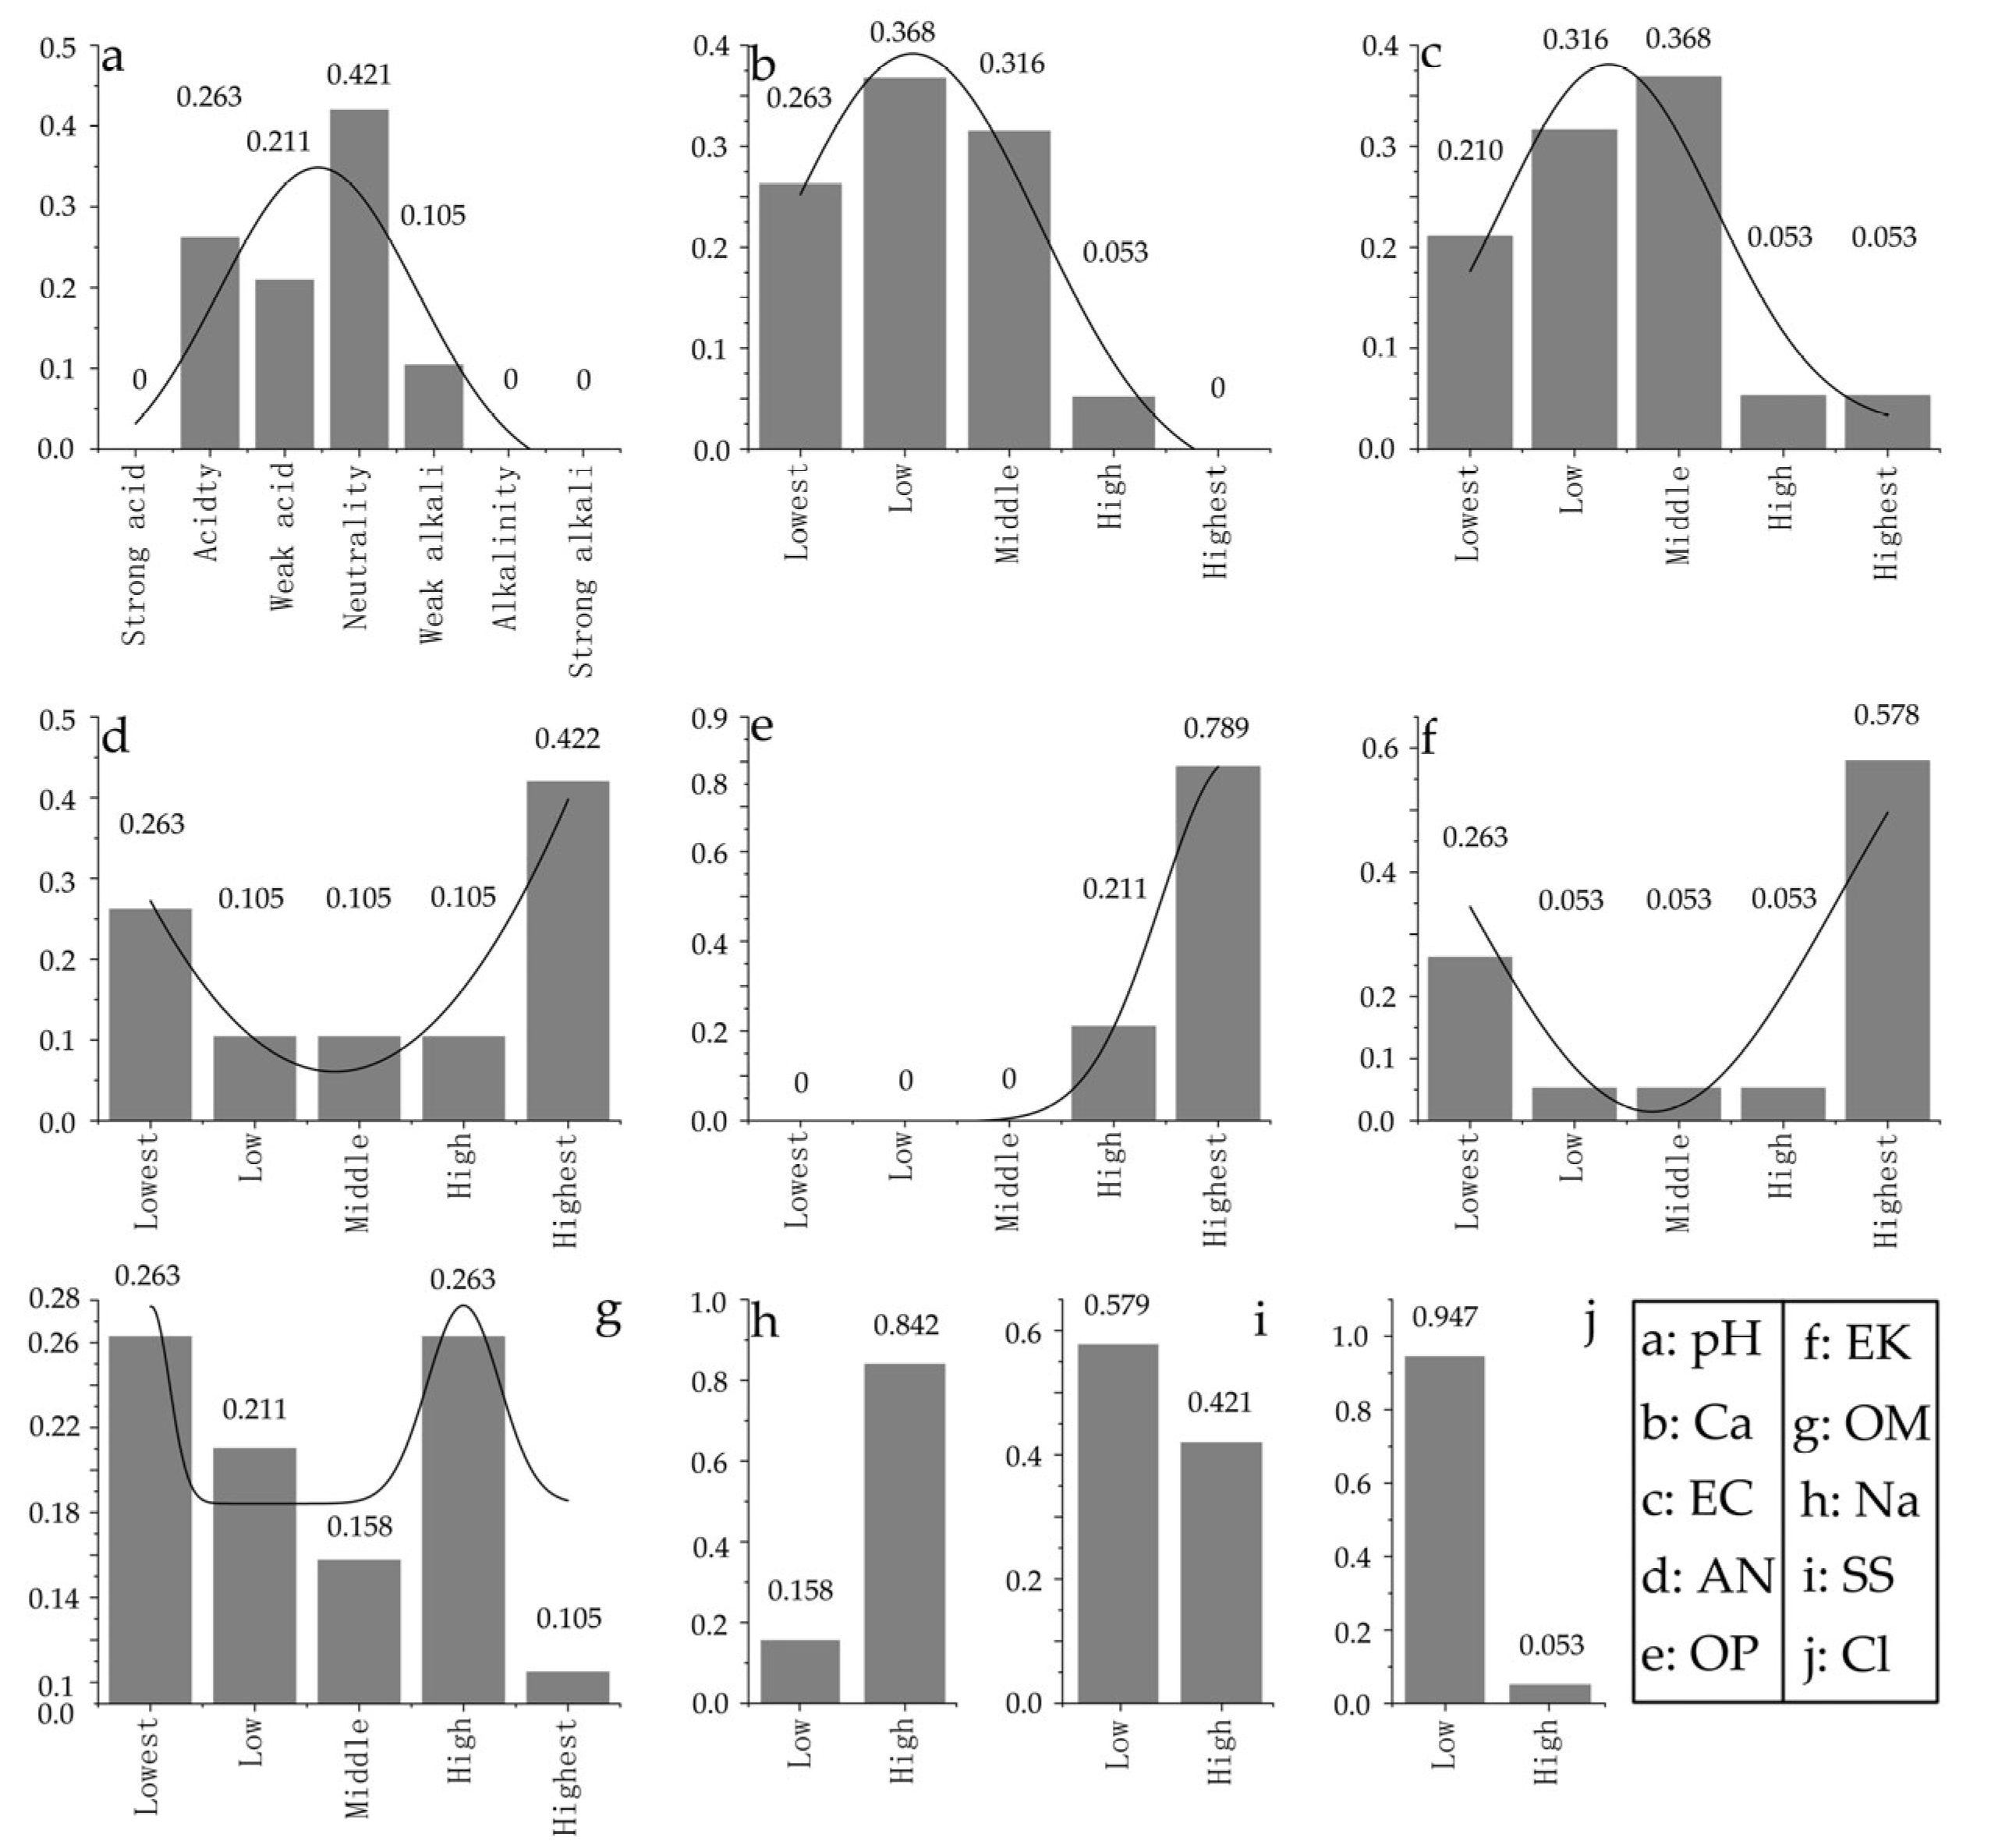
3.2. Frequency Distribution Analysis of Soil Quality Classification Indexes in the Yantai Apple Orchard Region

Based on the classification standards (Table 1), the soil quality distribution in apple orchards in Yantai was analyzed using frequency distribution and curve fitting methods (Figure 2). It was shown that pH was most frequently distributed in the neutrality, acidity, and weak acid categories, with a cumulative frequency of 89.5% of the samples (Figure 2a). Similarly, Ca was mainly concentrated in the low, middle, and lowest categories, representing 94.7% (Figure 2b), and EC was primarily distributed across the middle, low, and lowest categories, with a cumulative frequency of 89.4% (Figure 2c). In contrast, the highest frequencies for AN and EK were observed at both the lowest and the highest levels, with AN at 68.5% and EK at 84.1% (Figure 2d,f). Notably, convergence of the nonlinear fitting for EK was not achieved after three iterations. OP was entirely distributed within the high and highest levels (100%). Similarly, convergence of its curve fitting was also not achieved after three iterations (Figure 2e). A bimodal distribution was exhibited by OM, with the lowest frequency at the highest level and the highest frequencies at the lowest and high levels (52.6%) (Figure 2g). Na was predominantly found in the high category (Figure 2h), whereas SS and Cl were mostly concentrated in the low category (Figure 2i,j). In summary, in the apple orchards of Yantai, the frequency distributions of pH, Ca, and EC followed unimodal curve patterns; AN and EK followed single-valley curve fittings; OP presented an increasing trend; and OM presented a bimodal pattern. The soil in these orchards was found to be slightly acidic, with relatively low levels of OM, Ca, and EC and relatively high but unevenly distributed levels of AN, OP, and EK. Additionally, negative soil quality indicators—Na and SS—were present at excessively high levels, which might have posed adverse effects. It was indicated by these results that the frequency distribution characteristics of different soil physicochemical property grades varied in the apple orchards of Yantai, as reflected in the presence of values across various grades with uneven distribution. The broad distribution patterns of soil quality and the derived results were found to be consistent with the previous descriptive statistics analysis.

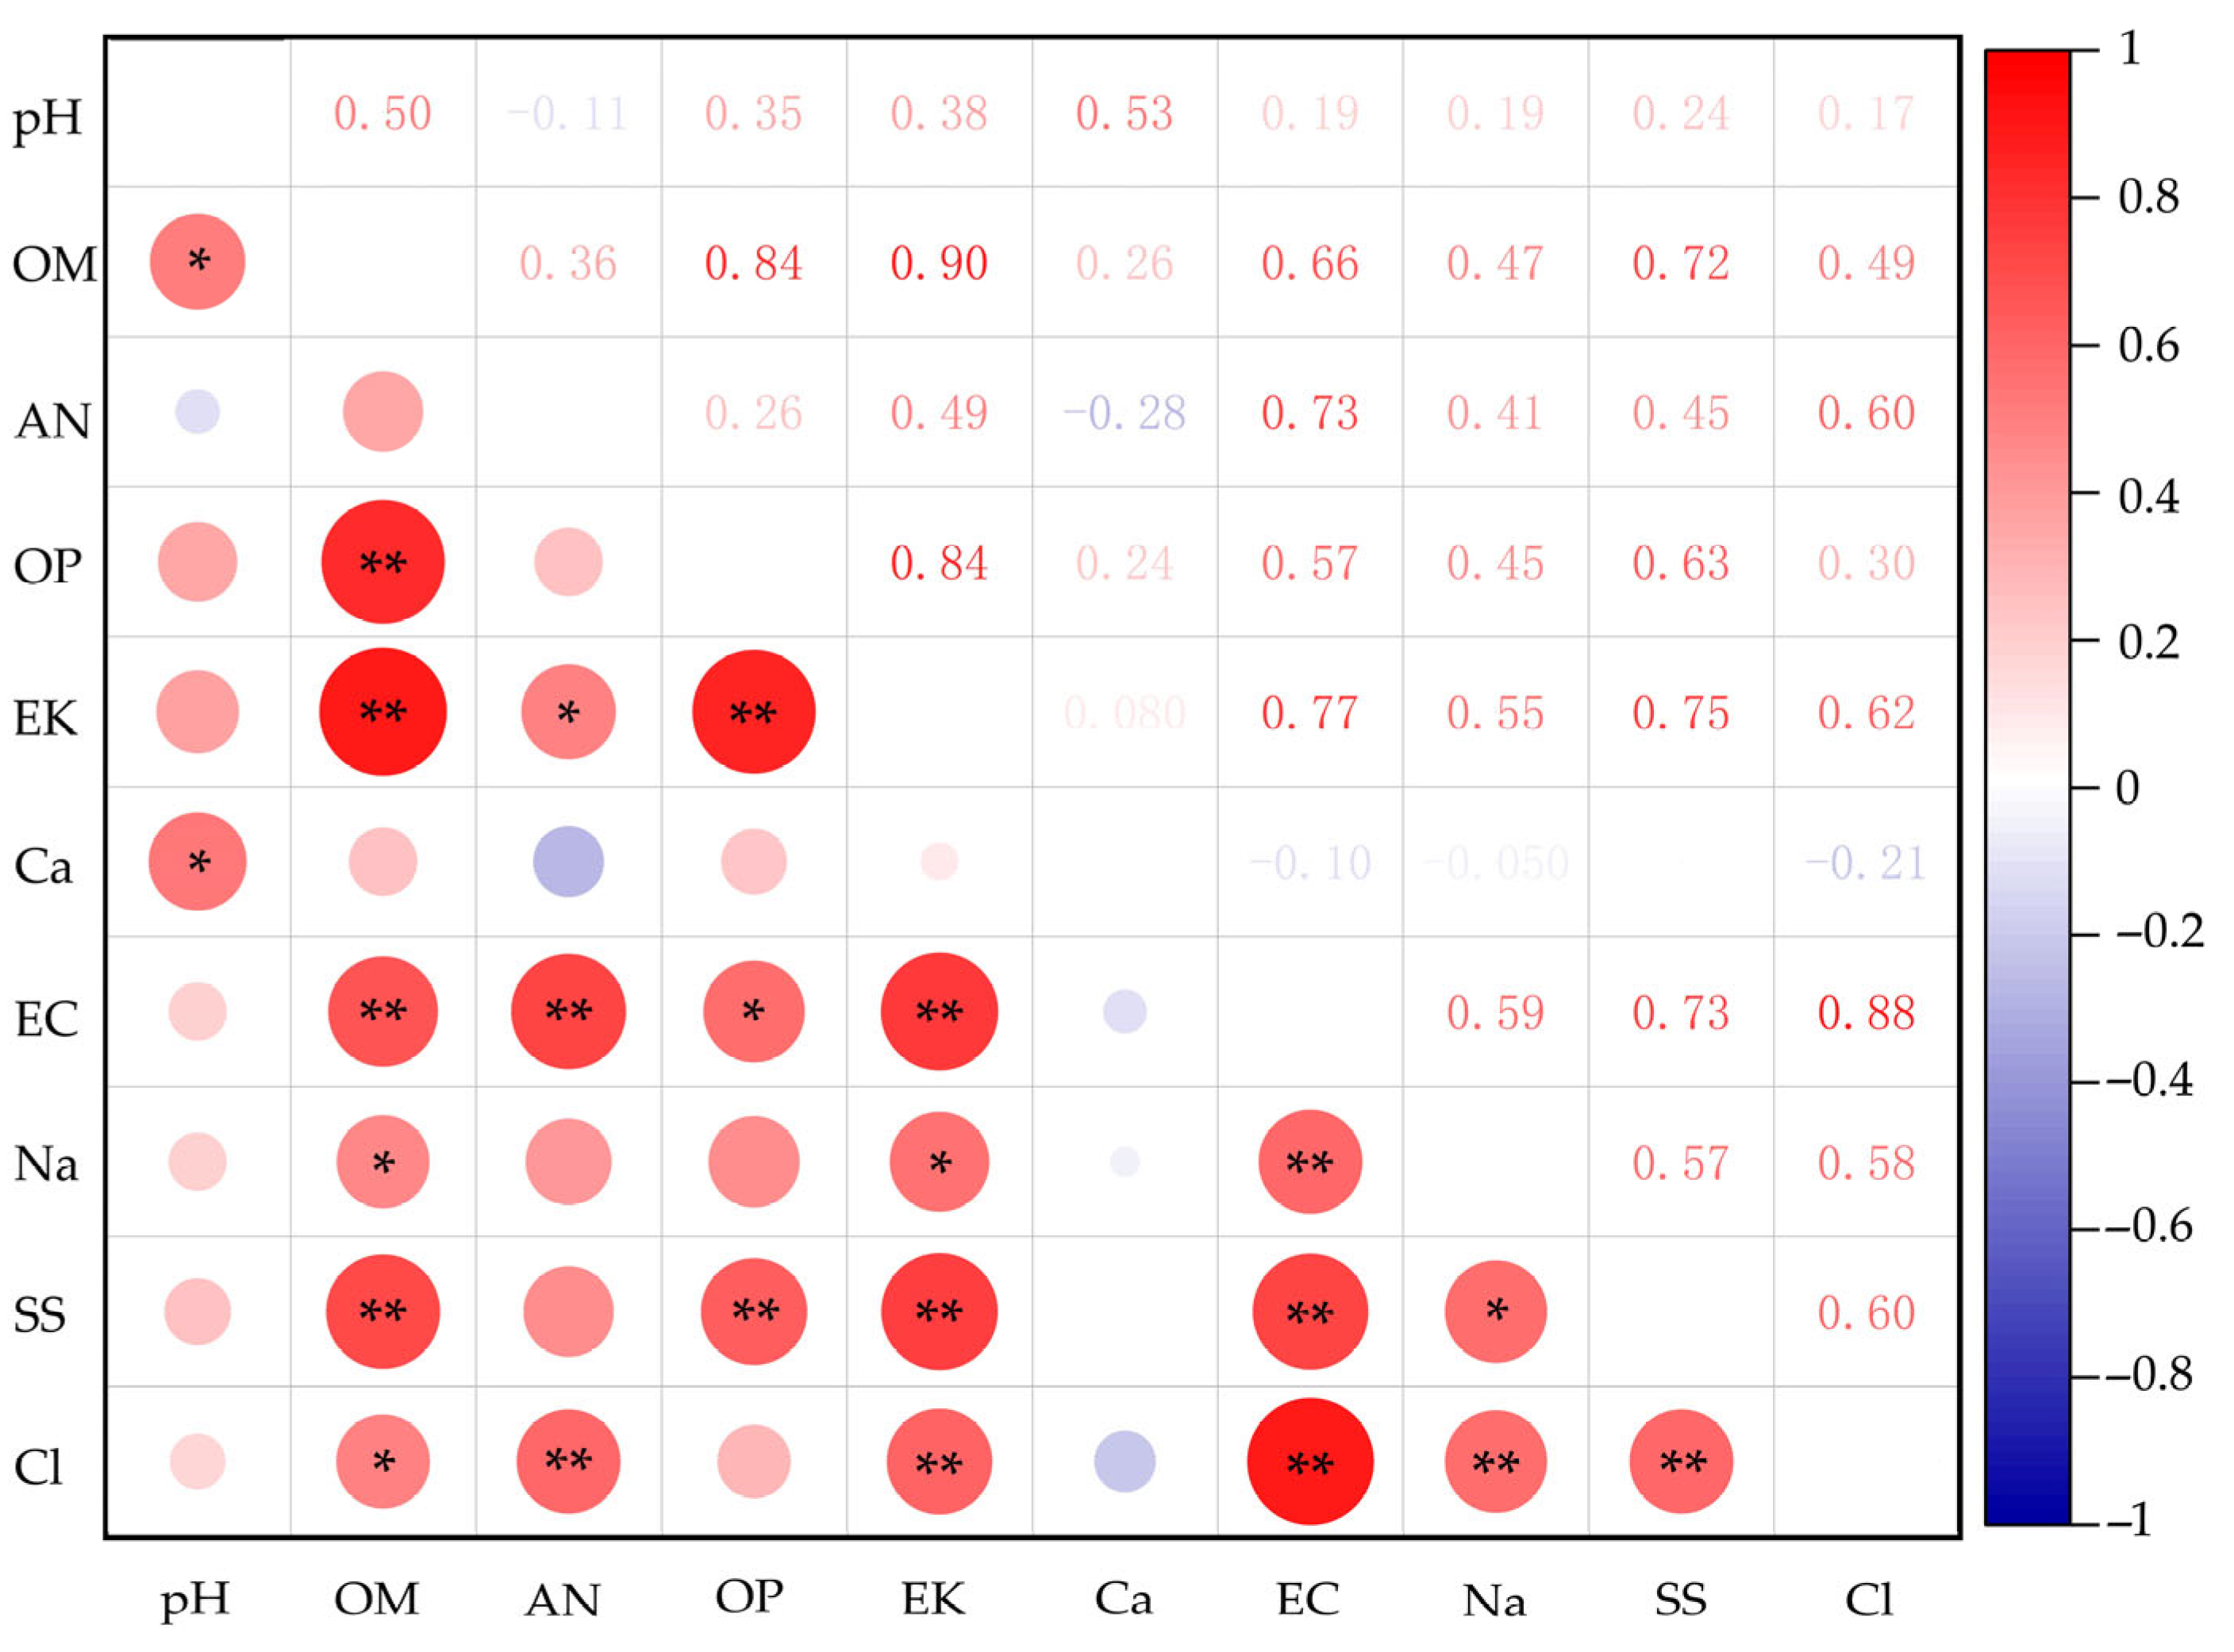
3.3. Canonical Correlation Analysis of Soil Physicochemical Properties in Yantai Apple Orchards

Canonical correlation analysis was performed to investigate the correlative relationships between pairs of soil physicochemical variables in Yantai orchards, focusing on those with significant or highly significant correlations (Figure 3). It was indicated by the results that Ca was significantly positively correlated only with pH (p < 0.05), whereas pH was significantly positively correlated with OM (p < 0.05). Significant positive correlations of soil OM with Na and Cl (p < 0.05), and highly significant correlations with OP, EK, EC, and SS (p < 0.01), were observed. Among these variables, significant positive correlations of EK with AN and Na (p < 0.05), and highly significant correlations with EC, SS, and Cl (p < 0.01), were observed. Similarly, highly significant positive correlations of SS and AN with Cl (p < 0.01) were observed. Additionally, highly significant positive correlations of SS and AN with Cl (p < 0.01) were observed. Overall, numerous significant or highly significant positive correlations, along with a few negative ones, were displayed among soil physicochemical properties in Yantai apple orchards. It was suggested by these findings that multiple significant or highly significant synergistic and antagonistic interactions existed among the variables. However, such complex relationships, particularly those involving more than two sets of variables, could not be fully explained by canonical correlation analysis alone. Therefore, canonical correlation analysis could be used as a foundation for identifying significantly related sets of independent variables. These variables could then be utilized in subsequent multivariate regression analyses and model fitting, thereby laying the groundwork for a more in-depth exploration of the complex interactions among soil physicochemical properties.

3.4. Establishment of the Stepwise Regression Equation for Soil Physicochemical Properties in the Yantai Apple Orchard Region

The complex multivariate correlations among soil physicochemical properties were explored, building on the assessment of current soil quality in Yantai apple orchards and addressing the limitations of canonical correlation analysis. All regression equations were statistically significant (p < 0.05) (Table 3), indicating the reliability of the multivariate regression relationships identified. Priority was given to selecting soil physicochemical variables closely associated with orchard inputs, such as pH, OM, AN, OP, EK, and Ca, so that the selection of independent variables could be standardized. Simultaneously, root mean square error (RMSE), Akaike Information Criterion (AIC), and its corrected version (AICc) were introduced so that comprehensive evaluation and optimization of the regression models could be ensured. When Na was set as the dependent variable (y), the regression equation based on the significantly correlated independent variables (x2, x5, x7, x9, x10) identified through canonical correlation analysis was not found to be statistically significant (p > 0.05), which was noteworthy. Consequently, the independent variables were redefined as EC, SS, and Cl, from which the following equation was derived: y = 0.04139x7 + 18.39293x9 + 0.85299x10 + 115.89144. Significant univariate or multivariate regression relationships were demonstrated by the results between dependent and independent variables. Among these, the regression equations involving the following variable combinations—pH with OM and Ca (p < 0.05); OM with OP and EK (p < 0.0001); AN with EK (p < 0.05); OP with OM (p < 0.0001); EK with OM and AN (p < 0.0001); Ca with pH (p < 0.05); EC with AN and EK (p < 0.0001); Na with EK (p < 0.05); SS with EK (p < 0.001); and Cl with AN and EK (p < 0.01)—showed the closest alignment with both observed values and real-world conditions. An optimal balance between goodness of fit and scientific validity was struck by these regression equations for Yantai apple orchards, revealing pronounced and complex univariate and multivariate regression relationships among various soil physicochemical properties, thereby allowing a strong theoretical foundation to be provided for optimizing orchard fertilization strategies.

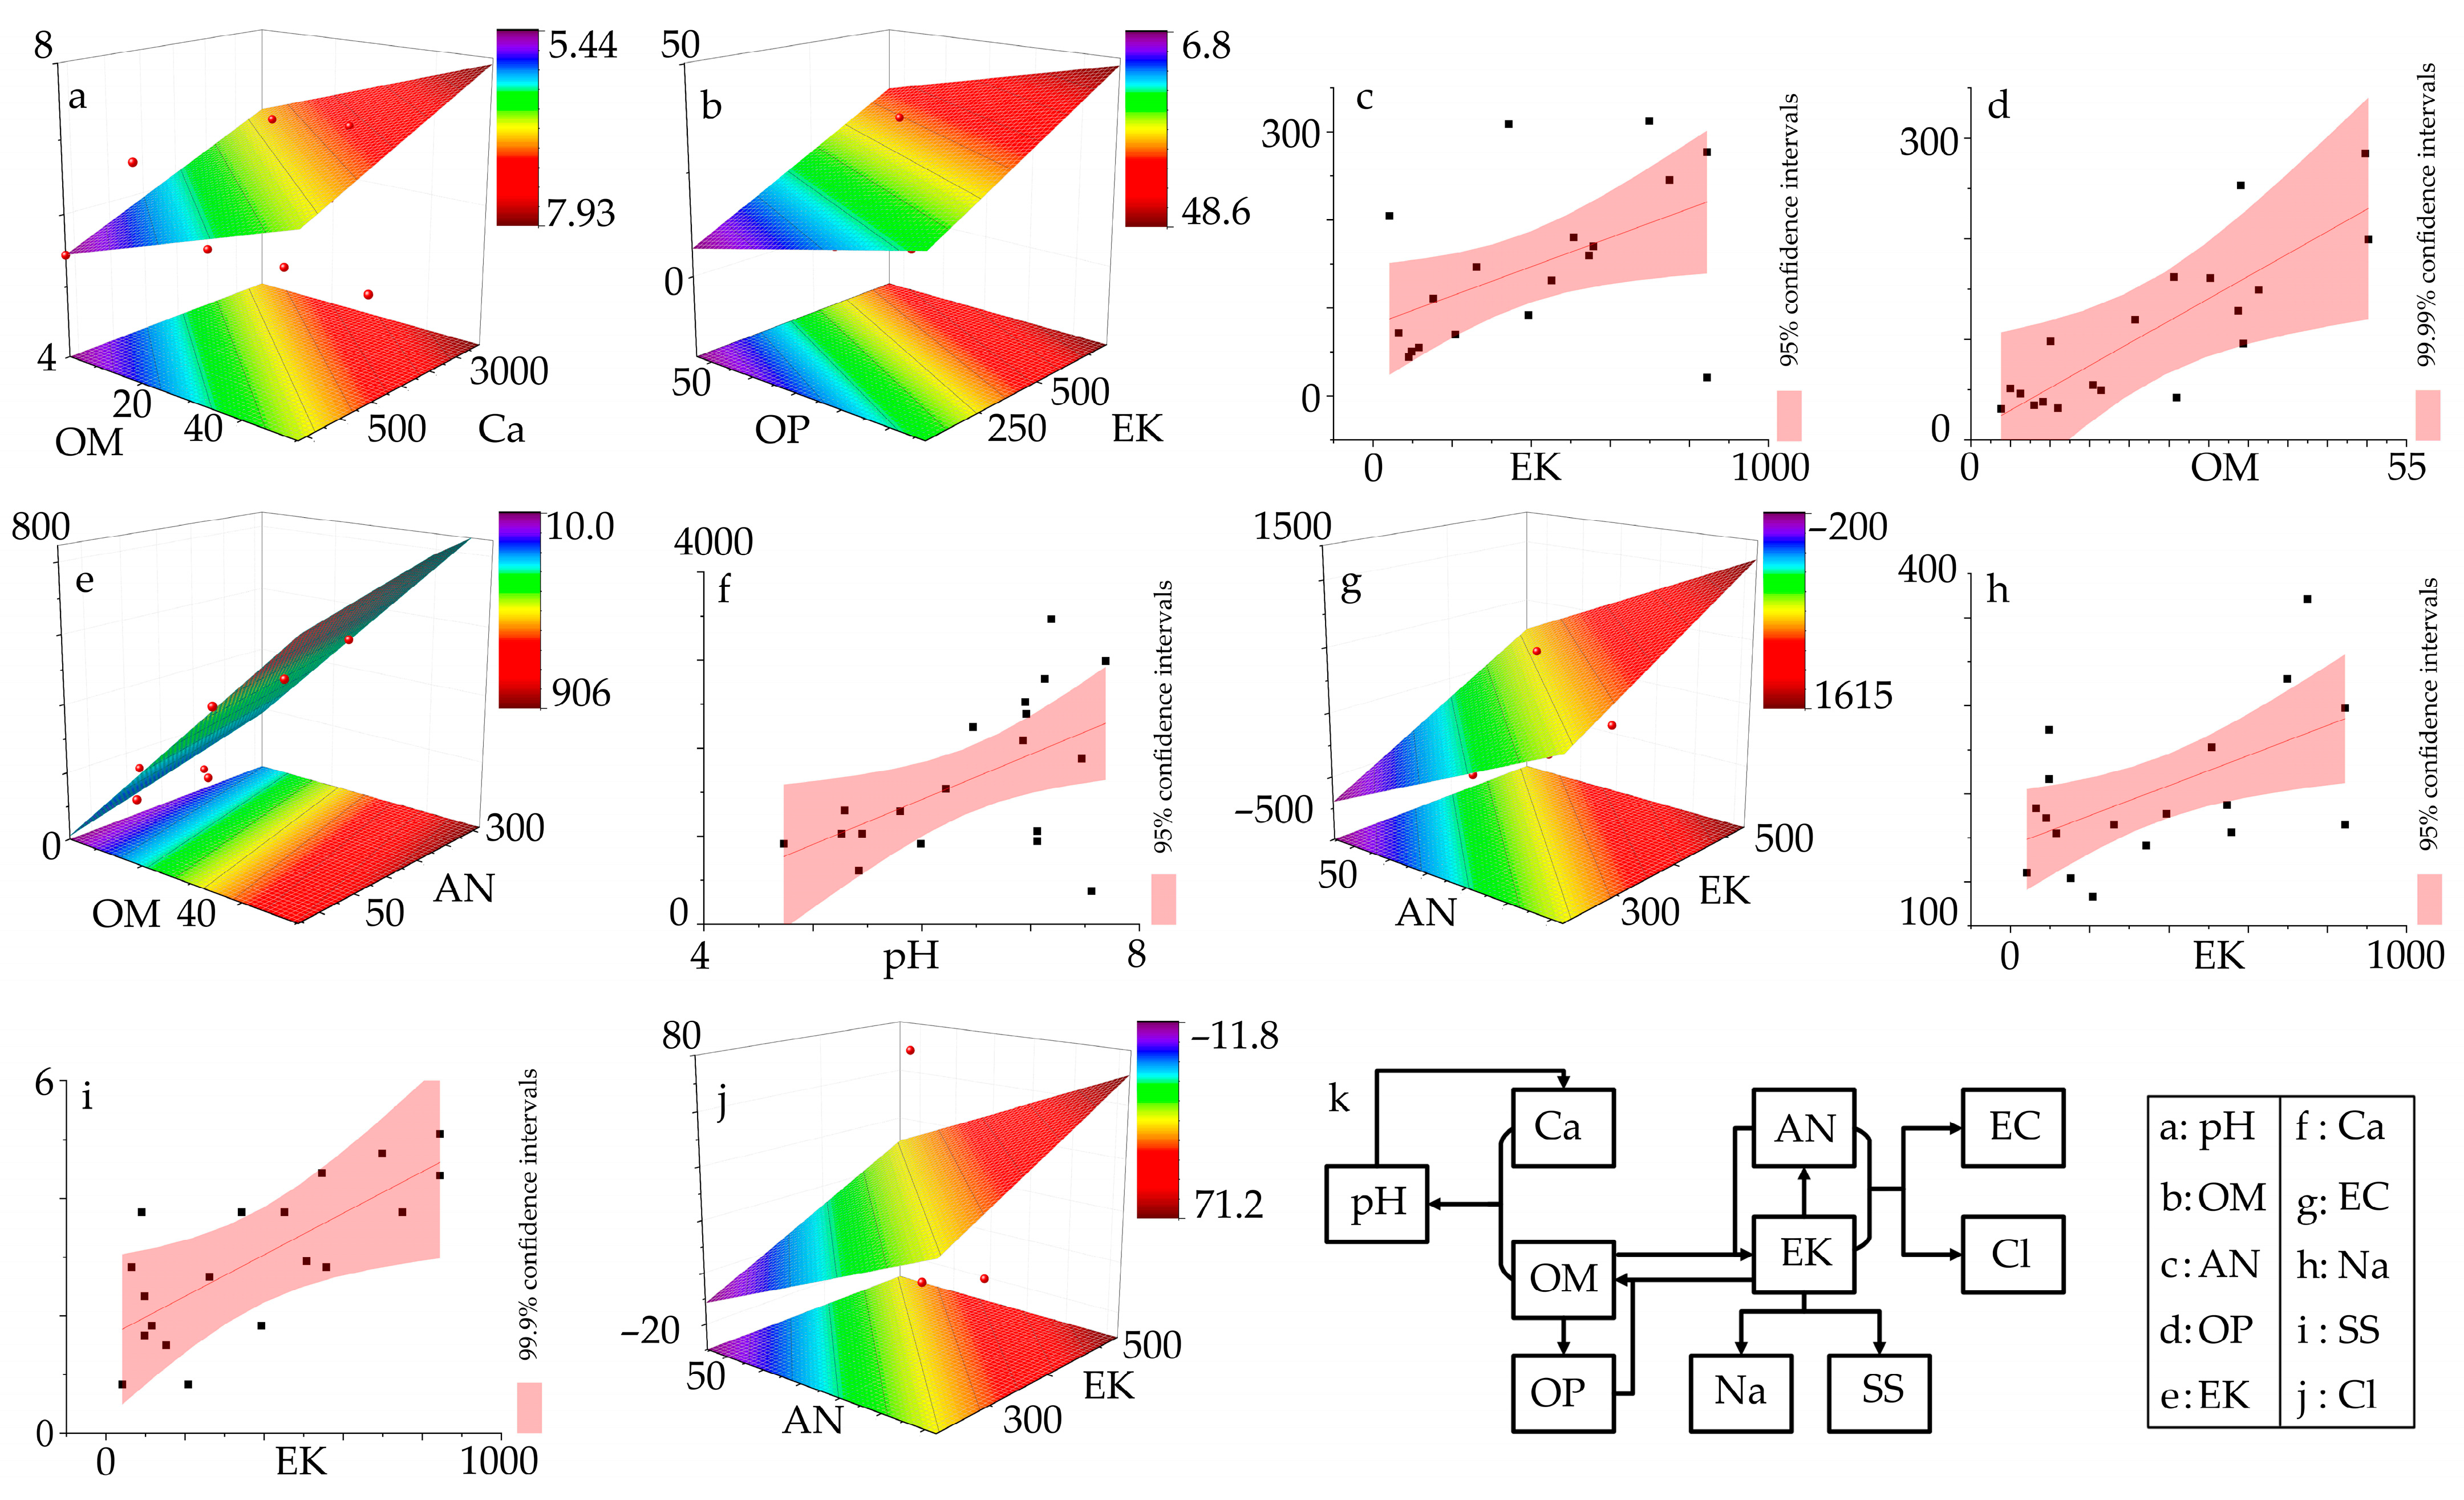
3.5. Analysis of Regression Fit Model for Soil Physicochemical Properties in Yantai Apple Orchards

Univariate and multivariate regression equations were established to explore the relationships among soil physicochemical properties. 2D linear fitting models and 3D planar fitting models were subsequently constructed, incorporating key statistical indicators, including significance levels, to elucidate the integrated and visualized relationships among variables, ultimately resulting in the establishment of a multivariate regulation model of soil physicochemical properties for Yantai apple orchards. Clear linear or planar relationships among soil physicochemical properties were revealed by the results. Specifically, an increase in pH was promoted by simultaneous increases in OM and Ca (Figure 4a); an increase in OM was promoted by the joint rise in OP and EK (Figure 4b); increases in AN, Na, and SS were facilitated by a unilateral increase in EK (Figure 4c,h,j); an increase in OP was linked to a single increase in OM (Figure 4d); the rise of EK was promoted by combined increases in OM and AN (Figure 4e); the increase of Ca was facilitated by a single increase in pH (Figure 4f); and significant increases in EC and Cl resulted from the joint increase in AN and EK (Figure 4g,j). All corresponding regression fit models were found to be statistically significant (p < 0.05, 0.0001, 0.05, 0.0001, 0.0001, 0.05, 0.0001, 0.05, 0.001, 0.01) (Table 3), with comprehensive integration into the multivariate regulation model of soil physicochemical properties (Figure 4k). These findings indicated that soil physicochemical properties were influenced not only by the direct input of specific elements through orchard management but also by the synergistic effects of one or two other soil physicochemical properties. This enhanced the predictive power and interpretability of soil quality assessment and management in Yantai apple orchards.

4. Discussion

4.1. Current Status and Quality Assessment of Soil Physicochemical Properties in Yantai Apple Orchards

Orchard soil quality, which is influenced by site conditions, plays a crucial role in nutrient supply, which is essential for crop yield and quality. Descriptive statistics and frequency distribution analyses revealed that soil physicochemical properties in Yantai’s apple orchards vary significantly. This suggests wide variation in soil quality grades. The average pH is 6.45, which is slightly acidic and favorable for apple growth [57,69]. However, some orchards experience severe acidification (26.3%), with pH levels dropping to 4.73, negatively affecting nutrient availability [69]. The benefits of OM for yield and quality are well-recognized, and increasing its application is generally recommended [3,53,54]. The average OM in Yantai apple orchards is moderate at 22.42 g/kg, Although 36.8% of the orchards exhibit relatively high organic matter content, 63.2% remain at moderately low levels, with the lowest level reaching 26.3%. This indicates that the majority of apple orchards in the Yantai region still have low soil OM levels, reflecting generally insufficient application of organic fertilizers. In Yantai orchards, increases in soil AN (21.63–38.05%), OP (5.60–54.69%), and EK (14.74–125.92%) are positively correlated with improvements in apple yield, which rose by 7.47–33.80% [53,54,55].
However, the practice of high-input, high-output cultivation has led to declines in soil quality and nutrient absorption efficiency [5,70]. Excessive nutrient levels can also reduce the effectiveness of other nutrients and lead to the accumulation of harmful substances [8,71] (as discussed in Section 4.2 and Section 4.3). Nutrient levels in Yantai orchards are alarmingly high. The fluctuations exhibited by AN and EK are primarily observed at both low and high extremes, while OP is consistently found at high levels, indicating an excessive and uneven distribution of macronutrient inputs. Compared to previous studies on Yantai orchards [49,50,53,54,55,72], the levels of pH, OM, and macronutrients have significantly increased, providing a better foundation for improved yield and quality. These advancements are attributed to an enhanced understanding of soil improvement and fertility enhancement in orchards, along with the widespread adoption of new fertilizers, organic alternatives, innovative technologies, and micronutrient conditioners in soil testing and formula fertilization practices.
The distribution of Ca follows a “low at both ends, high in the middle” pattern, indicating insufficient calcium content and application in orchard soils. This deficiency could lead to physiological disorders, such as apple bitter pit [19,20]. The EC level is moderate to low, indicating uneven distribution. This finding indicates a potential to mitigate soil acidification, reduce the accumulation of macronutrients, such as nitrogen, phosphorus, and potassium, and improve levels of organic matter, calcium, and electrical conductivity (EC) in orchard soils. The Na level is high and requires special attention due to potential sodium carryover from agricultural inputs. Additionally, both SS and Cl are at low levels (57.9% and 94.7%); however, attention should be given to rising trends in certain orchards. The findings of this study provide valuable data for soil testing and fertilization strategies to improve soil quality in Yantai apple orchards.

4.2. Multivariate Statistical Analysis and Regression Fit Model Analysis of Soil Physicochemical Properties in the Yantai Apple Orchard Region

For Yantai apple orchards, the canonical correlation analysis, stepwise regression equation analysis, and regression fit model analysis are interconnected, forming a coherent scientific framework. This suggests a significant plane-fitting relationship between Ca, OM, and pH, emphasizing their interdependence and mutual influence. This finding is partially consistent with the results reported by Feng et al. and Cao et al. in citrus orchards, where pH was negatively correlated with OM but positively with Ca [73,74]. It more closely aligns with Zhang et al.’s study in peach orchards, which reported a positive correlation between pH and both OM and Ca [75]. Additionally, our results are consistent with those of Ganai et al., who also reported a significant positive correlation between pH and Ca in apple orchards [38]. Soil OM is significantly correlated with pH, OP, EK, EC, Na, SS, and Cl. Soil OM is significantly correlated with pH, OP, EK, EC, Na, SS, and Cl, with EK, OP, and OM showing the most significant plane-fitting relationship. This is consistent with the studies by Wang et al. and Ganai et al. on apple orchards, as well as those by Feng et al. and Cao et al. on citrus orchards and Zhang et al. on vineyards and peach orchards [38,73,74,75,76,77]. Soil AN is significantly correlated with EK, EC, and Cl, with EK as the independent variable and AN as the dependent variable showing a significant linear regression relationship (p < 0.05). This is consistent with the studies by Feng et al. and He et al. in citrus orchards, Zhang et al. and Wang et al. in apple orchards, and Zhang et al. in vineyards orchards [31,73,76,77,78] and consistent with the fact that K + promotes the absorption and transportation of available nitrogen in plant roots [79,80]. Soil OP is significantly correlated with OM, EK, EC, and SS, with only OM as the independent variable showing the highest fitting degree in linear regression (RMSE, AIC, AICc). This result is consistent with the studies by Wu et al. in pomelo orchards, Zhang et al. in peach orchards, Ganai et al. Zhang et al. and Wang et al. in apple orchards, Feng et al. in citrus orchards, and Zhang et al. in vineyards [31,38,73,75,76,77,81] but inconsistent with He et al.’s study of citrus orchards, which found a significant negative correlation between OP and EK [78]. Soil EK is significantly correlated with OM, AN, OP, EC, Na, SS, and Cl, with OM and AN exhibiting the most significant positive planar effect on EK. This aligns with the studies of Zhang et al. on vineyards and Feng et al. on citrus orange orchards [73,77], and it is consistent with the significant positive correlation between EK and OP in the work of Zhang et al., Wang et al., and Ganai et al. on apple orchards, Zhang et al. on peach orchards, and Wu et al. on pomelo orchards [31,38,75,76,81]. Soil Ca is significantly positively correlated with pH, with only pH exerting a significant positive linear effect on Ca, exhibiting a non-significant negative correlation with AN, Na, and Cl. This is in line with the inhibitory effect of Ca2+ on the uptake and translocation of nitrogen in plant roots [79], which contrasts with the findings of Xing et al., who reported that calcium improved nitrogen utilization efficiency in apples [82]. Soil EC is significantly correlated with OM, AN, OP, EK, Na, SS, and Cl, with EK and AN exerting the largest significant positive plane-fitting effect on EC. This aligns with the findings of Mazur et al. [83], where EC showed a significant correlation with AN and EK, 84, and Chaudhary et al. [84], where EC exhibited a correlation with OP in a maize–wheat cropping system. Soil Na is significantly correlated with OM, EK, EC, SS, and Cl, with only EK demonstrating the highest fitting degree of a significant positive linear effect on Na. Soil SS is significantly correlated with OM, OP, EK, Na, and Cl, showing a similar pattern to AN and Na, where only EK exerts the largest significant positive linear effect on SS. This aligns with the findings of Singh et al., where a significant correlation was observed between SS and Na in field soils [85]. Soil Cl is significantly correlated with OM, AN, EK, EC, Na, and SS, with EK and AN exerting a significant positive plane-fitting effect on Cl. This confirms Chen et al.’s study indicating a positive correlation between Cl and EK, as well as a highly significant correlation with Na, particularly in soils with higher SS [86].
Soil quality results from the complex interactions among various physicochemical properties. In addition to the established relationship between changes in soil properties and orchard inputs [87], this study further explores the interrelationships among soil physicochemical characteristics across different orchards. Notably, significant univariate linear and multivariate planar regression relationships were observed among multiple variables (Figure 4a–k). First, strong correlations were observed among key nutrient indicators. For instance, exchangeable potassium (EK) exhibited a significant positive linear correlation with available nitrogen (AN), and organic matter (OM) showed a similar trend with available phosphorus (OP). Furthermore, OM and AN jointly influenced EK in a significant planar regression model, while EK and OP significantly affected OM. These relationships may result from the synchronized application of multiple macronutrient fertilizers, which can lead to synergistic or antagonistic effects on nutrient availability. Secondly, soil calcium (Ca) showed no significant correlations with any nutrient-related indicators and was only significantly associated with pH in a univariate linear regression model. This may be due to fertilization practices emphasizing macronutrients while neglecting calcium supplementation. This also indicates that the application and recycling of macronutrients may not effectively improve calcium availability in the soil. Moreover, an antagonistic relationship may exist between soil acidification and calcium availability, with OM potentially playing a synergistic role in this regulatory process [79,88]. Further analysis showed that electrical conductivity (EC) was significantly correlated with all soil physicochemical properties, except pH and Ca. Soluble salt content (SS) and chloride (Cl) showed positive correlations with most indicators, while sodium (Na) was significantly correlated with only three. Stepwise regression models indicated that increases in EC and Cl were best explained by elevated levels of AN and EK, forming a strong bivariate planar regression model. In contrast, increases in Na and SS were primarily associated with a univariate linear rise in EK. This may be due to the overapplication of nitrogen- and potassium-based low-quality fertilizers, particularly those containing high levels of Na and Cl. Finally, among all orchard input-related indicators, OM was the most frequently involved explanatory variable, showing significant linear or multivariate associations with positive soil quality indicators (pH, OM, AN, OP, EK, Ca), followed by EK. Conversely, among negative soil quality indicators (Na, SS, Cl), EK showed the strongest associations, followed by AN. These findings offer a theoretical basis for improving soil quality in Yantai apple orchards and suggest a strategy to optimize fertilization practices for achieving both high yield and fruit quality. These results provide a theoretical foundation for improving soil quality in Yantai apple orchards and propose a feasible strategy to optimize fertilization practices, ensuring both high yield and quality.

4.3. Soil Quality Improvement Program for Yantai Apple Orchards: Research Summary and Future Research Directions

This study builds on a clear understanding of soil quality in Yantai derived from descriptive statistics and frequency distribution analyses (Section 4.1). It aims to improve the overall quality of soil physicochemical properties. To achieve this, canonical correlation, stepwise regression equations, and regression model fitting analyses were applied to identify univariate linear and multivariate planar regression relationships in Yantai (Section 4.2) and, subsequently, to develop a multivariate regulation model of soil physicochemical properties. Based on these results, optimized fertilization strategies were developed to prevent tree growth from being significantly limited by the most restrictive nutrients or adversely affected by antagonistic interactions [89]. In Yantai apple orchards, the first priority should be to raise agricultural growers’ awareness of soil testing and formula fertilization, which will contribute to the overall improvement of soil quality while reducing the variation in soil quality levels across orchards. Applying organic and calcium-based fertilizers can increase organic matter (OM) and calcium (Ca) content while mitigating soil acidification. Applying organic and calcium-based fertilizers can directly increase soil organic matter (OM) and calcium (Ca) content, while simultaneously alleviating soil acidification. Increased OM further enhances the availability of phosphorus (OP) and exchangeable potassium (EK). For example, supplementing organic fertilizers with calcium-rich alkaline materials, such as lime, Ca-Mg-P fertilizers, Si-Ca-K-Mg fertilizers, and wood ash, can neutralize soil acidity, supply calcium, and reduce the demand for phosphorus- and potassium-based fertilizers. Additionally, these practices help prevent soil compaction and improve physical soil structure [90,91,92]. Reducing the application of nitrogen, phosphorus, and potassium source fertilizers can decrease both total and available nitrogen, phosphorus, and potassium in the soil [87]. Moreover, a decrease in EK further reduces the availability of alkali-hydrolyzable nitrogen (AN) and increases levels of the negative soil quality indicator chloride (Cl). Conversely, reduced AN levels also lead to lower EK. The simultaneous decline in AN and EK leads to reductions in other negative soil quality indicators, including soluble salts (SS) and sodium (Na). Increased application of organic fertilizers helps restore EK levels and stabilizes electrical conductivity (EC) within acceptable limits. Fertilizer residue issues should also be addressed to prevent secondary salinization. For instance, orchards in mountainous or coastal areas with high chloride, such as in Yantai, should avoid using chloride-based fertilizers (e.g., potassium chloride and magnesium chloride) and refrain from applying sodium-containing or high-sodium fertilizers in areas with high sodium content.
In summary, a lack of understanding of soil quality and the adoption of suboptimal fertilization strategies in Yantai apple orchards may lead to nutrient deficiencies, resource waste, and environmental pollution. Additionally, antagonistic interactions among nutrients can further reduce nutrient use efficiency. To address these challenges, this study introduced several key innovations. First, this study incorporated sodium (Na), soluble salts (SS), chloride (Cl), and electrical conductivity (EC)—alongside conventional soil physicochemical parameters—into the soil quality classification standard for Yantai apple orchards for the first time. Using descriptive statistics analysis, frequency distribution, and curve fitting analysis, the study provided a comprehensive overview of current soil conditions in Yantai orchards. This analysis delivers a robust data foundation for developing optimized fertilization strategies. These indicators are notable for their ease of testing, accessible data acquisition, and convenient field measurement. This expansion broadens the methodological toolkit for orchard soil quality assessment and offers strong potential for practical, large-scale application.
To address the pressing soil quality issues in Yantai apple orchards, this study presents several key innovations that enhance both theoretical understanding and practical management of orchard soils. (1) Indicator system innovation: This is the first study to integrate non-traditional salinity-related indicators, including sodium (Na+), chloride (Cl), electrical conductivity (EC), and soluble salts (SS), into a localized soil quality classification system tailored for Yantai apple orchards. Unlike conventional systems focused primarily on macronutrients (N, P, K), this expanded indicator framework captures salinization risk and ionic imbalance, which are particularly relevant in coastal or intensively fertilized regions. Excessive fertilizer application in Yantai has led to severe soil acidification and decreased availability of secondary and micronutrients, ultimately reducing both apple yield and fruit quality. The selected indicators are easy to measure in the field and offer a practical, scalable method for assessing soil degradation [22,29]. (2) Model framework innovation: This study developed a coherent and region-specific multivariate regulation model of soil physicochemical properties by sequentially applying canonical correlation analysis, stepwise regression analysis, and multidimensional regression fitting. For the first time in this research domain, root mean square error (RMSE), Akaike Information Criterion (AIC), and its corrected version (AICc) were introduced as comprehensive metrics to evaluate and optimize the regression models. These methods identified not only direct one-to-one relationships but also synergistic multivariate interactions, such as OM–Ca–pH, that are crucial for understanding complex nutrient dynamics in orchard soils. The use of 2D univariate and 3D bivariate visualization techniques transforms abstract statistical relationships into actionable insights, supporting both scientific understanding and practical decision making in fertilization strategies [13,14]. (3) Practical innovation in precision fertilization: Moving beyond the conventional “supplement what is lacking” approach, the proposed precision fertilization strategy incorporates multivariate interactions and feedback mechanisms. This allows for mitigation of antagonistic nutrient effects, reduction of excess chemical inputs, and restoration of balanced soil functionality. The model was validated using field data from Yantai and represents the first region-specific trial in which fertilization was guided by multidimensional soil interaction models. This approach is data-driven, operationally feasible, and adaptable to similar agro-ecological regions. Together, these innovations respond directly to the growing challenge of soil degradation and productivity decline in Yantai’s apple orchards, offering a science-based and regionally adapted solution for sustainable soil improvement and brand development. Beyond these methodological innovations, the study also demonstrated strong experimental rigor. All data were collected from a uniform soil type (brown earth) across Yantai districts, the same production years (7th to 9th years of the full fruit-bearing period), the same apple cultivar (“Yantai Fuji 3”), and the same phenological stage (early fruit expansion). Soil sampling followed a standardized protocol, including orchard selection, tree location, sampling tools, and lab procedures, all described in Section 2.3. This strict methodology ensured the authenticity and reliability of the data, making the results highly applicable to similar agroecosystems.
However, several limitations should be noted. First, although the study analyzed 19 orchards across Yantai and 10 major soil parameters, the sample size remains limited for robust statistical inference. Thus, expanding the number of test orchards is necessary to enhance the reliability of CV, AV, and multivariate analyses. Second, the study focused on macronutrients and key physicochemical indicators, omitting critical aspects, such as micronutrients, microbial activity, heavy metals, and organic pollutants. This omission limits the comprehensiveness of soil quality assessment and model development. Additionally, it does not explore the relationships between soil parameters and biological outcomes, such as yield, nutrient content, or fruit quality, factors essential for practical implementation and broader adoption. Moreover, although the classification system is grounded in both theoretical foundations and years of field experience, some references are outdated, and data gaps remain regarding specific soil characteristics in Yantai apple orchards. These shortcomings may introduce bias and warrant further validation. While the multivariate analysis was rigorous, it oversimplified the spatiotemporal dynamics and nutrient interactions among soil parameters. The stepwise regression models primarily selected input-related variables (e.g., pH, OM, AN, OP, EK, Ca), limiting insights into more complex interactions. Although fertilization strategies were optimized based on these models, no cost–benefit or feasibility analysis was conducted, potentially limiting their real-world application. Finally, the study did not investigate soil quality across different climates, terrains, soil types, cropping systems, or irrigation conditions. Future research should expand sampling, refine evaluation criteria, integrate a broader set of variables, and develop high-dimensional regression models based on the existing one- and two-dimensional frameworks. Efforts to increase regional replication, conduct production trials, monitor environmental quality, and standardize soil testing under varied conditions will be essential for achieving both agronomic effectiveness and economic feasibility. Overall, this study lays a methodological foundation for exploring multivariate interactions in orchard soils and offers valuable insights for improving nutrient management efficiency, supporting the innovation of the “Yantai Apple” brand and guiding future scientific research.

5. Conclusions

This study investigated the physicochemical properties and quality distribution of soils in Yantai apple orchards, identifying key factors limiting soil quality improvement. These include variations in soil physicochemical characteristics, low pH, and excessive levels of macronutrients, Na, and SS, as well as insufficient levels of OM, Ca, and EC. Multivariate statistical analysis was used to develop univariate 2D linear regression models and bivariate 3D plane regression models as visualization tools. A multivariate regulation model of Yantai apple orchards was also summarized, identifying key independent variables.
The proposed optimized fertilization strategy focuses on promoting awareness of soil testing and formula fertilization techniques in Yantai advantageous apple production areas. This strategy involves increasing organic and calcium source fertilizers, reducing nitrogen, phosphorus, and potassium source fertilizer application, and prohibiting chloride and sodium source fertilizers. The goal of this strategy is to reduce variations in soil properties, improve soil quality, mitigate acidification, increase organic matter, optimize the effectiveness of macronutrients, enhance secondary nutrient supply, stabilize electrical conductivity, and minimize the risks of negative indicators.
This study focuses on the “Yantai Apple” geographical indication industry, providing insights into the current soil quality status in key production areas and its relationship with soil physicochemical properties. It provides a theoretical basis and practical blueprint for optimizing orchard fertilization strategies and promoting sustainable industry development, offering crucial guidance for the green, efficient, and sustainable growth of the apple industry in this region.

Author Contributions

Conceptualization, Z.Z. (Zhantian Zhang) and H.C.; methodology, Z.Z. (Zhantian Zhang) and B.L.; software, Z.Z. (Zhantian Zhang) and Z.Z. (Zhihan Zhang); validation, Z.Z. (Zhihan Zhang), J.Y., and Z.F.; formal analysis, Z.Z. (Zhantian Zhang) and W.L.; investigation, Z.Z. (Zhantian Zhang) and J.Y.; resources, Z.Z. (Zhantian Zhang) and T.Y.; data curation, Z.Z. (Zhantian Zhang) and H.C.; writing—original draft preparation, Z.Z. (Zhantian Zhang); writing—review and editing, Z.Z. (Zhantian Zhang) and J.Y.; visualization, Z.Z. (Zhantian Zhang) and B.L.; supervision, Z.F.; project administration, B.L.; funding acquisition, Z.Z. (Zhantian Zhang), H.C., and B.L. All authors have read and agreed to the published version of the manuscript.

Funding

This research was funded by the Science and Technology Planning Project of Yantai [2023YD079, 2023ZDCX], the Project for Enhancing the Innovative Capacity of Science and Technology-Based Small and Medium-Sized Enterprises of Shandong Province [2023TSGC0829, 2023TSGC0894], the Yantai Science and Technology Innovation Development Plan—Basic Research Project [2024JCYJ075], and the Shandong Province Fruit Industry Technology System [SDAIT-06-11], and the APC was funded by 2023YD079.

Institutional Review Board Statement

Not applicable.

Data Availability Statement

Dataset available upon request from the authors.

Conflicts of Interest

The authors declare no conflicts of interest.

References

  1. Ke, B.; Zhang, Q.Q.; Georgiev, G. Assessing the Efficiency and Potential of China’s Apple Exports. Complexity 2024, 2024, 7816792. [Google Scholar] [CrossRef]
  2. Yantai Apple Brand Value of 15.837 Billion, for 15 Consecutive Years Ranked First in China’s Fruit Regional Public Brand Value! Available online: https://www.yantai.gov.cn/art/2024/8/26/art_11800_3209600.html (accessed on 26 August 2024).
  3. Kai, T.; Adhikari, D. Effect of Organic and Chemical Fertilizer Application on Apple Nutrient Content and Orchard Soil Condition. Agriculture 2021, 11, 340. [Google Scholar] [CrossRef]
  4. Zhuang, L.P.; Wang, P.L.; Hu, W.; Yang, R.Y.; Zhang, Q.Q.; Jian, Y.Y.; Zou, Y.J. A Comprehensive Study on the Impact of Chemical Fertilizer Reduction and Organic Manure Application on Soil Fertility and Apple Orchard Productivity. Agronomy 2024, 14, 1398. [Google Scholar] [CrossRef]
  5. Wienhold, B.J.; Andrews, S.S.; Karlen, D.L. Soil Quality: A Review of the Science and Experiences in the USA. Environ. Geochem. Health 2004, 26, 89–95. [Google Scholar] [CrossRef] [PubMed]
  6. Castellini, M.; Stellacci, A.; Barca, E.; Iovino, M. Application of Multivariate Analysis Techniques for Selecting Soil Physical Quality Indicators: A Case Study in Long-Term Field Experiments in Apulia (Southern Italy). Soil Sci. Soc. Am. J. 2019, 83, 707–720. [Google Scholar] [CrossRef]
  7. Gao, Z.L.; Wang, W.Q.; Wang, H.J.; Li, R.Y. Selection of Spectral Parameters and Optimization of Estimation Models for Soil Total Nitrogen Content during Fertilization Period in Apple Orchards. Horticulturae 2024, 10, 358. [Google Scholar] [CrossRef]
  8. Lu, C.; Xue, X.M.; Wang, C.L.; An, G.N.; Wang, J.Z. Correlation Analysis on Fruit Quality and Leaves Nutrition and Soil Nutrient in Apple Orchard of Shandong Province. Chin. Agric. Sci. Bull. 2011, 27, 168–172. (In Chinese) [Google Scholar]
  9. Zhang, Q.; Li, M.J.; Zhou, B.B.; Li, X.L.; Sun, J.; Zhang, J.K.; Wei, Q.P. Multivariate Analysis of Relationship between Soil Nutrient Factors and Fruit Quality Characteristic of ‘Fuji’ Apple in Two Dominant Production Regions of China. Ying Yong Sheng Tai Xue Bao 2017, 28, 105–114. [Google Scholar] [CrossRef]
  10. Jivan, C.; Sala, F. Relationship between Tree Nutritional Status and Apple Quality. Hortic. Sci. 2014, 41, 1–9. [Google Scholar] [CrossRef]
  11. Zhao, Y.X.; Chen, Y.Q.; Dai, H.C.; Cui, J.X.; Wang, L.; Sui, P. Effects of Organic Amendments on the Improvement of Soil Nutrients and Crop Yield in Sandy Soils during a 4-Year Field Experiment in Huang-Huai-Hai Plain, Northern China. Agronomy 2021, 11, 157. [Google Scholar] [CrossRef]
  12. Cavael, U.; Diehl, K.; Lentzsch, P. Assessment of Growth Suppression in Apple Production with Replant Soils. Ecol. Indic. 2020, 109, 105846. [Google Scholar] [CrossRef]
  13. Bray, R.H. Soil-Plant Relations: II. Balanced fertilizer Use Through Soil TestsFor Potassium and Phosphorus. Soil Sci. 1945, 60, 463–474. [Google Scholar] [CrossRef]
  14. Ahamad, A.; Gupta, A.; Kumar, D. Soil Fertility Evaluation Using Nutrient Index Approach. J. Krishi Vigyan 2021, 10, 276–282. [Google Scholar] [CrossRef]
  15. Li, X.; Zhang, W.J.; Wu, L.; Ren, Y.; Sun, J.; Zhang, J.D.; Xu, M.G. Advance in Indicator Screening and Methodologies of Soil Quality Evaluation. Sci. Agric. Sin. 2021, 54, 3043–3056. [Google Scholar] [CrossRef]
  16. Juhos, K.; Szabó, S.; Ladányi, M. Explore the Influence of Soil Quality on Crop Yield Using Statistically-Derived Pedological Indicators. Ecol. Indic. 2016, 63, 366–373. [Google Scholar] [CrossRef]
  17. Dai, W.; Li, Y.H.; Fu, W.J.; Jiang, P.K.; Zhao, K.L.; Li, Y.F.; Penttinen, P. Spatial Variability of Soil Nutrients in Forest Areas: A Case Study from Subtropical China. J. Plant Nutr. Soil Sci. 2018, 181, 827–835. [Google Scholar] [CrossRef]
  18. Ge, S.; Zhu, Z.; Jiang, Y. Long-Term Impact of Fertilization on Soil pH and Fertility in an Apple Production System. J. Soil Sci. Plant Nutr. 2018, 18, 282–293. [Google Scholar] [CrossRef]
  19. Gulbagca, F.; Burhan, H.; Elmusa, F.; Sen, F. Calcium Nutrition in Fruit Crops: Agronomic and Physiological Implications. In Fruit Crops; Elsevier: Amsterdam, The Netherlands, 2020; pp. 173–190. [Google Scholar] [CrossRef]
  20. Torres, E.; Kalcsits, L.; González Nieto, L. Is Calcium Deficiency the Real Cause of Bitter Pit? A Review. Front. Plant Sci. 2024, 15, 1383645. [Google Scholar] [CrossRef]
  21. Wang, S.J.; Chen, Q.; Li, Y.; Zhuo, Y.Q.; Xu, L.Z. Research on Saline-alkali soil Amelioration with FGD Gypsum. Resour. Conserv. Recycl. 2017, 121, 82–92. [Google Scholar] [CrossRef]
  22. Lu, R.K. Soil Agrochemical Analysis Method, 1st ed.; Zhu, H.Z., He, P.A., Eds.; China Agricultural Science and Technology Press: Beijing, China, 2000; pp. 13–14, 87–89, 150–152, 181–182, 193–195. ISBN 7-80119-925-1. [Google Scholar]
  23. Yu, J.; Miao, S.J.; Qiao, Y.F. The Stabilization Mechanism of Different Types of Soil Aggregates. Chin. Agric. Sci. Bull. 2022, 38, 89–95. (In Chinese) [Google Scholar] [CrossRef]
  24. Rengasamy, P. Irrigation Water Quality and Soil Structural Stability: A Perspective with Some New Insights. Preprints 2018, 8, 72. [Google Scholar] [CrossRef]
  25. Farahani, E.M.A.M.I.; Emami, H.; Fotovat, A.; Khorassani, R. Effect of Different K:Na Ratios in Soil on Dispersive Charge, Cation Exchange, and Zeta Potential. Eur. J. Soil Sci. 2019, 70, 311–320. [Google Scholar] [CrossRef]
  26. Curtin, D.; Steppuhn, H.; Selles, F. Structural Stability of Chernozemic Soils as Affected by Exchangeable Sodium and Electrolyte Concentration. Can. J. Soil Sci. 1994, 74, 157–164. [Google Scholar] [CrossRef]
  27. Buvaneshwari, S.; Riotte, J.; Sekhar, M.; Sharma, A.K.; Helliwell, R.; Kumar, M.S.M.; Braun, J.J.; Ruiz, L. Potash Fertilizer Promotes Incipient Salinization in Groundwater Irrigated Semi-arid Agriculture. Sci. Rep. 2020, 10, 3691. [Google Scholar] [CrossRef]
  28. Wang, Y.; Liu, X.B.; Wang, L.X.; Li, H.T.; Zhang, S.Y.; Yang, J.F.; Liu, N.; Han, X.R. Effects of Long-Term Application of Cl-Containing Fertilizers on Chloride Content and Acidification in Brown Soil. Sustainability 2023, 15, 8801. [Google Scholar] [CrossRef]
  29. Heiniger, R.; McBride, R.; Clay, D. Using Soil Electrical Conductivity to Improve Nutrient Management. Agron. J. 2003, 95, 508–519. [Google Scholar] [CrossRef]
  30. Fox, G.; Metla, R. Soil Property Analysis Using Principal Components Analysis, Soil Line, and Regression Models. Soil Sci. Soc. Am. J. 2005, 69, 1782–1788. [Google Scholar] [CrossRef]
  31. Zhang, Q.; Wei, Q.P.; Liu, H.P.; Jiang, R.S.; Liu, X.D.; Wang, X.W. Multivariate Analysis and Optimum Proposals of the Relationship Between Soil Nutrients and Fruit Qualities in Apple Orchard. Sci. Agric. Sin. 2011, 44, 1654–1661. (In Chinese) [Google Scholar]
  32. Zhang, Y.; Xie, Y.S.; He, M.D. Limiting Ecological Factors Evaluation of High-Quality Apple at Wangdonggou Watershed in Loess Gully Region. Sci. Agric. Sin. 2022, 38, 89–95. (In Chinese) [Google Scholar] [CrossRef]
  33. Mota, M.; Martins, M.J.; Policarpo, G.; Sprey, L.; Pastaneira, M.; Almeida, P.; Maurício, A.; Rosa, C.; Faria, J.; Martins, M.B.; et al. Nutrient Content with Different Fertilizer Management and Influence on Yield and Fruit Quality in Apple cv. Gala. Horticulturae 2022, 8, 713. [Google Scholar] [CrossRef]
  34. Zheng, X.C.; Che, J.X.; Lu, H.J.; Zhai, B.N.; Zhao, Z.Y. Analysis on Soil Nutrient Availability of Fuji Apple Demonstration Orchards in Baishui County in Weibei Area of Shaanxi. Sci. Acta Agric. Boreali-Occident. Sin. 2011, 20, 97–101. (In Chinese) [Google Scholar] [CrossRef]
  35. Zhang, L.N.; Li, J.; Fan, P.; Cao, Y.; Ju, K. Distribution of Soil NPK Nutrient Content in Deep Soil Profile of Typical Apple Orchards on the Loess Plateau. Acta Ecol. Sin. 2013, 33, 1907–1915. (In Chinese) [Google Scholar] [CrossRef]
  36. Cao, S.; Ouyang, M.Y.; Zhou, W.J.; Cui, H.J.; Liu, P.; Tan, J.; Huang, L.; Liu, S. Multivariate Analysis and Modeling of Fruit Mineral Nutrient, Soil Nutrient and pH in Satsuma Mandarin Citrus Orchards in Hunan Province. J. Fruit Sci. 2019, 36, 1029–1039. (In Chinese) [Google Scholar] [CrossRef]
  37. Yildiz, E.; Yaman, M.; Sümbül, A. Relationships Between Physical and Chemical Properties of Soils and Plant Nutrient Content of Leaves in the Apple Orchards. Curr. Trends Nat. Sci. 2022, 11, 139–144. [Google Scholar] [CrossRef]
  38. Ganai, A.Q.; Dar, M.A.; Chesti, M.H.; Dar, N.A. Correlation of Physico-Chemical Characteristic with Available Nutrients and Leaf Nutrient Content in Apple (Cv. Red Delicious) Orchard of Jammu and Kashmir (India). Curr. J. Appl. Sci. Technol. 2020, 39, 42–52. [Google Scholar] [CrossRef]
  39. Faria, M.; Bertocco, T.; Barroso, A.; Carvalho, M.; Fonseca, F.; Delerue Matos, C.; Figueiredo, T.; Sequeira Braga, A.; Valente, T.; Jiménez-Ballesta, R. A Comparison of Analytical Methods for the Determination of Soil pH: Case Study on Burned Soils in Northern Portugal. Fire 2023, 6, 227. [Google Scholar] [CrossRef]
  40. Leksungnoen, N.; Andriyas, T.; Andriyas, S. ECe Prediction from EC1:5 in Inland Salt-Affected Soils Collected from Khorat and Sakhon Nakhon Basins, Thailand. Commun. Soil Sci. Plant Anal. 2018, 49, 2627–2637. [Google Scholar] [CrossRef]
  41. Khan, S.A.; Mulvaney, R.L.; Hoeft, R.G. Direct-Diffusion Methods for Inorganic-Nitrogen Analysis of Soil. Soil Sci. Soc. Am. J. 2000, 64, 1083–1089. [Google Scholar] [CrossRef]
  42. Lin, X.; Zhang, J.; Chen, H.; Han, L. Determination of Available Phosphorus in Alkaline Soil by Molybdenum Blue Spectrophotometry. IOP Conf. Ser. Earth Environ. Sci. 2021, 781, 052003. [Google Scholar] [CrossRef]
  43. David, D.J. The Tetermination of Exchangeable Sodium, Potassium, Calcium and Magnesium in Soils by Atomic-Absorption Spectrophotometry. Analyst 1960, 85, 495–503. [Google Scholar] [CrossRef]
  44. Best, R.J. A Rapid Electrometric Method for Determining the Chloride Content of Soils. J. Agric. Sci. 1929, 19, 533–540. [Google Scholar] [CrossRef]
  45. He, W.S.; Liu, Y.C.; He, J.Y. Relationships Between Soluble Salt Content and Electrical Conductivity for Different Types of Salt-Affected Soils in Ningxia. Agric. Res. Arid Areas 2010, 28, 111–116. (In Chinese) [Google Scholar]
  46. Sonmez, S.; Buyuktas, D.; Okturen Asri, F.; Citak, S. Assessment of Different Soil to Water Ratios (1:1, 1:2.5, 1:5) in Soil Salinity Studies. Geoderma 2008, 144, 361–369. [Google Scholar] [CrossRef]
  47. Wang, Q.H.; Ren, Y.F.; Meng, L.; Li, H.; Fu, H.M.; Wang, H.F. Simultaneous Determination of Total Nitrogen and Organic Carbon in Soil with an Elemental Analyzer. Chin. J. Anal. Lab. 2013, 32, 41–45. (In Chinese) [Google Scholar]
  48. National Soil Survey Office. Soil of China; China Agricultural Publishing House: Beijing, China, 1998; pp. 534–549. ISBN 7-10904-354-1. [Google Scholar]
  49. Chen, X.N.; Wang, L.X.; Pang, L.H.; Shao, L. Analysis of Soil pH, Organic Matter and Available Nutrient Contents in Applegrowing Areas of Yantai in Shandong. China Fruits 2019, 2019, 25–28+40. (In Chinese) [Google Scholar] [CrossRef]
  50. Ge, S.F.; Hao, W.Q.; Jiang, H.; Wei, S.C.; Jiang, Y.M. Distribution Characteristics of Soil Organic Matter and pH and the Correlation to Soil Nutrients in Apple Orchards of Yantai. Chin. Agric. Sci. Bull. 2014, 30, 274–278. (In Chinese) [Google Scholar]
  51. Jiang, Y.M.; Zhang, H.Y.; Zhang, F.S. Theory and Practice of Integrated Nutrient Resource Management for Deciduous Fruit Trees in Northern Regions; China Agricultural Publishing House: Beijing, China, 1994; ISBN 9-78703-067-4937. [Google Scholar]
  52. Zhang, Z.T.; Xu, W.H.; Jiang, X.L.; Su, X.; Zhang, G.H.; Jiang, Z.W.; Chen, H.N.; Tan, D.S.; Liu, Z.Y.; Yang, J.C. Effects of Organic Fertilizer Instead of Chemical Fertilizer on Maize Growth, Nutrient Absorption and Soil Fertility. Mol. Plant Breed. 2025, 31, 1531–1540. (In Chinese) [Google Scholar] [CrossRef]
  53. Zhang, Z.T.; Yang, J.C.; Sun, X.; Zhang, G.H.; Chen, H.N.; Chen, X.M.; Jiang, X.L. Effect of Base Fertilizer Optimization Treatment on Growth Quality and Economic Benefit of Apple. Yantai Fruits 2021, 2021, 22–25. (In Chinese) [Google Scholar] [CrossRef]
  54. Zhang, Z.T.; Jiang, X.L.; Sun, X.; Zhang, G.H.; Chen, X.M.; Liu, Z.Y.; Zhang, A.R.; Jiang, Z.W.; Yang, J.C. Effects of Chemical Fertilizers Reduction and OrganicFertilizers Increase on Fuji Apple Yield and Quality. Mod. Agric. Sci. Technol. 2021, 2021, 68–72+84. (In Chinese) [Google Scholar] [CrossRef]
  55. Chen, H.N.; Gao, W.S.; Zheng, L.; Fan, Z.B.; Liu, B.Y.; Liu, H.B. Effects of Silicon-Calcium-Potassium-Magnesium Fertilizer Combined with Fulvic Acid Potassium on Soil Chemical Properties, Yield and Quality of Fruit in Apple Orchard with Acidified Soils. Soil Fertil. Sci. China 2023, 2023, 82–87. (In Chinese) [Google Scholar]
  56. Zhang, Z.T.; Fan, Z.B.; Leng, W.F.; Yao, J.; Yang, T.J.; Zhang, Z.H.; Chen, H.N.; Liu, B.Y. Effects of Silicon Calcium Potassium Magnesium Fertilizer on Wheat Soil and Yield, Nutrient Utilization. Soil Fertil. Sci. China 2024. accepted (In Chinese) [Google Scholar]
  57. Liu, Y.N.; Tong, Y.A.; Ma, C.; Wang, B.M.; Zhang, X.Y. Present Situation and Adjustment Measures of Orchard Soil pH in Shaanxi area. Shaanxi J. Agric. Sci. 2019, 65, 58–61. (In Chinese) [Google Scholar]
  58. Li, Y.N.; Zhong, P.F. Multivariate Analysis and Optimum Proposals of Fruit Quality and Soil Nutrients of Jiuquan Zaosu Red Pear. Non-Wood For. Res. 2024, 42, 99–106+149. (In Chinese) [Google Scholar]
  59. Zhang, D.; Zheng, L.W.; Han, M.Y.; Gao, C.X.; Luo, W.W.; Ma, J.J. Studies of the Standard Range of the Soil Nutrients in Apple Orchard in Loess Plateau. Acta Hortic. Sin. 2016, 43, 121–131. (In Chinese) [Google Scholar] [CrossRef]
  60. Zhang, Q.; Li, M.J.; Zhou, B.B.; Zhang, J.K.; Wei, Q.P. Quantitative Analysis of Relationship Between Fruit Quality of ‘Fuji’ Apple and Environmental Factors: A Case Study of the Loess Plateau Production Region. Erwerbs-Obstbau 2023, 65, 423–434. [Google Scholar] [CrossRef]
  61. Zheng, Z.X.; Wang, Y.; Shi, L.; Gong, Q.L.; Zhen, W.; Zhao, Z.Y.; Zhai, B.N. Contents and Distribution of Soil Organic Matter and Nitrogen, Phosphate, Potassium in the Main Apple Production Regions of Shaanxi Province. J. Plant Nutr. Fertil. 2017, 23, 1191–1198. (In Chinese) [Google Scholar] [CrossRef]
  62. Luo, Y.Z.; Zhang, W.W.; Li, Y.Y.; Yao, H.Y.; Wang, Y.J.; Han, J.G. Analysis and Comprehensive Evaluation of Soil Fertility Characteristics for the UrbanPark in Shanghai. Soil Fertil. Sci. China 2019, 2019, 86–93. (In Chinese) [Google Scholar]
  63. Acceptance Specification for Planting Soil Quality of Landscaping Project. Available online: http://www.csres.com/detail/285634.html (accessed on 26 August 2024).
  64. Cheng, M.F.; Jing, J.Y.; Li, C.H.; Wang, Y.J.; Wang, H. Research Progress on the Effects of Chloride Ion on Crop Growth and Soil Properties. J. Zhejiang Agric. Sci. 2010, 2010, 12–14. (In Chinese) [Google Scholar] [CrossRef]
  65. Ma, R.; Wang, X.N.; Tian, L.; Yu, S.B.; Wei, Z.Q.; Yang, Z.K.; Tan, J.L. Effects of Chlorine Application on Growth, Yield and Quality of Watermelon Planting in Gravel-Sand-Mulched Field. J. Northeast. Agric. Univ. 2022, 53, 58–66. (In Chinese) [Google Scholar] [CrossRef]
  66. Chen, P.; He, W.S. A Study of Soil Physicochemical Properties for Different Levels of Salinization. J. Agric. Sci. 2016, 37, 36–39. (In Chinese) [Google Scholar]
  67. Bao, S.D. Soil Agrochemical Analysis, 3rd ed.; Jiang, R.F., Yang, C.G., Eds.; China Agriculture Press: Beijing, China, 2000; pp. 534–549. ISBN 978-7-109-06644-1. [Google Scholar]
  68. Jiang, Z.B.; Ning, S.R.; Wang, Q.J. A Comprehensive Evaluation of the Effect of Desulfurized Gypsum for Improving Saline-alkali Soil. Acta Pedol. Sin. 2024, 61, 699–713. (In Chinese) [Google Scholar]
  69. Hartemink, A.E.; Barrow, N.J. Soil pH—Nutrient Relationships: The Diagram. Plant Soil 2023, 486, 209–215. [Google Scholar] [CrossRef]
  70. Ghafoor, I.; Habib-ur-Rahman, M.; Ali, M.; Afzal, M.; Ahmed, W.; Gaiser, T.; Ghaffar, A. Slow-Release Nitrogen Fertilizers Enhance Growth, Yield, NUE in Wheat Crop and Reduce Nitrogen Losses under an Arid Environment. Environ. Sci. Pollut. Res. 2021, 28, 43528–43543. [Google Scholar] [CrossRef]
  71. Kulkarni, D.-S.J.; Goswami, A. Effect of Excess Fertilizers and Nutrients: A Review on Impact on Plants and Human Population. In Proceedings of the International Conference on Sustainable Computing in Science, Technology and Management (SUSCOM), Jaipur, India, 26–28 February 2019. [Google Scholar] [CrossRef]
  72. Yu, Z.F.; Jiang, X.L.; Yu, B.; Kou, Y.; Zhao, X. Soil Nutrient Status and Fertilization Countermeasures of Orchard in Yantai City. Yantai Fruits 1999, 1999, 12–14. (In Chinese) [Google Scholar]
  73. Feng, X.J.; Lin, M.; Zhang, W.Q.; Wang, T.Y.; Ping, X.L.; Xu, C.N. Evaluation of Soil Nutritional Status in Satsuma mandarin and Red Beauty orchards. J. Zhejiang Agric. Sci. 2022, 63, 318–321. (In Chinese) [Google Scholar] [CrossRef]
  74. Cao, S.; Zhou, W.J.; Liu, P.; Tan, J.; Song, B. Multivariate Analysis and Optimization of Relationship Between Soil Nutrients and Fruit Quality in C. sinensis (L.) Osbeck Orchard. Soils 2021, 53, 97–104. (In Chinese) [Google Scholar] [CrossRef]
  75. Zhang, Y.S.; Luo, K.N.; Li, Y.X.; Gu, Q.Y.; Fu, Z.F.; Zhang, X.X.; Feng, H.W. Canonical Correlation Analysis and Optimum Proposals of Soil Nutrients and Fruit Quality of Ningxian Yellow-Flesh Peach. Non-Wood For. Res. 2023, 41, 38–48. (In Chinese) [Google Scholar] [CrossRef]
  76. Wang, S.Y.; Tan, X.H. Multivariate Analysis of Fruit Qualities and Soil Nutrients in Apple Orchard. J. Shandong Agric. Univ. (Nat. Sci. Ed.) 2022, 53, 24–28. (In Chinese) [Google Scholar] [CrossRef]
  77. Zhang, J.W.; Yue, C.Y.; Liu, A.H.; Kong, T.T. Multivariate Analysis of Relationship between Soil Nutrients and Grape Qualities for Grapery in Xinjiang Manasi. Southwest China J. Agric. Sci. 2017, 30, 1606–1611. (In Chinese) [Google Scholar] [CrossRef]
  78. He, B.B.; Jin, G.Q.; Li, Y.J. Correlation of Nitrogen, Phosphorus and Potassium Contents in soil, Spring Shoots and Fruits of Satsuma mandarin. J. Zhejiang Agric. Sci. 2022, 63, 2311–2313+2319. (In Chinese) [Google Scholar] [CrossRef]
  79. Lu, J.L. Plant Nutrition, 2nd ed.; Zhang, F.S., Li, C.J., Eds.; China Agriculture Press: Beijing, China, 2000; Volume 1, pp. 28–34. ISBN 978-7-81066-512-4. [Google Scholar]
  80. Li, H.; Yu, M.; Du, X.-Q.; Wang, Z.-F.; Wu, W.-H.; Quintero, F.J.; Jin, X.-H.; Li, H.-D.; Wang, Y. NRT1.5/NPF7.3 Functions as a Proton-Coupled H+/K+ Antiporter for K+ Loading into the Xylem in Arabidopsis. Plant Cell 2017, 29, 2016–2026. [Google Scholar] [CrossRef]
  81. Wu, Q.J.; Xiao, W.M.; Zhao, X.D.; Zhao, X.D.; Xie, Z.J.; Peng, J.F.; Zhou, C.H. Status, Spatial Distribution, and Fertility of Soil in Pomelo Orchards in Jinggang, Jiangxi Province. J. Agric. Resour. Environ. 2022, 39, 1025–1032. (In Chinese) [Google Scholar] [CrossRef]
  82. Xing, Y.; Zhu, Z.-L.; Wang, F.; Zhang, X.; Li, B.-Y.; Liu, Z.-X.; Wu, X.-X.; Ge, S.-F.; Jiang, Y.-M. Role of Calcium as a Possible Regulator of Growth and Nitrate Nitrogen Metabolism in Apple Dwarf Rootstock Seedlings. Sci. Hortic. 2021, 276, 109740. [Google Scholar] [CrossRef]
  83. Mazur, P.; Gozdowski, D.; Wójcik-Gront, E. Soil Electrical Conductivity and Satellite-Derived Vegetation Indices for Evaluation of Phosphorus, Potassium and Magnesium Content, pH, and Delineation of Within-Field Management Zones. Agriculture 2022, 12, 883. [Google Scholar] [CrossRef]
  84. Chaudhary, S.K. Physico-Chemical Properties, Available Nutrient Content and Their Inter-Relationship in Soils under Rain Fed Maize-Wheat Cropping System, District Reasi (J&K). Ann. Plant Soil Res. 2024, 26, 82–88. [Google Scholar] [CrossRef]
  85. Singh, A.; Prasad, V. Assessment of Salinity in the Field Soils of Azamgarh and Its Relation to Their Physico-Chemical Properties. Int. J. Plant Environ. 2020, 6, 137–145. [Google Scholar] [CrossRef]
  86. Chen, Y.; Chen, Z.C.; Wang, B.H. Soil Composition and Correlation Analysis of Three Typical Land Use Types in Xinjiang. J. Green Sci. Technol. 2023, 25, 121–126. (In Chinese) [Google Scholar] [CrossRef]
  87. Han, S.; An, J.Y.; Hwang, J.; Kim, S.B.; Park, B.B. The Effects of Organic Manure and Chemical Fertilizer on the Growth and Nutrient Concentrations of Yellow Poplar (Liriodendron tulipifera Lin.) in a Nursery System. Environ. Sci. Pollut. Res. 2016, 12, 137–143. [Google Scholar] [CrossRef]
  88. Wang, P.; Guo, J.; Xu, X.; Yan, X.; Zhang, K.; Qiu, Y.; Zhao, Q.; Huang, K.; Luo, X.; Yang, F.; et al. Soil Acidification Alters Root Morphology, Increases Root Biomass but Reduces Root Decomposition in an Alpine Grassland. Environ. Pollut. 2020, 265, 115016. [Google Scholar] [CrossRef]
  89. Rubio, G.; Zhu, J.; Lynch, J.P. A Critical Test of the Two Prevailing Theories of Plant Response to Nutrient Availability. Am. J. Bot. 2003, 90, 143–152. [Google Scholar] [CrossRef]
  90. Zhang, Z.T.; Shi, J.Q.; Chen, H.N.; Fan, Z.B.; Leng, W.F.; Liu, D.L.; Liu, B.Y. Effects of Calcium on the Growth and Development of Fruit Trees and Application Research. Deciduous Fruits 2023, 55, 43–47. (In Chinese) [Google Scholar] [CrossRef]
  91. Zhang, Z.T.; Chen, H.N.; Fan, Z.B.; Leng, W.F.; Yao, J.; Liu, B.Y. Effects of Silicon on the Growth and Development of Plant and Application Research. Yantai Fruits 2023, 4, 28–30. (In Chinese) [Google Scholar]
  92. Zhang, H.; Hartge, K.; Ringe, H. Effectiveness of Organic Matter Incorporation in Reducing Soil Compactibility. Soil Sci. Soc. Am. J. 1997, 61, 239–245. [Google Scholar] [CrossRef]
Figure 1. Locations of the soils of Yantai apple orchards in Shandong Province, China (range of coordinates: 119°34′–121°57′ E and 36°16′–38°23′ N). The letter “N” on the triangular symbol indicates north.
Agriculture 15 01520 g001
Figure 2. Frequency distribution histogram and nonlinear fitting curve graphs of soil quality in Yantai apple orchards. The proportion number of each column represents the specific value of the relative frequency. (aj) represent the frequency distribution and Gaussian nonlinear fitting curve graphs for the following soil quality parameters: pH, Ca, EC, AN, OP, EK, OM, Na, SS, and Cl. The legend in the lower-right corner summarizes and confirms these parameter to figure correspondences.
Agriculture 15 01520 g002
Figure 3. Correlation matrix heatmap of soil physicochemical properties in Yantai apple orchards. Pearson correlation was used to calculate the correlation coefficient R and significant p. The correlation coefficient (R) is shown in different color blocks, and the specific value is shown in the upper right part of the diagonal. The significance level (p) is shown with an asterisk, and “*” and “**” are shown to be significantly correlated at the levels of 0.05 and 0.01.
Agriculture 15 01520 g003
Figure 4. Univariate 2D linear regression fit models, bivariate 3D plane regression fit models, and multivariate regulation model of soil physicochemical properties in Yantai apple orchards. Panels (a,b,e,g,j) show bivariate 3D plane regression fit models with pH, OM, EK, EC, and Cl as dependent variables, respectively. The color gradient from blue to red represents increasing values of the dependent variables. Panels (c,d,f,h,i) display univariate 2D linear regression fit models with AN, OP, Ca, Na, and SS as dependent variables, respectively. The shaded bands in the plots represent confidence intervals of the regression equations at corresponding significance levels. Panel (k) presents the multivariate regulation model of soil physicochemical properties developed by integrating all ten foundational 2D linear and 3D planar fitting models. Directional arrows explicitly indicate significant positive regulatory relationships (p < 0.05) between soil parameters. The legend in the lower-right corner summarizes and confirms these parameter to figure correspondences.
Agriculture 15 01520 g004
Table 1. Classification standard of soil quality indexes of Yantai apple orchards.
Index
Description *
OM
g/kg
AN
mg/kg
OP
mg/kg
EK
mg/kg
Ca
mg/kg
EC
µs/cm
Index
Description
Na
mg/kg
SS
g/kg
Cl
mg/kg
Lowest<10<60<10<100<1000<120Low<120<3<180
Low10–2060–9010–20100–1501000–2000120–350
Middle20–3090–12020–30150–2002000–3000350–1000
High30–40120–15030–40200–2503000–40001000–2000High≥120≥3≥180
Highest≥40≥150≥40≥250≥4000≥2000
* Strong acid: <4.5; acidity: 4.5–5.5; weak acid: 5.5–6.5; neutrality: 6.5–7.5; weak alkali: 7.5–8.5; alkalinity: 8.5–9.5; strong alkali: >9.5. Note: “<” excludes the value, “≥” includes the value, and “−” contains the value of the latter only.
Table 2. Descriptive statistics for orchard soil physicochemical properties in Yantai.
Index *pHOM
g/kg
AN
mg/kg
OP
mg/kg
EK
mg/kg
Ca
mg/kg
EC
µs/cm
Na
mg/kg
SS
g/kg
Cl
mg/kg
Mean ± SE6.45
±0.21
22.42
±3.36
142.21
±21.25
106.91
±17.81
371.78
±63.37
1650.63
±202.09
550.22
±137.83
204.55
±19.83
2.94
±0.3
22.5
±7.72
CV %14.0465.4065.1472.6374.3053.37109.1942.2644.32149.64
AV4.73–7.693.81–50.1920.98–
312.46
31.05–284.8441.41–844.59376.68–
3465.70
59.6–226083.16–
421.30
0.83–5.17.13–
142.37
* Abbreviations: pH (–log10[H+], where [H+] represents soil hydrogen ion activity), OM (soil organic matter), AN (soil available nitrogen), OP (soil Olsen phosphorus), EK (soil exchangeable potassium), Ca (soil exchangeable calcium), EC (soil electrical conductivity), Na (soil exchangeable sodium), SS (soil soluble salts), Cl (soil chloride ions). These abbreviations are consistently used throughout all figures and tables in this study. This row of data in the table presents the average value of 19 observations (mean), along with the standard error (SE). The second row presents the coefficient of variation (CV) of 19 observations. The third row presents the amplitude of variation (AV) of 19 observations.
Table 3. Establishment of regression equation affecting soil physicochemical properties in Yantai apple orchards.
Soil
Qualities
(y)
Soil Physicochemical
Properties (x)
Regression
Equations 1
F 2RMSE 3AIC 4AICc 5
pHOM, Cay = 0.02445x2 + 0.0004366x6 + 5.185365.864 *0.84723653.6201955.22019
OMy = 0.03118x2 + 5.755255.806 *1.01076458.326559.0765
Cay = 0.000541x6 + 5.561246.504 *0.96242656.4643557.21435
OMpH, OP, EK, EC, Na, SS, Cly = 3.10842x1 + 0.04746x4 + 0.02802x5 + 0.00119x7 − 0.00772x8 + 1.49338x9 − 0.01977x10 − 16.1560910.026 ***54.71341221.9998236.3998
pH, OP, EKy = 2.96924x1 + 0.05151x4 + 0.0317x5 − 14.0354529.821 ****56.66747215.3333218.1904
OP, EKy = 0.05486x4 + 0.0346x5 + 3.6921738.425 ****54.22059211.656213.256
pH, EKy = 3.11539x1 + 0.04369x5 − 13.9309940.393 ****66.20909219.2467220.8467
pH, OPy = 3.92747x1 + 0.14244x4 − 18.1581124.661 ****89.71605230.7924232.3924
pHy = 8.16583x1 − 30.284575.806 *286.5772272.924273.674
OPy = 0.15835x4 + 5.4898240.290 ****88.7981228.4015229.1515
EKy = 0.04756x5 + 4.7361269.276 ****59.14407212.9588213.7088
ANEK, EC, Cly = −0.06334x3 + 0.16938x7 − 0.70903x10 + 88.516886.123 **5784.364391.1104393.9675
EKy = 0.16535x5 + 80.738925.460 *12,268.21415.6808416.4308
OPOM, EK, EC, SSy = 2.15557x2 + 0.16751x5 − 0.02201x7 + 0.85025x9 + 5.9185610.789 ***3167.341370.2243374.8397
OM, EKy = 2.28702x2 + 0.12761x5 + 8.1977323.234 ***3123.858365.699367.299
OMy = 4.44127x2 + 7.3431340.290 ****2897.308360.8381361.5881
EKy = 0.23639x5 + 19.0293441.045 ***4086.369373.9053374.6553
EKOM, AN, OP, EC, Na, SS, Cly = 7.02255x2 + 0.51911x3 + 1.73416x4 − 0.13412x7 − 0.13803x8 + 18.54982x9 + 3.43519x10 − 74.6901215.424 ****12,337.42427.8946442.2946
OM, AN, OPy = 10.23906x2 + 0.63917x3 + 1.17234x4 − 74.0111733.409 ****16,399.39430.7096433.5668
AN, OPy = 0.87921x3 + 2.71944x4 − 43.9994229.774 ****28,719.76450.0026451.6026
OM, OPy = 12.11929x2 + 1.0723x4 − 14.5710739.037 ****22,969.26441.5123443.1123
OM, ANy = 15.54414x2 + 0.59538x3 − 61.3801341.317 ****17,524.59431.2314432.8314
OMy = 16.88168x2 − 6.6970169.276 ****23,047.28439.6412440.3912
ANy = 1.47021x3 + 162.699765.460 *110,188.5499.0977499.8477
OPy = 2.99137x4 + 51.9616641.045 ****43,038.65463.3741464.1241
CapHy = 511.47475x1 − 1650.538516.503 *988,446.8582.4675583.2175
ECOM, AN, OP, EK, Na, SS, Cly = 1.33274x2 + 1.82796x3 + 2.92141x4 − 0.42446x5 − 0.48058x8 + 60.87424x9 + 11.9421x10 − 243.5156923.832 ****30,621.06462.4385476.8385
OM, AN, OP, EKy = 3.95122x2 + 2.98755x3 − 0.39564x4 + 1.07747x5 − 321.5111810.426 ****160,923.1519.4896524.105
AN, OP, EKy = 2.94944x3 − 0.20299x4 + 1.22617x5 − 303.3872514.770 ****159,205.1517.0817519.9389
OM, OP, EKy = −0.55038x2 − 2.03912x4 + 2.17407x5 − 27.705357.743 ***216,098.1528.6922531.5493
OM, AN, EKy = 3.19697x2 + 3.04201x3 + 1.01082x5 − 329.8652514.845 ****166,134.6518.7007521.5578
OM, AN, OPy = 14.98354x2 + 3.67624x3 − 0.86753x4 − 401.2562812.650 ***361,255.1548.2186551.0757
OM, ANy = 18.90927x2 + 3.64383x3 − 391.909419.876 ****225,973.8528.3903529.9903
OM, OPy = 25.79778x2 + 0.29214x4 − 59.383836.227 **444,310.2554.0822555.6822
OM, EKy = -5.2139x2 + 1.91386x5 − 44.4215111.504 ***252,359.4532.5868534.1868
AN, OPy = 4.02751x3 + 3.1315x4 − 357.3379816.983 ***264,345.8534.3502535.9502
AN, EKy = 2.98437x3 + 1.17241x5 − 310.0696523.609 ****162,224.6515.7957517.3957
OP, EKy = -2.06932x4 + 2.15503x5 − 29.7374412.387 ***363,322.2546.4354548.0354
OMy = 27.09524x2 − 57.2386313.209 **442,144.4551.8966552.6466
ANy = 4.70805x3 − 119.3188418.939 ***333,987.1541.2363541.9863
OPy = 4.37717x4 + 82.24138.002 *568,552.2561.4519562.2019
EKy = 1.66587x5 − 69.1151524.126 ***257,703.9531.3832532.1332
NaEK, SS, Cly = 0.04139x4 + 18.39293x9 + 0.85299x10 + 115.891443.682 *7144.524399.1355401.9927
EKy = 0.17083x4 + 141.034017.214 *7757.603398.264399.014
SSOM, OP, EK, EC, Na, Cly = 0.02458x2 − 0.00165x4 + 0.001061x5 + 0.00106x7 + 0.00281x8 − 0.00727x10 + 1.183.860 *0.9485465.9120876.0939
OM, OP, EKy = 0.02292x2 − 0.00143x4 + 0.00279x5 + 1.542536.752 **1.09497965.3675968.22474
OM, OPy = 0.05669x2 + 0.00156x4 + 1.501938.501 **1.20566567.0268468.62684
OM, EKy = 0.01966x2 + 0.0026x5 + 1.5308410.722 **1.09190463.2607464.86074
OP, EKy = -0.0001687x4 + 0.00358x5 + 1.6271510.310 **1.08853763.143464.7434
OMy = 0.06363x2 + 1.513417.880 ***1.22864965.7444366.49443
OPy = 0.01054x4 + 1.8131511.073 **1.35807669.5502870.30028
EKy = 0.00354x5 + 1.6239421.907 ***1.08851161.1424861.89248
ClOM, AN, EK, EC, Na, SSy = −0.57947x2 − 0.05806x3 + 0.01001x5 + 0.06129x7 + 0.04744x8 − 2.15476x9 + 2.935819.170 ***336.9845289.0811299.2629
OM, AN, EKy = -0.44025x2 + 0.13221x3 + 0.0745x5 − 14.130535.045 *1310.039334.6765337.5337
OM, ANy = 0.71785x2 + 0.17657x3 − 18.703586.328 **1739.418343.4493345.0493
OM, EKy = −0.80581x2 + 0.11375x5 − 1.72455.045 *1516.646338.2414339.8414
AN, EKy = 0.14015x3 + 0.05225x5 − 16.856567.854 **1398.37335.1560336.756
OMy = 1.11452x2 − 2.48635.238 *2554.424356.0518356.8018
ANy = 0.21697x3 − 8.355329.410 **1993.585346.6319347.3819
EKy = 0.07542x5 − 5.5408910.546 **1754.151341.7698342.5198
1 x1–x10 are pH, OM, AN, OP, EK, Ca, EC, Na, SS, and Cl, respectively. 2 The significance level (p) of the regression equation is indicated by an asterisk, with “*”, “**”, “***”, and “****” representing significant correlation at the 0.05, 0.01, 0.001, and 0.0001 levels. 3,4,5 Root mean square error (RMSE), Akaike Information Criterion (AIC), and its corrected version (AICc), respectively; smaller values indicate better model performance and greater significance.
Disclaimer/Publisher’s Note: The statements, opinions and data contained in all publications are solely those of the individual author(s) and contributor(s) and not of MDPI and/or the editor(s). MDPI and/or the editor(s) disclaim responsibility for any injury to people or property resulting from any ideas, methods, instructions or products referred to in the content.

