Article

Effects of Refrigerated Storage on the Physicochemical, Color and Rheological Properties of Selected Honey

by
Joanna Piepiórka-Stepuk
1,*,
Monika Sterczyńska
1,
Marta Stachnik
2 and
Piotr Pawłowski
1
1
Division of Food Industry Processes and Facilities, Koszalin University of Technology, Racławicka Street, 15-17, 75-620 Koszalin, Poland
2
Department of Life Technology, Food Sciences, University of Turku, FI-20014 Turun, Finland
*
Author to whom correspondence should be addressed.
Agriculture 2025, 15(14), 1476; https://doi.org/10.3390/agriculture15141476
Submission received: 30 April 2025 / Revised: 2 July 2025 / Accepted: 8 July 2025 / Published: 10 July 2025
(This article belongs to the Section Agricultural Product Quality and Safety)

Abstract

The paper presents a study of changes in selected physicochemical properties of honeys during their refrigerated storage at 8 ± 1 °C for 24 weeks. On the basis of the study of primary pollen, the botanical identification of the variety of honeys was made—rapeseed, multiflower and buckwheat honey. The samples were stored for 24 weeks in dark, hermetically sealed glass containers in a refrigerated chamber (8 ± 1 °C, 73 ± 2% relative humidity). The comprehensive suite of analyses comprised sugar profiling (ion chromatography), moisture content determination (refractometry), pH and acidity measurement (titration), electrical conductivity, color assessment in the CIELab system (ΔE and BI indices), texture parameters (penetration testing), rheological properties (rheometry), and microscopic evaluation of crystal morphology; all data were subjected to statistical treatment (ANOVA, Tukey’s test, Pearson correlations). The changes in these parameters were examined at 1, 2, 3, 6, 12, and 24 weeks of storage. A slight but significant increase in moisture content was observed (most pronounced in rapeseed honey), while all parameters remained within the prescribed limits and showed no signs of fermentation. The honeys’ color became markedly lighter. Already in the first weeks of storage, an increase in the L* value and elevated ΔE indices were recorded. The crystallization process proceeded in two distinct phases—initial nucleation (occurring fastest in rapeseed honey) followed by the formation of crystal agglomerates—which resulted in rising hardness and cohesion up to weeks 6–12, after which these metrics gradually declined; simultaneously, a rheological shift was noted, with viscosity increasing and the flow behavior changing from Newtonian to pseudoplastic, especially in rapeseed honey. Studies show that refrigerated storage accelerates honey crystallization, as lower temperatures promote the formation of glucose crystals. This accelerated crystallization may have practical applications in the production of creamed honey, where controlled crystal formation is essential for achieving a smooth, spreadable texture.

Graphical Abstract

1. Introduction

During storage, honeys undergo visually discernible changes. These result from the crystallization process of the honeys, causing changes in the sensory, rheological and even thermodynamic properties of the honeys [1,2,3,4]. As a result, honey becomes cloudy, hard and difficult to spread, and thus less attractive to the consumer [5,6,7,8]. Crystallization can also cause some problems in honey processing, because the change in viscosity results in difficulties in handling, fractionating and filling the product into containers. This worsens the proper functioning of certain equipment, such as dispensers and filling machines [9,10]. This phenomenon occurs naturally and spontaneously in honey and mainly depends on the species of honey, the ratio of glucose to fructose (G/F), glucose to water (G/W) and the ratio of the difference of glucose and water to fructose ((G − W)/F) but also on the conditions of honey storage (temperature, humidity and time). Among Polish honeys, rape and dandelion honeys are the fastest to crystallize, characterized by a fine-grained crystalline structure (replacement diameter of crystals dmax < 10 μm) [11,12]. The first signs of crystallization (slight turbidity resulting from the formation of crystallization nuclei) and changes in the consistency of these honeys occur as early as the first week after honey harvesting and are sometimes already visible in the cells of the comb [13,14]. Crystallization of multifloral honey occurs within a few weeks to a few months, while buckwheat honey takes about three months to crystallize. Both honeys are characterized by a coarse-grained crystal structure [13]. There are also honeys that take much longer to crystallize. An example is acacia honey, characterized by a high fructose content relative to glucose. In general, the literature divides honeys into fast, slow and rare crystallizers depending on the value of the G/F ratio, which is 0.88 (0.64–1.52); 0.76 (0.56–1.01); and 0.66 (0.51–0.74), respectively [15]. Concurrently, the same authors suggest that a better indicator to predict honey crystallization is the glucose-to-water (G/W) ratio. Using this ratio, the authors showed concordance for 68% of the international honeys tested and 93% of Greek honeys. Undoubtedly, the rate of crystallization depends on the storage temperature of the honeys. The literature reports various optimal temperatures for the crystallization process of honey, ranging from 10 °C to 17 °C, with most authors indicating 13–15 °C as the optimal temperature for the formation of crystallization nuclei (microscopic glucose crystals) [4,5,6,16,17,18,19,20]. Temperatures above 25 °C keep honey in liquid form longer, but due to the adverse physicochemical changes occurring in honeys, this is not advisable. Only a few sources report that refrigeration conditions (7–10 °C) also promote crystallization [21], although other sources report that at 8–10 °C, honey retains its liquid form [13,22], and lower storage temperatures (4–7 °C) initiate the formation of crystallization nuclei. Under such conditions, crystallization is faster and uniform throughout the volume due to an increase in the viscosity of the honey and impeded fall of glucose crystals to the bottom of the vessel.
The beekeeping industry is a very specific industry and struggles with many problems, including the lack of clear procedures for handling honey after it has been harvested. Hence, one of the research directions is to determine the optimal storage conditions of honey that fully preserve its sensory and nutritional properties. In this regard, questions arise: At what temperature should honey be stored to accelerate or delay the crystallization process without losing its nutritional value? Are clear jars good containers for storing honey? And finally, does honey expire? The answers to these questions are not confirmed by research, and beekeepers base their production practices on their own experiences. Given the scant reports on the storage of honeys under refrigeration conditions, a series of studies was undertaken to evaluate selected physicochemical properties of the most popular Polish honeys during their storage at 8 ± 1 °C at 73 ± 2% humidity without light exposure. The choice of 8 ± 1 °C in the study was primarily motivated by the fact that this temperature range corresponds to typical conditions in domestic refrigerators. Changes were observed from the moment the honey was harvested (t0—strained honey) through their 24-week crushing period. A short crystallization time may be beneficial for producers of creamed honey. During this time, most honey stored at room temperature crystallized.

2. Materials and Methods

2.1. Material

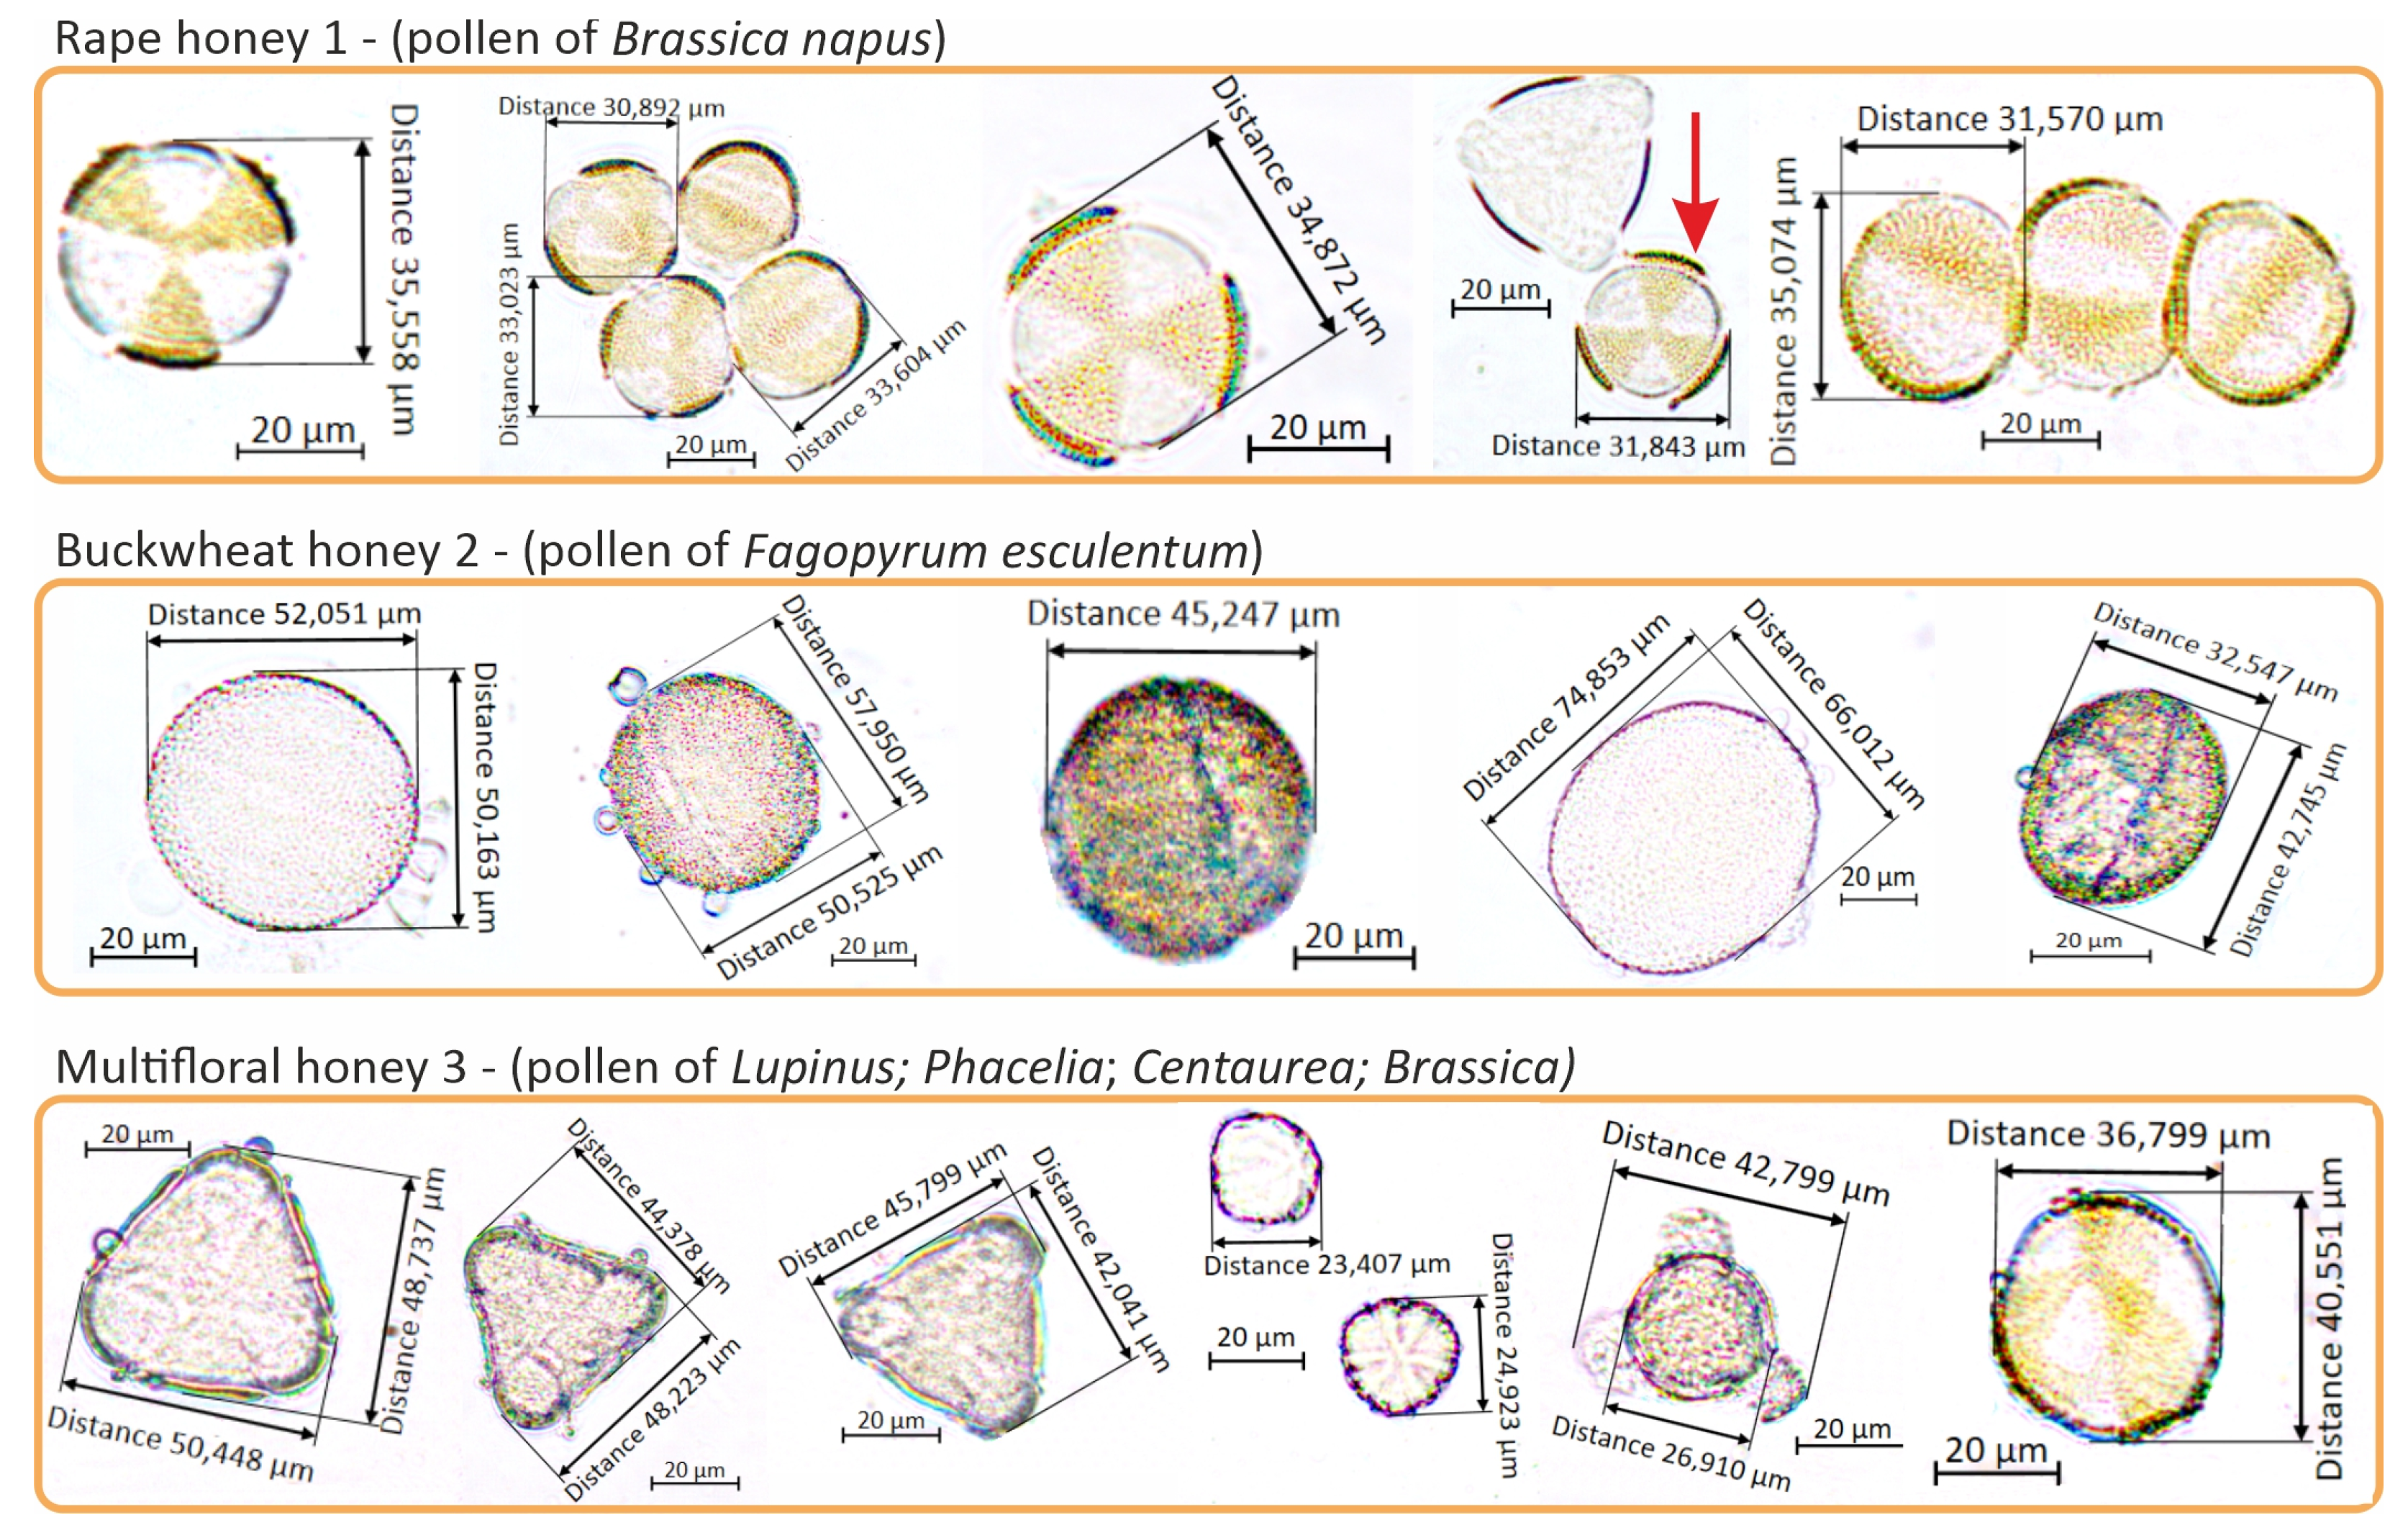
2.1.1. Varietal Identification of the Tested Honeys

The study included 3 varieties of nectar honeys produced by Apis mellifera species obtained in the months of June, July and August from an apiary located in the area of Wielkopolska, Poland. The honeys were identified by pollen analysis as rape (honey 1—June), multifloral (honey 2—July) and buckwheat honeys (honey 3—August). Pollen analysis was carried out according to the method presented by Pospiech et al. [23] and the Regulation of the Polish Minister of Agriculture and Rural Development [24], which involves microscopic examination of fixed preparations of pollen grains obtained by centrifugation of aqueous honey solutions. The preparations were observed using a Zeiss Axipolar microscope (Carl Zeiss AG, Oberkochen, Germany), counting at least 300 pollen grains for each honey while determining their species based on the database at www.paldat.org [25] and the flowering period in Poland. Based on the percentage of one pollen grain in the analyzed sample of 300 pollen, the following categories were determined: dominant pollen (D) > 45%, secondary pollen (S) 16–45%, tertiary pollen (M) 3–15% and trace pollen (T) < 3%. From a palynological point of view, honey that contains the dominant pollen type (>45% of total pollen) is considered monofloral. Meanwhile, when honey contains different types of pollen and lacks dominant pollen (<45%), it is considered multifloral [26]. Based on the study, the honeys studied were of the following varieties: rape (98% of rape dominant pollen), buckwheat (77% of buckwheat dominant pollen) and multifloral (diversity of pollen grains with secondary lupine pollen grains at 7%), (Figure 1).

2.1.2. Determination of the Sugar Profile of Honeys

The honeys were tested for the sugars present in them. Sample preparation consisted of extracting the sugars with water and then de-proteinizing them using the Carrez method, and then clarifying them. The prepared samples were determined by anion chromatography with pulsoamperometric detection in triplicate. Separation was performed with Thermo Scientific™ Dionex™ CarboPac™ SA10-4 µm Columns (2 × 250 mm) (Thermo Fisher Scientific, Waltham, MA, USA). The elution was performed with a gradient with two KOH solutions (concentration at 8–12 mM adapted to the condition of the system). Measurement uncertainties were estimated for a coverage factor of k = 2 and a confidence level of 95%. Based on the predictors of honey crystallization known from the literature, such as F/G (fructose/glucose ratio), G/W (glucose/water ratio) and (G − W)/F (glucose/water/fructose difference ratio), the honey crystallization potential was calculated [27,28,29,30]. It has been reported that the higher the W/G and (G − W)/F ratios, the faster the crystallization process occurs [15,19,31].
The honey, immediately after honey harvesting, was poured into glass jars (40 ± 2 g) with a total height of 45 mm and tightly closed with a twist-off metal lid. Samples prepared in this way (80 jars of each type of honey) were stored for a period of 6 months in thermo-insulated polystyrene containers in a refrigerated chamber at 8 ± 1 °C and 73 ± 2% humidity. All jars for each honey type were filled from a single bulk batch, collected during one harvest from the same apiary and at the same time (respectively for the harvest of a given honey variety). Using a single, homogeneous batch eliminated variability due to differences between individual harvests and environmental conditions, thus allowing a focused assessment of the effects of refrigerated storage alone on honey quality parameters. Given the discrepancies in the literature regarding the effects of 7–10 °C storage on honey crystallization and quality stability, the choice of 8 ± 1 °C was deemed scientifically justified, as it reflects typical household refrigeration conditions and enables deeper insight into honey behavior under real-world storage. Each jar represented an independent sample stored under identical conditions, and only one jar was opened and analyzed at each sampling point. This ensured that measurements were performed on independent samples, providing statistical validity of the results.
The honeys were tested immediately after collection (strained honey—t0 reference sample) and in the following weeks of storage: 1, 2, 3, 6, 12 and 24 (t1, t2, t3, t6, t12 and t24). Each time before testing, honey was heated to 20 ± 1 °C (held under natural conditions until this temperature was reached). The results of the tests were related to the requirements specified by the following documents: Regulation of the Minister of Agriculture and Rural Development [24], Directive 2014/63/EU of the European Parliament and of the Council [32] and the Codex Alimentarius Commission Standard [33]. The above-mentioned documents are currently mandatory for use in honey production. Some requirements are also referenced in the Polish Standard PN-88/A-77626 [34], which is used in Poland on a voluntary basis (Table 1).

2.2. Tests Carried out During Storage of Honeys

2.2.1. Determination of Moisture and Extract Content

The moisture in honeys was assessed using a refractometric method recommended by the AOAC [35] and also by the European Honey Commission (EHC) method described in Harmonised Methods of the European Honey Commission [36] and Regulation of the Polish Minister of Agriculture and Rural Development [26,37]. A unique difference of the second method is the sample pre-treatment, when it is crystallized. Therefore, for this purpose, 5 g of honey was weighed into a test tube and placed in a water bath at 50 °C to liquefy it. The liquefied honey sample, cooled to 20 °C, was applied between the prisms of an Abbe RL4 refractometer (Polish Optical Works, Warsaw, Poland), after which the refractive index and extract content were read. The readings from the measurements were converted according to the method of the AOAC [35] into moisture in honey [38,39].

2.2.2. Evaluation of pH and Free Acidity

The measurement was performed using the method presented by many authors [39,40,41,42,43]. For this purpose, 10 g of honey was dissolved in 75 mL of distilled water in a 150 mL beaker. The beaker with the solution was placed on a magnetic stirrer by immersing a pH-metric electrode in it and reading the pH value from the measurement. The prepared sample was then titrated with a 0.1 mol/L NaOH solution using a Titronic 300 digital burette (Donserv, Warsaw, Poland) until a pH of 8.3 was obtained, and then maintained for about 120 s [36]. The total free acid content of the honey was calculated as 10 times the volume of NaOH used for titration and expressed as milliequivalents of meq/kg of honey.

2.2.3. Determination of Electrical Conductivity of Honeys

Electrical conductivity was measured in aqueous honey solutions (CO2-free distilled water) as a 20% weight in volume solution in water at 20 °C, where the 20% refers to honey dry matter. The measurement was performed by the method recommended by the European Honey Commission (EHC) method described in Harmonized Methods of the European Honey Commission [35] and Regulation of the Polish Minister of Agriculture and Rural Development [24]. The measurement was performed with a multimeter with a ProLab 2500 (SI Analytics, Mainz, Germany) with a conductivity electrode TetraCon 925-P (Xylem Analytics, Weilheim, Germany).

2.2.4. Color Analysis

The color of the honeys during storage was evaluated with a colorimeter model RT100 (Lovibond Tintometer, Dortmund, Germany) in the CIEL*a*b* system, in which color is represented by an achromatic component L* and two chromatic components a* and b* [19,40], where −a* greenness; +a* redness; −b* blueness; and +b* yellowness. The instrument was calibrated with black and white standard tiles before each set of measurements. The sample temperature was equal to the ambient temperature and was 20 °C. According to Equation (1), the total color difference (ΔE) was calculated, thus determining the color changes of the honeys during storage. A criterion was used to process the results, in which color differences (ΔE) were classified as follows: imperceptible (0 to 0.5), barely noticeable (0.5 to 1.5), noticeable (1.5 to 3), clearly visible (3 to 6) and large (more than 6) [44]. Measurements for each sample were made in 5 replicates.
Δ E = ( L L 0 ) 2 + ( a a 0 ) 2 + ( b b 0 ) 2
where the symbols L0, a0, b0 denote the color coordinates of the sample at time t0.
The results of the colors were additionally presented in the cylindrical color space L*C*H*. For this purpose, the measured results were converted by determining the hue angle (H*) and saturation (C*). The value of H* represents the visual impression. The color is estimated based on specific values of the parameter H*: 0–90° red-yellow, H*: 90–180° yellow-green; H*: 180–270° green-blue; and H*: 270–360° blue-red. The C* value is the distance of the point from the center of the arrangement and describes the color saturation (so-called color purity). The further from the center of the arrangement (from the value 0), the deeper and purer the color is. Accordingly, a* and b* values were used to calculate Equations (2) and (3), the browning index (BI), according to research presented by [45,46]:
B I = 100 ( x 0.31 ) 0.172
x = ( a + 1.75 L ) 5.645 L + a 3.012 b

2.2.5. Texture Analysis

Texture evaluation was carried out based on the hardness and cohesiveness index, defined as the maximum and minimum value of the force necessary to deform the sample (or its penetration into the depths) occurring during the first compression of the sample. The measurement of this texture discriminator made it possible to determine the degree of crystallization of the honeys during storage. A single analytical sample was a jar filled with honey up to the height of the neck (40 mm), weighing 40 g ± 2 g. The jars were prepared on the first day of testing by bottling the strained honey. The analysis was performed based on a penetration test using a TMS-Pro texture analyzer (Food Technology Corporation, Sterling, VA, USA), as described by Tappi et al. [47], Conforti et al. [6] and Dolik et al. [48]. The texture analyzer was connected to a PC with Texture Lab Pro software, with which the values of selected parameters were recorded. A cylindrical probe with a flat type cross-section (d = 10 mm) and a y-axis displacement speed corresponding to 0.8 mm/s was used. Penetration was carried out at a depth of 35 mm into the product. Strain gauges of 50 N and 250 N contact force were used for measurement. The tests were performed in triplicate for each test term, with one jar of honey being one measurement. From the obtained curves of force as a function of time f = F(s), the following parameters were interpreted: hardness (H) as the force recorded at a positive peak, and cohesion (C) as the force recorded at a negative peak [19].

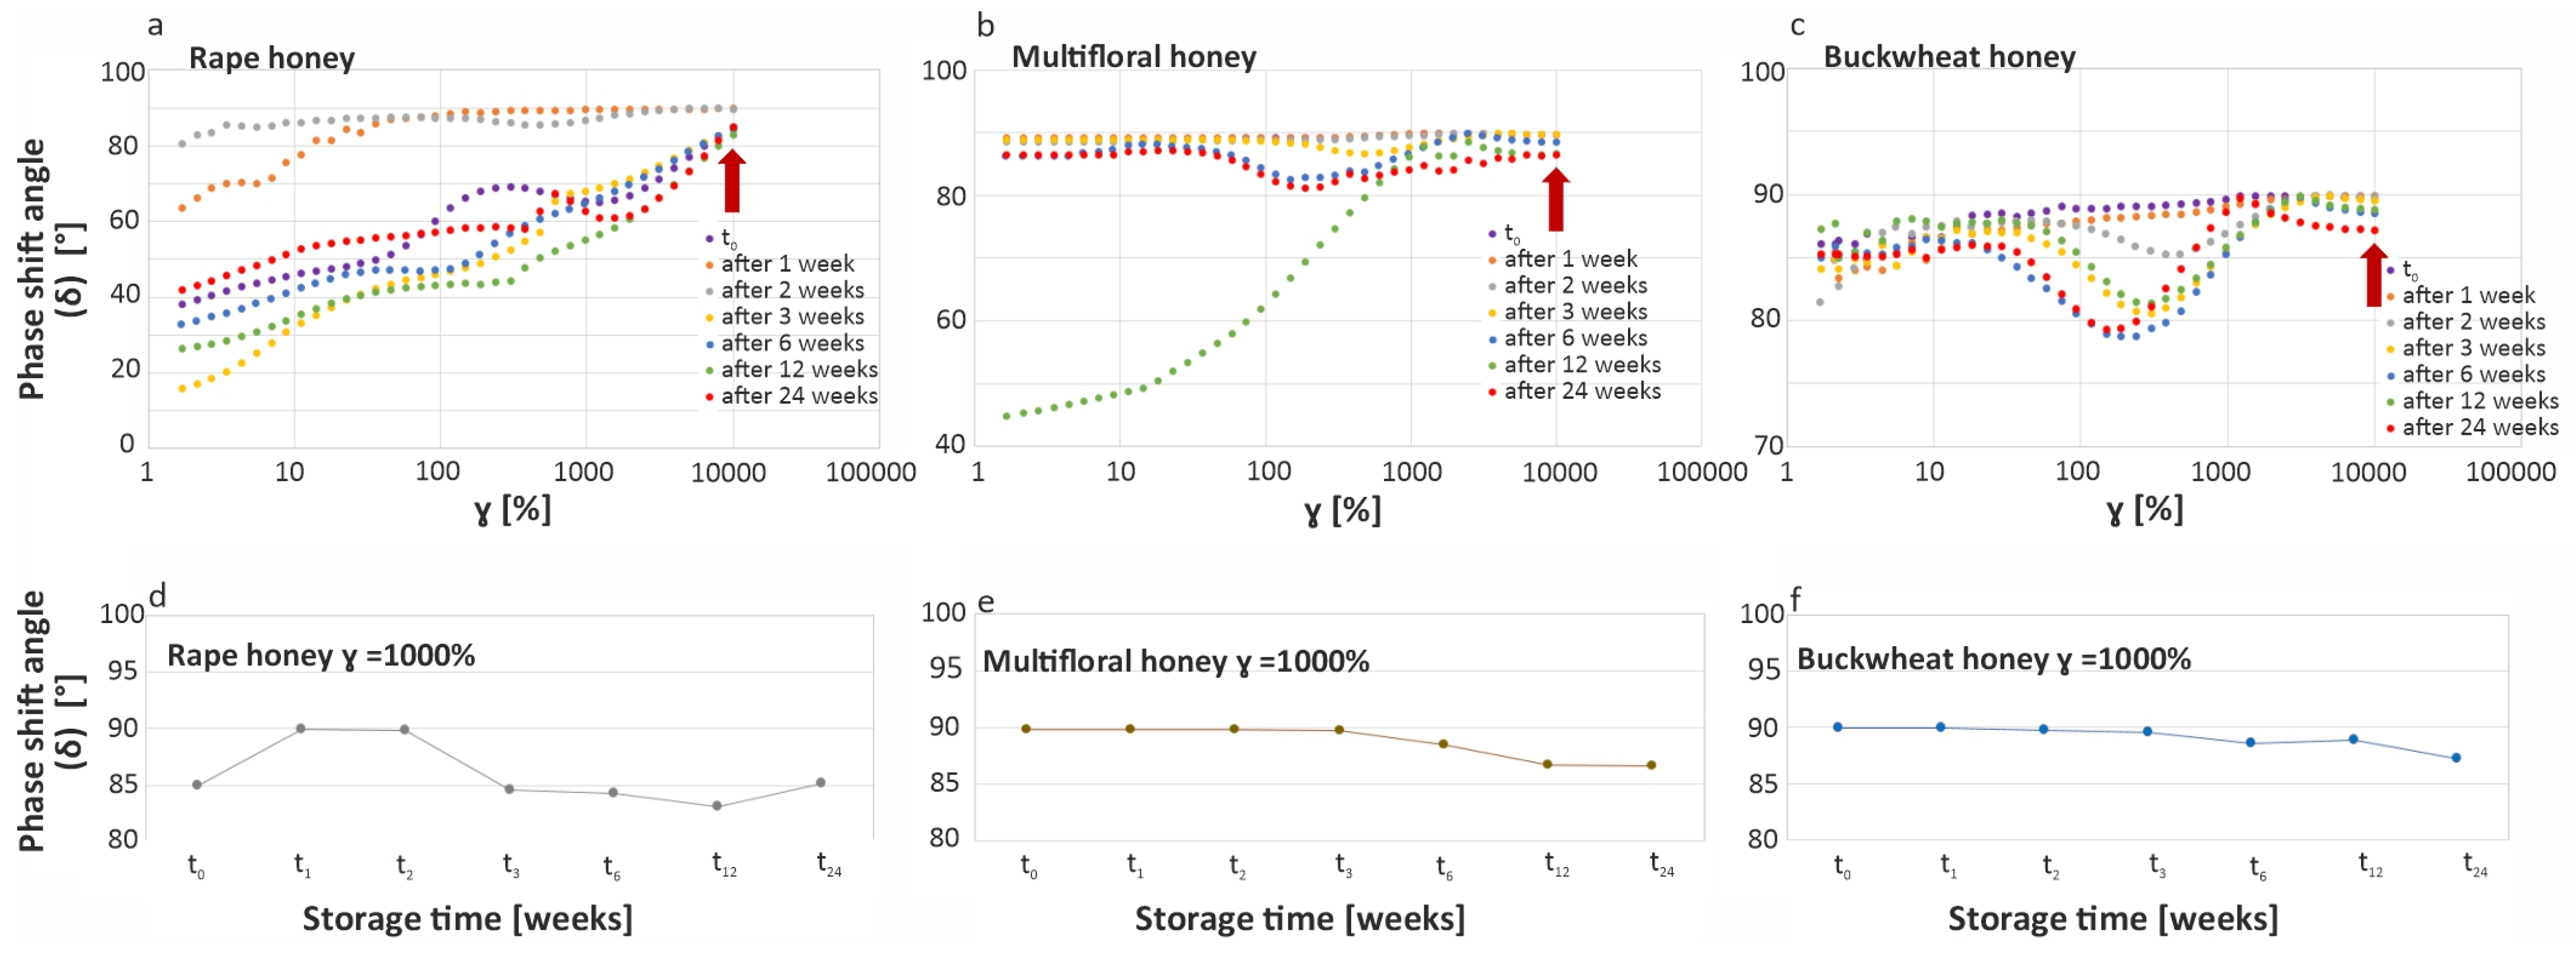
2.2.6. Rheological Measurements

Changes in the viscosity of the honeys during storage were tested using Thermo Scientific™. HAAKE™ Viscotester™ iQ Air rheometers (Thermo Fisher Scientific Inc., Waltham, MA, USA) according to the method presented by Faustino and Pinheiro [49], Chen et al. [50] and Tappi et al. [47]. The study was conducted on honeys at 20 °C. Rheological parameters were determined by rotational measurements as a function of linearly increasing stress. For the measurement, a plate–plate geometry with a diameter of 95 mm and a gap of h = 1 mm was used. The plates were notched to eliminate the phenomenon of sample slippage. Once the sample was loaded on the plate, shear (τ) was increased from 3 to 300 Pa during 500 s. Each week, the value of viscosity was recorded at shear 300 Pa. Additionally, an amplitude sweep from 0.01 to 1000% deformation at frequency 1 Hz was performed each week to determine changes in phase angle δ.

2.2.7. Size and Structure of Crystals

The microstructure of the honey was qualitatively assessed by microscopic observation using a Zeiss Axiolab microscope (Carl Zeiss AG, Oberkochen, Germany) equipped with a Nikon digital camera module [51]. About 1 g of honey was placed on a microscope slide and covered with a second coverslip. Observations were carried out at 40 magnification by taking five slides for each honey and taking pictures of the observed crystals and their agglomerates.

2.2.8. Statistical Analysis

Characteristics of honey samples (pollen analysis, sugar profile, moisture, F/G, G/W and (G − W)/F ratio) were evaluated at time t0 immediately after honey harvesting. Other tests, along with changes in moisture in honey, were conducted during the entire 24-week storage period (at time points t0, t1, t2, t3, t6, t12 and t24). The results obtained were presented as averages in graphs and tables, along with standard deviations. The results of the analyses were subjected to analysis of variance (ANOVA) and Tukey′s mean test (p < 0.05) using Statistic 13 software. Pearson′s linear correlation coefficients were determined between the hardness, consistency and viscosity of the honeys, using the following interpretation: r > 0 positive correlation (as the hardness/cohesion of the honeys increases, their viscosity increases); r = 0 no correlation (as the hardness/cohesion of the honeys increases, sometimes viscosity increases and sometimes viscosity decreases); r < 0 negative correlation (as the hardness/cohesion of the honeys increases, their viscosity decreases). The interpretation of the strength of correlation is as follows: <0.2 (no linear relationship); 0.2–0.4 (weak relationship); 0.4–0.7 (moderate relationship); 0.7–0.9 (fairly strong relationship); and >0.9 (very strong relationship) [44].

3. Results and Discussion

3.1. Analysis of the Physicochemical Changes of the Tested Honey Varieties During Storage

The tested honeys immediately after harvest (t0) were characterized by statistically significantly different moisture and extract contents (Table 2). Buckwheat honey exhibited the highest moisture content (18.0%) and consequently the lowest extract content (80.5%), whereas rapeseed honey had the lowest moisture level (17.1 g/100 g) and the highest extract content (81.4%). The authors of the reports explain the different values of moisture and extract of honey by the variety, harvest season and maturity of the honey [52,53]. During 24 weeks of refrigerated storage, an increase in the moisture content of the honeys was observed, ranging from 0.33 to 0.97 g/100 g. The most pronounced changes occurred in rapeseed honey, which initially had the lowest moisture content. The fastest increase in moisture for this honey (0.47 g/100 g) was noted between the sixth (t6) and twelfth (t12) week of storage. In the following 12 weeks (up to t24), the increase was smaller, at approximately 0.17 g/100 g. This rise in moisture content was accompanied by a decrease in extract content, which reached 80.4% after 24 weeks. Statistically insignificant changes in moisture and extract content during refrigerated storage of honeys were observed in buckwheat honey. The observed changes in the above parameters throughout the storage period were within the requirements set out in the applicable quality standards and legal regulations regarding honey production, including the maximum moisture content not exceeding 20% and the minimum extract content of at least 80%.
The obtained results are consistent with the findings of da Silva et al. [41], despite the fact that their study was conducted under ambient conditions. The authors attributed the increase in moisture and the corresponding decrease in extract content in honey to enzymatic reactions, which lead to the formation of various compounds responsible for its characteristic properties and functional value. One such compound is hydrogen peroxide, known for its antimicrobial activity, which is formed through the action of glucose oxidase converting glucose into gluconic acid. Subsequently, hydrogen peroxide is decomposed into water and oxygen by the enzyme catalase, potentially contributing to increased moisture levels in honey [41,54,55,56,57,58]. Since the optimal temperatures for glucose oxidase and catalase activity are 25–30 °C and 25–40 °C, respectively [59], it was hypothesized that refrigerated storage would slow down moisture increase compared to room temperature conditions. However, our findings, in light of previous studies [31,39,41,60,61], did not confirm this relationship. This may indicate that the kinetics of these changes are more complex and may depend on additional factors—possibly the ratio between glucose oxidase and catalase activity, or processes not solely driven by enzymatic reactions. It is also worth noting that the observed changes in moisture and extract content during storage were minor and did not affect the overall quality of the honey. Moreover, in all cases, moisture content remained well below the maximum allowable limit of 20% defined by national and international quality standards [33,34,37].
The tested honeys were characterized by different initial acidity (in the range of 10.67–40.70 meq/kg) and similar pH values (in the range of 3.58–3.83) (Table 2). The values of these parameters were within the limits set by national and international standards (the maximum allowable acidity value is 50 meq/kg according to the literature [32,33,34,37]). The results obtained were in line with those presented by other researchers, showed no signs of fermentation that would result in the formation of organic acids and exceeded the free acidity limit specified by the standards [27,40,53,62,63]. This indicates that the analyzed honeys were well preserved throughout their storage period at refrigeration temperature. Buckwheat honey had the highest initial acidity (at 40.70 meq/kg), while the acidity of multiflower and rapeseed honeys was at the level of 21.27 and 10.67 meq/kg, respectively. The observed differences are due, among others, to the varietal nature of the honey and the associated quantitative contribution of individual organic acids (for example, the amount of gluconic acid resulting from enzymatic action on glucose) and phenolic and tannic compounds. Differences in free acidity values may also result from the period of honey extraction [53,64,65]. For example, spring honey varieties such as rapeseed and multiflower honey have lower acidity in relation to summer varieties like buckwheat honey [13]. During 24 weeks of refrigerated storage of the honeys, it was observed that their acidity initially increases and then decreases to a level close to the initial acidity. Similar results were obtained by da Silva Cruz [66] for honeys stored at 5 °C. The largest increase in acidity (at 49%) was recorded in the third week of storage for canola honey, while the smallest increase was recorded for buckwheat honey (4% increase—second week of storage). It is significant that the acidity of the honeys did not exceed the critical value of 50 meq/kg, which could suggest their microbial contamination and the fermentation of sugars [67,68,69]. Literature reports indicate that storing honeys at 20 ± 2 °C results in a steady increase in their free acidity due to the storage maturation of the honeys and the transformation of sugars into organic acids (e.g., acetic acid) and water [41,42,54,56]. The acidity of honeys increases due to dehydration of hexoses, which consequently decompose into levulinic and formic acid, causing an increase in the free acidity of honey [21,70]. Thus, the use of refrigerated storage conditions inhibited this process and even reversed its effects, possibly related to the crystallization of the honeys. Moreover, the change in acidity did not directly affect the change in pH, although many scientific reports suggest this fact [39,60,66]. Finally, the final pH values of the honeys decreased with respect to the initial sample by about 3%, similar to other research studies [11,31,39,41,60,71], which is due to the formation of gluconic acid in the honey during storage. However, a linear relationship between the analyzed parameters was not demonstrated, as evidenced by the Pearson correlation coefficients calculated for the individual honeys (Table S1).
As shown in Table 2, the electrical conductivity values of the tested honeys at t0 ranged from 0.196 mS/cm for rapeseed honey to 0.465 mS/cm at t0 for buckwheat honey and were also within the limits indicated by national and international standards (for nectar honeys below 0.8 mS/cm—[32,33,34,37]). The differences in conductivity are due, among others, to the content of dissolved minerals [27], organic acids and proteins [39,60,63,69]. A 3–6% increase in the electrical conductivity of the honeys was observed during storage. It is likely that during storage, the enzymatic decomposition of sugars (especially fructose) occurs, and gluconic acid, acetic acid and other organic acids are formed. These acids dissociate in aqueous solution, increasing the concentration of ions and, thus, conductivity. Similar results regarding the increase in conductance were obtained by researchers storing honeys at room temperature [39,72], while different results were observed by da Silva et al. [41]. Honey from Apis mellifera, in general, presents conductivity values from 0.12 to 1.0 mS/cm [69].

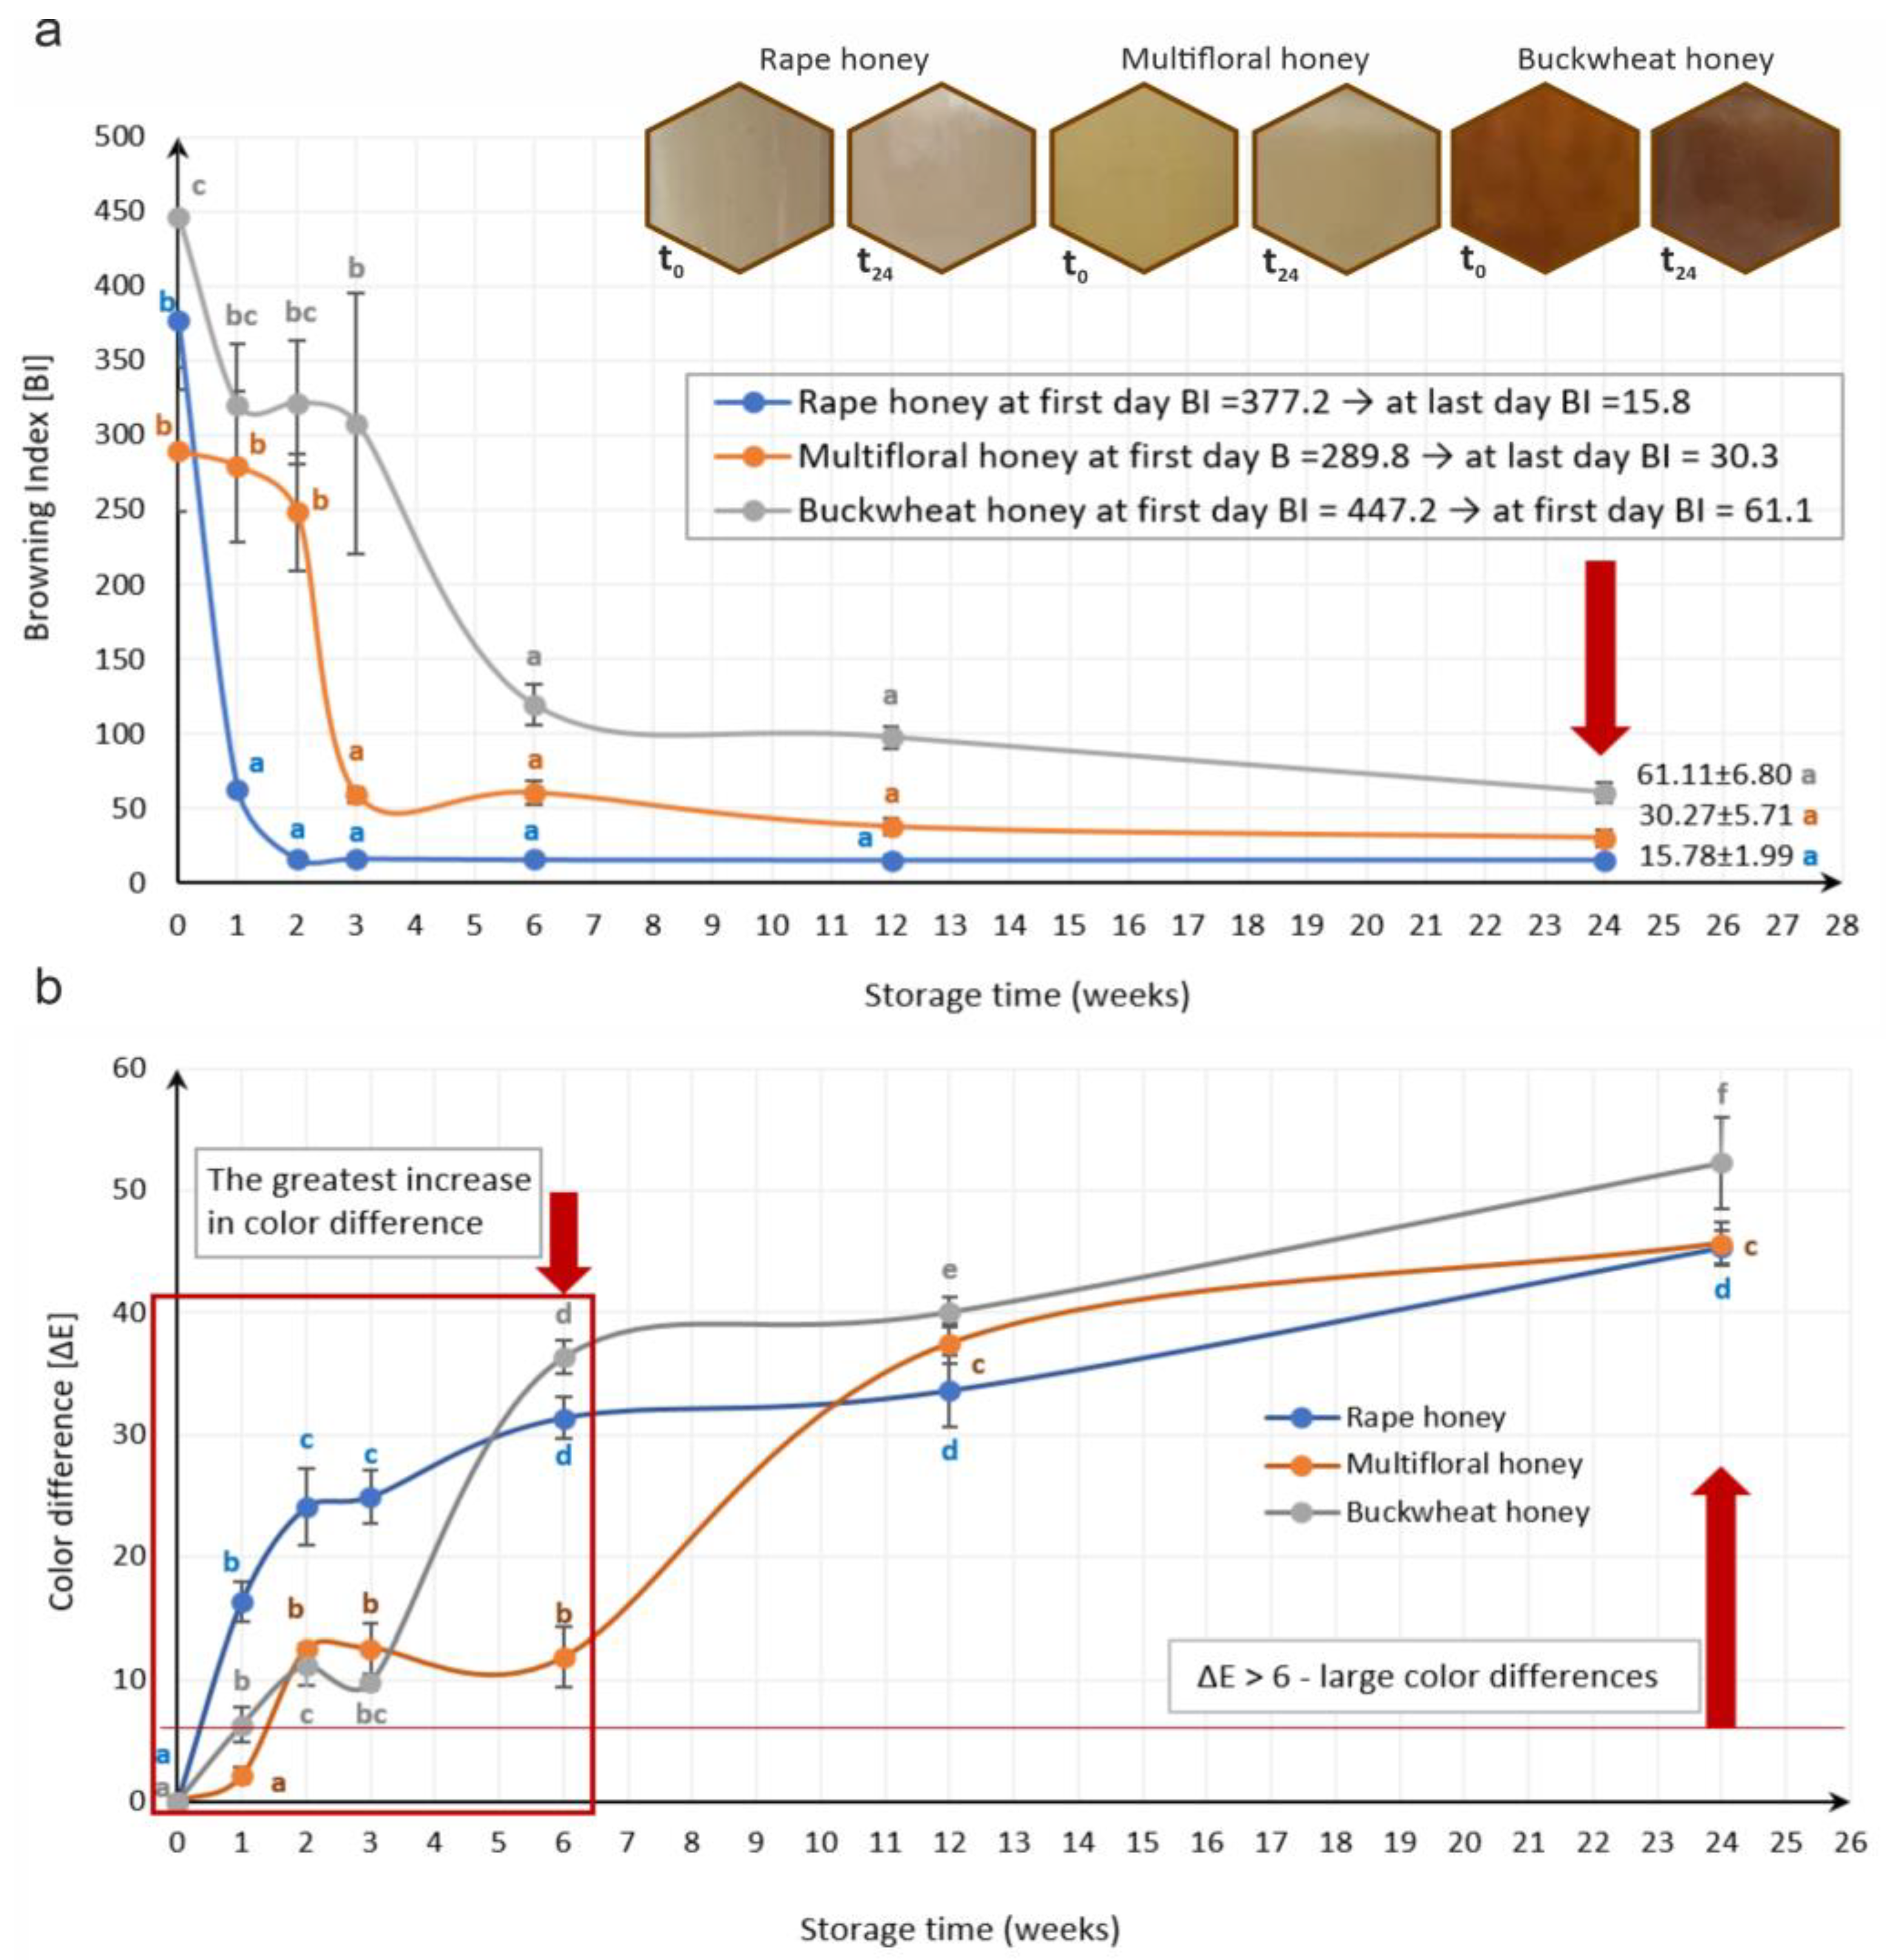
3.2. Analysis of Color Changes of Tested Honey Varieties During Storage

Table 3 presents the results of the color changes. Of the honey varieties analyzed immediately after bottling, rapeseed honey had the lightest color (mean L*t0 = 18.92), followed by multiflower honey (mean L*t0 = 10.38), while buckwheat honey was the darkest (mean L*t0 = 4.02). According to the study, the initial color of honey is significantly influenced by the flavonoid content [73]. The values obtained were significantly lower than those presented by other authors [10,41,74]. The reason for this was the clarity of the honeys at time t0 (day-old honey), which made it difficult to implement the measurement, which is in line with the study of Ji et al. [19]. The analysis of the color components in chromatic space (Table 3) indicates that the tested honeys immediately after their acquisition were characterized by a slight saturation of yellow color (the value of the parameter a* at the level of 2.40–4.30) and different saturation of red color (the value of the parameter b* was in the range of 5.35 for buckwheat honey and 23.73 for rapeseed honey). The obtained values were confirmed by the values of the H* and C* parameters (Table 3), indicating that the tested honeys were characterized by an orange hue (H: 53.87–79.71) with low intensity saturation (value of the C parameter: 6.72–24.12). In addition, based on the above values of the color components, a browning index (BI) was calculated for each botanical honey variety (Figure 2a). The highest initial degree of browning was found by buckwheat honey (BIt0 = 447.2), followed by rapeseed honey (BIt0 = 377.2) and multiflower honey (BIt0 = 289.8). The order of magnitude of the initial BI values is consistent with those obtained by Karabagias et al. [40] and Chaikham et al. [46], who studied the effect of heating and ultrasound treatment of honeys on the substitutions of color components, including browning index (BI).
It was observed that in all the honey varieties tested after 24 weeks (t24) of refrigerated storage, there was an increase in color brightness (L*) compared to the zero sample (honeys tested at t0). This may have been due to the crystallization of the honeys occurring at this time and the growth of crystals [19,75]. It is known that low temperatures encourage the crystallization of honey, and this process leads to the increased lightness of this product. The glucose crystals formed, and their shape and size affected the scattering and reflection of light and thus the values of the color parameters analyzed [4]. At the same time, it was noted that the obtained changes in color lightness (increase in the L* parameter) are not consistent with the results of da Silva et al. [41] and Schiassi et al. [10], who showed darkening of honeys. At the same time, they stored the honeys under room conditions, which could promote enzymatic and non-enzymatic color changes. On the other hand, the observed changes in the L* parameter were consistent with the results of Piotraszewska-Pająk and Gliszczynska-Świgło [74], who stored their honeys (rape, acacia, linden, multifloral, heather, buckwheat) at 4–6 °C for 9 months.
The largest increases in color brightness for the tested honeys were observed in the following weeks: t2 (L*t0 = 18.92 → L*t2 = 33.59) for rapeseed honey, t3 (L*t0 = 10.38 → L*t3 = 22.46) for multiflower honey and t6 (L*t0 = 4.02→ L*t6 = 35.01) for buckwheat honey. Intense crystallization of the honeys was also observed during these weeks. In addition, yellow b* and red a* color saturation also changed significantly during the storage. In the case of rapeseed and multiflower honeys, a significant reduction in redness (a*) and a shift in the value of this parameter toward a green color were observed, among others, which corresponded to changes in the value of a*t0 = 4.30 to a*t24 = −1.32 (rapeseed honey) and a*t0 = 2.40 to a*t24 = −1.27 (multiflower honey). This is consistent with the results of Popek and Figiel [76], who show that crystallized rapeseed and multiflower honeys can take CIELab color component values at (accordingly: L* = 38.47; a* = −1.03; b* = 3.67 oraz L* = 29.18; a*= −0.30; b* = 5.33). This is confirmed by the proportion of green color in this system (negative values of the a* parameter). However, in the case of buckwheat honey, refrigeration storage resulted in an increase in redness a*t0 = 3.96 to a*t24 = 5.24 and yellowing b*t0 = 5.35 to b*t24 = 22.69. The observed changes in the color of honey indicate that storing it in refrigerated conditions prevents Maillard reactions and the formation of HMF (5-hydroxymethylfurfural—one of the major intermediate products in the Maillard reaction) which, according to Turkut et al. [77], can be considered as an index of the shelf life and thermal treatment exposition of honey. In their study, the authors demonstrated, inter alia, a moderate negative correlation (r ranging from −0.6 to −0.5) between the color of honey and the HMF content in honeys after heat treatment at various temperatures. This means that with the increase in the storage temperature of honeys, their color darkens (color brightness L*↓) and the amount of HMF increases. Research in this direction should be continued.
At the same time, it was shown that the value of the BI parameter decreased with increasing storage time of the honeys under refrigeration conditions (Figure 2a), which was probably related to the progressive crystallization of the honeys and thus an increase in the brightness of the L* honeys. The Pearson correlation analysis conducted for the L* and BI color components confirmed this relationship as a negative correlation, which indicates that as the brightness of L* honeys increases, the value of the BI honey browning index decreases (Table S1). This relationship for rapeseed honey was moderate (r = −0.57), while for multiflower and buckwheat honeys it was r = −0.79 and r = −0.89, respectively (strong correlation).
Since color is one of the most important indicators of the sensory quality of food products, it directly affects the consumer′s perception of the product. The demonstrated differences in individual color components are difficult to interpret in general and do not indicate whether the color difference is perceived by the consumer or not. Hence, in order to determine the overall color changes of the honeys during storage, total color differences (ΔE) were calculated, with a value of ΔE > 3 interpreted as a clearly visible color difference [43]. The results, presented in Figure 2b, indicate that even after 1 week of storage, rapeseed and buckwheat honeys had a very large change in their color (ΔE > 6). The largest differences (at ΔEt0–t1 = 16.69) were recorded for rapeseed honey, which was undoubtedly related to the appearance of the crystal nuclei and the beginning of the crystallization process, while the lowest was for multiflower honey (ΔEt0–t1 = 2.14). Based on the observations, the kinetics of changes in the color difference (ΔE) of the analyzed honeys during their storage under refrigeration conditions were determined. It was noted that the greatest changes in the color of rapeseed and buckwheat honeys occurred in the first 6 weeks of their storage, with multiflower honey in the 12th week of storage. In subsequent weeks of storage of the honeys, there was a further increase in the difference in their color, and finally, after t24 weeks, the value of this parameter was at the level of ΔEt24 = 45.32 for rapeseed honey, ΔEt24 = 45.69 for multiflower honey and ΔEt24 = 52.28 for buckwheat honey. This means that the changes are strongly noticeable by the observer. Slightly smaller color differences were shown by Wilczyńska [78] for rapeseed honey ΔE = 25.69, multiflower honey ΔE = 19.46 and buckwheat honey ΔE = 12.48, with the honeys stored at room temperature without light exposure for 12 months.

3.3. Characteristics of Honey Crystallization Process

Rapeseed honey was characterized by the highest value of the index G/W = 2.19 and (G − W)/F = 0.59; hence, based on the research of other authors, it was assumed that this honey would undergo crystallization the fastest [15,19,30,78,79]. Multiflower honey should crystallize next, with G/W = 2.03 and (G − W)/F = 0.49, and finally, buckwheat honey, with G/W = 1.91 and (G − W)/F = 0.47. Photographs of the crystallization process of individual honey varieties in successive weeks of storage are shown in Figure 3.
Pollen grains, air bubbles and single crystalline embryos were present in liquid honeys immediately after collection (t0). It was observed that there were significantly more crystal embryos in rapeseed honey than in the other honeys, and they were characterized by a fine, oval shape. Multiflower honey, on the other hand, had an irregular crystal structure, while buckwheat honey contained mainly large, flat crystals, which is in line with the study of Bakier et al. [2]. It was observed that during the storage of the honeys, there was an increase in the number of crystals and that they formed characteristic crystal structures (clusters). Differences in the analyzed image for individual honeys can be seen as early as the second week of storage (t2). At this time, a lot of small and densely packed crystals are visible in rapeseed honey, while in multiflower and buckwheat honeys, single crystals and their small aggregates, unevenly distributed in the examined sample, are still observed. Only in the following weeks at t3 and t6, a thickening of crystal structures is observed in multiflower and buckwheat honeys, leading to the filling of voids in the field of vision. From this point on, no more significant changes are observed in the crystallization structure of the honeys. It can therefore be assumed that after this storage time, it is preferable to cream the honey. Similar observations were made by Ji et al. [19], who additionally showed that honey stored at higher temperatures (including 17 °C) crystallizes more slowly than honey stored at 11 °C and 14 °C. The authors showed that the crystal structures that form in honeys stored at 17 °C after 90 days (about 13 weeks) are sparsely arranged and characterized by an elongated shape, while in honeys stored under refrigeration conditions, the crystals are smaller and densely arranged. The observed changes in the honeys are also consistent with the reports of Bakier [12] and Dettori et al. [4], who in their work pointed out the characteristic two phases of the crystallization of honeys. The first is the so-called incubation phase, in which crystalline embryos are formed in the form of thin, elongated plates. The speed of this phase depends on the honey variety, and the result is a slight turbidity of the honey. The second phase of crystallization is the lamellar phase, characterized by a rapid increase in the number of crystals and the formation of crystal agglomerates, resulting in changes in the texture, viscosity and sensory characteristics of the honeys (color). This phase proceeds very slowly until an equilibrium between the crystalline and liquid phases is formed in the honey.

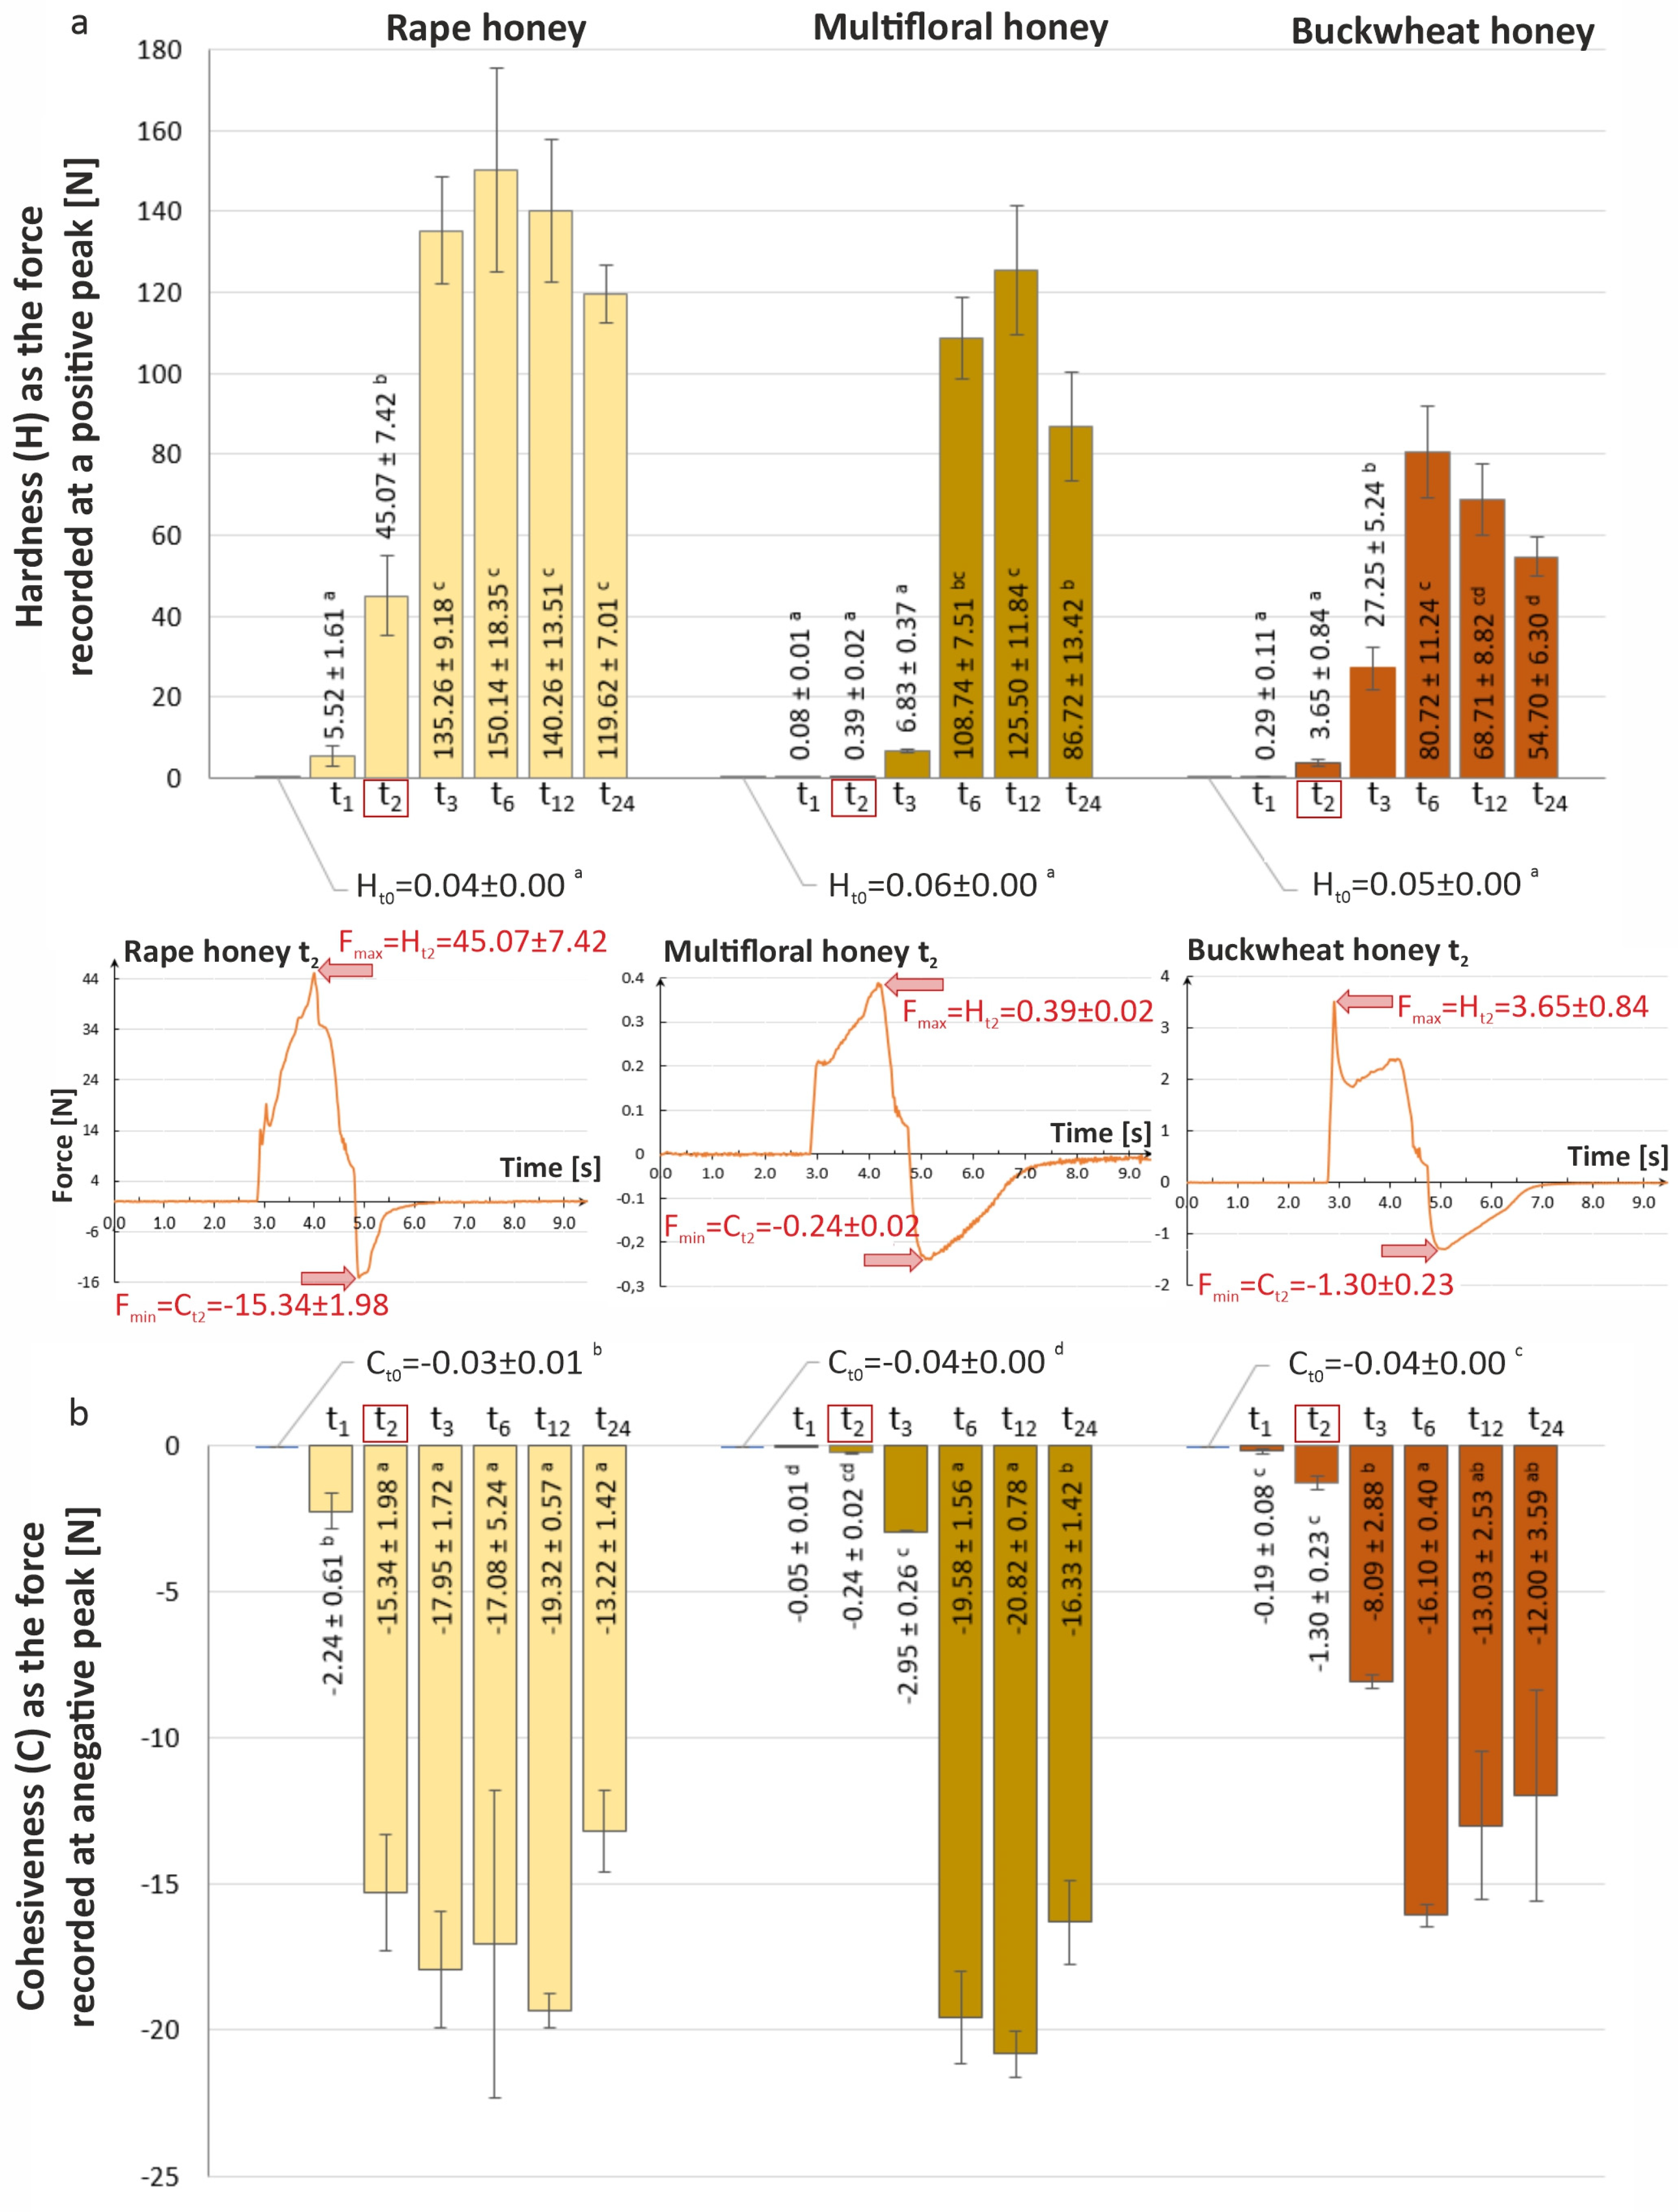
3.4. Analysis of Texture Changes of Tested Honey Varieties During Storage

The observed changes in the crystallization of the honeys are reflected in the changes in their hardness, cohesion and viscosity (Figure 4a,b and Figure 5) and are consistent with the studies of other authors [19].
The initial hardness of the honeys and the corresponding cohesion were at Ht0 = 0.04 ÷ 0.06 N and Ct0 = −0.04 ÷ −0.03 N, respectively. For the above values, the honey took a liquid form. During the storage of the honeys, the values of these parameters changed statistically significantly (α = 0.05), taking the highest (hardness) and lowest (cohesion) values between 6 and 12 weeks of storage (Figure 4). The changes in these parameters are due to the rate of crystallization, which, according to literature reports, depends, among others, on the glucose content of the honey but especially on the predictors of crystallization (F/G; G/W and (G − W)/F). Glucose crystallization influences the final structure of honey and, consequently, the texture properties described in this work, such as the hardness and consistency of honey, which is in line with previous reports [3,80].
Up to a 30% decrease in the values of the analyzed texture parameters was observed in the following weeks, while these changes were not always statistically significant (α = 0.05). For example, rapeseed honey was characterized by the highest hardness in the sixth week of its storage (Ht6 = 150.14 N). In contrast, the highest cohesion of this honey was recorded at week 12 (Ct12 = −19.32 N). The hardness and cohesion of rapeseed honey did not change significantly from week 3 to week 24 of its storage, contrary to multiflower and buckwheat honeys, in which, significantly, the highest hardness and cohesion were recorded at weeks 12 and 6, respectively. Based on the analysis of the hardness of the tested honeys, it can be assumed that by week 6 (rapeseed and buckwheat honey) and week 12 (multiflower honey), there is an intensive growth of crystals in crystal structures, resulting in an increase in the hardness and cohesion of the honeys. After this time, changes in the crystal structure occur. It is likely that the growth and compaction of the crystals cause them to fragment spontaneously, resulting in the formation of a fine crystalline structure. This, combined with the simultaneous increase in the moisture content of the honeys, results in reduced hardness and cohesion (Figure 4). A Pearson correlation analysis showed a strong negative linear relationship between the changing hardness and cohesion of honeys during storage (Table S1). The value of the correlation coefficient for this relationship was at the level of r = −0.99 ÷ −0.87. Moderate correlations were also shown between the changing moisture content of honeys during storage and their hardness (positive correlation r = 0.57 ÷ 0.67) and cohesion (negative correlation r = −0.72 ÷ −0.48).
The analysis of the results concerning viscosity changes indicates that multiflower honey, immediately after bottling, was characterized by an apparent viscosity of 7.14 Pa·s, while buckwheat and rape honeys were marked by viscosities of 5.21 Pa·s and 5.28 Pa·s, respectively (Figure 5). Many researchers have studied the rheological properties of traditional Polish honeys. Juszczak and Fortuna [81] investigated the rheology of Polish honeys and identified Newtonian flow behavior. Yanniotis et al. [82] examined the rheology of pine, fir, thymus, orange, helianthus and cotton honeys, finding that viscosity is particularly sensitive to temperature changes at low moisture contents, with the samples displaying Newtonian behavior. Kędzierska-Matysek and co-authors [83,84,85] investigated brassica napus honey from the Lublin region of Poland, noting similar temperature-dependent viscosity in the studied honeys. A rheological analysis by Belay et al. [55] of Ethiopian monofloral honeys showed them to display Newtonian behavior with varying values of viscosity. Many works have shown that the viscosity of the most popular honeys in Poland ranges from 1.6–20.9 Pa·s (rape honey) to 1.6–21.0 Pa·s (multiflower honey) to 1.6–18.0 Pa·s (buckwheat honey) [67,81,86,87]. The viscosity of honey can exhibit variability even when the same type of honey is measured under an identical protocol, which can be attributed to a complex interplay of several factors. Differences in geographical location and seasonal harvest periods are significant contributors, as they directly influence the physicochemical properties of honey. The mineral concentration and pollen diversity, determined by the local flora and environmental conditions prevalent in the area of honey production, can significantly impact honey′s viscosity [88]. Moreover, the environmental conditions, such as moisture and temperature, alongside bee population dynamics and the quantity of honey stored, play a crucial role [89]. Furthermore, the phenology of plant species, differential foraging behavior by bees and precipitation amounts during the apicultural period significantly affect the pollen assemblage. These factors can vary greatly across different harvest times and geographical locations, thereby affecting honey′s viscosity [88,89]. However, the results obtained confirm previous observations indicating that liquid honeys of various types exhibit Newtonian flow [81,82,90,91,92]. Average viscosity values obtained at 20 °C for samples of rape, multiflower and buckwheat honeys are shown in Figure 5, while changes in phase angle values are presented in Figure 6.
It was further observed that the viscosity of the analyzed honeys differed significantly within the botanical varieties. Rape honey had the highest viscosity, followed by multiflower and buckwheat honey. Bakier et al. [2] point out that this phenomenon depends solely on the morphology of the crystalline structures’ characteristic of the botanical variety of honey. Thus, viscosity is a reflection of the morphometric characteristics of honey crystals and their agglomerates. For example, rape honey is characterized by a fine crystalline structure and a high density of particles in suspension (Figure 3), resulting in a higher viscosity of this honey compared to the others (Figure 5). In multiflower honey, on the other hand, crystals characterized by irregular shape and size, when set in motion during oscillation, undergo changes in position relative to temporary support points. This causes greater resistance to flow in the suspension during the rotational motion of the sample than in buckwheat honey, whose crystals are large and flat [2] and change their position only horizontally during oscillation (they move rather than rotate with respect to the axis). Finally, the viscosity of crystallized multifloral honey is at a higher level than that of buckwheat honey. The viscosity of each of the analyzed honeys increased with storage time. Tikhonov et al. [93] report that viscosity is influenced by the specific gravity and moisture content of honey and that this parameter depends on the mutual ratio between simple and complex sugars, proteins and other components present in honey.
Figure 6 shows the changes in the value of phase angle. For a Newtonian liquid, the value of the angle is 90°, and for a perfectly elastic body it is 0°. The phase shift angle quantifies the phase difference between the sinusoidal stress input and the resulting strain output in a material undergoing oscillatory testing. Most materials demonstrate both elastic and viscous characteristics, classifying them as viscoelastic. In these materials, the phase shift angle, denoted as δ, ranges between 0° and 90°. The specific value of δ provides insights into whether the material behaves more like a solid or a liquid under the conditions tested. A smaller δ (less than 45°) indicates that the material exhibits more elastic behavior, where energy storage predominates. Conversely, a larger δ (greater than 45°) suggests that the material behaves more viscously, where energy dissipation is more significant. As can be observed in the case of buckwheat and multifloral honeys, there was no significant change in the angle value—from 90° just after collection to 86.3° and 86.8°, respectively. Interestingly, in week t12, the phase shift angle decreases (rape honey), indicating an increased elastic response. The crystallization process causes the formation of crystals with high molecular weight, which changes the honey from a Newtonian fluid to a pseudoplastic fluid [2,94]. Rapeseed honey showed elastic responses starting in week t3 and beyond. A decrease in the value of δ to 85° was already measured in week t1 at small deformations. The increase in viscosity observed in multifloral and buckwheat honeys over time can be primarily attributed to crystal growth. In contrast, rapeseed honey shows a gradual increase in viscosity initially, but starting from week 6, the viscosity unexpectedly starts to decrease, suggesting a halt or reversal in the factors driving the increase in viscosity observed in the earlier weeks. The relationship between crystallization and the viscosity of liquids exhibits a complex interplay, manifesting in both increases and decreases in viscosity under different conditions and stages of crystal growth. Research by Fredriksson and Åkerlind [95] highlights that as crystals grow within a liquid, the viscosity tends to increase. This phenomenon is attributed to the depletion of solute in the liquid phase, which consequently enhances the viscosity of the remaining liquid. This increase in viscosity directly influences the rate of crystal growth, underscoring a significant link between the crystallization process and the rheological properties of the liquid. Such a relationship is crucial for understanding both the kinetics of crystal growth and the material properties of the crystallized product.
Contrasting this, Hutter and Bechhoefer [96] present research where the viscosity of liquids generally decreases as crystals grow. This reduction in viscosity is thought to arise from changes in flow properties and possibly from alterations in the molecular structure or the release of heat during crystallization. Furthermore, Souda [97] observes that in systems where crystal grains mimic the behavior of viscous droplets, continuous morphological changes post-crystallization can lead to an initial increase in viscosity. However, the overall trend as crystallization progresses can still favor a decrease in viscosity.
Various mechanisms contribute to these changes in viscosity. The release of latent heat and the concentration of solute during crystallization can thin the liquid–crystal boundary and increase undercooling, facilitating crystal growth and generally decreasing viscosity [98]. Conversely, “frozen-in” stresses encountered during glass formation can heighten the nucleation barrier, potentially giving rise to well-defined crystallites associated with an increase in viscosity [99]. Furthermore, the impact of environmental conditions and microstructural orientation on viscosity changes during crystal growth is significant. The orientation of liquid-crystal directors, particularly under an electric field, can influence the propagation of elastic waves in liquid-crystal cells. This suggests that both the environmental conditions and the microstructural orientation of the system play critical roles in determining the rheological behavior during crystal growth [100].

4. Conclusions

The conducted study confirmed that storage conditions significantly affect the physicochemical and sensory properties of honey. Specifically, refrigeration conditions (8 °C, 73 ± 2% relative humidity and protection from light) effectively limited undesirable changes, such as the decrease in extract content and pH, as well as the increase in moisture, electrical conductivity and free acidity. Under these conditions, the honey samples maintained quality parameters compliant with both national and European standards throughout the storage period.
Refrigerated storage also promoted the crystallization process, which may be technologically advantageous, particularly in the production of creamed honey. This phenomenon, also reported in other studies, is estimated to proceed three to six times faster than at room temperature, although its intensity remains dependent on the botanical origin of the honey. Therefore, when modeling crystallization during storage, it is essential to consider not only known physicochemical indicators (F/G, G/W, G − W/F ratios) but also the storage conditions—especially temperature.
Importantly, honey stored under refrigeration did not exhibit darkening during storage, indicating the inhibition of both enzymatic browning and the Maillard reaction. The low temperature likely limited the activity of polyphenolic compounds, which are known to form brown complexes with amino acids and proteins and to generate reactive quinones during oxidation processes that lead to browning.
Given that honey is a product with a long shelf life, future research should focus on understanding how its bioactive properties evolve over time. Numerous studies have shown that storage temperatures above 25 °C accelerate the degradation of phenolic compounds and sucrose and increase the formation of 5-HMF. Thus, further research is needed to determine whether refrigeration can effectively inhibit these processes, what the optimal storage temperature might be and whether refrigerated storage is economically viable.

Supplementary Materials

The following supporting information can be downloaded at: https://www.mdpi.com/article/10.3390/agriculture15141476/s1, Table S1: Pearson′s linear correlation coefficients.

Author Contributions

Conceptualization, J.P.-S.; Data curation, J.P.-S. and M.S. (Marta Stachnik); Formal analysis, J.P.-S., M.S. (Marta Stachnik) and P.P.; Investigation, J.P.-S., M.S. (Monika Sterczyńska) and P.P.; Methodology, J.P.-S., M.S. (Monika Sterczyńska), M.S. (Marta Stachnik) and P.P.; Supervision, J.P.-S.; Visualization, J.P.-S., M.S. (Marta Stachnik) and P.P.; Writing—original draft, J.P.-S. and M.S. (Marta Stachnik); Writing—review and editing, J.P.-S. and M.S. (Marta Stachnik). All authors have read and agreed to the published version of the manuscript.

Funding

This research was financed by the Polish Ministry of Science and Higher Education from the statutory activities of the university.

Institutional Review Board Statement

Not applicable.

Data Availability Statement

The original contributions presented in the study are included in the article/Supplementary Material; further inquiries can be directed to the corresponding author/s.

Conflicts of Interest

The authors declare no conflicts of interest.

References

  1. Tomaszewska-Gras, J.; Bakier, S.; Goderska, K.; Mansfel, K. Differential scanning calorimetry for determining the thermodynamic properties of selected honeys. J. Apic. Sci. 2015, 59, 109–118. [Google Scholar] [CrossRef]
  2. Bakier, S.; Miastkowski, K.; Bakoniuk, J.R. Rheological properties of some honeys in liquefied and crystallised states. J. Agric. Sci. 2016, 60, 153–166. [Google Scholar] [CrossRef]
  3. Suriwong, V.; Jaturonglumlert, S.; Varith, J.; Narkprasom, K.; Tanongkankit, Y.; Nitatwichit, C.; Thaisamak, P. Thai creamed honey: Enthalpy of crystal melting and texture profile under different storage conditions. Int. Food Res. J. 2021, 28, 936–944. [Google Scholar] [CrossRef]
  4. Dettori, A.; Tappi, S.; Piana, L.; Dalla, R.M.; Rocculi, P. Kinetic of induced honey crystallization and related evolution of structural and physical properties. LWT 2018, 95, 333–338. [Google Scholar] [CrossRef]
  5. Lupano, C.E. DSC study of honey granulation stored at various temperatures. Food Res. Int. 1997, 30, 683–688. [Google Scholar] [CrossRef]
  6. Conforti, P.A.; Lupano, C.E.; Malacalza, N.H.; Arias, V.; Castells, C.B. Crystallization of honey at −20 °C. Int. J. Food Prop. 2006, 9, 99–107. [Google Scholar] [CrossRef]
  7. Venir, E.; Spaziani, M.; Maltini, E. Crystallization in Tarassaco Italian honey studied by DSC. Food Chem. 2010, 122, 410–415. [Google Scholar] [CrossRef]
  8. Cohen, I.; Weihs, D. Rheology and micro rheology of natural and reduced-calorie Israeli honeys as a model for high-viscosity Newtonian liquids. J. Food Eng. 2010, 100, 366–371. [Google Scholar] [CrossRef]
  9. Kabbani, D.; Sepulcre, F.; Wedekind, J. Ultrasound-assisted liquefaction of rosemary honey: Influence on rheology and crystal content. J. Food Eng. 2011, 107, 173–178. [Google Scholar] [CrossRef]
  10. Schiassi, M.C.E.V.; Souza, V.R.D.; Alves, N.A.; Lago, A.M.T.; Silva, S.H.; Carvalho, G.R.; de Resende, J.V.; Queiroz, F. Effect of botanical origin on stability and crystallization of honey during storage. Br. Food J. 2021, 124, 2689–2704. [Google Scholar] [CrossRef]
  11. Cavia, M.M.; Fernández-Muiño, M.A.; Alonso-Torre, S.R.; Huidobro, J.F.; Sancho, M.T. Evolution of acidity of honeys from continental climates: Influence of induced granulation. Food Chem. 2007, 100, 1728–1733. [Google Scholar] [CrossRef]
  12. Bakier, S. Crystalline structure characteristics of some polish honeys. Agric. Eng. 2007, 5, 13–21. [Google Scholar]
  13. Rybak-Chmielewska, H.; Szczęsna, T. Storage Conditions and Honey Quality. BASIC Issues of Honey Quality; Press Institute of Horticulture and Floriculture, Apiculture Department: Puławy, Poland, 1996; Volume 24. [Google Scholar]
  14. Kędzia, B.; Hołderna-Kędzia, E. Honey, Composition and Biological Properties; Rzeczpospolita Publishing House SA: Warsaw, Poland, 2008; pp. 187–206. (In Polish) [Google Scholar]
  15. Manikis, I.; Thrasyvoulou, A. The relation of physicochemical characteristics of honey and the crystallization sensitive parameters. Apiacta 2001, 36, 106–112. [Google Scholar]
  16. Costa, L.C.V.; Kaspchak, E.; Queiroz, M.B.; Almeida, M.M.D.; Quast, E.; Quast, L.B. Influence of temperature and homogenization on honey crystallization. Braz. J. Food Res. 2015, 18, 155–161. [Google Scholar] [CrossRef]
  17. Zamora, M.C.; Chirife, J. Determination of water activity change due to crystallization in honeys from Argentina. Food Control 2006, 17, 59–64. [Google Scholar] [CrossRef]
  18. Anand, S.; Pang, E.; Livanos, G.; Mantri, N. Characterization of physico-chemical properties and antioxidant capacities of bioactive honey produced from Australian grown Agastache rugosa and its correlation with colour and poly-phenol content. Molecules 2018, 23, 108. [Google Scholar] [CrossRef]
  19. Ji, P.; Liu, X.; Yang, C.; Wu, F.; Sun, J.; Cao, W.; Zhao, H. Natural crystallization properties of honey and seed crystals-induced crystallization process for honey performance enhancing. Food Chem. 2023, 405, 134972. [Google Scholar] [CrossRef]
  20. Krishnan, R.; Mohammed, T.; Kumar, G.S.; Sh, A. Honey crystallization: Mechanism, evaluation and application. Pharm. Innov. 2021, 10, 222–231. [Google Scholar] [CrossRef]
  21. Martínez, R.A.; Schnezov, N.; Brumovsky, L.A.; Román, A.B.P. Influence of temperature and packaging type on quality parameters and antimicrobial properties during Yateí honey storage. Food Sci. Technol. 2018, 38, 196–202. [Google Scholar] [CrossRef]
  22. Pidek, A.; Brzozowski, P. Crystallization of honey. Beekeeping 2004, 9, 18–19. (In Polish) [Google Scholar]
  23. Pospiech, M.; Javůrkova, Z.; Hrabec, P.; Starha, P.; Ljasovska, S.; Bednar, J.; Tremlova, B. Identification of pollen taxa by different microscopy techniques. PLoS ONE 2021, 16, e0256808. [Google Scholar] [CrossRef] [PubMed]
  24. Regulation of the Polish Minister of Agriculture and Rural Development of January 14 (2009) on Methods of Analysis Related to the Assessment of Honey (Dz.U. Journal of Laws of 2009, No. 17, Item 94). Available online: https://isap.sejm.gov.pl/isap.nsf/download.xsp/WDU20090170094/O/D20090094.pdf (accessed on 10 October 2024). (In Polish)
  25. PalDat—Palynological Database. Available online: www.paldat.org (accessed on 5 October 2024).
  26. Cabrera, M.; Santander, E. Physicochemical and sensory analysis of honeys from eastern Formosa province (Argentina) and its relationship with their botanical origin. Food Chem. Adv. 2022, 1, 100026. [Google Scholar] [CrossRef]
  27. Bhandari, B.; D’Arcy, B.; Kelly, C. Rheology and crystallization kinetics of honey: Present status. Int. J. Food Prop. 1999, 2, 217–226. [Google Scholar] [CrossRef]
  28. Gleiter, R.; Horn, H.; Isengard, H. Influence of type and state of crystallisation on the water activity of honey. Food Chem. 2006, 96, 441–445. [Google Scholar] [CrossRef]
  29. Escuredo, O.; Dobre, I.; Fernandez-Gonzalez, M.; Seijo, M.C. Contribution of botanical origin and sugar composition of honeys on the crystallization phenomenon. Food Chem. 2014, 149, 84–90. [Google Scholar] [CrossRef]
  30. Naik, R.R.; Gandhi, N.S.; Thakur, M.; Nanda, V. Analysis of crystallization phenomenon in Indian honey using molecular dynamics simulations and artificial neural network. Food Chem. 2019, 300, 125182. [Google Scholar] [CrossRef]
  31. Baloš, M.Z.; Popov, N.; Jakšić, S.; Mihaljev, Z.; Pelić, M.; Ratajac, R.; Pelić, D.L. Sunflower Honey—Evaluation of Quality and Stability during Storage. Foods 2023, 12, 2585. [Google Scholar] [CrossRef]
  32. Directive 2014/63/EU of the European Parliament and of the Council of 15 May (2014) Amending Council Directive 2001/110/EC Relating to Honey. Available online: https://eur-lex.europa.eu/legal-content/EN/TXT/PDF/?uri=OJ:L:2014:164:FULL (accessed on 10 October 2024).
  33. Codex Alimentarius Commission. Codex Standard for Honey; FAO: Rome, Italy, 2001. [Google Scholar]
  34. PN-88/A-77626; Bee Honey. Polish Standard, Polish Standardization Committee: Warsaw, Poland, 1988. (In Polish)
  35. AOAC. AOAC Official Methods of Analysis, 17th ed.; Association of Official Analytical Chemists: Arlington, TX, USA, 2000. [Google Scholar]
  36. Bogdanov, S.; Martin, P.; Lullman, C. Harmonised Methods of the European Honey Commission. (FAM, Bee Department, Bern 3003, Switzerland). Apidologie 2009, 159, 1–63. Available online: https://www.ihc-platform.net/ihcmethods2009.pdf (accessed on 10 October 2024).
  37. Regulation of the Polish Minister of Agriculture and Rural Development of May 29 (2015) Amending the Regulation on Specific Requirements for the Commercial Quality of Honey (Dz.U. Journal of Laws of 2015 No. 850). Available online: https://isap.sejm.gov.pl/isap.nsf/download.xsp/WDU20230002513/O/D20232513.pdf (accessed on 10 October 2024). (In Polish)
  38. Cano, C.B.; Felsner, M.L.; Matos, J.R.; Bruns, R.E.; Whatanabe, H.M.; Almeida-Muradian, L.B. Comparison of methods for determining moisture content of citrus and eucalyptus Brazilian honeys by refractometry. J. Food Compos. Anal. 2001, 14, 101–109. [Google Scholar] [CrossRef]
  39. Zarei, M.; Fazlara, A.; Alijani, N. Evaluation of the changes in physicochemical and antioxidant properties of honey during storage. Funct. Food Health Dis. 2019, 9, 593–605. [Google Scholar] [CrossRef]
  40. Karabagias, V.K.; Karabagias, I.K.; Gatzias, I. The impact of different heating temperatures on physicochemical, color attributes, and antioxidant activity parameters of Greek honeys. J. Food Proc. Eng. 2018, 41, e12668. [Google Scholar] [CrossRef]
  41. da Silva, P.M.; Gonzaga, L.V.; Biluca, F.C.; Schulza, M.; Vitali, L.; Micke, G.A.; Costa, A.C.O.; Fetta, R. Stability of Brazilian Apis mellifera L. honey during prolonged storage: Physicochemical parameters and bioactive compounds. LWT 2020, 129, 109521. [Google Scholar] [CrossRef]
  42. Julika, W.N.; Ajit, A.; Naila, A.; Sulaiman, A.Z. The effect of storage condition on physicochemical properties of some stingless bee honey collected in Malaysia local market. Mater. Today Proc. 2022, 57, 1396–1402. [Google Scholar] [CrossRef]
  43. Gomes, S.; Dias, L.G.; Moreira, L.L.; Rodrigues, P.; Estevinho, L. Physicochemical, microbiological and antimicrobial properties of commercial honeys from Portugal. Food Chem. Toxicol. 2010, 48, 544–548. [Google Scholar] [CrossRef] [PubMed]
  44. Piepiórka-Stepuk, J.; Wojtasik-Kalinowska, I.; Sterczyńska, M.; Mierzejewska, S.; Stachnik, M.; Jakubowski, M. The effect of heat treatment on bioactive compounds and color of selected pumpkin cultivars. LWT 2023, 175, 114469. [Google Scholar] [CrossRef]
  45. Gonzales, A.P.; Burin, L.; del Pilar Buera, M. Color changes during storage of honeys in relation to their composition and initial color. Food Res. Intern. 1999, 32, 185–191. [Google Scholar] [CrossRef]
  46. Chaikham, P.; Kemsawasd, V.; Apichartsrangkoon, A. Effects of conventional and ultrasound treatments on physicochemical properties and antioxidant capacity of floral honeys from Northern Thailand. Food Biosci. 2016, 15, 19–26. [Google Scholar] [CrossRef]
  47. Tappi, S.; Glicerina, V.; Ragni, L.; Dettori, A.; Romani, S.; Rocculi, P. Physical and structural properties of honey crystallized by static and dynamic processes. J. Food Eng. 2021, 292, 110316. [Google Scholar] [CrossRef]
  48. Dolik, K.; Kubiak, M.; Seńcio, M. Texture measurement analyzer, TMS-Pro—Principle of operation and application in food product testing. PAK 2010, 6, 636–639. (In Polish) [Google Scholar]
  49. Faustino, C.; Pinheiro, L. Analytical Rheology of Honey: A State-of-the-Art Review. Foods 2021, 10, 1709. [Google Scholar] [CrossRef]
  50. Chen, Y.W.; Lin, C.H.; Wu, F.Y.; Chen, H.H. Rheological properties of crystallized honey prepared by a new type of nuclei. J. Food Process Eng. 2009, 32, 512–527. [Google Scholar] [CrossRef]
  51. Piana, M.L.; Cianciabella, M.; Daniele, G.M.; Badiani, A.; Rocculi, P.; Tappi, S.; Gatti, E.; Marcazzan, G.L.; Magli, M.; Medoro, C.; et al. Influence of the physical state of two monofloral honeys on sensory properties and consumer satisfaction. Foods 2023, 12, 986. [Google Scholar] [CrossRef] [PubMed]
  52. Ucurum, O.; Tosunoglu, H.; Takma, C.; Birlik, P.M.; Berber, M.; Kolayli, S. Distinctive properties of the pine, oak, chestnut and multifloral blossom and honeydew honeys. Eur. Food Res. Technol. 2024, 250, 1765–1774. [Google Scholar] [CrossRef]
  53. Fuentes, M.O.; Alizadeh, K.; Bucarey, S.A.; Castaneza, Z.E.; Vásquez-Quitral, P. Analysis of organic molecules, physicochemical parameters, and pollen as indicators for authenticity, botanical origin, type and quality of honey samples examined. Int. J. Food Prop. 2020, 23, 2242–2256. [Google Scholar] [CrossRef]
  54. Tao, Z.; Raffel, R.A.; Souid, A.K.; Goodisman, J. Kinetic studies on enzyme catalyzed reactions: Oxidation of glucose, decomposition of hydrogen peroxide and their combination. Biophys. J. 2009, 96, 2977–2988. [Google Scholar] [CrossRef]
  55. Belay, A.; Haki, G.D.; Birringer, M.; Borck, H.; Addi, A.; Baye, K.; Melaku, S. Rheology and botanical origin of Ethiopian monofloral honey. LWT 2017, 75, 393–401. [Google Scholar] [CrossRef]
  56. Belay, A.; Haki, G.D.; Birringer, M.; Borck, H.; Lee, Y.C.; Kim, K.T.; Baye, K.; Melaku, S. Enzyme activity, amino acid profiles and hydroxymethylfurfural content in Ethiopian monofloral honey. J. Food Sci. Technol. 2017, 54, 2769–2778. [Google Scholar] [CrossRef]
  57. Chirife, J.; Zamora, M.C.; Motto, A. The correlation between water activity and % moisture in honey: Fundamental aspects and application to Argentine honeys. J. Food Eng. 2006, 72, 287–292. [Google Scholar] [CrossRef]
  58. Singh, I.; Singh, S. Honey moisture reduction and its quality. J. Food Sci. Technol. 2018, 55, 3861–3871. [Google Scholar] [CrossRef]
  59. Miłek, J. Studying and Modeling of Deactivation of Catalase. Ph.D. Thesis, West Pomeranian University of Technology, Szczecin, Poland, 2011. (In Polish). [Google Scholar]
  60. Zarei, M.; Fazlara, A.; Tulabifard, N. Effect of thermal treatment on physicochemical and antioxidant properties of honey. Heliyon 2019, 5, e01894. [Google Scholar] [CrossRef]
  61. Iglesias, M.T.; Martín-Álvarez, P.J.; Polo, M.C.; de Lorenzo, C.; González, M.; Pueyo, E. Changes in the Free Amino Acid Contents of Honeys During Storage at Ambient Temperature. J. Agric. Food Chem. 2006, 54, 9099–9104. [Google Scholar] [CrossRef] [PubMed]
  62. Chakir, A.; Romane, A.; Marcazzan, G.L.; Ferrazzi, P. Physicochemical properties of some honeys produced from different plants in Morocco. Arab. J. Chem. 2016, 9, S946–S954. [Google Scholar] [CrossRef]
  63. Karabagias, I.K.; Badeka, A.; Kontakos, S.; Karabournioti, S.; Kontominas, M.G. Characterisation and classification of greek pine honeys according to their geographical origin based on volatiles. Physicochemical Parameters and Chemometrics. Food Chem. 2014, 146, 548–557. [Google Scholar] [CrossRef] [PubMed]
  64. Jasińska, B.; Tomaka, K.; Uram-Dudek, A.; Paradowska, K. Physicochemical analysis of honeys from the Podkarpacie region. Post. Fitoter. 2020, 21, 219–227. [Google Scholar] [CrossRef]
  65. Kücük, M.; Kolail, S.; Karaoglu, S.; Ulusoy, E.; Baltac, C.; Candan, F. Biological activities and chemical composition of three honeys of different types from Anatolia. Food Chem. 2007, 100, 526–534. [Google Scholar] [CrossRef]
  66. da Silva Cruz, L.F.; Lemos, P.V.F.; de Souza Santos, T.; Tavares, P.P.L.G.; Nascimento, R.Q.; Almeida, L.M.R.; de Souza, C.O.; Druzian, J.I. Storage conditions significantly influence the stability of stingless bee (Melipona scutellaris) honey. J. Apic. Res. 2023, 62, 530–541. [Google Scholar] [CrossRef]
  67. Majewska, E.; Drużyńska, B.; Derewiaka, D.; Ciecierska, M.; Wołosiak, R. Physicochemical parameters of quality of floral honey. Bromatol. Toxicol. Chem. 2015, 3, 440–444. (In Polish) [Google Scholar]
  68. Majewska, E.; Drużyńska, B.; Wołosiak, R. Determination of the botanical origin of honeybee honeys based on the analysis of their selected physicochemical parameters coupled with chemometric assays. Food Sci. Biotechnol. 2019, 28, 1307–1314. [Google Scholar] [CrossRef]
  69. da Silva, P.M.; Gauche, C.; Gonzaga, L.V.; Costa, A.C.O.; Fett, R. Honey: Chemical composition, stability and authenticity. Food Chem. 2016, 196, 309–323. [Google Scholar] [CrossRef]
  70. Aljuhaimi, F.; Özcan, M.M.; Ghafoor, K.; Babiker, E.E. Determination of physicochemical properties of multifloral honeys stored in different containers. J. Food Process. Preserv. 2018, 42, e13379. [Google Scholar] [CrossRef]
  71. Vijayakumar, K.T.; Bhat, N.S.; Neethu, T.; Nayimabanu, T.; Kumar, H.L.N. Periodical changes in quality parameters of honey during storage and processing. Int. J. Chem. Stud. 2021, 9, 19–24. [Google Scholar] [CrossRef]
  72. Khan, K.A.; Ghramh, H.A.; Babiker, M.; Ahmad, Z.; El-Niweiri, M.A.A.; Ibrahim, E.H.; Brima, E.I.; Mohammed, M.E.A. Tolerance of Ziziphus and Acacia honeys to one-year storage conditions and altitude. J. King Saud Univ. Sci. 2021, 33, 101577. [Google Scholar] [CrossRef]
  73. Cabrera, M.; Perez, M.; Gallez, L.; Andrada, A.; Balbarrey, G. Colour, antioxidante capacity, phenolic and flavonoid content of honey from the Hu- mid Chaco Region Argentina. Revista Internacional de Botánica Experimental. Phyton-Int. J. Exp. Bot. 2017, 86, 4–11. Available online: http://www.revistaphyton.fund-romuloraggio (accessed on 10 October 2024).
  74. Piotraszewska-Pająk, A.; Gliszczyńska-Świgło, A. Directions of colour changes of nectar honeys depending on honey type and storage conditions. J. Apic. Sci. 2015, 59, 51–61. [Google Scholar] [CrossRef]
  75. Quintero-Lira, A.; Ángeles-Santos, A.; Aguirre-Álvarez, G.; Reyes-Munguía, A.; Almaraz-Buendía, I.; Campos-Montiel, R.G. Effects of liquefying crystallized honey by ultrasound on crystal size, 5-hydroxymethylfurfural, colour, phenolic compounds and antioxidant activity. Eur. Food Res. Technol. 2017, 243, 619–626. [Google Scholar] [CrossRef]
  76. Popek, S.; Figiel, K. Determining the colour of varietal honeys using the L* a* b* system. Crac. Rev. Econ. Manag. 2007, 743, 179–187. Available online: https://r.uek.krakow.pl/jspui/bitstream/123456789/356/1/137138903.pdf (accessed on 10 October 2024). (In Polish).
  77. Turkut, G.M.; Degirmenci, A.; Yildiz, O.; Can, Z.; Cavrar, S.; Karahalil, F.Y.; Kolayli, S. Investigating 5-hydroxymethylfurfural formation kinetic and antioxidant activity in heat treated honey from different floral sources. J. Food Meas. Charact. 2018, 12, 2358–2365. [Google Scholar] [CrossRef]
  78. Wilczyńska, A. The effect of processing on honey quality—Changes of colour parameters and HMF content under heating and storage. Sci. J. Poznań Univ. Econ. 2011, 196, 91–98. Available online: https://bazekon.uek.krakow.pl/zeszyty/171207637 (accessed on 10 October 2024).
  79. Berk, B.; Grunin, L.; Oztop, M.H. Anon-conventional TD-NMRapproach to monitor honey crystallization melting. J. Food Eng. 2021, 292, 110292. [Google Scholar] [CrossRef]
  80. Suriwong, V.; Jaturonglumlert, S.; Varith, J.; Narkprasom, K.; Nitatwichit, C. Crystallisation behaviour of sunflower longan honey with glucose addition by absorbance measurement. Int. Food Res. J. 2020, 27, 727–734. [Google Scholar]
  81. Juszczak, L.; Fortuna, T. Rheology of selected polish honeys. J. Food Eng. 2006, 75, 43–49. [Google Scholar] [CrossRef]
  82. Yanniotis, S.; Skaltsi, S.; Karaburnioti, S. Effect of moisture content on the viscosity of honey at different temperatures. J. Food Eng. 2006, 72, 372–377. [Google Scholar] [CrossRef]
  83. Kędzierska-Matysek, M.; Florek, M.; Wolanciuk, A.; Skałecki, P.; Litwińczuk, A. Characterisation of viscosity colour 5-hydroxymethylfurfural content diastase activity in raw rape honey (Brassica napus) at different temperatures. J. Food Sci. Technol. 2016, 53, 2092–2098. Available online: https://pubmed.ncbi.nlm.nih.gov/27413239/ (accessed on 10 October 2024). [CrossRef] [PubMed]
  84. Kędzierska-Matysek, M.; Florek, M.; Wolanciuk, A.; Skałecki, P. Effect of freezing and room temperatures storage for 18 months on quality of raw rapeseed honey (Brassica napus). J. Sci. Technol. 2016, 53, 3349–3355. [Google Scholar] [CrossRef]
  85. Kędzierska-Matysek, M.; Wolanciuk, A.; Florek, M.; Skałecki, P.; Litwińczuk, A. Hydroxymethylfurfural content, diastase activity and colour of multifloral honeys in relation to origin and storage time. J. Cent. Eur. Agric. 2017, 18, 657–668. [Google Scholar] [CrossRef]
  86. Popek, S. Identyfication of honey types. Nahrung/Food 2003, 47, 39–40. [Google Scholar] [CrossRef]
  87. Popek, S.; Halagarda, M.; Kursa, K. A new model to identify botanical origin of Polish honeys based on the physicochemical parametres and chemometric analysis. LWT 2017, 77, 482–487. [Google Scholar] [CrossRef]
  88. Rivera-Mondragón, A.; Marrone, M.; Bruner-Montero, G.; Gaitán, K.; de Núñez, L.; Otero-Palacio, R.; Fernández-Marín, H. Assessment of the quality, chemometric and pollen diversity of Apis mellifera honey from different seasonal harvests. Foods 2023, 12, 3656. [Google Scholar] [CrossRef]
  89. Fagúndez, G.A.; Blettler, D.C.; Gallo, M.A. Pollen assemblage variability of Apis mellifera honeys (Diamante, Entre Ríos, Argentina). Grana 2022, 61, 366–380. [Google Scholar] [CrossRef]
  90. Yoo, B. Effect of temperature on dynamic rheology of Korean honeys. J. Food Eng. 2004, 65, 459–463. [Google Scholar] [CrossRef]
  91. Kumar, J.S.; Mandal, M. Rheology and thermal properties of marketed Indian honey. Nutr. Food Sci. 2009, 39, 111–117. [Google Scholar] [CrossRef]
  92. Witczak, M.; Juszczak, L.; Gałkowska, D. Non-Newtonian behaviour of heather honey. J. Food Eng. 2011, 104, 532–537. [Google Scholar] [CrossRef]
  93. Tikhonov, A.I.; Bondarenko, L.A.; Jarnych, T.G.; Szpyczak, O.S.; Kowal, W.M.; Skrypnik–Tichonow, R.I. Natural Honey in Medicine and Pharmacy (Origin, Properties, Application, Medicinal Preparations); Sądecki Bartnik Beekeeping Farm: Stróże, Poland, 2017. (In Polish) [Google Scholar]
  94. Ciursa, P.; Oroian, M. Voltammetric e-tongue for honey adulteration detection. Sensors 2021, 21, 5059. [Google Scholar] [CrossRef] [PubMed]
  95. Fredriksson, H.; Åkerlind, U. Chapter 6. Crystal Growth in Liquids and Melts. In Solidification and Crystallization Processing in Metals and Alloys; Wiley Online Library: Tokyo, Japan, 2012. [Google Scholar] [CrossRef]
  96. Hutter, J.L.; Bechhoefer, J. Banded spherulitic growth in a liquid crystal. J. Cryst. Growth. 2000, 217, 332–343. [Google Scholar] [CrossRef]
  97. Souda, R. Dewetting of thin amorphous solid water films and Liquid-Cubic ice coexistence in droplets studied using Infrared-Absorption and Secondary-Ion-Mass spectroscopy. J. Phys. Chem. 2008, 112, 11976–11980. [Google Scholar] [CrossRef]
  98. Misyura, S. The Anomalously High Rate of Crystallization, Controlled by Crystal Forms under the Conditions of a Limited Liquid Volume. Cryst. Growth Des. 2018, 18, 1327–1338. [Google Scholar] [CrossRef]
  99. Schmelzer, J.W.P.; Tropin, T.V. Theory of crystal nucleation of glass-forming liquids: Some new developments. Int. J. Appl. Glass Sci. 2021, 13, 171–198. [Google Scholar] [CrossRef]
  100. Inoue, M.; Yoshino, K.; Moritake, H.; Toda, K. Influence of Liquid-Crystal directors in an electric field on elastic wave propagating in Liquid-Crystal cell. Jpn. J. Appl. Phys. 2001, 40, 5798. [Google Scholar] [CrossRef]
Figure 1. Microscopic images of leading pollen dominant in the tested honeys.
Agriculture 15 01476 g001
Figure 2. Changes in the color attributes of different botanical origin honeys stored at a temperature of 8 ± 1 °C: (a) browning index (BI); (b) color difference (ΔE), where tx is a time of storage: t0: zero days of storage; t24: 24 weeks of storage. a–f Different superscript letters denote significant differences (HSD Tukey’s test, p < 0.05).
Agriculture 15 01476 g002
Figure 3. Changes in honey crystals during chilled storage (40×), where tx is a time of storage: t0: zero days of storage; t1: 1 week of storage; t2: 2 weeks of storage; t3: 3 weeks of storage; t6: 6 weeks of storage; t12: 12 weeks of storage; t24: 24 weeks of storage.
Agriculture 15 01476 g003
Figure 4. Changes in: (a) hardness (H) and (b) cohesiveness (C) of honeys by week of storage at 8 ± 1 °C and 73 ± 2% humidity, where Fmax = force corresponding to hardness of honey (H); Fmin = force corresponding to cohesiveness of honey (C). a–d Different superscript letters denote significant differences (HSD Tukey’s test, p < 0.05).
Agriculture 15 01476 g004
Figure 5. Average viscosity value (η) of rapeseed honey; multiflower honey; and buckwheat honey in individual weeks of their storage at 8 ± 1 °C and 73 ± 2% humidity measured for shear of 300 Pa where tx is a time of storage: t0: zero days of storage; t1: 1 week of storage; t2: 2 weeks of storage; t3: 3 weeks of storage; t6: 6 weeks of storage; t12: 12 weeks of storage; t24: 24 weeks of storage. a–f Different superscript letters denote significant differences (HSD Tukey’s test, p < 0.05).
Agriculture 15 01476 g005
Figure 6. Changes in the phase angle values (δ) of the tested honeys in individual weeks of storage at 8 ± 1 °C and 73 ± 2% humidity conditions: (a,d) rape; (b,e) multifloral; (c,f) buckwheat.
Agriculture 15 01476 g006
Table 1. Sugar profile of analyzed honeys with calculated predictors of crystallization.
Sugar ProfileUnitRape Honey 1Buckwheat Honey 2Multifloral Honey 3
Fructose (F)g/100 g34.30 ± 6.9034.70 ± 6.9036.40 ± 7.30
Galactose (Ga)g/100 g<0.10 (0.10 ± 0.02)<0.10 (0.10 ± 0.02)<0.10 (0.10 ± 0.02)
Glucose (G)g/100 g37.50 ± 7.5034.30 ± 6.9035.50 ± 7.10
Maltose (M)g/100 g0.23 ± 0.050.53 ± 0.110.58 ± 0.12
Saccharose (S)g/100 g<0.10 (0.10 ± 0.02)<0.10 (0.10 ± 0.02)<0.10 (0.10 ± 0.02)
Sugars sumg/100 g72.23 ± 14.4969.73 ± 13.9572.68 ± 14.56
Water (W)%17.1 ± 0.0018.00 ± 0.1017.50 ± 0.10
F/G-0.921.011.02
G/W-2.191,912.03
(G − W)/F-0.590.470.49
Table 2. Physicochemical parameters of Apis mellifera honey samples of Wielkopolska, Poland, during refrigeration storage at 8 ± 1 °C.
Storage Time
Type of Honeyt0t1t2t3t6t12t24Error
Moisture (g/100 g w/w)Rape 17.10 ± 0.00 a17.23 ± 0.12 ab17.33 ± 0.15 ab17.33 ± 0.06 ab17.43 ± 0.12 b17.90 ± 0.20 c18.07 ± 0.06 c0.013
Multifloral 17.53 ± 0.06 a17.57 ± 0.12 a17.60 ± 0.10 a17.67 ± 0.06 a17.73 ± 0.06 ab17.67 ± 0.15 a17.93 ± 0.06 b0.009
Buckwheat ND18.00 ± 0.10 a18.20 ± 0.10 a18.23 ± 0.06 a18.27 ± 0.06 a18.33 ± 0.21 a18.23 ± 0.23 a18.33 ± 0.06 a0.018
Extract
(%)
Rape 81.40 ± 0.00 c81.27 ± 0.12 bc81.13 ± 0.12 bc81.17 ± 0.06 bc81.07 ± 0.12 b80.60 ± 0.20 a80.43 ± 0.06 a0.013
Multifloral 80.97 ± 0.06 b80.93 ± 0.12 b80.90 ± 0.10 b80.83 ± 0.06 b80.77 ± 0.06 ab80.83 ± 0.15 b80.57 ± 0.06 a0.009
Buckwheat ND80.50 ± 0.10 a80.30 ± 0.10 a80.27 ± 0.06 a80.23 ± 0.06 a80.17 ± 0.21 a80.27 ± 0.23 a80.17 ± 0.06 a0.018
Acidity free
(meq/kg)
Rape 10.67 ± 0.58 a10.90 ± 0.92 a12.27 ± 1.19 ab15.97 ± 1.23 c14.43 ± 1.50 bc11.13 ± 0.21 a11.90 ± 0.26 a0.769
Multifloral 21.27 ± 0.86 a26.37 ± 0.57 c24.33 ± 1.27 bc21.70 ± 0.95 ab20.23 ± 0.40 a21.53 ± 1.71 ab22.50 ± 1.08 ab1.119
Buckwheat ND40.70 ± 0.26 a40.53 ± 0.35 a42.33 ± 1.57 a42.23 ± 0.51 a41.73 ± 0.35 a40.70 ± 0.50 a41.00 ± 0.26 a0.480
pH (-)Rape 3.71 ± 0.14 ab3.93 ± 0.13 c3.95 ± 0.09 bc3.84 ± 0.07 abc3.77 ± 0.08 ab3.79 ± 0.04 ab3.58 ± 0.10 a0.010
Multifloral 3.58 ± 0.08 b3.69 ± 0.07 bc3.87 ± 0.14 cd3.91 ± 0.09 cd3.99 ± 0.02 d3.32 ± 0.04 a3.21 ± 0.07 a0.006
Buckwheat ND3.83 ± 0.02 a3.75 ± 0.05 a3.72 ± 0.02 a3.78 ± 0.06 a3.85 ± 0.04 a3.72 ± 0.06 a3.71 ± 0.10 a0.003
Conductivity (mS/cm)Rape 0.196 ± 0.000 a0.193 ± 0.001 a0.193 ± 0.002 a0.193 ± 0.002 a0.196 ± 0.002 a0.197 ± 0.002 a0.203 ± 0.001 b0.000
Multifloral 0.338 ± 0.005 a0.340 ± 0.001 ab0.341 ± 0.003 abc0.344 ± 0.002 abc0.347 ± 0.003 bc0.348 ± 0.002 c0.360 ± 0.001 d0.000
Buckwheat 0.465 ± 0.001 ab0.470 ± 0.002 bc0.471 ± 0.002 c0.466 ± 0.002 a0.464 ± 0.003 a0.479 ± 0.002 d0.483 ± 0.001 d0.000
t0: zero days of storage. t1: 1 week of storage. t2: 2 weeks of storage. t3: 3 weeks of storage. t6: 6 weeks of storage. t12: 12 weeks of storage. t24: 24 weeks of storage. Data are presented as mean ± S.D. (n = 3). ND: Not detected—this means that the differences between the group means are not statistically significant. a–d Different superscript letters in the same row denote significant differences (HSD Tukey’s test, p < 0.05). Arrows indicate the maximum/minimum average values of the tested parameters obtained during the honey tests in the subsequent weeks of their storage.
Table 3. Changes in the color parameters of different botanical origin honeys as a result of their chilled storage at 8 ± 1 °C, as defined in the CIE L*a*b* and C*H* color space.
Color Components in Chromatic Space CIE L*a*b* and Cylindrical Space Delta C*H*
Weeks of Storage at 8 ± 1 °C
t0t1t2t3t6t12t24
Type of honeyRapeCIE L*18.92 ± 0.58 a17.29 ± 0.7 a33.59 ± 4.34 b35.37 ± 2.27 b45.12 ± 5.20 c47.82 ± 1.03 c61.78 ± 1.21 d
CIE a*4.30 ± 0.46 c−0.26 ± 0.12 b−0.41 ± 0.36 b−0.48 ± 0.18 b−0.52 ± 0.16 b−0.59 ± 0.05 b−1.32 ± 0.20 a
CIE b*23.73 ± 2.93 d8.16 ± 2.57 bc5.37 ± 0.78 a5.85 ± 0.81 ab7.19 ± 3.27 ab7.49 ± 0.41 ab10.17 ± 1.47 c
Chroma C*24.12 ± 0.98 d8.17 ± 2.57 bc5.40 ± 0.37 a5.88 ± 0.47 ab7.21 ± 0.77 ab7.51 ± 0.17 ab10.26 ± 0.94 c
Hue H * [°]79.71 ± 1.13 a271.91 ± 0.95 b274.33 ± 3.81 bc274.67 ± 1.39 bc274.09 ± 1.13 bc274.52 ± 0.33 bc277.52 ± 1.77 c
MultifloralCIE L*10.38 ± 0.59 a9.21 ± 0.51 a9.77 ± 0.79 a22.46 ± 1.80 b21.72 ± 2.53 b47.53 ± 1.42 c55.70 ± 1.25 d
CIE a*2.40 ± 0.41 cd2.54 ± 0.28 d1.84 ± 0.23 c−0.38 ± 0.27 b−0.45 ± 0.29 b−0.60 ± 0.21 b−1.27 ± 0.30 a
CIE b*11.74 ± 0.64 a10.19 ± 0.80 a10.31 ± 0.48 a10.45 ± 1.37 a10.39 ± 1.18 a15.67 ± 1.22 b15.82 ± 2.16 b
Chroma C*11.98 ± 0.62 a10.50 ± 0.83 a10.48 ± 0.47 a10.45 ± 1.37 a10.40 ± 1.18 a15.69 ± 1.22 b15.89 ± 2.15 b
Hue H* [°]78.43 ± 2.09 ab76.03 ± 0.88 a79.87 ± 1.40 b272.03 ± 1.17 c272.44 ± 1.56 c274.70 ± 0.85 c272.20 ± 1.50 c
BuckwheatCIE L*4.02 ± 0.29 a8.01 ± 0.79 b11.92 ± 1.41 c10.79 ± 0.90 bc35.01 ± 1.43 d39.09 ± 0.64 e53.28 ± 3.94 f
CIE a*3.96 ± 1.10 bc1.59 ± 0.28 a1.55 ± 0.33 a4.35 ± 1.31 bc4.77 ± 0.14 c3.17 ± 0.52 b5.24 ± 0.59 c
CIE b*5.35 ± 0.58 a9.47 ± 0.66 b13.85 ± 0.35 c12.17 ± 1.14 c24.26 ± 1.36 d24.63 ± 1.64 d22.69 ± 1.14 d
Chroma C*6.72 ± 0.66 a9.61 ± 0.62 b13.94 ± 0.33 c12.99 ± 0.85 c24.73 ± 1.31 d24.84 ± 1.58 d23.28 ± 1.17 d
Hue H* [°]53.87 ± 8.83 a80.40 ± 2.18 c83.62 ± 1.44 c70.19 ± 6.83 b78.84 ± 0.87 bc82.59 ± 1.51 c77.00 ± 1.29 bc
t0: zero days of storage. t1: 1 week of storage. t2: 2 weeks of storage. t3: 3 weeks of storage. t6: 6 weeks of storage. t12: 12 weeks of storage. t24: 24 weeks of storage. Data are presented as mean ± S.D. (n = 5). a–f Different superscript letters in the same row denote significant differences (HSD Tukey’s test, p < 0.05).
Disclaimer/Publisher’s Note: The statements, opinions and data contained in all publications are solely those of the individual author(s) and contributor(s) and not of MDPI and/or the editor(s). MDPI and/or the editor(s) disclaim responsibility for any injury to people or property resulting from any ideas, methods, instructions or products referred to in the content.

