Article

Rainfall-Driven Nitrogen Dynamics in Catchment Ponds: Comparing Forest, Paddy Field, and Orchard Systems

1
Engineering Research Center of Ecology and Agricultural Use of Wetland, Ministry of Education, College of Agriculture, Yangtze University, Jingzhou 434025, China
2
College of Resources and Environment, Huazhong Agricultural University, Wuhan 430070, China
3
School of Ecology, Sun Yat-Sen University, Shenzhen 518107, China
*
Authors to whom correspondence should be addressed.
Agriculture 2025, 15(14), 1459; https://doi.org/10.3390/agriculture15141459
Submission received: 15 May 2025 / Revised: 24 June 2025 / Accepted: 27 June 2025 / Published: 8 July 2025
(This article belongs to the Special Issue Soil-Improving Cropping Systems for Sustainable Crop Production)

Abstract

The event scale method, employed for assessing changes in nitrogen (N) dynamics pre- and post-rain, provides insights into its transport to surface water systems. However, the relationships between N discharge in catchments dominated by different land uses and water quality remain unclear. This study quantified variations in key N components in ponds across forest, paddy field, and orchard catchments before and after six rainfall events. The results showed that nitrate (NO3-N) was the main N component in the ponds. Post-rainfall, N concentrations increased, with ammonium (NH4+-N) and particulate nitrogen (PN) exhibiting significant elevations in agricultural ponds. Orchard catchments contributed the highest N load to the ponds, while forest catchments contributed the lowest. Following a heavy rainstorm event, total nitrogen (TN) loads in the ponds within forest, paddy field, and orchard catchments reached 6.68, 20.93, and 34.62 kg/ha, respectively. These loads were approximately three times higher than those observed after heavy rain events. The partial least squares structural equation model (PLS-SEM) identified that rainfall amount and changes in water volume were the dominant factors influencing N dynamics. Furthermore, the greater slopes of forest and orchard catchments promoted more N loss to the ponds post-rain. In paddy field catchments, larger catchment areas were associated with decreased N flux into the ponds, while larger pond surface areas minimized the variability in N concentration after rainfall events. In orchard catchment ponds, pond area was positively correlated with N concentrations and loads. This study elucidates the effects of rainfall characteristics and catchment heterogeneity on N dynamics in surface waters, offering valuable insights for developing pollution management strategies to mitigate rainfall-induced alterations.

1. Introduction

Increasing anthropogenic nitrogen (N) inputs in recent decades have caused significant harm to surface water environments, particularly in agricultural catchments [1,2]. Many of these water pollution events are driven by rainfall, which mobilizes land-based N sources into freshwater systems. As rainwater infiltrates the soil, it either percolates into groundwater or forms surface runoff when the soil becomes saturated. Both pathways contribute to nutrient loss from the soil and alter N concentrations in surface waters. In many regions, surface water bodies such as lakes, reservoirs, and ponds experience visibly higher eutrophication levels during periods of intense rainfall compared to drier periods [3,4,5]. Reports indicate that record-breaking rainfall and flood events are becoming more frequent globally, exacerbating eutrophication and associated water quality issues [6]. Understanding how surface water N pollution responds to rainfall events is crucial for assessing the potential impacts of future extreme climate events. Such insights can guide the development of pollution mitigation strategies and improve N use efficiency.
The effects of rainfall are closely tied to changes in nutrient concentrations before and after rainfall events. At the event scale, river NH4+-N concentrations increased by 183.70% following heavy rain (29.2 mm) in Beiyun Watershed, China [7]. Rainstorm events (50–200 mm) were found to attenuate surface water TN concentrations in the Assiniboine River Watershed, Canada [8]. Such events of varying intensities provide insights into the role of rainfall patterns in driving N variability. Nutrient load reflects how rainfall transports pollutants to water bodies and serves as a broader measure of its impacts. Notably, several rainstorm events in a single year can account for nearly half of the annual N loss from catchment land [9,10]. Excessive N loads delivered to surface waters over short periods may exceed their carrying capacity, posing significant risks to aquatic ecosystem health.
Catchment characteristics, including land use type, area, and terrain (e.g., slope), play a critical role in nutrient migration. Surface water N pollution levels are typically higher in agricultural catchments compared to those with extensive forest cover following rainfall events [11]. Among agricultural lands, such as orchards, wheat fields, and paddy fields, significant differences in N discharge arise from variations in land use intensity and management practices [12,13]. Catchment area and slope substantially influence nutrient loss by regulating runoff and nutrient flow into receiving waters during rainfall events. Additionally, rainfall-driven morphological changes in aquatic systems further affect their nutrient dynamics. Small and shallow water bodies are particularly vulnerable because they have limited capacity to accommodate multi-path runoff and pollutants [14,15]. In such systems, water quality is strongly influenced by interactions between rainfall events and catchment characteristics.
Ponds are miniature aquatic systems that receive runoff from the catchment, and they have excellent effects on flood control and agricultural irrigation [16]. While some studies have explored the retention effects of urban detention ponds on N loads during rainfall events [17,18], limited attention has been given to the influence of catchment characteristics, especially for ponds in agricultural catchments. Tens of thousands of ponds are scattered throughout the subtropical regions of China, where their water quality is heavily influenced by agricultural activities and rainfall patterns [5,19]. This study focused on ponds located in agricultural catchments dominated by paddy fields and orchards, using forested catchments as a control, to investigate dynamics in N concentrations and loads following rainfall events. The specific objectives included (1) stating the changes in pond water depth pre- and post-rain, (2) analyzing the variations in N concentrations and N loads in ponds across different rainfall intensities, and (3) establishing pathways linking rainfall amounts and catchment characteristics to N changes. This study links hydrological responses to catchment characteristics, attempting to provide actionable insights for reducing N pollution while promoting sustainable agricultural development in China’s pond-dense subtropical regions.

2. Materials and Methods

2.1. Study Area

This experimental work was carried out in the Juhe Watershed (111°43′–111°55′ E, 30°38′–30°51′ N) of Eastern Yichang, Hubei Province, Central China (Figure 1). The watershed spans an area of 145 km2, with an east–west width of 17.24 km and a north–south length of 21.42 km. The elevation gradually decreases from 211 m in the west to 19 m in the east. The soil type is yellow-brown soil, characterized by a high clay particle content. In 2021, agricultural land covered 56% of the total area, predominantly cultivating crops included citrus, paddy, corn, etc. Forests covered an area of 17% and were mainly distributed in the northwestern part of the watershed. Ponds were the primary surface water source, comprising 77% of the total surface water area. The annual average water depth varied from 0.5 to 2 m. The northern subtropical monsoon humid climate brings approximately 70% precipitation from April to August [20]. N flux into ponds in agricultural catchments increases sharply during storms, yet the resulting patterns of water pollution remain poorly understood.

2.2. Background of the Monitoring Ponds

This study monitored 20 ponds across three catchment types from April to August 2021: 5 in forest-dominated, 7 in paddy field-dominated, and 8 in orchard-dominated catchments. Major land use types covered more than 65% of the catchment area surrounding each monitored pond. These catchments were equipped with specialized facilities for proper management of both animal and human waste. All monitored ponds were intentionally situated away from large-scale aquaculture operations and are protected from direct domestic sewage discharge, ensuring a focused analysis of non-point source pollution impacts. Using ArcGIS 10.2 hydrological analysis tools, catchment boundaries for each pond were delineated based on a 12.5 m resolution digital elevation model (DEM) (https://search.asf.alaska.edu/#/, accessed on 26 June 2025) of the Juhe Watershed (Figure 1). Regional statistical tools were employed to calculate the average slope of each catchment from the slope grid image. Pond areas (0.16–2.21 ha) were derived from GF-2 satellite remote sensing images (1 m resolution) provided by the local Natural Resources and Planning Bureau. The imagery was captured in June 2021, the same year that the experiment was conducted. Initial water depths of the ponds, measured during the first sampling event, ranged from 0.66 to 1.85 m. Detailed information on the monitored ponds is presented in Table 1.

2.3. Rainfall Events, Sampling, and Analysis

Light rainfall is typically absorbed and retained by the soil, making runoff generation unlikely [21]. This study conducted sampling activities following the moderate or higher rainfall intensity events to ensure runoff export. Six rainfall events were monitored from April to August (Figure 2), classified into two moderate rains (Event II (24.50 mm) and V (20.10 mm)), two heavy rains (Event I (39.50 mm) and VI (43.30 mm)), one rainstorm (Event III (61.70 mm)), and one heavy rainstorm (Event IV (120.80 mm)) according to national rainfall intensity standards (GB/T 28592-2012) [22]. Given the maximum straight-line distance of 18 km between the farthest monitoring ponds, the spatial variation in rainfall was considered negligible in this study.
Some studies suggest that short-term sustained rainfall can lead to overlapping effects, which may obscure the pollution export caused by the current rainfall event [23]. Therefore, pre-rain sampling required at least three days without significant rainfall (>5 mm/d), while post-rain sampling was completed within 24 h. The water samples were collected approximately 2 m from the shore in different directions using an organic glass sampler (JCG-1, Qingdao, China). The sampling depth was approximately 20 cm below the water surface. The average measured concentrations were used as the N concentrations for each pond. TN, NO3-N, NH4+-N, and PN concentrations were measured following the Chinese water and wastewater monitoring and analysis methods [24]. Additionally, pond depth was measured during each sampling to observe changes in water volume.

2.4. Data Processing

Water volume change was calculated by multiplying the water depth change pre- and post-rain by pond area. The magnitude of the variability was calculated using Equation (1), and changes in pond N loads post-rain were calculated using Equation (2). N concentrations and loads in ponds from three catchment types were compared during different rainfall intensity events and tested for significance using one-way analysis of variance (ANOVA).
Q = A after A before A before   ×   100 %
L = A after H after A before H before   ×   10
where Q indicates change amplitude (%) and A before and A after represent the N concentrations in ponds pre- and post-rain, respectively (mg/L). Q is a positive or negative value, indicating an increase or decrease in N concentrations post-rain, respectively. L denotes N loads (kg/ha), and H before and H after are the water depths of the ponds pre- and post-rain, respectively (m).
This study applied the partial least squares structural equation model (PLS-SEM) to identify the relationships between rainfall amount, pond water volume change, catchment characteristics, and variations in N concentrations and loads in ponds. Catchment characteristics included catchment area, average slope, and pond area. The PLS-SEM results show the direct or indirect relationships between the dependent variables and predictors, as well as the total effect of the factors. In the model, Q2 > 0 reflects good cross-validation prediction and R2 represents the goodness of fit [5,25].

3. Results

3.1. Pond Water Depth Changes

Large spatial differences were observed in water depth among different ponds during the monitoring period (Figure 3). After Event I, pond F2 was the only one to experience a decrease in post-rain water depth, with a reduction of 0.04 m compared to pre-rain levels. Depth values of ponds in the paddy field and orchard catchments increased post-rain, with ponds P1 and O6 showing the greatest increases of 0.35 and 0.28 m, respectively. After Event II, water depth decreased in ponds across all catchment types, including one forest, three paddy field, and three orchard catchments. The largest increase, observed in pond O6, was just 0.10 m after this event. Compared with Event I, the same ponds showed lower water depth changes after the occurrence of Event II.
After Event III, water depths increased in all ponds, with the highest increases in forest, paddy field, and orchard catchments reaching 0.35 (F1), 0.15 (P3), and 0.32 m (O2), respectively. In contrast, pond P5 exhibited the smallest increase, with a rise of only 0.02 m. After Event IV, pond water depths increased by 0.05–0.54 m, with F1 and P7 representing the lower and upper bounds of this interval. The average water depth increases for ponds in forest, paddy field, and orchard catchments after this event were 0.25, 0.17, and 0.20 m, respectively.
Following Event V, four ponds (F2, F3, O1, and O8) exhibited a decrease in post-rain water depth, while pond O6 showed the greatest increase, rising by 0.16 m. In paddy field catchments, post-rain water depths increased by 0.01–0.08 m, with an average increase of 0.05 m. After Event VI, ponds P7, O1, and O4 had the lowest increases, and pond F3, which had the lowest increase in forest catchments, showed a change that was double that of these ponds. In contrast, Pond P2 exhibited the largest increase in depth post-rain, rising by 0.19 m and showing the highest variability among all ponds. Overall, water depth declines post-rain mainly occurred after the moderate rain conditions of Events II and V, while the most pronounced increases occurred following the rainstorm of Event IV.

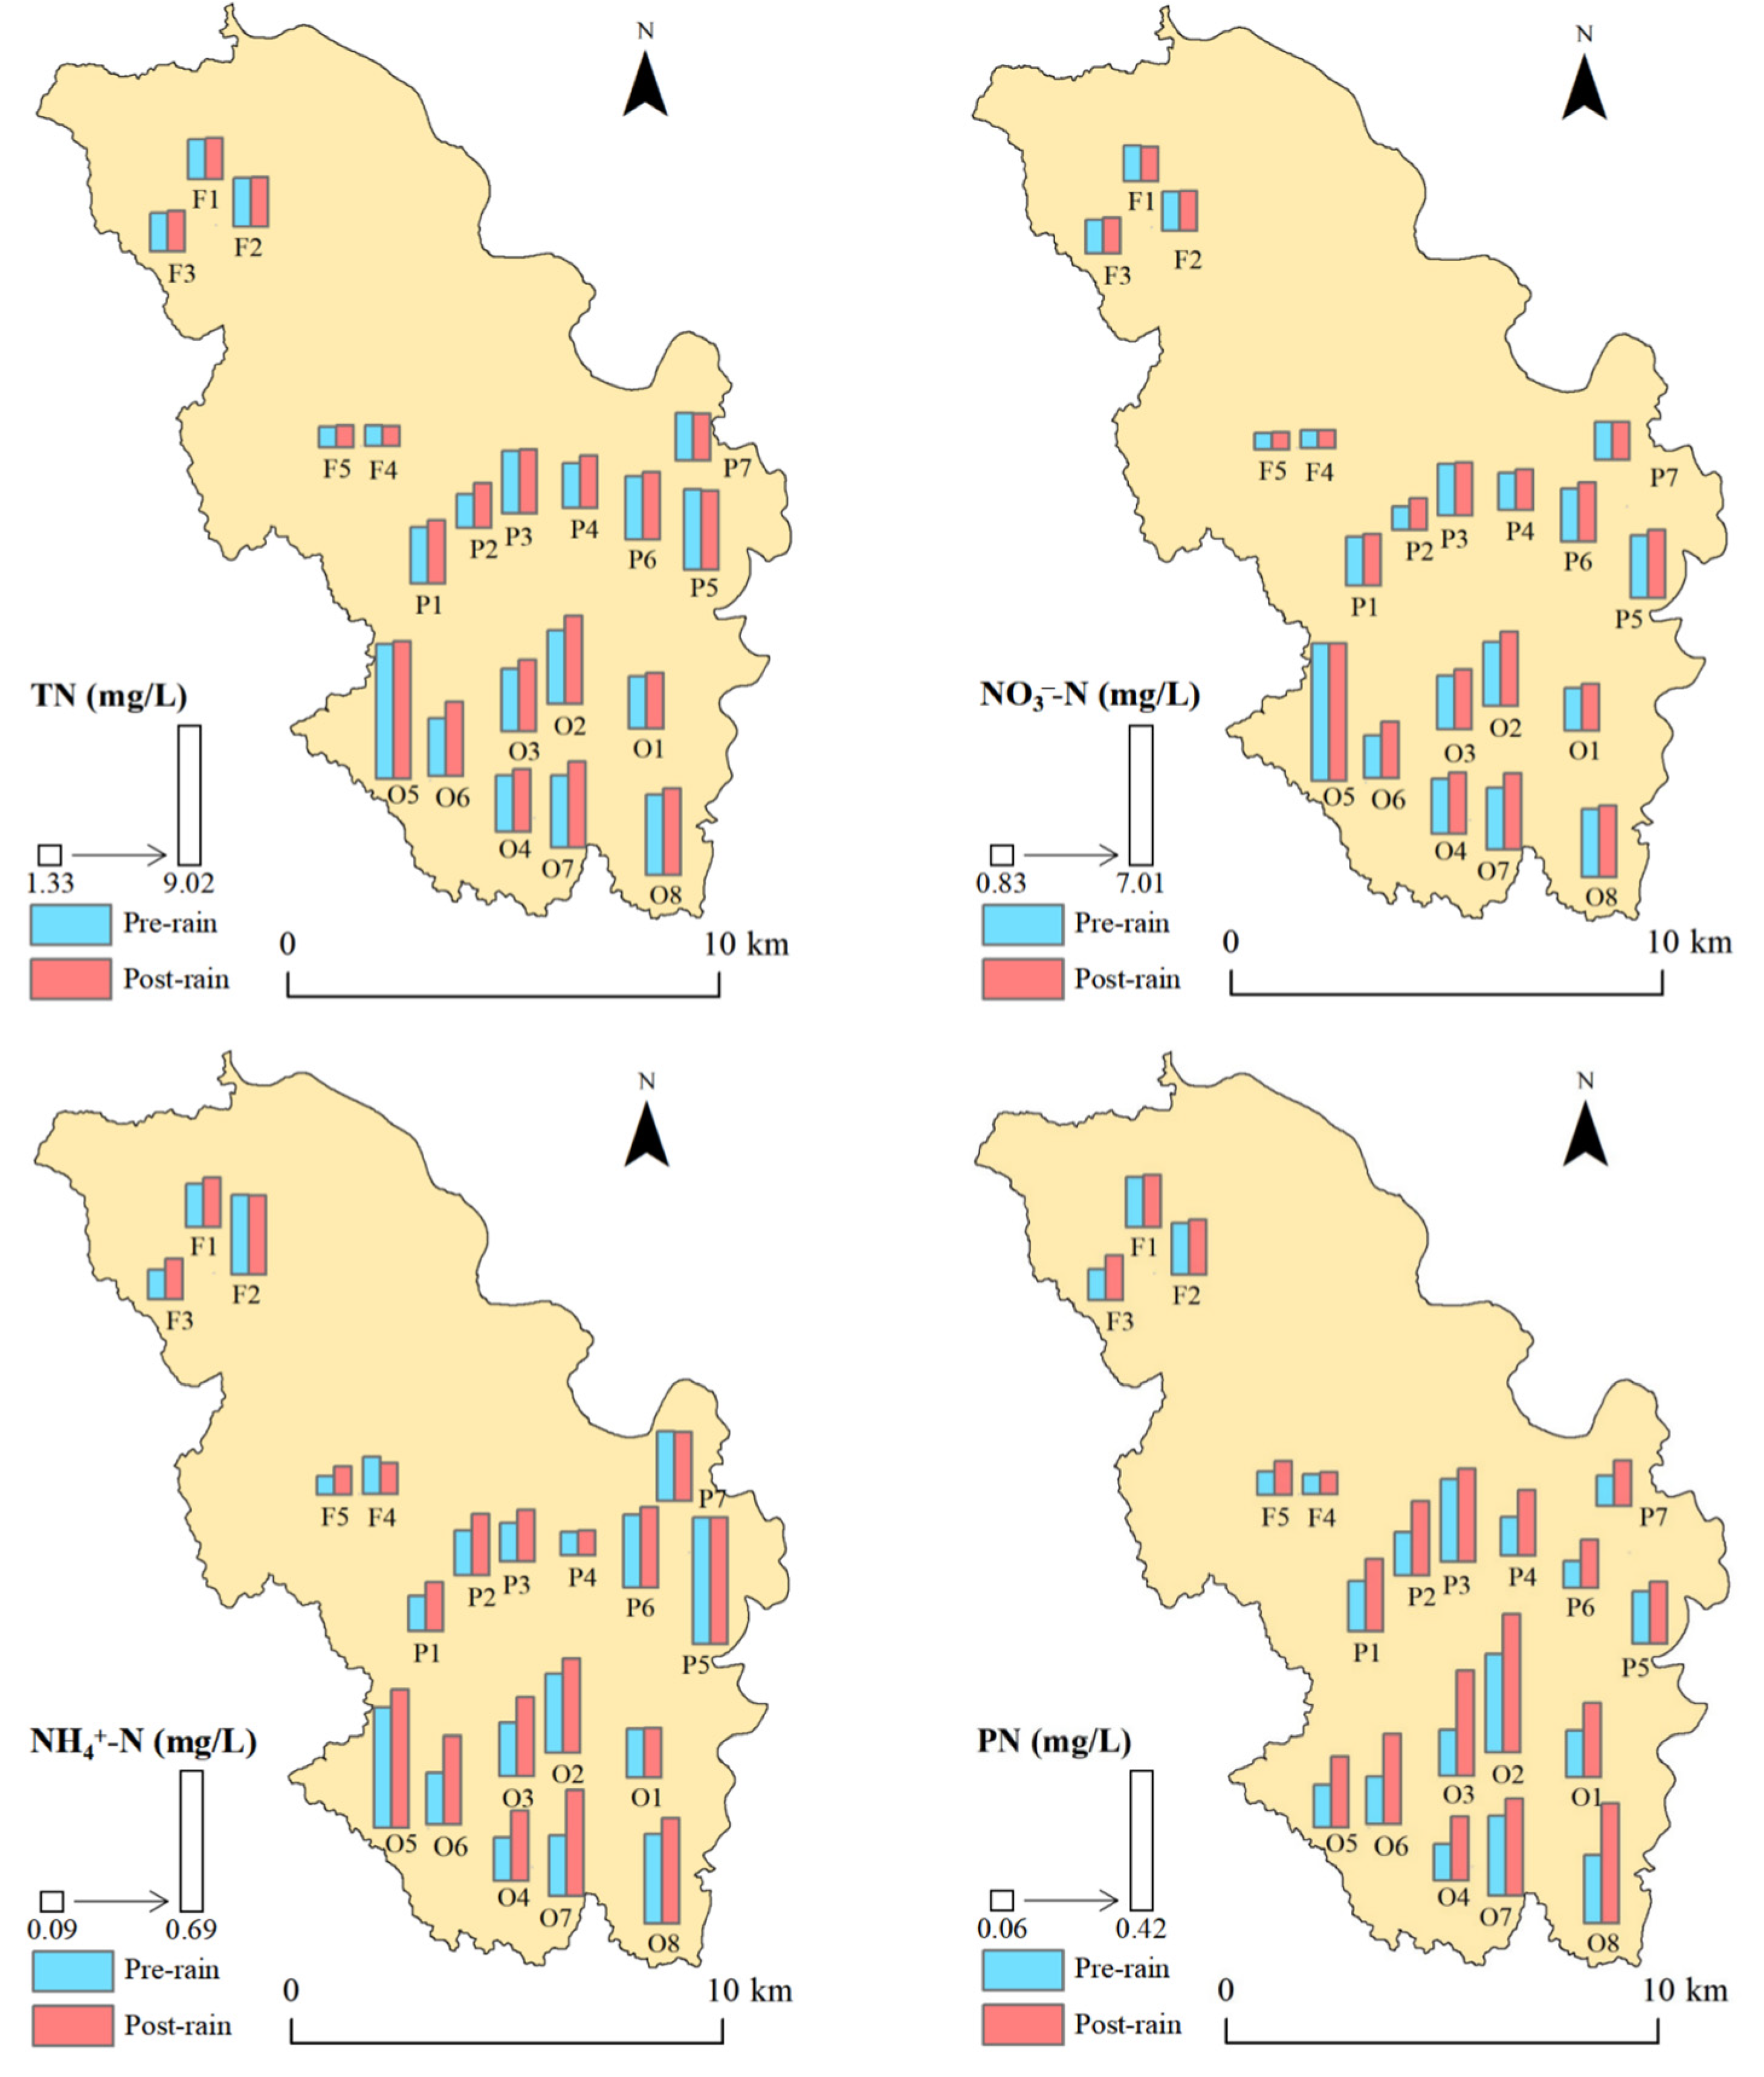
3.2. N Concentration Changes

The variability in pond N concentration was ranked as follows: forest catchments < paddy field catchments < orchard catchments (Figure 4). TN concentrations in orchard catchment ponds ranged from 3.43 to 9.02 mg/L, with an average of 1.36 times higher than that in paddy field catchment ponds and 2.27 times higher than that in forest catchment ponds. During the entire monitoring period, NO3-N remained the main N form, accounting for over 50% of TN concentrations. After the rainfall events, TN concentrations in eight orchard catchment ponds increased by 2.15–29.48%. NO3-N concentrations in ponds F1, P7, and O5, as well as NH4+-N concentrations in ponds F2, F4, P5, and P7, showed slight declines. The average NH4+-N concentrations in orchard catchment ponds increased by 38.46%. PN concentrations were most affected by rainfall events, with increases of 22.59, 49.92, and 69.21% in forest, paddy field, and orchard catchment ponds, respectively.
There were noticeable differences in N concentrations among ponds from different catchments under various rainfall intensity scenarios, but limited variability between pre- and post-rain periods was observed (Figure 5). No significant variations in N concentrations were detected after the moderate rain events. Following the heavy rain events, PN concentrations in orchard catchment ponds increased significantly post-rain compared to pre-rain levels. After the rainstorm event, NH4+-N concentrations in paddy field catchment ponds and PN concentrations in orchard catchment ponds increased markedly. After the heavy rainstorm event, NH4+-N and PN concentrations in paddy field catchment ponds and TN, NH4+-N, and PN concentrations in orchard catchment ponds were significantly higher than those pre-rain. These findings collectively suggest that N concentrations in forest catchment ponds were less affected by rainfall intensity, while NH4+-N and PN concentrations in agricultural catchment ponds were more susceptible to rainfall events with intensities exceeding heavy rain.

3.3. N Load Changes

N loads gradually climbed as rainfall intensity increased and were significantly higher in orchard catchments than those in forest and paddy field catchments (Table 2). After the moderate rain events, TN and PN loads in forest catchment ponds increased slightly, while NO3-N and NH4+-N loads showed a decreasing trend. And TN, NO3-N, and NH4+-N loads in paddy field catchment ponds decreased post-rain. As intensity increased from moderate to heavy rain, TN loads in forest catchment ponds increased tenfold. After the heavy rain events, TN, NO3-N, and PN loads in paddy field catchment ponds increased by 5.55, 3.60, and 0.89 kg/ha, respectively, while NH4+-N loads decreased by 0.70 kg/ha.
As intensity shifted from heavy rain to heavy rainstorm, NO3-N loads in forest catchment ponds showed little change, while NH4+-N and PN loads increased by 3.53 and 3.64 times, respectively. TN and NO3-N loads in paddy field catchment ponds maintained the same multiple increase, while PN loads increased the least. Throughout the study period, N loads in orchard catchment ponds increased, with TN, NH4+-N, and PN loads more than doubling between heavy rain and rainstorm events. NO3-N loads exhibited the greatest variability from rainstorm to heavy rainstorm. After the heavy rainstorm event, the average TN load in forest catchment ponds was 6.68 kg/ha, significantly lower than 20.93 kg/ha in paddy catchments and 34.62 kg/ha in orchard catchments. In summary, as rainfall intensity escalated from heavy rain to heavy rainstorm events, pond TN loads demonstrated an approximately linear response.

3.4. Driving Factors Affecting Pond N Dynamics

The model results clearly showed the differences in the changes in pond N among these catchments’ response to rainfall events and the main influencing factors. Positive Q2 values indicated that the combined effects of rainfall and catchment characteristics reliably explained the variations in pond N dynamics, while R2 results suggested that predictive factors explained N loads better than concentrations (Figure 6). The lower R2 of N concentrations may be related to the high variability of concentration. In forest catchments, rainfall amount and catchment characteristics indirectly affected pond N concentrations and loads through water volume changes, without direct effects (Figure 6a). Slope and rainfall amount significantly increased pond water volume, with path coefficients of 0.40 and 0.84, respectively. Water volume change had significant path coefficients of 0.35 for N concentrations and 0.75 for N loads. The total effect suggested that rainfall amount and the increase in water volume due to rainfall events were the main factors contributing to increased N concentrations and loads. In addition, catchments with steep slopes significantly elevated pond N loads.
In paddy field catchment ponds, environmental variables explained 41% and 76% of the variation in N concentrations and loads, respectively (Figure 6b). Slope had no significant effect on changes in water volume or N dynamics. Rainfall amount directly affected pond water quality, with path coefficients of 0.59 and 0.60 for variations in N concentrations and loads, respectively. On the other hand, rainfall amount indirectly affected N changes by altering pond water volume. Catchment area exhibited a significant negative impact on the water volume change with a path coefficient of −0.53, which in turn reduced the N loads. In terms of direct effects, pond area showed a significant negative correlation with N concentrations and loads, with coefficients of −0.26 and −0.20, respectively. On the other hand, pond area exhibited a positive effect on water volume, indirectly influencing N changes. However, the total effects only showed a significant negative impact of pond area on N concentration variability.
The model results for orchard catchments showed that factors other than catchment area significantly promoted pond N changes (Figure 6c). Specifically, rainfall amount directly and significantly discharged N loads into the ponds. At the same time, rainfall amount indirectly facilitated the increase in N concentrations and loads by affecting pond water volume. Both slope and pond area positively influenced pond water volume, with path coefficients of 0.44 and 0.41, respectively, thereby concentrating N pollution in these ponds. Catchment area did not show any significant direct or indirect effects on N concentrations or loads, indicating that pond N changes are independent of orchard catchment area. The entire analysis unveiled that N dynamics in orchard catchment ponds were closely related to rainfall amount, catchment slope, and pond area.

4. Discussion

4.1. Rainfall Affects N Dynamics in Ponds

This study found that N concentrations in nearly all ponds increased after rainfall, indicating that rainfall contributed to water quality degradation. Unlike other water systems, ponds have limited water capacity and poor exchange ability and are primarily influenced by the release of nutrients from their catchments [5]. Concentrations of pollutants carried by surface runoff from catchment land are typically higher than those found in ponds. In the current study area, Luo et al. (2023) observed that TN concentrations in surface runoff from citrus orchard plots reached approximately 20 mg/L during storms, nearly three times higher than those in nearby ponds [12]. Since NH4+-N is easily adsorbed by soil colloids and undergoes nitrification, it leads to high NO3-N concentrations in pond water. NH4+-N and PN mainly adhere to soil particles that are lost with surface runoff [26]. The variability in these two types of N concentrations suggests that increased rainfall intensity significantly impacts the discharge of particulates and sediments in agricultural catchments (Figure 4). Some studies have found that rainfall-induced soil erosion may cause PN to dominate N loss after a rainstorm event [27,28]. However, PN concentrations in TN post-rain accounted for less than 10% in this study, likely due to efficient sedimentation in relatively static pond environments.
Rainfall significantly promoted the increase in pond water volume and N loads but exhibited negative feedback under low-intensity rainfall events. Soil has the ability to retain moisture, with the vast majority of rainwater being absorbed during low-intensity rainfall events, resulting in limited runoff generation [21]. After the moderate rainfall events, the negative N loads (TN, NO3-N, and NH4+-N) in forest and paddy field catchment ponds suggested that surface runoff was retained within the catchments. Processes such as adsorption, nitrification, and denitrification in the ponds also contributed to the reduction in dissolved N levels [29,30]. PN loads increase independently of rainfall intensity, potentially due to pond disturbances induced by rainwater. In addition, rainfall amounts increased three-fold from heavy rain to heavy rainstorm events, and pond TN loads maintained an almost linear increase (Table 2), indicating minimal saturation effects in nutrient mobilization pathways. These findings provide useful insights for estimating future N export to ponds under varying rainfall conditions.

4.2. The Role of Catchment Characteristics in Pond N Changes

TN concentrations in paddy field and orchard catchment ponds exceeded the national surface water lower limit of Grade V (2 mg/L), highlighting a significant agricultural N pollution issue. N concentration variability also showed that pond N pollution was more pronounced in agricultural catchments after the rainfall events. In contrast, forest land has low external inputs and high natural vegetation coverage, effectively intercepting nutrients in surface runoff [31]. Similarly, pond N loads in agricultural catchments were almost two to six times greater than in forest catchments (Table 2). The high percent areas of paddy fields and orchards in the catchments contributed to high fertilizer inputs, and these substantial external nutrients exacerbated catchment N loss during rainfall events [12,32]. After the heavy rainstorm, TN loads in paddy field and orchard catchment ponds represented 19.56% and 8.81% of the annual fertilizer N input (107 kg/ha for paddy fields and 393 kg/ha for citrus orchards), respectively [20]. The results remind us that N loss from paddy fields during the rainy season is worth paying attention to.
Slope in both forest and orchard catchments also intensified pond N loads. Steeper terrain is more susceptible to hydraulic erosion compared to that with gentler slopes, thus pushing N losses after the rainfall events [11]. Paddy fields were mainly distributed in flat areas and had little effect on N discharge to ponds. In forest and orchard catchments, this study found that the spatial scale controlling pond water volume and N changes was not at the catchment extent. Previous studies have shown that material cycling and hydrological fluctuations within buffer zones (e.g., 100 m buffer scale) have more impact on water nutrients compared to larger spatial scales [20,33]. However, paddy fields stored water for a long time and some runoff and pollutants were retained in the catchments. Therefore, a large paddy field catchment area significantly reduced N loads entering the ponds. Pond area reflects both storage capacity and nutrient concentration variability [5]. The SEM total effect results indicated that N concentrations increased less in larger paddy field catchment ponds post-rain, suggesting that rainfall concentrated N pollution in smaller ponds. Topographical differences allow larger ponds to receive more runoff from the orchard catchments, potentially intensifying N changes after the rainfall events.

4.3. Water Quality Management in Response to Storms

The increasing frequency of storm events driven by climate change will undoubtedly pose a great threat to freshwater environments [6]. Ponds intercept runoff and pollution loads from catchments, significantly reducing pollution diffusion after rainfall events. However, we found that even in forest-dominated catchments, N concentrations in ponds F1, F2, and F3 were comparable to those in agricultural catchment ponds (Figure 4). Human activities are rapidly altering land cover, resulting in the deterioration of surface water quality. Long-term nutrient surpluses cause ponds to gradually lose their original ecological functions, shifting from ‘sinks’ to ‘sources’ of pollution, affecting other ecosystems after storm events [16,34]. In this study area, rainfall events coincide with the high-temperature period. Previous studies have shown that ponds experience high pH and eutrophication during this period [20]. Generally, the higher the pH and temperature, the greater the proportion of NH4+-N [35]. Intense microbial activity also promotes nitrification and denitrification in water bodies. These processes are equally important for changes in the N components of pond water and require more in-depth research in the future to better manage N pollution.
Planting aquatic plants (e.g., Carex and Myriophyllum spicatum) can absorb and intercept pollutants, making it an effective method for reducing N levels in wetlands post-rain [36,37]. External measures mainly consider the spatial configuration and planting patterns of land use within the catchment. In agricultural catchments, greater land use diversity can significantly reduce N loss during rainy periods compared to monoculture land use [5]. Responsible fertilization management can also mitigate surface water pollution in agricultural catchments. Adopting terraced planting or increasing surface plant cover in sloping areas can reduce N losses after rainfall events [12,38]. Some studies have found that rainfall duration and antecedent dry conditions also affect surface runoff and N transport from catchments [23]. Future research should consider these factors for a more comprehensive understanding.

5. Conclusions

The effects of rainfall were quantified by monitoring the variability in N concentrations and loads in forest, paddy field, and orchard catchment ponds during six rainfall events. N concentrations in ponds post-rain were generally higher than those pre-rain. PN concentrations showed the greatest increase, ranging from 22.59% to 69.21%. N loads in ponds gradually increased with the rainfall intensity, following a pattern of forest catchments < paddy field catchments < orchard catchments. Rainfall events promoted an increase in pond water volume, which in turn deteriorated pond water quality. In steep catchments, it is essential to minimize human disturbance, and measures such as terraced planting or increasing surface plant cover are promising approaches to reduce pollution. In paddy field catchments, sufficient space must be allocated to store rainwater, which requires rational spatial planning. As for the ponds themselves, planting aquatic vegetation has become a necessary measure to mitigate excessively high nutrient levels in the water.

Author Contributions

Conceptualization, M.J. and H.X.; methodology, M.J. and Y.L.; investigation, Y.L. and H.X.; data curation, M.J. and R.S.; writing—original draft preparation, M.J. and H.X.; writing—review and editing, P.X., M.J., R.S. and R.H.; project administration, R.H.; funding acquisition, R.H. All authors have read and agreed to the published version of the manuscript.

Funding

This research was funded by the National Natural Science Foundation of China, grant number 42407040, the National Key Research and Development Program of China, grant number 2023 YFD1900902, and the National Science Foundation of Hubei Province, grant number 2024 AFB299.

Institutional Review Board Statement

Not applicable.

Data Availability Statement

The data presented in this study are available on request from the corresponding author.

Conflicts of Interest

The authors declare no conflicts of interest.

References

  1. Basu, N.B.; Van Meter, K.J.; Byrnes, D.K.; Van Cappellen, P.; Brouwer, R.; Jacobsen, B.H.; Jarsjö, J.; Rudolph, D.L.; Cunha, M.C.; Nelson, N.; et al. Managing nitrogen legacies to accelerate water quality improvement. Nat. Geosci. 2022, 15, 97–105. [Google Scholar] [CrossRef]
  2. Schulte-Uebbing, L.F.; Beusen, A.H.W.; Bouwman, A.F.; de Vries, W. From planetary to regional boundaries for agricultural nitrogen pollution. Nature 2022, 610, 507–512. [Google Scholar] [CrossRef] [PubMed]
  3. Beal, M.R.W.; Wilkinson, G.M.; Block, P.J. Large scale seasonal forecasting of peak season algae metrics in the Midwest and Northeast U.S. Water Res. 2023, 229, 119402. [Google Scholar] [CrossRef]
  4. Jargal, N.; An, K.G. Seasonal and interannual responses of blue-green algal taxa and chlorophyll to a monsoon climate, flow regimes, and N:P ratios in a temperate drinking-water reservoir. Sci. Total Environ. 2023, 896, 165306. [Google Scholar] [CrossRef]
  5. Xiao, H.B.; Luo, Y.; Jiang, M.D.; Su, R.L.; Li, J.L.; Xiang, R.B.; Hu, R.G. Landscape patterns are the main regulator of pond water chlorophyll α concentrations in subtropical agricultural catchments of China. J. Clean. Prod. 2023, 425, 139013. [Google Scholar] [CrossRef]
  6. Richardson, J.; Feuchtmayr, H.; Miller, C.; Hunter, P.D.; Maberly, S.C.; Carvalho, L. Response of cyanobacteria and phytoplankton abundance to warming, extreme rainfall events and nutrient enrichment. Glob. Change Biol. 2019, 25, 3365–3380. [Google Scholar] [CrossRef] [PubMed]
  7. Zhang, X.Y.; Chen, L.; Yu, Y.; Shen, Z.Y. Water quality variability affected by landscape patterns and the associated temporal observation scales in the rapidly urbanizing watershed. J. Environ. Manag. 2021, 298, 113523. [Google Scholar] [CrossRef]
  8. Wilson, H.F.; Casson, N.J.; Glenn, A.J.; Badiou, P.; Boychuk, L. Landscape Controls on Nutrient Export during Snowmelt and an Extreme Rainfall Runoff Event in Northern Agricultural Watersheds. J. Environ. Qual. 2019, 48, 841–849. [Google Scholar] [CrossRef]
  9. Gao, X.J.; Chen, N.W.; Yu, D.; Wu, Y.Q.; Huang, B.Q. Hydrological controls on nitrogen (ammonium versus nitrate) fluxes from river to coast in a subtropical region: Observation and modeling. J. Environ. Manag. 2018, 213, 382–391. [Google Scholar] [CrossRef]
  10. Li, W.C.; Lei, Q.L.; Yen, H.; Zhai, L.M.; Hu, W.L.; Li, Y.; Wang, H.Y.; Ren, T.Z.; Liu, H.B. Investigation of watershed nutrient export affected by extreme events and the corresponding sampling frequency. J. Environ. Manag. 2019, 250, 109477. [Google Scholar] [CrossRef]
  11. Ramos, M.C.; Lizaga, I.; Gaspar, L.; Quijano, L.; Navas, A. Effects of rainfall intensity and slope on sediment, nitrogen and phosphorous losses in soils with different use and soil hydrological properties. Agric. Water Manag. 2019, 226, 105789. [Google Scholar] [CrossRef]
  12. Luo, Y.; Wu, X.; Liu, J.; Xiao, H.B.; Liao, B.; Hu, R.G. Mitigating runoff nitrate loss from soil organic nitrogen mineralization in citrus orchard catchments using green manure. Water Res. 2023, 243, 120398. [Google Scholar] [CrossRef] [PubMed]
  13. Yan, L.; Xue, L.H.; Petropoulos, E.; Qian, C.; Hou, P.F.; Xu, D.F.; Yang, L.Z. Nutrient loss by runoff from rice-wheat rotation during the wheat season is dictated by rainfall duration. Environ. Pollut. 2021, 285, 117382. [Google Scholar] [CrossRef]
  14. Nobre, R.L.G.; Caliman, A.; Cabral, C.R.; Araujo, F.C.; Guerin, J.; Dantas, F.; Quesado, L.B.; Venticinque, E.M.; Guariento, R.D.; Amado, A.M.; et al. Precipitation, landscape properties and land use interactively affect water quality of tropical freshwaters. Sci. Total Environ. 2020, 716, 137044. [Google Scholar] [CrossRef] [PubMed]
  15. Qin, B.Q.; Zhou, J.; Elser, J.J.; Gardner, W.S.; Deng, J.M.; Brookes, J.D. Water depth underpins the relative roles and fates of nitrogen and phosphorus in lakes. Environ. Sci. Technol. 2020, 54, 3191–3198. [Google Scholar] [CrossRef]
  16. Chen, W.J.; He, B.; Nover, D.; Lu, H.M.; Liu, J.; Sun, W.; Chen, W. Farm ponds in southern China: Challenges and solutions for conserving a neglected wetland ecosystem. Sci. Total Environ. 2019, 659, 1322–1334. [Google Scholar] [CrossRef] [PubMed]
  17. Abduljaleel, Y.; Salem, A.; Ul Haq, F.; Awad, A.; Amiri, M. Improving detention ponds for effective stormwater management and water quality enhancement under future climate change: A simulation study using the PCSWMM model. Sci. Rep. 2023, 13, 5555. [Google Scholar] [CrossRef]
  18. Janke, B.D.; Finlay, J.C.; Taguchi, V.J.; Gulliver, J.S. Hydrologic processes regulate nutrient retention in stormwater detention ponds. Sci. Total Environ. 2022, 823, 153722. [Google Scholar] [CrossRef]
  19. Zhang, W.S.; Li, H.P.; Pueppke, S.G.; Diao, Y.Q.; Nie, X.F.; Geng, J.W.; Chen, D.Q.; Pang, J.P. Nutrient loss is sensitive to land cover changes and slope gradients of agricultural hillsides: Evidence from four contrasting pond systems in a hilly catchment. Agric. Water Manag. 2020, 237, 106165. [Google Scholar] [CrossRef]
  20. Xiao, H.B.; Jiang, M.D.; Su, R.L.; Luo, Y.; Jiang, Y.B.; Hu, R.G. Fertilization intensities at the buffer zones of ponds regulate nitrogen and phosphorus pollution in an agricultural watershed. Water Res. 2024, 250, 121033. [Google Scholar] [CrossRef]
  21. Xie, H.; Gao, T.T.; Wan, N.S.; Xiong, Z.Y.; Dong, J.W.; Lin, C.; Lai, X.J. Controls for multi-temporal patterns of riverine nitrogen and phosphorus export to lake: Implications for catchment management by high-frequency observations. J. Environ. Manag. 2022, 320, 115858. [Google Scholar] [CrossRef] [PubMed]
  22. Hou, G.R.; Zheng, J.K.; Cui, X.L.; He, F.; Zhang, Y.Q.; Wang, Y.; Li, X.W.; Fan, C.; Tan, B. Suitable coverage and slope guided by soil and water conservation can prevent non-point source pollution diffusion: A case study of grassland. Ecotoxicol. Environ. Saf. 2022, 241, 113804. [Google Scholar] [CrossRef]
  23. Pérez-Gutiérrez, J.D.; Paz, J.O.; Tagert, M.L.M.; Sepehrifar, M. Impact of rainfall characteristics on the NO3-N concentration in a tailwater recovery ditch. Agric. Water Manag. 2020, 233, 106079. [Google Scholar] [CrossRef]
  24. State Environmental Protection Administration of China (SEPA). Methods of Monitoring and Analyzing for Water and Wastewater, 4th ed.; China Environmental Science Press: Beijing, China, 2002. [Google Scholar]
  25. Ketchen, D.J. A primer on partial least squares structural equation modeling. Long Range Plan. 2013, 46, 184–185. [Google Scholar] [CrossRef]
  26. Gao, Y.; Zhu, B.; Yu, G.R.; Chen, W.L.; He, N.P.; Wang, T.; Miao, C.Y. Coupled effects of biogeochemical and hydrological processes on C, N, and P export during extreme rainfall events in a purple soil watershed in southwestern China. J. Hydrol. 2014, 511, 692–702. [Google Scholar] [CrossRef]
  27. Baumgartner, S.; Bauters, M.; Drake, T.W.; Barthel, M.; Alebadwa, S.; Bahizire, N.; Bazirake, B.M.; Six, J.; Boeckx, P.; Van Oost, K. Substantial Organic and Particulate Nitrogen and Phosphorus Export from Geomorphologically Stable African Tropical Forest Landscapes. Ecosystems 2022, 26, 553–567. [Google Scholar] [CrossRef]
  28. Yang, J.L.; Zhang, G.L.; Shi, X.Z.; Wang, H.J.; Cao, Z.H.; Ritsema, C.J. Dynamic changes of nitrogen and phosphorus losses in ephemeral runoff processes by typical storm events in Sichuan Basin, Southwest China. Soil Till. Res. 2009, 105, 292–299. [Google Scholar] [CrossRef]
  29. Fu, B.; Xu, P.; Wang, Y.K.; Yan, K.; Chaudhary, S. Assessment of the ecosystem services provided by ponds in hilly areas. Sci. Total Environ. 2018, 642, 979–987. [Google Scholar] [CrossRef]
  30. Senzia, M.A.; Mayo, A.W.; Mbwette, T.S.; Katima, J.H.; Jorgensen, S.E. Modelling nitrogen transformation and removal in primary facultative ponds. Ecol. Model. 2002, 154, 207–215. [Google Scholar] [CrossRef]
  31. Lebar, K.; Kastelec, D.; Rusjan, S. Investigating the interplay of the hydrometeorological and seasonal forest vegetation role in regulating the nitrate flushing in a small torrential catchment. Sci. Total Environ. 2023, 874, 162475. [Google Scholar] [CrossRef]
  32. Tang, J.L.; Zhang, B.; Gao, C.; Zepp, H. Hydrological pathway and source area of nutrient losses identified by a multi-scale monitoring in an agricultural catchment. Catena 2008, 72, 374–385. [Google Scholar] [CrossRef]
  33. Cole, L.J.; Stockan, J.; Helliwell, R. Managing riparian buffer strips to optimise ecosystem services: A review. Agric. Ecosyst. Environ. 2020, 296, 106891. [Google Scholar] [CrossRef]
  34. Liu, J.; Liu, X.L.; Wang, Y.; Li, Y.; Jiang, Y.X.; Wang, M.H.; Wu, J.S. Landscape pattern at the class level regulates the stream water nitrogen and phosphorus levels in a Chinese subtropical agricultural catchment. Agric. Ecosyst. Environ. 2020, 295, 106897. [Google Scholar] [CrossRef]
  35. Lin, K.N.; Zhu, Y.; Zhang, Y.B.; Lin, H. Determination of ammonia nitrogen in natural waters: Recent advances and applications. Trends Environ. Anal. Chem. 2019, 24, e00073. [Google Scholar]
  36. Schwammberger, P.F.; Yule, C.M.; Tindale, N.W. Rapid plant responses following relocation of a constructed floating wetland from a construction site into an urban stormwater retention pond. Sci. Total Environ. 2020, 699, 134372. [Google Scholar] [CrossRef]
  37. Xue, J.F.; Li, H.C.; Du, J.Z.; Zhou, M.Y.; Mei, Y. Temporal variation pollution source and decontamination characteristics of the Myriophyllum spicatum treatment pond. Ecol. Eng. 2020, 143, 105675. [Google Scholar] [CrossRef]
  38. Wang, W.; Wu, X.H.; Yin, C.M.; Xie, X.L. Nutrition loss through surface runoff from slope lands and its implications for agricultural management. Agric. Water Manag. 2019, 212, 226–231. [Google Scholar] [CrossRef]
Figure 1. Spatial distribution of monitoring ponds and photos of catchment types.
Agriculture 15 01459 g001
Figure 2. Date and rainfall amount of six rainfall events.
Agriculture 15 01459 g002
Figure 3. Changes in pond water depth during six rainfall events.
Agriculture 15 01459 g003
Figure 4. Spatial variations in the N concentrations in the 20 monitored ponds. F, P, and O indicate ponds in forest land, paddy field, and orchard catchments, respectively.
Agriculture 15 01459 g004
Figure 5. Pre- and post-rain N concentrations in forest, paddy field, and orchard catchment ponds. Different letters indicate significance at the p < 0.05 level. The triangle symbols in the box plots represent the mean values.
Agriculture 15 01459 g005
Figure 6. The structural equation model for N pollution in ponds in forest (a), paddy field (b), and orchard (c) catchments driven by rainfall events. Solid and dotted arrows represent significant and insignificant, respectively. * indicate significance (p < 0.05).
Agriculture 15 01459 g006
Table 1. Basic information on monitoring ponds and their catchments.
CatchmentsPondsCatchment Area (ha)Average Slope of Catchment (°)Pond Area (ha)Water Depth (m)
ForestF12.4212.220.321.68
F25.355.270.391.44
F317.307.291.281.61
F44.357.650.731.76
F56.6010.120.521.65
Paddy fieldP12.512.210.250.95
P23.932.650.330.66
P34.422.620.440.83
P46.212.710.161.28
P56.592.530.550.72
P65.512.420.651.45
P77.612.130.630.75
OrchardO17.993.670.391.55
O25.505.700.701.56
O35.945.080.611.72
O415.545.041.341.85
O56.404.110.531.64
O614.997.770.531.28
O721.765.122.211.57
O811.673.711.311.46
Note: Water depth data was measured at the first sampling.
Table 2. N loads in forest, paddy field, and orchard catchment ponds under different rainfall intensity events. Different letters indicate significance at the p < 0.05 level.
ParametersRainfall IntensitiesForest Catchments (kg/ha)Paddy Field Catchments (kg/ha)Orchard Catchments (kg/ha)
TNModerate0.21 ± 0.59 a−0.87 ± 1.36 a7.06 ± 3.76 b
Heavy2.63 ± 1.59 a5.55 ± 2.23 ab10.12 ± 2.00 b
Rainstorm5.01 ± 1.54 a13.01 ± 1.97 b20.22 ± 3.05 c
Heavy rainstorm6.68 ± 1.72 a20.93 ± 3.04 b34.62 ± 4.84 c
NO3-NModerate−0.07 ± 0.46 a−0.04 ± 1.27 a4.57 ± 2.11 b
Heavy1.96 ± 0.88 a3.60 ± 1.40 a7.21 ± 1.59 b
Rainstorm3.71 ± 0.64 a8.23 ± 1.71 b11.37 ± 2.03 b
Heavy rainstorm4.04 ± 1.18 a13.59 ± 3.48 b21.44 ± 4.10 b
NH4+-NModerate−0.22 ± 0.53 a−1.52 ± 0.74 a0.57 ± 0.73 b
Heavy0.49 ± 0.41 ab−0.70 ± 0.34 a1.30 ± 0.63 b
Rainstorm1.05 ± 0.18 a3.96 ± 1.35 b3.77 ± 1.35 b
Heavy rainstorm1.73 ± 0.33 a6.18 ± 1.02 b6.60 ± 1.09 b
PNModerate0.09 ± 0.25 a0.34 ± 0.24 a1.10 ± 0.37 b
Heavy0.34 ± 0.16 a0.89 ± 0.22 b1.47 ± 0.39 b
Rainstorm0.68 ± 0.15 a1.03 ± 0.35 ab3.25 ± 1.44 b
Heavy rainstorm1.24 ± 0.39 a1.99 ± 0.32 b4.60 ± 0.57 c
Disclaimer/Publisher’s Note: The statements, opinions and data contained in all publications are solely those of the individual author(s) and contributor(s) and not of MDPI and/or the editor(s). MDPI and/or the editor(s) disclaim responsibility for any injury to people or property resulting from any ideas, methods, instructions or products referred to in the content.

