Abstract
Plant roots influence various soil physical properties by altering the soil structure and pore configuration; however, a detailed understanding of these effects remains limited. In this study, we applied a relatively simple approach for segmenting plant roots and soil constituents using X-ray computed tomography (CT) images to evaluate root-induced changes in soil structure. The method combines manual initialization with a layer-wise automated region-growing approach, enabling the extraction of the root systems of soybean, Italian ryegrass, and Guinea grass. The method utilizes freely available software with a simple interface and does not require advanced image analysis skills, making it accessible to a wide range of researchers. The soil particles, pore water, and pore air were segmented using a Kriging-based thresholding technique. The segmented four-phase images allowed for the quantification of the volume fractions of soil constituents, pore size distributions, and coordination numbers. Furthermore, by separating the rhizosphere and bulk soil, we found that the root presence significantly reduced solid fractions and increased water content, particularly in the upper soil layers. Macropores and fine pores were observed near the roots, highlighting the complex structural impacts of root growth. While further validation is needed to assess the method’s applicability across different soil types and imaging conditions, it provides a practical basis for visualizing and quantifying root–soil interactions, and could contribute to advancing our understanding of how plant roots influence key soil hydraulic and thermal properties.
1. Introduction
Plant roots spread widely in surface soil, exerting various mechanical and hydrological effects on the soil. For example, the binding effect of soil particles by plant roots increases soil shear and erosion resistance [,]. From a hydrological perspective, soil permeability and water retention are influenced by plant roots, which are associated with plant water uptake and rearrangement of soil particles [,,]. Moreover, plant roots are thought to play an important role in heat and gas transport in the soil [,]. Thus, plant roots influence various soil properties by altering the soil structure and pore configuration [,,]; however, the details of these effects have not been fully elucidated. An accurate understanding of root system structure, soil particle arrangement, and pore configuration in the soil is essential for elucidating these effects.
In recent years, X-ray computed tomography (CT) has gained attention for the analysis of soil structure and fluid movement at the microscale [,]. With a resolution ranging from several tens to several hundreds of micrometers, X-ray CT enables the identification of distinct soil particles, pore water, and pore air, particularly in soil with relatively coarse particles []. Furthermore, attempts have been made to estimate hydraulic conductivity and gas transport properties based on the volume fraction, size distribution, and connectivity of each soil component obtained from X-ray CT [,]. X-ray CT has also emerged as a powerful alternative for observing plant roots in soil, offering a non-destructive solution compared to traditional methods, such as excavation [] and two-dimensional observations with rhizoboxes []. In other words, X-ray CT has the potential to segment plant roots and other soil components, enabling the evaluation of plant root effects on the soil particle arrangement and pore structure.
The segmentation of roots in soil requires relatively complex image analysis. This is because the density of plant roots is close to that of water, resulting in similar brightness values in CT images, and making segmentation based solely on a simple brightness threshold difficult []. Previous studies have introduced several segmentation approaches. For example, Gao et al. [] and Phalempin et al. [] focused on root shape and successfully segmented tubular regions as roots. Teramoto et al. [] visualized rice roots grown in uniformly particle-sized clay from CT images using edge detection. Advanced research has also been conducted to facilitate root extraction using deep learning [,], and other studies have employed fine-tuned threshold filtering [,,,]. Although these methods offer promising results, they also have limitations, such as applicability to only specific soil types, limited detection of fine roots, or misclassification of pore water as roots. As a result, researchers are required to evaluate and choose the most appropriate segmentation tools depending on the characteristics of their target samples and the aims of their study. Furthermore, many of these approaches require commercial software, often accompanied by significant licensing fees, or advanced expertise in image analysis, which can be barriers to broader use in soil science. Therefore, there is still a need for a relatively simple method that does not require specialized software or advanced expertise in image analysis, that can segment plant roots reliably, and also allows for further segmentation of soil constituents.
In this study, we applied a relatively simple root segmentation method that requires only a threshold setting as a parameter and can be implemented using two widely available and free software tools. Such an approach could potentially lower some of the technical and financial barriers associated with image analysis, thereby supporting the broader use of X-ray CT in the studies of root–soil interactions. To illustrate its usefulness, we demonstrate the application of this method to evaluate the effects of plant roots on soil and pore structure.
2. Segmentation of Plant Roots and Soil Constituents
2.1. Preparation of Samples and X-Ray CT Scanning
An acrylic column with an inner diameter of 20 mm and a height of 50 mm was uniformly filled to the top with air-dried Toyoura sand at bulk density of approximately 1500 kg m−3. Toyoura sand is natural silica sand with a particle diameter of 100–500 µm. A nylon sheet with a mesh size of 45 µm was attached to the bottom of the column to prevent the soil particles from flowing out. One column was prepared for each plant species: soybean, Italian ryegrass, and Guinea grass. Seeds were sown directly onto the surface layer of the filled Toyoura sand and germinated there to initiate growth. The plants were grown for two weeks in a temperature-controlled chamber maintained at 20 °C, using lighting for ornamental plants. Water was regularly provided during the growth period.
X-ray CT scanning was conducted to scan the soil sample inside the acrylic column using a Metrotom 1500 G1 (Carl Zeiss, Oberkochen, Germany) with a scanning energy level of 190 kV and 55 μA. The voxel size corresponding to the resolution was 16.5 µm. It should be noted that features below this image resolution are not captured. Cross-sectional images of the soil column were obtained with a horizontal plane resolution of 1378 × 1432 voxels (approximately 22.7 mm × 23.6 mm) and a depth direction consisting of 3000 to 4000 cross-sectional slices (49.5 mm to 66.0 mm).
2.2. Segmentation of Plant Roots
2.2.1. Preprocessing
Pre-processing was conducted to segment the plant roots. The free image analysis software, ImageJ ver. 1.53t (FIJI distribution; National Institutes of Health, Bethesda, MD, USA), was used to convert the resolution of the CT images from 16-bit to 8-bit. This conversion reduced the brightness value to 256; however, it did not compromise the image quality or the visibility of the soil components. The maximum and minimum brightness values within the column were then adjusted, with voxels that had brightness values of 255 changed to 254 and those of 0 changed to 1. This adjustment was necessary to facilitate root extraction, where a brightness of 255 was assigned to plant roots, and regions outside a soil column with 20 mm radius were set to a brightness of 0. Finally, the acrylic column was removed from the CT images.
The acrylic column was removed using an approach proposed by Phalempin et al. []. Owing to the slight tilt of the column, the center coordinates and radius of the soil column varied across the cross-sectional images, necessitating removal on a per-image basis. The center coordinates and radii were manually determined from the topmost and bottommost cross-sectional images. Assuming a linear change in the center of the column and a radius with the height owing to the tilt, the center coordinates and inner diameter for all cross-sectional images were calculated through linear interpolation based on the values from the topmost and bottommost images. Using the distribution of the center coordinates and inner diameters derived from the linear correction, the soil portion within the acrylic column was extracted as the region of interest, whereas all other regions were set to a brightness of zero.
2.2.2. Root Segmentation Using a Region-Growing Approach
Plant roots grow underground while branching out from the seed. Based on this, the concept of region growing [] is sometimes used for root segmentation [], where root regions progressively change as they extend downward from the stem at the surface. We considered that this region growing approach offers a relatively simple and suitable framework for the method we intend to establish. From the surface layer images, the roots immediately beneath the stem were extracted based on their shape characteristics. For the next layer, new regions were defined by identifying the voxels with brightness values similar to those of the surface roots within the vicinity of the regions detected in the previous layer. By sequentially repeating this process down to the lowest layer, we aimed to extract the entire root system.
The processing procedure was as follows. First, using ImageJ software, the regions in the cross-sectional image of the uppermost layer that were judged to be plant roots based on their shape were manually filled with a brightness value of 255. The filling process was performed using a pen-display tablet (XP-Pen Artist 15.6 Pro, Hanvon Ugee Technology Co., Shenzhen, China). Figure 1 shows the uppermost layer images before and after filling as well as the procedure. Next, the threshold corresponding to the filled voxels in the uppermost layer was determined. This threshold was fixed and consistently applied to all subsequent layers. The extraction of the plant roots from the second layer onward was automatically performed using a program written in Python 3.12.7. An overview of the automatic plant root extraction program for layers beyond the second layer is shown in Figure 2.
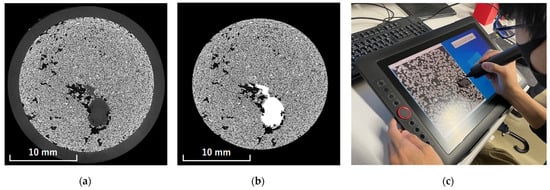
Figure 1.
Segmentation of roots in the cross-sectional image of the uppermost layer: (a) original image; (b) image with roots manually filled in; (c) scene of the filling process.
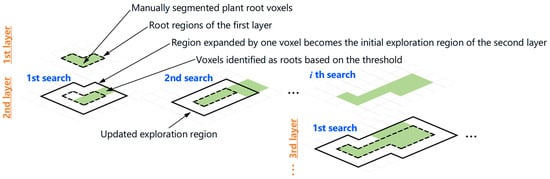
Figure 2.
An overview of the sequential plant root extraction based on the upper layer voxels identified as plant root.
In this program, the exploration area of the plant roots was first set. The position information of the plant roots in the first layer was reflected in the cross-sectional image of the second layer. The voxels identified as plant roots in the first layer, along with the adjacent voxels, were included in the exploration area of the second layer. After setting the exploration area for the plant roots, voxel segmentation was then performed using the same threshold determined from the first layer. Following the initial segmentation of the plant roots, the exploration area was reset, that is, additional adjacent voxels were added to the exploration area based on the positions of the plant roots identified in the first exploration, and further segmentation was conducted using the unchanged threshold from the first layer. This process was repeated until the exploration area no longer changed. In the third layer, the exploration area included the voxels identified as plant roots in the second layer along with those adjacent to them, and the same procedure was applied continuously through to the bottom layers. Plant roots do not always grow vertically downward; occasionally, they grow in an upward direction. Therefore, after completing the exploration down to the bottom layer, the exploration direction was reversed and a similar exploration process was performed from the bottom to the top layer.
As mentioned earlier, plant roots and pore water have similar densities; therefore, there is only a minor difference in their brightness values. It is possible that the pore water was incorrectly extracted during plant root segmentation. To suppress such false detections, an erode–dilate process was applied after each exploration. The erode process involves contracting and removing the outermost voxel layer of the extracted plant roots, whereas the dilate process involves expanding the outermost voxels, thereby restoring the structure. Plant roots are relatively large in diameter, typically at least 20 voxels, whereas pore water is much smaller (approximately 10 voxels). Therefore, after the erode–dilate process, the plant roots are restored to their original shape, whereas the pore water is likely to be removed. Furthermore, the boundaries between the plant roots and the surrounding soil components were often highly irregular and unclear. To improve the visibility of these boundaries, a 3D median filter (σ = 3) was applied using ImageJ software to reduce the noise and smooth the structure. Additionally, the segmented plant root images included some voxels inside the root that were not segmented, probably because of their lower density. To address this issue, a Python script was used in the final step to fill all the internal holes smaller than 250 voxels by assigning a brightness value of 255.
The three-dimensional images of the segmented plant roots are shown in Figure 3. Differences in root thickness and growth patterns were observed depending on the plant species. In the soybean and the Italian ryegrass, root development was prominent in the horizontal direction near the soil surface, followed by downward vertical growth along the column walls. Due to the influence of the column wall, root elongation may have differed from that under actual field conditions, highlighting the need for larger column sizes in future studies. By contrast, the Guinea grass exhibited poor aboveground growth and its root development was less pronounced than that of the other plant species. These results demonstrated that the roots of each plant were reasonably extracted. Although the proposed method involves some manual processing, it is considered to be effective, straightforward, and accessible for segmenting plant roots.
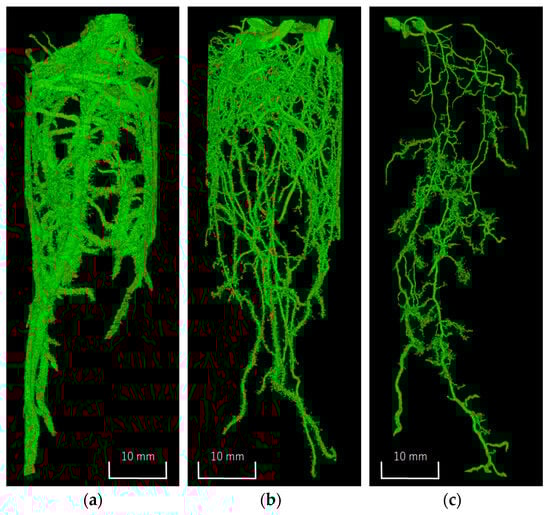
Figure 3.
Three-dimensional images of the segmented plant roots: (a) soybean; (b) Italian ryegrass; (c) Guinea grass.
2.3. Segmentation of Soil Constituents
The voxels identified as plant roots in Section 2.2 were filled with a brightness value of 255. Consequently, in the CT images, the background region (outer space) had a brightness value of 0, the plant roots had a brightness value of 255, and the soil constituents had brightness values ranging from 1 to 254. Based on these images, the soil constituents were segmented using a thresholding approach based on the brightness values. In this process, segmentation was not based solely on a simple brightness value comparison of individual voxels, but incorporated spatial relationships among the voxels using a Kriging method. Kriging is a statistical spatial interpolation technique widely used in various fields, including soil science []. It estimates the brightness values of the voxels by considering the values of the neighboring voxels, which helps to statistically classify the voxels with brightness values near the threshold. This approach reduces ambiguity in the boundary regions and enables more accurate segmentation. The segmentation was conducted using the image analysis software ExFact VR 2.1 (Nihon Visual Science, Inc., Tokyo, Japan).
In addition to the plant roots, segmented images of the soil components were generated. As an example, the segmented image for the soybeans is shown in Figure 4, and the volumetric proportions of each constituent obtained from the segmentation of the soil cultivated with different plants are presented in Table 1. The volumetric fraction of the soil particles can be estimated by dividing the bulk density of the Toyoura sand (approximately 1500 kg m−3) by the density of quartz, which is considered to be the main component (2660 kg m−3) []. The calculated volumetric fraction of the soil particles was 56%, which was generally consistent with the results obtained from the present analysis. Through this segmentation, the plant roots, soil particles, water, and air were successfully distinguished. These segmented images facilitated the analysis of the impact of the plant roots on the soil structure.
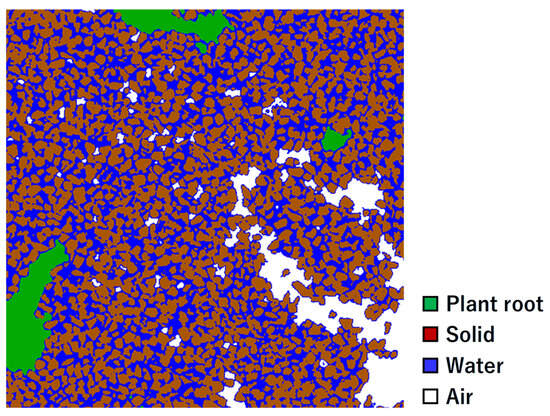
Figure 4.
Cross-sectional image of soybean-cultivated soil segmented into four constituents. The image represents the section at a height of 39 mm from the bottom of the column and spans 8.25 mm × 8.25 mm (500 voxels × 500 voxels).

Table 1.
The volumetric fractions of plant roots and soil constituents based on the segmented images.
3. Evaluation of Plant Root Effects on Soil Structure
A demonstration was conducted to evaluate the impact of plant roots on soil structure using segmented CT images. For this demonstration, CT images of soybean-cultivated soil were used. Initially, the segmented images were divided into rhizosphere and bulk soil. The rhizosphere soil was defined as the region within 100 voxels (approximately 1.65 mm) of the voxels identified as plant roots. Conversely, areas more than 100 voxels away from the plant roots were classified as bulk soil. The rhizosphere and bulk soil were separated using a custom Python program. Figure 5 shows the cross-sectional images of the original image (entire soil), rhizosphere soil, and bulk soil.
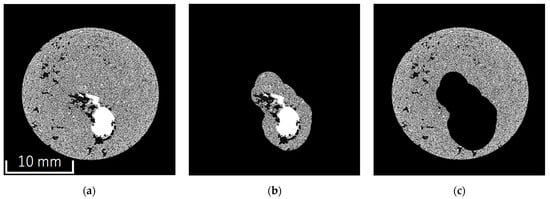
Figure 5.
Separation of rhizosphere and bulk soil: (a) whole soil image; (b) rhizosphere soil image; (c) bulk soil image.
Additionally, to evaluate the growth of the plant roots at different depths, images from specific layers of the column were used: images from 9.1–14.0 mm (measured upward from the bottom end of the scanned region) were designated as the lower layer, 21.7–26.6 mm as the middle layer, and 35.7–42.3 mm as the upper layer. These images were cropped and used for analysis. A total of 300 images from the lower and middle layers, and 400 images from the upper layer were analyzed. The difference in the number of images used for each layer was due to the varying number of images that could be processed during the analysis, which was influenced by the density of the plant roots, as explained in the subsequent analysis. The volume ratios of the rhizosphere soil to the bulk soil for each layer are shown in Table 2. The rhizosphere region was broader in the surface layer, where the root density was higher, and this region became smaller with the increasing depth.
Table 2.
Volumetric fractions of rhizosphere and bulk soil at different depth layers.
The analysis was conducted using image analysis software ExFact VR 2.1 and ExFact Analysis ver. 6.2.0 (Nihon Visual Science, Inc.). First, the total voxel counts for the entire soil, the rhizosphere soil, and the bulk soil, as well as the number of voxels for each constituent (roots, soil particles, water, air), were determined from the 3D images segmented using the Kriging method in ExFact VR. The solid-phase ratio, volumetric water content, and gas-phase ratio of the soil were calculated from the voxel counts. Next, the pore network information (pore size distribution and pore coordination number) was analyzed using ExFact Analysis. This analysis was based on the 3DMA-Rock data analysis [], which divides pores into nodal pores separated by throats. Based on the calculated volume of each nodal pore, the equivalent pore diameter was calculated, assuming that the pores were perfect spheres. Additionally, the coordination number of the nodal points was simultaneously output. The details of this analysis method can be found in Hamamoto et al. [,]. The analysis was conducted in two ways: one for the pores, and the other for the pore water.
Figure 6 shows the volumetric solid, water, and air fractions of the rhizosphere and the bulk soil at each depth. When calculating these volumetric fractions, the voxels identified as roots were excluded. The rhizosphere soil tended to exhibit a lower solid fraction than the bulk soil. For example, in the upper layer, the solid fraction was 44% in the rhizosphere soil and 76% in the bulk soil. Because the soil samples used in this study had low air fractions and were nearly saturated, the reduction in the solid fraction of the rhizosphere soil was offset by an increase in the volumetric water content. The difference in the solid fraction between the rhizosphere and the bulk soil decreased with depth, with differences of 32%, 31%, and 21% in the upper, middle, and lower layers, respectively. Given that the root density decreased with depth (Table 2), the reduction in the solid fraction in the rhizosphere soil was likely attributable to the influence of the roots.
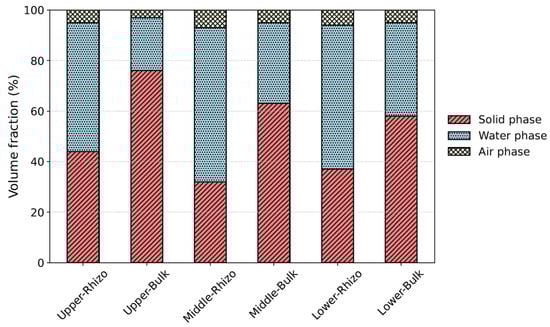
Figure 6.
Three-phase distribution of rhizosphere and bulk soil at each depth. In the horizontal axis, “Upper,” “Middle,” and “Lower” indicate the upper, middle, and lower soil layers, respectively, while “Rhizo” and “Bulk” represent the rhizosphere and bulk soil.
Previous studies have reported that bulk density tends to decrease in the immediate vicinity of the roots [,], and similar results were obtained in the present study. Phalempin et al. [] also reported that, in homogeneously repacked soil, such as the soil used in this study, roots create pores around themselves by pushing away the surrounding soil particles. A visual inspection of the X-ray CT images taken in this study clearly showed the presence of macropores around the roots at all depths (Figure 7). For instance, when the two roots extended in parallel, it was reasonable to assume that the soil particles were displaced, resulting in pore formation. It is also possible that, as the roots grow while bending, macropores form on the inner side of the curved surface. In the present study, the plant roots exhibited a tendency to grow along the column wall, and macropores were frequently observed near the wall. Therefore, the roots are considered to have displaced the soil particles adjacent to the column wall, leading to pore formation in these regions.
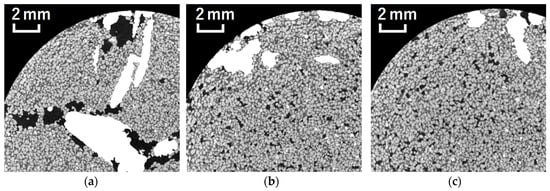
Figure 7.
Cross-sectional images near the root, where the roots are colored with a brightness value of 255: (a) upper layer; (b) upper layer; (c) lower layer.
Figure 8 shows the pore size distributions of the rhizosphere and bulk soil. A comparison of the pore size distributions between the rhizosphere and the bulk soil revealed broadly similar patterns in the upper and middle layers. However, the rhizosphere soil appeared to contain a slightly greater proportion of smaller pores than the bulk soil. Although this observation seems to contradict the marked decrease in the solid-phase ratio in the rhizosphere soil (Figure 6), the close-up image in Figure 7 suggests that, while large pores were present around the roots, fine pores were also observed. These findings imply that both macropores and fine pores may form near the roots. It is presumed that the bending elongation of the roots results in the formation of macropores on the inner side of the curvature and smaller pores on the outer side. Because there are relatively few macropores, their impact on the overall pore size distribution is likely to be limited. In the lower layer, a clear difference in the pore size distribution between the two regions was observed compared to the upper and middle layers. The rhizosphere contains a greater proportion of smaller pores. As shown in Figure 3, the roots of the soybeans in the lower layer extended vertically downward without bending, and only a few roots were present. This suggests that, in the lower layer, the formation of macropores is limited, and pore compression may have mainly occurred in the rhizosphere.
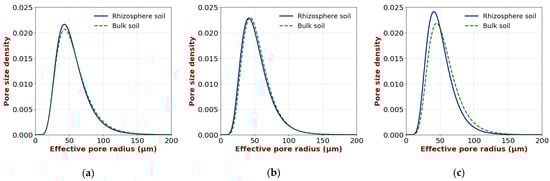
Figure 8.
Pore size distributions of rhizosphere and bulk soil: (a) upper layer; (b) middle layer; (c) lower layer.
Figure 9 shows the distribution of the coordination number of the pore water. Although there was no significant difference between the rhizosphere and the bulk soil in the middle layer, opposite trends were observed in the upper and lower layers; the coordination number was higher in the rhizosphere in the upper layer, whereas it was higher in the bulk soil in the lower layer. The coordination number tends to increase when large pores are formed and surrounded by smaller pores. Therefore, in the upper layer, it is likely that the simultaneous formation of macropores and small pores, induced by the bending growth of the roots, as mentioned earlier, contributes to a higher coordination number. By contrast, in the lower layer, where only a few roots extended straight without bending, as discussed previously, the decrease in the coordination number in the rhizosphere soil may simply be due to soil compaction.
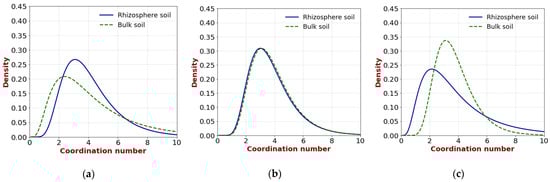
Figure 9.
Pore-water coordination numbers of rhizosphere and bulk soil: (a) upper layer; (b) middle layer; (c) lower layer.
Thus, based on the segmented images of the plant roots, soil particles, water, and air, we demonstrated an approach for evaluating the influence of plant roots on soil structure.
4. Conclusions
In this study, we applied a relatively simple method based on the concept of region growing to segment plant roots from X-ray CT images of soil columns under cultivation conditions, with the aim of evaluating the impact of plant roots on soil structure. The proposed method extracts roots by tracing them vertically downward from the soil surface, and successfully segments the root systems of soybean, Italian ryegrass, and Guinea grass. In addition, soil particles, pore water, and pore air were segmented using a Kriging-based approach, enabling the construction of three-dimensional images consisting of four components: roots, soil particles, pore water, and pore air. Using these four-phase images, we quantified the structural characteristics, such as volume fraction, pore size distribution, and coordination number. Although this approach requires that soil particles and pore sizes be sufficiently larger than the resolution of the X-ray CT, it also allows for an analysis of the soil particle arrangement and contact points, and is expected to facilitate quantitative evaluation of the effects of plant roots on key soil properties, including hydraulic conductivity, water retention, thermal conductivity, gas permeability, and diffusivity.
While a variety of root segmentation methods have already been developed, the method used in this study, which relies only on ImageJ and Python software, with the threshold setting as the only required parameter, is considered to be easy to use and accessible to researchers across a wide range of disciplines, including soil science. However, like other methods, it was selected because it suited the specific characteristics of our samples, and its applicability to different soil types or imaging conditions remains uncertain and should be evaluated in future studies. Furthermore, although the segmented roots appeared reasonable based on visual inspection and volumetric analysis, quantitative validation of segmentation accuracy through a comparison with other established methods has not yet been conducted, which is also a future task. Additionally, a comprehensive assessment of the applicability and segmentation accuracy of various methods, including the approach proposed in this study and previously established techniques, warrants further investigation in future studies.
Author Contributions
Conceptualization, Y.K., S.H., Y.O. and K.K.; methodology, Y.K., S.H. and Y.O.; data curation, T.T., S.H. and Y.O.; image analysis; T.T. and S.H.; writing—original draft, Y.K. and T.T.; writing—review and editing; S.H., Y.O. and K.K.; visualization, Y.K. and T.T.; funding acquisition, Y.K. and S.H. All authors have read and agreed to the published version of the manuscript.
Funding
This research was funded by JSPS KAKENHI (grant numbers 19K22921, 21K14940, and 24K21262).
Institutional Review Board Statement
Not applicable.
Data Availability Statement
The datasets and codes used in this study are available from the corresponding author upon request.
Conflicts of Interest
The authors declare no conflicts of interest.
Abbreviations
The following abbreviations are used in this manuscript:
| CT | Computed tomography |
References
- Haji Ali, F.; Osman, N. Shear strength of a soil containing vegetation roots. Soils Found. 2008, 48, 587–596. [Google Scholar] [CrossRef]
- Gyssels, G.; Poesen, J. The importance of plant root characteristics in controlling concentrated flow erosion rates. Earth Surf. Process. Landf. 2003, 28, 371–384. [Google Scholar] [CrossRef]
- Leung, A.K.; Garg, A.; Coo, J.L.; Ng, W.W.; Hau, B.C.H. Effects of the roots of Cynodon dactylon and Schefflera heptaphylla on water infiltration rate and soil hydraulic conductivity. Hydrol. Process. 2015, 29, 3342–3354. [Google Scholar] [CrossRef]
- Simon, A.; Collison, A.J.C. Quantifying the mechanical and hydrologic effects of riparian vegetation on streambank stability. Earth Surf. Process. Landf. 2002, 27, 527–546. [Google Scholar] [CrossRef]
- Li, J.; Cui, P.; Yin, Y. Field observation and micro-mechanism of roots-induced preferential flow by infiltration experiment and phase-field method. J. Hydrol. 2023, 623, 129756. [Google Scholar] [CrossRef]
- Fu, Y.; Lu, Y.; Heitman, J.; Ren, T. Root-induced changes in soil thermal and dielectric properties should not be ignored. Geoderma 2020, 370, 114352. [Google Scholar] [CrossRef]
- Uteau, D.; Pagenkemper, S.K.; Peth, S.; Horn, R. Root and time dependent soil structure formation and its influence on gas transport in the subsoil. Soil Till. Res. 2013, 132, 69–76. [Google Scholar] [CrossRef]
- Whalley, W.R.; Riseley, B.; Leeds-Harrison, P.B.; Bird, N.R.A.; Leech, P.K.; Adderiey, W.P. Structural differences between bulk and rhizosphere soil. Eur. J. Soil Sci. 2004, 56, 353–360. [Google Scholar] [CrossRef]
- Guidi, G.; Poggio, G.; Petruzzelli, G. The porosity of soil aggregates from bulk soil and from soil adhering to roots. Plant Soil 1985, 87, 311–314. [Google Scholar] [CrossRef]
- Bodner, G.; Leitner, D.; Kaul, H.-P. Coarse and fine root plants affect pore size distributions differently. Plant Soil 2014, 380, 133–151. [Google Scholar] [CrossRef]
- Daly, K.R.; Mooney, S.J.; Bennett, M.J.; Crout, N.M.J.; Roose, T.; Tracy, S.R. Assessing the influence of the rhizosphere on soil hydraulic properties using X-ray computed tomography and numerical modelling. J. Exp. Bot. 2015, 66, 2305–2314. [Google Scholar] [CrossRef]
- Luo, L.; Lin, H.; Halleck, P. Quantifying soil structure and preferential flow in intact soil using X-ray computed tomography. Soil Sci. Soc. Am. J. 2008, 72, 1058–1069. [Google Scholar] [CrossRef]
- Helliwell, J.R.; Sturrock, C.J.; Grayling, K.M.; Tracy, S.R.; Flavel, R.J.; Young, I.M.; Whalley, W.R.; Mooney, S.J. Applications of X-ray computed tomography for examining biophysical interactions and structural development in soil systems: A review. Eur. J. Soil Sci. 2013, 64, 279–297. [Google Scholar] [CrossRef]
- Hamamoto, S.; Ohko, Y.; Ohtake, Y.; Moldrup, P.; Nishimura, T. Water- and air-filled pore networks and transport parameters under drying and wetting processes. Vadose Zone J. 2022, 21, e20205. [Google Scholar] [CrossRef]
- Katuwal, S.; Arthur, E.; Tuller, M.; Muldrup, P.; de Jonge, L.W. Quantification of soil pore network complexity with X-ray computed tomography and gas transport measurements. Soil Sci. Soc. Am. J. 2015, 79, 1577–1589. [Google Scholar] [CrossRef]
- Trachsel, S.; Kaeppler, S.M.; Brown, K.M.; Lynch, J.P. Shovelomics: High throughput phenotyping of maize (Zea mays L.) root architecture in the field. Plant Soil 2011, 341, 75–87. [Google Scholar] [CrossRef]
- Wenzel, W.W.; Wieshammer, G.; Fitz, W.J.; Puschenreiter, M. Novel rhizobox design to assess rhizosphere characteristics at high spatial resolution. Plant Soil 2001, 237, 37–45. [Google Scholar] [CrossRef]
- Zappala, S.; Mairhofer, S.; Tracy, S.; Sturrock, C.J.; Bennett, M.; Pridmore, T.; Mooney, S.J. Quantifying the effect of soil moisture content on segmenting root system architecture in X-ray computed tomography images. Plant Soil 2013, 370, 25–45. [Google Scholar] [CrossRef]
- Gao, W.; Schlüter, S.; Blaser, S.R.G.A.; Shen, J.; Vetterlein, D. A shape-based method for automatic and rapid segmentation of roots in soil from X-ray computed tomography images: Rootine. Plant Soil 2019, 441, 643–655. [Google Scholar] [CrossRef]
- Phalempin, M.; Lippold, E.; Vetterlein, D.; Schlüter, S. An improved method for the segmentation of roots from X-ray computed tomography 3D images: Rootine v.2. Plant Methods 2021, 17, 39. [Google Scholar] [CrossRef]
- Teramoto, S.; Takayasu, S.; Kitomi, Y.; Arai-Sanoh, Y.; Tanabata, T.; Uga, Y. High-throughput three-dimensional visualization of root system architecture of rice using X-ray computed tomography. Plant Methods 2020, 16, 66. [Google Scholar] [CrossRef] [PubMed]
- Douarre, C.; Schielein, R.; Frindel, C.; Gerth, S.; Rousseau, D. Transfer learning from synthetic data applied to soil-root segmentation in X-ray tomography images. J. Imaging 2018, 4, 65. [Google Scholar] [CrossRef]
- Smith, A.G.; Han, E.; Petersen, J.; Olsen, N.A.F.; Giese, C.; Athmann, M.; Dresbøll, D.B.; Thorup-Kristensen, K. RootPainter: Deep learning segmentation of biological images with corrective annotation. New Phytol. 2022, 236, 774–791. [Google Scholar] [CrossRef] [PubMed]
- Flavel, R.J.; Guppy, C.N.; Tighe, M.; Watt, M.; McNeill, A.; Young, I.M. Non-destructive quantification of cereal roots in soil using high-resolution X-ray tomography. J. Exp. Bot. 2012, 63, 2503–2511. [Google Scholar] [CrossRef]
- Schmidt, S.; Bengough, A.G.; Gregory, P.J.; Grinev, D.V.; Otten, W. Estimating root-soil contact from 3D X-ray microtomographs. Eur. J. Soil Sci. 2012, 63, 776–786. [Google Scholar] [CrossRef]
- Metzner, R.; Eggert, A.; van Dusschoten, D.; Pflugfelder, D.; Gerth, S.; Schurr, U.; Uhlmann, N.; Jahnke, S. Direct comparison of MRI and X-ray CT technologies for 3D imaging of root systems in soil: Potential and challenges for root trait quantification. Plant Methods 2015, 11, 17. [Google Scholar] [CrossRef]
- Flavel, R.J.; Guppy, C.N.; Rabbi, S.M.R.; Young, I.M. An image processing and analysis tool for identifying and analysing complex plant root system in 3D soil using non-destructive analysis: Root1. PLoS ONE 2017, 12, e0176433. [Google Scholar] [CrossRef]
- Revol-Muller, C.; Peyrin, F.; Carrilon, Y.; Odet, C. Automated 3D region growing algorithm based on an assessment function. Pattern Recogn. Lett. 2002, 23, 137–150. [Google Scholar] [CrossRef]
- Mairhofer, S.; Zappala, S.; Tracy, S.; Sturrock, C.; Bennett, M.J.; Mooney, S.J.; Pridmore, T.P. Recovering complete plant root system architectures from soil via X-ray μ-computed tomography. Plant Methods 2013, 9, 8. [Google Scholar] [CrossRef]
- Radcliffe, D.E.; Šimůnek, J. Soil Physics with HYDRUS, 1st ed.; CRC Press: Boca Raton, FL, USA, 2010; pp. 1–16. [Google Scholar]
- Lindquist, W.B.; Lee, S.-M.; Coker, D.A.; Jones, K.W.; Spanne, P. Medial axis analysis of void structure in three-dimensional tomographic images of porous media. J. Geophys. Res.-Sol. Ea. 1996, 101, 8297–8310. [Google Scholar] [CrossRef]
- Hamamoto, S.; Moldrup, P.; Kawamoto, K.; Sakaki, T.; Nishimura, T.; Komatsu, T. Pore network structure linked by X-ray CT to particle characteristics and transport parameters. Soils Found. 2016, 56, 676–690. [Google Scholar] [CrossRef]
- Lucas, M.; Schlüter, S.; Vogel, H.-J.; Vetterlein, D. Roots compact the surrounding soil depending on the structures they encounter. Sci. Rep. 2019, 9, 16236. [Google Scholar] [CrossRef] [PubMed]
- Burr-Hersey, J.E.; Ritz, K.; Bengough, G.A.; Mooney, S.J. Reorganisation of rhizosphere soil pore structure by wild plant species in compacted soils. J. Exp. Bot. 2020, 71, 6107–6115. [Google Scholar] [CrossRef] [PubMed]
- Phalempin, M.; Lippold, E.; Vetterlein, D.; Schlüter, S. Soil texture and structure heterogeneity predominantly governs bulk density gradients around roots. Vadose Zone J. 2021, 20, e20147. [Google Scholar] [CrossRef]
Disclaimer/Publisher’s Note: The statements, opinions and data contained in all publications are solely those of the individual author(s) and contributor(s) and not of MDPI and/or the editor(s). MDPI and/or the editor(s) disclaim responsibility for any injury to people or property resulting from any ideas, methods, instructions or products referred to in the content. |
© 2025 by the authors. Licensee MDPI, Basel, Switzerland. This article is an open access article distributed under the terms and conditions of the Creative Commons Attribution (CC BY) license (https://creativecommons.org/licenses/by/4.0/).