Article

Spatial Distribution of Cadmium in Avocado-Cultivated Soils of Peru: Influence of Parent Material, Exchangeable Cations, and Trace Elements

1
Dirección de Supervisión y Monitoreo en las Estaciones Experimentales Agrarias, Instituto Nacional de Innovación Agraria (INIA), Av. La Molina 1981, Lima 15024, Peru
2
Facultad de Ciencias Ambientales, Universidad Científica del Sur (UCSUR), Lima 15067, Peru
*
Author to whom correspondence should be addressed.
Agriculture 2025, 15(13), 1413; https://doi.org/10.3390/agriculture15131413
Submission received: 22 May 2025 / Revised: 21 June 2025 / Accepted: 24 June 2025 / Published: 30 June 2025
(This article belongs to the Section Agricultural Soils)

Abstract

Potentially toxic elements such as cadmium (Cd) in agricultural soils represent a global concern due to their toxicity and potential accumulation in the food chain. However, our understanding of cadmium’s complex sources and the mechanisms controlling its spatial distribution across diverse edaphic and geological contexts remains limited, particularly in underexplored agricultural regions. Our study aimed to assess the total accumulated Cd content in soils under avocado cultivation and its association with edaphic, geochemical, and geomorphological variables. To this end, we considered the total concentrations of other metals and explored their associations to gain a better understanding of Cd’s spatial distribution. We analyzed 26 physicochemical properties, the total concentrations of 22 elements (including heavy and trace metals such as As, Ba, Cr, Cu, Hg, Ni, Pb, Sb, Se, Sr, Tl, V, and Zn and major elements such as Al, Ca, Fe, K, Mg, and Na), and six geospatial variables in 410 soil samples collected from various avocado-growing regions in Peru in order to identity potential associations that could help explain the spatial patterns of Cd. For data analysis, we applied (1) univariate statistics (skewness, kurtosis); (2) multivariate methods such as Spearman correlations and principal component analysis (PCA); (3) spatial modeling using the Geodetector tool; and (4) non-parametric testing (Kruskal–Wallis test with Dunn’s post hoc test). Our results indicated (1) the presence of hotspots with Cd concentrations exceeding 3 mg·kg−1, displaying a leptokurtic distribution (skewness = 7.3); (2) dominant accumulation mechanisms involving co-adsorption and cation competition (Na+, Ca2+), as well as geogenic co-accumulation with Zn and Pb; and (3) significantly higher Cd concentrations in Leptosols derived from Cretaceous intermediate igneous rocks (diorites/tonalites), averaging 1.33 mg kg−1 compared to 0.20 mg·kg−1 in alluvial soils (p < 0.0001). The factors with the greatest explanatory power (q > 15%, Geodetector) were the Zn content, parent material, geological age, and soil taxonomic classification. These findings provide edaphogenetic insights that can inform soil cadmium (Cd) management strategies, including recommendations to avoid establishing new plantations in areas with a high risk of Cd accumulation. Such approaches can enhance the efficiency of mitigation programs and reduce the risks to export markets.

1. Introduction

Contamination with potentially toxic elements (PTEs) in agricultural soils is a growing environmental and public health concern worldwide [1,2]. These elements, including cadmium (Cd), lead (Pb), and zinc (Zn), are naturally present in soils, with their concentrations varying depending on their geological origin [3]. However, anthropogenic activities, including mining, intensive agriculture, and industrial processes, have markedly elevated these levels [4,5]. Among these PETs, Cd is particularly notable for its high toxicity, strong bioaccumulation potential, and environmental persistence [6], posing a significant risk when it enters the food chain [7].
In the Peruvian context, avocados (Persea americana) have become a consolidated and important agricultural export product [8]. However, the presence of Cd in avocado-growing soils represents an emerging challenge. In 2025 alone, the European Union’s Rapid Alert System for Food and Feed (RASFF) issued nine notifications regarding the cadmium levels in Peruvian avocados exceeding the maximum permissible limit (0.05 mg Kg−1), resulting in product recalls in several European countries. This issue is not exclusive to Peru; other avocado-exporting countries such as Colombia and the Dominican Republic have also faced similar notifications due to Cd exceedances in their shipments to the EU [9]. Recent studies in other producing areas have reported high concentrations of this metal, even in areas with no obvious anthropogenic sources [10], suggesting that the parent material may be the main determining factor. This is particularly relevant, considering that plants can absorb Cd and accumulate it in their fruits [11], which affects both food safety and the commercial value of the crop.
The spatial distribution of PTEs in agricultural systems is influenced by a complex set of factors, including edaphic properties (pH, texture, cation exchange capacity), geological features, and management practices [12,13]. To analyze these patterns, researchers have developed methodological approaches ranging from classical spatial interpolation techniques [14] to advanced tools such as Geodetector [15]. Nevertheless, the complexity of the sources and mechanisms controlling the spatial distribution of PTEs in the agricultural soils of the arid and semi-arid regions along the Peruvian coast—particularly those engaged in avocado cultivation—remains poorly characterized. Knowledge gaps persist regarding the mechanisms driving the accumulation of PTEs, such as Cd, in soils with a basic pH, the role of the underlying lithology and geological age on cadmium’s spatial distribution, and the interactions between Cd and other elements such as Zn, Pb, and Na under these edaphic conditions [15,16].
Our study aimed to fill these gaps through an innovative approach that combined geochemical analysis using inductively coupled plasma mass spectrometry (ICP-MS) to quantify the total content of Cd and 21 additional elements (including trace and heavy metals such as As, Ba, Cr, Cu, Hg, Ni, Pb, Sb, Se, Sr, Tl, V, and Zn and major elements such as Al, Ca, Fe, K, Mg, and Na), multivariate statistics (PCA, Spearman correlations), and advanced spatial modeling (Geodetector). This work represents the first systematic effort to understand the Cd accumulation patterns in avocado-growing soils in Peru, integrating geochemical, edaphic, and spatial approaches for the first time in the context of the Peruvian coast and contributing to the broader understanding of Cd’s sources, distribution, and associated risks, which have gained significant relevance for the scientific community and policy makers [17,18].
The specific objectives included characterizing the distribution patterns of Cd in soils from avocado plantations across different regions of Peru, identifying the most influential edaphic and geological factors in its accumulation, and establishing criteria for risk zoning based on the parent material. The relevance of this research lies in its potential to inform sustainable soil management strategies for high-value commercial crops, thereby contributing to both food security and the competitiveness of Peruvian agricultural exports. The findings will be particularly valuable for designing more efficient sampling protocols, prioritizing areas for remediation programs, and developing technical guidelines for site selection for future avocado plantations.

2. Materials and Methods

2.1. Study Area

A total of 410 soil samples were collected from agricultural areas dedicated to avocado (Persea americana) cultivation in the departments of Ancash, Ayacucho, Cusco, Huancavelica, Ica, La Libertad, and Lima (Figure 1). The samples represented a wide diversity of soil and climatic conditions, vegetation coverage, soil taxonomic classes, and types of parent material, including residual igneous, sedimentary, and transported soils (alluvial, eolian, fluvial, and glacial).

2.2. Soil Sampling

We adopted the soil sampling model proposed by Havlin et al. [19], in which each soil sample represents an agricultural unit with similar crop, topographic, and agronomic management characteristics. The sampling units (SUs) were defined according to different boundaries. The slope boundary provided a distinction between hillside and flat areas. The soil boundary divided areas with different textural classes and soil colors. The crop boundary divided areas with different rootstocks and planting ages. Finally, the area boundary ensured a maximum of 10 hectares per soil sample. After identifying the SUs, the sampling design was implemented, considering five avocado trees per homogeneous lot, with the trees being representative and randomly distributed throughout the plantation. An approximately 1 Kg sample per homogeneous batch was placed in an impermeable bag to avoid external contamination. Finally, the collection of the soil samples consisted of taking one sub-sample of soil per tree within the canopy projection at a depth of 30 cm. A total of 410 soil samples were collected from different avocado plantations in Peru.

2.3. Soil Analysis

The soil samples were analyzed in the facilities of the Soil, Water, and Foliar Laboratory Network of the National Institute for Agrarian Innovation (LABSAF-INIA). Prior to physicochemical analysis, the samples were pre-treated by air-drying them at temperatures below 40 °C and then sieved to obtain a fraction smaller than 2 mm, following procedures established by the International Organization for Standardization [20]. The characterization analysis used the following parameters and reference methodologies: the particle size distribution (sand, silt, and clay percentages), measured using the Bouyoucos density meter method [21]; the pH in a solution with a 1:1 soil-to-water ratio [22]; the electrical conductivity (EC) in a 1:5 soil-to-water aqueous extract [23]; the calcium carbonate equivalents, measured using an acid neutralization method [21]; the organic matter, total organic carbon, total carbon, and total nitrogen content of the soil, determined using an LECO CN828 elemental combustion analyzer; the available phosphorus (p) in neutral and acidic soils, measured using the Bray and Kurtz method [21]; the available potassium (K), determined following the method described by Bazán Tapia [24]; and the concentration of exchangeable bases (Ca2+, Mg2+, K+, and Na+) extracted with ammonium acetate and exchangeable acids (H+, Al3+) extracted with potassium chloride [21]. The effective cation exchange capacity (CECe) was calculated as the sum of the exchangeable cations. In addition, the bulk density (BD) and total CEC at pH 7 were obtained from the global digital soil mapping system SoilGrids [25], with a spatial resolution of 250 m. These data were extracted for the 0–15 cm and 15–30 cm depth intervals by downloading a file in TIFF format and extracting the values in Qgis.

2.4. Extraction and Processing of Geospatial Variables

In addition to the physicochemical parameters determined through laboratory analysis, a set of potential drivers influencing the spatial distribution of cadmium concentrations was selected based on a literature review and relevant research. These included the geoform type (GT), obtained from a 1:250,000-scale geomorphological map [26] which represented broad relief units that influenced the processes of element accumulation and runoff and was compatible with the regional scale of the study. The parent material (PM) and geological age (GA), both obtained at a 1:100,000 scale from a national geological map (from sheets 21 h to 271), provided necessary details to capture key lithological variations. The soil type (ST) was obtained at a 250 m resolution (approximately 1:250,000) from SoilGrids [25], which accurately reflects the general soil conditions and is well-suited for regional analysis. The life zone (LZ), obtained at a scale of 1: 100,000 from a life zone map [27], summarized broad ecological factors such as the climate and altitude, while the climate classification (CLI) obtained from a climate distribution map of Peru [28], although obtained at a more general scale (1: 400,000), provided a macro view of the climatic environment. The altitude (ALT), with a 30 m resolution, served to refine the spatial interpretations and compensate for the generalization inherent in the other layers.
The selected spatial scales were adjusted to match the territorial dimensions of the study, allowing for a clear representation of the environmental processes that may have influenced the cadmium distribution. Data were obtained from reliable sources and at appropriate levels of detail, given the nature of the phenomenon under investigation, thereby minimizing potential spatial inconsistencies. While some variation existed in the accuracy of the geospatial layers used, this was not expected to significantly impact the results, as the chosen resolutions were sufficient to properly identify the general patterns of the Cd distribution and the associated explanatory factors.

2.5. Univariate Statistical Analysis

Univariate descriptive statistical analysis was conducted using R software (version 4.4.1). Various tools and libraries were utilized to generate graphs and support the statistical analysis of the soil properties. The dataset was first imported directly from the clipboard using the read. delim () function. The numerical variables were selected using the select (where (is. numeric)) function from the dplyr package. Descriptive statistics were then calculated for each variable, including the mean, standard deviation, variance, coefficient of variation, skewness, kurtosis, minimum and maximum values, 25th (Q1) and 75th (Q3) percentiles, median, and the p-value significance from the Shapiro–Wilk normality test. These statistics were obtained using the summarise (across ()) function and subsequently rearranged into long and wide formats using functions from the tidyr package to facilitate better presentation and interpretation.

2.6. Multivariate Statistical Analysis

Non-parametric bivariate correlations among the numerical variables were evaluated using Spearman’s correlation coefficient, calculated using the rcorr () function from the Hmisc package. Spearman’s correlation coefficient (r) does not assume normality in the distribution of variables or linearity in their relationships, making it particularly suitable for the typically heterogeneous and skewed nature of soil data. The correlation matrix (r) and the associated p-value matrix were generated by transforming the numerical data into a matrix format. For visualization, the corrplot function was employed. Only statistically significant correlations (p < 0.01) were displayed, omitting those without significance.
To reduce the dimensionality and explore multivariate patterns among the evaluated edaphic variables, principal component analysis (PCA) was performed using the FactoMineR package, with visualization supported by factoextra. First, categorical variables were excluded, and only standardized numerical data were retained. Categorical study factors were converted into factor-type variables to facilitate easier visualization and for grouping purposes. The analysis included the assessment of the explained variances for each principal component (eigenvalues), as well as the individual contributions of the variables. The quality of representation (cos2) and the distribution of individuals within the factorial space were plotted, considering groupings according to the previously defined factors. Biplots with confidence ellipses were also generated to explore the potential latent structures associated with the soil classes. All graphical analyses were performed with ggplot2.

2.7. Application of Geodetector Algorithm Principle

The Geodetector (GD) is a statistical method designed to evaluate whether a geographical factor, such as a soil type or parent material, influences the spatial distribution of a dependent variable, such as the total cadmium concentration in the soil. It operates under a fundamental principle: if two variables (i.e., Cd and geoforms) exhibit similar geographical patterns, they are likely associated. A key advantage of the Geodetector is that it does not rely on strict assumptions about the data, enabling the exploration of the effects of interaction between two combined factors on the variable of interest. In this study, the Geodetector model developed by Wang et al. [29] was applied to analyze the spatial heterogeneity in the cadmium concentrations and to understand how certain factors influenced this pattern. This approach, based on variance partitioning statistics, quantifies the degree of spatial association between a continuous dependent variable and multiple categorical factors.
The model comprises four main components: the factor detector, ecological detector, risk detector, and interaction detector. The factor detector assesses whether a given factor is associated with the spatial distribution of a continuous variable by analyzing whether they share a similar spatial pattern that suggests a possible cause-and-effect relationship. For each factor analyzed, a power factor, ‘q’, is determined that quantifies its influence on the dependent variable, according to
q = 1 1 n σ H 2   i = 1 m   ( n D , i · σ H D , i 2 )
where D represents a categorized driving factor; m is the number of categories of the factor F; H determines the spatial distribution of the dependent variable; q is the power of the driving factor (D) over H; n represents the total number of samples and σ H 2 is the total variance of H in the study area; n D , i represents the number of samples in the ith layer of D; and σ H D , i 2 is the variance of H over the ith layer of D. The parameter q is quantified in the range of [0;1] [15], where a higher q-value indicates a greater influence [29].
The ecological detector enables the assessment and comparison of the influence of determinants to identify which factor has the most significant effect on the spatial distribution of the analyzed variable. This process is performed in a bivariate way using the F-test, according to
F = n C , p   n C , p 1   σ C , m 2 n D , p   n D , p 1   σ D , m 2
where F is the value of the F-test and n C , p and n D , p determine the number of samples of the determinant factors C and D within a stratum of the categorisation (p). σ C , m 2 and σ D , m 2 denote the variances reflecting the dispersion of the values of factors C and D.
The risk detector evaluates the differences in the mean values of a dependent variable across the categories (or strata) of a given factor using a t-test. As the magnitude of these differences increases, so does the factor’s influence on the dependent variable. The interaction detector can be used to examine how two factors (x1 and x2) jointly influence the cadmium accumulation in soils, identifying whether their interaction weakens or strengthens or whether they operate independently of each other. This is assessed by comparing q (x1 ∩ x2) with q(x1) and q(x2). If q (x1 ∩ x2) is less than min[q(x1), q(x2)], the interaction is non-linearly weakening. If it lies between min[q(x1), q(x2)] and max[q(x1), q(x2)], it is unilaterally weakening. If it exceeds max[q(x1), q(x2)], it is considered to be bi-directionally increasing. If it is greater than q(x1) + q(x2), the two factors are deemed to interact non-linearly and independently.

Factor Data Processing

Based on the findings from previous studies and considering the availability and accessibility of relevant data, a total of 18 factors were selected as potential determinants of the ecological risks associated with the total cadmium (Cd) content in avocado plantation soils in Peru. The evaluated soil properties included the soil type, particle size distribution (percentages of sand, silt, and clay), pH, organic matter content, available phosphorus (p), exchangeable sodium percentage (ESP), exchangeable calcium percentage (ECP), exchangeable potassium percentage (EPP), exchangeable magnesium percentage (EMP), and the total concentrations of lead (Pb), magnesium (Mg), and zinc (Zn).
Geomorphological (GT), geological (GA and PM), edaphic (ST), ecological (LZ), and climatic (climate distribution) variables were also incorporated into the analysis. The soil properties were obtained through laboratory analyses, while the remaining variables were derived from spatial databases in vector and raster formats and subsequently converted into polygons. These spatial variables, as part of the Geodetector analysis, were processed using geoprocessing tools in QGIS 3.40 (Bratislava). All the spatial layers were clipped to the area of interest and reprojected to the WGS 84/UTM Zone 18S coordinate reference system to ensure spatial consistency. To reduce the spatial noise, small or fragmented polygons were removed. Before categorization, the “dissolve” tool was used to group values that shared common attributes.
The driving factors were categorized using expert knowledge, national metrics, and classification algorithms such as Jenks natural breaks and quantile ranking. The application of the classification method was based on enhancing the magnitude of the “q” statistic [30]. Finally, the “Point Sampling Tool” plugin was used to extract the values of each variable at the sampling points, ensuring that each point was assigned a single value per variable, ready for analysis in Geodetector.

2.8. Statistical Analysis of Non-Parametric Comparison

Differences in the Cd concentrations between the groups defined by the factors ST, GA, and PM were evaluated using non-parametric statistical tests, given the absence of assumptions of normality and homogeneous variances. The Kruskal–Wallis test was initially used to identify the overall differences in the median total Cd content across the groups. When significant differences were detected (p < 0.05), post hoc multiple comparisons were conducted using Dunn’s test with Bonferroni correction to control for Type I errors, implemented using the dunnTest () function from the FSA package. These analyses enabled the identification of specific group pairs exhibiting significant differences. To illustrate these differences, significance letters were assigned to each factor level using the multcompLetters () function from the multcompView package, based on the adjusted p-values. The distribution of Cd by the group was visualized using box plots enhanced with individual data point dispersion (jitter), generated using the ggplot2 package.

2.9. Cartographic Mapping of Influencing Factors in Spatial Variability of Cd

Based on the results of the statistical analyses, thematic maps were generated to depict the categories within each factor that exhibited significantly different values in the cadmium distribution patterns. Map production was carried out using QGIS 3.40 (Bratislava). Attribute filters were applied to isolate significant classes, and a differentially categorized symbology was defined for the variables. Ambiguous scales were avoided, and contrast with the background was prioritized to enhance the interpretability.
All the maps adhered to the principles of thematic cartography, including a graphic scale, explanatory legend, and title. A minimum cartographic unit (MCU) was established to avoid displaying polygons with minimal areas, which would hinder visual interpretation. Contiguous polygons sharing the same category were generalized into a single unit when the thematic accuracy was not compromised. Particular attention was given to maintaining a clear visual hierarchy, minimizing the background graphic load while emphasizing significant areas. Accordingly, maps were produced for the Lima region using the factors with the highest explanatory power (q > 15% according to Geodetector): the parent material (PM), geological age (GA), geoform type (GT), soil type (ST), climate (CLI), and life zone (LZ).
The categories of each factor were weighted according to their respective q-values from the Geodetector analysis and subsequently combined using an additive index, spatially overlaid to identify areas with different levels of risk. This methodology enabled the classification of the spatial risk levels for the occurrence of elevated Cd levels in the Department of Lima. Areas with the highest overlap of high-risk categories were identified as zones of the most significant concern.

3. Results

3.1. Statistical Distribution of Cd and Edaphic Properties: Identification of Anomalies and Geochemical Heterogeneity

Table 1 and Table 2 present the results of the physicochemical, metal, and metalloid analyses of the 410 soil samples examined. The total Cd content in the soils ranged from 0.00 to 11.98 mg·kg−1, with a mean of 0.54 ± 1.00 mg·kg−1, a variance of 1.01, and a coefficient of variation (CV) of 185.09%. These findings indicate a high degree of spatial heterogeneity in the Cd accumulation in soils from avocado plantations in Peru.
The statistical behavior of Cd in the assessed soils exhibited extreme positive skewness, indicating a strongly right-skewed distribution. This distribution suggests that most of the sampling units contained low Cd levels, while a small subset displayed anomalously high concentrations.
Regarding the shape of the distribution, the high kurtosis value classifies it as extremely leptokurtic. This statistical behavior not only indicates a higher probability of the occurrence of extreme values compared to that of a normal distribution but also suggests that such extremes are not the result of random noise or stochastic fluctuations. Instead, they reflect recurrent and systematic patterns in the data.
In addition to the Cd content, several soil fertility-related variables, such as the electrical conductivity (EC), available phosphorus (Olsen p), total nitrogen, exchangeable calcium (Ca2+), exchangeable sodium (Na+), and effective cation exchange capacity (CECe), as well as specific cation ratios (Ca2+ + Mg2+/K+, Ca2+/Mg2+, and Mg2+/K+), also exhibited statistically anomalous distributions. These variables exhibited extreme positive skewness values, leptokurtic distributions, and coefficients of variation. The total content of metals and metalloids in the soil, reported in Table 2, including Mo, Ni, Ag, Pb, Se, Tl, Ca, Na, Zn, Sb, and Cr, displayed distributional characteristics comparable to those observed for Cd.

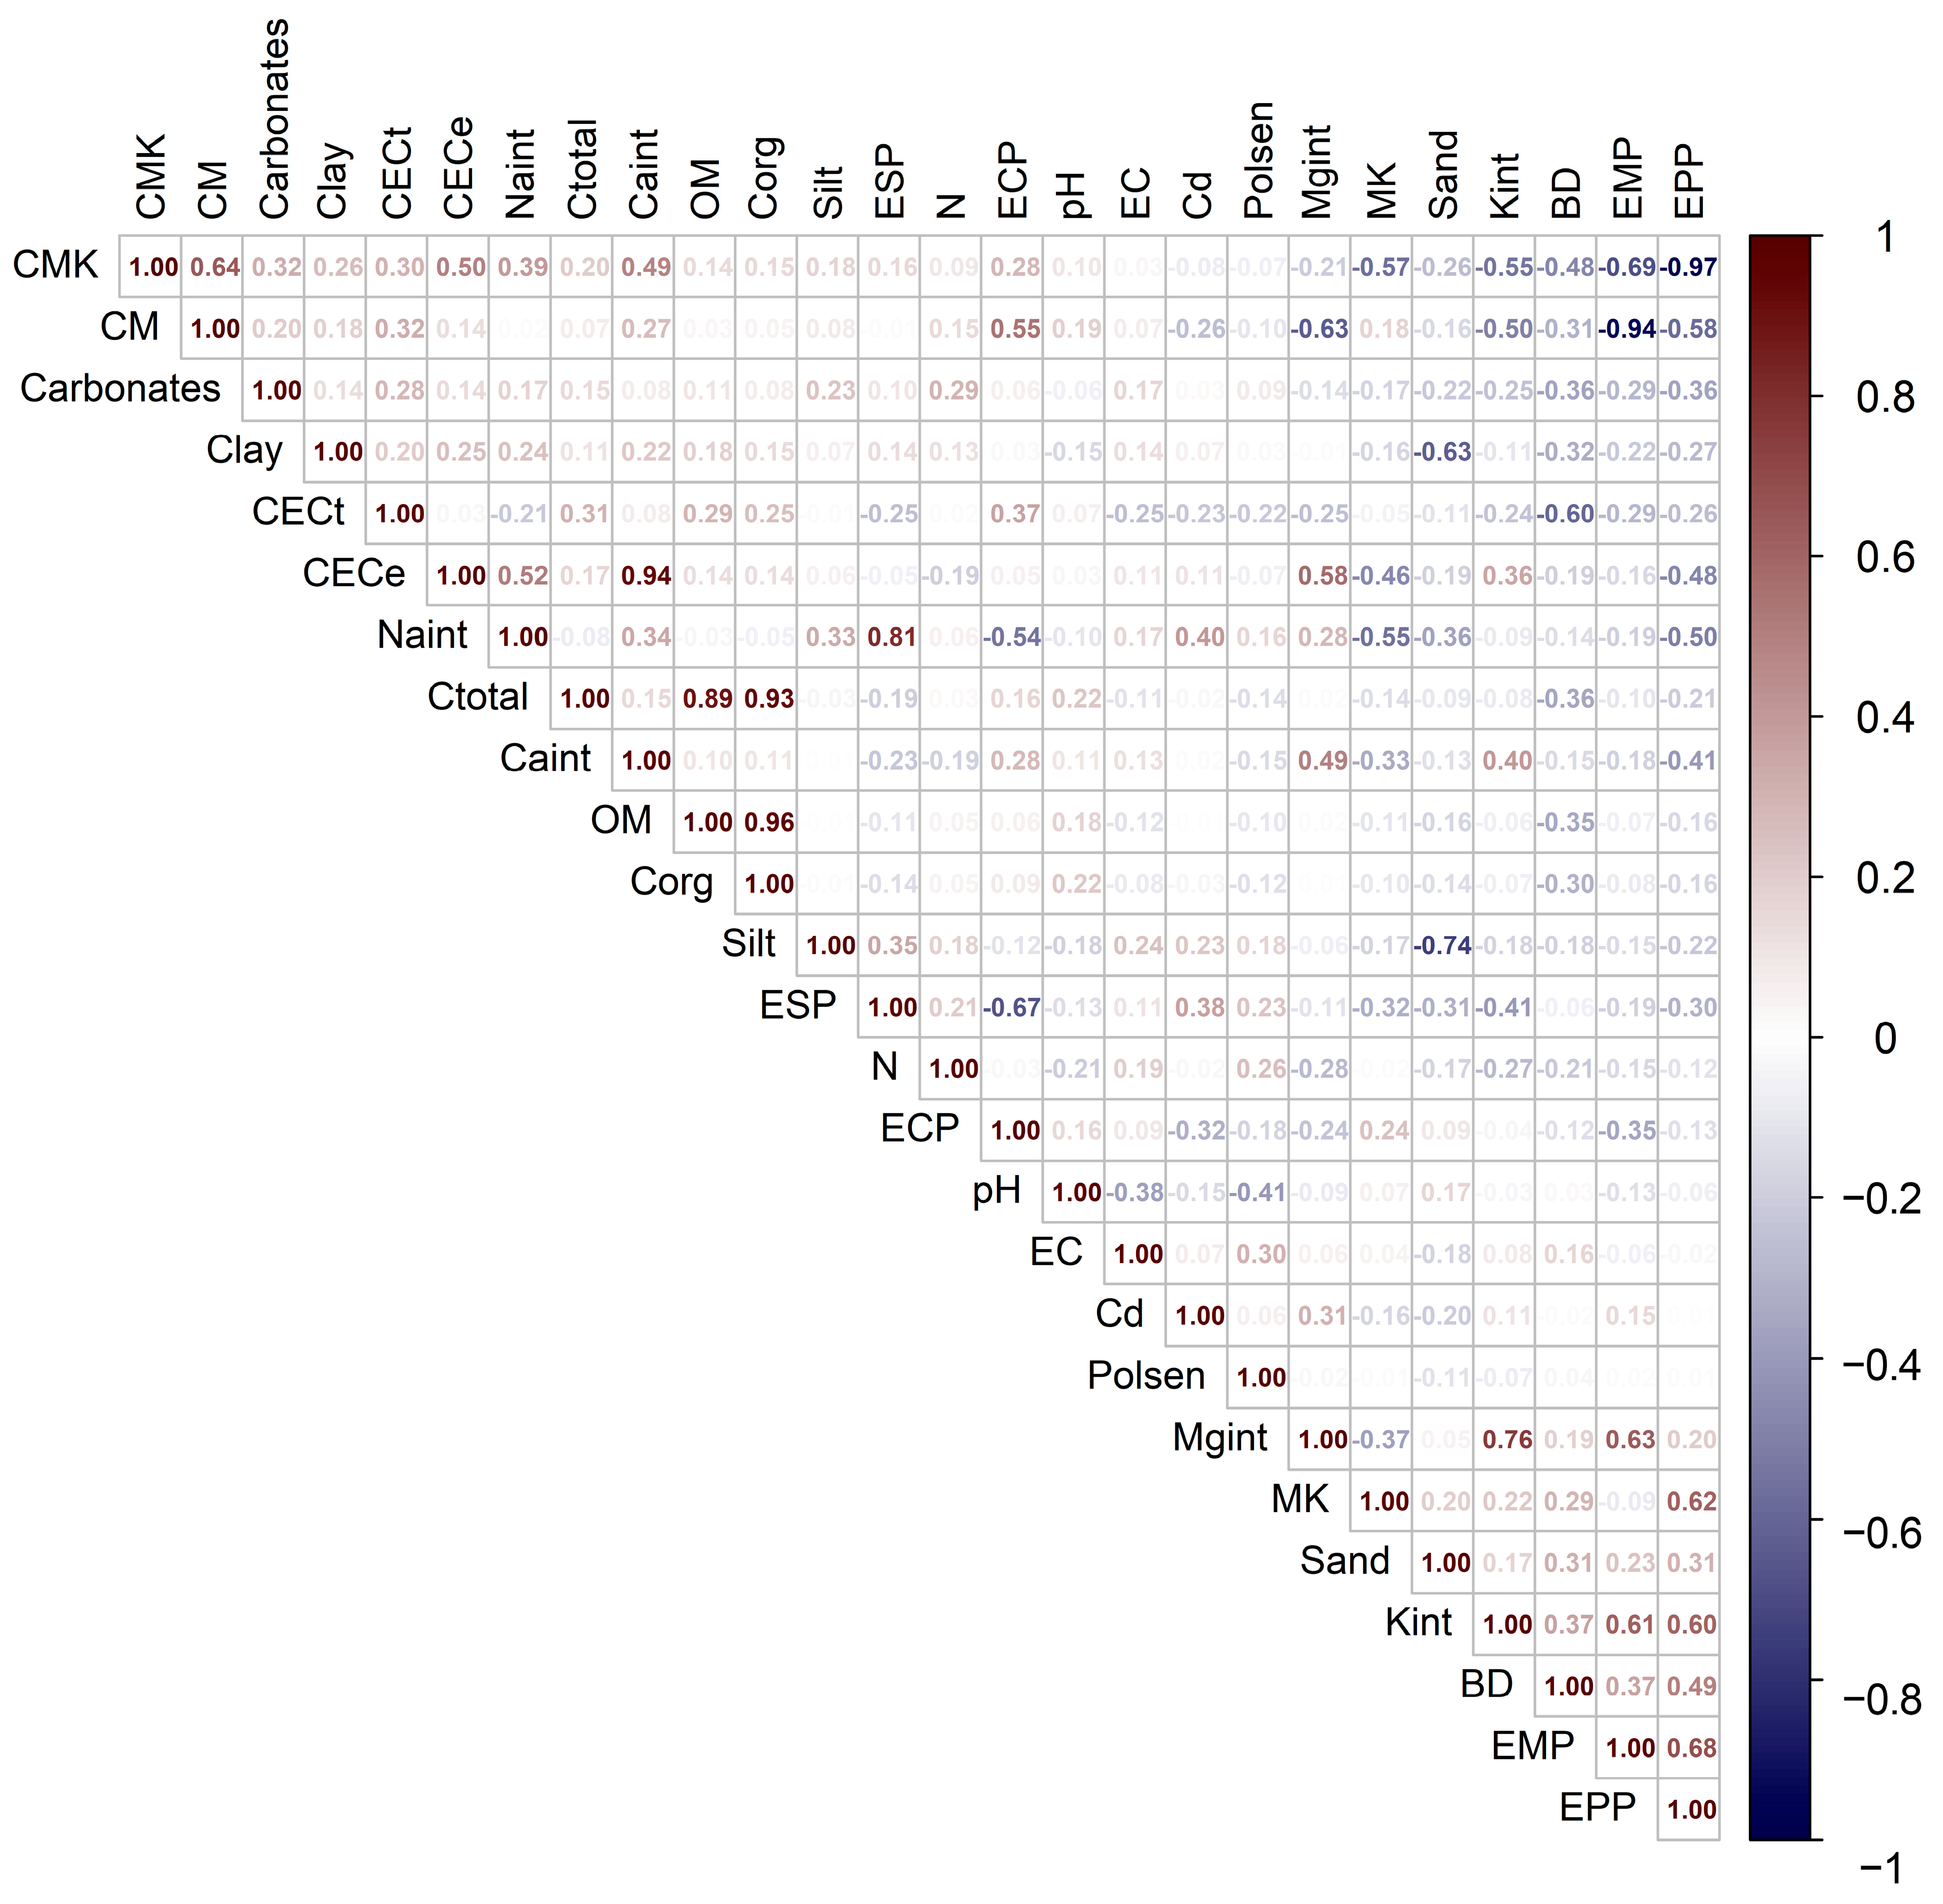
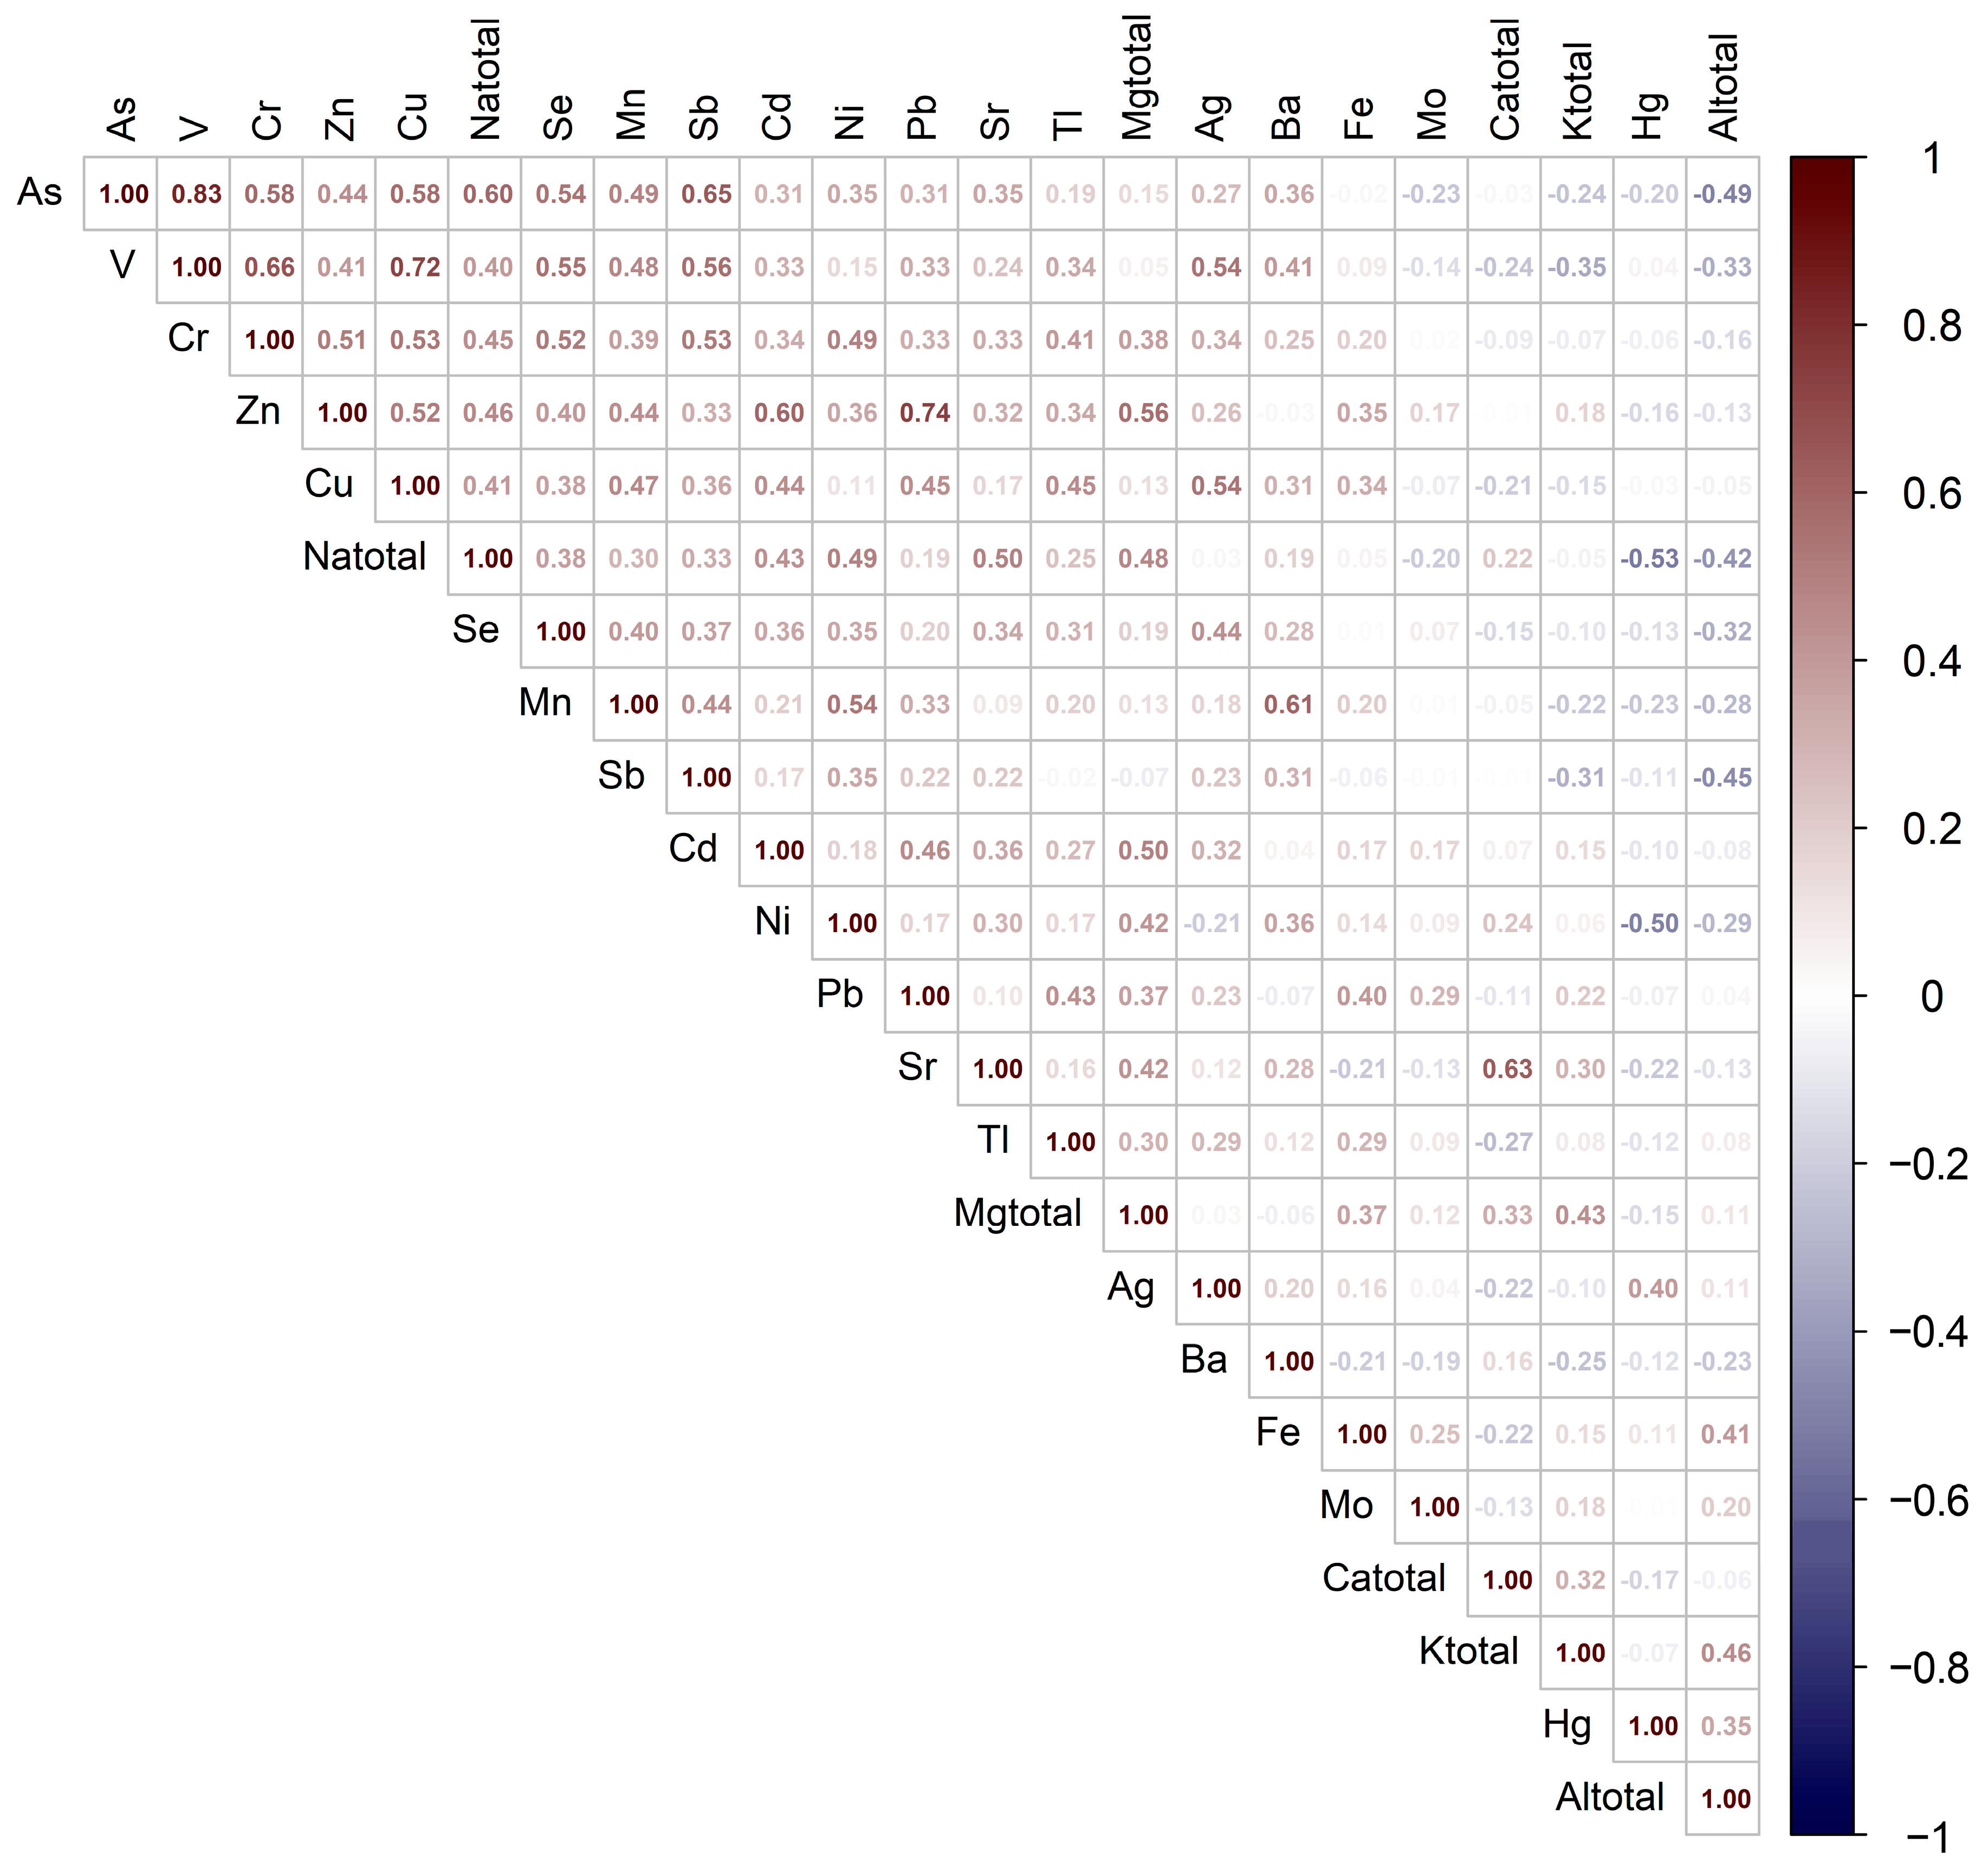
3.2. Non-Parametric Spearman Correlation Between Total Cd Content and Fertility Parameters and Total Metal Accumulation in Avocado Plantation Soils in Peru

Spearman correlation analysis was conducted to assess the non-parametric monotonic relationships between the cadmium (Cd) concentration and 26 soil physicochemical properties (Figure 2). The results revealed potential patterns of co-variance between the total Cd accumulation and edaphic factors associated with phenomena such as cation exchange and soil sodicity.
Moderate positive correlations (R > 0.30) were observed between Cd and Na+, ESP, and Mg2+, along with low but statistically significant positive correlations with the silt content and EMP. In contrast, moderate negative correlations were found with the ECP, and low negative correlations were found with the Ca2+/Mg2+ ratio, total cation exchange capacity (CECt), Mg2+/K+ ratio, sand content, and pH.
Figure 3 presents the Spearman correlations between the total Cd content and the total content of 22 metals and metalloids in the soil. The results indicate high positive correlations between Cd and Zn, Mg, Pb, Na, and Cu. Moderate positive correlations were also observed with Se, Sr, V, Cr, As, and Ag, with correlation coefficients ranging from 0.31 to 0.36. Additionally, low but statistically significant positive correlations were found with TI, Mn, Ni, Mo, Sb, Fe, and K, with values ranging from 0.15 to 0.27.
These associations, assessed using the non-parametric Spearman approach, reflect a systemic tendency for certain soil fertility and geochemical variables to co-vary with the Cd accumulation. The results provide strong evidence of joint multivariate behavior, in which processes such as cation exchange, sodicity, and geochemical co-accumulation positively regulate Cd concentrations. Conversely, in soils with ahigher pH and greater sand content, the Cd levels appear to be negatively regulated.

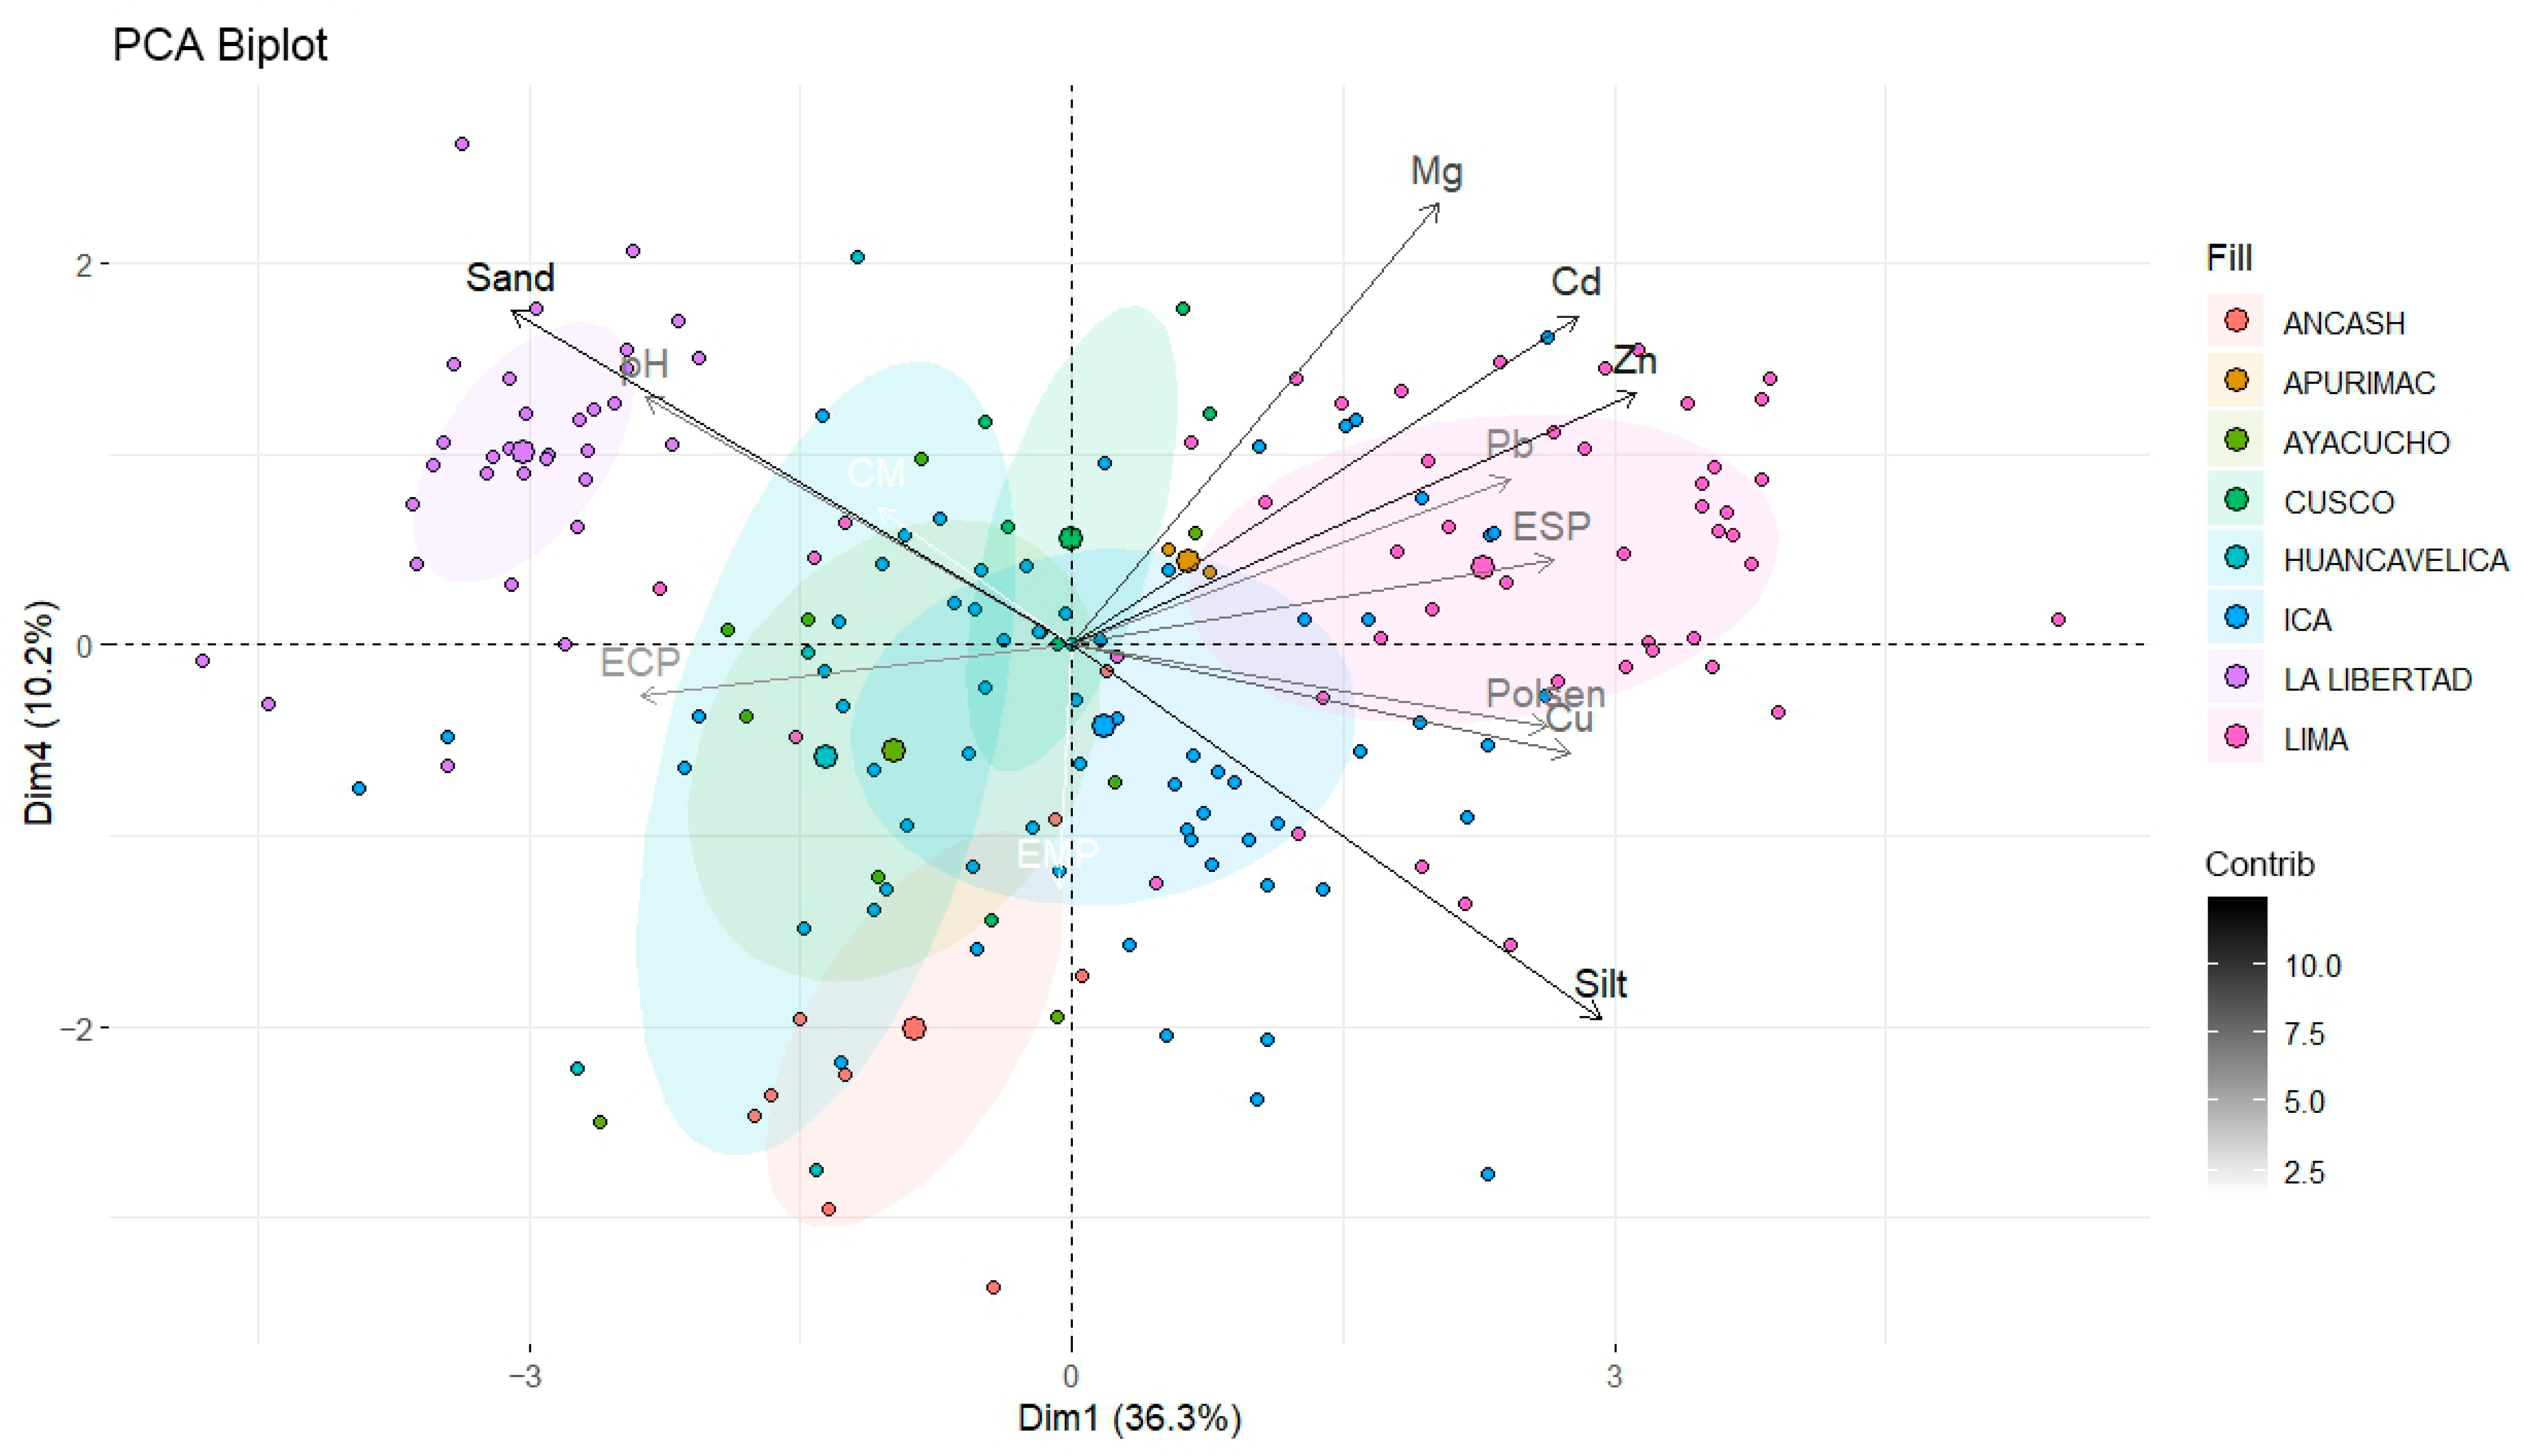
3.3. Principal Component Analysis of Fertility Parameters and Total Content of Metals Associated with Cd Accumulation in Avocado Plantation Soils in Peru

Principal component analysis (PCA) was conducted by selecting the variables with the highest correlations with the total soil Cd, thereby reducing the collinearity and transforming the variables to homogenize the variances. This approach accounted for 46.5% of the variance across components 1 to 4 (Figure 4). Component 4 was included in the analysis because Cd contributed more significantly to it than to components 2 and 3. The variables contributing most to the variance explained by component 1 were Zn, the sand content, the silt content, Cd, Cu, the exchangeable sodium percentage (ESP), and the available phosphorus. In contrast, the variables most strongly associated with component 4 were Mg, the sand content, the silt content, and Cd. These findings highlight the significant influence of primary mineral weathering processes in agricultural soils under avocado cultivation, resulting in the simultaneous release of metals and metalloids, including Zn, Cu, Mg, and Cd. Furthermore, the analysis underscores the importance of the variables that modulate Cd accumulation, particularly the sand and silt content, ESP, and pH.
The clustering analysis using ellipses, with the department of origin as a categorical variable, revealed notable patterns. The department of Lima (pink ellipse) showed a pronounced orientation to the right (Dim1) of the graph, influenced by the high values of Cd, Zn, Mg, and the ESP. In contrast, the departments of Huancavelica (light blue ellipse), Ayacucho (green ellipse), and Ancash (red ellipse) displayed considerable overlaps, with the centroids positioned closely together, indicating similar soil profiles among these regions. These three departments exhibited an inclination toward variables negatively associated with component 1, such as the pH, sand content, and ECP. However, the presence of both high- and low-Cd-content hotspots cannot be ruled out, as the proximity of their centroids to the origin of the biplot suggested a multivariate profile not determined by compositional extremes but by an intermediate balance of variables. In the case of Ica (blue ellipse), the ellipse was oval-shaped and parallel to Dim1, indicating low internal dispersion, but with multivariate similarity to the department of Lima, particularly in terms of its high contents of Cd, Zn, and Mg and ESP, with its silt content also contributing to this similarity. Lastly, the department of La Libertad (purple ellipse) was represented by a compact, circular ellipse of a small size, signifying low internal dispersion and high compositional homogeneity among the analyzed samples. Its centroid lay in the negative quadrant of Dim1, opposite to those of Lima and Ica, suggesting soils characterized by low total Cd concentrations and low ESP levels, alongside higher pH values and a greater sand content.

3.4. Application of Geodetector Model for Identifying Determinant Factors in Spatial Variability of Total Soil Cd in Avocado Plantations in Peru

Table 3 presents the results of the Geodetector analysis, highlighting the Zn and Mg content, life zone (LZ), soil parent material (SPM), climate, and geological age (GA) as the factors with the highest explanatory power regarding the spatial variation in the total soil Cd. These factors accounted for 27.88%, 26.20%, 25.54%, 23.38%, 20.73%, and 18.21% of the variation, respectively, all with high statistical significance (p < 0.01). However, no statistically significant differences were observed among these variables (Figure 5), suggesting that the spatial variability of the total soil Cd was likely driven by the combined effect of these variables, which implies the involvement of interrelated geological, geochemical, and climatic processes.
Additionally, the results indicate that the Pb content, soil type (ST), geomorphology (GT), exchangeable sodium percentage (ESP), and exchangeable calcium percentage (ECP) also contributed to the spatial variation in the soil Cd, with values of 15.53%, 14.81%, 11.60%, 10.28%, and 8.59%, respectively, all statistically significant (p < 0.01). Similarly to the most influential variables, these soil characteristics did not exhibit statistically significant differences among themselves (Figure 4), suggesting a combined effect on the spatial variation in Cd in soils under avocado cultivation. It is necessary to mention that these variables integrated characteristics related to the cation balance between Na and Ca, as well as their interaction with the Cd accumulation.
Other significant factors (p < 0.01), though with lower explanatory power, included the silt content (5.99%), sand content (5.46%), and available phosphorus (3.74%). However, the individual influence of these variables on the Cd accumulation was statistically equal. In contrast, variables such as the clay content, pH, and soil organic matter, although traditionally considered influential, showed low q-values of between 2.43 and 2.45%, with no significant differences (p > 0.05).

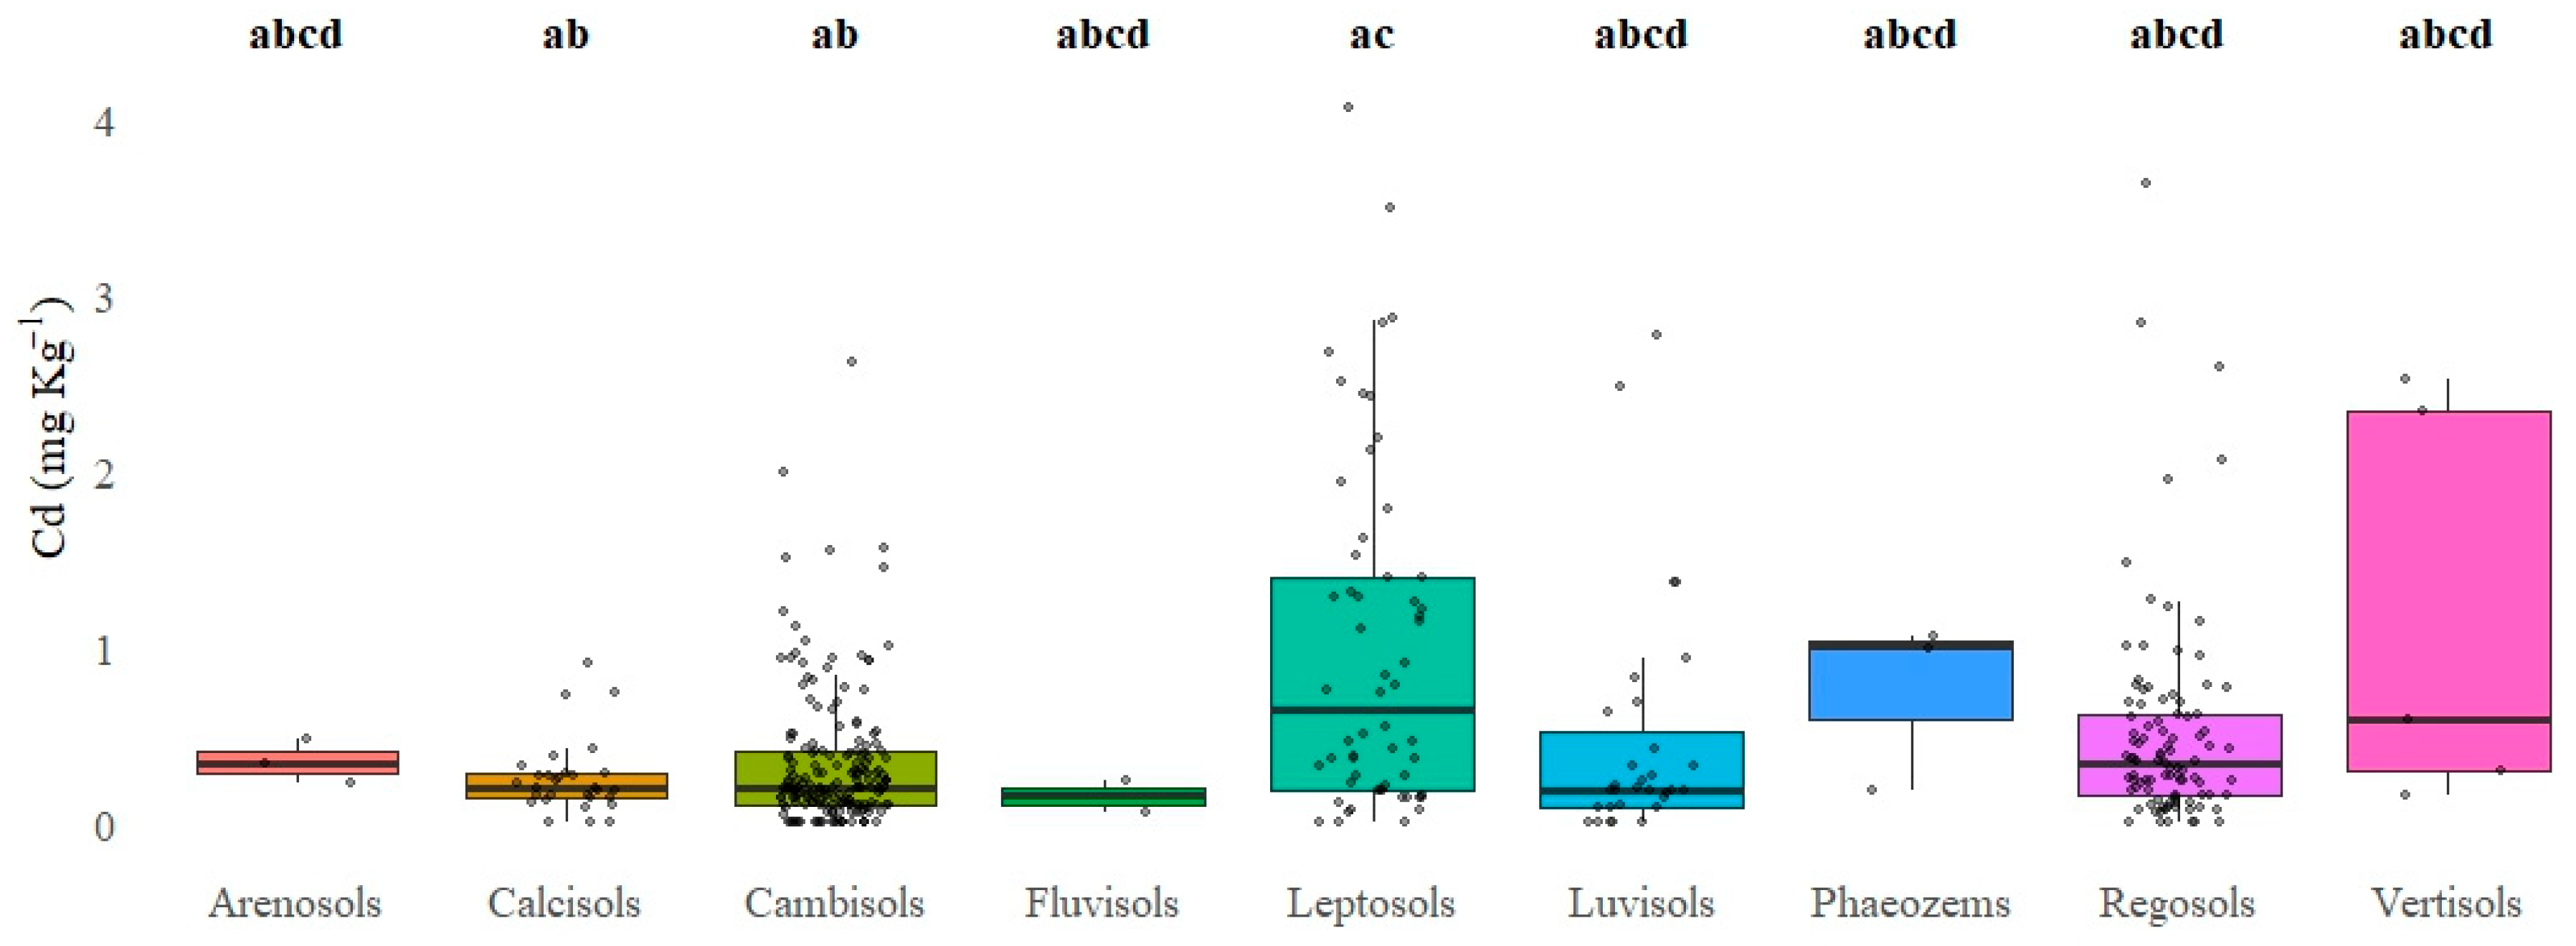
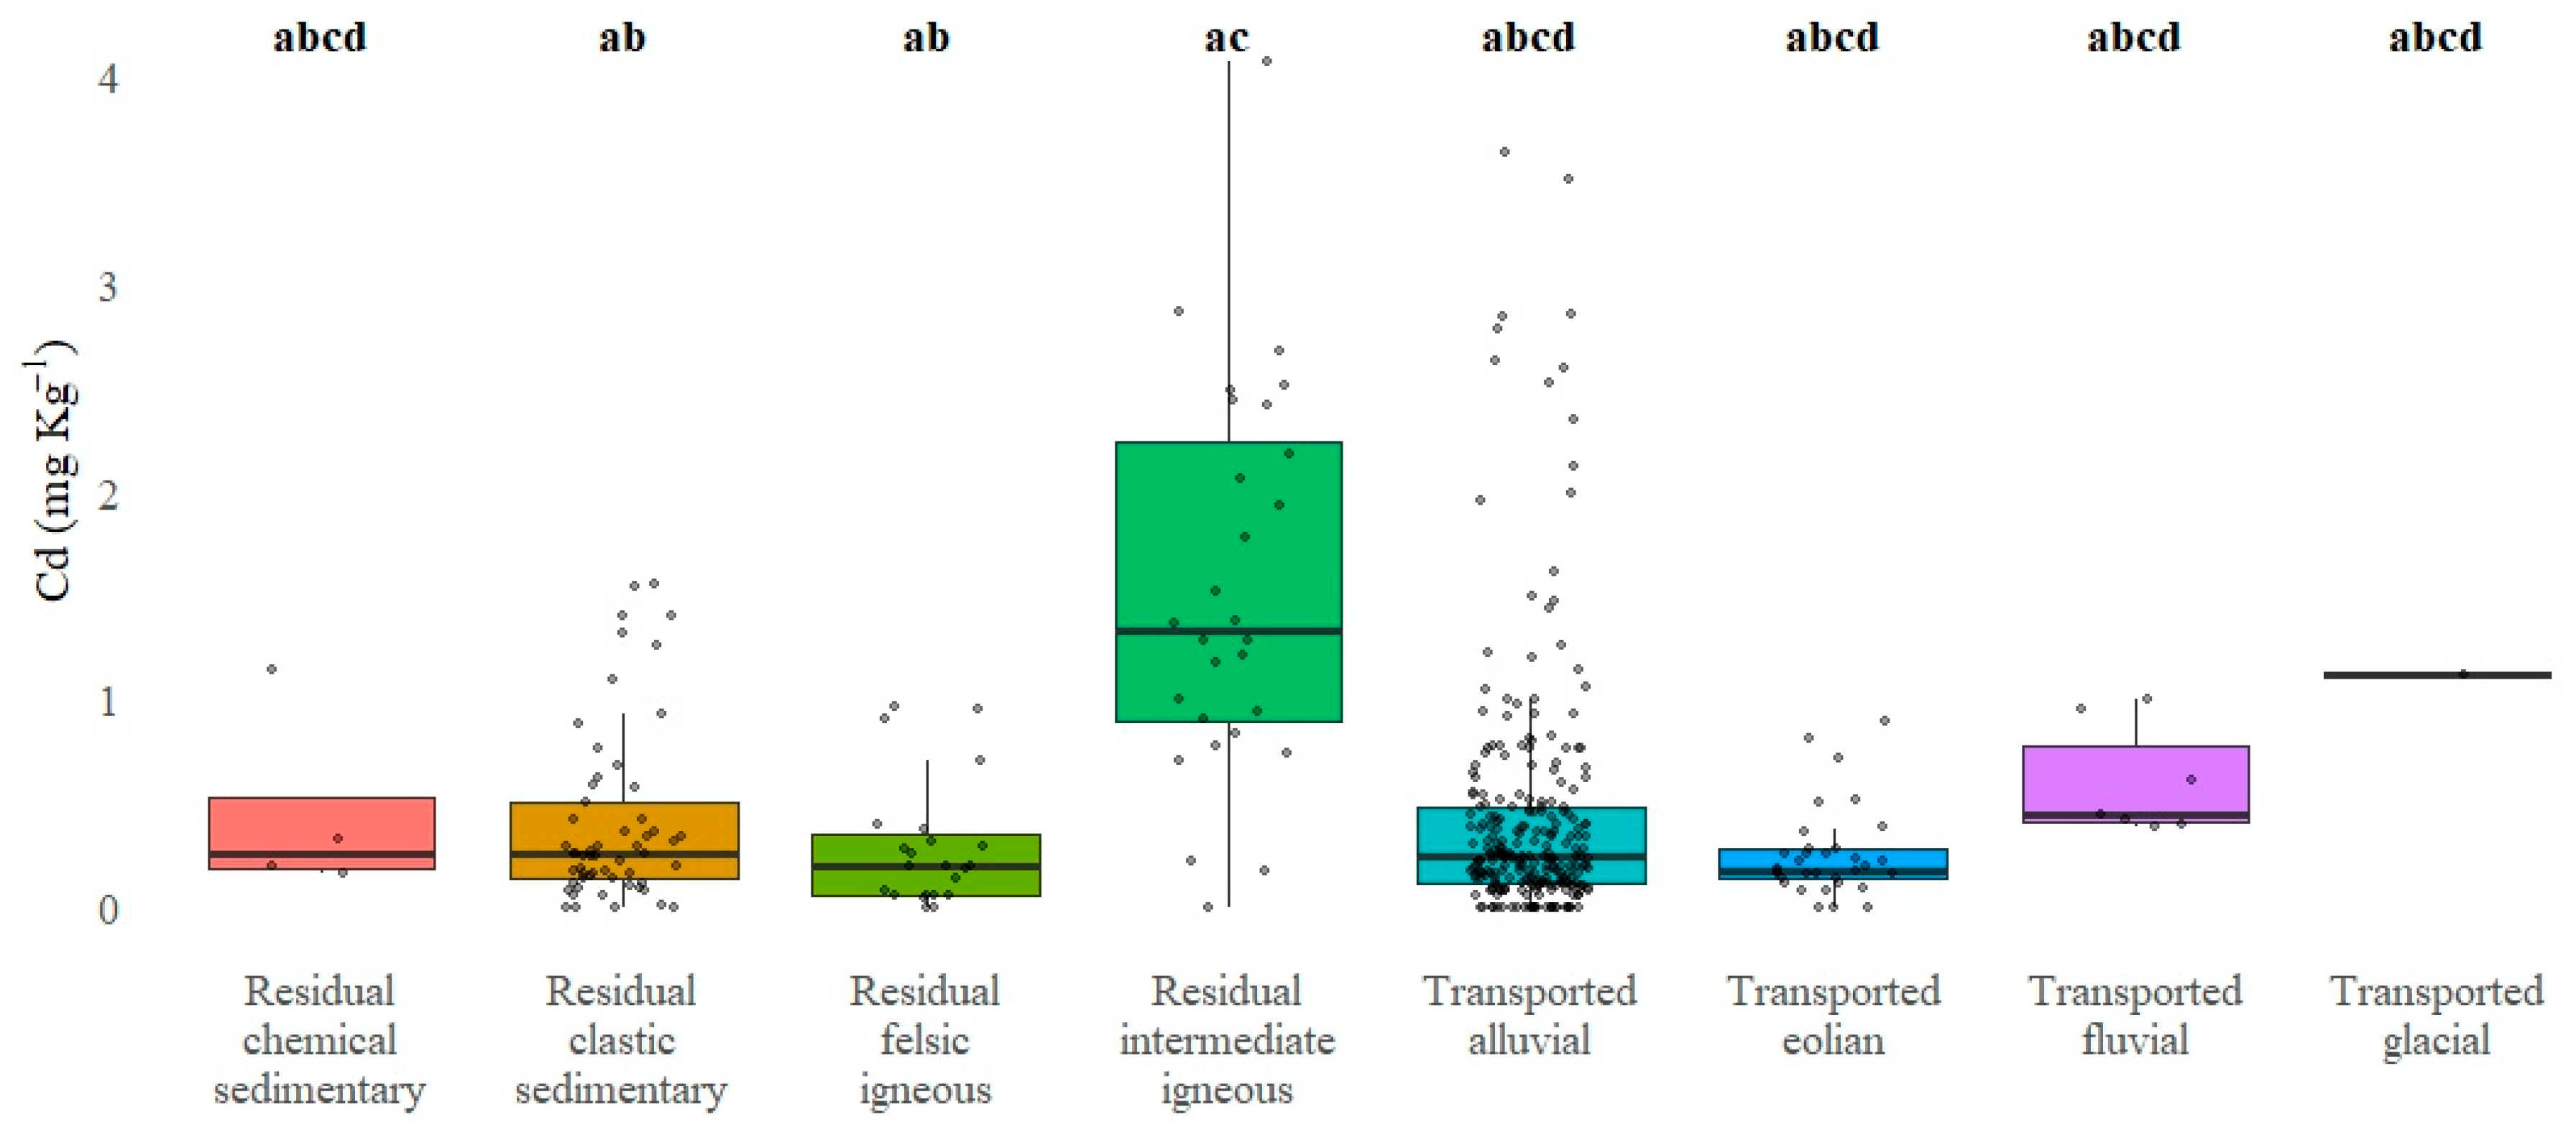
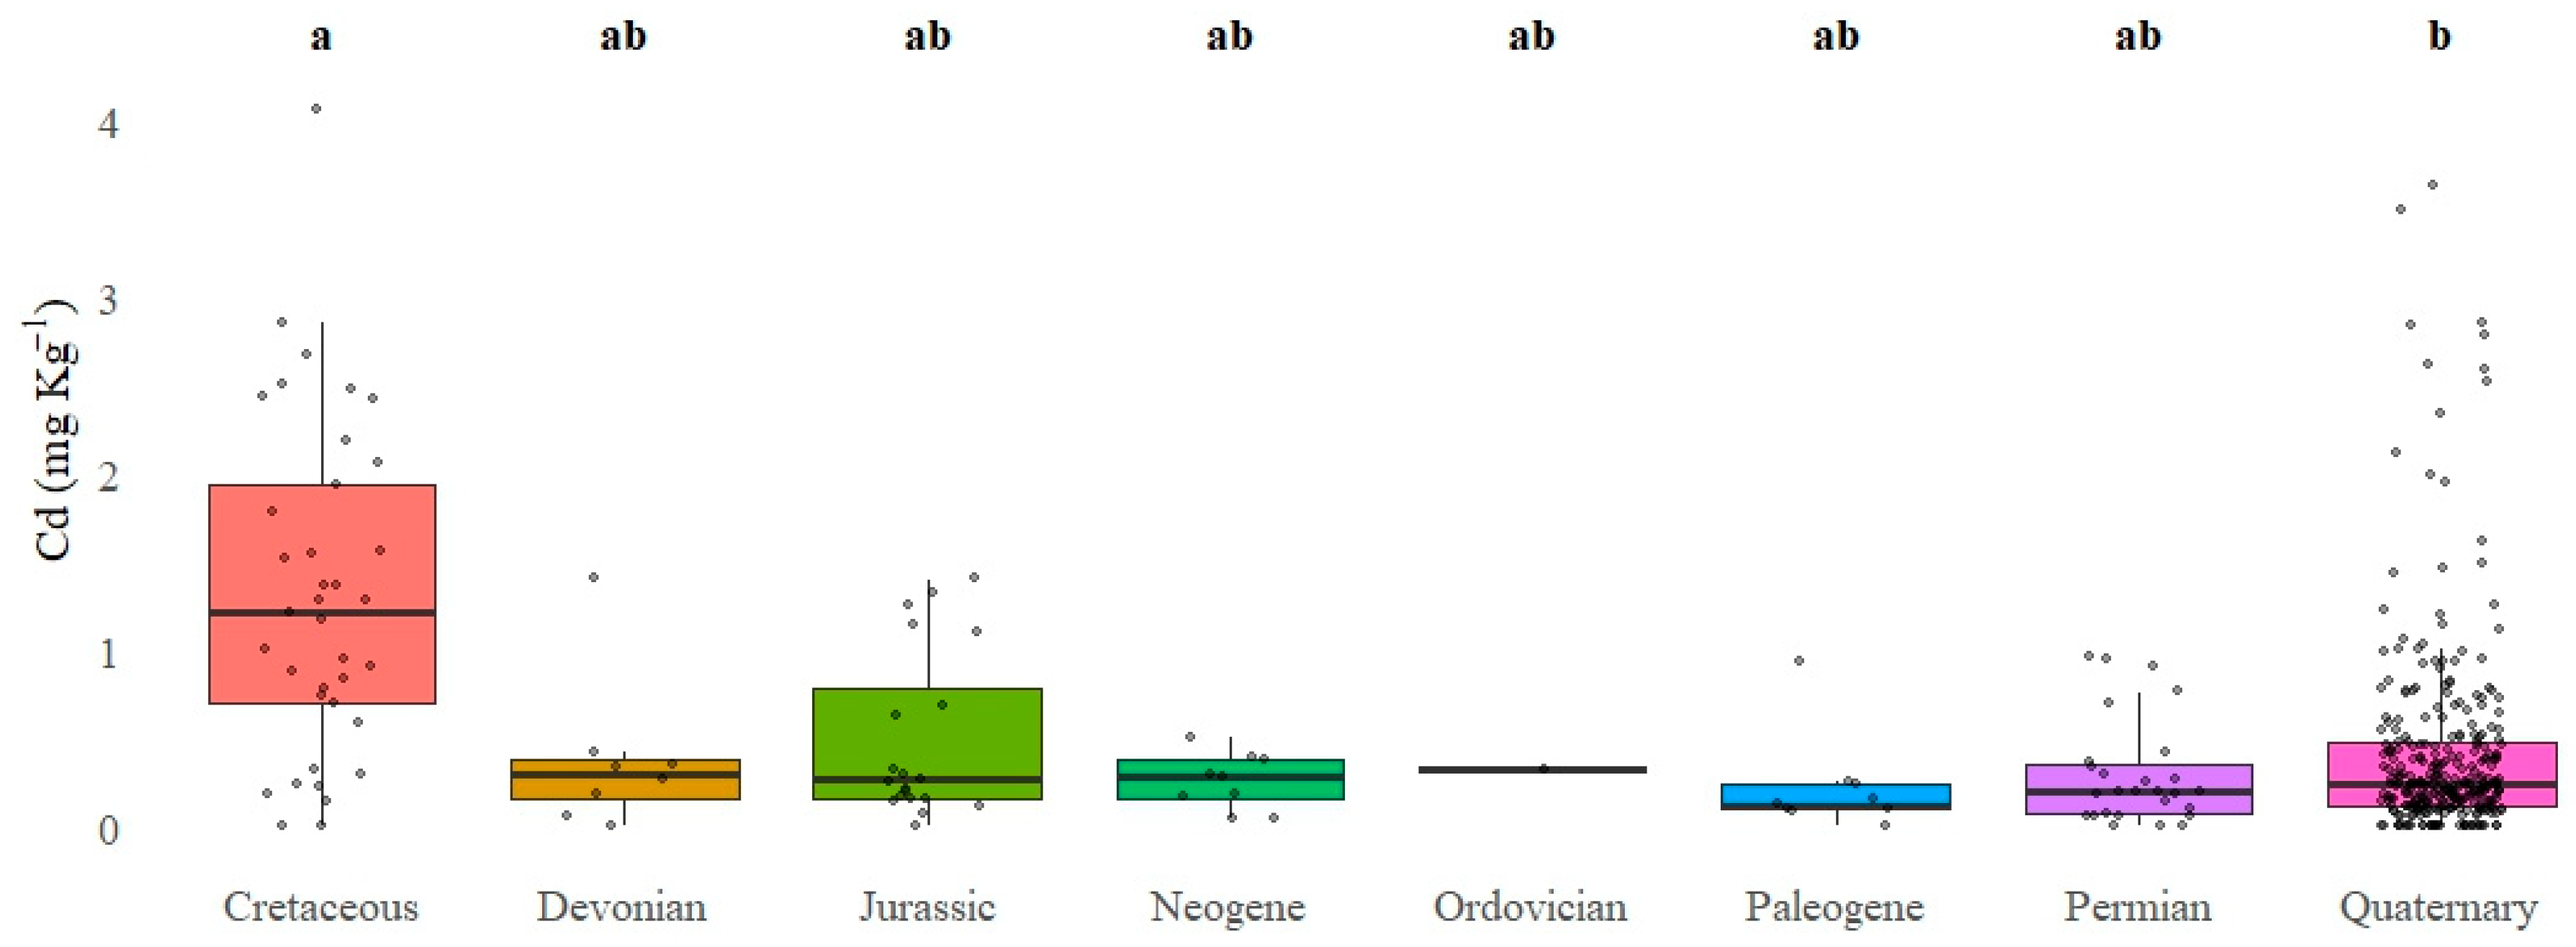
3.5. Non-Parametric Comparison of Total Cd Levels According to Parent Material of Origin, Taxonomic Type (Wrb) of Soil, and Geological Age of Parent Material in Soils Cultivated with Avocados

The Kruskal–Wallis test revealed significant overall differences in the Cd levels (mg·kg−1) among the different soil types (Figure 6). Post hoc analysis using Dunn’s test showed that Leptosols had significantly higher total soil Cd levels compared to Cambisols (medians: 0.64 vs. 0.20; z = 5.17; p-adj < 0.0001), Calcisols (0.64 vs. 0.20; z = 3.91; p-adj < 0.0001), and Luvisols (0.64 vs. 0.18; z = −3.35; p-adj = 0.03). These differences suggest that Leptosols, characterized by limited pedogenic evolution and potentially low contents of clay and stabilized organic matter, may promote Cd accumulation, in contrast to more developed soils or soils with a higher immobilization capacity. Although other soil types, such as Phaeozems and Vertisols, also exhibited high medians, the small sample sizes in these cases reduced the statistical significance, preventing the detection of real differences after conservative Bonferroni adjustment in Dunn’s test. These findings highlight the significance of the soil type as a crucial modulator of Cd’s geochemical behavior in avocado agroecosystems, indicating a strong interaction with factors related to the parent material and soil mineralogy.
Highly statistically significant differences in the total soil Cd concentrations were observed based on the origin of the parent material (Figure 7). Soils developed from residual parent material derived from intermediate igneous rocks exhibited the highest Cd levels (1.33 mg·kg−1), significantly exceeding those in soils from clastic sedimentary rocks (0.26 mg·kg−1; z = −5.41; p-adj < 0.0001) and felsic igneous rocks (0.20 mg·kg−1; z = 5.36; p-adj < 0.0001). Similarly, soils formed from residual parent material derived from intermediate igneous rocks also showed significantly higher values of accumulated Cd than soils with transported parent material of alluvial (0.24 mg·kg−1; z = −6.43; p-adj < 0.0001) and aeolian (0.18 mg·kg−1; z = −5.90; p-adj < 0.0001) origin.
Similarly, soils developed from glacially transported parent material exhibited a high median (1.12 mg·kg−1); however, due to the limited sample size and resulting low statistical power, no significant differences were detected compared to most other groups. In contrast, soils derived from aeolian-transported parent material showed the lowest Cd median (0.18 mg·kg−1), with no significant difference to most other groups (p-adj > 0.05). This behavior suggests that soils formed from intermediate igneous rocks, potentially enriched in primary amphibole group minerals such as hornblende, commonly found in intermediate igneous rocks like diorites and tonalites, may represent a significant geogenic source contributing to Cd accumulation in soils.
Regarding the geological age of the parent material, highly significant differences in the total Cd concentrations were observed in soils cultivated with avocados (Figure 8). In particular, soils developed from Cretaceous geological formations exhibited the highest Cd concentrations (1.21 mg·kg−1), significantly exceeding those associated with most other geological periods. The most pronounced differences were found in comparison with soils derived from Quaternary (0.24 mg·kg−1; z = −6.13; p-adj < 0.0001), Permian (0.20 mg·kg−1; z = −5.10; p-adj < 0.0001), and Paleogene (0.12 mg·kg−1; z = −4.29; p-adj < 0.0001) formations, all with strong statistical significance. Additionally, though more moderate, significant differences were observed to soils of Jurassic (0.26 mg·kg−1; z = −3.14; p-adj = 0.05) and Neogene (0.28 mg·kg−1; z = −3.20; p-adj = 0.04) origin.
On the other hand, although soils developed on Devonian, Ordovician, and Paleogene formations exhibited low Cd medians (0.30, 0.32, and 0.12 mg·kg−1, respectively), they did not significantly differ from those developed on Cretaceous formations (p-adj > 0.05). This lack of statistical significance may be attributed to limited statistical power, resulting from both small sample sizes and high intra-group variability.

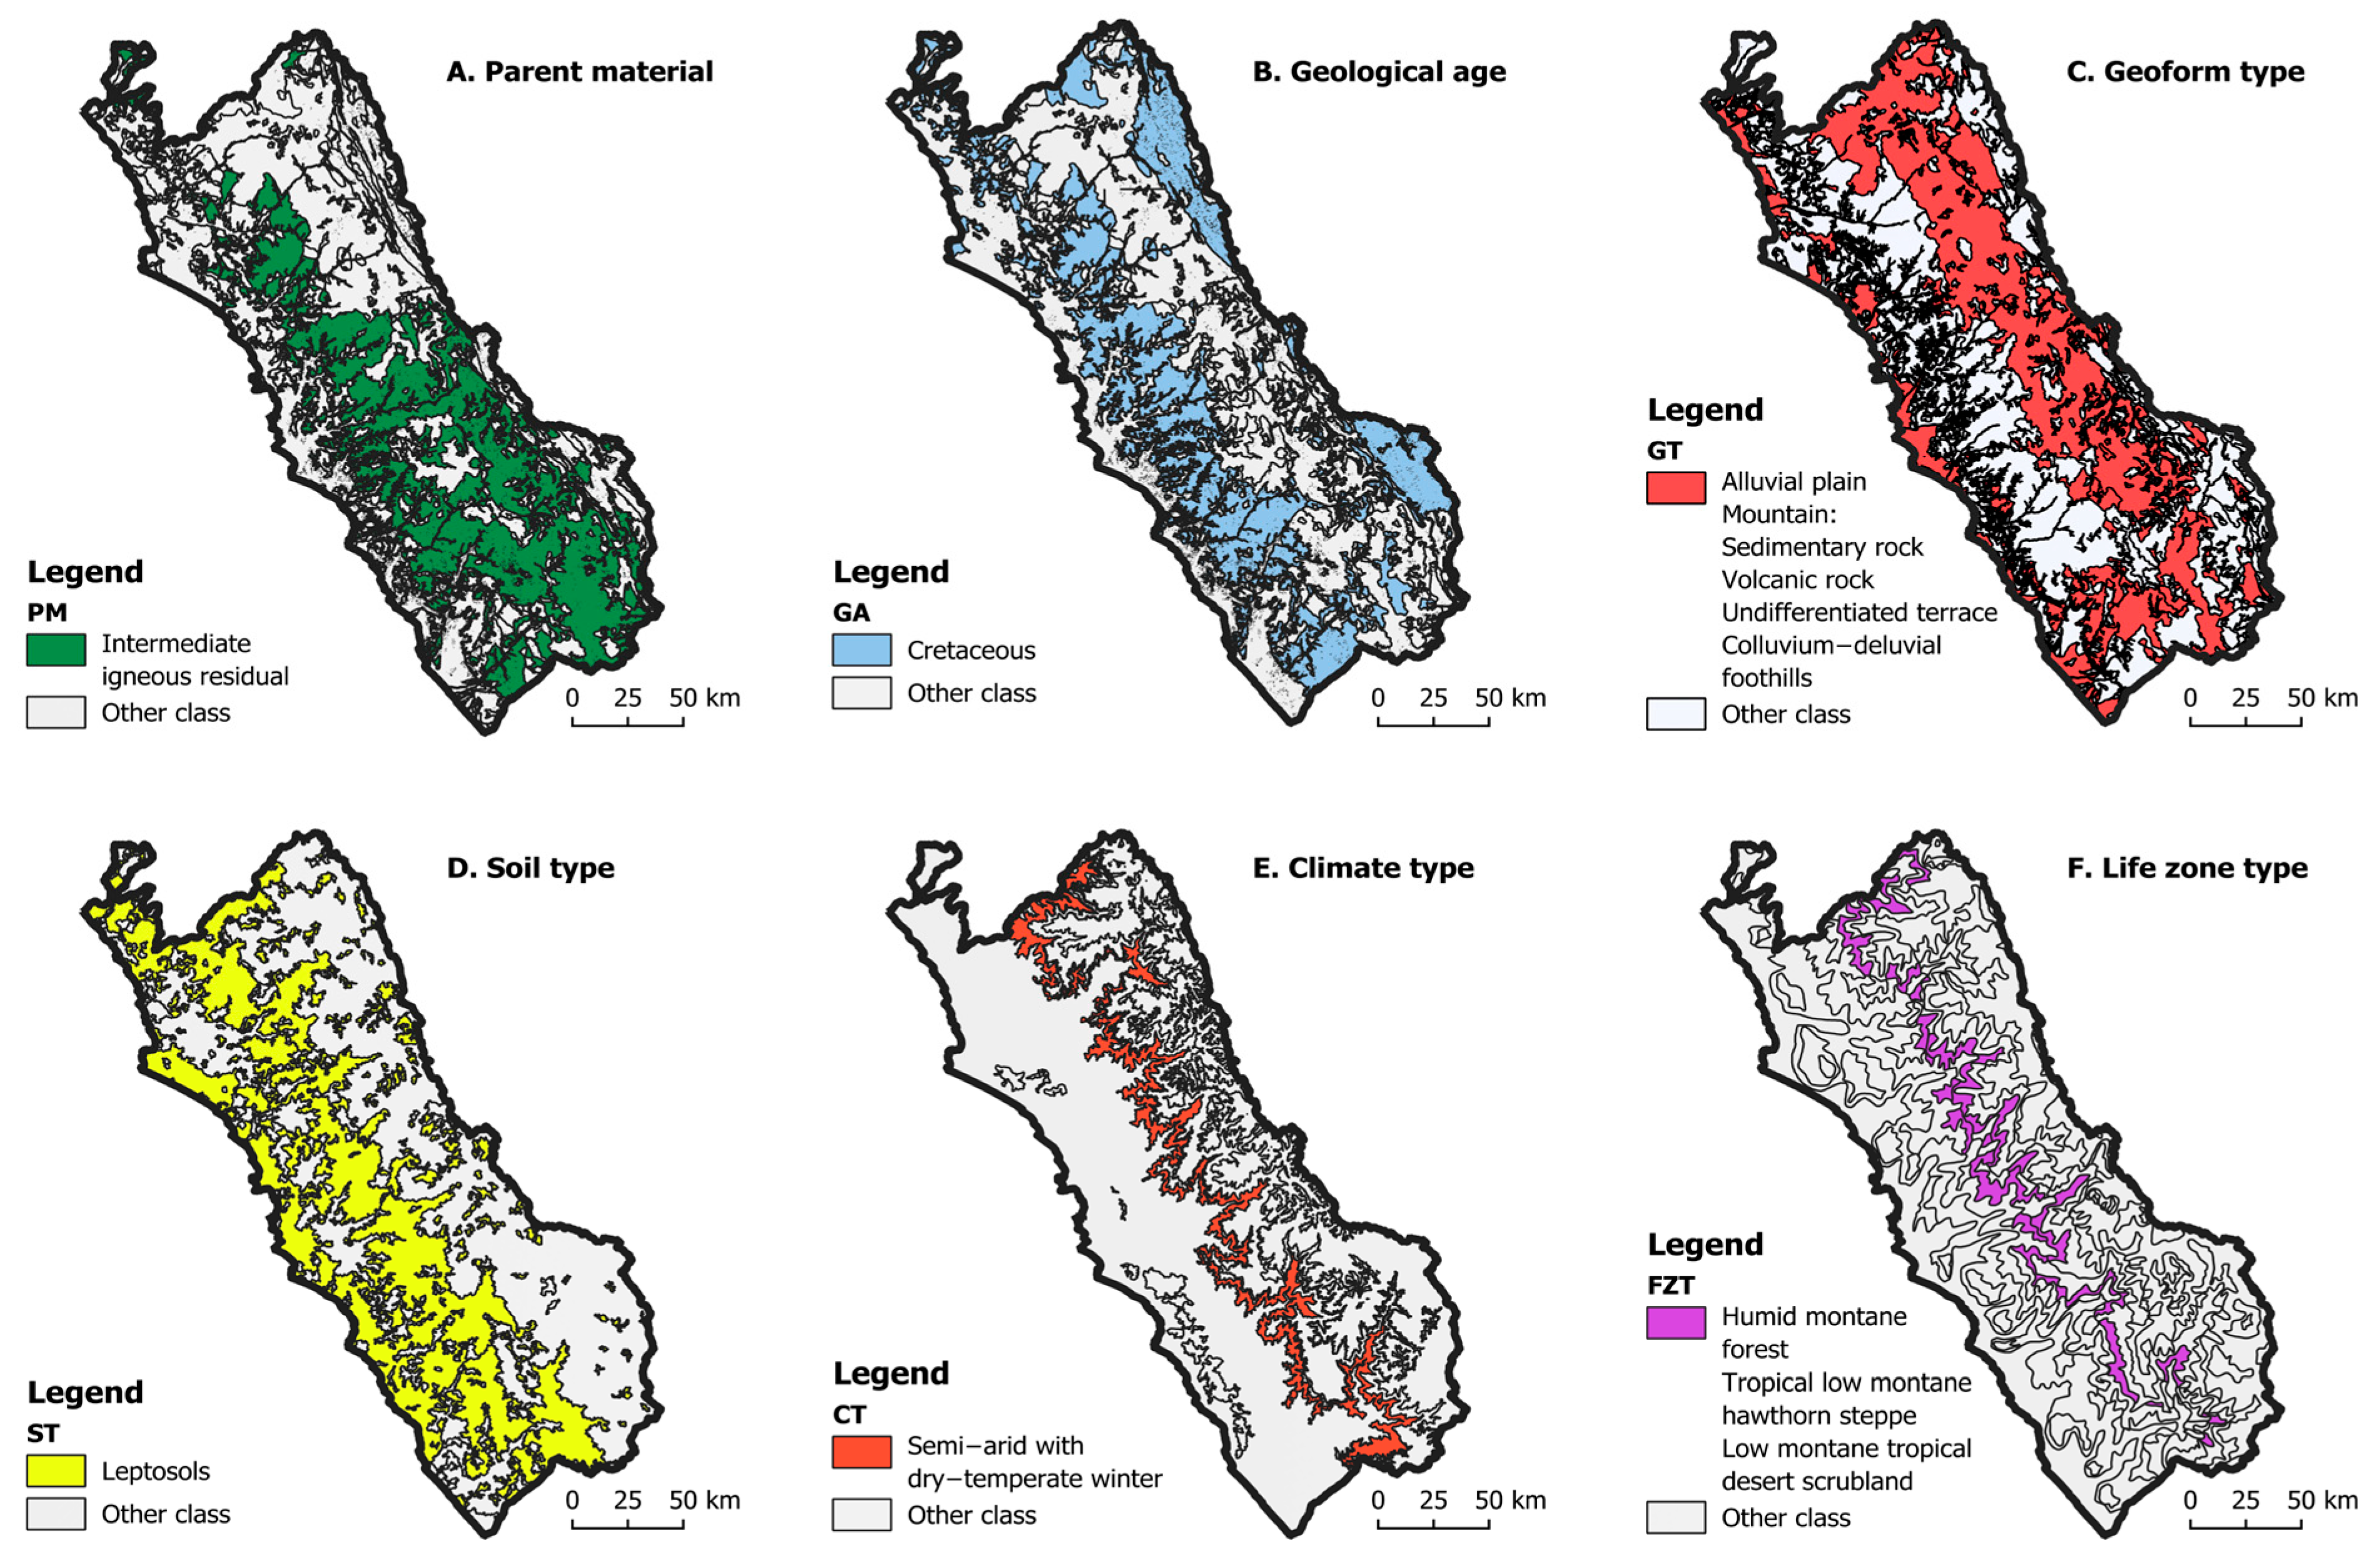
3.6. Spatial Representation of Influential Factors in Cadmium Distribution Based on Geodetector Analysis

Analysis using the Geodetector (GD) algorithm identified a statistically significant relationship between the spatial distribution of cadmium (Cd) in the soils and six categorical factors. By visually representing these factors—the parent material (PM), geological age (GA), geomorphological type (GT), soil type (TS), climate (CLI), and life zone (LZ)—it was possible to identify regions where specific classes exhibited higher average Cd concentrations compared to other categories within the same variable (Figure 9).
In terms of the parent material, soils developed on intermediate igneous rocks (r-ii) exhibited elevated cadmium levels. A similar spatial pattern was observed for certain Cretaceous geological formations, which overlapped with areas of higher Cd concentrations. Distinct associations were also found with specific soil types, particularly Leptosols, and ecological zones such as tropical humid montane forest (th-MF), tropical low montane hawthorn steppe (tl-MHS), and low montane tropical desert scrubland (lm-TDS). Additionally, the climatic category “semi-arid with dry-temperate winter” (D(i)B′) and certain geoform types, namely alluvial plains (p-aluv), sedimentary rock mountains (M-sr), volcanic rock mountains (M-vr), and undifferentiated terraces (T-u), were spatially associated with areas of increased Cd accumulation.
This visual interpretation is supported by the quantitative results for the q-statistic, which measured the extent to which each factor contributed to the spatial variability of Cd. The variables with the highest explanatory power were the life zone (LZ) and parent material (PM), with q-values of 0.26 and 0.23, respectively. These were followed by the climate (CLI) with q = 0.21 and geological age (GA) with q = 0.18. In practical terms, this indicates that approximately a quarter of the observed variation in the soil Cd levels can be attributed independently to each of these factors. All the q-values were statistically significant, providing robust support for their interpretation.
Figure 10 presents the potential risk map for the occurrence of elevated Cd accumulation values in soils across the agricultural areas of the Lima department, encompassing a total of 224,349.27 hectares. This map reflects the integrated effect of the most relevant categories from the key factors influencing the spatial variability of Cd. Four potential risk zones were identified and classified into levels: low, moderate, high, and very high. The majority of the agricultural area fell within the low-risk category (Category 1), covering approximately 175,106.35 hectares, which accounted for approximately 78.1% of the total area. This was followed by Category 2 (moderate risk), with 28,446.39 hectares (12.7%), Category 3 (high risk), with 14,262.29 hectares (6.4%), and Category 4 (very high risk), comprising 6534.24 hectares (2.9%).

4. Discussion

4.1. Geochemical Implications of Anomalous Cd Distributions and Their Association with Edaphic Variables in Avocado Plantations in Peru

The pronounced positive skewness and extreme leptokurtosis of the total Cd content in the soil of avocado plantations in Peru, which have a typical pH of 7.42 ± 0.43, indicate a high probability of the elevated occurrence of outliers in the Cd distribution. These findings highlight the need for targeted attention in affected areas, as even small portions of the cultivated land may exceed the permissible Cd limits for agricultural soils, which range from 1 to 3 mg·kg−1 [31].
This response is highly relevant for diagnosing areas with an elevated total soil Cd, as its occurrence is driven by systemic factors rather than random variation. The statistical evidence supports the existence of edaphic hotspots, induced by localized micro-environmental and geochemical processes, such as selective adsorption onto specific soil fractions or the influence of point sources of contamination [32].
Univariate statistical analysis also revealed that soil properties related to cation ratios (Na+, Ca2+, CEC, Ca2++Mg2+/K+, Ca2+/Mg2+, and Mg2+/K+), as well as the total accumulation of metals and metalloids (Zn, Pb, Na, Se, Cr, Ag, Tl, Ni, Mo, Sb, and Ca), exhibit heterogeneous behavior similar to that of Cd [33,34]. These findings suggest that these soil characteristics may be directly or indirectly modulating the spatial distribution of Cd. Consequently, the base cation saturation ratio and the geogenic co-accumulation of metals appear to play a significant role in shaping the Cd dynamics in avocado plantation soils in Peru.

4.2. Edaphic Mechanisms of Cd Accumulation: Insights from Multivariate Statistical Analysis

The Spearman’s correlation analysis and principal component analysis revealed positive correlations between the total Cd content and variables related to soil sodicity (Na+ and ESP), with soil sodicity also having a strong influence on the explained variance, suggesting that soils with high sodium saturation tend to accumulate more Cd. This finding is consistent with that of Zahedifar [35], who reported that sodic (0.5–0.96 mg·kg−1) and saline–sodic (2.8–3.6 mg·kg−1) soils exhibit higher total Cd accumulation compared to saline (0.2–0.44 mg·kg−1) and normal soils (0.4 mg·kg−1). In these soils, characterized by a high exchangeable Na+ content, the phenomenon of the colloidal dispersion of the clay–humic complex and soil aggregates predominates [36]. This process increases the exposure of negatively charged sites and reduces the cation selectivity at exchange sites, thereby promoting the adsorption of metal cations such as Cd [37].
Among the variables most positively correlated with Cd were Mg2+ and the EMP, while the Ca2+/Mg2+ ratio and ECP exhibited significant negative correlations. These results suggest that cationic competition between Na+ and Mg2+ against exchangeable Ca2+ may enhance Cd fixation in soil matrix constituents and increase its mobility into the soil solution [38]. The principal component analysis supported these findings because it identified the high influence of the total Mg content on the explained variance in the presence of soils with high Cd accumulation. It also reinforced the hypothesis of cationic competition between Ca2+ and Cd, given their similar elemental properties, such as their ionic radius (Cd2+ = 0.95 Å; Ca2+ = 0.99 Å) and divalent charge [39,40].
Low but statistically significant negative correlations were also observed between Cd and parameters such as the pH, total CEC, and sand content, along with a low positive correlation with the silt content. Regarding the pH, it is well established that this parameter influences the solubility and mobility of labile Cd in soils [41], and it is considered one of the most important predictor variables for Cd bioaccumulation in crops [42]. Specifically, Cd becomes more soluble under acidic soil conditions and tends to precipitate as cadmium carbonate or hydroxide under alkaline soil conditions [43]. However, in the present study, the total soil Cd accumulation was determined through chemical digestion followed by analysis using inductively coupled plasma mass spectrometry (ICP-MS). This technique quantifies Cd across all the soil phases, including Cd adsorbed on ion exchange complexes, bound to Fe, Mn, and Al oxides, associated with soil organic matter, incorporated into primary and secondary minerals, and precipitated as salts or insoluble complexes [44]. Consequently, this methodology does not measure the soluble or labile Cd; nor does it distinguish the chemical forms of Cd speciation. Therefore, the correlation between the pH and total Cd content is weak; however, this does not preclude the possibility that soils with parent material derived from alkaline rocks may have a lower Cd content.
Cadmium accumulation has also been shown to depend on the soil particle size distribution [31]. In our principal component analysis, the sand and silt contents emerged as prominent variables, explaining a significant proportion of the influence of component 1 on the explained variance in these soils. Our results indicate that soils with a higher silt content tend to accumulate more Cd than those with a higher sand content. Although previous studies have reported that soils with a greater proportion of fine particles (<2 µm) adsorb 1.2 to 1.4 times more Cd than those with a higher proportion of coarse particles [31], our findings in avocado plantation soils in Peru reveal that the silt content (particles between 2 and 20 µm) has a greater influence on the total Cd accumulation than the clay content. This may be attributed to silt functioning as a primary Cd reservoir, potentially through the formation of surface complexes with carbonates originating from the weathering of plagioclase [45]. Conversely, the observed negative correlation between the sand content and Cd accumulation can be explained by the enhanced vertical migration of Cd in sandy soils. A higher sand content is typically associated with greater soil aeration and more alkaline conditions, both of which increase Cd’s mobility, facilitating its leaching into deeper soil layers [46].
The Spearman correlations between the total Cd concentrations and the total contents of 22 metals and metalloids in the soil revealed systematic patterns of geochemical co-accumulation linked to the parent material. The strongest positive correlations were observed with Zn, Mg, Pb, Na, and Cu. This association can be attributed to the geochemical inheritance from the parent material [47]. In our study, intermediate igneous rocks, specifically Cretaceous diorites and tonalites, were identified as the parent material associated with the highest levels of Cd accumulation. These rocks often coexist with primary minerals, such as plagioclase and biotite, within their structure.
Cadmium (Cd), zinc (Zn), and lead (Pb) share a combination of structural, electronic, and thermodynamic similarities that influence their mobility, adsorption, and partitioning among mineral and organic soil phases [31]. These elements exhibit comparable ionic radii in their most common oxidation states (0.95 Å for Cd2+, 0.74 Å for Zn2+, and 1.19 Å for Pb2+) [48]. This similarity supports their participation in isomorphic substitution processes within crystalline structures, including carbonates, oxides, clay minerals, and primary sulfide-type minerals such as sphalerite (ZnS), galena (PbS), and greenockite (CdS) [31].
Zinc (Zn) showed the strongest correlation with cadmium (R = 0.60) among the 48 soil variables evaluated and was also the variable that contributed most to the explained variance in the soils studied. Both Zn and Cd possess a closed d10 electronic configuration [45], indicating that their d orbitals are fully occupied. As a result, they exhibit low redox reactivity; that is, they are not readily oxidized or reduced. Instead, these elements tend to form electrostatic complexes by binding to negatively charged functional groups, such as carboxylic (-COO) and phenolic (-OH) groups, present in soil organic matter or on the surfaces of clay minerals [1].
Recent research has demonstrated the effectiveness of zinc oxide nanoparticles in reducing the chromium concentrations in soils by 20–40%, depending on the level of accumulation [49]. Similarly, silicon-based nanoparticles have exhibited high adsorption efficiencies (>80%) for chromium, primarily through surface complexation involving hydroxyl (-OH) and carboxyl (-COOH) functional groups [50]. A high immobilization efficiency and reduction in cadmium’s bioavailability have also been reported with the application of metal- and/or oxide-modified biochars [51]. Given the chemical similarities between cadmium and zinc (particularly their shared d10 electronic configuration and strong affinity for organic and mineral binding sites), the combined use of zinc-based nanoparticles and engineered biochars could represent a highly targeted and effective strategy for the remediation of cadmium-contaminated soils.
Lead (Pb), on the other hand, has a 6 s2 electronic configuration, known as an “inert pair,” which refers to an energetically stable electron pair that is not easily ionized or shared [52]. This property makes Pb a chemically heavier element, and like Zn and Cd, it forms electrostatic bonds with oxygenated functional groups rather than strong covalent bonds [47].
The physicochemical characteristics of Cd, Zn, and Pb support their geochemical co-adsorption onto soil colloids, particularly in soils with a high content of humic complexes and/or the presence of Fe and Mn oxides, typical of highly weathered acid soils [45]. However, despite the high variability in the clay content (18.56 ± 9.78%) and organic matter content (2.04 ± 1.69%) in the studied soils, no significant correlations with Cd were observed. These findings underscore the relevance of alternative mechanisms, such as the influence of weakly weathered parent material near the soil surface, in controlling Cd accumulation. This characteristic is typical of young soils, such as Leptosols, which are derived from parent materials rich in primary minerals, including plagioclase and biotite, and are contaminated with trace metals or sulfide minerals that have adsorbed metal ions.

4.3. Soil and Geological Factors Controlling Total Cd Accumulation in Avocado-Cultivated Soils: Influence of Taxonomic Type, Parent Material, and Geological Age

Non-parametric tests were conducted to identify specific edaphological characteristics associated with an elevated total Cd content in soils. The results indicate that Leptosols accumulate significantly more Cd than Cambisols, Calcisols, and Luvisols. Likewise, parent materials of a Cretaceous origin derived from intermediate igneous residual material reached significantly higher Cd levels. To enable a more comprehensive soil analysis of these interactions, it is essential to clarify the key differences among these soil types.
Leptosols are poorly developed soils, typically formed over cemented parent material and characterized by a shallow effective depth (<50 cm), which can significantly constrain agricultural activity [53]. They commonly exhibit lithic, petrocalcic, or gypsic contact, which causes edaphic restrictions on root growth and the limited horizonation of the soil profile [54]. Additionally, Leptosols have a low water-storage capacity and good drainage, features typical of soils with low organic matter content in the surface horizon [55]. However, due to their shallow profile, metals such as Cd tend to accumulate in the upper soil layers, particularly in soils with a basic pH, where Cd becomes less soluble [56].
The more recent geological age of the parent material in Leptosols results in a higher proportion of primary minerals in the early stages of weathering [57]. The low degree of alteration of the primary minerals, mainly amphiboles and micas, supports the higher content of trace Cd in their crystalline structure [58]. Thus, in highly technified agricultural soils, the frequent use of acidified irrigation water leads to the dissolution of these minerals and the release of Cd into the solid phase and the ion exchange complex of the soil [59].
Cambisols are also poorly evolved soils, with the incipient alteration of the parent material [53]. However, this alteration is sufficient to modify the soil’s physical and chemical properties compared to the original material. These soils are typically characterized by the presence of a cambic subsurface diagnostic horizon [53]. The cambic horizon exhibits a color and structure formation derived from the parent material, without significant illuviation processes; that is, its differentiation is due to the alteration of primary minerals or the incipient formation of secondary minerals.
Thus, in contrast to Leptosols, Cambisols contain higher levels of clay minerals and soil organic matter, reflecting greater pedogenetic maturity [60]. For this reason, they tend to accumulate Cd through organic chelation complexes or metal-specific adsorption mechanisms [60]. However, the higher soil profile horizon of Cambisols likely produces a dilution effect on the total Cd concentrations, whereas Leptosols exhibit higher concentrations (>3 mg·kg−1) within a topsoil layer with a reduced thickness. Nonetheless, Cambisols with high levels of Cd content (>1 mg·kg−1) have been identified in avocado plantations, particularly in alluvial and glacially transported soils with a Quaternary geological age. These edaphic hotspots within certain Cambisols are driven by dynamic geomorphological features such as undifferentiated terraces, mountainous areas formed on volcanic rocks, and riverbeds.
Luvisols, unlike Leptosols and Cambisols, exhibit a higher degree of pedogenic development and are characterized by the presence of an argic subsurface horizon (Bt) with significant clay accumulation, typically exceeding 15 cm in thickness [53]. These soils have a fine texture, moderate organic matter content in the A horizon, a high CEC (>20 cmol·kg−1), and a neutral-to-alkaline pH and are dominated by illite-type minerals [61]. In these Luvisols, the highest concentrations of Cd (>1 mg·kg−1) have been observed in soils of residual origin derived from intermediate igneous rocks (diorite and tonalite) formed during the Cretaceous period. This characteristic coincides with that associated with the highest Cd values found in Leptosols (>3 mg·kg−1). However, it is likely that in Luvisols, the Cd released through weathering is present in a higher concentration in the argic horizon, where it is firmly attached to the specific surface of clay minerals, thereby diluting its concentration in the arable layer of the soil [62].
Finally, significant differences were also observed between Leptosols and Calcisols. Calcisols are defined by the presence of a calcic subsurface horizon (Bk), characterized by a carbonate content exceeding 15% within this layer [53]. These soils typically exhibit a neutral-to-alkaline pH, a moderate CEC lower than that of Luvisols, and a low organic matter content, primarily due to the leaching of soluble organic compounds [63]. Notably, Calcisols presented the lowest levels of Cd accumulation in the arable layer of avocado plantation soils (median = 0.2 mg·kg−1), with pronounced differences to Leptosols. The lowest Cd concentrations in these soils were associated with parent material of an aeolian-transported origin, which contributes to the formation of sandy layer deposits, causing the generation of sandier soils with good infiltration.
It is likely that, in the arable soil layer, most cation exchange sites are saturated with calcium, thereby displacing Cd into the soluble phase of the soil [40,64]. Then, in the soil solution, Cd forms complexes with short-chain soluble organic acids [31], which can migrate with the downward flow of water, particularly in permeable horizons (sandy or colluvial). Upon reaching the calcic subsurface horizon, which is rich in carbonates, Cd can precipitate as otavite (CdCO3) or become incorporated into mixed Ca-Cd carbonate phases [46,65,66].

5. Conclusions

The findings of this study demonstrate that the total cadmium (Cd) content in avocado-cultivated soils in Peru exhibits a highly heterogeneous spatial distribution, with notably elevated values (>3 mg·kg−1) that are not attributable to random variability but rather to the systematic influence of edaphic and geogenic factors. The results provide strong evidence that the main explanatory variables of Cd accumulation at a basic pH are of a pedo-geochemical nature. Key explanatory variables include the soil taxonomic classification, parent material, geological age, total content of Zn, Pb, and Mg, exchangeable sodium percentage (ESP), and specific cation ratios (Ca2+/Mg2+). Moreover, this research identified Leptosols formed on Cretaceous intermediate igneous parent materials (diorite and tonalite) as having the highest total Cd concentrations, indicating a pronounced lithogenic contribution. This is likely linked to the weathering of trace-metal-rich primary minerals and the shallow depth of the arable soil layer. Based on the integrated results, a risk map was developed to illustrate the potential occurrence of elevated total Cd levels in soils across the Lima region. The analysis indicated that approximately 49,242.92 hectares, representing 22% of Lima’s agricultural land, have a high probability of occurrence and are at a moderate to very high risk of Cd accumulation in the soil.
The identification of soil types with lower cadmium accumulation, such as Calcisols, Cambisols, and Luvisols, compared to Leptosols provides critical insights for developing soil management strategies that aim to mitigate the Cd levels in vulnerable agricultural areas. These more pedogenetically evolved soils, characterized by better profile development and the presence of subsurface horizons with chemical immobilization capacities (argic or calcic horizons), offer natural attenuation mechanisms for Cd. Such mechanisms include organic chelation, specific adsorption onto high-cation-exchange-capacity (CEC) clays, and precipitation into insoluble forms, such as mixed carbonates. In contrast, Leptosols, with their limited soil profile differentiation and close proximity to lithogenic parent material, tend to favor surface Cd accumulation. Consequently, Calcisols, Cambisols, and Luvisols may serve as functional reference soils for guiding the sustainable management of avocado-growing areas in Peru.

Author Contributions

Conceptualization, R.S. and K.Q.; methodology, K.Q., R.S., R.L. and S.M.; software, K.Q., R.L. and S.M.; validation, R.S. and K.Q.; formal analysis, K.Q. and R.L.; investigation, R.S., K.Q. and R.L.; resources, R.S. and J.C.; data curation, R.L., K.Q. and S.M.; writing—original draft preparation, K.Q. and R.L.; writing—review and editing, R.S., K.Q. and R.L.; visualization, K.Q. and R.L.; supervision, R.S. and J.C.; project administration, R.S. and J.C.; funding acquisition, R.S. and J.C. All authors have read and agreed to the published version of the manuscript.

Funding

This research was funded by the INIA project CUI 2487112: “Mejoramiento de los servicios de investi-gación y transferencia tecnológica en el manejo y recuperación de suelos agrícolas degradados y aguas para riego en la pequeña y mediana agricultura en los departamentos de Lima, Áncash, San Martín, Cajamarca, Lambayeque, Junín, Ayacucho, Arequipa, Puno y Ucayali”.

Institutional Review Board Statement

Not applicable.

Data Availability Statement

The data presented in this study are available on request from the corresponding author.

Conflicts of Interest

The authors declare no conflicts of interest.

References

  1. Zhou, J.; Zhang, C.; Du, B.; Cui, H.; Fan, X.; Zhou, D.; Zhou, J. Effects of Zinc Application on Cadmium (Cd) Accumulation and Plant Growth through Modulation of the Antioxidant System and Translocation of Cd in Low- and High-Cd Wheat Cultivars. Environ. Pollut. 2020, 265, 115045. [Google Scholar] [CrossRef] [PubMed]
  2. Wei, B.; Yang, L. A Review of Heavy Metal Contaminations in Urban Soils, Urban Road Dusts and Agricultural Soils from China. Microchem. J. 2010, 94, 99–107. [Google Scholar] [CrossRef]
  3. Huang, X.; Yu, H.; Zhao, X.; Guo, X.; Ye, Y.; Xu, Z. Spatial Variation in Cadmium and Mercury and Factors Influencing Their Potential Ecological Risks in Farmland Soil in Poyang Lake Plain, China. Front. Environ. Sci. 2021, 9, 641497. [Google Scholar] [CrossRef]
  4. Mitra, S.; Chakraborty, A.J.; Tareq, A.M.; Bin Emran, T.; Nainu, F.; Khusro, A.; Idris, A.M.; Khandaker, M.U.; Osman, H.; Alhumaydhi, F.A.; et al. Impact of heavy metals on the environment and human health: Novel therapeutic insights to counter the toxicity. J. King Saud. Univ. Sci. 2022, 34, 101865. [Google Scholar] [CrossRef]
  5. McLaughlin, M.J.; Smolders, E.; Zhao, F.J.; Grant, C.; Montalvo, D. Managing cadmium in agricultural systems. In Advances in Agronomy; Sparks, D.L., Ed.; Academic Press: Cambridge, MA, USA, 2021; Volume 164, pp. 1–129. [Google Scholar] [CrossRef]
  6. Sun, L.; Wang, R.; Ju, Q.; Xing, M.; Li, R.; Li, W.; Li, W.; Wang, W.; Deng, Y.; Xu, J. Mitigation mechanism of zinc oxide nanoparticles on cadmium toxicity in tomato. Front. Plant Sci. 2023, 14, 1162372. [Google Scholar] [CrossRef]
  7. Wang, R.; Sang, P.; Guo, Y.; Jin, P.; Cheng, Y.; Yu, H.; Xie, Y.; Yao, W.; Qian, H. Cadmium in food: Source, distribution and removal. Food Chem. 2023, 405, 134666. [Google Scholar] [CrossRef]
  8. Taramuel-Taramuel1, J.P.; Montoya-Restrepo, I.A.; Barrios, D. Challenges in the Avocado Production Chain in Latin America: A Descriptive Analysis. Agron. Colomb. 2024, 42, e113982. [Google Scholar] [CrossRef]
  9. European Commission. RASFF—Rapid Alert System for Food and Feed. Available online: https://webgate.ec.europa.eu/rasff-window/screen/search (accessed on 14 June 2025).
  10. Thomas, E.; Atkinson, R.; Zavaleta, D.; Rodriguez, C.; Lastra, S.; Yovera, F.; Arango, K.; Pezo, A.; Aguilar, J.; Tames, M.; et al. The Distribution of Cadmium in Soil and Cacao Beans in Peru. Sci. Total Environ. 2023, 881, 163372. [Google Scholar] [CrossRef]
  11. Song, Y.; Jin, L.; Wang, X. Cadmium Absorption and Transportation Pathways in Plants. Int. J. Phytoremediat. 2017, 19, 133–141. [Google Scholar] [CrossRef]
  12. Guan, Q.; Wang, F.; Xu, C.; Pan, N.; Lin, J.; Zhao, R.; Yang, Y.; Luo, H. Source Apportionment of Heavy Metals in Agricultural Soil Based on PMF: A Case Study in Hexi Corridor, Northwest China. Chemosphere 2018, 193, 189–197. [Google Scholar] [CrossRef]
  13. Bi, X.; Zhang, M.; Wu, Y.; Fu, Z.; Sun, G.; Shang, L.; Li, Z.; Wang, P. Distribution Patterns and Sources of Heavy Metals in Soils from an Industry Undeveloped City in Southern China. Ecotoxicol. Environ. Saf. 2020, 205, 111115. [Google Scholar] [CrossRef] [PubMed]
  14. Quispe, K.; Mejía, S.; Carbajal, C.; Alejandro, L.; Verástegui, P.; Solórzano, R. Spatial Variability of Soil Acidity and Lime Requirements for Potato Cultivation in the Huánuco Highlands. Agriculture 2024, 14, 2286. [Google Scholar] [CrossRef]
  15. Zhao, Y.; Deng, Q.; Lin, Q.; Zeng, C.; Zhong, C. Cadmium Source Identification in Soils and High-Risk Regions Predicted by Geographical Detector Method. Environ. Pollut. 2020, 263, 114338. [Google Scholar] [CrossRef] [PubMed]
  16. Yang, Y.; Li, Y.; Chen, W.; Wang, M.; Wang, T.; Dai, Y. Dynamic Interactions between Soil Cadmium and Zinc Affect Cadmium Phytoavailability to Rice and Wheat: Regional Investigation and Risk Modeling. Environ. Pollut. 2020, 267, 115613. [Google Scholar] [CrossRef]
  17. Chen, S.; Wang, M.; Li, S.; Zhao, Z.; Wen-Di, E. Overview on Current Criteria for Heavy Metals and Its Hint for the Revision of Soil Environmental Quality Standards in China. J. Integr. Agric. 2018, 17, 765–774. [Google Scholar] [CrossRef]
  18. Tindwa, H.J.; Singh, B.R. Soil Pollution and Agriculture in Sub-Saharan Africa: State of the Knowledge and Remediation Technologies. Front. Soil Sci. 2022, 2, 1101944. [Google Scholar] [CrossRef]
  19. Havlin, J.L.; Tisdale, S.L.; Nelson, W.D.; Beaton, J.D. Soil Fertility and Fertilizers: An Introduction to Nutrient Management, 6th ed.; Pearson Education: Chennai, India, 2016; Volume 8, ISBN 978-93-325-7034-4. [Google Scholar]
  20. ISO 11464:2006; Soil Quality—Pretreatment of Samples for Physico-Chemical Analysis. ISO: Geneva, Switzerland, 2006. Available online: https://www.iso.org/standard/37718.html (accessed on 19 May 2025).
  21. DOF—Diario Oficial de La Federación. Available online: https://www.dof.gob.mx/nota_detalle.php?codigo=717582&fecha=31/12/2002#gsc.tab=0 (accessed on 19 May 2025).
  22. U.S. Environmental Protection Agency. Method 9045D: Soil and Waste pH. Revision 4. Available online: https://www.epa.gov/sites/default/files/2015-12/documents/9045d.pdf (accessed on 5 April 2025).
  23. ISO 11265:1994; Soil Quality—Determination of the Specific Electrical Conductivity. ISO: Geneva, Switzerland, 1994. Available online: https://www.iso.org/standard/19243.html (accessed on 10 October 2024).
  24. Bazán Tapia, R. Manual de Procedimientos de los Análisis de Suelos y Agua con Fines de Riego; Instituto Nacional de Innovación Agraria-INIA: Lima, Peru, 2017. [Google Scholar]
  25. ISRIC. SoilGrids—Global Gridded Soil Information. Available online: https://www.isric.org/explore/soilgrids (accessed on 19 May 2025).
  26. Instituto Geológico, Minero y Metalúrgico (INGEMMET): Lima, Perú. Geocatmin: Sistema de Información Geológica y Catastral del Perú. Available online: https://geocatmin.ingemmet.gob.pe/geocatmin/ (accessed on 25 March 2025).
  27. De la Cruz, A. Atlas de Zonas de Vida del Perú: Guía Explicativa; Nota Técnica No. 003 SE-NAMH-DHI-2017; Servicio Nacional de Meteorología e Hidrología del Perú (SENAMHI): Lima, Perú, 2017. [Google Scholar]
  28. Catalogo de Metadatos Cartográficos—SENAMHI. Available online: https://idesep.senamhi.gob.pe/geonetwork/srv/spa/catalog.search#/metadata/9f18b911-64af-4e6b-bbef-272bb20195e4 (accessed on 19 May 2025).
  29. Wang, J.; Li, X.; Christakos, G.; Liao, Y.; Zhang, T.; Gu, X.; Zheng, X. Geographical Detectors-Based Health Risk Assessment and Its Application in the Neural Tube Defects Study of the Heshun Region, China. Int. J. Geogr. Inf. Sci. 2010, 24, 107–127. [Google Scholar] [CrossRef]
  30. Wang, L.; Cui, X.; Cheng, H.; Chen, F.; Wang, J.; Zhao, X.; Lin, C.; Pu, X. A Review of Soil Cadmium Contamination in China Including a Health Risk Assessment. Environ. Sci. Pollut. Res. 2015, 22, 16441–16452. [Google Scholar] [CrossRef]
  31. Kubier, A.; Wilkin, R.T.; Pichler, T. Cadmium in Soils and Groundwater: A Review. Appl. Geochem. 2019, 108, 104388. [Google Scholar] [CrossRef]
  32. Xu, H.; Wang, H.; Croot, P.; Liu, J.; Li, Y.; Beiyuan, J.; Li, C.; Singh, B.P.; Xie, S.; Zhou, H.; et al. Investigation of Spatially Varying Relationships between Cadmium Accumulation and Potential Controlling Factors in the Topsoil of Island of Ireland Based on Spatial Machine Learning Approaches. Environ. Res. 2025, 275, 121466. [Google Scholar] [CrossRef]
  33. Yang, F.; Zhang, G.; Yin, X.; Liu, Z. Field-Scale Spatial Variation of Saline-Sodic Soil and Its Relation with Environmental Factors in Western Songnen Plain of China. Int. J. Environ. Res. Public Health 2011, 8, 374–387. [Google Scholar] [CrossRef]
  34. Zhao, K.; Fu, W.; Ye, Z.; Zhang, C. Contamination and Spatial Variation of Heavy Metals in the Soil-Rice System in Nanxun County, Southeastern China. Int. J. Environ. Res. Public Health 2015, 12, 1577–1594. [Google Scholar] [CrossRef]
  35. Zahedifar, M. Effect of Biochar on Cadmium Fractions in Some Polluted Saline and Sodic Soils. Environ. Manag. 2020, 66, 1133–1141. [Google Scholar] [CrossRef]
  36. Kharche, V.K.; Paradhi, A.; Shirale, A.O.; Jadhao, S.D. Diagnosis, Classification and Management of Black Sodic Soils: An Overview: Classification and Management of Black Sodic Soils. J. Soil Salin. Water Qual. 2024, 16, 317–328. [Google Scholar] [CrossRef]
  37. Filipović, L.; Romić, M.; Romić, D.; Filipović, V.; Ondrašek, G. Organic Matter and Salinity Modify Cadmium Soil (Phyto)Availability. Ecotoxicol. Environ. Saf. 2018, 147, 824–831. [Google Scholar] [CrossRef]
  38. Ondrasek, G.; Rengel, Z. The Role of Soil Organic Matter in Trace Element Bioavailability and Toxicity. In Abiotic Stress Responses in Plants: Metabolism, Productivity and Sustainability; Ahmad, P., Prasad, M.N.V., Eds.; Springer: New York, NY, USA, 2012; pp. 403–423. ISBN 978-1-4614-0634-1. [Google Scholar]
  39. Li, W.; Qin, F.; Li, H.; Huang, Q.; Luo, L.; Xu, A. Calcium Supplementation Alleviates Cadmium Toxicity in Contaminated Soil and Rice (Oryza Sativa) Seedlings. Ciência Rural. 2025, 55, e20240467. [Google Scholar] [CrossRef]
  40. Liu, J.; Feng, X.; Qiu, G.; Li, H.; Wang, Y.; Chen, X.; Fu, Q.; Guo, B. Inhibition Roles of Calcium in Cadmium Uptake and Translocation in Rice: A Review. Int. J. Mol. Sci. 2023, 24, 11587. [Google Scholar] [CrossRef]
  41. He, L.L.; Huang, D.Y.; Zhang, Q.; Zhu, H.H.; Xu, C.; Li, B.; Zhu, Q.H. Meta-Analysis of the Effects of Liming on Soil PH and Cadmium Accumulation in Crops. Ecotoxicol. Environ. Saf. 2021, 223, 112621. [Google Scholar] [CrossRef]
  42. Liu, Q.; Liu, S.; Wang, D.; Sun, D.; Ge, Y.; Zhang, S.; Li, G.; Jho, E.H.; Joo, J.C.; Zhao, X.; et al. Decoupling Soil PH and Geography: Universal Drivers of Cadmium Bioavailability in Rice across Terrains. J. Environ. Manag. 2025, 381, 125297. [Google Scholar] [CrossRef]
  43. Yan, Z.; Ding, W.; Xie, G.; Yan, M.; Li, J.; Han, Y.; Xiong, X.; Wang, C. Identification of Cadmium Phytoavailability in Response to Cadmium Transformation and Changes in Soil PH and Electrical Conductivity. Chemosphere 2023, 342, 140042. [Google Scholar] [CrossRef]
  44. Jackson, B.P.; Punshon, T. Recent Advances in the Measurement of Arsenic, Cadmium, and Mercury in Rice and Other Foods. Curr. Environ. Health Rep. 2015, 2, 15–24. [Google Scholar] [CrossRef] [PubMed]
  45. Zhou, J.; Moore, R.E.T.; Rehkämper, M.; Kreissig, K.; Coles, B.; Wu, L.; Luo, Y.; Christie, P. Cadmium and Zinc Isotope Compositions Indicate Metal Sources and Retention Mechanisms in Different Soil Particle Size Fractions. J. Hazard Mater. 2024, 461, 132560. [Google Scholar] [CrossRef] [PubMed]
  46. Boostani, H.R.; Hosseini, S.M.; Hardie, A.G. Mechanisms of Cd Immobilization in Contaminated Calcareous Soils with Different Textural Classes Treated by Acid- and Base-Modified Biochars. Sci. Rep. 2024, 14, 24614. [Google Scholar] [CrossRef] [PubMed]
  47. Alloway, B.J. Heavy Metals in Soils: Trace Metals and Metalloids in Soils and Their Bioavailability; Springer: Dordrecht, The Netherlands, 2013; Volume 22, ISBN 978-94-007-4469-1/978-94-007-4470-7. [Google Scholar]
  48. Abia, A.A.; Igwe, J.C. Sorption Kinetics and Intraparticulate Diffusivities of Cd, Pb and Zn Ions on Maize Cob. Afr. J. Biotechnol. 2005, 4, 509–512. [Google Scholar]
  49. Mehmood, S.; Ou, W.; Ahmed, W.; Bundschuh, J.; Rizwan, M.; Mahmood, M.; Sultan, H.; Alatalo, J.M.; Elnahal, A.S.M.; Liu, W.; et al. ZnO nanoparticles mediated by Azadirachta indica as nano fertilizer: Improvement in physiological and biochemical indices of Zea mays grown in Cr-contaminated soil. Environ. Pollut. 2023, 339, 122755. [Google Scholar] [CrossRef]
  50. Mehmood, S.; Mahmood, M.; Núñez-Delgado, A.; Alatalo, J.M.; Elrys, A.S.; Rizwan, M.; Weng, J.; Li, W.; Ahmed, W. A green method for removing chromium (VI) from aqueous systems using novel silicon nanoparticles: Adsorption and interaction mechanisms. Environ. Res. 2022, 213, 113614. [Google Scholar] [CrossRef]
  51. Rahim, H.U.; Akbar, W.A.; Alatalo, J.M. A Comprehensive Literature Review on Cadmium (Cd) Status in the Soil Environment and Its Immobilization by Biochar-Based Materials. Agronomy 2022, 12, 877. [Google Scholar] [CrossRef]
  52. Walsh, A.; Watson, G.W. The Origin of the Stereochemically Active Pb(II) Lone Pair: DFT Calculations on PbO and PbS. J. Solid State Chem. 2005, 178, 1422–1428. [Google Scholar] [CrossRef]
  53. Anjos, L.; Gaistardo, C.C.; Deckers, J.; Dondeyne, S.; Eberhardt, E.; Gerasimova, M.; Harms, B.; Jones, A.; Krasilnikov, P.; Reinsch, T.; et al. World Reference Base for Soil Resources 2014 Soil Classification System for Naming Soils and Creating Legends for Soil Maps; FAO: Rome, Italy, 2015; ISBN 978-92-5-108369-7. [Google Scholar]
  54. Moreira, A.C.; Martins, J.M.S. Influence of Site Factors on the Impact of Phytophthora Cinnamomi in Cork Oak Stands in Portugal. For. Pathol. 2005, 35, 145–162. [Google Scholar] [CrossRef]
  55. Kaiser, K.; Guggenberger, G.; Haumaier, L. Changes in Dissolved Lignin-Derived Phenols, Neutral Sugars, Uronic Acids, and Amino Sugars with Depth in Forested Haplic Arenosols and Rendzic Leptosols. Biogeochemistry 2004, 70, 135–151. [Google Scholar] [CrossRef]
  56. Huang, X.; Zhang, Z.; Zhou, Y.; Wang, X.; Zhang, J.; Zhou, X. Spatial Heterogeneity of Soil Thickness and Factors Controlling It in a Karst Basin. Eurasian Soil Sci. 2021, 54, 478–486. [Google Scholar] [CrossRef]
  57. Bockheim, J.G. Classification and Development of Shallow Soils (<50 cm) in the USA. Geoderma Reg. 2015, 6, 31–39. [Google Scholar] [CrossRef]
  58. Butler, J.R.; Thompson, A.J. Cadmium and Zinc in Some Alkali Acidic Rocks. Geochim. Cosmochim. Acta 1967, 31, 97–105. [Google Scholar] [CrossRef]
  59. Aksouh, M.Y.; Boudieb, N.; Benosmane, N.; Moussaoui, Y.; Michalski, R.; Klyta, J.; Kończyk, J. Presence of Heavy Metals in Irrigation Water, Soils, Fruits, and Vegetables: Health Risk Assessment in Peri-Urban Boumerdes City, Algeria. Molecules 2024, 29, 4187. [Google Scholar] [CrossRef] [PubMed]
  60. Duan, C.; Liu, Y.; Zhang, H.; Chen, G.; Song, J. Cadmium Pollution Impact on the Bacterial Community of Haplic Cambisols in Northeast China and Inference of Resistant Genera. J. Soil Sci. Plant Nutr. 2020, 20, 1156–1170. [Google Scholar] [CrossRef]
  61. Lavkulich, L.M.; Arocena, J.M. Luvisolic Soils of Canada: Genesis, Distribution, and Classification. Can. J. Soil Sci. 2011, 91, 781–806. [Google Scholar] [CrossRef]
  62. Chaves, L.H.G.; de Souza, R.S.; de Brito Chaves, I.; Tito, G.A. Energia Livre da Reação de Adsorção do Cádmio em Luvissolos e Cambissolos. Rev. Caatinga 2010, 23, 84–89. [Google Scholar]
  63. Akça, E.; Aydemir, S.; Kadir, S.; Eren, M.; Zucca, C.; Günal, H.; Previtali, F.; Zdruli, P.; Çilek, A.; Budak, M.; et al. Calcisols and Leptosols; Springer: Berlin/Heidelberg, Germany, 2018; pp. 139–167. [Google Scholar] [CrossRef]
  64. Zhou, W.; Ren, L.; Zhu, L. Reducement of Cadmium Adsorption on Clay Minerals by the Presence of Dissolved Organic Matter from Animal Manure. Environ. Pollut. 2017, 223, 247–254. [Google Scholar] [CrossRef]
  65. Rassaei, F.; Hoodaji, M.; Abtahi, S.A. Adsorption Kinetic and Cadmium Fractions in Two Calcareous Soils Affected by Zinc and Different Moisture Regimes. Paddy Water Environ. 2020, 18, 595–606. [Google Scholar] [CrossRef]
  66. Escrig, I.; Morell, I. Effect of Calcium on the Soil Adsorption of Cadmium and Zinc in Some Spanish Sandy Soils. Water Air Soil Pollut. 1998, 105, 507–520. [Google Scholar] [CrossRef]
Figure 1. Geographic distribution of the 410 soil sampling points in agricultural areas under avocado (Persea americana) cultivation in the departments of Ancash, Ayacucho, Cusco, Huancavelica, Ica, La Libertad, and Lima. The background map displays the departmental boundaries, agricultural land cover, and major surrounding rivers within the study area. Red points are soil samples.
Agriculture 15 01413 g001
Figure 2. Spearman matrix of bivariate non-parametric correlations between total cadmium (Cd) content and 26 soil physicochemical variables. Only statistically significant correlations (p < 0.01) are presented. Abbreviations: CMK = (Ca2+ + Mg2+)/K+; CM = Ca2+/Mg2+; MK = Mg2+/K+; Naint, Caint, Mgint, and Kint = exchangeable sodium, calcium, magnesium, and potassium, respectively; ESP, EPP, ECP, and EMP = exchangeable sodium, potassium, calcium, and magnesium percentages; CECt = total cation exchange capacity; CECe = effective cation exchange capacity; BD = bulk density.
Agriculture 15 01413 g002
Figure 3. Spearman matrix of bivariate non-parametric correlations between total cadmium (Cd) content and total content of 22 metals and metalloids determined by ICP-MS. Only statistically significant correlations (p < 0.01) are displayed.
Agriculture 15 01413 g003
Figure 4. Principal component analysis (PCA) of soil variables: regional multivariate distribution on Dim1 (36.3%) and Dim4 (10.2%) axes with 95% confidence ellipses.
Agriculture 15 01413 g004
Figure 5. Percentage influence on the spatial variability of Cd based on the combined results from the interaction detector and the ecological detector. Green cells indicate that the influence of the variables was statistically different, while red cells indicate that the influences of the variables were statistically equal.
Agriculture 15 01413 g005
Figure 6. Comparison of total Cd levels across different taxonomic soil types (WRB) cultivated with avocados, based on Dunn’s post hoc test following Kruskal–Wallis test and Bonferroni correction for multiple comparisons. Different letters indicate statistically significant differences between soil types (p < 0.05).
Agriculture 15 01413 g006
Figure 7. Comparison of total Cd levels across different parent materials in soils cultivated with avocados, based on Dunn’s post hoc test following Kruskal–Wallis test and Bonferroni correction for multiple comparisons. Different letters indicate statistically significant differences between soil types (p < 0.0001).
Agriculture 15 01413 g007
Figure 8. Comparison of total Cd concentrations among different geological ages of parent material in soils cultivated with avocados, based on Dunn’s post hoc test following Kruskal–Wallis test and Bonferroni correction for multiple comparisons. Different letters indicate statistically significant differences between geological ages (p < 0.0001).
Agriculture 15 01413 g008
Figure 9. Thematic maps of the categorical strata significantly associated with the distribution of cadmium (Cd) in the soils of the Lima department, as determined from the Geodetector analysis. Six subfigures (AF) are included, corresponding to the factors of the parent material (PM), geological age (GA), geoform type (GT), soil type (ST), climate (CT), and life zone (FZT), respectively. In each case, the categories whose average Cd incidence was statistically different when compared to other classes of the same factor are shown (White color), highlighting those with higher values. The symbology was standardized, and the maps were created in QGIS 3.40, using the WGS 84/UTM Zone 18S Projection.
Agriculture 15 01413 g009
Figure 10. Map of the potential risk of occurrence of high accumulated Cd levels in the soils of the Lima department. It considers the most influential factors, as determined through the Geodetector analysis, and the categories with significantly higher median Cd values. The generated map displays a discrete scale where higher values indicate greater overlapping conditions associated with elevated Cd concentrations.
Agriculture 15 01413 g010
Table 1. Descriptive statistics of 25 physicochemical parameters related to soil fertility in avocado plantations in Peru.
ParameterUnitMeanSDVarCVSkewnessKurtosisMinMaxP25MedianP75Shapiro
pHRatio7.520.430.185.68−0.041.516.009.107.307.507.807.27 × 10−34
ECdS·m−12.303.5212.40153.365.5341.820.2240.050.921.312.004.67 × 10−6
OM%2.041.692.8782.931.824.330.0010.370.831.562.761.69 × 10−33
Olsen Pmg·kg−134.7874.295519.41213.636.1745.340.00732.007.0413.2831.614.53 × 10−20
Nmg·g−12.405.4029.15224.967.5861.820.0052.060.871.382.207.25 × 10−35
Sand%56.8215.65245.0727.550.820.3619.3197.3845.7454.4663.729.14 × 10−37
Clay%18.569.7895.6152.680.32−0.300.0556.7411.2617.7325.745.00 × 10−12
Silt%24.7011.63135.2247.080.17−0.121.2161.8617.7724.3231.471.65 × 10−4
Carbonates%3.683.009.0381.712.128.350.0023.121.443.115.323.64 × 10−4
Ca+2cmol·kg−115.7017.22296.58109.683.2117.270.29166.784.959.5019.975.88 × 10−20
K+cmol·kg−10.690.750.56107.612.246.170.034.780.210.420.892.80 × 10−26
Mg+2cmol·kg−11.481.893.56127.562.355.400.0111.350.460.731.351.05 × 10−24
Na+cmol·kg−12.244.1216.93183.333.0211.650.0132.690.160.531.557.56 × 10−28
CECecmol·kg−120.1219.81392.5798.483.1718.441.02200.467.3214.6526.122.24 × 10−30
ECP%75.7016.44270.4021.72−1.592.927.2798.9270.9178.9085.684.83 × 10−25
EPP%4.924.5820.9693.011.814.000.1025.181.543.626.661.31 × 10−18
EMP%8.136.1137.3275.111.563.850.2043.263.437.3110.498.33 × 10−21
ESP%11.2516.43270.00146.112.073.680.1475.521.453.9410.783.62 × 10−17
(Ca+2 + Mg+2)/K+Ratio44.0465.614304.48148.965.7049.222.78797.9012.9923.8949.981.69 × 10−27
Ca+2/Mg+2Ratio22.0038.061448.24172.976.2655.860.22472.006.7910.5121.366.02 × 10−32
Mg+2/K+Ratio0.741.091.18147.008.0577.000.0313.000.330.530.851.27 × 10−33
Ctotalg·kg−116.9313.03169.7876.941.764.360.4581.827.5913.3023.031.71 × 10−35
Corgg·kg−112.119.9498.7882.081.764.020.0060.405.069.2116.243.09 × 10−19
CECtcmol·kg−1119.744.1116.8920.820.01−1.1711.6027.2016.4419.1723.771.09 × 10−19
BDg·m−31.290.060.004.41−0.130.821.051.451.261.281.342.79 × 10−10
Table 2. Descriptive statistics of total content of 22 metals related to geochemistry of soils in avocado plantations in Peru.
ParameterUnitMeanSDVarCVSkewnessKurtosisMinMaxP25MedianP75Shapiro
Cdmg·kg−10.541.001.01185.097.3073.460.0011.980.140.260.597.27 × 10−34
Asmg·kg−150.858.133379.229114.441.120.800246.210.1639.9790.281.14 × 10−20
Cumg·kg−138.9730.45926.907278.1340.68−0.511.39142.9711.2334.96558.742.19 × 10−15
Srmg·kg−179.3361.363764.53877.3412.5811.308.11555.139.2964.3999.088.90 × 10−23
Momg·kg−11.6962.5956.7342761536.8853.19026.270.8231.31.81.69 × 10−35
Nimg·kg−115.0915.84250.9882105.014.5328.962.09159.347.57510.39515.781.11 × 10−30
Agmg·kg−10.2170.9610.9232046442.639.0384.2209.6600.060.21.03 × 10−38
Pbmg·kg−124.4217.98323.225473.6082.799.936.3132.3113.7620.17527.595.74 × 10−26
Semg·kg−10.4832.6096.806738540.437.0850.73022.340007.23 × 10−39
TImg·kg−10.2540.6460.4172612254.059.1595.2008.410.060.140.262.90 × 10−37
Vmg·kg−184.4784.317107.50399.810.920.780444.670.18378.575132.41.01 × 10−17
Femg·kg−12052571645132437034.9050.972.287279568751560120008.9247964.66 × 10−10
Ca, totalmg·kg−11761323074532430500131.013.9622.26022654560849731196586.68 × 10−30
K, totalmg·kg−12074955.1912246.546.0530.34−0.14210.95469.213162092.4127229.68 × 10−5
Mg, totalmg·kg−1659533691134892051.0841.303.64112.22186247586217.7878812.64 × 10−15
Na, totalmg·kg−1134525436469144189.093.0011.455.620612103282.51849.57.84 × 10−31
Hgmg·kg−10.1690.3210.1033403190.052.788.0201.890.020.040.1751.69 × 10−30
Bamg·kg−1203.6180.432560.2788.6171.913.5813.71899.285.25137.185251.34.45 × 10−23
Znmg·kg−199.1859.423530.3459.912.7713.2319.95554.464.1385.295115.23.27 × 10−23
Sbmg·kg−10.510.8170.6676311160.226.8673.800110.080.260.7156.78 × 10−32
Crmg·kg−112.5212.13147.157296.8813.3415.890.0497.516.0739.81515.41.75 × 10−26
Al, totalmg·kg−11004569054768390068.745−0.17−0.963.7328827131111625.4149651.45 × 10−14
Table 3. Geodetector algorithm factor detector results.
Olsen PSandClaySiltPbMgZnpHOMESPECPAltPMSTGACLIGTLZ
q-statistic0.040.050.020.060.160.260.280.020.020.100.090.020.230.150.180.210.120.26
p-value0.000.000.030.000.000.000.000.060.030.000.000.130.000.000.000.000.000.00
Disclaimer/Publisher’s Note: The statements, opinions and data contained in all publications are solely those of the individual author(s) and contributor(s) and not of MDPI and/or the editor(s). MDPI and/or the editor(s) disclaim responsibility for any injury to people or property resulting from any ideas, methods, instructions or products referred to in the content.

