Article

Impact of Coastal Beach Reclamation on Seasonal Greenhouse Gas Emissions: A Study of Diversified Saline–Alkaline Land Use Patterns

1
School of Geography and Ocean Science, Nanjing University, Nanjing 210023, China
2
The Key Laboratory of the Coastal Zone Exploitation and Protection, Ministry of Natural Resources, Nanjing 210023, China
3
School of Environmental Engineering, Nanjing Institute of Technology, Nanjing 211167, China
4
NJIT Research Center, The Key Laboratory of Carbon Neutrality and Territory Optimization, Ministry of Natural Resources, Nanjing 211167, China
5
International Joint Laboratory of Green & Low Carbon Development, Nanjing 211167, China
*
Author to whom correspondence should be addressed.
Agriculture 2025, 15(13), 1403; https://doi.org/10.3390/agriculture15131403
Submission received: 23 May 2025 / Revised: 26 June 2025 / Accepted: 27 June 2025 / Published: 29 June 2025
(This article belongs to the Section Agricultural Soils)

Abstract

Reclaiming coastal wetlands for agricultural purposes has led to intensified farming activities, which are anticipated to affect greenhouse gas (GHG) flux processes within coastal wetland ecosystems. However, how greenhouse gas exchanges respond to variations in agricultural reclamation activities across different years remains uncertain. To address this knowledge gap, this study characterized dynamic exchanges within the soil–plant–atmosphere continuum by employing continuous monitoring across four representative coastal wetland soil–vegetation systems in Jiangsu, China. The results show the carbon dioxide (CO2) and nitrous oxide (N2O) flux exchanges between the system and the atmosphere and soil–vegetation carbon pools, which revealed the drivers of carbon dynamics in the coastal wetland system. The four study sites, converted from coastal wetlands to agricultural lands at different times (years), generally act as CO2 sinks and N2O sources. Higher levels of CO2 sequestration occur as the age of reclamation rises. In terms of time scale, crops lands were found to be CO2 sinks during the growing period but became CO2 sources during the crop fallow period. Although the temporal trend of the N2O flux was generally smooth, reclaimed farmlands acted as net sources of N2O, particularly during the crop-growing period. The RDA and PLS-PM models illustrate that soil salinity, acidity, and hydrothermal conditions were the key drivers affecting the magnitude of the GHG flux exchanges under reclamation. This study demonstrates that GHG emissions from reclaimed wetlands can be effectively regulated through science-based land management, calling for prioritized attention to post-development practices rather than blanket restrictions on coastal exploitation.

1. Introduction

Greenhouse gas emissions are recognized internationally as the main cause of global warming [1]. Carbon dioxide (CO2) and nitrous oxide (N2O) are two important atmospheric greenhouse gases (GHGs) [2]. Among greenhouse gases, CO2 maintains the highest atmospheric concentration and remains the primary focus of mitigation efforts. Concurrently, N2O has garnered significant scientific attention due to its 100-year global warming potential (GWP100) exceeding 265 times that of CO2 [3,4]. Amidst the impacts of global climate change, research on ecosystem GHG sources and sinks has attracted much attention [5,6]. Against the backdrop of the ecosystem carbon cycle being a focal point in global change research, disturbance-driven carbon exchange flux variability has drawn increasing attention, particularly in wetlands with heterogeneous disturbance legacies [7,8,9,10].
Human reclamation activities in wetlands have seriously disturbed ecosystems, which may lead to saline–alkali changes, species invasions, and the destruction of native vegetation [11,12]. The reclamation of coastal wetlands for urban expansion, industrial development, and agricultural production activities is common worldwide [13]. Ecosystem changes have occurred from natural wetlands to reclamation wetlands. It is therefore reasonable to assume that these unique coastal reclamation wetland settings are influenced by both natural siltation and human activities. The interplay between climatic variability and anthropogenic disturbances may exert nonlinear effects on the functioning of ecosystems in anthropogenically modified wetlands, potentially driving ecological systems beyond critical thresholds [14]. These influences contribute to local environmental changes and directly or indirectly result in greenhouse gas emissions [15,16]. Newly reclaimed coastal croplands represent a critical land resource, with converted wetlands used for continuous agricultural production. These systems exhibit advantages as strategic reserves with high developmental potential [17,18]. GHG emissions from aquaculture ponds converted from coastal wetlands have been well studied [4,19,20]. However, there is still a lack of quantitative studies on the GHG emissions from agricultural land use in coastal wetland reclamation areas under different land use patterns. Moreover, emerging challenges in newly reclaimed croplands—particularly low soil maturity, poor structural stability, and constrained productivity—impede agricultural development while also disrupting greenhouse gas emission regimes. There is a lack of monitoring and mechanism analyses of intra-annual GHG exchange for different reclamation years [21,22,23]. To reduce carbon emissions from coastal wetlands experiencing increasing human disturbances, it is necessary to quantify the possible responses of CO2 fluxes in the reclamation of coastal wetlands for agriculture and explore the underlying impact mechanisms [24,25,26,27].
The Jiangsu coastal zone, representing a key region along China’s southeastern coast, is characterized by its rich silty beaches. Owing to its unique geographic environment, it has evolved into an important coastal wetland ecosystem on a global scale [28]. Under the combined pressures of climate change and anthropogenic disturbances, salt marshes along the Jiangsu coast have experienced persistent modifications [29]. Rapid urbanization in the economically powerful middle and lower Yangtze River region has intensified human activities in Jiangsu’s coastal wetlands, particularly reclamation [30]. Notably, China’s coastline is advancing at 25–30 cm/year, with most of the newly formed land reclaimed for agricultural development [31]. The coastal wetlands in Jiangsu exhibit a long history of reclamation, with an estimated total reclaimed area of approximately 107,420.0 hm2. Over the past six decades, intensified reclamation has led to a >70% reduction in the natural wetland area along Jiangsu’s coast, coupled with severe degradation of native saltmarsh vegetation. This has resulted in spatially heterogeneous land use patterns shaped by varying reclamation chronosequences [32]. Following soil amelioration measures, agricultural cultivation—including crops such as wheat, rice, and maize—was initiated [33]. The conversion of coastal wetlands to arable land under saline–alkali conditions significantly alters the spatiotemporal dynamics of salt ion transport in surface soils across reclamation chronosequences. Notably, surface soil salinity decreases at an accelerated rate following prolonged reclamation [34]. Reclamation age gradients drive spatiotemporal differentiation in soil salt ion redistribution via ‘leaching-downward’ transport mechanisms. Newly reclaimed areas (<20 years) exhibit surface salt accumulation that constrains SOC sequestration, whereas long-term reclaimed sites (>40 years) demonstrate enhanced carbon–nitrogen turnover under amelioration practices [35]. Critically, soil salinization modulates multiple ecosystem parameters—including plant biomass accumulation, soil organic carbon (SOC) stocks, net photosynthetic rates, and CO2 flux patterns [36]. Moreover, implementing systematic farmland management and sustained amelioration measures progressively enhances salinity reduction efficiency over extended reclamation periods [37]. Consequently, the carbon cycling mechanisms of the reclaimed agricultural systems evolve with both reclamation duration and associated physicochemical environmental shifts. Therefore, it is crucial to investigate specific environmental factors and pathways that influence GHG flux and balance under varying durations of reclamation.
Following reclamation, soil salinity exhibits a predictable temporal migration pattern. Initial hypersaline conditions strongly suppress vegetation establishment, whereas long-term anthropogenic amelioration reduces topsoil salt ion concentrations, forming a distinct vertical ‘top-down’ desalination gradient [38]. These salinity dynamics critically regulate soil–vegetation carbon interactions, yet systematic investigations into salinity–GHG coupling mechanisms across reclamation chronosequences remain limited. Notably, salinity exerts opposing controls on CO2 and N2O emissions—elevated salt content promotes CO2 efflux via organic matter destabilization while concurrently inhibiting nitrification to reduce N2O production. Agricultural interventions may disrupt this natural equilibrium, necessitating a quantitative assessment of how reclamation duration modulates agroecosystem carbon cycling. This study primarily utilized the reclaimed wetlands for dry agriculture, focusing on two greenhouse gases, CO2 and N2O. The research involved observations of GHG flux exchanges in four mudflat coastal wetland systems with 65, 49, 41, and 16 years of reclamation along the southeastern coast of China, to (I) quantitatively compare seasonal CO2 and N2O source–sink balances across reclamation chronosequences, establishing the GHG status of agroecosystems in reclaimed coastal wetlands; (II) identify the key environmental factors affecting CO2 and N2O balances under temporal changes and crop rotation systems; and (III) analyze the direct and indirect pathways through which environmental factors mediate greenhouse gas fluxes. This investigation addresses critical knowledge gaps in GHG flux dynamics during land use transition from coastal wetlands to cultivated croplands, providing novel insights for carbon sequestration strategies in reclaimed coastal agricultural ecosystems.

2. Materials and Methods

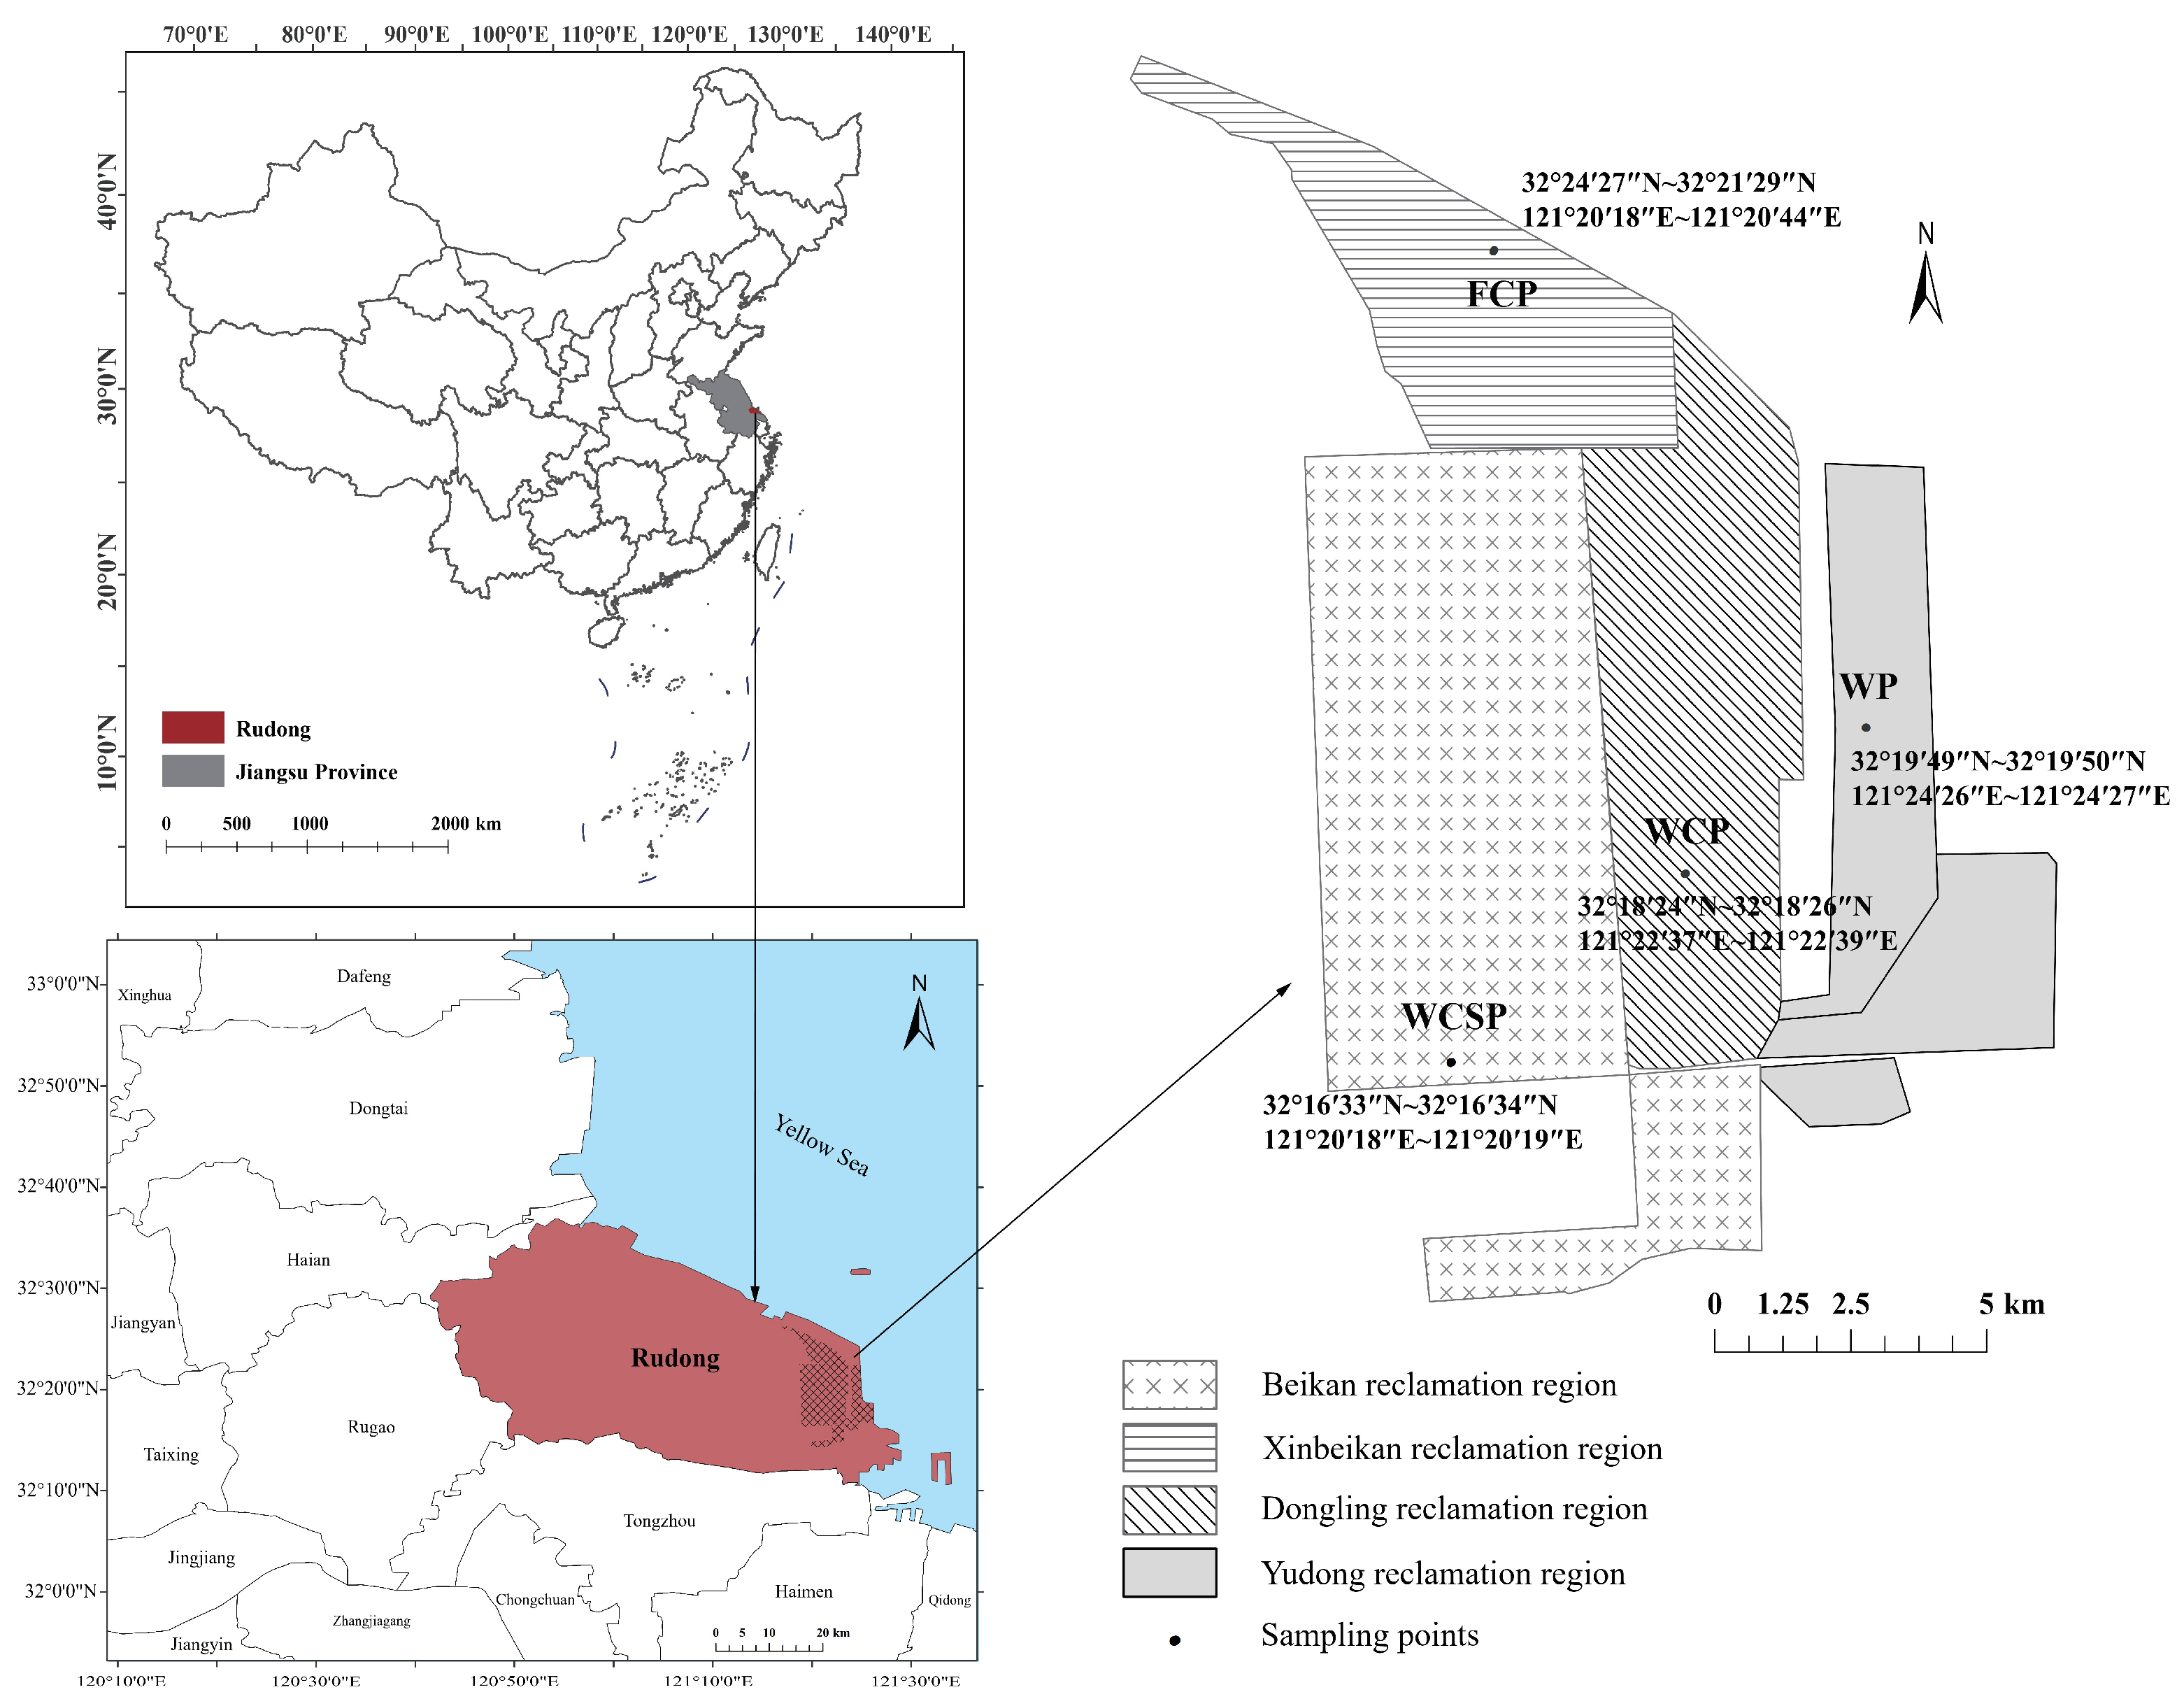
2.1. Study Area and Sampling Sites

This study is located in Rudong County (32°12′ N–32°36′ N, 120°42′ E–121°22′ E) in southeastern Jiangsu Province, situated on the northern flank of the Yangtze River Delta at the confluence of the Yangtze River and the South Yellow Sea (Figure 1). The region experiences a northern subtropical monsoon humid climate with abundant light, simultaneous rain, and heat. The average annual temperature is 15.9 °C, while the average yearly precipitation is 1155.6 mm. As a typical coastal reclamation area, the site features saline soils with expanding reclaimed farmland due to increasing human activities.
This study sampled the reclaimed farmland in the coastal wetland of Rudong County, Jiangsu Coastal area, which has a history of reclamation. Following representativeness (covering the range of reclamation histories), typicality (characteristic of regional land use patterns), and consistency (stable land use over the past decade) principles in sample point selection, this study used four reclamation areas from different reclamation eras as research subjects. Each reclamation area contained three replicate sampling points (Figure 1). Several sites show stable land use patterns over the last decade (Table 1). Each sampling point was stably utilized, minimizing confounding effects from recent land use changes.
In this study, a soil chronosequence spanning 65 years was identified. To investigate temporal patterns of ecosystem development following reclamation, we employed a space-for-time substitution (SFTS) approach [39]. This method is widely used in ecological studies when long-term monitoring data are unavailable, allowing researchers to infer temporal dynamics by examining sites of different ages that share similar environmental conditions and management histories [40]. The validity of this approach rests on three key assumptions: (1) the selected sites share similar initial conditions, (2) the environmental gradients are minimal compared to the age gradient, and (3) the sites have experienced similar management regimes. In our study, all selected sites had comparable geomorphological settings, soil parent materials, and regional agricultural management practices, differing primarily in their reclamation history.

2.2. Gas Flux Measurements

Greenhouse gas (CO2 and N2O) fluxes were measured at 19 time points spanning the 2022–2023 agricultural cycle, using static chamber–gas chromatography techniques. Sampling intervals were stratified seasonally, including monthly sampling, bimonthly (transition periods), and weekly (growing season) measurements. All sampling events occurred between 09:00 and 11:00 local time to minimize diurnal variation effects. The seasonal settings discussed in this paper include spring (March–May), summer (June–August), autumn (September–November), and winter (December–February). Gas samples were collected and analyzed in a static box using gas chromatography. Transparent polycarbonate chambers (70 cm height × 70 cm diameter) equipped with internal fans were deployed for 40-min sampling periods, with gas samples collected at 10-min intervals (0, 10, 20, 30, and 40 min) using evacuated vials. Gas concentrations were analyzed within 24 h using a gas chromatograph (Agilent 8860, Santa Clara, CA, USA) equipped with electron capture and flame ionization detectors.
In this study, gas fluxes were measured using static box–gas chromatography. The GHG flux was determined as the change in GHG concentration per unit time per unit area of the static box [41,42]. The gas flux (mg·m−2·h−1) was calculated using the following formula:
F = ρ H d C d t 273 273 + T ,
where F represents the gas emission flux (mg·m−2·h−1), indicating the amount of greenhouse gases released per unit of time per unit of area. ρ represents the density of the greenhouse gas (g·L−1), calculated by the ideal gas equation of state, where CO2 and N2O are used as standard molecular weights, respectively. dc/dt is the rate of change of gas concentration in the chamber (mL·m−3·h−1), obtained by linearly fitting the slope to the gas concentration in the box. H is the height of the sampling chamber (m). T is the average air temperature inside the box at the time of sampling (°C), recorded by the temperature sensor inside the box. The value 273 is the constant of the gas equation. Five gas samples were collected in each sampling set, and a test was performed by fitting a straight line to the gas concentration with corresponding time intervals (0, 10, 20, 30, and 40 min) with an R2 value greater than 0.87 (p < 0.05). The gas emission fluxes can be calculated by combining parameters such as atmospheric pressure, air temperature, universal gas constant, effective height of the sampling box, and molecular weight of target gases. Cumulative gas emissions, total cumulative gas emissions, and global warming potential (GWP) are derived from the fluxes of gas emissions [43,44]. Global Warming Potential (GWP) was calculated using the 100-year timeframe as per IPCC AR6 guidelines [45]. The equations for calculating these values are provided below:
F ¯ = i = 1 n F i × d i d   G = F ¯ × 24 × d 100
F = ρ H d C d t 273 273 + T ,
G W P = G C O 2 × 44 12 + G N 2 O × 44 28 × 265
where F i represents the gas emission flux at the ith sampling, with CO2 measured in C and N2O in N (mg·m−2·h−1), d i is the number of days between the ith sample and the next sample, while d represents the total number of days. G denotes the total emissions, with CO2 measured in C and N2O in N (kg·ha−1). C i + 1 refers to the cumulative emissions of gases between the ith and i+1 sampling period (kg·ha−1).

2.3. Vegetation Sampling and Analysis

This study involved the collection of vegetation from different crops during various cropping periods in four reclamation areas. The collection occurred during the crop harvesting season, and both above-ground vegetation components and below-ground root systems were collected. Biomass was estimated at each sample plot using 0.5 × 0.5 cm sample boxes for vegetation. All vegetation within the sample box was cut to separate its roots and leaves, and whole vegetation carbon was determined using a Vario EL cube organic element analyzer (Elementar, Langen, Germany). Furthermore, vegetation samples were then cleaned and dried, and aboveground biomass was determined. A few samples of each part of the plant were ground, and the carbon content of each part of the plant was determined using a C/N elemental analyzer (Vario PYRO, Elementar, Langen, Germany).

2.4. Soil Sampling and Analysis

Soil samples were collected from six different depths (0~10, 10~20, 20~30, 30~40, 40~50, and 50~60 cm) using stainless steel corers. Subsequently, soil bulk weight was measured using ring knife method [46]. Some of the soil samples were brought back to the laboratory, air-dried, ground, and passed through a 2 mm sieve for soil physico-chemical property tests. Some of the pre-treated soil samples were used to determine soil carbon and nitrogen content using the combustion oxidation–elemental analyzer method (vario-macroCN Elementar, Germany). The leaching–spectrophotometer method determined NH4+-N and NO3−-N (GB/T 42485) [47]. TN was determined by the Kjeldahl method (GB/T 6432) [48]. A digital pH meter was used to determine the pH value of the soil leachate with a 1:5 soil–water ratio to determine the soil acidity and alkalinity (pH). A Mettler Toledo Experimental Conductivity Meter (FE30, Mettler Toledo Instruments, Shanghai, China) was used to determine the electrical conductivity (EC), and soil water content (SWC) was measured using the drying and weighing method. This study employed the conductivity method to assess water-soluble total salts in saline soils. The conversion of conductivity to soil salt mass was conducted using the relationship between soil salt mass fraction and conductivity. The formula for salinity content ( S C ) (g·kg−1) is provided below:
S C = E c 0.0033 0.28989
where E c refers to the soil’s electrical conductivity.

2.5. Statistical Analyses

Statistical analyses were performed using SPSS 26 and R 4.3.3. One-way analysis of variance (ANOVA) was conducted to assess differences in gas, soil, and vegetation component indices across reclamation years, followed by Fisher’s Least Significant Difference (LSD) post hoc test for pairwise comparisons (α = 0.05). The repeated-measures ANOVA model evaluated fixed effects of season (within-subject) and site (between-subject) on N2O fluxes. Redundancy analysis (RDA) was implemented using the vegan package in R to examine relationships between greenhouse gas (GHG) fluxes and environmental factors [49,50]. Partial Least Squares Path Modeling (PLS-PM) was performed via the plspm package to evaluate direct and indirect effects of environmental variables on GHG emissions [51,52]. Direct pathways show immediate variable impacts, while indirect pathways operate through mediators. Model fit was assessed using the Goodness-of-Fit (GOF) index, where GOF > 0.50 was considered acceptable for exploratory research and GOF ≥ 0.70 indicated strong fit. Data visualization was generated using OriginPro 2023 (v9.9.0.225), R software (v4.3.3) and the ggplot2 package (v3.4.4).

3. Results

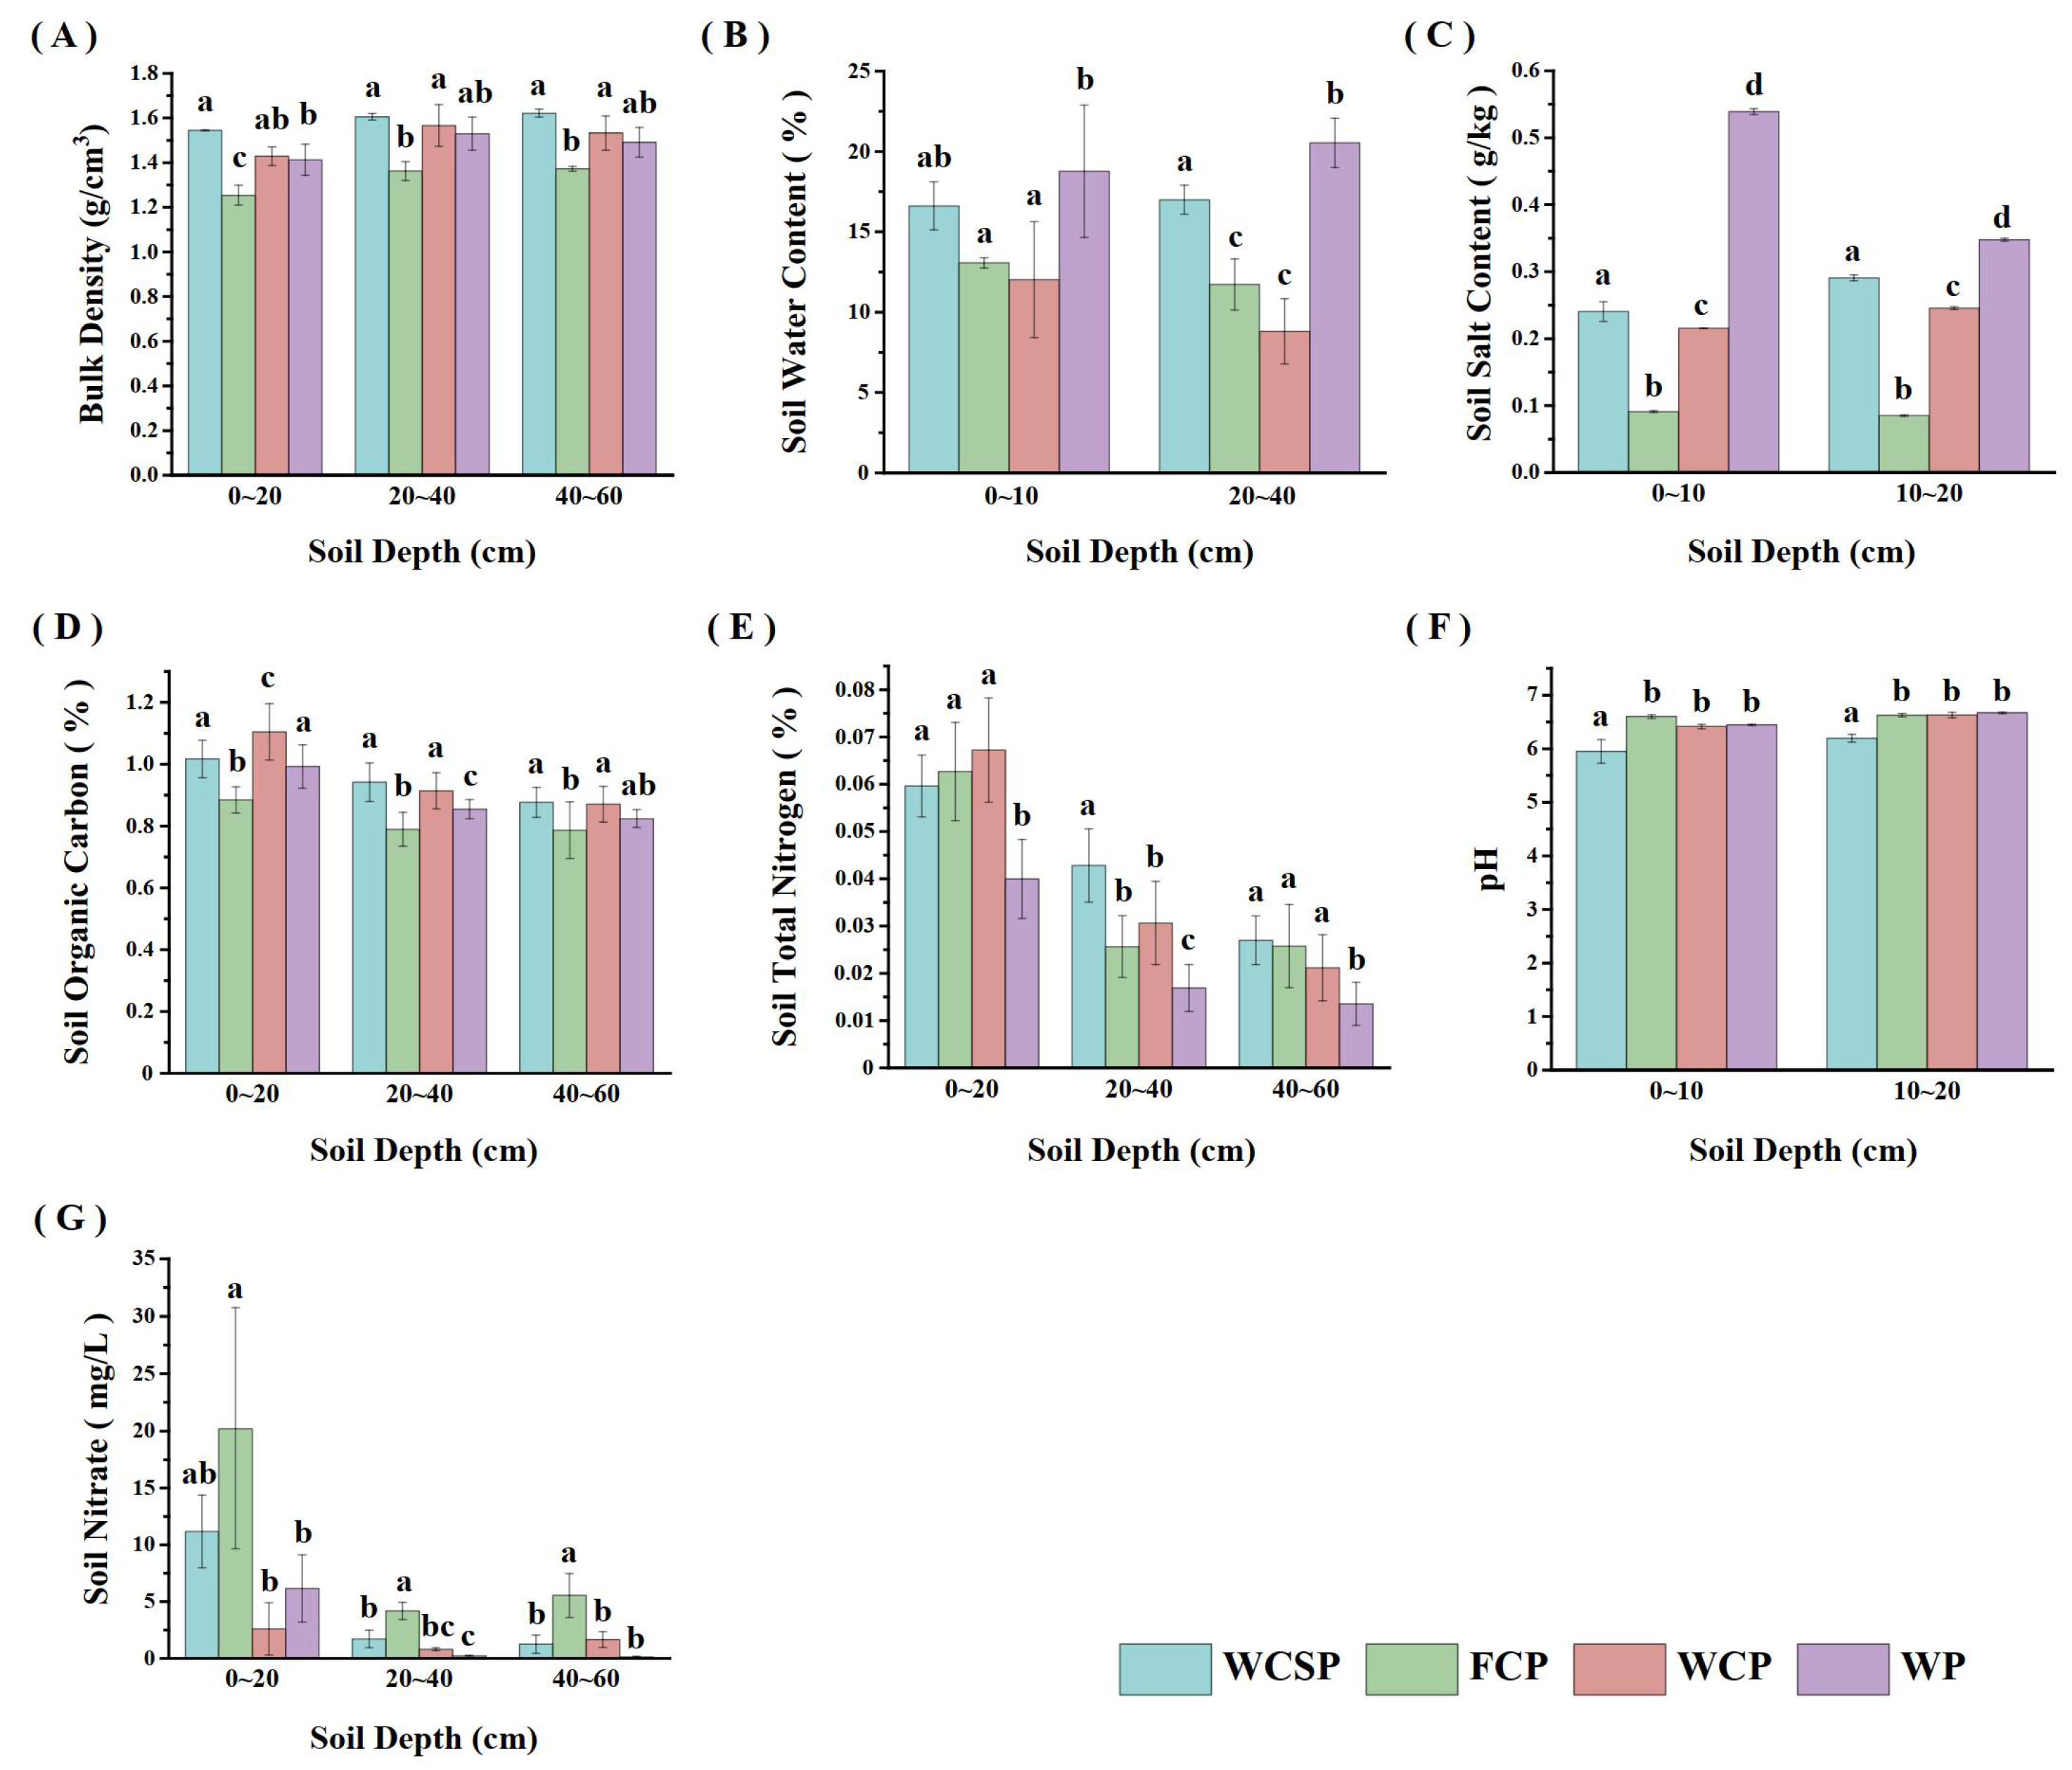
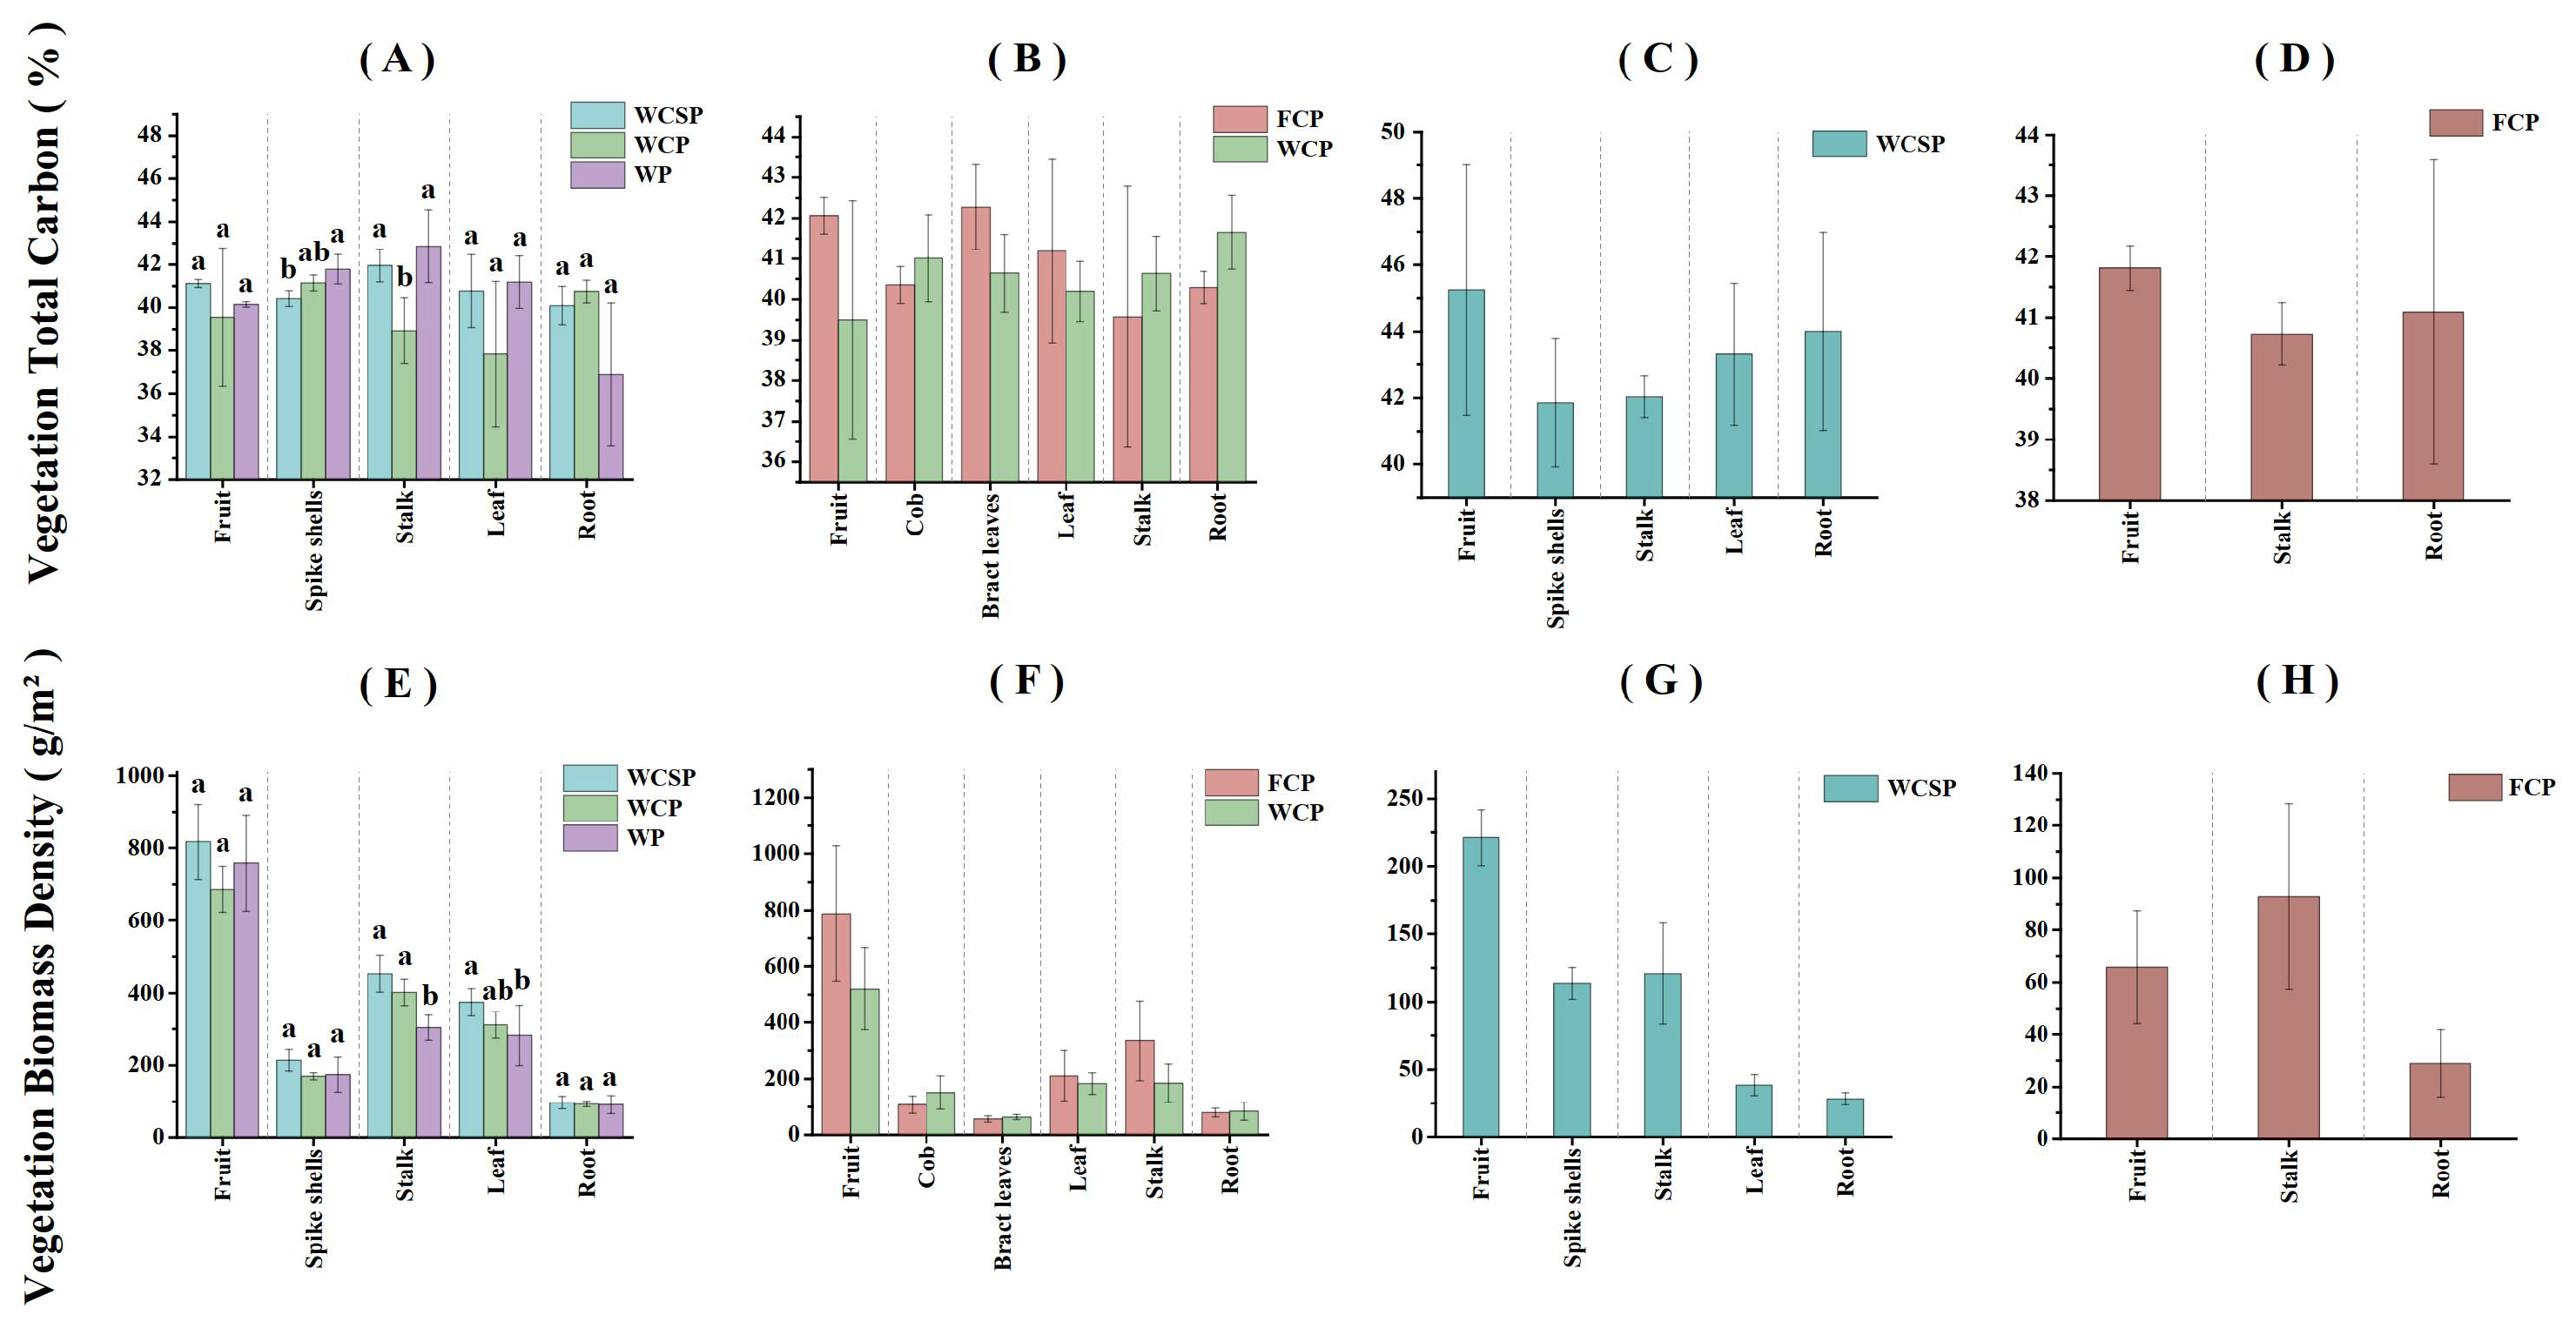
3.1. Description of Soil and Vegetation Traits

Soil and vegetation’s physical and chemical properties in the reclaimed area during the study period are presented below (Figure 2 and Figure 3). For some obvious factors, soil water content (SWC) varied from 6.64% to 22.30%, while soil salinity (SC) ranged from 0.0841 g·kg1 to 0.542 g·kg1. The pH of the soil ranged from 5.7 to 6.68. Additionally, the soil organic carbon content (SOC) ranged from 0.67% to 1.37%, and the soil total nitrogen content (STN) was between 0.008% and 0.102%. Soil structure and nutrient composition improved with increasing years of reclamation. For instance, BD, SOC, and STN were found to be higher at WCSP compared to other samples (p < 0.05), although their pH was significantly lower than that of other samples (p < 0.001). As years of reclaiming increased, there was an observed increase in soil maturity. For instance, soil total nitrogen in WP (the sample area was reclaimed in 2007) was significantly less than (p < 0.05) in the previously reclaimed area (Figure 2C). Moreover, there was also a decrease in salinity levels with a longer history of reclamation. Samples in WP showed significantly higher SC than other samples (p < 0.001). Significant differences were observed between surface and subsurface layers regarding various soil properties. However, most physicochemical parameters of samples from different depths in the subsurface were not statistically different (p > 0.05). In conclusion, for saline-amended cropland, the surface soil of arable land under the effect of reclamation activities has a more pronounced response.
Comparing the total biomass densities of the different sites, it was found that WCP had the highest total biomass density, of 2472.2 to 3124.1 g/m2 (maize’s total biomass density ranged from 919.6 to 1328.3 g/m2 and wheat’s total biomass density ranged from 1517.6 to 1795.8 g/m2). WP had the lowest total biomass density, of 1328.92–1958.16 g/m2 (total biomass density of wheat crop only). Figure 3 illustrates the biomass density and total carbon index at harvest time for various vegetation types across different sites. However, no significant difference was observed when comparing the total carbon content of wheat crop leaves, fruits, and roots of vegetation (p > 0.05) among WCSP, WCP, and WP. Combined with the biomass data, the average carbon fixations of the crops in the four reclamation sample plots during a year were as follows: 1024.88 g C/m2 for WCSP, 722.54 g C/m2 for FCP, 1139.79 g C/m2 for WCP, and 652.89 g C/m2 for WP.

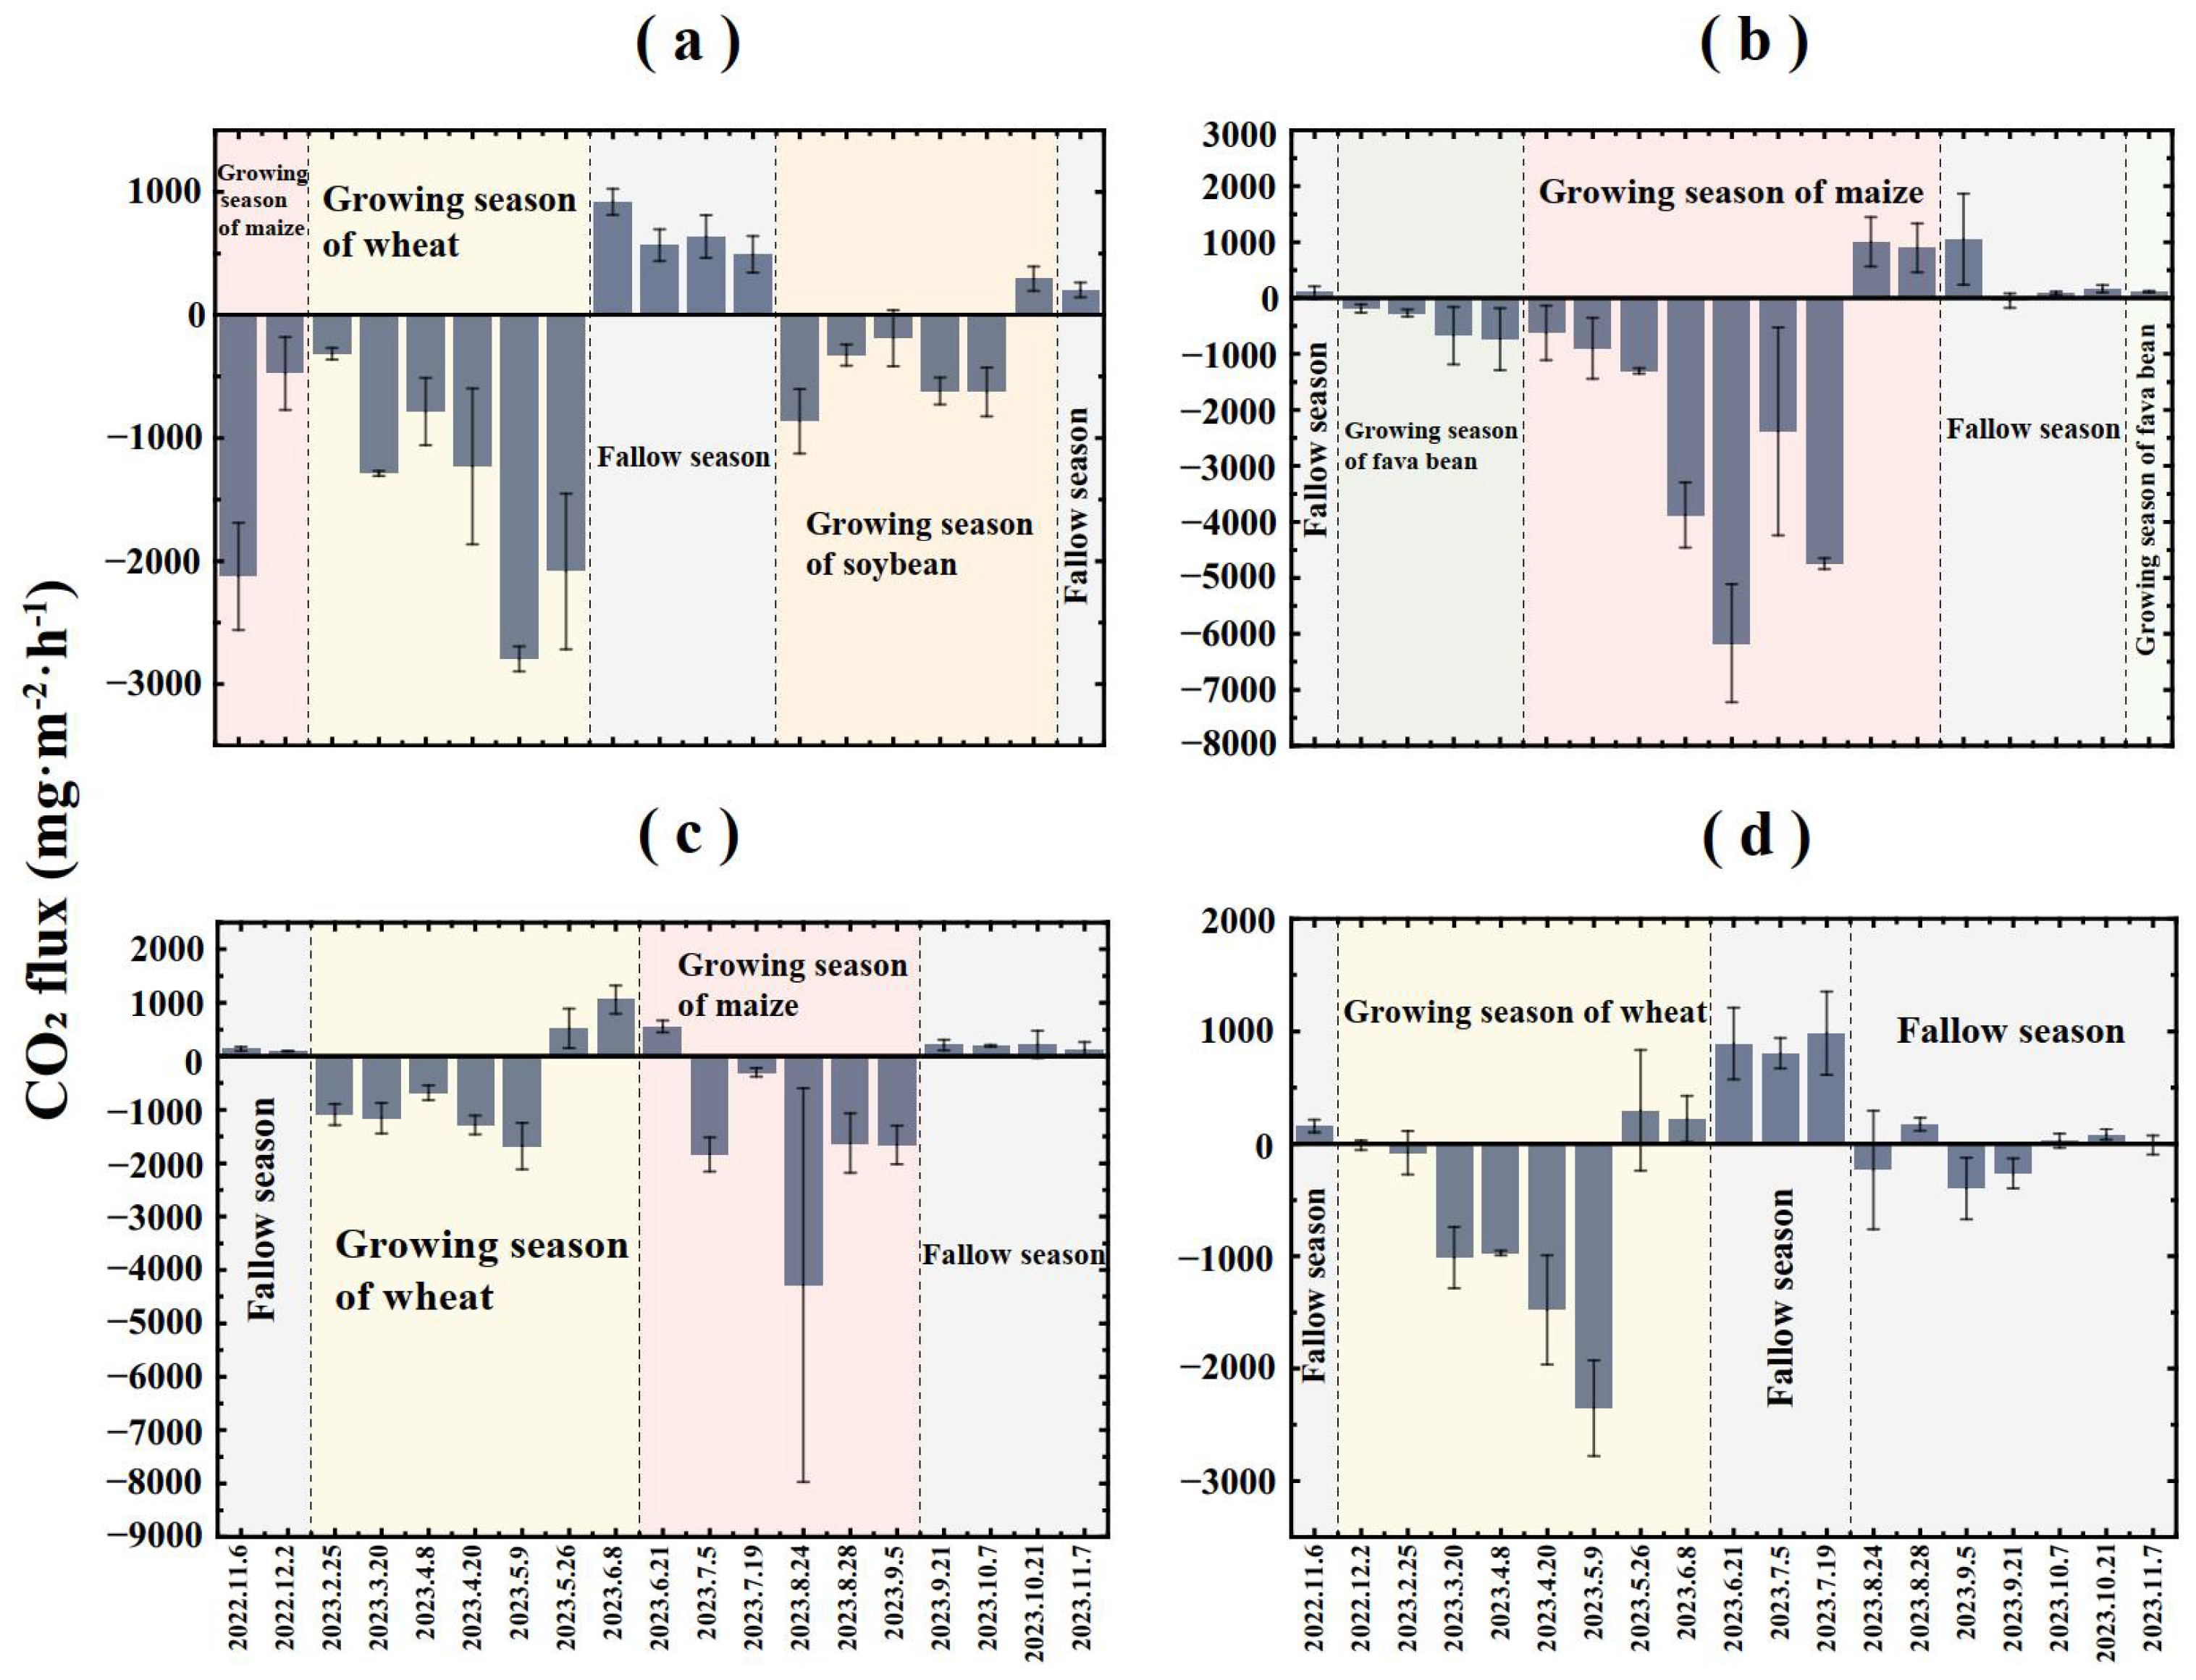
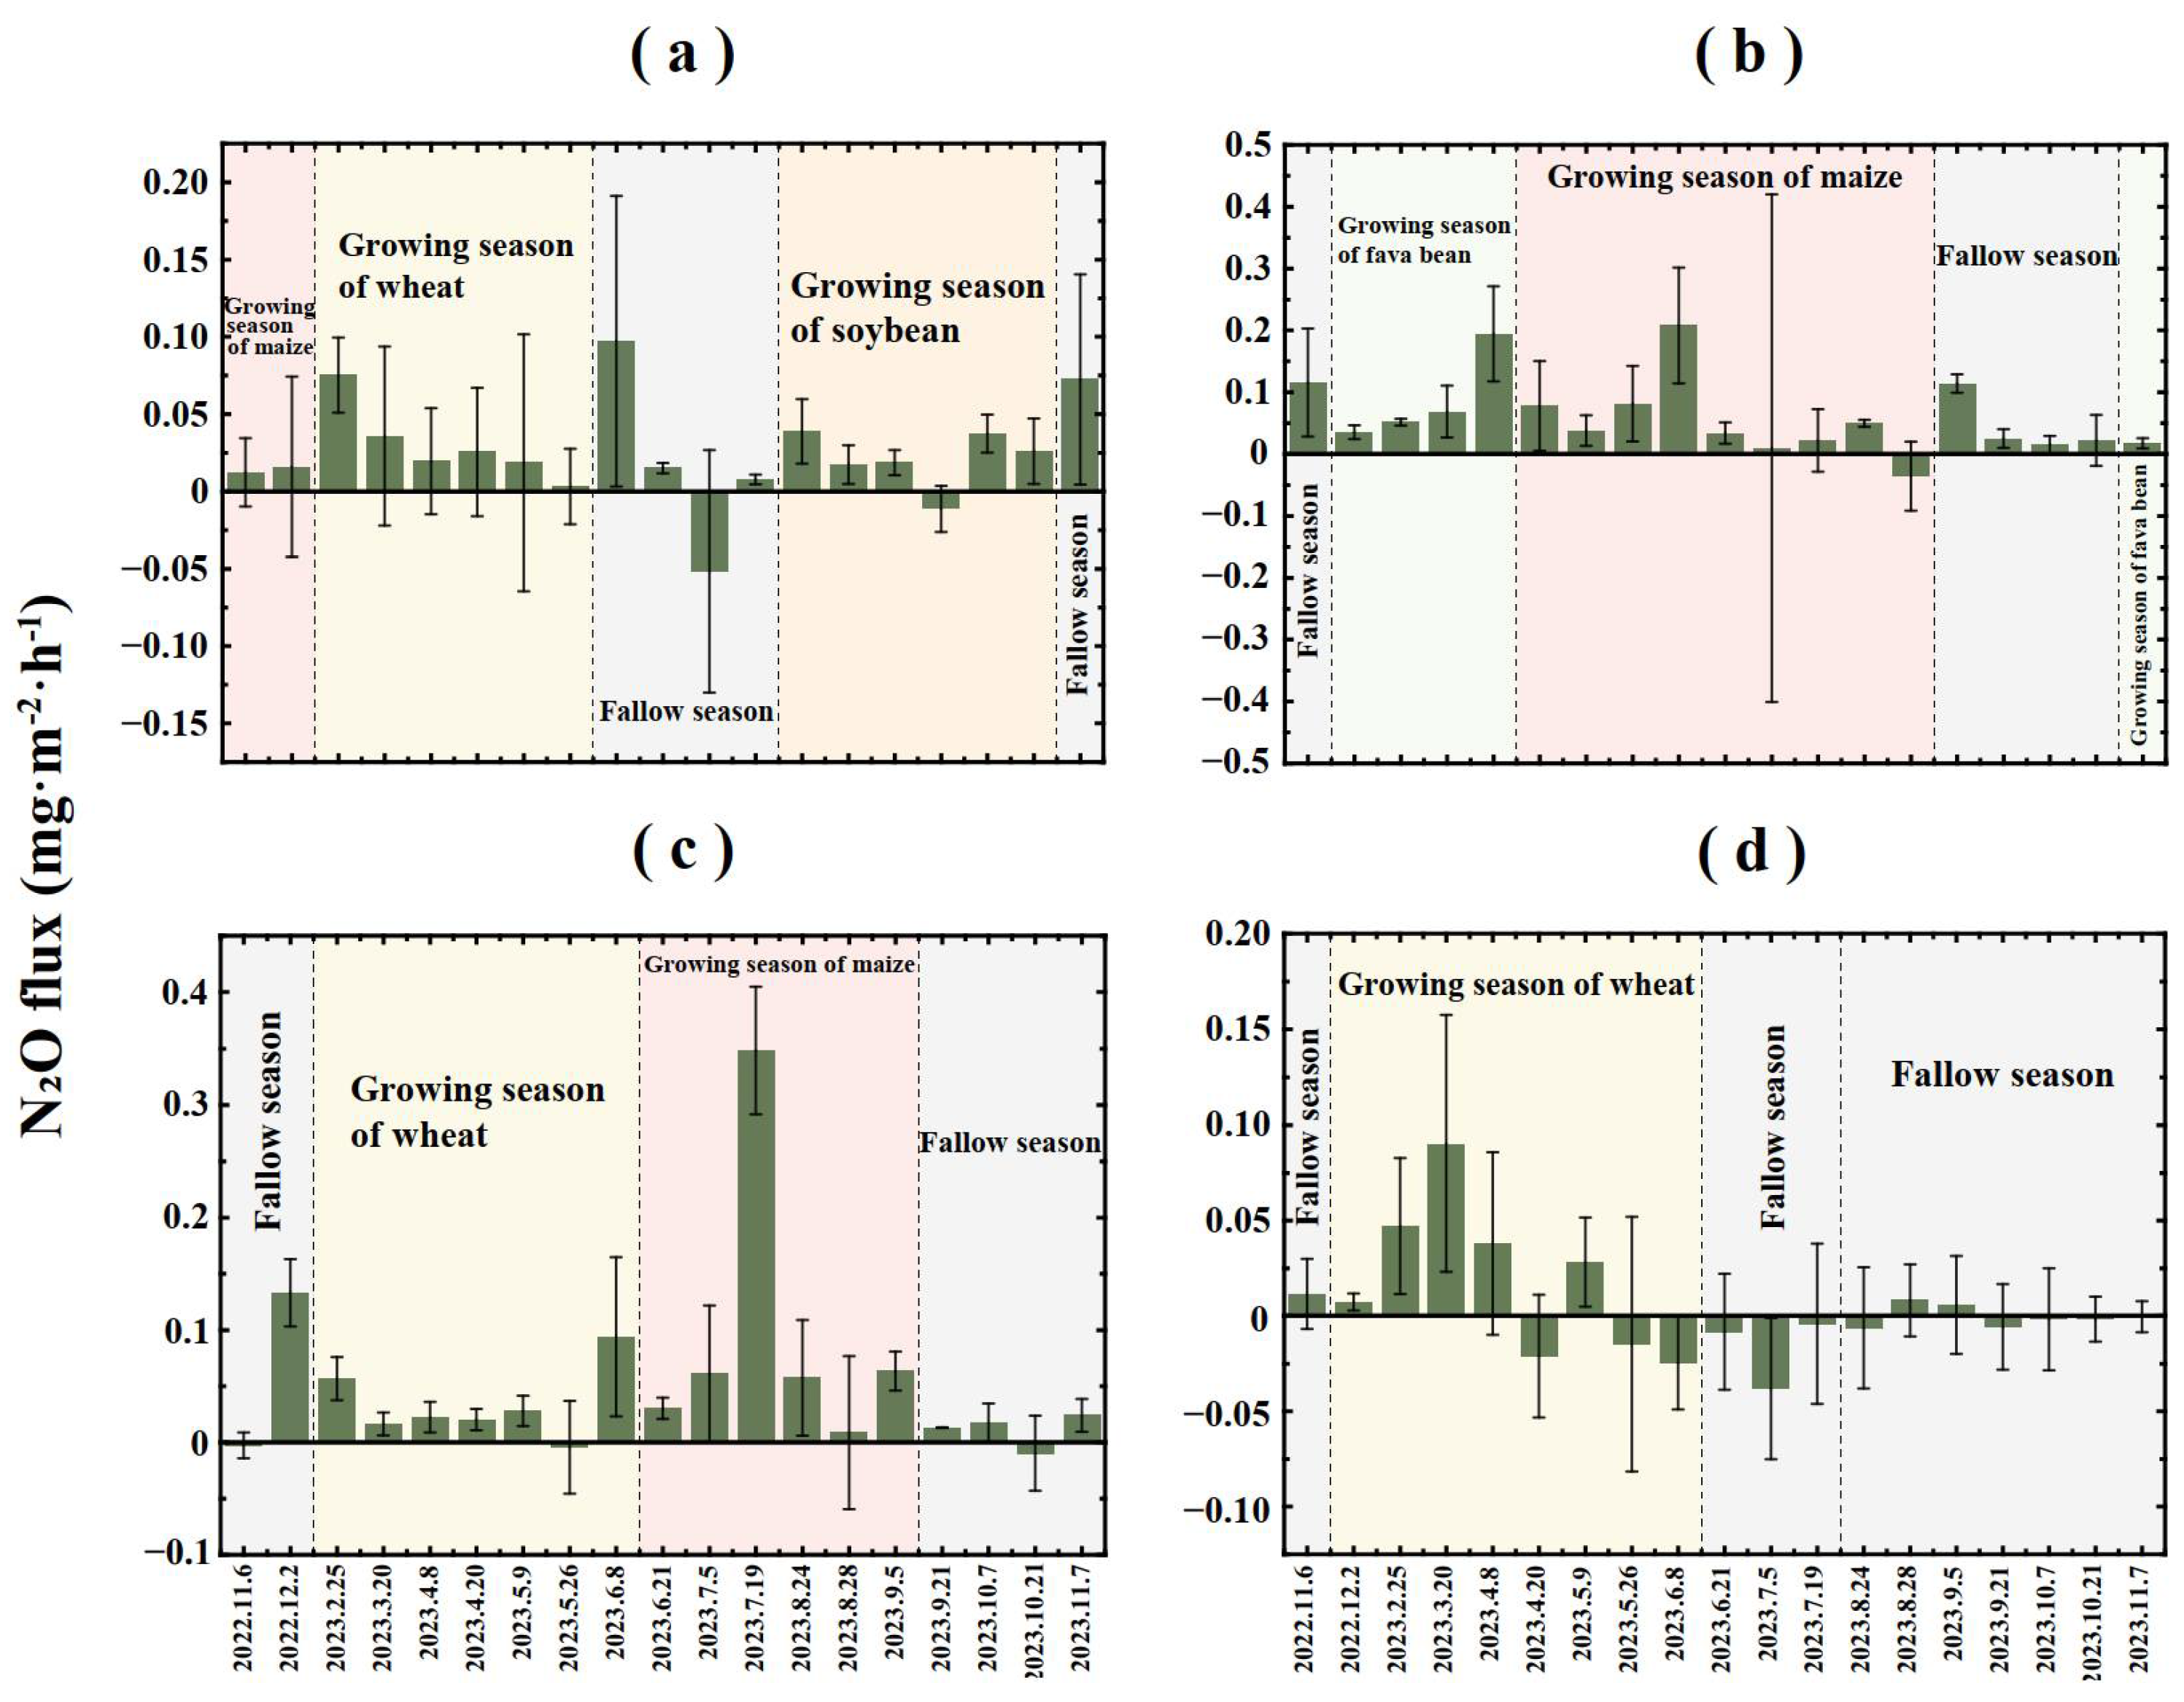
3.2. Analyses of the Dynamic Seasonal-Scale Gas Carbon Fluxes and Greenhouse Gas Emissions

The gas flux variation at different sampling times of the coastal reclamation during the study period is illustrated in Figure 4. CO2 fluxes ranged from −7394.62 mg·m2·h1 (WCP sample site, August 2023) to 1878.58 mg·m2·h1 (FCP sample site, September 2023) for all sample sites during the sampling period (Figure 4). This contrasts with positive values denoting net carbon release to the atmosphere. The difference in monthly CO2 flux status was found to be extremely significant (p < 0.001). The difference in mean CO2 fluxes between corn and the other crop growth periods was found to be highly significant (p < 0.001). Furthermore, it was observed that the CO2 fluxes during the crop fallow period were significantly greater than the CO2 fluxes during the growing periods of both wheat and maize (p < 0.001), as well as being significantly greater than the CO2 emissions during the growing period of fava bean (p < 0.05). In spring and winter, the CO2 flux during the fallow period of WP was higher (Figure 4d) at 86.05 mg·m2·h1, while the CO2 flux during the fallow period of FCP was higher in summer and autumn (Figure 4b), at 1878.58 mg·m2·h1. Overall, there were significant seasonal differences in CO2 fluxes between spring/summer and autumn/winter (p < 0.01). However, no significant difference was found between autumn and winter (p > 0.05). The trend of the CO2 fluxes in each reclamation area generally exhibited fluctuating changes throughout the months studied. In terms of total CO2 emissions, the average CO2 emissions of WCSP, FCP, WCP, and WP were −51,273.44 kg·ha1, −94,856.25 kg·ha1, −36,557.534 kg·ha1, and −9696.77 kg·ha1, respectively (Table 2). Negative CO2 flux values indicate net carbon uptake by the soil–plant system (i.e., the ecosystem functioning as a carbon sink), in which photosynthetic fixation exceeds respiratory emissions. During the growing periods of different sites, there were significant differences (p < 0.05) in CO2 emissions between the FCP and WP sample plots (Table 3). Additionally, significant differences (p < 0.05) in CO2 emissions were observed among the WSCP, WCP, and WP sample plots when considering different fallow periods of the same land (Table 3).
The trend of the N2O fluxes remained relatively consistent throughout the study period. The N2O fluxes at all the sample sites varied from −0.001491 mg·m2·h1 (October 2023 at FCP sample plot) to 0.18217 mg·m2·h1 (June 2023 at WCSP sample plot) (Figure 5). The N2O emission status differed significantly (p < 0.05) from month to month for all the sample sites. Still, there was no significant seasonal difference (p > 0.05) in the overall N2O flux exchange. In terms of total N2O emissions, the average N2O emissions for WCSP, FCP, WCP, and WP were 1.674 kg·ha1, 5.016 kg·ha1, 7.329 kg·ha1, and 0.701 kg·ha1, respectively (Table 2). Marginal differences existed among the reclamation sites (F = 3.84, p = 0.057, η2 = 0.59), with FCP exhibiting the highest average flux (0.054 ± 0.021 mg·m2·h1) and WP the lowest (0.007 ± 0.025 mg·m2·h1). The WCSP emitted 34% less during growth periods than FCP (p = 0.03). For growing season and fallow period comparisons, the flux decreased by 52% during fallow periods compared to growth seasons (F = 5.18, p = 0.052, η2 = 0.40), with consistent reduction patterns across all the sites (season × site: F = 1.08, p = 0.41). In terms of the N2O emissions during the growing period in different sample plots, there was a significant difference (p < 0.05) between the N2O emissions of WCSP and FCP. Additionally, significant differences (p < 0.01) were observed in the N2O flux exchanges between WCP and other sample plots during the fallow period for different sites (Table 3). With a significant overall effect (F = 2.52, p = 0.042, η2 = 0.043) but small effect size, the N2O fluxes were found to be significantly lower in soybeans than in wheat and corn during the growth period (p < 0.05).

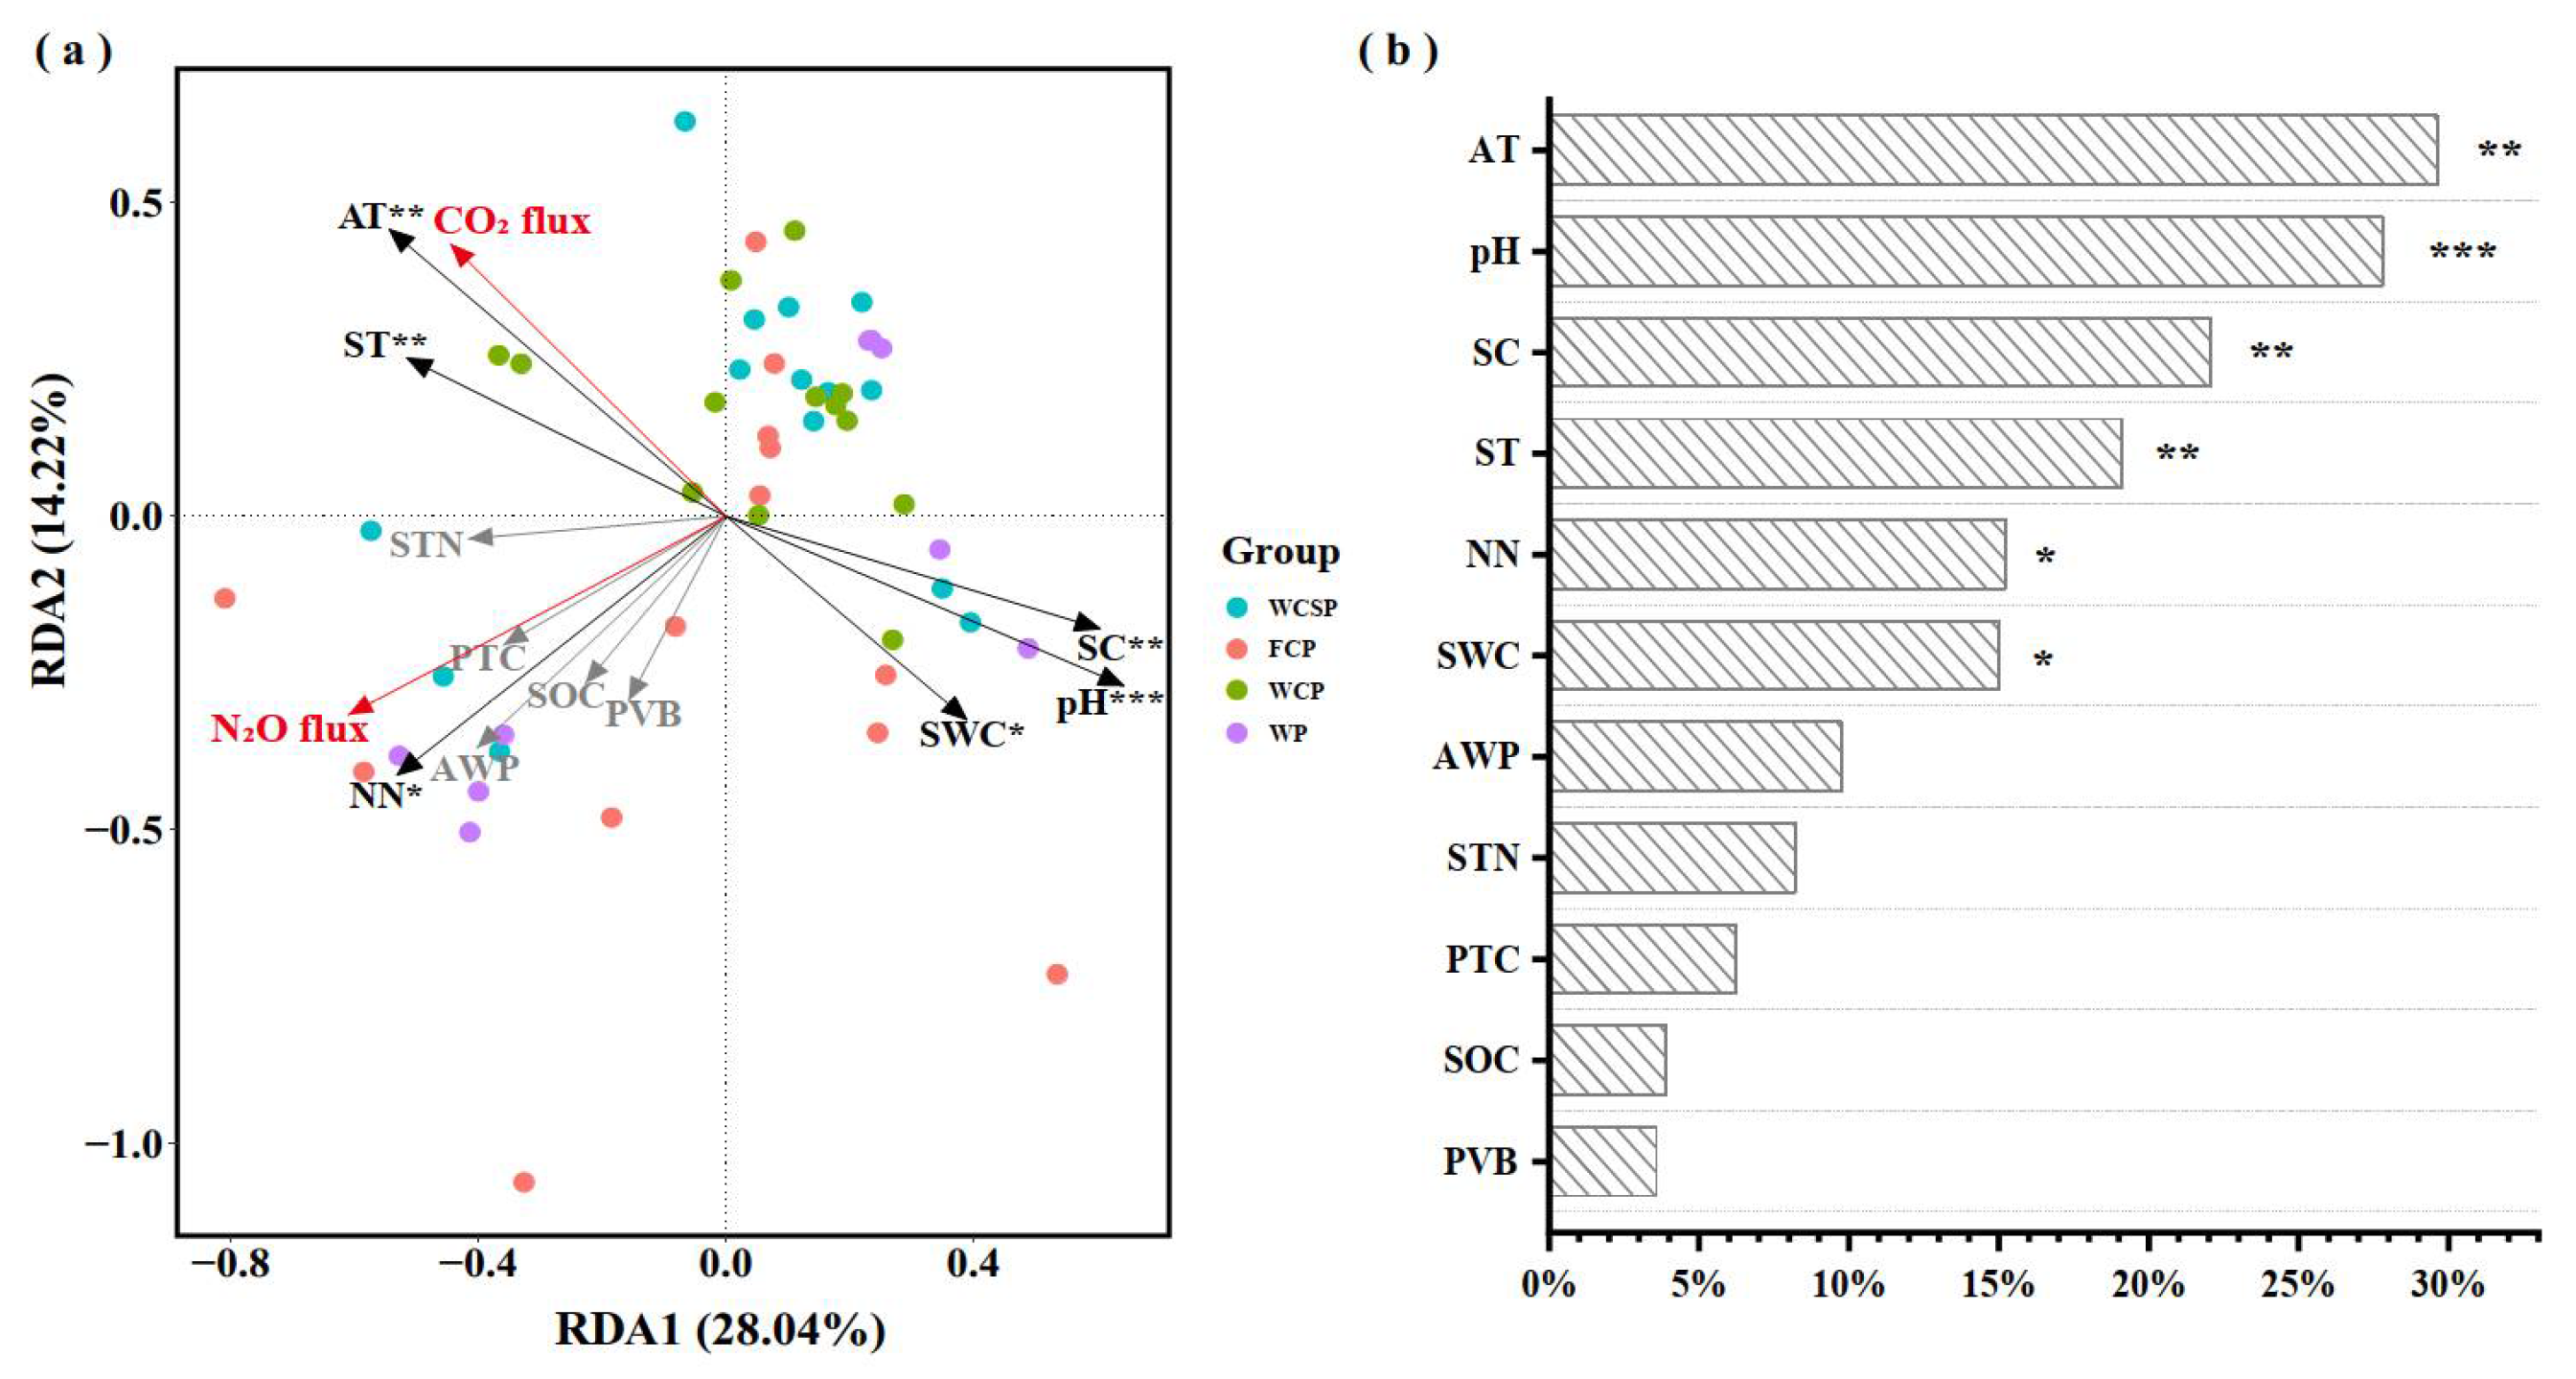
3.3. Environmental Drivers of GHG Flux Exchange in Coastal Reclamation Areas

The RDA method was utilized to elucidate the impact of environmental factors on GHG flux exchange. The selected environmental variables were chosen based on their established ecological relevance to GHG fluxes in restored ecosystems. Soil temperature (ST) and soil water content (SWC) are fundamental regulators of biogeochemical processes, while soil organic carbon (SOC) and nitrogen availability (nitrate nitrogen, NN; soil total nitrogen, STN) serve as key factors in CO2 and N2O production. Soil salinity (SC) and pH reflect critical saline–alkali soil characteristics. Plant total carbon (PTC) and vegetation biomass density (PVB) represent vegetation carbon status. Atmospheric temperature (AT) and precipitation (AWP) were included as essential climate drivers. The multicollinearity among the predictors was assessed using variance inflation factors (VIFs), with all the variables exhibiting VIF values < 10, indicating acceptable collinearity for multivariate analysis. The results of the redundancy analysis (RDA) (Figure 6) revealed that the spatial and temporal variations of the CO2 and N2O flux exchanges within the year were primarily influenced by temperature, soil hydrothermal environment, and soil salinity environment, which collectively accounted for 80.78% of the variance (Figure 6b). This suggests that temperature, soil moisture, soil temperature, soil pH, and soil salinity play a significant role in explaining GHG fluxes in coastal reclaimed wetlands alone, making them key drivers influencing greenhouse gas exchange. Specifically, temperature significantly impacts CO2 flux exchange, while soil nitrate nitrogen has a greater influence on N2O exchange. Additionally, both GHG flux exchanges are affected by coastal beach soil salinity, as well as overall salinity interference (Figure 6a).
PLS-PM was employed to elucidate further the direct and indirect pathways by which soil properties, vegetation carbon pools, and external climatic conditions impact CO2 and N2O gas flux exchanges, as well as the greenhouse gas source and sink status in coastal wetland reclamation areas (Figure 7). The results indicated that soil temperature (ST) had a significant direct effect on CO2 flux exchange (direct effect = 7.94, p < 0.05), as did the saline and alkaline environment (SPS) (direct effect = 9.381, p < 0.01). Conversely, soil bulk density (SBD) showed a non-significant direct effect on CO2 flux exchange in general (direct effect = −0.907, p = 0.09), as did soil carbon pools (Soil C) (direct effect = 0.258, p > 0.05). In addition, soil temperature, closely linked to climatic conditions, and saline and alkaline environments in the coastal reclamation have a more pronounced impact on CO2 fluxes (significant path: Climate–ST-CO2 flux; SPS-CO2 flux). Based on PLS-PM analyses, for the soil nitrogen environment, soil total nitrogen (STN, direct effect = 3.301, p < 0.05) and nitrate nitrogen (SNN, direct effect = 0.748, p < 0.05) showed a significant positive effect on N2O flux exchange. The saline environment (SPS, direct effect = −4.34, p < 0.01) and the soil hydrothermal environment (SWT, direct effect = −0.785, p < 0.05) showed a significant negative effect on N2O flux exchange. In contrast, the vegetation carbon pool (Plant C, direct effect = −0.119, p > 0.05) did not show overall significance for N2O flux exchange. In addition, nitrogen and saline environments influenced by climatic conditions have a more sensitive effect on N2O flux exchange (significant pathways: Climate–STN-N2O flux, Climate–SPS-N2O flux, SNN-N2O flux).

4. Discussion

4.1. Responses of CO2 and N2O Emissions to Wetland Reclamation and Saline–Alkali Dynamics

In this study, observations of greenhouse gases in coastal wetlands in southeastern China were carried out, contributing to targeted carbon sequestration and emission reduction in coastal reclaimed wetlands. The CO2 fluxes of the reclaimed wetlands were all in obvious seasonal patterns (Figure 4). That is, the coastal reclaimed wetlands clearly showed a CO2 gas sink during the crop growing period, and a clear CO2 source during the crop intercropping fallow period (Figure 4; Table 3). Vegetated drylands significantly reduced CO2 concentrations through crop-mediated carbon sequestration [53]. Photosynthesis converted atmospheric CO2 into biomass, while deeper root systems enhanced soil carbon storage, consistent with He’s observations in Yangtze River wetlands [22].
Regarding the CO2 sequestration capacity in different seasons, it was found to be strongest during the summer rainy season, which is consistent with Wang et al.’s study in the coastal reclaimed wetland of Chongming, Shanghai. The peak CO2 sequestration occurred during summer rains, aligning with Wang et al.’s findings in Chongming wetlands [19]. Soil respiration increases with rising temperatures within a certain range. This reflects temperature-dependent respiration dynamics [54,55,56,57]. Higher temperatures increase systemic respiration, thereby increasing CO2 flux exchange [58,59]. Accordingly, we identified a pathway of positive influence of soil temperature on CO2 flux (direct effect of 7.94; Figure 7). In this study, the CO2 flux balance showed a significant positive correlation with soil water content (Figure 6 and Figure 7). This could be attributed to the substantial impact of soil water content on the seasonal dynamics of soil respiration [60]. It is widely acknowledged that soil moisture has a threshold effect on soil respiration. When the soil moisture is low, it becomes the limiting factor for soil respiration; however, beyond a certain threshold, excessively high moisture content reduces soil respiration rates by impeding CO2 diffusion through the soil and CO2 release. This may be due to low gas diffusion rates and reduced aerated porosity resulting from excess moisture, which limits respiration and leads to increased anaerobic conditions [61]. Critically, soil temperature and moisture are recognized as the primary physical factors controlling carbon mineralization in soils. They influence gas diffusion through soil pores by affecting microbial and root activity, thereby impacting CO2 exchange fluxes. Soil moisture exhibited threshold effects on respiration [45,46]: low moisture limited microbial activity, while saturation impeded CO2 diffusion. As key controllers of mineralization, temperature and moisture jointly regulate gas diffusion via microbial and root activity [62]. An interesting discovery from this research was the presence of spatial regularity in total annual CO2 emissions. The total annual CO2 emissions from the different polder areas ranged from the ocean to the inland (Figure 1; Table 3). There was a decreasing trend in the total CO2 emissions from sea to land, which may be attributed to the increasing years of reclamation from sea to land. The influence mechanism can be considered as the soil salinity and the soil acid–base environment playing an irreplaceable role (Figure 6 and Figure 7). The coastal soils in Jiangsu are typical saline soils, formed mainly by the deposition of river sediment into the sea through tidal power and its subsequent elevation, becoming land. The main characteristic of these soils is their high salinity due to leaching from the sea. Additionally, there is a significant positive correlation between soil salinity and CO2 flux (direct effect of 9.381; Figure 7), indicating that higher soil salinity content and pH lead to increased CO2 emissions [63,64]. This may be attributed to several factors. Firstly, salinization impacts the availability of soil unstable organic carbon, which subsequently affects microbially mediated soil organic mineralization processes [65]. Secondly, salinization has the potential to disrupt soil aggregates. Thirdly, salinization can alter the structure of microbial communities, leading to changes in nutrient patterns and availability, ultimately influencing CO2 emissions [66]. After the natural wetland has been reclaimed, the soil water salt content will gradually decrease due to natural precipitation leaching and anthropogenic cultivation improvement. Since WP is a sample site from the Yudong Reclamation Area, reclaimed in 2007, it differs from the other sample sites reclaimed earlier in the year, with higher soil salt content and mildly salinized soils. As a result, it showed a lower CO2 sequestration capacity. The small difference in annual mean CO2 fluxes between WCSP and WCP may be attributed to the proximity of the two sites and the minimal difference between the reclaimed croplands.
While the CO2 dynamics showed strong seasonality, the N2O emissions displayed distinct patterns. It was observed that during crop growth, the reclaimed agricultural land acted as a clear source of N2O (Figure 5). This finding is consistent with previous studies. Reclaimed farmland consistently acted as an N2O source during crop growth (Figure 5), confirming agricultural soils as major anthropogenic N2O emitters [67]. The mean annual N2O emissions in different reclamation areas varied spatially, as follows: 7.329 kgN·ha1 (WCP); 5.016 kgN·ha1 (FCP); 1.674 kgN·ha1 (WCSP) and 0.701 kgN·ha1 (WP), respectively. This finding is consistent with previous studies indicating that agricultural soils, heavily impacted by human agricultural activities, are the primary anthropogenic sources of N2O emissions [68]. Additionally, it was observed that saline environments affected by climatic conditions had a significant negative impact on N2O fluxes (Figure 7; with a direct effect of −4.34), resulting in lower N2O flux exchange for samples with higher salinity. This could be attributed to the following factors: (1) The low productivity of saline soils and the high intensity of agricultural production, both of which contribute to N2O emissions. (2) The fact that as salinity levels increase, the stress effect also increases, leading to the inhibition of nitrification. This, in turn, results in high soil NH4+-N retention, making it difficult for effective conversion to NO3N to take place [69,70]. Low salinity has been found to stimulate the processes of nitrification and mineralization of soil nitrogen. Conversely, elevated levels of soil salinity have been shown to weaken the capacity for soil nitrification and may potentially lead to an increase in the intensity of soil ammonia volatilization. These findings highlight the significant impact that salinity levels can have on the nitrogen cycle within soils. Such insights are crucial for understanding and managing agricultural systems in saline environments. In coastal wetlands, environmental factors such as soil temperature, hydrological conditions, nutrients, pH, and salinity significantly impact the exchange of CO2 and N2O fluxes in soil. Salinity is particularly noteworthy among these factors due to its unique environmental influence.

4.2. Responses of GHG and Soil–Vegetation Carbon and Nitrogen Pools Under Different Years of Reclamation

The combination of the soil respiration and greenhouse gas sequestration capacity of coastal reclaimed cropland with its environment constitutes an agroecosystem. This special ecosystem is intricately linked to the functioning of its various components. In turn, this ecosystem process is driven by a range of soil physical and biogeochemical processes [35]. Soil organic carbon (SOC) serves as a crucial indicator of soil fertility and quality and plays a significant role in the global carbon cycle [71]. SOC can impact the exchange fluxes of atmospheric CO2 by enhancing microbial activity, by providing material and energy to soil microorganisms. In this study, it was observed that SOC had a positive influence on CO2 fluxes, although the effect was not statistically significant (p > 0.05) (Figure 6 and Figure 7). This could be attributed to the complex and variable environment of the reclamation area, which is influenced by both terrestrial and marine ecosystems to varying degrees. The reclaimed areas of the coastal mudflats in Rudong are of different ages, leading to variations in SOC affected by tides and climate before reclamation, as well as subsequent improvement measures, such as desalination of saline soils during conversion into agricultural land in different reclaimed areas [72]. Reclamation has resulted in significant environmental disturbances. Previous research has indicated that levels of soil organic carbon (SOC) mineralization in coastal soils exhibit significant disparities before and after reclamation [73]. The conversion of vegetated wetlands to alternative land uses may lead to a reduction in SOC, resulting in a relatively narrow range of spatial variation in SOC across different reclaimed areas [74]. However, it is important to consider the potential influence of the limited time scale for observation on establishing a more substantial correlation between SOC and CO2 flux. In addition, when considering the synthesis of factors influencing the modeled pathways, it is important to note that the storage state of soil organic carbon (SOC) in coastal reclaimed areas is often influenced by a combination of soil properties [75]. It is also possible that changes in other properties, such as salinity and acidity/alkalinity, may buffer the sensitivity of SOC and its ability to alter CO2 fluxes [76]. The study area has a complex history of land use and farming practices, which have led to environmental disturbances in different reclaimed areas. Additionally, different tillage management practices can impact CO2 flux exchange [77], with CO2 fluxes potentially increasing with higher tillage intensity [78].
The increase in soil nitrogen (N) content due to farming practices had a significant positive impact on N2O emissions (direct effect of 3.301; Figure 7). Soil N2O production primarily occurs through denitrification processes, in which NH4+-N and NO3-N are transformed into each other [27]. The denitrification reaction is influenced by enzymatic reactions in the soil, with an increase in NO3-N accelerating the process. This study also found a significant correlation between N2O flux and soil NO3-N content, which positively affected the N2O flux balance (Figure 6 and Figure 7c,d), consistent with previous empirical studies showing a positive correlation between N2O emissions and NO3-N concentrations [79,80]. Additionally, previous research has shown that the use of nitrogen fertilizers significantly increases N2O emissions [81,82]. In agricultural ecosystems heavily impacted by human activities, the regularity of N2O flux exchange is closely linked to the application rate of nitrogen fertilizer. According to our survey, in the study area, farmers typically make decisions regarding nitrogen fertilizer application based on crop growth. In conclusion, saline environments, diversity in the fertilizers used, and rates of nitrogen fertilizer application collectively influence the results for N2O flux and balance within farmland ecosystems.
Different types of vegetation respond differently to temperature, particularly through their root systems. It has been observed that the root system of vegetation exhibits a greater sensitivity to temperature concerning soil respiration [83], which aligns with the findings depicted in this study (Figure 7). Additionally, it is worth noting that temperature can also impact soil respiration by affecting microbial activity [84]. In this study, the carbon sequestration capacity of each sample plot was found to be higher in summer than in winter and spring. This difference may be closely related to temperature, root system, and microbial activity status. The effect of a saline environment on soil carbon and nitrogen pools is also significant. In coastal saline wetlands, the soil matrix was affected by seawater immersion and had a high original pH value. As a result, the SOC content may be low [85]. Previous studies have indicated that soil salinity is significantly correlated with pH in terms of physical and chemical properties but negatively correlated with soil nutrients, the fractal dimension of soil particle fractions, and soil organic matter. It can be concluded that soil salinity is the most important factor influencing soil quality in coastal agricultural reclamation areas under widespread saline soils. Additionally, excessive salinity causes water loss to plants through osmotic stress, which affects crop survival, as well as carbon and nitrogen exchanges [66,86]. This finding aligns with the observation that salinity and pH had significant negative effects on vegetation carbon pools in this study (Figure 7). The coupling mechanism of CO2 and N2O fluxes with soil and vegetation nitrogen pools in this study exhibits a certain level of complexity, which is attributed to the unique environmental conditions resulting from reclamation. Before reclamation, the carbon and nitrogen contents of natural beach salt marsh wetlands were primarily influenced by tides, geomorphology, and saline vegetation. However, after reclamation, soil carbon and nitrogen pools are predominantly impacted by cropland management and agricultural practices [33]. With the transition from wetlands to agricultural land, the process of farmland management and crop growth during agricultural cultivation activities may alter the structure and diversity of biotechnology in sediments [87]. This alteration could potentially accelerate the decomposition of organic matter and greenhouse gas emissions in sediments.
Reclamation fundamentally alters coastal ecosystem equilibrium, with measurable impacts on biodiversity and biogeochemical cycling. Specifically, empirical evidence confirms tidal influence reduction in reclaimed zones [88], driving hydrological shifts, including water table depression. Furthermore, the reclamation of coastal wetlands also impacts the physiological processes and community structures of native salt-tolerant vegetation [89]. This, in turn, weakens soil drought biochemistry and anaerobic environments while affecting the composition and activity of soil microbial communities in response to changes in soil respiration processes at different levels. Additionally, soil salinity and pH are altered after coastal wetland reclamation, impacting not only the vegetation’s physiological processes and ecological status but also the CO2 and N2O balance within reclaimed wetland areas. When agricultural production is carried out on reclaimed land, unique types of coastal reclaimed wetlands can form. Due to their shallow water table, many shorter-reclaimed-year wetlands still maintain varying degrees of environmental characteristics typical for wetlands, further complicating soil respiration within these coastal wetland reclamation areas. Moreover, reclamation has resulted in stagnation of material and energy exchanges between coastal reclaimed areas and offshore regions [90], leading to anthropogenic interference in greenhouse gas fluxes within coastal wetlands.

4.3. Insights and Perspectives on Sustainable Planting in Coastal Wetland Development and Reclaimed Areas

Currently, there are significant changes in land use types along the southeastern coastline of China, particularly involving the transition between natural salt marshes and aquaculture ponds, as well as agricultural cropland [91]. The dynamics of wetland exploitation and coastal greenhouse gas fluxes along China’s coastline have been closely linked to government policies over the last decade or so [7,92]. This is evident in China’s large-scale reclamation of coastal saline soils to meet the growing demand for arable land for food security [33]. However, it is important to note that coastal wetland ecosystems are more fragile systems that are highly sensitive to climate change and human activities. It is widely recognized that large-scale reclamation and associated activities can disturb and damage coastal wetlands, leading to environmental risks such as soil salinization, coastal eutrophication, and reductions in species habitats. The natural salt marsh area in Jiangsu Province has significantly increased as a result of conservation and restoration policies implemented during development [30]. The presence of a substantial portion of wetlands with vegetative cover plays a crucial role in absorbing CO2 and N2O [23]. The advantageous regeneration and restoration rate of mud coasts in the coastal zone makes it feasible to carry out coastal zone development with suitable reclamation at an acceptable rate.
The term “carbon sink in agroecosystems” refers to the process through which atmospheric CO2 is absorbed by agroecosystems and then fixed into crop and soil carbon pools. This involves the effective absorption of atmospheric CO2 by crops, aided by planting and management techniques. While farmland soil organic carbon levels are relatively low compared to those found in natural landscapes, agriculture can still contribute to negative emissions through effective management [93]. Our research shows that in comparison to the greenhouse gases released by converting coastal salt marshes to aquaculture ponds [94,95,96], developing coastal salt marshes into agricultural land would be a more viable option. The farmland ecosystem in a reclamation area is an open system formed by the joint action of humans and nature, encompassing not only living and non-living elements on the farmland, but also their interactions. Human activities such as cultivation, fertilization, irrigation, weeding, and pest control have direct or indirect impacts on farmland ecosystems. However, farmland is also a significant source of N2O emissions. When considering the global warming potential analysis of coastal reclaimed wetlands, it is important to note that while reclaimed farmland does contribute to N2O emissions and has a global warming potential 265 times that of CO2 gas, the sink function of CO2 makes a substantial contribution to reclaimed farmland (Table 2). Therefore, coastal reclaimed wetlands still serve as sinks for greenhouse gases. Furthermore, differences in GHG flux exchange and yields on coastal reclaimed agricultural land can be attributed to natural conditions, farming systems in different reclaimed areas, and the types of crops grown [97,98]. Effective management of coastal reclamation agricultural land is therefore crucial.
Our analysis shows that corn has a superior ability to mitigate CO2 emissions compared to other crops. During the growth of snap beans and soybeans, N2O emissions were significantly reduced compared to the growth of non-legume crops. This suggests that the crops in the cropping system are of decision-making significance for the agroecosystem as a whole. The human activity of reclamation cultivation provides valuable information on various land use practices, farmland management techniques, and the cropping preferences of different farmers [31]. This includes practices such as fertilizer application, irrigation, plowing, and the return of straw to fields, among others. In addition, there are additional effects on soil respiration from different farming systems under varying climatic conditions. Numerous studies have demonstrated that the analysis of factors influencing CO2 and N2O fluxes, including the production, transportation, storage, and utilization of agricultural resources such as fertilizers and pesticides, as well as the impacts of agricultural activities on carbon balance [27], involves more intricate considerations. Research has indicated that diverse crop rotations and fertilization practices can directly alter the carbon sequestration and emission reduction capacity of soils [99]. In this study, different farming methods were employed to distinguish between wheat–corn–soybean rotation and the continuous cropping of wheat, which are managed by large professional households, and fava bean–corn rotation and wheat–corn rotation, which are operated by family farms. The two reclaimed plots managed by large professional households have a significant sown area, with activities such as fertilizer application, planting, pesticide spraying, and harvesting now being mechanized on a large scale. As a result, various disturbances exhibit complex mechanisms that require further support based on controlled and observational studies [100].
While this study provides novel insights into the GHG dynamics of reclaimed coastal agroecosystems, several limitations warrant consideration. Residual fertilizer impacts from pre-study years were not explicitly measured, although the soil N testing (0–60 cm) indicated minimal nitrate accumulation. Future studies should employ 15N isotopic tracing to quantify carry-over effects. Groundwater interactions and wind erosion effects were not quantitatively assessed due to methodological scoping. Their potential influence on carbon–nitrogen cycling warrants targeted investigation in future studies. Furthermore, while ANOVA and PLS-PM provided robust frameworks for our research questions, future studies could benefit from mixed-effects models to account for potential temporal autocorrelation in multi-seasonal measurements and plot-level random effects. Such approaches would be particularly valuable when analyzing high-frequency temporal dynamics within individual reclaimed plots. The limitations, however, do not invalidate our core findings regarding reclamation age effects, but instead highlight opportunities for mechanistic depth in coastal agroecology.

5. Conclusions

In this study, we comprehensively assessed greenhouse gas (GHG) fluxes from cultivated land in four typical reclaimed areas of wetland along China’s southeastern coast. By analyzing the drivers of the GHG fluxes in these ecosystems, we evaluated the importance of sustainable coastal reclamation development and GHG mitigation while ensuring food security. The key findings reveal distinct temporal patterns in CO2 exchange. During crop growing periods, most agricultural lands function as CO2 sinks, and during fallow periods, reclaimed lands predominantly become CO2 sources. This pattern correlates strongly with the temperature-driven enhancement of soil respiration. Collectively, the coastal agroecosystems demonstrated significant carbon sequestration capacity, with annual mean CO2 uptake values of −7446.77 kgC ha1, −35,678.02 kgC ha1, −51,273.55 kgC ha1, and −81,181.77 kgC ha1. However, the systems consistently acted as net N2O emission sources, with annual fluxes of 7.329 kgN ha1, 5.016 kgN ha1, 1.674 kgN ha1, and 0.701 kgN ha1. Notably, when integrating all the GHGs using global warming potentials (GWP), these reclaimed wetlands functioned as net GHG sinks due to dominant CO2 sequestration. Our study also demonstrated the carbon fixation effect of corn crops and the nitrogen fixation effect of legume crops. The RDA and PLS-PM analyses indicated that the exchange of CO2 and N2O gas fluxes was influenced by soil and vegetation physico-chemical properties, as well as various factors, including time, space, environment, and anthropogenic disturbances. The main driving factors were found to be soil temperature, moisture, salinity, and pH. Agricultural land reclaimed from coastal wetlands holds significant ecological importance. On one hand, the conversion of coastal wetlands into agro-ecosystems plays a crucial role in altering greenhouse gas emissions. On the other hand, farmland ecosystems also possess the capacity to sequester carbon. This is primarily demonstrated through ameliorating soil salinity and alkalinity over time following reclamation. Furthermore, adopting more rational agricultural management practices will further enhance crop carbon sequestration as the duration of reclamation increases. In conclusion, this study offers the following recommendations: (I) Effective measures should be implemented to enhance the carbon sequestration capacity of farmland ecosystems in coastal reclaimed areas by exploring reasonable agronomic practices and farmland management. (II) Deeper and longer-term research is needed to understand the carbon sequestration characteristics of farmland ecosystems in coastal wetland reclamation areas and their influencing factors, providing a theoretical basis for developing and protecting coastal zones.

Author Contributions

Conceptualization, J.X. and S.H.; Methodology, Y.Y.; Software, J.X. and X.W.; Validation, R.Z. (Rui Zhang), R.Z. (Rui Zhong) and J.Z.; Formal analysis, Y.Y., R.Z. (Rui Zhang), R.Z. (Rui Zhong), S.H. and J.X.; Investigation, Y.Y., R.Z. (Rui Zhang), R.Z. (Rui Zhong), J.Z., Y.L., J.X. and J.T.; Resources, L.P.; Data curation, Y.Y. and J.X.; Writing—original draft preparation, J.X.; Writing—review and editing, S.H.; Visualization, J.X. and X.W.; Supervision, L.P.; Project administration, Y.Y.; Funding acquisition, L.P. All authors have read and agreed to the published version of the manuscript.

Funding

This work was financially supported by the National Natural Science Foundation of China (No. 42171245, No. 42476239), The Research Initiation Fund for Introduced Talents of Nanjing Institute of Technology (No. YKJ202336), Jiangsu Province Carbon Peak Carbon Neutral Technology Innovation Project (No. BK20231515), Marine Science and Technology Innovation Special Projects of Jiangsu Province, China (No. JSZRHYKJ202212), Natural Resources Science and Technology Project of Jiangsu Province (No. 2023003), and The Project Supported by the Open Fund of Key Laboratory of Coastal Zone Exploitation and Protection, MNR (No: 2023CZEPK02).

Data Availability Statement

The authors declare that the data supporting the findings of this study are available within the paper. Should any raw data files be needed in another format they are available from the corresponding author upon reasonable request.

Conflicts of Interest

The authors declare that they have no conflicts of interest.

References

  1. IPCC—Intergovernmental Panel on Climate Change. Available online: https://www.ipcc.ch (accessed on 26 June 2025).
  2. Nguyen, H.-D.; Youn, Y.-C.; Bui, D.T.; Nguyen, T.H.Y.; Dinh, D.T.; Ho, Q.T. Optimal Forest Management for Carbon Sequestration, Timber, and Bioenergy Production in Vietnam Using an Extended Full-Cycle Carbon Accounting Method. Environ. Sci. Pollut. Res. 2023, 30, 101192–101207. [Google Scholar] [CrossRef] [PubMed]
  3. Badr, O.; Probert, S.D. Sources of Atmospheric Nitrous Oxide. Appl. Energy 1992, 42, 129–176. [Google Scholar] [CrossRef]
  4. Zhang, L.; Wang, X.; Huang, L.; Wang, C.; Gao, Y.; Peng, S.; Canadell, J.G.; Piao, S. Inventory of Methane and Nitrous Oxide Emissions from Freshwater Aquaculture in China. Commun. Earth Environ. 2024, 5, 531. [Google Scholar] [CrossRef]
  5. Bao, T.; Jia, G.; Xu, X. Weakening greenhouse gas sink of pristine wetlands under warming. Nat. Clim. Change 2023, 13, 462–469. [Google Scholar] [CrossRef]
  6. Tian, H.; Xu, R.; Canadell, J.G.; Thompson, R.L.; Winiwarter, W.; Suntharalingam, P.; Davidson, E.A.; Ciais, P.; Jackson, R.B.; Janssens-Maenhout, G.; et al. A Comprehensive Quantification of Global Nitrous Oxide Sources and Sinks. Nature 2020, 586, 248–256. [Google Scholar] [CrossRef]
  7. Dong, H.; Hu, Y.; Qian, L.; Yan, J.; Gao, L.; Mei, W.; Zhang, J.; Chen, X.; Wu, P.; Sun, Y.; et al. Preliminary Manifestation of the Yangtze River Protection Strategy in Improving the Carbon Sink Function of Estuary Wetlands. iScience 2024, 27, 108974. [Google Scholar] [CrossRef]
  8. Hopkinson, C.S.; Cai, W.-J.; Hu, X. Carbon Sequestration in Wetland Dominated Coastal Systems—A Global Sink of Rapidly Diminishing Magnitude. Curr. Opin. Env. Sustain. 2012, 4, 186–194. [Google Scholar] [CrossRef]
  9. Yin, C.; Zhao, W.; Ye, J.; Muroki, M.; Pereira, P. Ecosystem Carbon Sequestration Service Supports the Sustainable Development Goals Progress. J. Environ. Manage. 2023, 330, 117155. [Google Scholar] [CrossRef]
  10. Haonan, Q.; Shihong, Y.; Guangmei, W.; Xiaoling, L.; Jie, Z.; Yi, X.; Shide, D.; Hanwen, L.; Zewei, J. Analysis of carbon flux characteristics in saline-alkali soil under global warming. J. Agron. Crop Sci. 2024, 210, e12720. [Google Scholar] [CrossRef]
  11. Xu, C.; Pu, L.; Li, B.; Xu, Y.; Kong, F. Coupling Mechanism of C:N:P Stoichiometry between Plant and Soil after Long-Term Reclamation in the Coastal Area, Eastern China. Reg. Stud. Mar. Sci. 2023, 68, 103178. [Google Scholar] [CrossRef]
  12. Hou, X.; Feng, L.; Tang, J.; Song, X.-P.; Liu, J.; Zhang, Y.; Wang, J.; Xu, Y.; Dai, Y.; Zheng, Y.; et al. Anthropogenic Transformation of Yangtze Plain Freshwater Lakes: Patterns, Drivers and Impacts. Remote Sens. Environ. 2020, 248, 111998. [Google Scholar] [CrossRef]
  13. Chen, M.; Zeng, S.; Jiang, B.; Wen, Z.; Wu, J.; Xia, J. The Comprehensive Evaluation of How Water Level Fluctuation and Temperature Change Affect Vegetation Cover Variations at a Lake of Ecological Importance (Poyang Lake), China. Ecol. Indic. 2023, 148, 110041. [Google Scholar] [CrossRef]
  14. Rooney, R.C.; Robinson, D.T.; Petrone, R. Megaproject Reclamation and Climate Change. Nat. Clim. Change 2015, 5, 963–966. [Google Scholar] [CrossRef]
  15. Tan, L.-S.; Ge, Z.-M.; Li, S.-H.; Li, Y.-L.; Xie, L.-N.; Tang, J.-W. Reclamation-Induced Tidal Restriction Increases Dissolved Carbon and Greenhouse Gases Diffusive Fluxes in Salt Marsh Creeks. Sci. Total Environ. 2021, 773, 145684. [Google Scholar] [CrossRef]
  16. Xiong, J.; Sheng, X.; Wang, M.; Wu, M.; Shao, X. Comparative Study of Methane Emission in the Reclamation-Restored Wetlands and Natural Marshes in the Hangzhou Bay Coastal Wetland. Ecol. Eng. 2022, 175, 106473. [Google Scholar] [CrossRef]
  17. Liu, Z.; Cao, S.; Sun, Z.; Wang, H.; Qu, S.; Lei, N.; He, J.; Dong, Q. Tillage Effects on Soil Properties and Crop Yield after Land Reclamation. Sci. Rep. 2021, 11, 4611. [Google Scholar] [CrossRef] [PubMed]
  18. Zhu, S.; Gao, S.; Li, M.; Wang, Y.P. Evolution Modeling and Protection Scheme for Tidal Flats under Natural Change and Human Pressure, Central Jiangsu Coast. Earth’s Future 2024, 12, e2023EF003913. [Google Scholar] [CrossRef]
  19. Ma, Z.; Lu, M.; Jin, H.; Sheng, X.; Wei, H.; Yang, Q.; Qi, L.; Huang, J.; Chen, L.; Dou, X. Greenhouse Gas Emissions and Environmental Drivers in Different Natural Wetland Regions of China. Environ. Pollut. 2023, 330, 121754. [Google Scholar] [CrossRef] [PubMed]
  20. Xu, X.; Zou, X.; Cao, L.; Zhamangulova, N.; Zhao, Y.; Tang, D.; Liu, D. Seasonal and Spatial Dynamics of Greenhouse Gas Emissions under Various Vegetation Covers in a Coastal Saline Wetland in Southeast China. Ecol. Eng. 2014, 73, 469–477. [Google Scholar] [CrossRef]
  21. Chen, M.; Hussain, S.; Liu, Y.; Mustafa, G.; Hu, B.; Qin, Z.; Wang, X. Responses of Soil Seed Bank and Its Above-Ground Vegetation to Various Reclamation Patterns. Mar. Environ. Res. 2024, 196, 106436. [Google Scholar] [CrossRef]
  22. He, G.; Wang, K.; Zhong, Q.; Zhang, G.; Van Den Bosch, C.K.; Wang, J. Agroforestry Reclamations Decreased the CO2 Budget of a Coastal Wetland in the Yangtze Estuary. Agric. For. Meteorol. 2021, 296, 108212. [Google Scholar] [CrossRef]
  23. Wang, L.; Mei, W.; Yin, Q.; Guan, Y.; Le, Y.; Fu, X. The Variability in CO2 Fluxes at Different Time Scales in Natural and Reclaimed Wetlands in the Yangtze River Estuary and Their Key Influencing Factors. Sci. Total Environ. 2021, 799, 149441. [Google Scholar] [CrossRef]
  24. Chu, X.; Han, G.; Xing, Q.; Xia, J.; Sun, B.; Li, X.; Yu, J.; Li, D.; Song, W. Changes in Plant Biomass Induced by Soil Moisture Variability Drive Interannual Variation in the Net Ecosystem CO2 Exchange over a Reclaimed Coastal Wetland. Agric. For. Meteorol. 2019, 264, 138–148. [Google Scholar] [CrossRef]
  25. Krauss, K.W.; Whitbeck, J.L. Soil Greenhouse Gas Fluxes during Wetland Forest Retreat along the Lower Savannah River, Georgia (USA). Wetlands 2012, 32, 73–81. [Google Scholar] [CrossRef]
  26. Yan, X.; Wei, C.; Li, X.; Cui, S.; Zhong, J. New Insight into Blue Carbon Stocks and Natural-Human Drivers under Reclamation History Districts for Sustainable Coastal Development: A Case Study from Liaohe River Delta, China. Sci. Total Environ. 2023, 872, 162162. [Google Scholar] [CrossRef] [PubMed]
  27. Yang, P.; Tang, K.W.; Yang, H.; Tong, C.; Zhang, L.; Lai, D.Y.F.; Hong, Y.; Tan, L.; Zhu, W.; Tang, C. Contrasting Effects of Aeration on Methane (CH4) and Nitrous Oxide (N2O) Emissions from Subtropical Aquaculture Ponds and Implications for Global Warming Mitigation. J. Hydrol. 2023, 617, 128876. [Google Scholar] [CrossRef]
  28. Zhong, R.; Pu, L.; Xie, J.; Yao, J.; Qie, L.; He, G.; Wang, X.; Zhang, R.; Zhai, J.; Gong, Z.; et al. Carbon Storage in Typical Ecosystems of Coastal Wetlands in Jiangsu, China: Spatiotemporal Patterns and Mechanisms. Catena 2025, 254, 108882. [Google Scholar] [CrossRef]
  29. Sun, C.; Li, J.; Liu, Y.; Zhao, S.; Zheng, J.; Zhang, S. Tracking Annual Changes in the Distribution and Composition of Saltmarsh Vegetation on the Jiangsu Coast of China Using Landsat Time Series–Based Phenological Parameters. Remote Sens. Environ. 2023, 284, 113370. [Google Scholar] [CrossRef]
  30. Fan, B.; Li, Y. China’s Conservation and Restoration of Coastal Wetlands Offset Much of the Reclamation-Induced Blue Carbon Losses. Glob. Change Biol. 2024, 30, e17039. [Google Scholar] [CrossRef]
  31. Cai, F.; Van Vliet, J.; Verburg, P.H.; Pu, L. Land Use Change and Farmer Behavior in Reclaimed Land in the Middle Jiangsu Coast, China. Ocean Coast. Manage. 2017, 137, 107–117. [Google Scholar] [CrossRef]
  32. Zhang, R.; Pu, L.; Li, J.; Zhang, J.; Xu, Y. Landscape Ecological Security Response to Land Use Change in the Tidal Flat Reclamation Zone, China. Environ. Monit. Assess. 2016, 188, 1. [Google Scholar] [CrossRef] [PubMed]
  33. Xie, X.; Pu, L.; Zhu, M.; Meadows, M.; Sun, L.; Wu, T.; Bu, X.; Xu, Y. Differential Effects of Various Reclamation Treatments on Soil Characteristics: An Experimental Study of Newly Reclaimed Tidal Mudflats on the East China Coast. Sci. Total Environ. 2021, 768, 144996. [Google Scholar] [CrossRef] [PubMed]
  34. Liu, C.; Xu, J.; Ding, N.; Fu, Q.; Guo, B.; Lin, Y.; Li, H.; Li, N. The Effect of Long-Term Reclamation on Enzyme Activities and Microbial Community Structure of Saline Soil at Shangyu, China. Environ. Earth Sci. 2013, 69, 151–159. [Google Scholar] [CrossRef]
  35. Xie, X.; Pu, L.; Wang, Q.; Zhu, M.; Xu, Y.; Zhang, M. Response of Soil Physicochemical Properties and Enzyme Activities to Long-Term Reclamation of Coastal Saline Soil, Eastern China. Sci. Total Environ. 2017, 607–608, 1419–1427. [Google Scholar] [CrossRef]
  36. Zhang, Y.; Hou, K.; Qian, H.; Gao, Y.; Fang, Y.; Xiao, S.; Tang, S.; Zhang, Q.; Qu, W.; Ren, W. Characterization of Soil Salinization and Its Driving Factors in a Typical Irrigation Area of Northwest China. Sci. Total Environ. 2022, 837, 155808. [Google Scholar] [CrossRef]
  37. Peng, Z.; Ting, W.; Haixia, W.; Min, W.; Xiangping, M.; Siwei, M.; Rui, Z.; Zhikuan, J.; Qingfang, H. Effects of Straw Mulch on Soil Water and Winter Wheat Production in Dryland Farming. Sci. Rep. 2015, 5, 10725. [Google Scholar] [CrossRef]
  38. Xie, X.; Pu, L.; Zhu, M.; Wu, T.; Xu, Y. Spatio-Temporal Variability of Soil Salinity and Sodicity in Agricultural Reclaimed Coastal Wetlands, Eastern China. Arch. Agron. Soil Sci. 2020, 66, 1639–1650. [Google Scholar] [CrossRef]
  39. Su, B.; Shangguan, Z. Response of Water Use Efficiency and Plant-Soil C:N:P Stoichiometry to Stand Quality in Robinia Pseudoacacia on the Loess Plateau of China. Catena 2021, 206, 105571. [Google Scholar] [CrossRef]
  40. Walker, L.R.; Wardle, D.A.; Bardgett, R.D.; Clarkson, B.D. The Use of Chronosequences in Studies of Ecological Succession and Soil Development. J. Ecol. 2010, 98, 725–736. [Google Scholar] [CrossRef]
  41. Dacosta, J.; Rosenberg, N.; Verma, S. Respiratory Release of CO2 in Alfalfa and Soybean under Field Conditions. Agric. For. Meteorol. 1986, 37, 143–157. [Google Scholar] [CrossRef]
  42. Hutchinson, G.L.; Mosier, A.R. Improved Soil Cover Method for Field Measurement of Nitrous Oxide Fluxes. Soil Sci. Soc. Am. J. 1981, 45, 311–316. [Google Scholar] [CrossRef]
  43. Chapter 7: The Earth’s Energy Budget, Climate Feedbacks, and Climate Sensitivity. Available online: https://www.ipcc.ch/report/ar6/wg1/chapter/chapter-7/ (accessed on 19 May 2025).
  44. Kucera, C.L.; Kirkham, D.R. Soil Respiration Studies in Tallgrass Prairie in Missouri. Ecology 1971, 52, 912–915. [Google Scholar] [CrossRef]
  45. Armour, K.; Forster, P.; Storelvmo, T.; Collins, W.; Dufresne, J.L.; Frame, D.; Lunt, D.; Mauritsen, T.; Palmer, M.; Watanabe, M.; et al. The Earth’s Energy Budget, Climate Feedbacks and Climate Sensitivity. In Climate Change 2021—The Physical Science Basis: Working Group I Contribution to the Sixth Assessment Report of the Intergovernmental Panel on Climate Change; Intergovernmental Panel on Climate Change (IPCC), Ed.; Cambridge University Press: Cambridge, UK, 2023; pp. 923–1054. ISBN 978-1-009-15788-9. [Google Scholar]
  46. Li, Y.; Chen, Z.; Chen, J.; Castellano, M.J.; Ye, C.; Zhang, N.; Miao, Y.; Zheng, H.; Li, J.; Ding, W. Oxygen Availability Regulates the Quality of Soil Dissolved Organic Matter by Mediating Microbial Metabolism and Iron Oxidation. Glob. Change Biol. 2022, 28, 7410–7427. [Google Scholar] [CrossRef]
  47. Bi, W.; Hu, Y.; Weng, B.; Zhang, D.; Wang, F.; Lin, W.; Wang, W.; Dong, G.; Yan, D. Drought–Flood Abrupt Alternation Events Increase Soil Nitrogen Loss via Surface Runoff in a Typical Grain Base in China. J. Hydrol. Reg. Stud. 2025, 60, 102543. [Google Scholar] [CrossRef]
  48. Cui, J.; Cui, J.; Li, J.; Wang, W.; Xu, B.; Yang, J.; Li, B.; Chang, Y.; Liu, X.; Yao, D. Improving Earthworm Quality and Complex Metal Removal from Water by Adding Aquatic Plant Residues to Cattle Manure. J. Hazard. Mater. 2023, 443, 130145. [Google Scholar] [CrossRef] [PubMed]
  49. Cheng, Z.; Shi, J.; He, Y.; Wu, L.; Xu, J. Assembly of Root-Associated Bacterial Community in Cadmium Contaminated Soil Following Five-Year Consecutive Application of Soil Amendments: Evidences for Improved Soil Health. J. Hazard. Mater. 2022, 426, 128095. [Google Scholar] [CrossRef] [PubMed]
  50. Oksanen, J.; Simpson, G.L.; Blanchet, F.G.; Kindt, R.; Legendre, P.; Minchin, P.R.; O’Hara, R.B.; Solymos, P.; Stevens, M.H.H.; Szoecs, E.; et al. Vegan: Community Ecology Package, version 2.7-1; 2025. Available online: https://CRAN.R-project.org/package=vegan (accessed on 26 June 2025).
  51. Munabi, S.K.; Aguti, J.; Nabushawo, H.M. Using the TAM Model to Predict Undergraduate Distance Learners Behavioural Intention to Use the Makerere University Learning Management System. OALib 2020, 07, 1–12. [Google Scholar] [CrossRef]
  52. Wu, G.; Ling, J.; Zhao, D.-Q.; Xu, Y.-P.; Liu, Z.-X.; Wen, Y.; Zhou, S.-L. Deep-Injected Straw Incorporation Improves Subsoil Fertility and Crop Productivity in a Wheat-Maize Rotation System in the North China Plain. Field Crop. Res. 2022, 286, 108612. [Google Scholar] [CrossRef]
  53. Panchal, P.; Preece, C.; Peñuelas, J.; Giri, J. Soil carbon sequestration by root exudates. Trends Plant Sci. 2022, 27, 749–757. [Google Scholar] [CrossRef]
  54. Inglett, K.S.; Inglett, P.W.; Reddy, K.R.; Osborne, T.Z. Temperature Sensitivity of Greenhouse Gas Production in Wetland Soils of Different Vegetation. Biogeochemistry 2012, 108, 77–90. [Google Scholar] [CrossRef]
  55. Li, J.; Nie, M.; Pendall, E. An Incubation Study of Temperature Sensitivity of Greenhouse Gas Fluxes in Three Land-Cover Types near Sydney, Australia. Sci. Total Environ. 2019, 688, 324–332. [Google Scholar] [CrossRef] [PubMed]
  56. Liu, H.; Zhao, P.; Lu, P.; Wang, Y.-S.; Lin, Y.-B.; Rao, X.-Q. Greenhouse Gas Fluxes from Soils of Different Land-Use Types in a Hilly Area of South China. Agric. Ecosyst. Environ. 2008, 124, 125–135. [Google Scholar] [CrossRef]
  57. Schaufler, G.; Kitzler, B.; Schindlbacher, A.; Skiba, U.; Sutton, M.A.; Zechmeister-Boltenstern, S. Greenhouse Gas Emissions from European Soils under Different Land Use: Effects of Soil Moisture and Temperature. Eur. J. Soil Sci. 2010, 61, 683–696. [Google Scholar] [CrossRef]
  58. Tang, L.; Zhang, L.; Yang, P.; Tong, C.; Yang, H.; Tan, L.; Lin, Y.; Lai, D.Y.F.; Tang, K.W. Seasonal Variations in Source-Sink Balance of CO2 in Subtropical Earthen Aquaculture Ponds: Implications for Carbon Emission Management. J. Hydrol. 2023, 626, 130330. [Google Scholar] [CrossRef]
  59. Xiao, Q.; Xu, X.; Duan, H.; Qi, T.; Qin, B.; Lee, X.; Hu, Z.; Wang, W.; Xiao, W.; Zhang, M. Eutrophic Lake Taihu as a significant CO2 source during 2000–2015. Water Res. 2020, 170, 115331. [Google Scholar] [CrossRef] [PubMed]
  60. Wang, Y.; Li, Q.; Wang, H.; Wen, X.; Yang, F.; Ma, Z.; Liu, Y.; Sun, X.; Yu, G. Precipitation Frequency Controls Interannual Variation of Soil Respiration by Affecting Soil Moisture in a Subtropical Forest Plantation. Can. J. For. Res. 2011, 41, 1897–1906. [Google Scholar] [CrossRef]
  61. Ball, B.C. Soil Structure and Greenhouse Gas Emissions: A Synthesis of 20 Years of Experimentation. Eur. J. Soil Sci. 2013, 64, 357–373. [Google Scholar] [CrossRef]
  62. Wei, S.; Zhang, X.; McLaughlin, N.B.; Liang, A.; Jia, S.; Chen, X.; Chen, X. Effect of Soil Temperature and Soil Moisture on CO2 Flux from Eroded Landscape Positions on Black Soil in Northeast China. Soil Tillage Res. 2014, 144, 119–125. [Google Scholar] [CrossRef]
  63. Chakraborty, K.; Joshi, A.P.; Ghoshal, P.K.; Ghosh, J.; Akhand, A.; Bhattacharya, T.; Sreeush, M.G.; Valsala, V. Mechanisms and Drivers Controlling Spatio-Temporal Evolution of pCO2 and Air-Sea CO2 Fluxes in the Southern Java Coastal Upwelling System. Estuar. Coast. Shelf Sci. 2023, 293, 108509. [Google Scholar] [CrossRef]
  64. Tan, L.; Zhang, L.; Yang, P.; Tong, C.; Lai, D.Y.F.; Yang, H.; Hong, Y.; Tian, Y.; Tang, C.; Ruan, M.; et al. Effects of Conversion of Coastal Marshes to Aquaculture Ponds on Sediment Anaerobic CO2 Production and Emission in a Subtropical Estuary of China. J. Environ. Manage. 2023, 338, 117813. [Google Scholar] [CrossRef]
  65. Chen, X.; Luo, M.; Tan, J.; Zhang, C.; Liu, Y.; Huang, J.; Tan, Y.; Xiao, L.; Xu, Z. Salt-Tolerant Plant Moderates the Effect of Salinity on Soil Organic Carbon Mineralization in a Subtropical Tidal Wetland. Sci. Total Environ. 2022, 837, 155855. [Google Scholar] [CrossRef] [PubMed]
  66. Li, Y.-L.; Ge, Z.-M.; Xie, L.-N.; Li, S.-H.; Tan, L.-S. Effects of Waterlogging and Salinity Increase on CO2 Efflux in Soil from Coastal Marshes. Appl. Soil Ecol. 2022, 170, 104268. [Google Scholar] [CrossRef]
  67. Smith, K.A.; Ball, T.; Conen, F.; Dobbie, K.E.; Massheder, J.; Rey, A. Exchange of Greenhouse Gases between Soil and Atmosphere: Interactions of Soil Physical Factors and Biological Processes. Eur. J. Soil Sci. 2003, 54, 779–791. [Google Scholar] [CrossRef]
  68. Wagner-Riddle, C.; Congreves, K.A.; Abalos, D.; Berg, A.A.; Brown, S.E.; Ambadan, J.T.; Gao, X.; Tenuta, M. Globally Important Nitrous Oxide Emissions from Croplands Induced by Freeze-Thaw Cycles. Nat. Geosci. 2017, 10, 279–283. [Google Scholar] [CrossRef]
  69. Zeng, W.-Z.; Xu, C.; Wu, J.-W.; Huang, J.-S.; Ma, T. Effect of Salinity on Soil Respiration and Nitrogen Dynamics. Ecol. Chem. Eng. S 2013, 20, 519–530. [Google Scholar] [CrossRef]
  70. Zhou, G.; Zhang, W.; Ma, L.; Guo, H.; Min, W.; Li, Q.; Liao, N.; Hou, Z. Effects of Saline Water Irrigation and N Application Rate on NH3 Volatilization and N Use Efficiency in a Drip-Irrigated Cotton Field. Water Air Soil Pollut. 2016, 227, 103. [Google Scholar] [CrossRef]
  71. Bossio, D.A.; Cook-Patton, S.C.; Ellis, P.W.; Fargione, J.; Sanderman, J.; Smith, P.; Wood, S.; Zomer, R.J.; Von Unger, M.; Emmer, I.M.; et al. The Role of Soil Carbon in Natural Climate Solutions. Nat. Sustain. 2020, 3, 391–398. [Google Scholar] [CrossRef]
  72. Yuan, Y.; Liu, Q.; Zheng, H.; Li, M.; Liu, Y.; Wang, X.; Peng, Y.; Luo, X.; Li, F.; Li, X.; et al. Biochar as a Sustainable Tool for Improving the Health of Salt-Affected Soils. Soil Environ. Health 2023, 1, 100033. [Google Scholar] [CrossRef]
  73. Yang, P.; Zhang, L.; Lai, D.Y.F.; Yang, H.; Tan, L.; Luo, L.; Tong, C.; Hong, Y.; Zhu, W.; Tang, K.W. Landscape Change Affects Soil Organic Carbon Mineralization and Greenhouse Gas Production in Coastal Wetlands. Glob. Biogeochem. Cycles 2022, 36, e2022GB007469. [Google Scholar] [CrossRef]
  74. Yang, P.; Chen, G.; Zhang, L.; Tong, C.; Yang, H.; Zhu, W.; Sun, D.; Tan, L.; Hong, Y.; Tang, K.W. Variable Responses of Mineral-Bound Soil Organic Carbon to Land Cover Change in Southern China’s Coastal Wetlands. Catena 2024, 242, 108129. [Google Scholar] [CrossRef]
  75. Li, J.; Wang, S.; Tang, Y.; Du, Y.; Xu, L.; Hu, J.; Zhu, C. Coastal Reclamation Alters Soil Organic Carbon Dynamics: A Meta-Analysis in China. Catena 2024, 240, 107975. [Google Scholar] [CrossRef]
  76. Xie, M.; Qian, L.; Dong, H.; Mei, W.; Fu, X.; Hu, Y.; Yan, J.; Sun, Y.; Wu, P.; Chen, X.; et al. The High Organic Carbon Accumulation in Estuarine Wetlands Necessarily Does Not Represent a High CO2 Sequestration Capacity. Environ. Int. 2023, 172, 107762. [Google Scholar] [CrossRef] [PubMed]
  77. Xie, X.; Pu, L.; Shen, H.; Wang, X.; Zhu, M.; Ge, Y.; Sun, L. Effects of Soil Reclamation on the Oat Cultivation in the Newly Reclaimed Coastal Land, Eastern China. Ecol. Eng. 2019, 129, 115–122. [Google Scholar] [CrossRef]
  78. Ruis, S.J.; Blanco-Canqui, H.; Jasa, P.J.; Jin, V.L. No-till Farming and Greenhouse Gas Fluxes: Insights from Literature and Experimental Data. Soil Tillage Res. 2022, 220, 105359. [Google Scholar] [CrossRef]
  79. Cooper, H.V.; Evers, S.; Aplin, P.; Crout, N.; Dahalan, M.P.B.; Sjogersten, S. Greenhouse Gas Emissions Resulting from Conversion of Peat Swamp Forest to Oil Palm Plantation. Nat. Commun. 2020, 11, 407. [Google Scholar] [CrossRef]
  80. Hatano, R. Impacts of Changes in Peat Soils Due to Agricultural Activities on Greenhouse Gases (Especially N2O) Emissions and Their Mitigations. Pedosphere 2023, 35, 8–11. [Google Scholar] [CrossRef]
  81. Davidson, E.A. The Contribution of Manure and Fertilizer Nitrogen to Atmospheric Nitrous Oxide since 1860. Nat. Geosci. 2009, 2, 659–662. [Google Scholar] [CrossRef]
  82. Liu, Q.; Qin, Y.; Zou, J.; Guo, Y.; Gao, Z. Annual nitrous oxide emissions from open-air and greenhouse vegetable cropping systems in China. Plant Soil 2013, 370, 223–233. [Google Scholar] [CrossRef]
  83. Boone, R.D.; Nadelhoffer, K.J.; Canary, J.D.; Kaye, J.P. Roots Exert a Strong Influence on the Temperature Sensitivityof Soil Respiration. Nature 1998, 396, 570–572. [Google Scholar] [CrossRef]
  84. Zhang, Z.; Jiang, W.; Peng, K.; Wu, Z.; Ling, Z.; Li, Z. Assessment of the Impact of Wetland Changes on Carbon Storage in Coastal Urban Agglomerations from 1990 to 2035 in Support of SDG15.1. Sci. Total Environ. 2023, 877, 162824. [Google Scholar] [CrossRef]
  85. Xia, S.; Song, Z.; Van Zwieten, L.; Guo, L.; Yu, C.; Wang, W.; Li, Q.; Hartley, I.P.; Yang, Y.; Liu, H.; et al. Storage, Patterns and Influencing Factors for Soil Organic Carbon in Coastal Wetlands of China. Glob. Change Biol. 2022, 28, 6065–6085. [Google Scholar] [CrossRef] [PubMed]
  86. Brown, R.W.; Rhymes, J.M.; Jones, D.L. Saltwater Intrusion Induces Shifts in Soil Microbial Diversity and Carbon Use Efficiency in a Coastal Grassland Ecosystem. Soil Biol. Biochem. 2022, 170, 108700. [Google Scholar] [CrossRef]
  87. Yang, W.; Xia, L.; Zhu, Z.; Jiang, L.; Cheng, X.; An, S. Shift in Soil Organic Carbon and Nitrogen Pools in Different Reclaimed Lands Following Intensive Coastal Reclamation on the Coasts of Eastern China. Sci. Rep. 2019, 9, 5921. [Google Scholar] [CrossRef]
  88. Fang, J.; Xu, M. A novel ecological risk assessment approach applied to jiangsu coastal zone, china. Ocean Coast. Manag. 2023, 244, 106815. [Google Scholar] [CrossRef]
  89. Wang, W.; Sardans, J.; Wang, C.; Zeng, C.; Tong, C.; Chen, G.; Huang, J.; Pan, H.; Peguero, G.; Vallicrosa, H.; et al. The Response of Stocks of C, N, and P to Plant Invasion in the Coastal Wetlands of China. Glob. Change Biol. 2019, 25, 733–743. [Google Scholar] [CrossRef] [PubMed]
  90. Gong, J.-C.; Li, B.-H.; Hu, J.-W.; Ding, X.-J.; Liu, C.-Y.; Yang, G.-P. Tidal Effects on Carbon Dioxide Emission Dynamics in Intertidal Wetland Sediments. Environ. Res. 2023, 238, 117110. [Google Scholar] [CrossRef]
  91. Lu, Q.; Gao, Z.; Zhao, Z.; Ning, J.; Bi, X. Dynamics of Wetlands and Their Effects on Carbon Emissions in China Coastal Region—Case Study in Bohai Economic Rim. Ocean Coast. Manag. 2014, 87, 61–67. [Google Scholar] [CrossRef]
  92. Wang, W.; Liu, H.; Li, Y.; Su, J. Development and Management of Land Reclamation in China. Ocean Coast. Manag. 2014, 102, 415–425. [Google Scholar] [CrossRef]
  93. Singh, S.; Kiran, B.R.; Mohan, S.V. Carbon Farming: A Circular Framework to Augment CO2 Sinks and to Combat Climate Change. Environ. Sci. Adv. 2024, 3, 522–542. [Google Scholar] [CrossRef]
  94. Chen, Y.; Dong, S.; Wang, F.; Gao, Q.; Tian, X. Carbon Dioxide and Methane Fluxes from Feeding and No-Feeding Mariculture Ponds. Environ. Pollut. 2016, 212, 489–497. [Google Scholar] [CrossRef]
  95. Chen, Y.; Dong, S.; Wang, Z.; Wang, F.; Gao, Q.; Tian, X.; Xiong, Y. Variations in CO2 Fluxes from Grass Carp Ctenopharyngodon Idella Aquaculture Polyculture Ponds. Aquac. Environ. Interact. 2015, 8, 31–40. [Google Scholar] [CrossRef]
  96. Zhu, L.; Che, X.; Liu, H.; Liu, X.; Liu, C.; Chen, X.; Shi, X. Greenhouse Gas Emissions and Comprehensive Greenhouse Effect Potential of Megalobrama Amblycephala Culture Pond Ecosystems in a 3-Month Growing Season. Aquacult. Int. 2016, 24, 893–902. [Google Scholar] [CrossRef]
  97. Yao, R.; Yang, J.; Gao, P.; Zhang, J.; Jin, W. Determining Minimum Data Set for Soil Quality Assessment of Typical Salt-Affected Farmland in the Coastal Reclamation Area. Soil Tillage Res. 2013, 128, 137–148. [Google Scholar] [CrossRef]
  98. Zhu, Y.; Song, X.; Wang, X.; Chen, W.; Niu, X. The Yield Increase and Land Improvement Effects of Different Sorghum/Wild Soybean Intercropping Patterns on Reclaimed Coastal Salt Pans. J. Soils Sediments 2022, 22, 731–744. [Google Scholar] [CrossRef]
  99. Gao, H.; Tian, H.; Zhang, Z.; Xia, X. Warming-Induced Greenhouse Gas Fluxes from Global Croplands Modified by Agricultural Practices: A Meta-Analysis. Sci. Total Environ. 2022, 820, 153288. [Google Scholar] [CrossRef]
  100. Shang, Z.; Abdalla, M.; Xia, L.; Zhou, F.; Sun, W.; Smith, P. Can Cropland Management Practices Lower Net Greenhouse Emissions without Compromising Yield? Glob. Change Biol. 2021, 27, 4657–4670. [Google Scholar] [CrossRef]
Figure 1. The location of the coastal wetland study area and sampling points in Rudong County. The WCSP refers to corn–wheat–soybean rotational cropland reclaimed in 1958, located in Beikan Reclamation Area; FCP refers to fava bean–corn rotational cropland reclaimed in 1974, located in Xinbeikan Reclamation Area; WCP refers to wheat–corn rotational cropland reclaimed in 1982, located in Dongling Reclamation Area; WP refers to wheat continuous cropland reclaimed in 2007, located in Yudong Reclamation Area.
Agriculture 15 01403 g001
Figure 2. Histogram depicting the soil’s physical and chemical property variations throughout the sampling period. The significance of difference contrasts is indicated. Values are means of three replicates ± S.D.; error bars refer to standard deviation; values with different letters on the bars indicate significant differences among different reclamation areas. The traits represented by (AG) correspond to soil bulk density (BD), soil water content (SWC), soil salt content (SC), soil organic carbon content (SOC), soil total nitrogen (STN), soil pH, and soil nitrate–nitrogen (NN) in different soil horizons, respectively.
Agriculture 15 01403 g002
Figure 3. Histogram depicting the physicochemical parameters of vegetation organs over the sampling period. The significance of difference contrasts is indicated. Values are means of three replicates ± S.D.; error bars refer to standard deviation; values with different letters on the bars indicate significant differences among different reclamation areas (if not shown, then no comparison is possible). The first line illustrates the total carbon content of the vegetation, with the labeled significance of difference contrasts. (AD) correspond to the whole carbon content of wheat, maize, soybean, and fava bean, respectively. The second line represents vegetation biomass density, with (EH) representing biomass density for wheat, maize, soybean, and fava bean, as indicated on the first line graph.
Agriculture 15 01403 g003
Figure 4. Seasonal and spatial CO2 fluxes in the coastal wetlands of Rudong were investigated. Positive values indicate CO2 emissions, while negative values represent CO2 uptake. Error lines depict standard errors (n = 3). The lower part of the figure displays the sampling date, with different background colors representing the growing periods of various crops: red for the corn growth period, yellow for the wheat growth period, orange for the soybean growth period, green for the fava bean growth period, and gray for the fallow period. Panels (ad) illustrate four typical sample plots from different reclamation years: (a) WCSP (wheat–corn–soybean rotation) reclaimed in 1958, (b) FCP (fava bean–corn rotation) reclaimed in 1974, (c) WCP (wheat–corn rotation) reclaimed in 1982, and (d) WP (wheat continuous crop) reclaimed in 2007.
Agriculture 15 01403 g004
Figure 5. Seasonal and spatial fluxes of N2O in the coastal wetland of Rudong were investigated. Positive values indicate N2O emissions, while negative values represent N2O uptake. Error lines show standard errors (n = 3). The lower part of the figure displays the sampling date, with different background colors representing the growing periods of various crops: red for corn, yellow for wheat, orange for soybean, green for fava bean, and gray for the fallow period. Panels (ad) illustrate four typical sample plots from different reclamation years: (a) WCSP (wheat–corn–soybean rotation) reclaimed in 1958, (b) FCP (fava bean–corn rotation) reclaimed in 1974, (c) WCP (wheat–corn rotation) reclaimed in 1982, and (d) WP (wheat continuous crop) reclaimed in 2007.
Agriculture 15 01403 g005
Figure 6. Redundancy analysis (RDA) was conducted to examine the relationship between environmental variables and CO2 fluxes and N2O fluxes. For (a), arrows indicate the loadings of the ecological factors, and the fraction of observations for all sampling events is provided. The following environmental variables were selected based on the VIF results test: atmospheric temperature (AT), soil temperature (ST), weekly mean precipitation (AWP), soil salinity (SC), soil water content (SWC), soil pH, vegetation biomass density (PVB), nitrate nitrogen (NN), vegetation total carbon (PTC), soil organic carbon (SOC), and soil total nitrogen at the time of gas collection (STN). Significance: * p < 0.05, ** p < 0.01, *** p < 0.001. (b) illustrates the explanatory power of different environmental factors, with significance labeled separately. Significance: * p < 0.05, ** p < 0.01, *** p < 0.001.
Agriculture 15 01403 g006
Figure 7. The results of PLS-PM illustrate the direct and indirect potential pathways through which climatic conditions, vegetation carbon pools, soil carbon pools, and soil physical and chemical properties influence the balance status of CO2 and N2O gas flux (a,c), as well as the direct, indirect, and total pathway effects of PLS-PM factors on greenhouse gas flux exchange (b,d). Solid lines represent positive effects while dashed lines indicate negative effects, and thicker arrows denote stronger effects. The significance levels for path coefficients are denoted as follows: p < 0.001 represented by ***; 0.001 < p < 0.01 represented by **; and 0.01 < p < 0.05 represented by *. Plant C refers to vegetation carbon pool; Climate denotes climatic conditions during sampling time in different plots; SPS represents soil salinity and alkaline environment; SWT represents soil hydrothermal condition; ST represents soil temperature; SBD stands for soil bulk density; STN denotes soil total nitrogen; SNN indicates soil NO3-N condition; Soil N refers to overall nitrogen condition in the soil; Soil C denotes soil carbon pool.
Agriculture 15 01403 g007
Table 1. Information and description of coastal wetland reclamation plots.
SiteReclamation YearsLand Use Planting System
WCSP65Wheat–corn–soybean rotational cropping arable land system
FCP49Fava bean–corn rotational cropping arable land system
WCP41Wheat–corn rotational cropping arable land system
WP16Wheat continuous cropping arable land system
Table 2. The total CO2 and N2O greenhouse gas emissions (kg·ha−1), as well as the corresponding GWP for different plots; different letters indicate significant differences between reclamation sites at p < 0.05.
Plot
WCSPFCPWCPWP
CO2−51,273.55 ± 4746.99 bc−81,181.77 ± 18,715.87 b−35,678.02 ± 1086.91 ac−7446.77 ± 6497.05 a
N2O1.674 ± 0.598 b5.016 ± 0.862 a7.329 ± 0.260 a0.701 ± 1.032 b
GWP−187,305 ± 17,598.45 cb−295,577 ± 68,741.63 cb−127,767.24 ± 4064.92 ab−27,012.72 ± 33,412.39 a
Table 3. Comparison of average monthly CO2 and N2O greenhouse gas emissions from different plots in the reclamation area during the growing season and the fallow period (kg·ha−1); different letters indicate significant differences between reclamation sites at p < 0.05.
Greenhouse Gas EmissionPeriodPlot
WCSPFCPWCPWP
CO2Fallow period180.74 ± 16.43 a106.86 ± 35.13 ab70.17 ± 83.72 b79.00 ± 29.85 b
Crop growth period−424.19 ± 57.21 ab−542.93 ± 94.27 b−438.46 ± 97.40 ab−257.63 ± 64.85 a
N2OFallow period0.0013 ± 0.0057 b0.0120 ± 0.0028 b0.0491 ± 0.0201 a−0.0015 ± 0.0019 b
Crop growth period0.0147 ± 0.0058 b0.0283 ± 0.0075 c0.0325 ± 0.0052 abc0.0142 ± 0.0042 abc
Disclaimer/Publisher’s Note: The statements, opinions and data contained in all publications are solely those of the individual author(s) and contributor(s) and not of MDPI and/or the editor(s). MDPI and/or the editor(s) disclaim responsibility for any injury to people or property resulting from any ideas, methods, instructions or products referred to in the content.

