Abstract
Tropical montane cloud forests (TMCFs) are biodiversity hotspots that have been increasingly cleared to cultivate coffee under full sun exposure, replacing traditional shaded agroforestry systems. This study evaluated the impact of TMCF clearing on soil quality by analyzing 108 samples from undisturbed primary and secondary forests and deforested coffee plantations in the Dominican Republic and Haiti. Our findings indicate that forest clearing has a substantial adverse impact on soil nutrient status. Soils from undisturbed plots had total organic carbon (TOC) concentrations 4.83 units higher than those from cleared plots. Nitrogen levels were reduced by 28–61%, and available potassium declined by 23–51% in soils that had been cleared. Conversely, the available phosphorus levels exhibited a modest increase (ranging from 23% to 27%) following the clearing process, presumably attributable to diminished plant uptake and augmented mineralization in conditions characterized by diminished organic matter. However, given that phosphorus is not a limiting factor for coffee growth, this marginal gain does not compensate for the broader degradation of soil fertility. The study emphasizes that allowing TMCFs to be used for sun-grown coffee results in long-term nutrient depletion through erosion and leaching, which poses a threat to both the productivity of the soil and the ecological integrity of these valuable forest systems.
1. Introduction
Tropical montane cloud forests (TMCFs) are distinguished by frequent and/or persistent ground-level cloud or mist, which results in unique hydrological and ecological characteristics [1]. Furthermore, it has been established that fog plays an important role in their distribution and dynamics [2]. Cloud forests are fragile habitats, and some of the least understood ecosystems in the world [3].
The distribution of TMCFs is determined by a number of factors, including latitude, altitude, wind patterns, rainfall patterns, the size of their mountains, and distance from the sea. According to Bubb et al. [4], the distribution of TMCFs across tropical regions is not uniform, which poses a challenge to their mapping. Scatena et al. [1] estimate that 40.8% of all potential cloud forests occur in the Americas, 16.0% in Africa, and 43.2% in Asia.
The TMCFs are characterized by a high level of biodiversity, with a wide range of plant and animal species, including numerous endemic species in cloud forests. Cloud forests are typically found in headwater areas with high precipitation and low evaporation rates, leading to substantial stream flow volumes [1,5,6,7].
Despite these ecological and hydrological attributes, since the early 1990s, TMCFs have been listed as the world’s most threatened terrestrial ecosystems [1]. In order to meet the food and land requirements of a rapidly expanding population of peasant farmers in tropical regions [8] and for commercial agricultural purposes [4], more than 50% of the original surface area of TMCFs has been converted into croplands, pastures, tree plantations, secondary forests, or wastelands. The primary threats to these ecosystems have been identified as the production of timber and other forest products, fragmentation, and conversion to other forms of land use, notably cattle ranching and the cultivation of temperate vegetables [4,9,10,11]. Bubb et al. [4] posit that coffee plantations are among the most significant causes of cloud forest loss.
Human activity had a considerable impact on TMCF vegetation in Latin America, with significant impact areas extending across Mexico, the western and central Cordilleras of Colombia, western Ecuador, Peru, Bolivia, and the Brazilian Atlantic forests. Protected areas exhibiting high proportions of deforested TMCFs have been identified across Central America, the Caribbean, Thailand, and Indonesia [12]. Bubb et al. [4] identified coffee as a significant commercial crop that is cultivated on the lower altitude slopes of numerous cloud forest regions around the world. Consequently, lower montane cloud forests may have been cleared to a greater extent than higher altitude forests due to their suitability for crops such as coffee and greater accessibility.
García and Roersch [13], Mulligan [12], Alexis [14], and Alexis et al. [15] emphasize that in some areas of the Caribbean, such as Hispaniola Island (comprising Haiti and the Dominican Republic), deforestation associated with coffee cultivation constitutes a primary concern for threatened TMCFs. In this tropical ecosystem, Pastor et al. [16], Alexis et al. [15], and Hernández et al. [17] described the factors affecting soil quality and compared erosion risks between TMCFs used for coffee and other crops and undisturbed TMCFs in the Dominican Republic. These conclusions, drawn by the authors, suggest that perturbed TMCFs are the most threatened tropical soils in the Dominican Republic, with an erodibility index that is five times that of undisturbed TMCF soil.
Coffee is currently the second most significant agricultural commodity in terms of exportation in the Dominican Republic and Haiti [18,19]. Despite being a tropical plant, it requires a specific environment to produce high-quality coffee. Traditionally, coffee has been cultivated under a dense canopy of local tree species [20]. The presence of these trees provides shade, thereby creating microclimate conditions that are well-suited to the ecophysiology of the coffee plant [2,21,22]. Furthermore, the tree cover plays a vital role in protecting the soil from erosion and provides a continuous source of organic matter. Consequently, a sustainable coffee production system should prevent soil erosion and contribute to the preservation of forests and their associated habitats [22,23,24,25].
Complex processes, including poverty, population growth, land degradation, and the marginalization of mountain communities and groups, drive agricultural clearance. Cleared land is primarily used for subsistence agriculture by farmers with limited resources [4]. However, other studies [18] have observed that a lack of knowledge about soil coffee-crop limiting factors means that farmers are not implementing corrective actions and are interfering with cultural cropping practices. The outcome of this phenomenon is a diminished coffee yield and quality, as well as a scarcity of sustainable management options for these valuable agroforestry systems from which to choose.
The composition and productivity of coffee are significantly affected by the chemical and physical properties of the soil [26,27]. In tropical agroecosystems, soil quality is contingent on biomass production, plant residue input [28], and litter residence times [29]. These factors protect and sustain soil organisms, enhancing soil structure, moisture retention, and nutrient supply [30]. Nutrient concentrations in the soil are driven by biological and geochemical cycles and are also influenced by anthropogenic factors such as deforestation and land management [27,31]. However, as indicated by García-Santos [32], Schrumpf et al. [33], and Valladares [34], TMCF soil characteristics and dynamics are still poorly understood, and few studies have addressed the issue of how these factors have been affected by changes in land use.
A number of authors have examined the impact of deforestation and coffee management on the fertility of tropical soils. For instance, some authors have indicated that soil total organic carbon (TOC) and nitrogen reserves were similar in soils under tropical forests and under coffee agroforestry at different altitudinal ranges [35]. Conversely, in the initial years following forest clearing in agroforestry management, for instance, the decomposition of tree roots can contribute to an additional supply of TOC [36]. Indeed, changes related to forest clearing have been shown to impact soil functions, including nutrient storage and recycling, as well as carbon storage [37]. However, the findings of various studies indicate inconsistencies with regard to the role of coffee agroforestry in maintaining soil fertility, organic carbon, and nitrogen reserves [38,39].
In contrast, coffee is a highly mycotrophic plant. It is estimated that there are more than 100 species of arbuscular mycorrhizal fungi (AMF) associated with coffee plantations, representing more than a third of the total AMF species recorded worldwide. Therefore, coffee interacts with a variety of AMF fungi, which benefit host plants by increasing water absorption, stimulating root development, and improving nutrient absorption, resulting in an average increase of 65%, 74%, and 40% in N, P, and Ca content in the plants, respectively [40]. Furthermore, the root growth of coffee plants has shown excellent performance since the age of 3 years, reaching depths of up to 1 m (and even more) in both horizontal and vertical directions and displaying the typical characteristics of a mature plant. Coffee plants have a significant number of fine roots throughout the soil profile, reaching layers below 0.80 m in depth [41]. For this reason, studies related to the “effective” depth of the root zone of coffee plants should include soil data from both the organic and mineral horizons. In addition, the utilization of average values for soil parameters across the soil profile presents a promising approach for the analysis of the overall fertility of the soil for a specific coffee stand.
In this context, the practice of clearing forests to improve tropical coffee crops under the tree canopy, as occurs in poorly managed coffee plantations in Haiti and the Dominican Republic, would have an unpredictable impact on soil fertility beyond reducing competition between trees and coffee plants for soil nutrients. Therefore, the primary aim of the present work was to examine the effect of deforestation on coffee agroforestry through an analysis of the soil fertility, organic carbon, and nitrogen reserve patterns in comparison with unaltered TMFCs. In addition, the present study sought to gain insight into the characteristics of TMCF soil and to optimize coffee quality and crop sustainability in the lower TMCFs of Haiti and the Dominican Republic.
2. Materials and Methods
2.1. Sampling Sites
The Dominican study area is part of the Jaragua-Bahoruco-Enriquillo Biosphere Reserve. It is located in the south of the country and includes TMCFs situated in the eastern part of the Bahoruco mountain range (municipalities of Cortico and Monteada Nueva). These TFMCs are located below 1600 m a.s.l. and cover more than square kilometers. The cloud forest’s unique character is shaped by the humid winds from east to west and the mists from the Caribbean Sea. The TMFC area is characterized by dense and well-developed broadleaf forests, interspersed with tree ferns.
The Haitian study area is located within Pic Macaya National Park. The location is on the southern peninsula of the country, within the Macizo de la Hotte, which is home to the last virgin cloud forest in the country, covering more than 8000 hectares. The Park’s elevated terrain reaches a maximum height of 2347 m a.s.l. at Macaya Peak. The TMFCs on karst limestone are located between 850 and 1250 m a.s.l. At higher altitudes, the Park is covered by a mosaic of open pine forests (Pinus occidentalis) and denser broadleaf cloud forests. TMFCs of both study areas are home to numerous endemic species (Alexis [14]; Hernández et al. [35]); Martínez [42]; Schutt-Ainé [43].
A total of 108 soil samples collected from 36 soil profiles at three distinct TMCF sites (with 12 soil profiles at each site) were analyzed:
- 12 soil profiles from Paraíso (Barahona; Dominican Republic; 18°5′29.81″ N, 71°06′38.93″ W; altitude >1100 m a.s.l.; annual precipitation 2200 mm; average temperature 26 °C);
- 12 soil profiles from Barahona (Dominican Republic; 18°5′39.76″ N, 71°16′49.22″ W; altitude >1200 m a.s.l.; annual precipitation 1900 mm; average temperature 25 °C);
- 12 soil profiles from Pic Macaya National Park (Département Sud, Haiti; 18°22′17″ N, 74°01′13″ W; altitude >1200 m a.s.l.).
For each of the three sites (Paraíso, Barahona, and Pic Macaya), a total of 12 soil profiles were analyzed and compared. A total of 36 soil samples were analyzed, including 12 samples from organic horizons, 12 from mineral horizons, and 12 representing the entire soil profile. Within each set of 12 soil profiles from each site (Paraíso, Barahona, and Pic Macaya), the following samples were studied and compared: a further six were located in undisturbed primary TMCFs (Dominican Republic) or secondary TMCFs (Haiti), while the remaining six plots were located in areas where the TMCF had been cleared for coffee cultivation. The secondary succession of the Haitian TMCF consists of pines. The term “primary forest” is generally understood to denote the “climax forest type” for a given region and environment, which is regarded as relatively stable. The term “secondary forest” then refers to the successional forests that develop after the original forest has been cleared [40].
In 15 soil profiles, the sampling design was based on paired soil sampling, i.e., for each soil profile studied (both in the organic and mineral horizons) in an undisturbed (primary or secondary) TMCF, another soil profile (both in the organic and mineral horizons) was studied at a minimum distance of 25 m away in the same TMCF, which had been cleared for coffee cultivation.
2.2. Soil Sampling, Processing, and Analysis
A total of 36 soil average samples were collected by mixing the soils of the whole profile (from 36 soil profiles at three different TMCF sites). These samples were combined with a hoe in accordance with the experimental design outlined in Table 1 and Table 2 (termed whole profile samples; average depth 30.58 cm; SD 8.45). A second set of 36 topsoil samples was collected in the organic layer following the experimental design outlined in Table 1 and Table 2 (averaging 5.94 cm in depth; SD 3.24); and finally, a third set of 36 topsoil samples was then collected in the mineral horizon following the experimental design described in Table 1 and Table 2 (on average 16.58 cm deep; SD 5.90).
Sampling was conducted in accordance with the procedures outlined by FAO [41], after which the litter was discarded. The soil samples were dried at room temperature for a week, accompanied by periodic manual mixing, and sieved through a 2 mm mesh. The following determinations were made: pH in slurry, soil TOC by potassium dichromate reduction, Kjeldahl nitrogen (N), available P (P2O5 concentration), and soluble anion concentrations by ionic chromatography (Dionex 4500, Thermo Fisher Scientific, Sunnyvale, CA, USA), according to the protocols described by Hernández and Pastor [44]. Element concentrations were analyzed by plasma emission spectroscopy (ICP-OES, Perkin Elmer 4300DV, PerkinElmer, Waltham, MA, USA). Exchangeable Ca, Mg, K, and Na concentrations were determined after prior extraction by ammonium acetate at pH 7. In addition, Fe, Mn, Zn, Cu, and Al concentrations were estimated using the method of Lakanen and Ervio [45]. The concentrations of Ca, K, Mg, Na, Fe, Mn, Zn, Cu, Al, and P were measured after HNO3 and HClO4 acid digestion, as described by Walsh [46]. As this method does not result in the complete digestion of all minerals (a process that requires HF), the elements obtained are referred to as pseudo-total (pse.). This method provides an estimate of the total recoverable amount of an element that could become available over time, especially under changing environmental or chemical conditions [46,47].
To ensure analytical accuracy and precision, all measurements were performed in duplicate, and Certified Reference Materials (CRMs) were used to validate instrument calibration. Procedural blanks were incorporated for the purpose of monitoring contamination and recovery rates. Instruments were calibrated on a daily basis using multi-point standard curves, and all analyses followed established Standard Operating Procedures (SOPs) [47].
To determine the SQI (Soil Quality Index), the direct scaled-SQI method was used, as explained in Mukherjee and Lal [48]. In our case, each soil parameter was first assigned a unitless score ranging from 1 to 9 by employing linear scoring functions, i.e., SQI = Σ(1 + ((SQI − SQIMin)/(SQIMax − SQIMin))) × 9. The elements utilized in this study encompassed TOC, N, available Ca, Mg, K, Mn, and Zn, along with pseudo-total P, Ca, Mg, K, Fe, Mn and Zn. Prior checks were performed to confirm that the conclusions were not fundamentally altered by eliminating data redundancy. For example, comparisons were made of the effect of removing values for pseudo-soluble elements when assimilable ones were already included. Furthermore, the application of weighting factors to significant variables, including soil organic carbon (SOC) and total nitrogen (N), did not yield substantial qualitative alterations. This is most likely a consequence of the fact that a high degree of intercorrelation was observed among the values in the data set.
2.3. Statistical Analyses
The normality of the experimental data was checked using both the Shapiro–Wilk and Kolmogorov–Smirnov tests, and the homogeneity of variances was checked using Levene’s test. In instances where the parametric assumptions were not met, data transformation (logarithm or square root) was implemented. The data was analyzed using Student’s t-tests and ANOVAs. The significance was set at p < 0.05. Statistica v.6 (StatSoft, Inc., Tulsa, OK, USA) and Statgraphics Centurion Program v.19 (1982–2019) were used for statistical data treatment.
3. Results
3.1. Paired t-Tests: Comparison of Paired Samples of Each Unalterated TMFC Plots Versus the Close Altered Coffee Plots
In the organic soil horizons of both primary and secondary TMFCs (located in Dominican and Haitian forests, respectively), the following significant differences were obtained using paired t-tests (Figure 1):
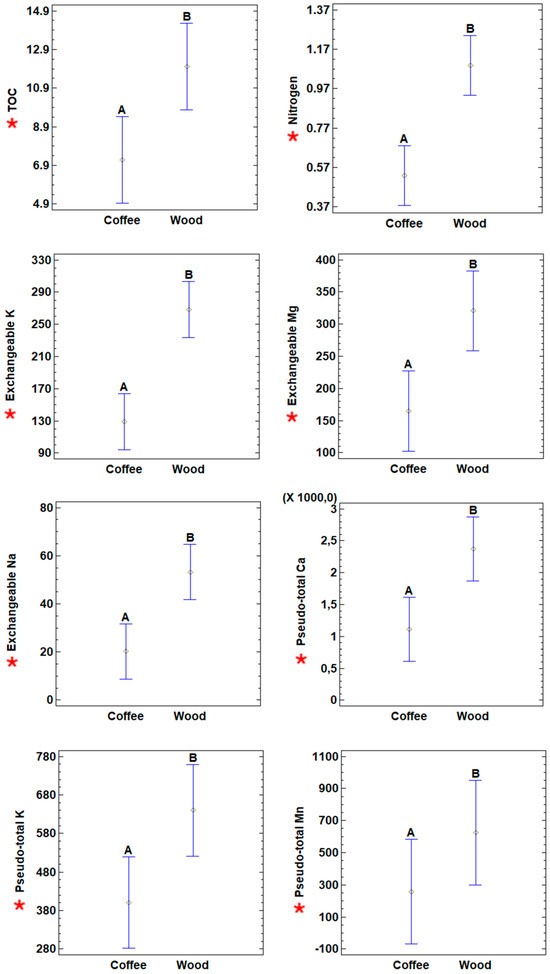
Figure 1.
Average of soil parameters analyzed in organic horizons of undisturbed plots of TMCFs (both primary and secondary TFMCs) compared to organic horizons of nearby plots of cleared TMCFs for coffee production (significant differences using paired t-tests: p < 0.05 *). Error bars indicate confidence intervals. [N and TOC expressed in g·100 g−1; available (av.) and pseudo-total (pse.) elements expressed in mg kg−1].
- ○
- The TOC was higher in undisturbed plots of TMFCs than in cleared plots of TMFCs for coffee cultivation (p-value < 0.0001; paired t-test with 14 d.f.). The mean value of soil TOC (%) in undisturbed plots of TMFCs was 4.83 units higher than in cleared plots of TMFCs (95% CI interval from 0.28 to 0.64 units).
- ○
- The N was higher in undisturbed plots of TMFCs than in cleared plots of TMFCs for coffee cultivation (p-value < 0.001; paired t-test with 14 d.f.). The mean value of soil N (%) in undisturbed plots of TMFCs was 0.56 units higher than in cleared plots of TMFCs (95% CI interval from 0.17 to 0.45 units).
- ○
- The exchangeable K+ was higher in undisturbed plots of TMFCs than in cleared plots of TMFCs for coffee cultivation (p-value < 0.001; paired t-test with 14 d.f.). The mean value of soil exchangeable K+ (mg kg−1) in undisturbed plots of TMFCs was 139.09 units higher than in cleared plots of TMFCs (95% CI interval from 2.47 to 7.78 units).
- ○
- The exchangeable Mg2+ was higher in undisturbed plots of TMFCs than in cleared plots of TMFCs for coffee cultivation (p-value < 0.005; paired t-test with 14 d.f.). The mean value of soil exchangeable Mg2+ (mg kg−1) in undisturbed plots of TMFCs was 156.05 units higher than in cleared plots of TMFCs (95% CI interval from 1.96 to 8.49 units).
- ○
- The exchangeable Na+ was higher in undisturbed plots of TMFCs than in cleared plots of TMFCs for coffee cultivation (p-value < 0.002; paired t-test with 14 d.f.). The mean value of soil exchangeable Na+ (mg kg−1) in undisturbed plots of TMFCs was 33.03 units higher than in cleared plots of TMFCs (95% CI interval from 1.07 to 3.73 units).
- ○
- The available Cu was higher in undisturbed plots of TMFCs than in cleared plots of TMFCs for coffee cultivation (p-value < 0.002; paired t-test with 14 d.f.). The mean value of soil available Cu (mg kg−1) in undisturbed plots of TMFCs was 2.19 units higher than in cleared plots of TMFCs (95% CI interval from 0.14 to 0.82 units).
- ○
- The pseudo-total Ca was higher in undisturbed plots of TMFCs than in cleared plots of TMFCs for coffee cultivation (p-value < 0.03; paired t-test with 14 d.f.). The mean value of soil pseudo-total Ca (mg kg−1) in undisturbed plots of TMFCs was 1258.40 units higher than in cleared plots of TMFCs (95% CI interval from 0.14 to 1.42 units).
- ○
- The pseudo-total K was higher in undisturbed plots of TMFCs than in cleared plots of TMFCs for coffee cultivation (p-value < 0.02; paired t-test with 14 d.f.). The mean value of soil pseudo-total K (mg kg−1) in undisturbed plots of TMFCs was 239.01 units higher than in cleared plots of TMFCs (95% CI interval from 0.16 to 1.10 units).
- ○
- The pseudo-total Mn was higher in undisturbed plots of TMFCs than in cleared plots of TMFCs for coffee cultivation (p-value < 0.05; paired t-test with 14 d.f.). The mean value of soil pseudo-total Mn (mg kg−1) in undisturbed plots of TMFCs was 368.04 units higher than in cleared plots of TMFCs (95% CI interval from 0.03 to 2.29 units.

Table 1.
Dominican Mountains: Mean values and ANOVA analysis of the soil fertility indicators recorded for the primary TMCFs versus nearby forests cleared for coffee cultivation.
Table 1.
Dominican Mountains: Mean values and ANOVA analysis of the soil fertility indicators recorded for the primary TMCFs versus nearby forests cleared for coffee cultivation.
| Location | Wood | UTM-E 1 | UTM-N 1 | Altitude 2 | Horizon (Code) | Depth | pH | TOC | N | P av. | Ca av. | Mg av. | K av. | Na av. | Fe av. | Mn av. | Zn av. | Cu av. | Al av. |
|---|---|---|---|---|---|---|---|---|---|---|---|---|---|---|---|---|---|---|---|
| Cachote | Primary TMCF | 267009 | 2002778 | 1141.83 | Profile (1) | 32.83 | 4.62 | 5.73 | 0.64 | 20.97 ** | 1153.97 | 201.65 | 141.48 ** | 48.02 | 148.07 | 142.38 | 4.76 | 3.50 | 528.74 |
| SD | 9.02 | 0.51 | 2.93 | 0.36 | 24.21 | 1027.12 | 112.04 | 68.27 | 29.03 | 101.26 | 216.60 | 2.66 | 3.62 | 465.56 | |||||
| Coffee crop | Profile (2) | 35.00 | 4.56 | 3.12 | 0.24 | 78.74 ** | 480.53 | 56.66 | 43.19 ** | 16.51 | 72.74 | 9.89 | 2.50 | 0.57 | 34.81 | ||||
| SD | 12.25 | 0.41 | 1.59 | 0.12 | 62.21 | 643.63 | 41.66 | 13.80 | 6.16 | 25.19 | 12.78 | 3.43 | 0.31 | 12.52 | |||||
| Primary TMCF | Organic (1.1) | 7.00 | 4.37 | 9.36 | 1.20 * | 19.64 | 1798.09 | 350.05 | 263.93 ** | 79.76 | 94.83 | 170.34 | 5.15 | 3.17 | 592.40 | ||||
| SD | 4.60 | 0.64 | 5.95 | 0.69 | 41.68 | 1528.30 | 191.35 | 147.27 | 57.59 | 52.24 | 227.16 | 5.82 | 3.20 | 590.53 | |||||
| Coffee crop | Organic (2.1) | 10.00 | 4.26 | 4.50 | 0.33 * | 55.59 | 666.32 | 78.07 | 60.98 ** | 18.77 | 58.12 | 15.30 | 1.22 | 0.40 | 34.65 | ||||
| SD | 0.00 | 0.27 | 2.22 | 0.13 | 33.27 | 865.00 | 54.38 | 18.46 | 5.64 | 42.90 | 21.80 | 0.86 | 0.27 | 26.01 | |||||
| Primary TMCF | Mineral (1.2) | 17.50 | 4.82 | 3.20 | 0.26 | 18.74 | 689.37 | 88.18 | 53.87 | 23.35 | 170.02 | 94.10 | 3.78 | 3.60 | 539.17 | ||||
| SD | 9.87 | 0.45 | 1.92 | 0.16 | 12.76 | 740.91 | 81.58 | 32.58 | 9.90 | 61.54 | 153.44 | 2.21 | 3.82 | 404.10 | |||||
| Coffee crop | Mineral (2.2) | 20.00 | 4.65 | 2.02 | 0.16 | 107.49 | 314.15 | 37.92 | 29.03 | 14.88 | 76.42 | 4.60 | 3.85 | 0.65 | 37.32 | ||||
| SD | 0.00 | 0.22 | 1.03 | 0.10 | 124.10 | 419.75 | 29.25 | 9.06 | 6.78 | 52.74 | 5.13 | 6.42 | 0.68 | 20.88 | |||||
| Cachote | P pse. | Ca pse. | Mg pse. | K pse. | Na pse. | Fe pse. | Mn pse. | Zn pse. | Cu pse. | Al pse. | |||||||||
| Primary TMCF | 267009 | 2002778 | 1141.83 | Profile (1) | 528.22 | 1660.23 | 821.34 | 530.52 | 97.97 | 3997.86 | 353.28 | 31.48 | 9.47 | 5677.57 | |||||
| SD | 448.40 | 1426.61 | 912.14 | 364.61 | 41.39 | 4087.49 | 505.01 | 36.86 | 10.16 | 5792.43 | |||||||||
| Coffee crop | Profile (2) | 164.09 | 726.58 | 552.27 | 389.13 | 70.98 | 7008.93 | 38.40 | 14.76 | 7.41 | 6999.72 | ||||||||
| SD | 154.94 | 831.18 | 791.32 | 469.09 | 29.41 | 8191.94 | 49.78 | 14.49 | 11.27 | 9149.30 | |||||||||
| Primary TMCF | Organic (1.1) | 753.92 | 2443.93 | 819.93 | 615.14 | 118.46 | 3330.20 | 317.99 | 35.50 | 9.94 | 5333.31 | ||||||||
| SD | 492.19 | 1921.79 | 585.69 | 256.21 | 49.98 | 2075.94 | 411.51 | 38.30 | 8.74 | 3781.82 | |||||||||
| Coffee crop | Organic (2.1) | 195.03 | 865.56 | 437.65 | 343.59 | 70.04 | 4695.48 | 32.33 | 13.01 | 5.81 | 5013.42 | ||||||||
| SD | 164.24 | 1022.88 | 583.94 | 332.49 | 24.69 | 5330.71 | 42.84 | 9.89 | 7.37 | 6021.74 | |||||||||
| Primary TMCF | Mineral (1.2) | 376.29 | 823.73 | 676.21 | 426.95 | 75.80 | 3475.71 | 330.13 | 25.15 | 7.48 | 5311.42 | ||||||||
| SD | 488.51 | 812.04 | 951.70 | 439.09 | 44.26 | 4067.86 | 500.14 | 31.28 | 8.82 | 6181.78 | |||||||||
| Coffee crop | Mineral (2.2) | 142.23 | 615.74 | 672.57 | 447.09 | 72.28 | 9407.55 | 44.79 | 16.96 | 9.09 | 9094.63 | ||||||||
| SD | 145.26 | 684.54 | 1004.52 | 601.38 | 34.74 | 11,284.35 | 57.01 | 18.82 | 15.24 | 12,261.46 | |||||||||
| Polo-Cortico | Primary TMCF | 265430 | 2003692 | 1276.67 | Profile (3) | 28.50 | 4.70 | 5.37 | 0.43 | 17.27 ** | 523.43 | 126.73 | 139.91 ** | 23.55 | 108.17 | 4.51 | 1.90 | 0.52 | 112.58 |
| SD | 5.28 | 0.35 | 3.45 | 0.17 | 19.19 | 295.92 | 86.16 | 45.53 | 5.84 | 81.60 | 3.35 | 2.00 | 0.43 | 192.22 | |||||
| Coffee crop | Profile (4) | 28.17 | 5.13 | 4.46 | 0.45 | 75.40 ** | 1135.20 | 163.37 | 90.52 ** | 22.93 | 197.09 | 73.37 | 11.37 | 1.75 | 430.47 | ||||
| SD | 8.59 | 0.62 | 2.57 | 0.26 | 88.60 | 821.13 | 122.59 | 39.81 | 7.10 | 71.54 | 103.14 | 14.54 | 1.79 | 344.03 | |||||
| Primary TMCF | Organic (3.1) | 6.83 | 4.22 | 11.83 | 0.91 * | 12.30 | 1101.77 | 273.95 | 291.57 ** | 41.50 | 56.52 | 3.11 | 2.63 | 0.37 | 24.42 | ||||
| SD | 3.54 | 0.30 | 10.22 | 0.54 | 20.22 | 847.38 | 246.33 | 122.87 | 18.14 | 92.35 | 1.92 | 3.90 | 0.43 | 33.18 | |||||
| Coffee crop | Organic (4.1) | 4.50 | 4.83 | 5.92 | 0.55 * | 24.99 | 1324.54 | 228.74 | 149.24 ** | 23.50 | 132.57 | 28.63 | 2.47 | 0.93 | 302.10 | ||||
| SD | 0.84 | 0.64 | 3.41 | 0.31 | 31.32 | 1252.27 | 209.90 | 75.63 | 4.71 | 74.55 | 60.62 | 2.24 | 1.09 | 401.76 | |||||
| Primary TMCF | Mineral (3.2) | 15.83 | 4.97 | 1.75 | 0.11 | 21.61 | 176.58 | 37.48 | 36.87 | 11.85 | 155.98 | 6.55 | 0.82 | 0.77 | 201.67 | ||||
| SD | 4.92 | 0.79 | 1.79 | 0.09 | 26.27 | 137.46 | 29.47 | 24.87 | 4.80 | 98.13 | 6.92 | 0.92 | 1.10 | 353.22 | |||||
| Coffee crop | Mineral (4.2) | 13.67 | 5.03 | 4.21 | 0.44 | 153.95 | 1131.88 | 156.63 | 80.10 | 23.10 | 297.97 | 97.58 | 21.92 | 2.33 | 607.75 | ||||
| SD | 4.97 | 0.79 | 2.79 | 0.25 | 204.88 | 820.40 | 123.68 | 39.35 | 7.52 | 146.95 | 147.23 | 28.20 | 2.60 | 420.80 | |||||
| Polo-Cortico | P pse. | Ca pse. | Mg pse. | K pse. | Na pse. | Fe pse. | Mn pse. | Zn pse. | Cu pse. | Al pse. | |||||||||
| Primary TMCF | 265430 | 2003692 | 1276.67 | Profile (3) | 231.15 | 1073.70 | 196.03 | 241.67 | 51.10 | 928.94 | 114.33 | 7.83 | 3.04 | 1302.46 | |||||
| SD | 153.88 | 845.52 | 126.86 | 77.91 | 10.39 | 233.48 | 68.86 | 2.70 | 2.98 | 620.55 | |||||||||
| Coffee crop | Profile (4) | 992.12 | 1581.69 | 1442.71 | 836.12 | 128.59 | 25,533.36 | 1886.25 | 104.42 | 65.21 | 36,244.29 | ||||||||
| SD | 1087.33 | 1124.65 | 1477.07 | 767.64 | 99.72 | 27,507.13 | 2291.55 | 109.86 | 70.15 | 39,776.13 | |||||||||
| Primary TMCF | Organic (3.1) | 513.02 | 1709.71 | 416.72 | 454.55 | 67.43 | 1525.22 | 271.28 | 13.24 | 5.86 | 2209.83 | ||||||||
| SD | 469.50 | 1563.54 | 371.28 | 151.74 | 24.07 | 654.52 | 202.46 | 6.26 | 6.83 | 1044.72 | |||||||||
| Coffee crop | Organic (4.1) | 1045.25 | 2073.90 | 1508.66 | 896.34 | 133.92 | 25,095.52 | 1830.41 | 101.37 | 62.07 | 35,400.40 | ||||||||
| SD | 1089.00 | 1787.35 | 1508.85 | 839.19 | 108.27 | 27,511.32 | 2119.88 | 110.04 | 68.30 | 40,389.68 | |||||||||
| Primary TMCF | Mineral (3.2) | 53.30 | 1044.23 | 59.23 | 77.17 | 39.55 | 520.83 | 13.92 | 3.96 | 1.48 | 640.62 | ||||||||
| SD | 59.31 | 1339.06 | 45.81 | 41.73 | 7.66 | 345.75 | 20.29 | 2.43 | 1.83 | 469.06 | |||||||||
| Coffee crop | Mineral (4.2) | 893.36 | 1463.58 | 1379.93 | 806.76 | 121.91 | 25,653.24 | 1788.73 | 101.35 | 63.80 | 34,851.08 | ||||||||
| SD | 962.54 | 789.34 | 1417.60 | 676.14 | 88.65 | 27,736.11 | 2208.53 | 107.09 | 68.88 | 37,300.50 |
1 Central geographical point; 2 Altitude average in m a.s.l.; SD = standard deviation; horizon depth expressed in cm; N and total organic carbon (TOC) expressed in g·100−1; available (av.) and pseudo-total (pse.). Elements expressed in mg kg−1; * p ≤ 0.01; ** p ≤ 0.002.
Table 2.
Haitian Mountains: Mean values and ANOVA analysis of the soil fertility indicators recorded for the secondary TMCFs (with pines) versus nearby forests cleared for coffee cultivation.
Table 2.
Haitian Mountains: Mean values and ANOVA analysis of the soil fertility indicators recorded for the secondary TMCFs (with pines) versus nearby forests cleared for coffee cultivation.
| Location | Wood | UTM-E 1 | UTM-N 1 | Altitude 2 | Horizon (Code) | Depth | pH | TOC | N | P av. | Ca av. | Mg av. | K av. | Na av. | Fe av. | Mn av. | Zn av. | Cu av. | Al av. |
|---|---|---|---|---|---|---|---|---|---|---|---|---|---|---|---|---|---|---|---|
| Macaya | Secondary TMCF | 597247 | 2031597 | 1282.17 | Profile (5) | 32.00 | 4.53 | 7.35 | 0.53 | 9.47 | 402.19 | 117.10 | 100.18 | 17.23 | 168.41 | 159.58 | 5.67 | 7.91 | 1224.66 |
| SD | 7.77 | 0.24 | 2.25 | 0.16 | 10.30 | 181.13 | 60.52 | 32.00 | 5.91 | 47.29 | 168.96 | 6.20 | 3.63 | 344.06 | |||||
| Coffee crop | Profile (6) | 27.00 | 4.95 | 7.72 | 0.53 | 10.50 | 1068.76 | 120.71 | 109.78 | 15.02 | 151.76 | 65.77 | 11.28 | 4.18 | 1109.34 | ||||
| SD | 6.81 | 0.57 | 1.47 | 0.09 | 10.40 | 1243.75 | 20.95 | 21.36 | 2.61 | 33.25 | 29.22 | 4.25 | 1.79 | 366.62 | |||||
| Secondary TMCF | Organic (5.1) | 3.67 | 4.59 | 12.58 | 0.86 | 16.95 | 922.54 | 222.96 | 191.02 | 21.44 | 219.87 | 258.67 | 10.05 | 7.77 | 953.05 | ||||
| SD | 1.03 | 0.28 | 5.48 | 0.31 | 24.01 | 558.81 | 157.37 | 98.70 | 12.98 | 74.39 | 258.02 | 8.49 | 2.50 | 207.79 | |||||
| Coffee crop | Organic (6.1) | 3.67 | 5.11 | 11.05 | 0.74 | 22.28 | 2149.80 | 227.82 | 172.67 | 18.65 | 171.50 | 127.83 | 19.97 | 4.45 | 891.38 | ||||
| SD | 1.03 | 0.96 | 3.10 | 0.18 | 20.61 | 2467.41 | 57.34 | 38.80 | 3.06 | 64.57 | 51.82 | 9.85 | 2.04 | 429.91 | |||||
| Secondary TMCF | Mineral (5.2) | 13.33 | 4.45 | 5.62 | 0.42 | 2.65 | 240.33 | 72.07 | 75.25 | 16.45 | 150.18 | 123.88 | 5.68 | 8.40 | 1298.37 | ||||
| SD | 4.08 | 0.27 | 2.01 | 0.20 | 6.48 | 233.88 | 60.22 | 38.28 | 5.13 | 57.74 | 184.02 | 10.16 | 4.26 | 353.03 | |||||
| Coffee crop | Mineral (6.2) | 19.17 | 4.79 | 5.18 | 0.36 | 0.00 | 97.25 | 30.82 | 59.25 | 12.02 | 129.43 | 8.95 | 4.45 | 4.07 | 1354.57 | ||||
| SD | 5.85 | 0.19 | 1.26 | 0.13 | 0.00 | 20.93 | 8.05 | 18.09 | 3.49 | 10.80 | 1.58 | 2.70 | 1.74 | 497.24 | |||||
| Macaya | P pse. | Ca pse. | Mg pse. | K pse. | Na pse. | Fe pse. | Mn pse. | Zn pse. | Cu pse. | Al pse. | |||||||||
| Secondary TMCF | 597247 | 2031597 | 1282.17 | Profile (5) | 301.42 | 634.19 | 1358.80 | 411.32 | 112.81 | 99,553.75 | 292.93 | 31.23 | 136.23 | 85,072.22 | |||||
| SD | 49.72 | 423.04 | 684.20 | 222.50 | 21.80 | 9855.36 | 144.72 | 7.22 | 40.56 | 17,277.23 | |||||||||
| Coffee crop | Profile (6) | 885.28 | 3300.23 | 809.80 | 307.39 | 105.61 | 96,698.47 | 214.52 | 47.09 | 85.39 | 85,436.11 | ||||||||
| SD | 816.32 | 6344.21 | 374.23 | 84.74 | 29.56 | 11,580.96 | 129.48 | 32.68 | 21.63 | 10,862.85 | |||||||||
| Secondary TMCF | Organic (5.1) | 484.20 | 1430.24 | 1234.73 | 499.98 | 112.72 | 86,680.00 | 388.43 | 31.14 | 93.68 | 71,800.00 | ||||||||
| SD | 135.97 | 1066.46 | 647.99 | 270.88 | 29.55 | 14,743.95 | 253.55 | 6.58 | 26.56 | 21,479.01 | |||||||||
| Coffee crop | Organic (6.1) | 1421.58 | 6431.50 | 976.79 | 413.54 | 105.77 | 83,690.83 | 324.18 | 68.44 | 71.25 | 76,808.33 | ||||||||
| SD | 1617.22 | 12,673.33 | 556.26 | 182.46 | 34.24 | 20,277.77 | 237.66 | 63.51 | 21.38 | 8038.87 | |||||||||
| Secondary TMCF | Mineral (5.2) | 257.62 | 311.25 | 1373.40 | 423.73 | 116.83 | 105,702.50 | 273.47 | 30.79 | 146.70 | 89,875.00 | ||||||||
| SD | 102.38 | 267.27 | 640.42 | 320.05 | 21.11 | 9479.56 | 164.69 | 7.15 | 59.14 | 18,788.13 | |||||||||
| Coffee crop | Mineral (6.2) | 408.53 | 202.18 | 649.03 | 226.12 | 99.78 | 107,908.33 | 112.63 | 28.67 | 97.72 | 93,200.00 | ||||||||
| SD | 76.83 | 62.08 | 343.16 | 59.51 | 22.41 | 17,962.96 | 25.99 | 7.22 | 34.87 | 15,538.66 |
1 Central geographical point; 2 Altitude average in m a.s.l.; SD = standard deviation; horizon depth expressed in cm; N and total organic carbon (TOC) expressed in g·100−1; available (av.) and pseudo-total (pse.). Elements expressed in mg kg−1; * p ≤ 0.01; ** p ≤ 0.002.
In the mineral soil horizons of both primary and secondary TMFCs (located in Dominican and Haitian forests, respectively), the following significant differences were obtained using paired t-tests (Figure 2):
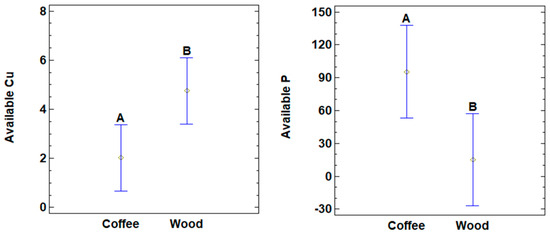
Figure 2.
Average of soil parameters analyzed in mineral horizons of undisturbed plots of TMCFs (both primary and secondary TFMCs) compared to mineral horizons of nearby plots of cleared TMCFs for coffee production (significant differences using paired t-tests: p < 0.05 *). Error bars indicate confidence intervals. [Available (av.) elements expressed in mg kg−1].
- ○
- The available Cu was higher in undisturbed TMFCs plots than in cleared TMFCs plots used for coffee cultivation (p-value < 0.03; paired t-test with 14 d.f.). The mean value of soil available Cu (mg kg−1) in undisturbed TMFCs was 2.73 units higher than in cleared TMFCs (95% CI interval from 0.07 to 0.81 units);
- ○
- The available P was lower in undisturbed plots of TMFCs than in cleared plots of TMFCs for coffee cultivation (p-value < 0.05; paired t-test with 14 d.f.). The mean value of soil available P (mg kg−1) in cleared plots of TMFCs was 80.19 units higher than in undisturbed plots of TMFCs (95% CI interval from 0.05 to 6.91 units).
3.2. ANOVAs: Differences in the Coffee Agroforesty Management (Tree Clearing) Impact on the Primary TFMCs (Dominican Area) Versus Secondary TFMCs (Haitian Area)
In a different approach, we also considered soil degradation caused by tree clearing in the unaltered primary TMCFs in Dominican forests versus secondary TMCFs in Haitian forests. In this regard, a global comparison of whole soil profiles and soil organic horizons was made between 12 unaltered primary TMCF plots (TMCF-1 plots) and 12 nearby primary forest soil profiles cleared for coffee cultivation (COFFEE-1) in the mountains of the Dominican Republic. The results of this comparison are as follows:
- (1)
- A comparison of the whole soil profiles revealed that the available P level in TMCF-1 was significantly lower than in COFFEE-1 [ANOVA (log-transformed data): F3,36 = 6.45; p = 0.0015] (Table 1; Figure 3; LSD test post-hoc p = 0.0211);
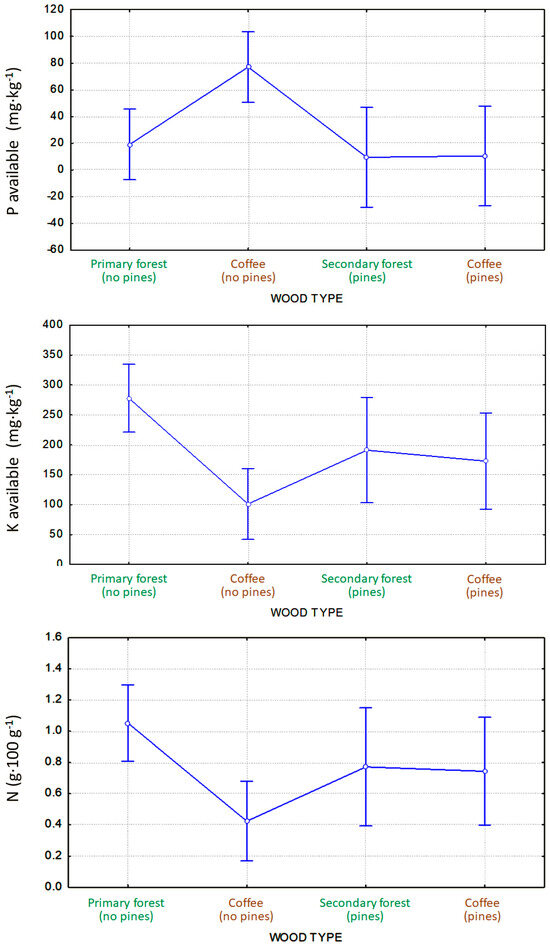 Figure 3. Average values of available P (whole soil profiles), available K (organic horizons), and N (organic horizons) of primary TMCFs versus nearby coffee plantations (ANOVA: significantly different; p < 0.05); and secondary TMCFs versus nearby coffee plantations (ANOVA: not significantly different). Error bars indicate confidence intervals.
 - (2)
- Similarly, a comparison of the entire soil profiles revealed that the available K levels in TMCF-1 were significantly higher than those in COFFEE-1 [ANOVA (log-transformed data): F3,36 = 6.15; p = 0.0020] (Table 1; LSD test post-hoc p = 0.0014);
- (3)
- (4)
- (5)
A similar approach was adopted, with no significant differences in the soil fertility of the secondary TMCFs at the mountains of Haiti being detected in the entire soil profile, organic and mineral horizons of the six secondary TMCF plots (TMCF-2 plots) versus the six nearby secondary forest plots cleared for coffee cultivation (COFFEE-2) (Table 2).
The results of the SQI calculation are shown in Figure 4 for the three zones, separating the SQIs calculated for the surface and deep horizons. The conclusions largely coincide with previous t-tests in that forest clearing primarily affects the organic horizons, but the effect is unclear in the mineral horizons. Indeed, a trend is observed in the surface horizons—much more significant in the soils of the Chacote area—toward greater elemental richness in the case of coffee plantations under montane cloud forest. The lower values in the cleared zones under coffee cultivation may reflect lower nutrient input, concomitant with lower biomass cover.
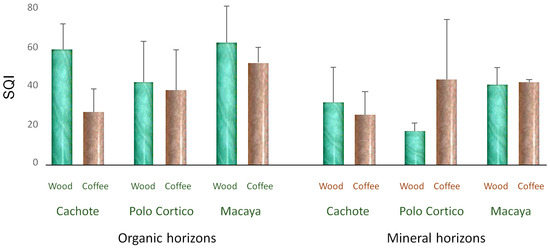
Figure 4.
Comparison of soil quality index (SQI) values in coffee plantations developed under cloud montane forests (green bars) and in areas where forest clearance has taken place (brown bars). The values are displayed for three distinct study areas, as well as for the surface and lower horizons. Standard deviation is indicated by error bars.
4. Discussion
Since TMCFs are dependent on specific environmental conditions they need for their establishment and growth (i.e., high air humidity, shade, and low ground level temperatures), their regeneration of the primary forest is more challenging than that of other vegetation types. Consequently, any alteration in microclimatic conditions has the potential to replace the cloud forest with different formations, such as pine forests, capable of withstanding lower humidity levels. In addition, the recovery of TMCFs following a disturbance is characterized by a reduced rate of soil organic matter decomposition and low biomass production compared to tropical rainforest and other formations [22]. Consequently, TMCFs face many of the same threats to their existence as other tropical forests: however, their unique ecology and location on mountain slopes make them particularly vulnerable [4,22].
As posited by Benner et al. [49], the productivity of aboveground forestry in TMCF soils is constrained by two factors: the nutrient-poor nature of these soils and their inherent toxicity. The prevailing opinion among several authors [42,43] is that nitrogen limitation is an essential and probable cause of low net primary productivity. Benner et al. [49] advanced the argument that diminished nitrogen supply is more likely to be attributable to slow rates of nitrogen cycling than to low nitrogen inputs. They also suggested that the high soil water contents of many cloud-immersed montane forests are likely to be an essential ultimate cause of such reduced nitrogen cycling rates. Roman et al. [50] also highlighted the potential for nitrogen and phosphorus limitations to restrict the above-ground productivity of TMCF. However, these authors caution that not all TMCFs are subject to nitrogen and phosphorus limitations, and that if such limitations exist in these forests, they may be more related to the plants’ ability to access the soil resource than the size of the nutrient pools. Benner et al. [49] observed a transition from nitrogen to phosphorus limitation as soils aged in a chrono-sequence originating from the same volcanic parent material in Hawaii. This suggests that montane forests on younger soils are nitrogen-limited. In comparison, those on older soils are phosphorus-limited.
Our results indicate a correlation between clearing TMCFs for coffee production and the subsequent impact on soil fertility and quality. The assessment encompassed parameters such as soil pH, thickness of the organic horizon, TOC, N, available P and available Al, which we were able to use to discriminate, the perturbed soils sustaining coffee crops from the soils of uncleared nearby both primary TMCFs (without pines and where hardwoods are the dominant species) and secondary TMCFs (with pines), respectively (Figure 2). As outlined in the above findings, Nonato de Souza [20] discovered that specific soil quality variables (TOC, microbial carbon, soil respiration, and potential nitrogen mineralization) exhibited elevated levels in “reference forest fragments” when compared to the surrounding “full-sun coffee” systems within the tropical forests of Brazil.
Letts et al. [51] found that soils of primary TMCFs have significantly higher levels of N, available P, K, and Ca than secondary TMCFs and pastures, which have changed their soil use. The N and available K data obtained here corroborate this hypothesis. Our analysis revealed that, on average, available K and N in the soil organic horizons were lower in the coffee plantations compared with nearby primary forests (0.49 to 0.77 and 0.39 to 0.72 times lower, respectively) or secondary forests (0.10 and 0.13 times lower, respectively, but not significantly).
Research on nutrient stocks, turnover rates, and foliar nutrients has demonstrated that the nitrogen supply to vegetation is lower in TMCFs than in lowland tropical forests. Furthermore, the potential for biological nitrogen fixation may also be diminished in montane ecosystems compared to lowland tropical forests. This finding lends support to the hypothesis that reduced nutrient cycling may result in nutrient limitation. However, it should be noted that these limitations may be temporary. As a result, the observed slowing of decomposition and mineralization could lead to significant accumulations of organic soil matter and nutrients, as we have seen in tropical montane environments. It is predicted that this phenomenon will be transient, with even minimal rates of nutrient turnover potentially ensuring an adequate supply of biogenic nutrients for organisms [41].
The TMCF tree cover provides a continuous supply of organic matter to the soil, thereby protecting it from erosion and leaching. Consequently, the clearing of TMCFs for the purpose of coffee cultivation in the study area is hypothesized to have precipitated alterations in soil nutrient stock patterns and turnover rates, thereby promoting soil erosion. This could explain the diminished N and available K observed in soils supporting coffee crops compared to soils within unaltered TMCFs. In effect, Bruijnzeel [52], Sidle et al. [53], and Mulligan [12] described that TMCFs are generally highly susceptible to erosion in the absence of the protection provided by intact forest.
An ANOVA further demonstrates that, in the entire soil profile, the available P levels were, on average, higher in the coffee plantations than in the proximate undisturbed primary forests (0.73–0.77 times greater) or secondary forests (0.10 times greater, but not significantly). These results are consistent with the hypothesis proposed by Bautista-Cruz et al. [54], who stated that soil phosphorus levels decline during succession due to the increasing demand for this nutrient by the large-sized plants common to old-growth forests.
Nevertheless, the present findings and the initial hypothesis of Bautista-Cruz et al. [54] are not in line with the results obtained by these authors in TMCFs of the Sierra Norte Mountain range of the State of Oaxaca (Mexico). In these TMCFs, the authors observed that: (1) The available P showed a slow rate of change during forest recovery (four successional stages were compared: cornfield soils, incipient forest soils, young and mature forest soils, and old-growth forest soils); (2) the mean available P values over the course of succession were outside the natural range of variability found in the old-growth forest soils (0.025 to 0.035 mg kg−1) (excluding pines and where hardwoods are the dominant species); (3) in all the cases examined, the mean available P levels were found below (<0.015 mg kg−1) the natural range of variability in the old-growth forest soils; and (4) soil available P levels were slightly lower in 75-year forests (with few tropical pines) than 45-year forests (dominated by of tropical pines) (both ranging from >0.010 to <0.015 mg kg−1), and in both cases, the available P was much higher than in the incipient 15-year forests (dominated by tropical pines) (<0.010 mg kg−1) or corn crops (<0.005 mg kg−1). These authors have provided a rationale for these unanticipated outcomes, attributing them to the minimal phosphorus input from bedrock weathering in specific ecosystems. In such an environment, the atmosphere assumes the primary phosphorus source, enabling old-growth forests to trap fog droplets with concentrations of dissolved phosphorus and other nutrients.
As illustrated in our case study and in the profiles from Cachote (see Table 2), there is a clear increase in the availability of P in coffee plantations. This increase cannot be easily explained by the change in pH, which remains almost constant. This issue may be partly attributable to diminished demand, consequent to the loss of vegetation in the cleared plot. Nevertheless, it is suggested that the observed data appear to be logical when considered in the context of the comparison between the primary forest and the coffee plantation, where a decline in TOC values from approximately 6% to 3% is evident. It is hypothesized that this variation in the accumulated TOC in the soil may indicate a range of alternative processes that could influence P availability. It is conceivable that this is due to enhanced mineralization of organic matter, which can result in the release of inorganic P forms. It is also possible that the release of the element to the soil solution is due to the biodegradation of the soil and the decreased occurrence of P-humic acid complexes in TOC-depleted soils.
Coffee cultivation is typically carried out beneath the canopies of local tree species [20]. Senbeta [55] noted that soils in the coffee-growing area are acidic to slightly acidic, with limited phosphorus availability. For an optimum yield and quality of coffee, the nature and properties of the soil are of utmost importance [31]. Nutrient availability is crucial for coffee trees’ vegetative growth and for producing high-quality beans. Available P and K are pivotal factors influencing coffee quality among the major soil nutrients. It is crucial to maintain a balanced ratio between soil nutrients is crucial, particularly between P and N and Mg and K.
The findings of this study reveal that clearing TMCFs for coffee cultivation has a substantial impact on soil nutrient dynamics, particularly N, K, and P. The depletion of soil N and the availability of K in cleared plots suggest a decline in soil fertility that may adversely affect coffee quality and yield. These changes are largely driven by the loss of canopy cover, which accelerates organic matter decomposition and intensifies nutrient leaching and erosion. thereby reducing the nutrient retention capacity of the soil.
Although available P increased following forest clearing, likely due to reduced plant uptake and enhanced mineralization in organic matter–depleted soils, this does not offset the broader degradation of nutrient balance. Given that phosphorus is usually not a limiting factor in coffee production, the ecological cost of clearance appears disproportionate to any potential benefits.
A comparison of SQI values (Figure 4) suggests that the effect of deforestation and coffee cultivation cannot be considered to have produced a dramatic loss of soil quality, as it still retains a considerable capacity for nutrient accumulation. Additionally, the alterations remain undetectable within the deep horizons, where the differences are not significant. In one case, such as the soils of Polo-Cortico, a greater concentration of most of the nutrients is even observed in the cleared zones. A thorough examination of the distinctive behavior exhibited by this group of samples has led to the conclusion that elevated levels of several elements traditionally associated with calcium, including Mg, Mn, P, and Zn, are observed. It can be posited that the increase in SQI, although statistically insignificant, may be indicative of a correlation between deforestation and the reduced influence of biomass cover within these ecosystems. This could potentially lead to an increased influence of the geological substrate on soil nutrient accumulation. The aforementioned findings are consistent with the preceding observation that the impact of deforestation on soil quality is predominantly produced in the surface horizons.
In order to guide sustainable land-use practices, future research should explore the long-term effects of these nutrient shifts on coffee quality, assess the potential of agroforestry systems to buffer against nutrient losses, and evaluate soil restoration strategies that maintain both crop productivity and forest ecosystem integrity.
Author Contributions
Conceptualization, L.G.G.-M., S.A. and G.A.; methodology, L.G.G.-M., G.A. and M.F.; software, L.G.G.-M. and M.F.; validation, G.A.; formal analysis, L.G.G.-M. and M.F.; investigation, L.G.G.-M., M.F., S.A. and G.A.; resources, G.A.; data curation, G.A.; writing—original draft preparation, L.G.G.-M., M.F. and G.A.; writing—review and editing, L.G.G.-M. and G.A.; visualization, L.G.G.-M. and G.A.; supervision, L.G.G.-M. and G.A. All authors have read and agreed to the published version of the manuscript.
Funding
This research received no external funding.
Data Availability Statement
Supplementary data to this article can be found online at https://zenodo.org/records/15274443 (accessed on 27 June 2025).
Acknowledgments
The authors would also like to acknowledge the suggestions of three anonymous referees, whose contributions have significantly enhanced the original version of this article.
Conflicts of Interest
The authors declare no conflicts of interest.
Abbreviations
The following abbreviations are used in this manuscript:
| AMF | Arbuscular mycorrhizal fungi |
| ANOVA | Analysis of variance |
| a.s.l. | Above sea level |
| CRM | Certified Reference Material |
| ICP-OES | Inductively Coupled Plasma Optical Emission Spectrometry |
| LSD | Least Significant Difference |
| SD | Standard Deviation |
| SOP | Standard Operating Procedure |
| SQI | Soil Quality Index |
| TOC | Total organic carbon |
| TMCF | Tropical montane cloud forests |
References
- Scatena, F.N.; Bruijnzeel, L.A.; Bubb, P.; Das, S. Setting the stage. In Tropical Montane Cloud Forests: Science for Conservation and Management; Bruijnzeel, L.A., Scatena, F.N., Hamilton, L.S., Eds.; Cambridge University Press: Cambridge, UK, 2010; pp. 38–63. [Google Scholar]
- Toledo-Aceves, T.; Meave, J.A.; González-Espinoza, M.; Ramírez-Marcial, N. Tropical montane cloud forest: Current threats and opportunities for their conservation and sustainable management in Mexico. J. Environ. Manag. 2009, 92, 974–981. [Google Scholar] [CrossRef] [PubMed]
- Ledo, A.; Condes, S.; Alberdi, I. Forest biodiversity assessment in Peruvian Andean Montane cloud forest. J. Mt. Sci. 2012, 9, 372–384. [Google Scholar] [CrossRef]
- Bubb, P.; May, I.; Miles, L.; Sayer, J. Cloud Forest Agenda; UNEP World Conservation Monitoring Centre: Cambridge, UK, 2004; p. 32. [Google Scholar]
- Leo, M. The importance of tropical montane cloud forest for preserving vertebrate endemism in Peru: The Rio Abiseo National Park as a case study. In Tropical Montane Cloud Forests; Hamilton, L.S., Juvik, J.O., Scatena, F.N., Eds.; Springer: New York, NY, USA, 1995; pp. 198–211. [Google Scholar]
- Long, A. Restricted-range and threatened bird species in tropical montane cloud forests. In Tropical Montane Cloud Forests; Hamilton, L.S., Juvik, J.O., Scatena, F.N., Eds.; Springer: New York, NY, USA, 1995; pp. 47–65. [Google Scholar]
- Salaman, P.; Donegan, T.M.; Mulligan, M. A new species of wood-wren (Troglodytidae: Henicorhina) from the western Andes of Colombia. Ornitol. Colomb. 2003, 1, 4–21. [Google Scholar] [CrossRef]
- Calvo-Alvarado, C.; Sánchez-Azofeifa, A.; Méndez, A. Conservation strategies for montane cloud forests in Costa Rica: The case of protected areas, payments for environmental services, and ecotourism. In Tropical Montane Cloud Forests: Science for Conservation and Management; Bruijnzeel, L.A., Scatena, F.N., Hamilton, L.S., Eds.; Cambridge University Press: Cambridge, UK, 2011; pp. 686–690. [Google Scholar]
- Kappelle, M.; Brown, A.D. Bosques Nublados del Neotrópico; IMBIO: Heredia, Costa Rica, 2001; pp. 397–442. [Google Scholar]
- Beck, E.; Bendix, J.; Kottke, I.; Makeschin, F.; Mosandl, R. Gradients in a Tropical Mountain Ecosystem of Ecuador; Springer: Berlin, Germany, 2007; pp. 1–522. [Google Scholar]
- Bruijnzeel, L.A.; Kapelle, M.; Mulligan, M.; Scatena, F.N. Tropical montane cloud forests: State of knowledge and sustainability perspectives in a changing world. In Tropical Montane Cloud Forests: Science for Conservation and Management; Bruijnzeel, L.A., Scatena, F.N., Hamilton, L.S., Eds.; Cambridge University Press: Cambridge, UK, 2011; pp. 691–737. [Google Scholar]
- Mulligan, M. Modeling the tropics-wide extent and distribution of cloud forest and cloud forest loss, with implications for conservation priority. In Tropical Montane Cloud Forests: Science for Conservation and Management; Bruijnzeel, L.A., Scatena, F.N., Hamilton, L.S., Eds.; Cambridge University Press: Cambridge, UK, 2011; pp. 14–38. [Google Scholar]
- García, R.; Roersch, C. Política de manejo y utilización de los recursos florísticos en la República Dominicana. J. Ethnopharmacol. 1996, 51, 147–160. [Google Scholar] [CrossRef]
- Alexis, S. Estrategias de Desarrollo Sostenible en la Provincia y Cuenca Transfronteriza de Pedernales (República Dominicana-Haiti). Ph.D. Thesis, University of Alcalá, Alcalá de Henares, Spain, 2008. [Google Scholar]
- Alexis, S.; García-Montero, L.G.; Hernández, A.J.; García-Abril, A.; Pastor, J. Soil fertility and GIS raster models for tropical agroforestry planning in economically depressed and contaminated Caribbean areas (coffee and kidney bean plantations). Agrofor. Syst. 2010, 79, 381–391. [Google Scholar] [CrossRef]
- Pastor, J.; Alexis, S.; Vizcayno, C.; Hernández, A.J. Quantitative physical and chemical variables used to assess erosion and fertility loss in tropical Dominican and Haitian soils. Geophys. Res. Abstr. 2009, 11, 13717. [Google Scholar]
- Hernández, A.J.; Vizcayno, C.; Alexis, S.; Pastor, J. Parámetros cuantitativos para la evaluación de la susceptibilidad a la erosión de suelos tropicales dominicanos. Rev. Ciênc. Agrár. 2010, 33, 128–138. [Google Scholar]
- Núñez, P.A.; Pimentel, A.; Almonte, I.; Sotomayar-Ramírez, D.; Martínez, N.; Pérez, A.; Céspedes, C.M. Soil fertility evaluation of coffee (Coffea spp.) production systems and management recommendations for the Barahona province, Dominican Republic. J. Soil Sci. Plant Nutr. 2011, 11, 127–140. [Google Scholar] [CrossRef]
- CIA Central Intelligence Agency of the United States of America. The World Factbook. Available online: https://www.cia.gov/the-world-factbook/ (accessed on 24 April 2025).
- Nonato de Souza, H.; de Goede, R.G.M.; Brussaard, L.; Cardoso, I.M.; Duarte, E.M.G.; Fernandes, R.B.A.; Gomes, L.C.; Pulleman, M.M. Protective shade, tree diversity and soil properties in coffee agroforestry systems in the Atlantic Rainforest biome. Agric. Ecosyst. Environ. 2012, 146, 179–196. [Google Scholar] [CrossRef]
- De Matta, F.M. Ecophysiological constraints on the production of shaded and unshaded coffee: A review. Field Crops Res. 2004, 86, 99–114. [Google Scholar] [CrossRef]
- Toledo, T. El bosque de niebla. CONABIO. Biodivers. 2009, 83, 1–6. [Google Scholar]
- Nigussie, A.; Kissi, E. The contribution of coffee agroecosystem to soil fertility in Southwestern Ethiopia. Afr. J. Agric. Res. 2012, 7, 74–81. [Google Scholar] [CrossRef]
- Dias, K.G.D.L.; Guimarães, P.T.G.; do Carmo, D.L.; Reis, T.H.P.; Lacerda, J.J.D.J. Alternative sources of potassium in coffee plants for better soil fertility, productivity, and beverage quality. Pesq. Agropec. Bras. 2018, 53, 1355–1362. [Google Scholar] [CrossRef]
- Hanisch, S.; Dara, Z.; Brinkmann, K.; Buerkert, A. Soil fertility and nutrient status of traditional Gayo coffee agroforestry systems in the Takengon region, Aceh Province, Indonesia. J. Agric. Rural Dev. Trop. Subtrop. 2011, 112, 87–100. [Google Scholar]
- Raghubanshi, A.S. Effect of topography on selected soil properties and nitrogen mineralization in a dry tropical forest. Soil Biol. Biochem. 1992, 24, 145–150. [Google Scholar] [CrossRef]
- Yadessa, A.; Burhardt, J.; Denich, M.; Woldermariam, T.; Bekele, E.; Goldbach, H. Influence of soil properties on cup quality of wild arabica coffee in the coffee forest ecosystem of SW Ethiopia. In Proceedings of the 22nd International Conference on Coffee Science (ASIC), Campinas, Brazil, 14–19 September 2008. [Google Scholar]
- Tian, G.; Badejo, M.; Okoh, A.; Ishida, F.; Kolawole, G.; Hayashi, Y.; Salako, F. Effects of residue quality and climate on plant residue decomposition and nutrient release along the transect from humid forest to Sahel of West Africa. Biogeochemistry 2007, 86, 217–229. [Google Scholar] [CrossRef]
- Hairiah, K.; Sulistyani, H.; Suprayogo, D.; Purnomosidhi, P.; Widodo, R.H.; Van Noordwijk, M. Litter layer residence time in forest and coffee agroforestry systems in Sumberjaya, West Lampung. For. Ecol. Manag. 2006, 224, 45–57. [Google Scholar] [CrossRef]
- Kibblewhite, M.G.; Ritz, K.; Swift, M.J. Soil health in agricultural systems. Philos Trans. R. Soc. B Biol. Sci. 2008, 363, 685–701. [Google Scholar] [CrossRef]
- Mintesnot, A.; Dechassa, N.; Mohammed, A. Association of Arabica coffee quality attributes with selected soil chemical properties. East Afr. J. Sci. 2015, 9, 73–84. [Google Scholar]
- García-Santos, G. An Ecohydrological and Soils Study in a Montane (Cloud Forest in the National Park of Garajonay, La Gomera (Canaria Islands, Spain). Ph.D. Thesis, University of Amsterdam, Amsterdam, The Netherlands, 2007. [Google Scholar]
- Schrumpf, M.; Lyaruu, H.V.M.; Axmacher, J.C.; Zech, W.; Bruijnzeel, L.A. Effects of forest disturbance and regeneration on net precipitation and soil water dynamics in tropical montane rain forest on Mount Kilimanjaro, Tanzania. In Tropical Montane Cloud Forests: Science for Conservation and Management; Bruijnzeel, L.A., Scatena, F.N., Hamilton, L.S., Eds.; Cambridge University Press: Cambridge, UK, 2011; pp. 491–501. [Google Scholar]
- Valladares, R. Review of Tropical Montane Cloud Forest Focused on a Case Study of Soils (Dominican Republic and Haiti). Master’s Thesis, Universidad Politécnica de Madrid, Madrid, Spain, 2012. [Google Scholar]
- Kassa, H.; Dondeyne, S.; Poesen, J.; Frankl, A.; Nyssen, J. Impact of deforestation on soil fertility, soil carbon and nitrogen stocks: The case of the Gacheb catchment in the White Nile Basin, Ethiopia. Agric. Ecosyst. Environ. 2017, 247, 273–282. [Google Scholar] [CrossRef]
- Veldkamp, E. Organic carbon turnover in three tropical soils under pasture after deforestation. Soil Sci. Soc. Amer. J. 1994, 58, 175–180. [Google Scholar] [CrossRef]
- Veldkamp, E.; Schmidt, M.; Powers, J.S.; Corre, M.D. Deforestation and reforestation impacts on soils in the tropics. Nat. Rev. Earth. Environ. 2020, 1, 590–605. [Google Scholar] [CrossRef]
- Mohammed, A.; Bekele, L. Changes in carbon stocks and sequestration potential under native forest and adjacent land use systems at Gera: South-Western Ethiopia. Glob. J. Sci. Front. Res. D Agric. Vet. 2014, 14, 11–20. [Google Scholar]
- Hombegowda, H.C.; van Straaten, O.; Köhler, M.; Hölscher, D. On the rebound: Soil organic carbon stocks can bounce back to near forest levels when agroforests replace agriculture in southern India. Soil 2016, 2, 13. [Google Scholar] [CrossRef]
- Hernández, A.J.; Alexis, S.; Pastor, J. Soil degradation in the tropical forests of the Dominican Republic’s Pedernales province in relation to heavy metal contents. Sci. Total Environ. 2007, 378, 36–41. [Google Scholar] [CrossRef] [PubMed]
- FAO. Guidelines for Soil Description; FAO: Roma, Italy, 1990; pp. 1–109. [Google Scholar]
- Martínez, E. Los bosques nublados de la República Dominicana. Cienc. Soc. 1990, 15, 192–218. [Google Scholar] [CrossRef]
- Schutt-Ainé, P. Haiti: A Basic Reference Book; Librairie Au Service de la Culture: Miami, FL, USA, 1994; p. 20. ISBN 0-9638599-0-0. [Google Scholar]
- Hernández, A.J.; Pastor, J. Técnicas analíticas para el estudio de las interacciones suelo-planta. Rev. Geol. 1989, 3, 51–92. [Google Scholar][Green Version]
- Lakanen, E.; Erviö, R. A Comparison of eight extractants for the determination of plant available micronutrients in soils. Finn. Soc. Agric. Sci. Publ. 1971, 123, 223–232. [Google Scholar][Green Version]
- Walsh, L.M. Instrumental Methods for Analysis of Soils and Plant Tissue; Soil Science Society of America: Madison, WI, USA, 1971; Volume 7, pp. 1–220. [Google Scholar]
- Ministerio de Agricultura Pesca y Alimentación (MAPA); Dirección General de Alimentación. Métodos Oficiales de Análisis de la Unión Europea Madrid; MAPA Centro de Publicaciones: Madrid, Spain, 1998. [Google Scholar]
- Mukherjee, A.; Lal, R. Comparison of soil quality index using three methods. PLoS ONE 2014, 9, e105981. [Google Scholar] [CrossRef]
- Benner, J.; Vitousek, P.M.; Ostertag, R. Nutrient cycling and nutrient limitation in tropical montane cloud forests. In Tropical Montane Cloud Forests: Science for Conservation and Management; Bruijnzeel, L.A., Scatena, F.N., Hamilton, L.S., Eds.; Cambridge University Press: Cambridge, UK, 2011; pp. 90–100. [Google Scholar]
- Roman, L.; Scatena, F.N.; Bruijnzeel, L.A. Global and local variations in tropical montane cloud forest soils. In Tropical Montane Cloud Forests: Science for Conservation and Management; Bruijnzeel, L.A., Scatena, F.N., Hamilton, L.S., Eds.; Cambridge University Press: Cambridge, UK, 2011; pp. 772–789. [Google Scholar]
- Letts, M.G.; Mulligan, M.; Rincón-Romero, M.E.; Bruijnzeel, L.A. Environmental controls of photosynthetic rates of lower montane cloud forest vegetation in south-western Colombia. In Tropical Montane Cloud Forests: Science for Conservation and Management; Bruijnzeel, L.A., Scatena, F.N., Hamilton, L.S., Eds.; Cambridge University Press: Cambridge, UK, 2011; pp. 465–478. [Google Scholar]
- Bruijnzeel, L.A. Hydrological functions of tropical forests: Not seeing the soil for the trees? Agric. Ecosyst. Environ. 2004, 104, 185–228. [Google Scholar] [CrossRef]
- Sidle, R.C.; Ziegler, A.D.; Negishi, J.N. Erosion process in steep terrain: Truths, myths, and uncertainties related to forest management in Southeast Asia. For. Ecol. Manag. 2006, 224, 199–225. [Google Scholar] [CrossRef]
- Bautista-Cruz, A.; del Castillo, R.F.; Etchevers-Barra, J.D.; Gutiérrez-Castorena, M.C.; Baez, A. Selection and interpretation of soil quality indicators for forest recovery after clearing of a tropical montane cloud forest in Mexico. For. Ecol. Manag. 2012, 277, 74–80. [Google Scholar] [CrossRef]
- Senbeta, F. Biodiversity and ecology of Afromontane rainforests with wild Coffea arabica L. populations in Ethiopia. In Ecology and Development Series 38; Vlek, P.L.G., Denich, M., Martius, C., Rodgers, C., Eds.; Cuvillier Verlag: Göttingen, Germany, 2006; pp. 1–120. [Google Scholar]
Disclaimer/Publisher’s Note: The statements, opinions and data contained in all publications are solely those of the individual author(s) and contributor(s) and not of MDPI and/or the editor(s). MDPI and/or the editor(s) disclaim responsibility for any injury to people or property resulting from any ideas, methods, instructions or products referred to in the content. |
© 2025 by the authors. Licensee MDPI, Basel, Switzerland. This article is an open access article distributed under the terms and conditions of the Creative Commons Attribution (CC BY) license (https://creativecommons.org/licenses/by/4.0/).