Article

Driving by a Publicly Available RGB Image Dataset for Rice Planthopper Detection and Counting by Fusing Swin Transformer and YOLOv8-p2 Architectures in Field Landscapes

1
College of Biosystems Engineering and Food Science, Zhejiang University, Hangzhou 310058, China
2
College of Agriculture and Biotechnology, Zhejiang University, Hangzhou 310058, China
3
The Rural Development Academy, Zhejiang University, Hangzhou 310058, China
4
Collect of Advanced Agricultural Sciences, Zhejiang A&F University, Hangzhou 311300, China
5
Department of Nutrition & Food Science, National Research Centre, Dokki, Giza 12622, Egypt
*
Authors to whom correspondence should be addressed.
Agriculture 2025, 15(13), 1366; https://doi.org/10.3390/agriculture15131366
Submission received: 14 May 2025 / Revised: 21 June 2025 / Accepted: 23 June 2025 / Published: 25 June 2025
(This article belongs to the Section Digital Agriculture)

Abstract

Rice (Oryza sativa L.) has long been threatened by the brown planthopper (BPH, Nilaparvata lugens) and white-backed planthopper (WBPH, Sogatella furcifera). It is difficult to detect and count rice planthoppers from RGB images, and there are a limited number of publicly available datasets for agricultural pests. This study publishes a publicly available planthopper dataset, explores the potential of YOLOv8-p2 and proposes an efficient improvement strategy, designated SwinT YOLOv8-p2, for detecting and counting BPH and WBPH from RGB images. The Swin Transformer was incorporated into the YOLOv8-p2 in the strategy. Additionally, the Spatial and Channel Reconstruction Convolution (SCConv) was applied, replacing Convolution (Conv) in the C2f module of YOLOv8. The dataset contains diverse pest small targets, and it is easily available to the public. YOLOv8-p2 can accurately detect different pests, with mAP50, mAP50:95, F1-score, Recall, Precision and FPS up to 0.847, 0.835, 0.899, 0.985, 0.826 and 16.69, respectively. The performance of rice planthopper detection was significantly improved by SwinT YOLOv8-p2, with increases in mAP50 and mAP50:95 ranging from 1.9% to 61.8%. Furthermore, the correlation relationship between the manually counted and detected insects was strong for SwinT YOLOv8-p2, with an R2 above 0.85, and RMSE and MAE below 0.64 and 0.11. Our results suggest that SwinT YOLOv8-p2 can efficiently detect and count rice planthoppers.

1. Introduction

Rice (Oryza sativa L.) is the first largest cereal crop in the world, feeding more than half of the world’s population [1]. Given the importance of rice in the global food system, it is crucial to ensure the security of the grain supply to avoid shocks from various events, such as extreme weather conditions and widespread pest infestations [2]. Rice production has long been seriously threatened by various pests, of which the brown planthopper (BPH, Nilaparvata lugens) and white backed planthopper (WBPH, Sogatella furcifera) are two of the most destructive [3]. The long-winged BPH and WBPH can migrate across countries with seasonal winds. In addition, these planthoppers infest rice plants by sucking sap, laying eggs at the base of rice plant stems and transmitting viruses, significantly affecting rice quality and yield [4]. Therefore, timely and effective monitoring of the species, population density and development stages of these pests are critical for ensuring food security.
At present, we usually collect information on rice planthopper infestation by light-taps and field surveys [5]. The strategies involving the use of light-taps are suitable for monitoring long-winged adults with the ability to fly. However, they can always lead to underestimation of the planthopper population because they ignore short-winged adults and nymphae, which occupy a dominant position in the field [6]. Compared to others, the traditional “pat-check method” survey of planthopper adults and nymphae involves manual collection and counting at a small scale, which is labor-intensive, time-consuming and susceptible to errors [7]. The advent of digital imaging technology and machine or deep learning has enabled the automated detection and counting of pests. Nevertheless, the deployment of these technologies in pest detection remains in its nascent stages in outdoor field settings, and numerous challenges remain to be addressed.
In the natural landscape, the tiny nymphae of rice planthoppers are found to lurk over the base or leaves of rice plants [8]. The similar size and color of rice planthopper nymphae results in confusion regarding the detection of different species. Furthermore, several non-target impurities are present in the digital imaging of planthoppers, including rice stalks and leaves, which can impact the performance of detection models. Furthermore, the unequal distribution of multiple planthopper classes in images presents an additional challenge for planthopper detection and counting [9]. To address these challenges, researchers have proposed various machine learning and deep learning methods. Among them, deep learning methods, particularly convolutional and Transformer-based techniques, have demonstrated potential for pest detection [10]. Convolution-based deep learning methods, such as Faster RCNN (Faster Region-based Convolutional Neural Networks, Fast RCNN), Cascade-RCNN-PH and RPH-Counter, have proven effective for detecting rice planthoppers [7,11,12,13,14]. Convolution-based methods extract the deep features of rice planthoppers using convolutional layers, effectively capturing local patterns and contextual relationships with complex backgrounds. Their computational efficiency, due to weight sharing and local connectivity, makes them well-suited for real-time applications [15]. However, their limited receptive fields hinder the detection of small targets like rice planthoppers, as they struggle to capture long-range dependencies and fine-grained features. Moreover, their performance often relies heavily on precise hyperparameter tuning. To address these limitations, researchers have integrated attention mechanisms into CNN frameworks. Attention modules help the network focus on the most relevant regions, improving feature quality and enhancing object localization accuracy. This is beneficial for detecting small pests in cluttered environments, in which distinguishing subtle features is critical. By guiding the model’s focus to informative areas, attention-enhanced CNNs significantly improve detection performance for small objects [16]. However, detecting and counting rice planthoppers in complex field environments by using these methods remains challenging. With advances in computer vision (CV), You Only Look Once (YOLO) architectures have achieved success in object detection and related tasks. Among them, the CNN-based YOLOv8-p2 has shown strong performance and holds promise for addressing rice planthopper detection and counting in real-world agricultural settings.
Recently, Transformer architectures have attracted increasing attention in computer vision tasks (CV), particularly through the Vision Transformer (ViT), which leverages self-attention to capture global contextual information and long-range dependencies [17,18]. This mechanism is beneficial for detecting small objects in cluttered scenes. Furthermore, Transformers are also flexible and scalable, making them adaptable to various tasks and capable of leveraging large-scale multimodal data to improve detection accuracy [19]. Nevertheless, the implementation of Transformer models typically requires substantial computational resources and large datasets, which may limit their practicality in real-time or resource-constrained agricultural scenarios. Furthermore, they are also sensitive to hyperparameter tuning, and standard ViT structures often face challenges with localization and time consumption in dense object detection tasks [20]. To overcome these limitations, enhanced variants like Deformable DETR and Swin Transformer have been introduced [21]. Deformable DETR incorporates sparse attention, improving efficiency and precision [22,23,24]. Swin Transformer uses a hierarchical design with shifted windows to better capture both local and global features while reducing computation, aligning well with multi-scale visual inputs [25]. These advances improve the performance and applicability of Transformer-based models in object detection and other computer vision tasks. Nonetheless, this type of architecture has rarely been applied to the detection and counting of rice planthoppers in previous reports. It is potentially valuable to integrate the Swin Transformer module into YOLOv8-p2 architectures for further improving the performance and accuracy of tiny rice planthopper detection.
Deep learning methods have always been driven by big data, and high-quality planthopper image datasets support the automatic detection and counting of rice planthoppers. However, there are only a limited number of publicly available datasets for agricultural pests, and it is difficult to construct high-quality planthopper image datasets captured in situ, because rice is often cultivated in muddy paddies in vast plains and hilly areas, and planthopper image collection campaigns are time-consuming and take place in poor working environments. There is potential to construct a representative publicly available rice planthopper dataset for developing a high-performance deep learning method based on public intelligence for rice planthopper detection. This research aims to (1) create and publish a high-quality publicly available dataset of rice planthopper images; (2) address the challenges in detecting and counting tiny rice planthoppers in complex backgrounds by implementing YOLOv8-p2; (3) explore the potential of the strategy by integrating the Swin Transformer-based module and YOLOv8-p2 architecture for BPH and WBPH detection and counting from RGB images; and (4) evaluate the strategy using a dataset from field landscapes and compare its performance with the benchmark methods.

2. Materials and Methods

We created and published a publicly available rice planthopper dataset from field landscapes with complex backgrounds, along with exploring the potential of YOLOv8-p2. Next, a big-data-driven method was implemented for detecting and counting rice planthoppers based on the dataset by fusing a Swin Transformer-based module with YOLOv8-p2 architectures (Figure 1), improving its performance in detecting and counting rice planthoppers across different scenes. This research was achieved through the following three steps: (1) creating and publishing a high-quality publicly available image dataset of rice planthoppers and selecting the YOLOv8-p2 model as the baseline for small object detection; (2) integrating the Swin Transformer-based module into the backbone of the YOLOv8-p2 architectures to improve its ability to extract deep features; and (3) refining the C2f module in the YOLOv8-p2 architectures by replacing standard Convolution (Conv) with Spatial and Channel Reconstruction Convolution (SCConv). The details of each step are described in the following subsections, and the algorithms involved in this research were implemented on a professional computer, as shown in Table 1.

2.1. RGB Digital Imagery Collection from the Field Landscapes

Since it is a challenge to capture the adults and nymphae of rice planthoppers, a professional Sony A6000 camera (Sony Co., Ltd., Osaki, Japan), which was equipped with a Brigtin Star 60 mm f/2.8 2× macro lens (Brigtin Star Co., Ltd., Shenzhen, China), was used to collect RGB images (Figure 2a). The Sony A6000 is a typical compact camera with a 24.3-megapixel Exmor APS HD CMOS sensor, and it allows RGB images to be captured with the highest spatial resolution of up to 6000 × 4000 pixels. The ISO sensitivity range of this camera spans from 100 to 25,600, and its precise autofocus can be achieved in as little as 0.06 s. The Brightin Star 60 mm f2.8 2× Macro Lens is a specially designed macro lens that can be applied to various camera systems. Supported by a focal length of 60 mm and a maximum aperture of f/2.8, the lens offers us an impressive ability to achieve close distance focusing and 2× magnification. It is important to capture intricate details of small subjects using this lens, especially for insects and flowers. However, the operations of manual focus and aperture control are required when using this lens.
To support this study and collect representative samples, the rice planthoppers, including BPH (Nilaparvata lugens) and WBPH (Sogatella furcifera), were fed with special varieties of rice, named Taichung Native 1 (TN1), in a climatic chamber at Zhejiang University, Hangzhou, Zhejiang Province, China. The above procedure was carried out according to the previous literature [26]. We can easily observe the BPH and WBPH with different development stages in the chamber. From June 2023 to June 2024, the image collection campaigns for rice planthoppers were carried out. Before collecting the images, we adjusted the camera operation mode to macro, and the aperture to f/2.8. Because rice planthoppers lurk at the base of rice stems, where light is weak, a peripheral high-brightness camera fill light was permanently switched on. Furthermore, the rice leaf miner (RLM, Hydrellia griseola), which damages rice plants, was also selected to improve the performance of detection models in the future. The size of the image dataset is up to 5000 images, including images of rice planthoppers at different stages of development and with complex backgrounds (Figure 2b). The background contains rice leaves, stems, soil, water and so on, which efficiently exhibit the actual landscape of a paddy field. All signals of the RGB images were recorded in the form of an 8-bit digital number (DN). In addition, the rows and columns of RGB images are up to 6000 × 4000 pixels.

2.2. Planthopper Object Annotation and Counting Based on X-AnyLabeling

With the help of insect experts, rice planthoppers and others were annotated using X-AnyLabeling annotation tools [27]. Several deep learning models have been embedded in X-AnyLabeling. We finished the complex annotation task based on this tool by simply clicking. According to the objectives and actual situations, the involved species were divided into three classes, referring to the brown planthopper (Nilaparvata lugens), the whitebacked planthopper (Sogatella furcifera) and the rice leaf miner (Hydrellia griseola). The brown planthopper (BPH) includes the macropterous brown planthopper adult, brachypterous brown planthopper adult and brown planthopper nymph. Similarly, the whitebacked planthopper (WBPH) includes macropterous whitebacked planthopper adult, brachypterous whitebacked planthopper adult and whitebacked planthopper nymph. All RGB images were manually annotated one by one using the X-AnyLabeling tool based on the Segment Anything Model (SAM) published by Meta AI Research [28]. The annotation boxes with pest species collected from the JPG images were saved in YOLO format, and the numbers of the annotation boxes were also manually recorded simultaneously as the ground-truth dataset of rice planthopper counts for validating the performance of different methods in the future. There are 3000 images in the training dataset, 1000 images in the validation dataset and 1000 images in the testing dataset for the rice planthopper detection task. Additionally, the numbers of the annotation boxes corresponding to these images were also set to the training dataset and the testing dataset for the rice planthopper counting task.

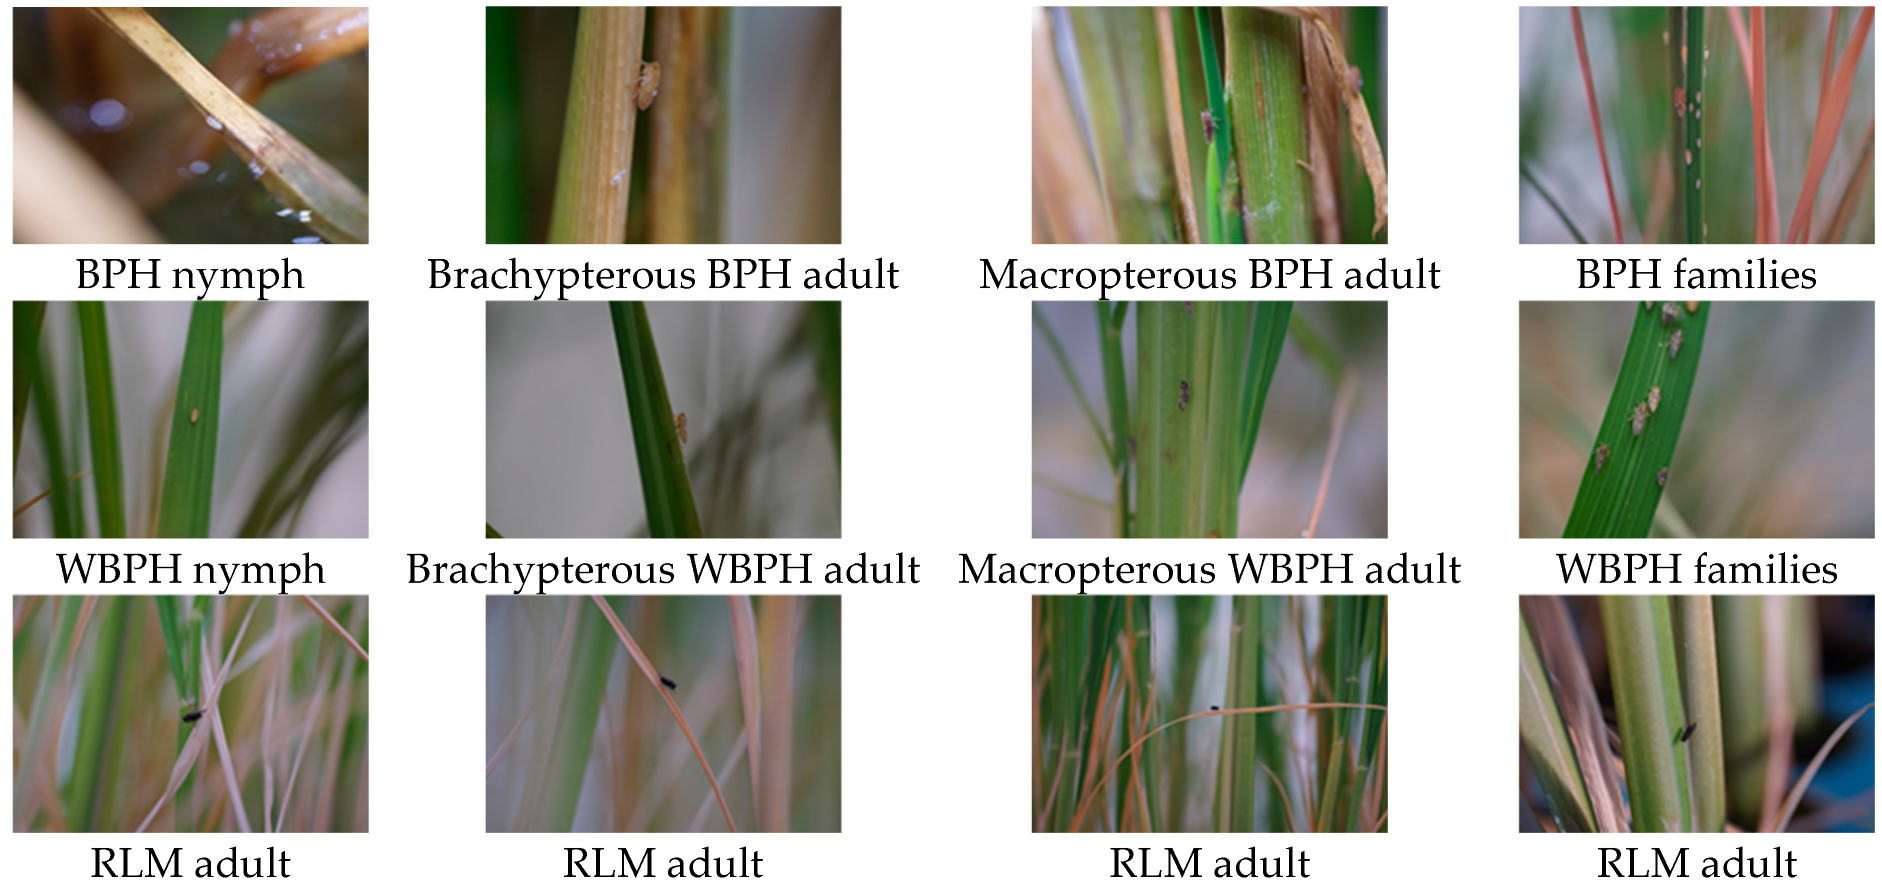
2.3. Constructing the High-Quality Publicly Available Rice Planthopper Image Dataset

Motivated by the necessity and importance of constructing a high-quality planthopper image dataset, we have presented and published a large-scale publicly available rice planthopper image dataset. It is our understanding that our dataset is elaborate in the details of insect organs over field landscapes among all published rice planthopper datasets. We have made it publicly available for free, non-commercial use at https://doi.org/10.34740/kaggle/dsv/12187050 (accessed on 22 June 2025). This Kaggle dataset can be directly downloaded and used in Python 3.9.13, making it easy for other researchers to further improve or reconstruct the rice planthopper detection model. Furthermore, the dataset is constantly being updated. Compared to the rice planthopper images taken from a yellow sticky trap or a half-white flat plate, our dataset has a complex background, being in an actual agricultural landscape. The background displays a coloration like that of the rice planthopper, and the different pests (BPH, WBPH and RLM) exhibit comparable coloration and size, as shown in Figure 3. It should be noted that the shooting factors, such as shooting angle, light intensity and focal length, are not fixed when capturing rice planthopper images, which will increase the diversity of images for making detection model more robust in complex scenes. Among the 5000 annotated planthopper images, the most common pest is BPH, with a total of 5335 instances in 3000 BPH images, while the least frequently present is RLM, with 410 instances in 200 RLM images, as shown in Table 2. The mean numbers of instances of different pest images (BPH, WBPH and RLM) are up to 1.8, 1.5 and 2.1, respectively. The pixel proportion of the individual pest in the entire image is in the range of 0.5% to 5%, which is suitable for exploiting the performance of small target detection methods.

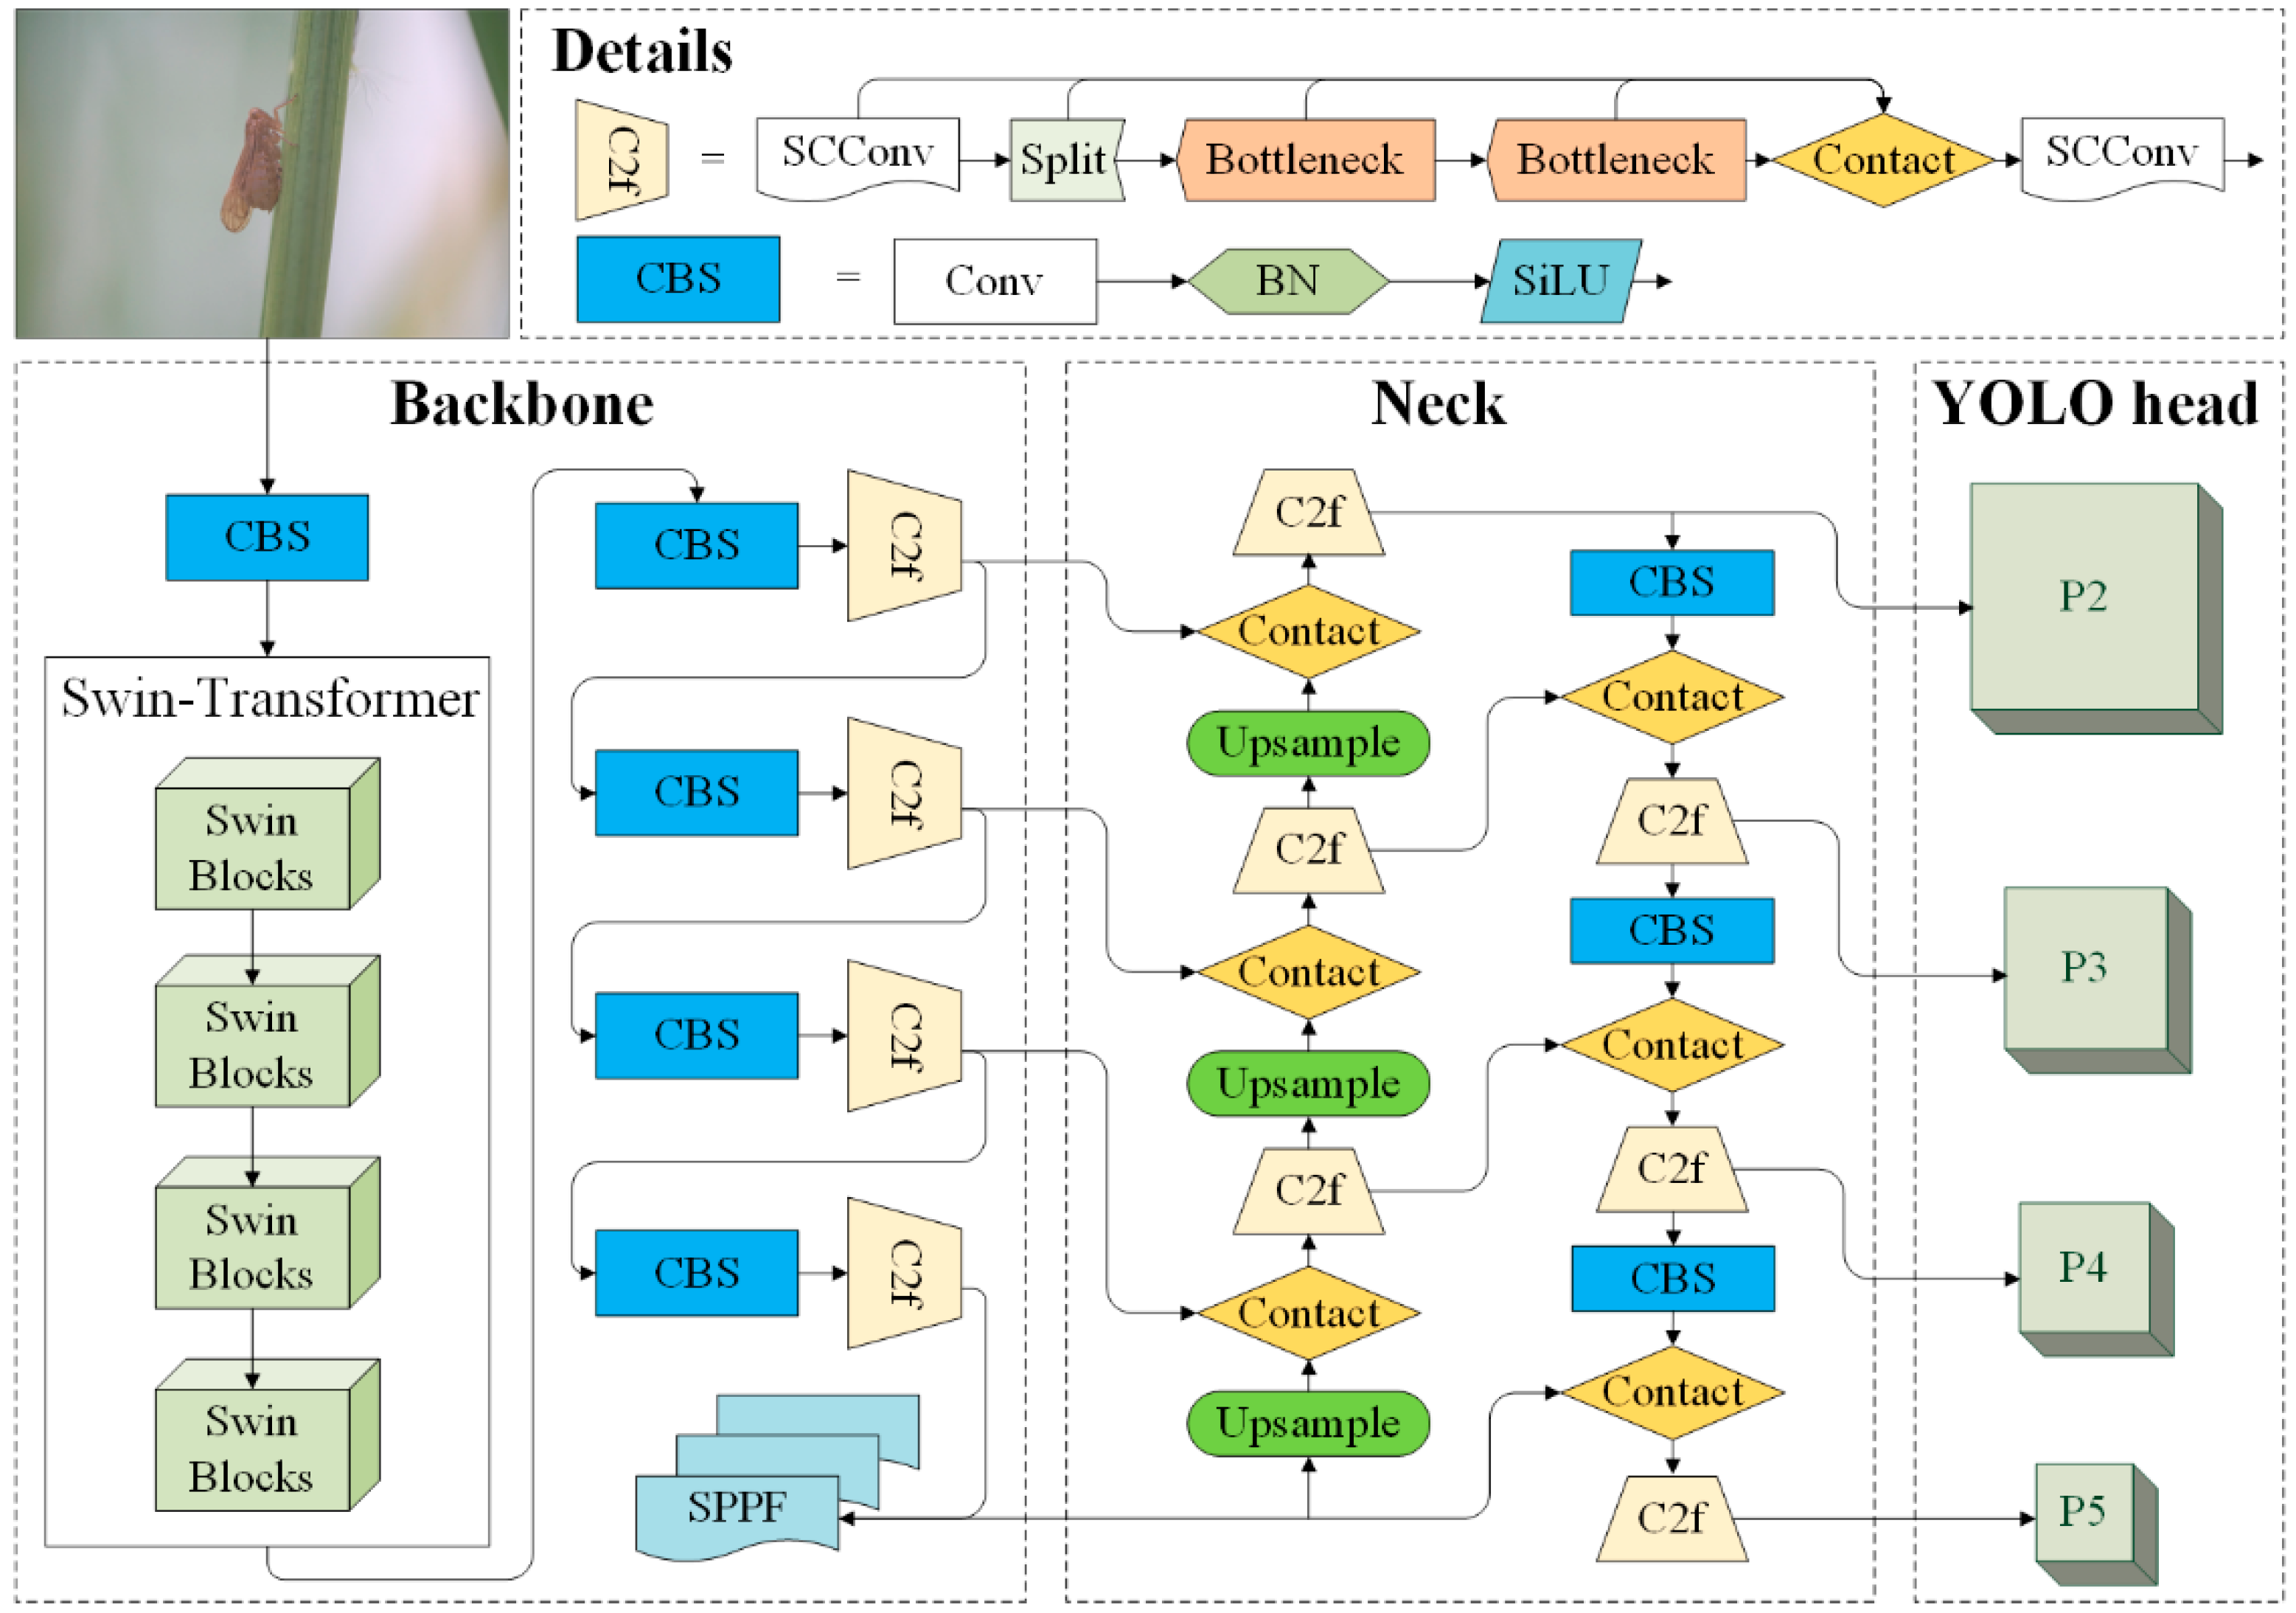
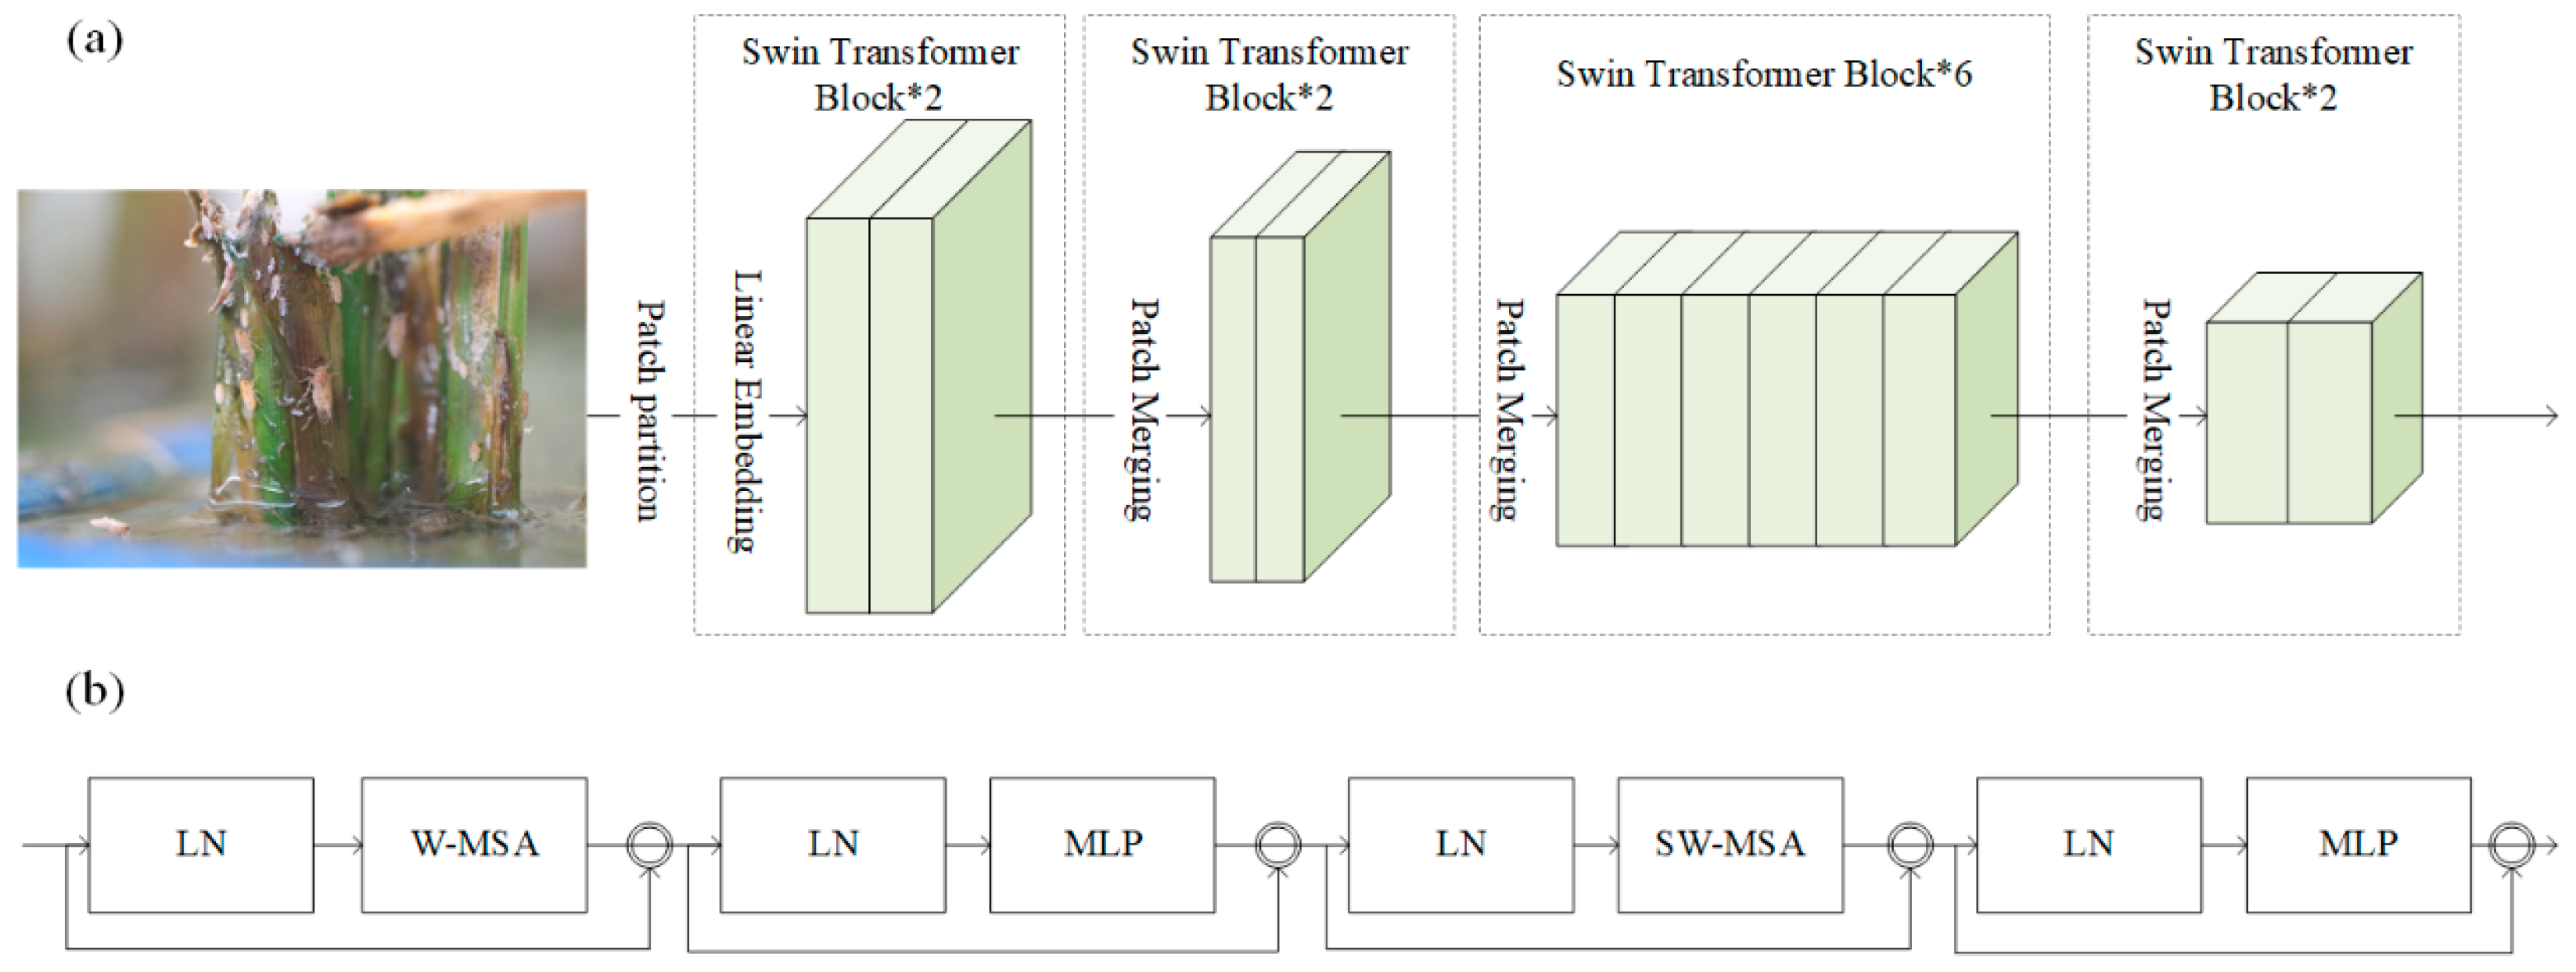
2.4. Fusing Swin Transformer-Based Module with YOLOv8 Backbone for Extrating Features

To capture the elaborate details of rice planthoppers, the images were taken with the macro lens system. The region, which is out of focus in these images, is severely blurred, so it is not scientific to directly divide the whole scene into the image size required by YOLO architecture. It is difficult to extract features from tiny objects, so we need to input high-resolution images into the YOLO architecture as much as possible. YOLOv8 is an excellent deep learning architecture, and it can be applied to various tasks, including object detection, semantic segmentation and image classification. The YOLOv8-p2 model is a special upgrade version for detecting small objects from high-resolution images [29]. It was suitable to develop a planthopper detection model based on YOLOv8-p2 model, so we chose YOLOv8-p2 model as the baseline in this research. It is noted that YOLOv10, YOLOv11 and YOLOv12 have been introduced. However, they were designed solely for object detection tasks, which are limited when widely used [30]. Moreover, compared with YOLOv8, their architectures have only minor changes and omit the detection head corresponding to P2 feature layer. For our rice planthopper detection and counting tasks, the YOLOv8-p2 model suitably meets our requirements.
As a specialized version of the YOLOv8 model, a new detection head was developed in the YOLOv8-p2 model to improve the performance of small object detection. The P2 feature layer with a size of 1/4 of the input size was fed into this new detection head during the object detection process, making the model sensitive to the extra-small object. The feature layers of the YOLOv8-p2 model were mainly extracted by the CSPDarkNet53 backbone feature extraction network based on CNN with 53 convolutional layers, and could not effectively acquire global information. In addition, due to the relatively weak feature extraction network of the YOLOv8-p2 model, the details corresponding to rice planthopper detection could not be effectively captured. Therefore, we should improve the ability of the YOLOv8-p2 model in extracting deep features, when detecting and counting rice planthoppers.
In this research, the YOLOv8-p2 was directly implemented. Next, the Convolution module in backbone of YOLOv8-p2 model corresponding to P2 feature layer was replaced by Swin Transformer-based module to improve the performance of deep feature extraction (Figure 1), and the strategy was named SwinT YOLOv8-p2. Swin Transformer with multi-head self-attention mechanism is capable when it was used as a universal backbone feature extraction network for computer version [31]. Compared with traditional ViT, it builds hierarchical feature maps by merging image patches in deeper layers, and has a computational complexity linear to the input image size due to the computation of self-attention only within each local window, making it efficient in detecting rice planthoppers, as shown in Figure 4. When integrating the Swin Transformer-based module with the YOLOv8x-p2 model, we can observe slightly more parameters and FLOPs. It is necessary to ensure the counting yield by reducing the parameters and FLOPs of SwinT YOLOv8-p2 in the next step.

2.5. Optimizing Computation Efficiency of the SwinT YOLOv8-p2 Architecture

In the initial stage of rice planthopper detection using the original SwinT YOLOv8-p2 model, a specific number of deep features was extracted through the C2f module employing traditional Convolution (Conv). Although Conv has demonstrated impressive performance in a range of CV tasks, the extraction of redundant features by convolutional layers necessitates the expenditure of considerable computational resources. Previously, numerous strategies were proposed by researchers to address this issue [32]. Recently, a novel convolution, designated SCConv (Spatial and Channel Reconstruction Convolution), has been developed, and has rapidly garnered considerable interest. The SCConv is composed of distinct elements: the spatial reconstruction unit (SRU) and the channel reconstruction unit (CRU). The SRU employs a divide–reconstruction approach to mitigate spatial redundancy, whereas the CRU utilizes a divide–transform–fusion strategy to minimize channel redundancy. Moreover, SCConv is a plug-and-play architectural unit that can be directly employed to supplant standard convolution in a multitude of convolutional neural networks [33]. It has been demonstrated that models incorporating SCConv can attain superior performance while markedly reducing complexity and computational cost by eliminating superfluous features. To diminish the parameters and FLOPs of the SwinT YOLOv8-p2 model, we substituted the Conv in the C2f module with SCConv, as illustrated in Figure 1. The contents have been made available via a link to the GitHub repository (https://github.com/SSVSVSQQ/Planthopper accessed on 23 June 2025).

2.6. The Evaluation Metrics and Benchmark Methods Involved in Detection and Counting Tasks

To comprehensively evaluate the performance of the various methods used for detection and counting tasks in a comprehensive manner and facilitate a comparison between them, several typical evaluation metrics, including Precision, Recall, F1-score and mAP, were selected. The calculation of these indicators was conducted as follows:
P r e c i s i o n = T P T P + F P
R e c a l l = T P T P + F N
F 1 s c o r e = 2.0 × P r e c i s i o n × R e c a l l P r e c i s i o n + R e c a l l
where TP (True Positive) and TN (True Negative) refer to the number of instances of the different pests correctly identified from RGB images. FP (False Positive) represents the number of instances of annotated pest species that were misclassified as other pest species, while FN (False Negative) denotes the number of instances in which the pests were misclassified as non-pests.
Additionally, the R-square(R2) and Root Mean Squared Error (RMSE) between detected and manually counted pest instances were also used to assess the counting accuracy of different methods.
It was essential to gain further insight into the SwinT YOLOv8-p2 by comparing it with existing methods to facilitate further improvements. To achieve this, several typical deep learning architectures were implemented, including Faster R-CNN, Swin Transformer-base, YOLOv5, YOLOv8, YOLOv8-p2, RT-DETR, YOLOv10 and YOLOv11 in the same dataset. This is a useful approach for summarizing the advantages and drawbacks of the SwinT YOLOv8-p2. The details of the selected methods are presented in Table 3.
During model training, the image was inputted with a size of 6000 × 4000 pixels. Data augmentation was applied using random horizontal flipping. Training was conducted with a batch size of 16, using the Adam optimizer with a learning rate of 1 × 10⁻⁵ and weight decay of 1 × 10⁻⁴. YOLO models were trained for 500 epochs, while other models were trained for 300 epochs. The R-CNN series models were implemented using the MMDetection framework, and YOLOv5 employed adaptive anchor mechanisms to further optimize detection performance.

3. Results

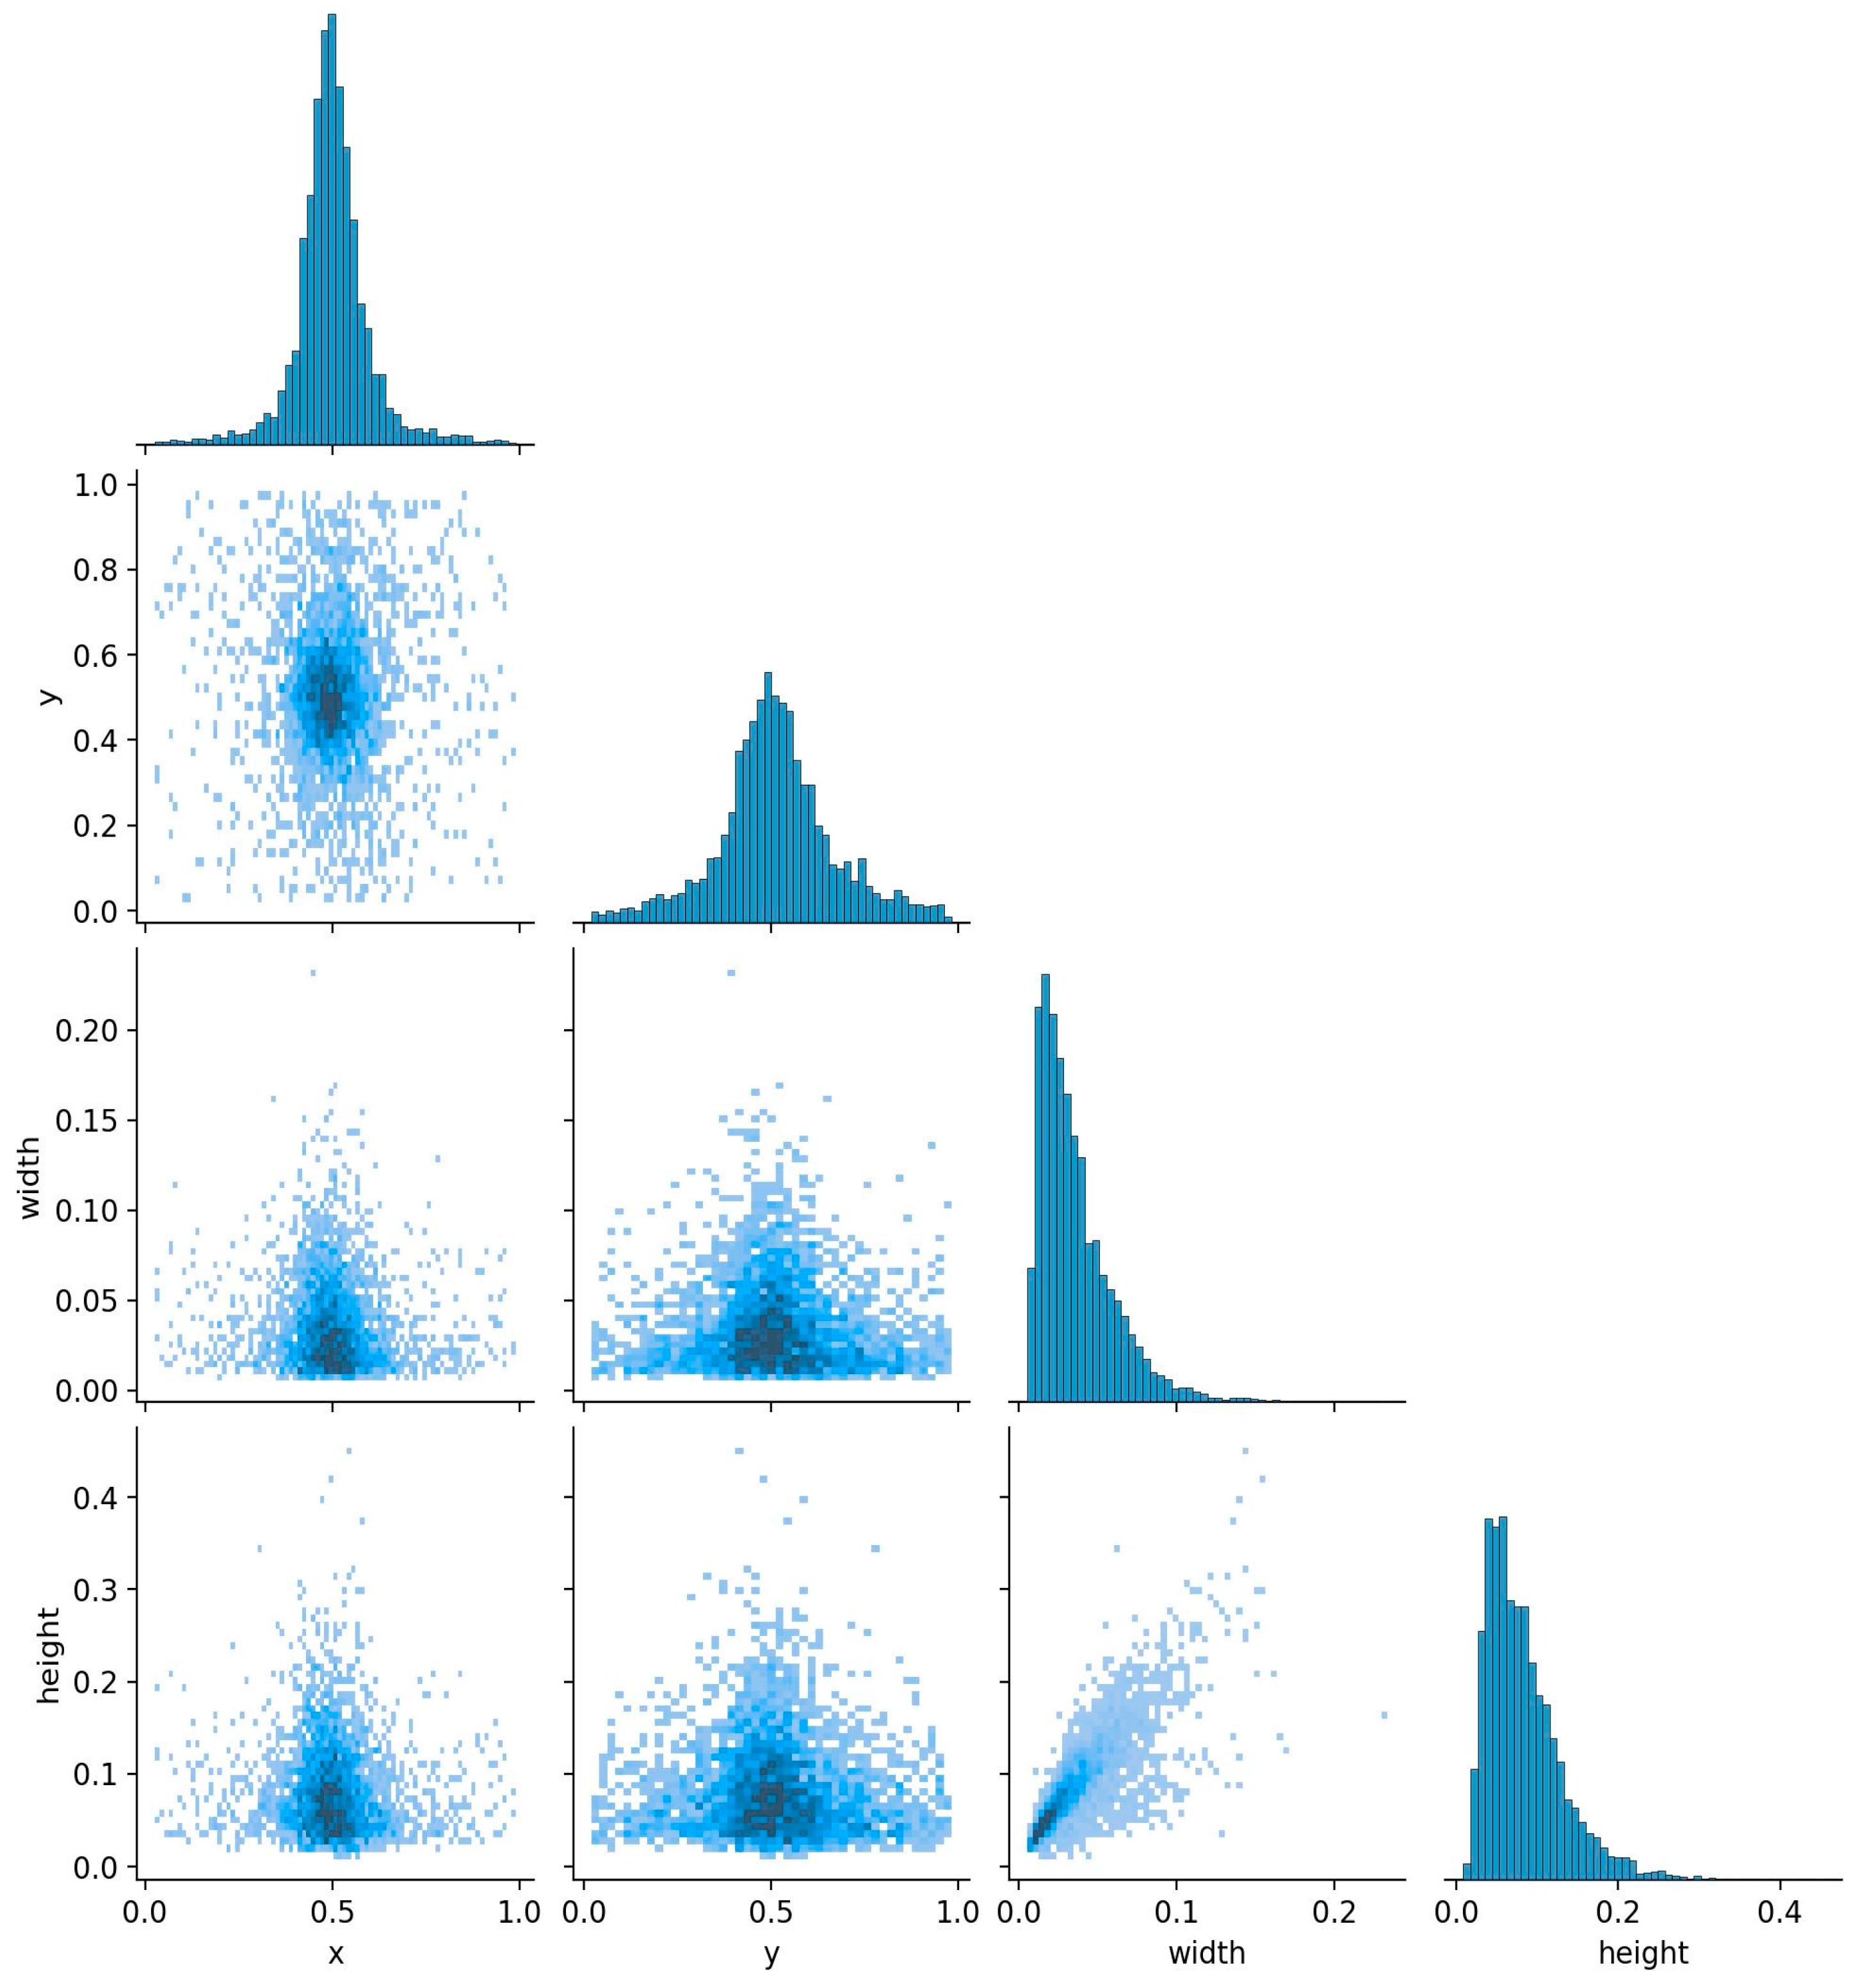
3.1. The Size and Spatial Distribution of the Target Box in the Rice Planthopper Dataset

Figure 5 shows the distribution of the pest target boxes in terms of positional parameters (x, y) and scale parameters (width, height) in the publicly available dataset, and it is described in the form of the joint distribution and marginal histogram. Each parameter is represented by a normalized value (0–1), which visually presents the spatial distribution characteristics and scale variation trend of the target in the image. It can be observed from the figure that the target center points show a distinct central aggregation trend in the image. In particular, the distributions of x and y roughly follow a symmetrical distribution centered at 0.5, indicating that most of the rice planthopper targets appear in the central region of the image. The spatial position distribution pattern of the above target box can effectively avoid the adverse effects on target recognition caused by the background blurring phenomenon resulting from the use of macro lenses. Furthermore, the width and height of the target boxes are generally small. The width and height ratios occupied by most of the target boxes in the entire image are only 0.1 and 0.2, respectively. The distribution density is most concentrated in the interval close to zero, fully reflecting that the data set is mainly characterized by small targets. Furthermore, there is also a certain positive correlation between width and height, indicating that the target has a relatively consistent aspect ratio in scale. This distribution characteristic of concentrated target locations and generally small sizes poses a challenge to the target detection model, requiring the model to have higher accuracy and robustness in the recognition of small targets and the extraction of spatial context information. When using this dataset, researchers must optimize the algorithm structure and improve the performance of the model through data augmentation and multi-scale feature fusion methods. In addition, this graph also shows a certain degree of dispersion in the rice planthopper dataset, reflecting the background interference factors and the randomness in the data collection process. This also provides a direction for the subsequent improvement of the model in terms of anti-interference ability and generalization performance.

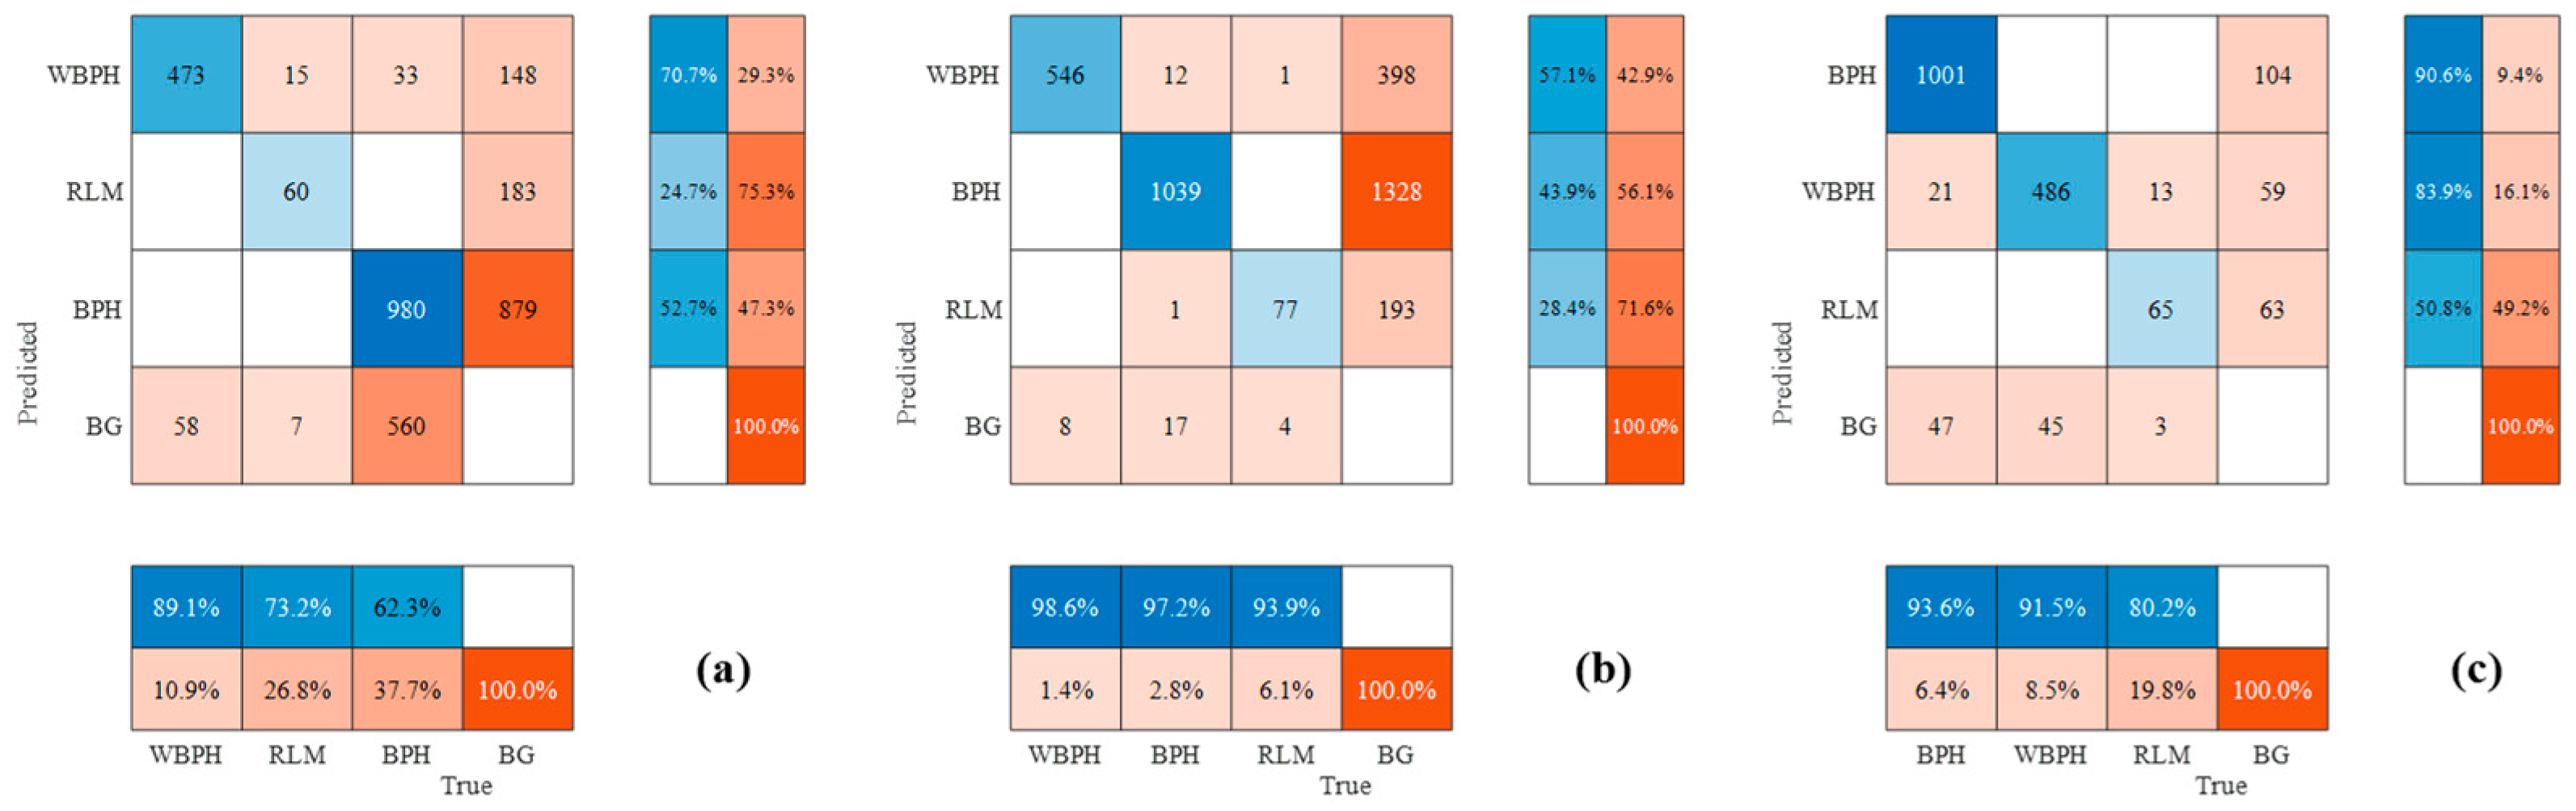
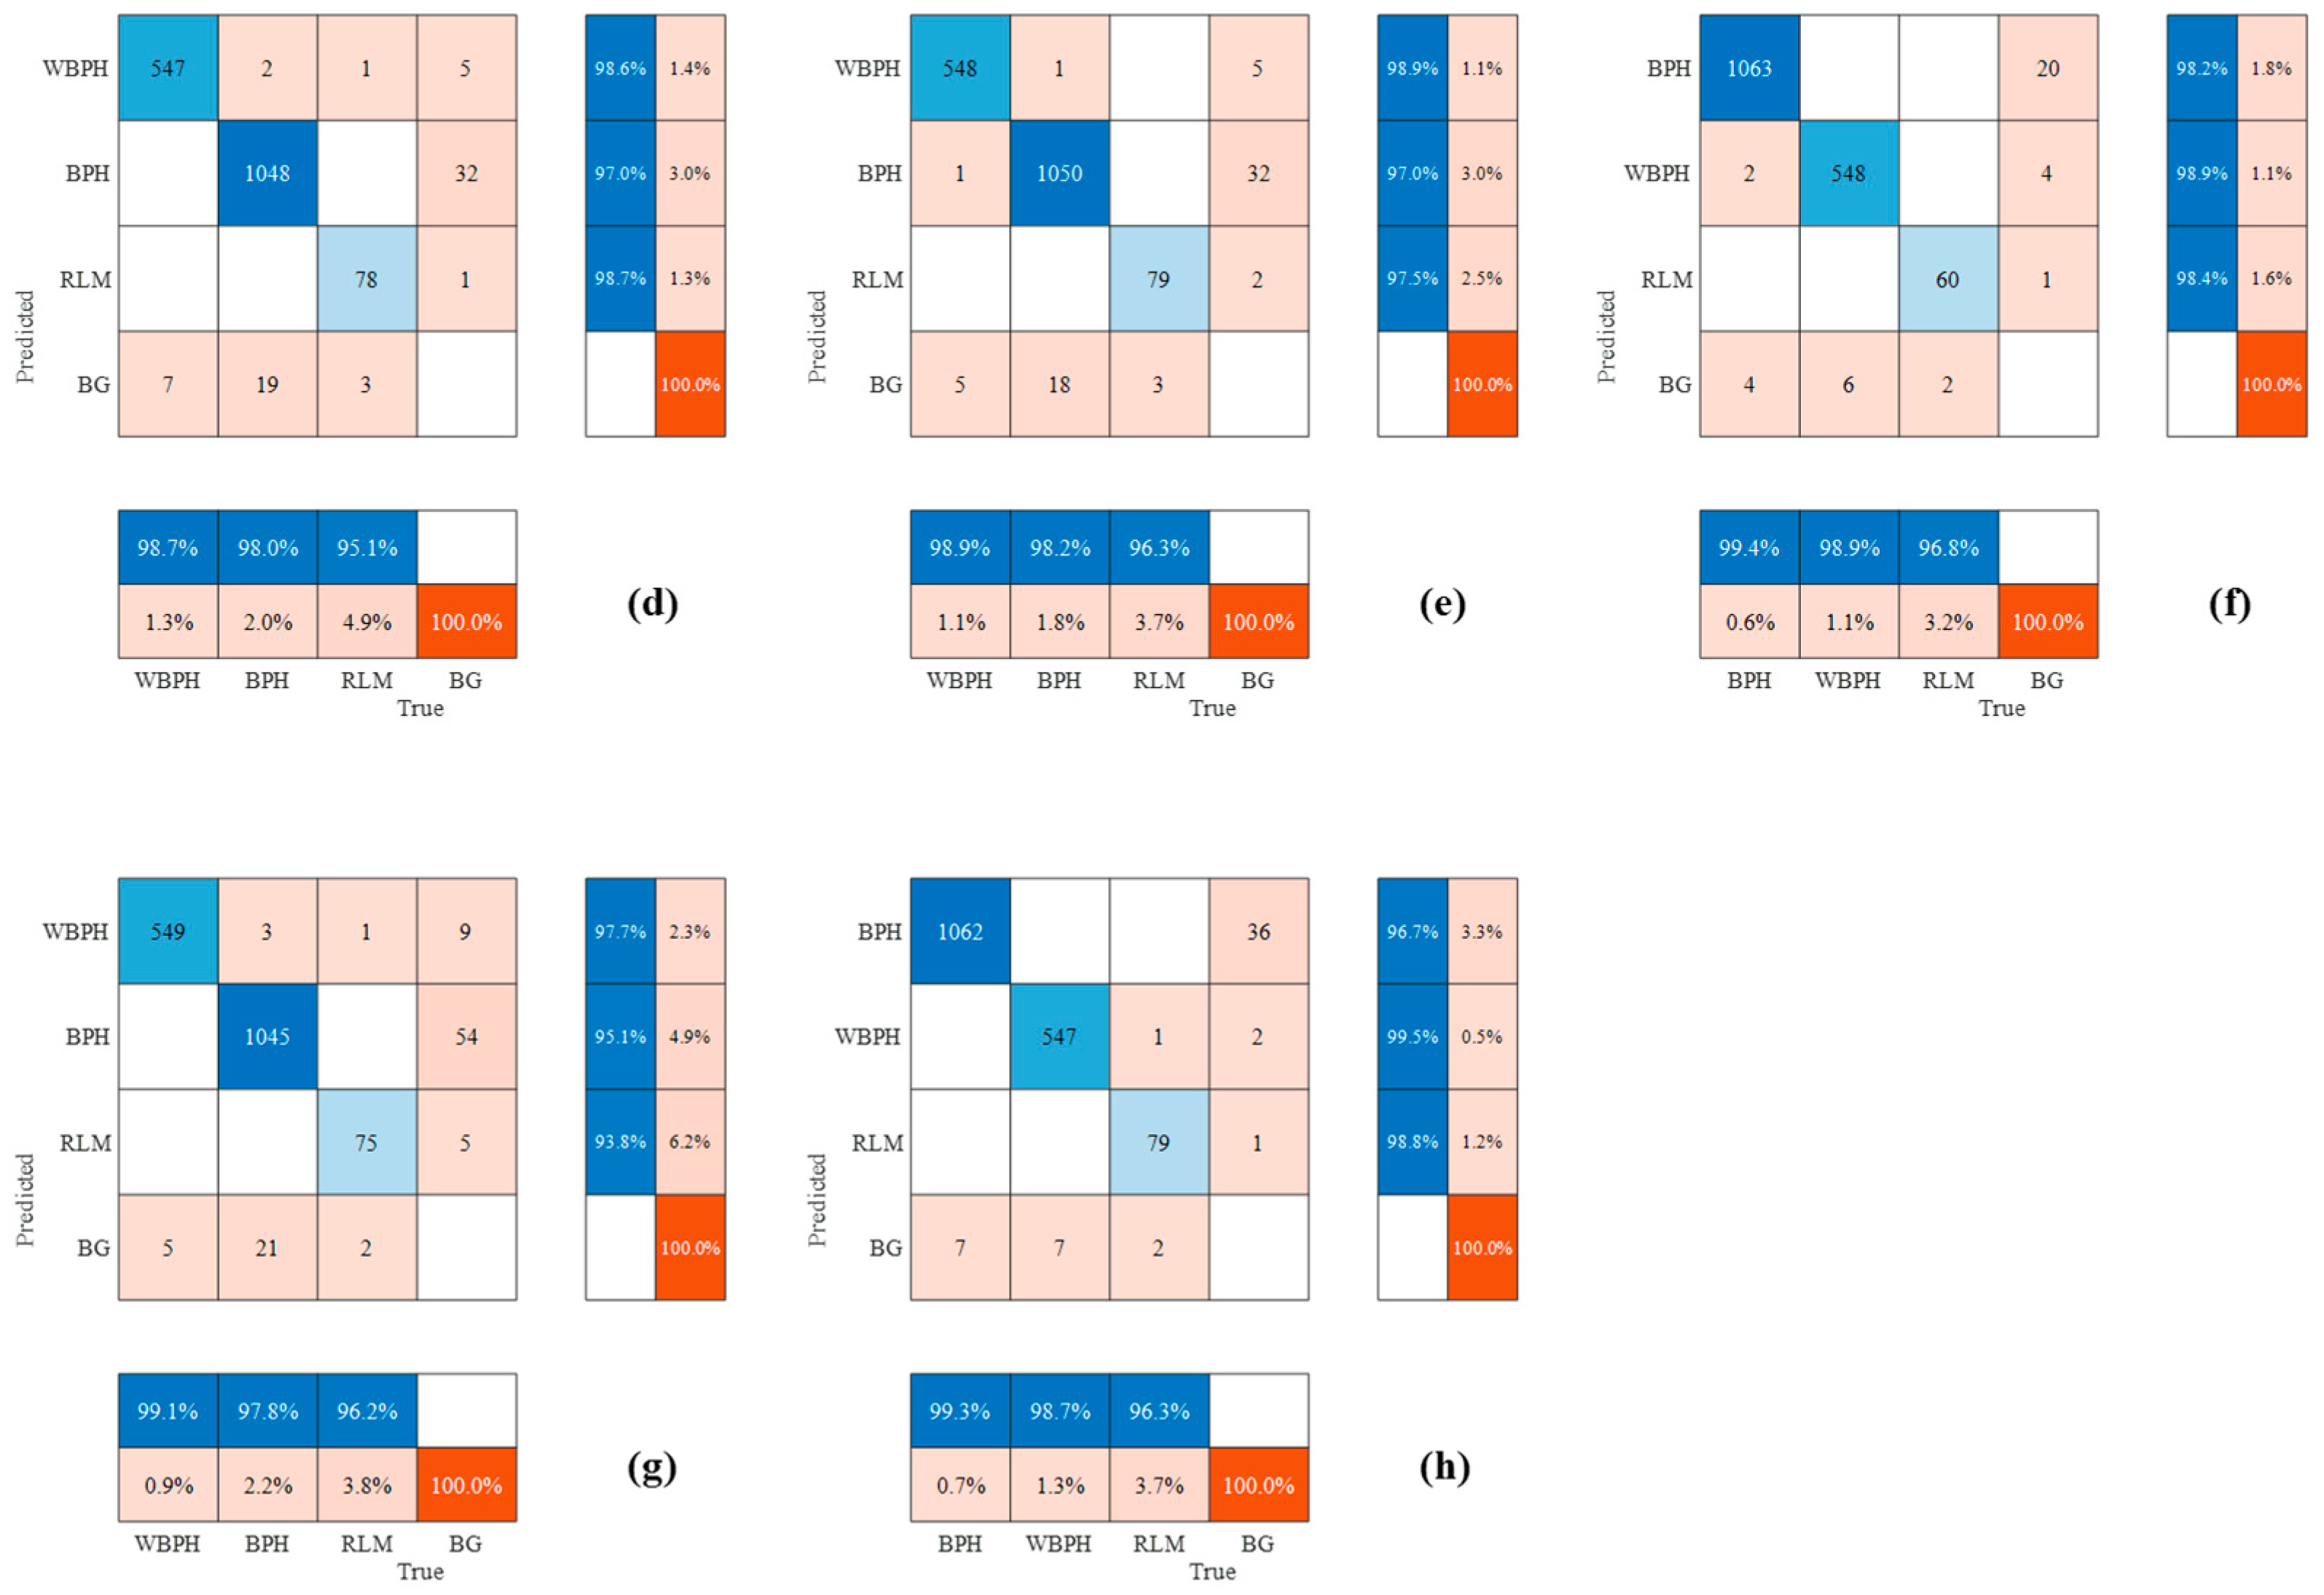
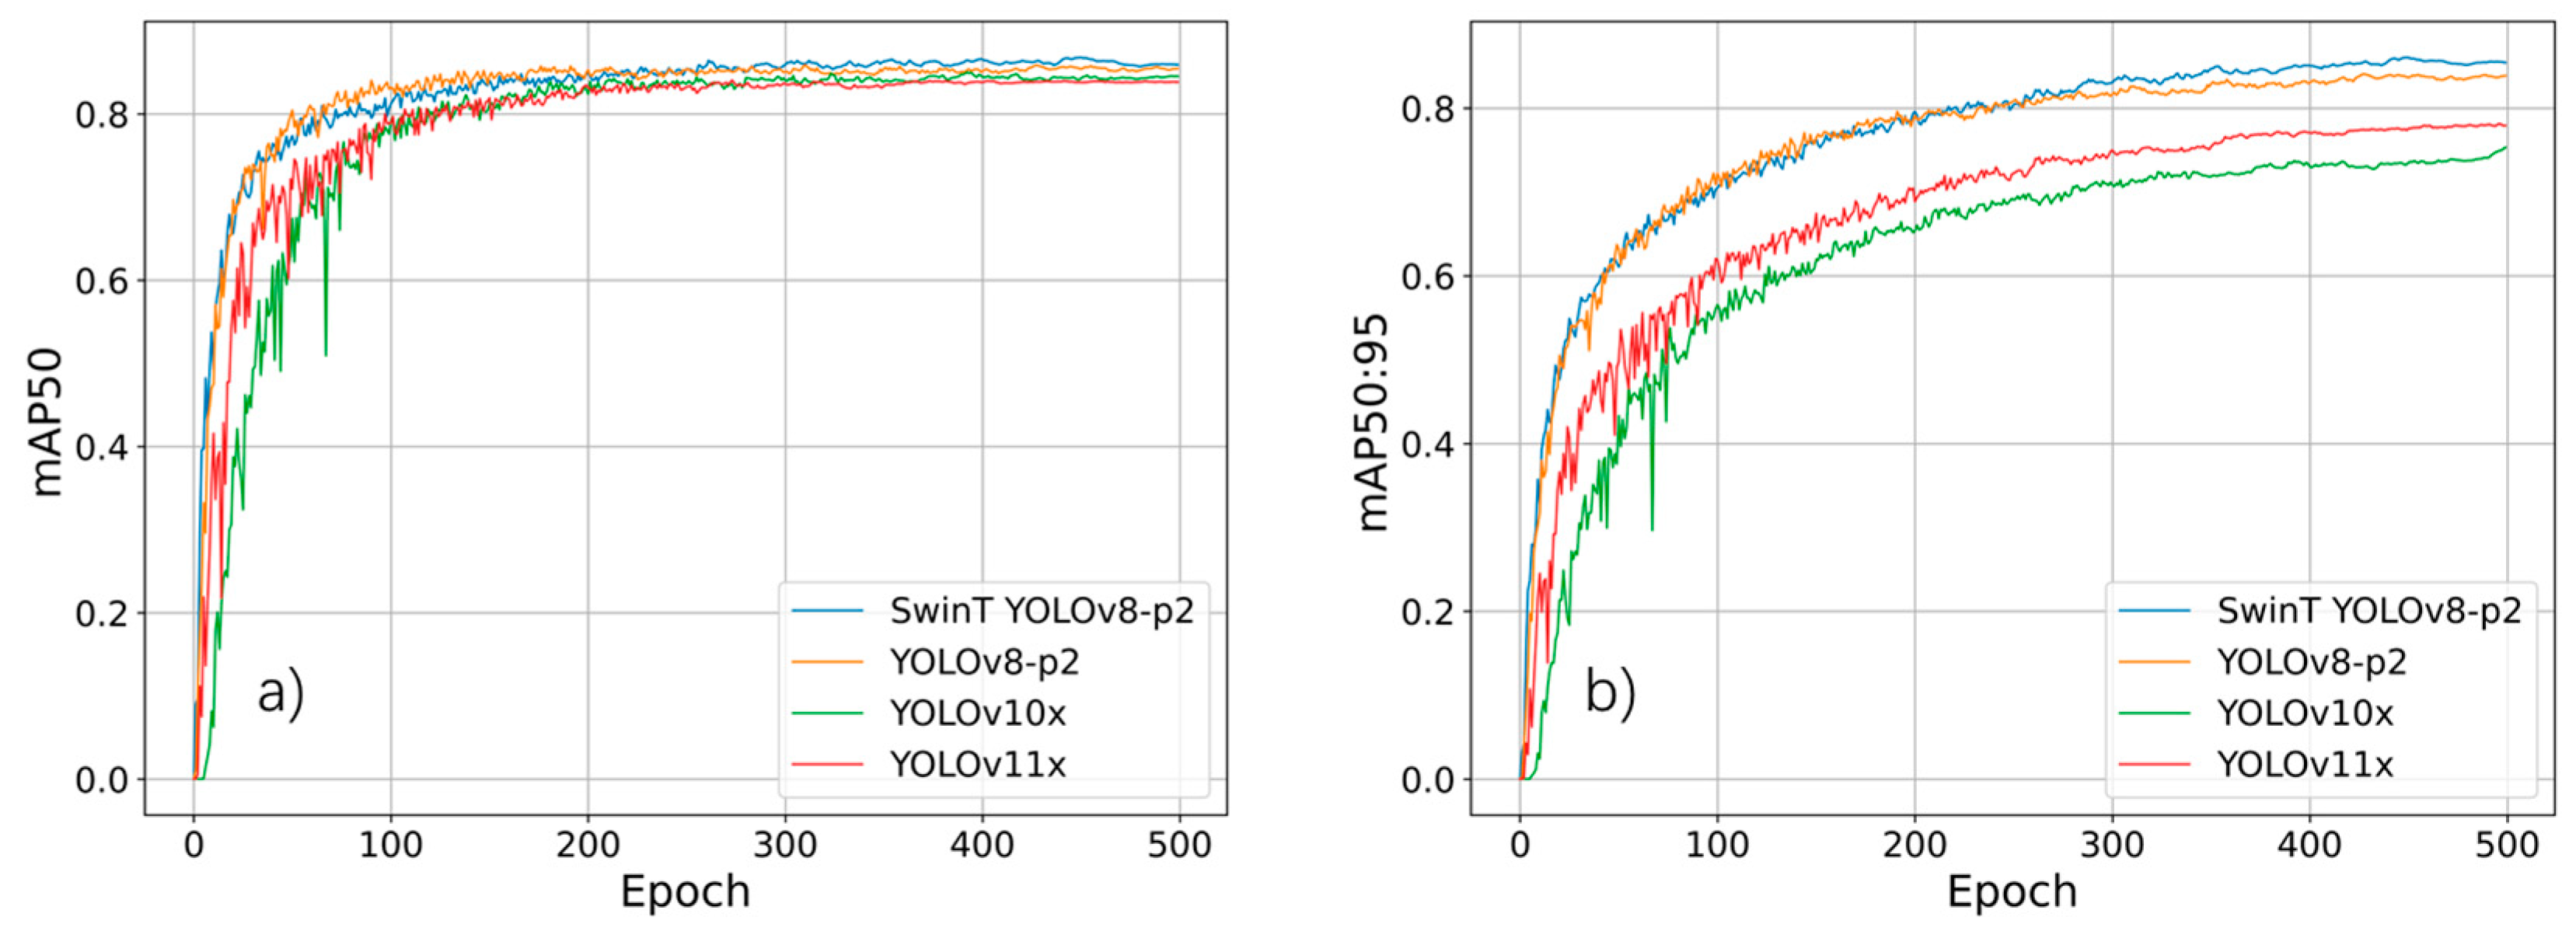
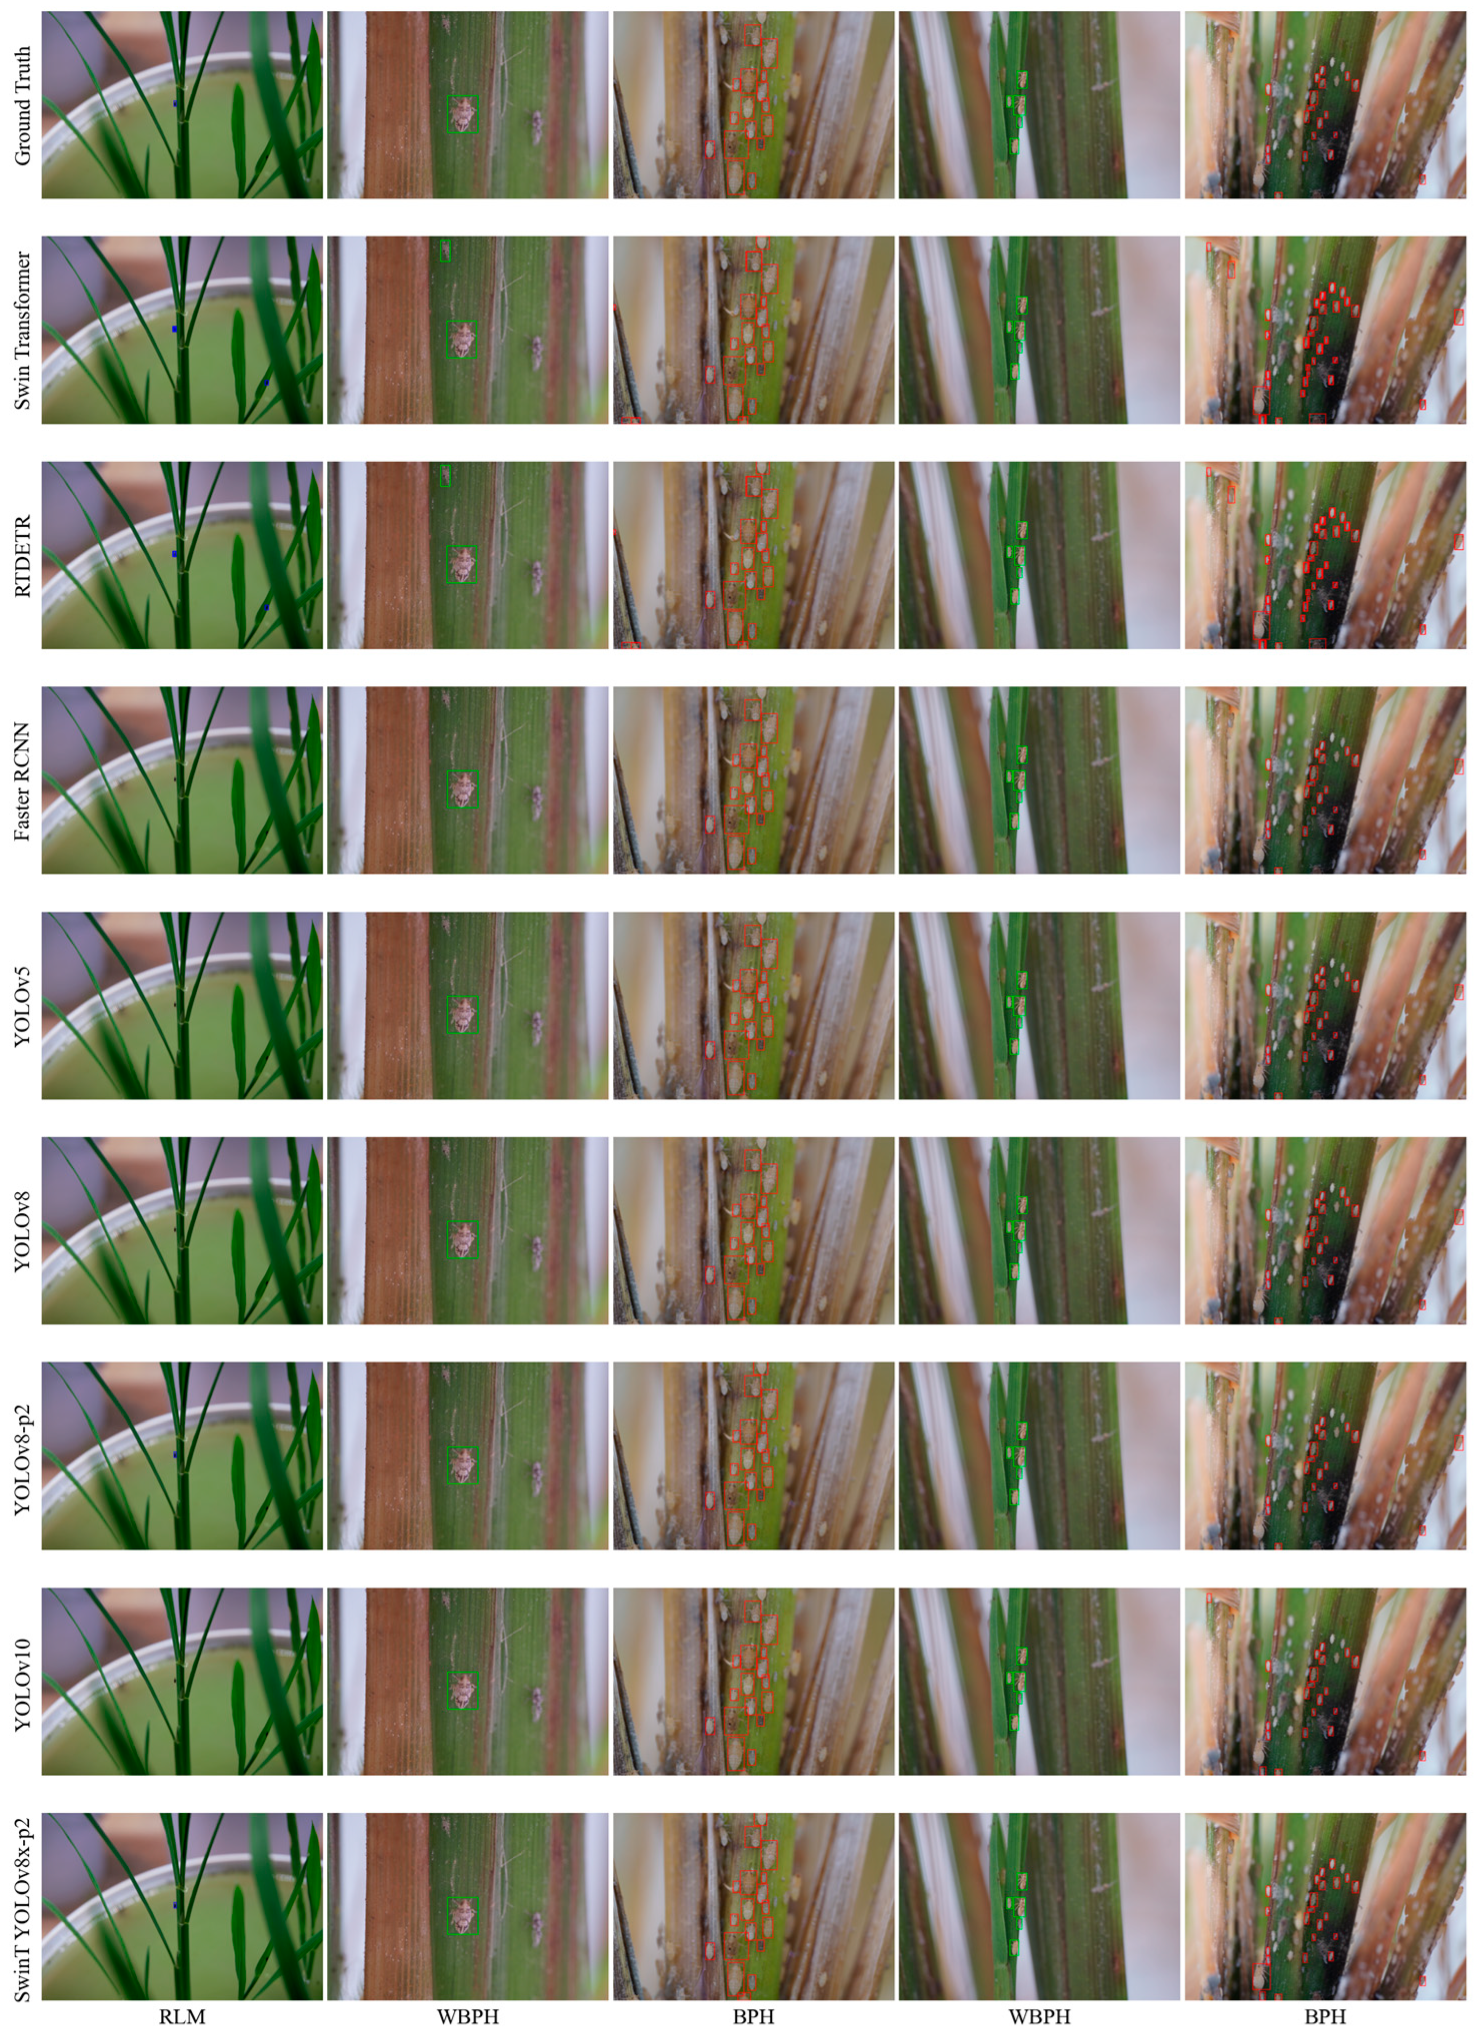
3.2. Performances of Different Deep Learning Methods for Detecting Planthoppers

Table 4 presents the performance in detecting different pests using SwinT YOLOv8x-p2 and seven other different deep learning methods involved in this research, along with the comparison of the involved methods in terms of computational complexity. The SwinT YOLOv8x-p2 model exhibits better performance in pest detection when compared to other deep learning methods, as evidenced by its higher mAP50, mAP50:95, F1-score, Recall, Precision and FPS up to 0.868, 0.851, 0.905, 0.989, 0.835 and 17.42, respectively. Moreover, the implementation of the SwinT YOLOv8x-p2 model resulted in a notable enhancement in the accuracy of insect species identification when the FPS remained consistent. This improvement is particularly noteworthy in terms of mAP50 and mAP50:95 for pest detection, with increases ranging from 1.9% to 61.8%. This suggests that the SwinT YOLOv8x-p2 model has capabilities in identifying rice planthoppers. While YOLOv10x and YOLOv11x were employed in this research, it is noteworthy that YOLOv8x-p2 also exhibits relatively good performance in detecting the planthoppers among the other involved methods with mAP50, mAP50:95, F1-score, Recall, Precision and FPS of up to 0.847, 0.835, 0.899, 0.985, 0.862 and 16.69, respectively. Except for FPS, all the indicators were promoted through the utilization of the YOLOv8x-p2 model. The indicators of the YOLOv8x-p2 model demonstrate improvements ranging from 33% to 86%. During our research, we observed no significant variations in the five indicators corresponding to the detection accuracy using YOLOv5x or YOLOv8x, when the FPS of the YOLOv5x model was markedly increased. In comparison to other models, the Swin Transformer and RT-DETRx models demonstrated a notable deficiency in detecting the rice planthoppers, exhibiting mAP50, mAP50:95 and F1-score below 0.76. Additionally, it is noteworthy that Precision exhibited a considerable decline in comparison to Recall for all the methods employed in this research. Furthermore, it is obvious that two-stage detectors such as Cascade-Mask R-CNN exhibit the highest FLOPs and parameter counts, indicating greater computational demands (738.6, 258.9M). In contrast, one-stage YOLO-based models offer a more efficient balance between complexity and model size. Among them, YOLOv10x shows the lowest FLOPs and parameter count, while YOLOv8x-p2 variants with SCConv or Swin Transformer modules moderately increase complexity to improve feature representation. Overall, YOLOv8x-p2 strikes a favorable trade-off between computational cost and model capacity for real-time pest detection tasks.
Figure 6 illustrates the detection details of the assorted insect species, including BPH, WBPH and RLM, as determined by SwinT YOLOv8x-p2 and seven additional different deep learning algorithms. While most of the insects were correctly identified, the BPH and WBPH were frequently misclassified as background across all the methods in our research. Concurrently, a considerable number of non-target backgrounds were identified and erroneously attributed to BPH and WBPH. Identifying BPH and non-target backgrounds is more challenging than identifying WBPH. There is a higher rate of misidentification between BPH and non-target backgrounds. The discrepancy in the capacity of the various methods for detecting rice planthoppers was demonstrated by the reduction in the misclassification of BPH or WBPH from complex backgrounds, particularly for the accurate identification of BPH and background. The implementation of the SwinT YOLOv8x-p2 model resulted in a notable reduction in the misclassification of BPH or WBPH from complex backgrounds, thereby enhancing the performance of planthopper detection.
Figure 7 illustrates the training performances of four detection models (SwinT YOLOv8-p2, YOLOv8-p2, YOLOv10x and YOLOv11x) over 500 epochs in terms of mAP50 and mAP50:95. The SwinT YOLOv8-p2 model consistently outperformed the others, achieving the highest accuracy and fastest convergence. YOLOv8-p2 also demonstrated strong performance, closely following SwinT YOLOv8-p2. In contrast, YOLOv10x and YOLOv11x lagged behind, particularly in the early stages of training, and showed less stability. These results highlight the benefits of integrating Swin Transformer into the YOLOv8-p2 architecture for improved detection of tiny objects.

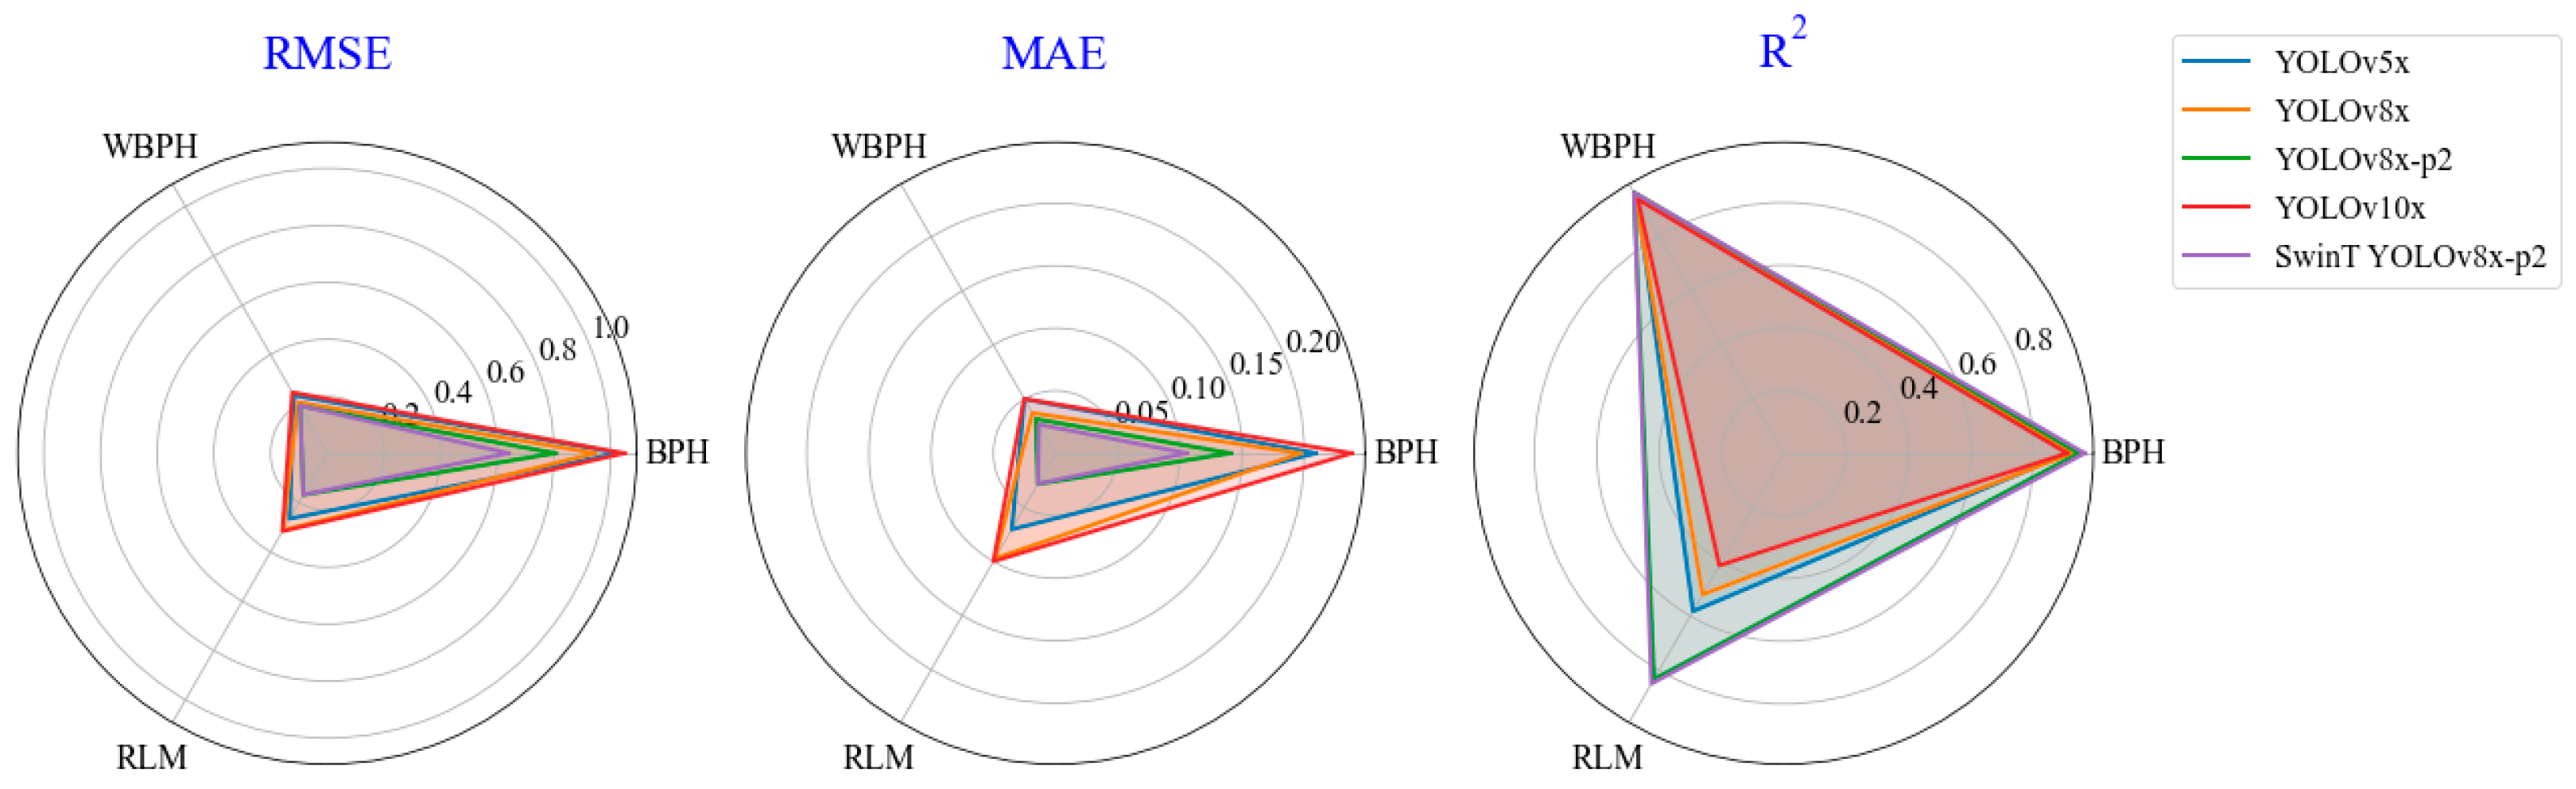
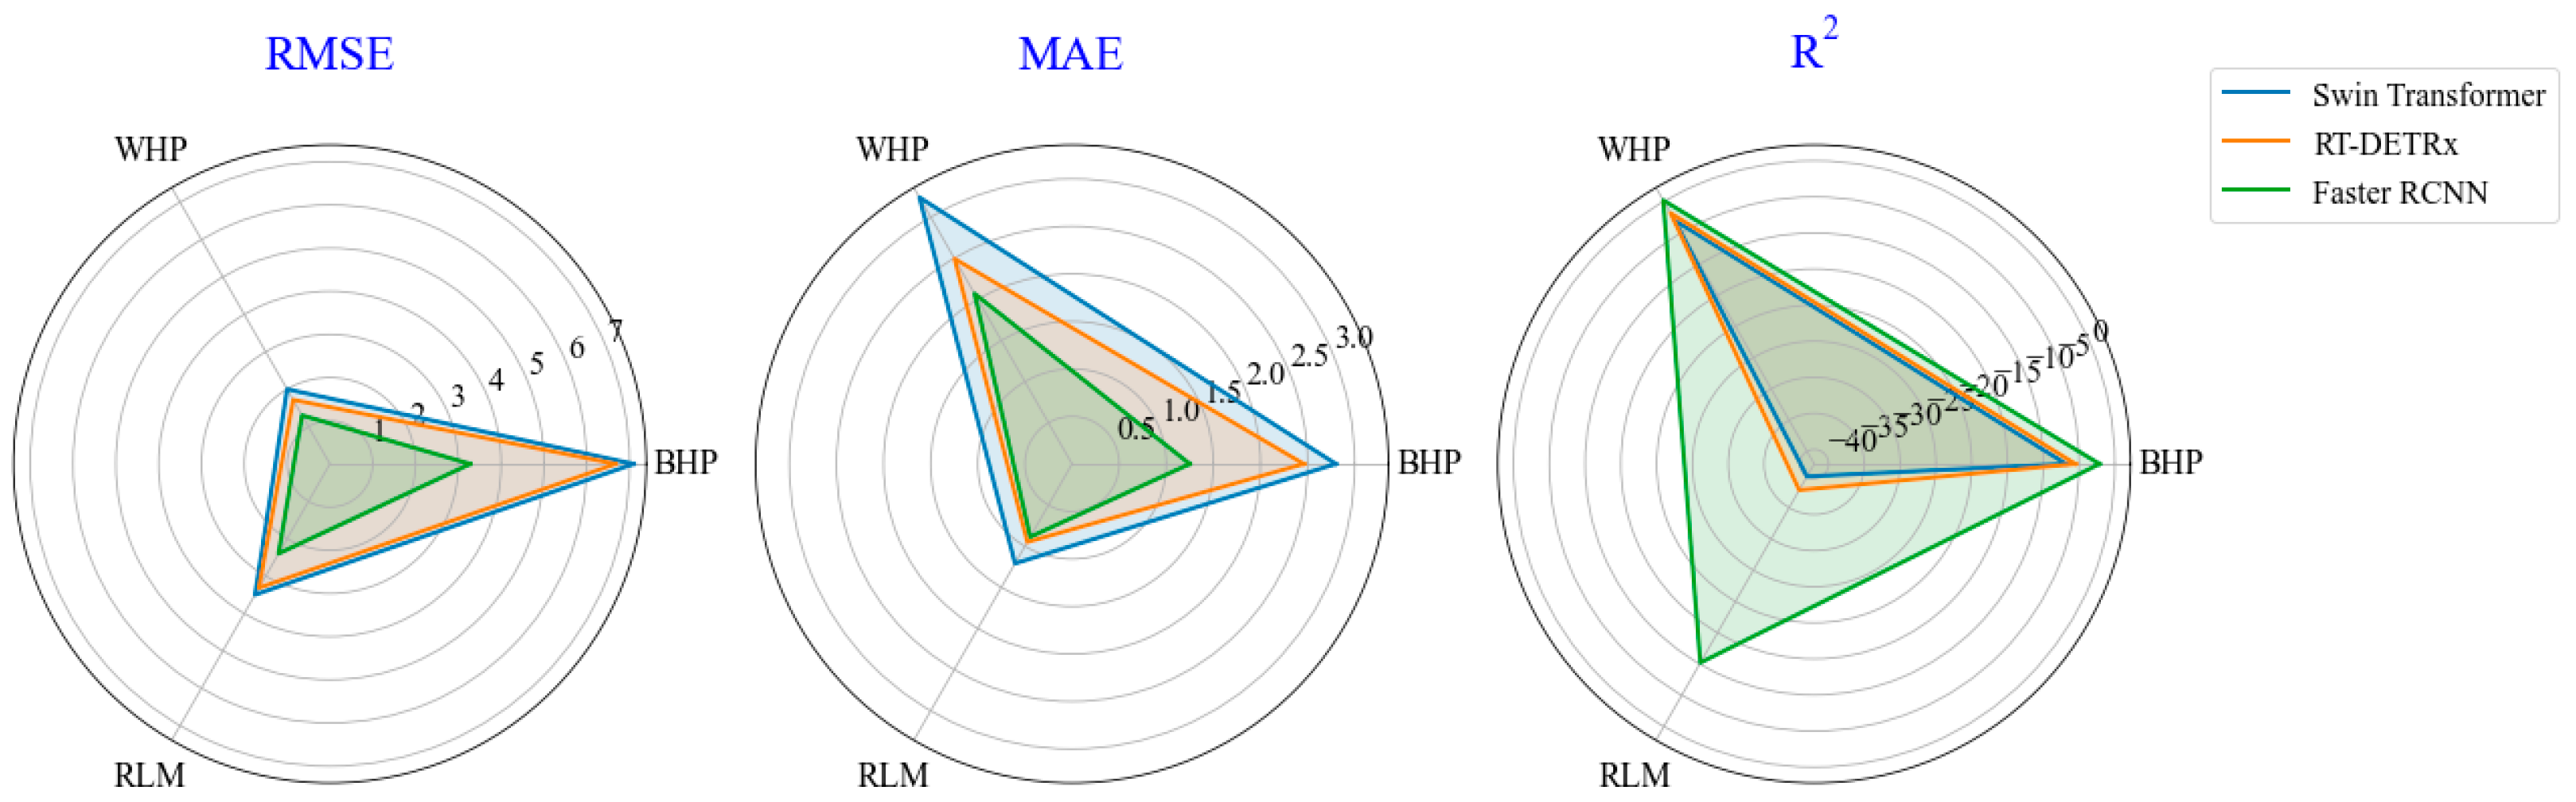
3.3. Differences in Planthopper Counting Based on Involved Methods

In this study, a diverse set of images from complex field landscapes was collected for training and testing the involved models. Figure 8 presents a comparison of the numbers between manually counted insects and detected insects in each image, based on a variety of methods, including the Swin Transformer, RT-DETRx, Faster RCNN, YOLOv5x, YOLOv8x, YOLOv8x-p2, YOLOv10x and SwinT YOLOv8x-p2 methods. It can be observed that the correlation relationship in counting between the referenced and detected insects is strong for the YOLOv5x, YOLOv8x, YOLOv8x-p2, YOLOv10x and SwinT YOLOv8x-p2 methods. The SwinT YOLOv8x-p2 method exhibited the most promising results, with the R2 above 0.85 and RMSE and MAE below 0.64 and 0.11, respectively, across different pests. Although most of the insects were successfully classified, some planthoppers were either missed or misclassified by the various methods employed in this research, particularly in the case of the Swin Transformer and RT-DETRx methods, which exhibited R2 values below 0 in the counting of different pests. It is evident from Figure 5 and Figure 6 that the Faster R-CNN, Swin Transformer and RT-DETRx methods were unable to accurately count the number of pests in each image. Furthermore, there were notable differences in the performances of various methods in detecting BPH, WBPH and RLM. The capacity for the SwinT YOLOv8x-p2 method to enumerate BPH was enhanced during our investigation. In comparison to the error generated by the detection of BPH using the YOLOv8x-p2 model, the error produced by the SwinT YOLOv8x-p2 model was observed to decrease when detecting BPH in our research, with a reduction in RMSE from 0.81 to 0.64, and in MAE from 0.14 to 0.10.
Figure 9 shows the 1:1 relationship between the detected and manually counted pests across each species for each image using RT-DETRx, YOLOv10x, YOLOv8x-p2 and SwinT YOLOv8x-p2 models. It should be noted that these four methods were selected as representative in the model architecture. In terms of counting pests from digital images, both WBHP and RLM densities tend to be overestimated in different models. This phenomenon was particularly obvious when the RT-DETRx model was implemented in the pest counting task. Furthermore, although the performances of the YOLOv10x, YOLOv8x-p2 and SwinT YOLOv8x-p2 models are excellent in counting different pest species from images, the differences can be captured when using images that includes both relatively low and relatively high pest density. The improvements in counting pests were observed in those images capturing more pest individuals when using higher-performance methods.
Figure 10 illustrates the efficacy of detecting the pests through a range of methodologies, including the Swin Transformer, RT-DETRx, Faster RCNN, YOLOv5x, YOLOv8x, YOLOv8x-p2, YOLOv10x and SwinT YOLOv8x-p2, across diverse rice images encompassing various insect species. The images were selected at random from the test dataset. It was demonstrated that the performance of detecting rice planthoppers using different YOLO models is comparable when both spare adult and nymph insects are included. The detection errors were primarily due to false positives, with relatively few false negatives. The background was easily misclassified as pests, as evident in Figure 6 and Figure 10. In this context, the benefits of the SwinT YOLOv8x-p2 are not clear. Improved performance in detecting and counting planthoppers was consistently observed when using SwinT YOLOv8x-p2 or other models, particularly in images featuring backgrounds that closely resembled those of rice planthoppers, with a high prevalence of tiny nymphae. In conclusion, the performance of the YOLOv5x, YOLOv8x, YOLOv8x-p2 and YOLOv10x methods was found to be highly satisfactory, with most of the adult insects in the images being identified with remarkable efficiency. However, these YOLO models exhibited a tendency to commit errors when attempting to detect tiny nymphae, particularly in scenarios in which they are white in color and situated within a background of a similar hue. In comparison to other methodologies, the capacity of the Swin Transformer and RT-DETRx approaches to detect insects was found to be limited, with a considerable number of errors occurring when attempting to identify adults and nymphae.

4. Discussion

The deep learning methods for pest detection from RGB images depend on robust, annotated and available pest image datasets. However, it is challenging to assemble a high-quality image dataset that exhibits pest attacks in natural landscapes. At present, most of the publicly accessible datasets for agriculture have been generated from strictly controlled conditions, which is unreliable for exhibiting realistic agricultural scenes. Furthermore, the objects captured by these datasets are always blurry, with relatively few details of morphological features or organic features [38,39]. Developing and publishing a publicly accessible dataset from actual field landscapes for pest detection and counting would not only advance model development but also enable more effective, data-driven pest management strategies. During our research, we assembled and published a comprehensive big dataset on rice planthoppers, encompassing both BPH and WBPH. Small targets with complex backgrounds are dominant in the dataset, and the width and height ratios occupied by the insect target box in the entire image are only 0.1 and 0.2, respectively. The dataset’s background includes a variety of rice stems, leaves, water bodies and soil, thereby recreating the complexity of a real farmland pest-damage scene. Moreover, the dataset was collected from different plant architectures across diverse plant densities, which can accurately exhibit the vertical distribution of insects on the plant, as evident in Figure 3, Figure 8 and Figure 9.
The quality of the image and the efficacy of the methods employed are important in the detection of tiny insects [40]. It is an efficient strategy to improve performance in detecting insects by refining image quality. For the dataset captured, a professional camera, equipped with a 2× macro lens, was utilized to collect high-definition images, resulting in the acquisition of a total of 5000 RGB of images, which captured the fine details of the rice planthoppers. A dataset with detailed information about the pests’ morphological characteristics was created, which will facilitate the development of more sophisticated models for detecting rice planthoppers [41]. The rich details enabled the implementation of advanced models, such as SwinT YOLOv8x-p2, YOLOv8x-p2, YOLOv10x and YOLOv5x, which demonstrated impressive performance. Additionally, several damaged scenes were manually selected in our research when collecting rice planthopper images, given the constraints of the camera’s field of view and the density distribution of the planthopper family. These operations guarantee the efficacy of most of the methods employed in this research. Furthermore, our attempts addressed the limitations of previous studies that focused only on simple backgrounds or a single rice planthopper type, representing a significant advancement in accurately distinguishing and counting multiple types of rice planthoppers in field landscapes [7,12]. Despite the notable success of most of the methods based on the big dataset, particularly the YOLO series, a small number of rice planthoppers were still missed or misclassified by various methods, as evidenced in Figure 11. The presence of a complex background in our insect images represents a significant challenge that hinders further enhancement of the performance of planthopper detection methods. Furthermore, a 2× Macro lens was employed in this research to capture high-definition insect images, which resulted in the appearance of a bokeh effect in the planthopper images. This effect has the potential to impede the detection of insects, particularly those situated within the blurred area, as it obscures crucial details, leading to missed or misclassified planthoppers. Moreover, the rice planthoppers were fed separately to prevent species extinction caused by natural competition. This setup simplified the identification of individual species in each image, resulting in a limited number of false negatives (FN). In the future, more complex interaction scenarios between BPH and WBPH should be incorporated to better understand the impact of false positives (FPs) and false negatives (FNs) on pest detection and counting performance.
While the high-definition images of the insects were instrumental in detecting the pests, the deep learning methods were also essential for accurately identifying and quantifying them [42]. In this study, the YOLOv8-p2 model was selected as the baseline. As the model was designed specifically for the detection of small objects, it comprises a total of four detection heads, whereas the YOLOv8 base model includes only three. The newly added detection head corresponded to the P2 features layer, which was 1/4 the size of the input image. The other detection heads corresponded to the P3, P4 and P5 feature layers, which were 1/8, 1/16 and 1/32 the size of the input image, respectively. As the size of the feature layers increases, the receptive field size also grows, and the neural network becomes more lightweight [43]. A lighter neural network could result in a paucity of deep features related to insect detection in the P2 feature layer, which seems harmful to the detection and counting of tiny insects. However, the disadvantages and advantages of the YOLOv8-p2 architecture in detecting and counting tiny insects remain unclear [12]. In this research, it has been proven that the YOLOv8-p2 architecture is capable of performing the tasks, achieving mAP, mAP50:95, F1-score, Recall, Precision and FPS of up to 0.847, 0.835, 0.899, 0.985, 0.826 and 16.69 in the detection task. For pest counting, the model yielded a higher R2 values (BPH: 0.8325, WBPH: 0.961; RLM: 0.945) and lower RMSE values (BPH: 0.169, WBPH: 0.192; RLM: 0.805), indicating reliable performance across different rice planthopper types. It is reported that the transformer architecture is a powerful tool for the extraction of deep features, yet it is susceptible to significant errors in location [21,44]. The Swin Transformer with a multi-head self-attention mechanism is a suitable choice as a universal backbone feature extraction network for computer vision applications. The integration of the Swin Transformer module with the YOLOv8-p2 backbone architecture enhanced the latter’s capacity for deep feature mining, particularly within the P2 feature layer, causing a performance improvement in the detection task, as evidenced by the mAP, mAP50:95, F1-score, Recall and Precision increasing to 0.868, 0.851, 0.905, 0.989 and 0.835, along with an increase in R2 values (BPH: 0.850, WBPH: 0.961; RLM: 0.965) and a decrease in RMSE values (BPH: 0.168, WBPH: 0.193; RLM: 0.640) in the pest counting. Additional tests confirmed that the improvements are both statistically significant and robust, as illustrated in Figure 7, as well as Table 5 and Table 6. The multi-head self-attention mechanism enables a focus on global features in an image, rather than solely on local features. With the introduction of the Transformer, the model is better able to comprehend the contextual information within the image, thus enhancing the accuracy of the detection [45]. Moreover, the multi-scale feature fusion capabilities have been augmented by the SwinT YOLOv8-p2 model, thereby conferring enhanced flexibility and accuracy upon the model in its ability to process targets at disparate scales.
It is a challenging task to accurately detect and count planthoppers in complex field environments, especially due to the inconspicuous nature of nymphs concealed on the lower surfaces of rice plants. Traditional tools such as unmanned ground vehicles (UGVs) and unmanned aerial vehicles (UAV) often fail to capture planthoppers directly in situ, particularly under muddy and occluded conditions [46]. However, recent advancements in multi-legged robot platforms, exemplified by Boston Dynamics’ dog-like robots, present promising opportunities for integrating intelligent pest monitoring capabilities [47]. Despite increased the computational complexity of the Transformer, the combined model can still maintain a light weight and high real-time performance through optimization and a reasonable architectural design, making it suitable for real-time application scenarios. The SwinT YOLOv8-p2 can be embedded into the dog-like robot in the future, making it as a powerful tool for detecting and counting planthoppers in field landscapes. By using a strategy based on deep learning methods and agricultural robots, traditional light-taps and manual pat-check methods can be augmented or replaced, enabling continuous, automated monitoring and more accurate pest detection in the field. Furthermore, by embedding the model into a smartphone app, farmers can instantly identify and monitor the pest populations in a field, enabling real-time alerts, historical tracking and data-driven decision support for timely interventions.
Improving pest management practices through public intelligence by continually releasing publicly accessible datasets is an important long-term goal, and our research contributes toward achieving this objective. Simultaneously, our results suggest that enhancing the backbone of the deep learning framework by fusing the Transformer can improve the performance of pest detection and counting. Although this method is capable, there remains significant potential for further improvement. Recently, Mamba has gained increasing attention for its potential to further enhance the capabilities of deep learning methods in detecting and counting tiny pests [48]. In the future, it should be integrated into existing detection frameworks to improve model efficiency, accuracy and real-time performance in complex agricultural environments. Furthermore, the dedicated loss function should also be designed for detecting and counting the rice planthopper.
While the development of new models, such as designing novel loss functions, remains an important direction in research, it is also valuable to recognize the potential of existing models. With appropriate and modest adjustments, these established architectures can still perform effectively. In this study, we found that simple refinements to a well-known model were enough to meet our objectives. This experience suggests that, in some cases, focusing on the specific characteristics of the problem itself may be more beneficial than pursuing innovation for its own sake. Both innovation and the thoughtful application of existing methods play essential roles in advancing research.

5. Conclusions

The number of publicly accessible datasets pertaining to agricultural pests is relatively limited. Moreover, there is a paucity of high-definition images of planthoppers. It is a challenging task to accurately detect and count planthopper adults, senior nymphae and juvenile nymphae in field landscapes. This research presents and publishes a large-scale publicly accessible planthopper image dataset with refined details, exploring the potential of YOLOv8-p2, and suggests an improvement strategy for the detection and counting of rice planthopper. This strategy, named SwinT YOLOv8-p2, integrates the Swin Transformer module with the backbone of the YOLOv8-p2 architecture. The efficacy of SwinT YOLOv8-p2 was rigorously evaluated. Furthermore, its performance was benchmarked against other established techniques. The findings demonstrate the following:
(1)
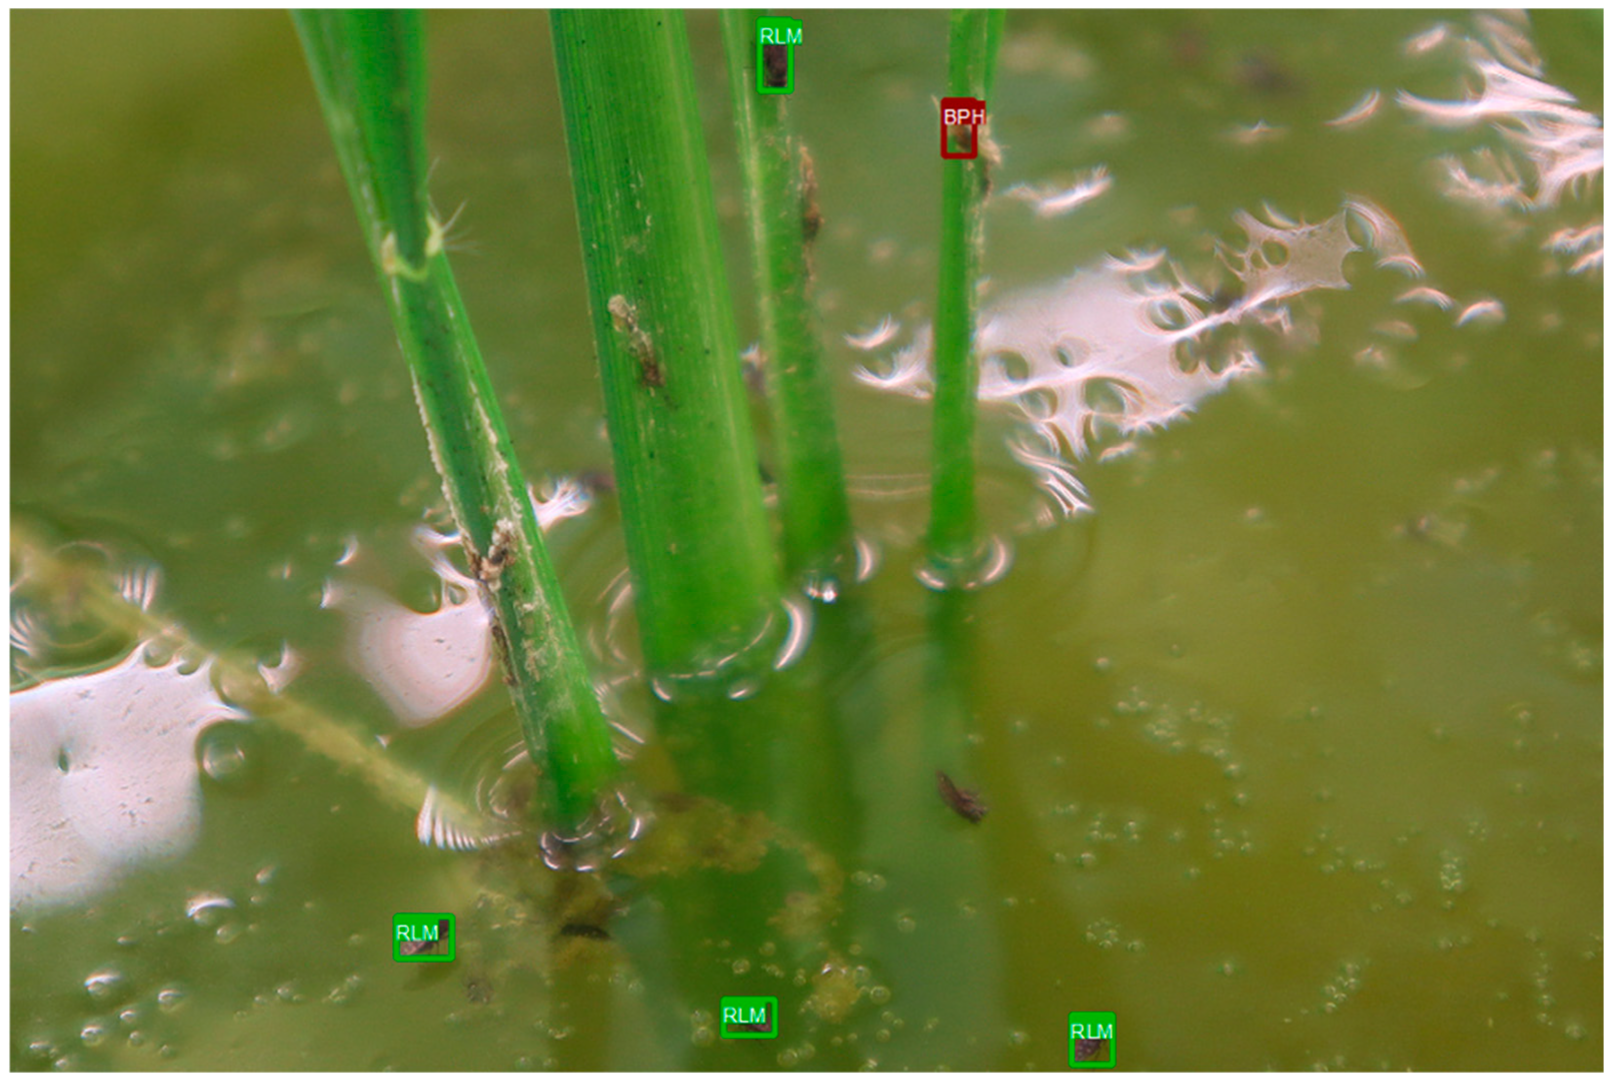
A high-definition publicly accessible planthopper image dataset has been created, and the small targets with complex backgrounds are dominant in this dataset.
(2)
YOLOv8-p2 is robust for the detection of pests, with mAP50, mAP50:95, F1-score, Recall, Precision and FPS of up to 0.847, 0.835, 0.899, 0.985, 0.826 and 16.69, respectively.
(3)
By integrating the Swin Transformer module and YOLOv8-p2 architectures, the performance of SwinT YOLOv8-p2 shows remarkable improvement compared to the YOLOv8-p2 and YOLOv10 methods, with increases in the mAP50 and mAP50:95 ranging from 1.9% to 61.8%.
(4)
The correlation relationship in counting between the manually counted pests and detected pests was strong across the YOLO methods, especially for the SwinT YOLOv8x-p2 method, with the R2 above 0.85 and the RMSE and MAE below 0.64 and 0.11, respectively, in different pests.

Author Contributions

Conceptualization, X.J. and J.L.; resources, Y.H., X.Y., G.Y. and X.L.; writing—original draft preparation, X.J. and X.C.; writing—review and editing, X.J., X.C. and M.G.; supervision, G.Y. and X.L.; project administration, G.Y. and X.L.; funding acquisition, G.Y. and X.L. All authors have read and agreed to the published version of the manuscript.

Funding

This research was funded by the Key R&D Projects in Zhejiang Province (2023C02009, 2023C02043, 2022C02044), the National Natural Science Foundation of China (32171889) and a Project Supported by Scientific Research Fund from Zhejiang University (XY2022033).

Institutional Review Board Statement

Not applicable.

Data Availability Statement

The data presented in this study are openly available in Kaggle at https://doi.org/10.34740/kaggle/dsv/12187050 (accessed on 23 June 2025), reference number [https://doi.org/10.34740/kaggle/dsv/12187050].

Acknowledgments

During the preparation of this manuscript/study, the author(s) used ChatGPT 3.5 (OpenAI) for the purposes of language polishing, and the scientific content and conclusions of this study were not generated by AI.

Conflicts of Interest

The authors declare no conflicts of interest.

References

  1. Seck, P.A.; Diagne, A.; Mohanty, S.; Wopereis, M.C. Crops that feed the world 7: Rice. Food Secur. 2012, 4, 7–24. [Google Scholar] [CrossRef]
  2. Chowdhury, P.R.; Medhi, H.; Bhattacharyya, K.G.; Hussain, C.M. Severe deterioration in food-energy-ecosystem nexus due to ongoing Russia-Ukraine war: A critical review. Sci. Total Environ. 2023, 902, 166131. [Google Scholar] [CrossRef]
  3. Heong, K.L.; Wong, L.; Delos Reyes, J.H. Addressing planthopper threats to Asian rice farming and food security: Fixing insecticide misuse. In Rice Planthoppers: Ecology, Management, Socio Economics and Policy; Asian Development Bank: Manila, Philippines, 2015; pp. 65–76. [Google Scholar]
  4. Dale, D. Insect pests of the rice plant–their biology and ecology. Biol. Manag. Rice Insects 1994, 438, 363–487. [Google Scholar]
  5. Sun, G.; Liu, S.; Luo, H.; Feng, Z.; Yang, B.; Luo, J.; Tang, J.; Yao, Q.; Xu, J. Intelligent monitoring system of migratory pests based on searchlight trap and machine vision. Front. Plant Sci. 2022, 13, 897739. [Google Scholar] [CrossRef]
  6. Zhou, X.; Zhang, H.; Pan, Y.; Li, X.; Jia, H.; Wu, K. Comigration of the predatory bug Cyrtorhinus lividipennis (Hemiptera: Miridae) with two species of rice planthopper across the South China Sea. Biol. Control 2023, 179, 105167. [Google Scholar] [CrossRef]
  7. Sheng, H.; Yao, Q.; Luo, J.; Liu, Y.; Chen, X.; Ye, Z.; Zhao, T.; Ling, H.; Tang, J.; Liu, S. Automatic detection and counting of planthoppers on white flat plate images captured by AR glasses for planthopper field survey. Comput. Electron. Agric. 2024, 218, 108639. [Google Scholar] [CrossRef]
  8. Hanson, P.E. Insects and Other Arthropods of Tropical America; Cornell University Press: Ithaca, NY, USA, 2016. [Google Scholar]
  9. Qing, Y.; Chen, G.-T.; Zheng, W.; Zhang, C.; Yang, B.-J.; Jian, T. Automated detection and identification of white-backed planthoppers in paddy fields using image processing. J. Integr. Agric. 2017, 16, 1547–1557. [Google Scholar]
  10. He, Y.; Zhou, Z.; Tian, L.; Liu, Y.; Luo, X. Brown rice planthopper (Nilaparvata lugens Stal) detection based on deep learning. Precis. Agric. 2020, 21, 1385–1402. [Google Scholar] [CrossRef]
  11. Ibrahim, M.F.; Khairunniza-Bejo, S.; Hanafi, M.; Jahari, M.; Ahmad Saad, F.S.; Mhd Bookeri, M.A. Deep CNN-Based Planthopper Classification Using a High-Density Image Dataset. Agriculture 2023, 13, 1155. [Google Scholar] [CrossRef]
  12. Zhang, Z.; Zhan, W.; Sun, K.; Zhang, Y.; Guo, Y.; He, Z.; Hua, D.; Sun, Y.; Zhang, X.; Tong, S.; et al. RPH-Counter: Field detection and counting of rice planthoppers using a fully convolutional network with object-level supervision. Comput. Electron. Agric. 2024, 225, 109242. [Google Scholar] [CrossRef]
  13. Khairunniza-Bejo, S.; Ibrahim, M.F.; Hanafi, M.; Jahari, M.; Ahmad Saad, F.S.; Mhd Bookeri, M.A. Automatic Paddy Planthopper Detection and Counting Using Faster R-CNN. Agriculture 2024, 14, 1567. [Google Scholar] [CrossRef]
  14. Guo, Q.; Wang, C.; Xiao, D.; Huang, Q. An Enhanced Insect Pest Counter Based on Saliency Map and Improved Non-Maximum Suppression. Insects 2021, 12, 705. [Google Scholar] [CrossRef]
  15. Cong, S.; Zhou, Y. A review of convolutional neural network architectures and their optimizations. Artif. Intell. Rev. 2023, 56, 1905–1969. [Google Scholar] [CrossRef]
  16. Wang, H.; Li, Y.; Dang, L.M.; Moon, H. An efficient attention module for instance segmentation network in pest monitoring. Comput. Electron. Agric. 2022, 195, 106853. [Google Scholar] [CrossRef]
  17. Islam, S.; Elmekki, H.; Elsebai, A.; Bentahar, J.; Drawel, N.; Rjoub, G.; Pedrycz, W. A comprehensive survey on applications of transformers for deep learning tasks. Expert Syst. Appl. 2024, 241, 122666. [Google Scholar] [CrossRef]
  18. Yang, J.; Li, C.; Zhang, P.; Dai, X.; Xiao, B.; Yuan, L.; Gao, J. Focal self-attention for local-global interactions in vision transformers. arXiv 2021, arXiv:2107.00641. [Google Scholar]
  19. He, J.; Zhang, S.; Yang, C.; Wang, H.; Gao, J.; Huang, W.; Wang, Q.; Wang, X.; Yuan, W.; Wu, Y. Pest recognition in microstates state: An improvement of YOLOv7 based on Spatial and Channel Reconstruction Convolution for feature redundancy and vision transformer with Bi-Level Routing Attention. Front. Plant Sci. 2024, 15, 1327237. [Google Scholar] [CrossRef]
  20. Tabani, H.; Balasubramaniam, A.; Marzban, S.; Arani, E.; Zonooz, B. Improving the efficiency of transformers for resource-constrained devices. In Proceedings of the 2021 24th Euromicro Conference on Digital System Design (DSD), Palermo, Italy, 1–3 September 2021; pp. 449–456. [Google Scholar]
  21. Han, K.; Wang, Y.; Chen, H.; Chen, X.; Guo, J.; Liu, Z.; Tang, Y.; Xiao, A.; Xu, C.; Xu, Y. A survey on vision transformer. IEEE Trans. Pattern Anal. Mach. Intell. 2022, 45, 87–110. [Google Scholar] [CrossRef]
  22. Zhu, X.; Su, W.; Lu, L.; Li, B.; Wang, X.; Dai, J. Deformable detr: Deformable transformers for end-to-end object detection. arXiv 2020, arXiv:2010.04159. [Google Scholar]
  23. Qi, F.; Chen, G.; Liu, J.; Tang, Z. End-to-end pest detection on an improved deformable DETR with multihead criss cross attention. Ecol. Inform. 2022, 72, 101902. [Google Scholar] [CrossRef]
  24. Zhang, Y.; Lv, C. TinySegformer: A lightweight visual segmentation model for real-time agricultural pest detection. Comput. Electron. Agric. 2024, 218, 108740. [Google Scholar] [CrossRef]
  25. Liu, Z.; Lin, Y.; Cao, Y.; Hu, H.; Wei, Y.; Zhang, Z.; Lin, S.; Guo, B. Swin transformer: Hierarchical vision transformer using shifted windows. In Proceedings of the IEEE/CVF International Conference on Computer Vision, Montreal, QC, Canada, 10–17 October 2021; pp. 10012–10022. [Google Scholar]
  26. Li, C.; Luo, C.; Zhou, Z.; Wang, R.; Ling, F.; Xiao, L.; Lin, Y.; Chen, H. Gene expression and plant hormone levels in two contrasting rice genotypes responding to brown planthopper infestation. BMC Plant Biol. 2017, 17, 57. [Google Scholar] [CrossRef]
  27. Wang, W. Advanced Auto Labeling Solution with Added Features. Available online: https://github.com/CVHub520/X-AnyLabeling (accessed on 3 November 2023).
  28. Kirillov, A.; Mintun, E.; Ravi, N.; Mao, H.; Rolland, C.; Gustafson, L.; Xiao, T.; Whitehead, S.; Berg, A.C.; Lo, W.-Y. Segment anything. In Proceedings of the IEEE/CVF International Conference on Computer Vision, Paris, France, 1–6 October 2023; pp. 4015–4026. [Google Scholar]
  29. Sohan, M.; Sai Ram, T.; Rami Reddy, C.V. A review on yolov8 and its advancements. In Proceedings of the International Conference on Data Intelligence and Cognitive Informatics, Tirunelveli, India, 18–20 November 2024; pp. 529–545. [Google Scholar]
  30. Wang, A.; Chen, H.; Liu, L.; Chen, K.; Lin, Z.; Han, J. Yolov10: Real-time end-to-end object detection. Adv. Neural Inf. Process. Syst. 2024, 37, 107984–108011. [Google Scholar]
  31. Yang, Y.; Jiao, L.; Liu, X.; Liu, F.; Yang, S.; Feng, Z.; Tang, X. Transformers meet visual learning understanding: A comprehensive review. arXiv 2022, arXiv:2203.12944. [Google Scholar]
  32. Chen, J.; He, T.; Zhuo, W.; Ma, L.; Ha, S.; Chan, S.-H.G. Tvconv: Efficient translation variant convolution for layout-aware visual processing. In Proceedings of the IEEE/CVF Conference on Computer Vision and Pattern Recognition, New Orleans, LA, USA, 18–24 June 2022; pp. 12548–12558. [Google Scholar]
  33. Li, J.; Wen, Y.; He, L. Scconv: Spatial and channel reconstruction convolution for feature redundancy. In Proceedings of the IEEE/CVF Conference on Computer Vision and Pattern Recognition, Vancouver, BC, Canada, 17–24 June 2023; pp. 6153–6162. [Google Scholar]
  34. Zhao, Y.; Lv, W.; Xu, S.; Wei, J.; Wang, G.; Dang, Q.; Liu, Y.; Chen, J. Detrs beat yolos on real-time object detection. In Proceedings of the IEEE/CVF Conference on Computer Vision and Pattern Recognition, Seattle, WA, USA, 16–22 June 2024; pp. 16965–16974. [Google Scholar]
  35. Ren, S.; He, K.; Girshick, R.; Sun, J. Faster r-cnn: Towards real-time object detection with region proposal networks. Trans. Pattern Anal. Mach. Intell. 2017, 39, 1137–1149. [Google Scholar] [CrossRef]
  36. Jocher, G.; Stoken, A.; Borovec, J.; Changyu, L.; Hogan, A.; Diaconu, L.; Poznanski, J.; Yu, L.; Rai, P.; Ferriday, R. ultralytics/yolov5: v3.0. Zenodo 2020. Available online: https://github.com/ultralytics/yolov5 (accessed on 20 December 2020).
  37. Khanam, R.; Hussain, M. Yolov11: An overview of the key architectural enhancements. arXiv 2024, arXiv:2410.17725. [Google Scholar]
  38. Kurmi, Y.; Gangwar, S. A leaf image localization based algorithm for different crops disease classification. Inf. Process. Agric. 2022, 9, 456–474. [Google Scholar] [CrossRef]
  39. Rana, S.; Crimaldi, M.; Barretta, D.; Carillo, P.; Cirillo, V.; Maggio, A.; Sarghini, F.; Gerbino, S. GobhiSet: Dataset of raw, manually, and automatically annotated RGB images across phenology of Brassica oleracea var. Botrytis. Data Brief 2024, 54, 110506. [Google Scholar] [CrossRef]
  40. Li, W.; Zheng, T.; Yang, Z.; Li, M.; Sun, C.; Yang, X. Classification and detection of insects from field images using deep learning for smart pest management: A systematic review. Ecol. Inform. 2021, 66, 101460. [Google Scholar] [CrossRef]
  41. Wu, X.; Zhan, C.; Lai, Y.-K.; Cheng, M.-M.; Yang, J. Ip102: A large-scale benchmark dataset for insect pest recognition. In Proceedings of the IEEE/CVF Conference on Computer Vision and Pattern Recognition, Long Beach, CA, USA, 15–20 June 2019; pp. 8787–8796. [Google Scholar]
  42. Liu, J.; Wang, X. Plant diseases and pests detection based on deep learning: A review. Plant Methods 2021, 17, 22. [Google Scholar] [CrossRef]
  43. Farkaš, L. Object Tracking and Detection with YOLOv8 and StrongSORT Algorithms Captured by Drone; University of Split, Faculty of Science, Department of Informatics: Split, Croatia, 2023. [Google Scholar]
  44. Touvron, H.; Cord, M.; El-Nouby, A.; Verbeek, J.; Jégou, H. Three things everyone should know about vision transformers. In Proceedings of the European Conference on Computer Vision, Tel Aviv, Israel, 23–27 October 2022; pp. 497–515. [Google Scholar]
  45. Khan, S.; Naseer, M.; Hayat, M.; Zamir, S.W.; Khan, F.S.; Shah, M. Transformers in vision: A survey. ACM Comput. Surv. (CSUR) 2022, 54, 1–41. [Google Scholar] [CrossRef]
  46. Lakmal, D.; Kugathasan, K.; Nanayakkara, V.; Jayasena, S.; Perera, A.S.; Fernando, L. Brown planthopper damage detection using remote sensing and machine learning. In Proceedings of the 2019 18th IEEE International Conference on Machine Learning and Applications (ICMLA), Boca Raton, FL, USA, 16–19 December 2019; pp. 97–104. [Google Scholar]
  47. Mahapatra, A.; Roy, S.S.; Pratihar, D.K.; Mahapatra, A.; Roy, S.S.; Pratihar, D.K. Multi-legged robots—A review. In Multi-Body Dynamic Modeling of Multi-Legged Robots; Springer: Berlin/Heidelberg, Germany, 2020; pp. 11–32. [Google Scholar]
  48. Gu, A.; Dao, T. Mamba: Linear-time sequence modeling with selective state spaces. arXiv 2023, arXiv:2312.00752. [Google Scholar]
Figure 1. The architecture of the improved planthopper detection strategy: SwinT YOLOv8-p2.
Agriculture 15 01366 g001
Figure 2. The planthopper image collection by Sony A6000 camera equipped with a macro lens, where (a) is the professional camera, and (b) is the detail of a high-definition image of the pests.
Agriculture 15 01366 g002
Figure 3. The different pest images (BHP, WBHP and RLM) captured from complex agricultural landscape.
Agriculture 15 01366 g003
Figure 4. The architecture of the Swin Transformer module, where (a) is the details of the Swin Transformer module, and (b) refers to the Swin Transformer block in Swin Transformer-based module.
Agriculture 15 01366 g004
Figure 5. The size and spatial distribution of the target box in the rice planthopper dataset. The x- and y-axes represent the normalized center coordinates of objects, while width and height indicate the normalized box dimensions. Diagonal plots show variable distributions; off-diagonals illustrate pairwise correlations.
Agriculture 15 01366 g005
Figure 6. The details for detecting different insects, including BPH, WBPH and RLM using (a) Swin Transformer, (b) RT-DETRx, (c) Faster RCNN, (d) YOLOv5x, (e) YOLOv8x, (f) YOLOv8x-p2, (g) YOLOv10x and (h) SwinT YOLOv8x-p2 models. Where warm colors stand for the better performance and cool colors stand for the poor performance.
Agriculture 15 01366 g006aAgriculture 15 01366 g006b
Figure 7. The comparison of detection performance over training epochs for SwinT YOLOv8-p2, YOLOv8-p2, YOLOv10x and YOLOv11x models, where (a) shows the mAP50 curves and (b) presents the mAP50:95 curves.
Agriculture 15 01366 g007
Figure 8. The details for counting different insects including BPH, WBPH and RLM using (a) Swin Transformer, (b) RT-DETRx, (c) Faster RCNN, (d) YOLOv5x, (e) YOLOv8x, (f) YOLOv8x-p2, (g) YOLOv10x and (h) SwinT YOLOv8x-p2 models.
Agriculture 15 01366 g008aAgriculture 15 01366 g008b
Figure 9. The 1:1 relationship between the detected and manually counted pests including BPH, WBPH and RLM based on (a) RT-DETRx, (b) YOLOv10x, (c) YOLOv8x-p2 and (d) SwinT YOLOv8x-p2 models.
Agriculture 15 01366 g009
Figure 10. The detection results for pests including BHP, WBPH and RLM using different models over the randomly selected images. The blue, red and green bounding boxes represent the RLM, BPH and WBPH.
Agriculture 15 01366 g010
Figure 11. The visual examples of FNs in which RLM was confused with BPH by SwinT YOLOv8-p2 model.
Agriculture 15 01366 g011
Table 1. The configuration of equipment and software in this research.
Equipment/SoftwareNameCompanyCountry
CPUI5 13600kIntelAmerica
GPUGeForce RTX3080TiNVIDIAAmerica
Operating SystemWindows 10MicrosoftAmerica
Deep learning frameworkPytorch 2.2.2MetaAmerica
Table 2. The details for constructing the high-quality planthopper image dataset.
IndexPest NamesImagesInstances
1Brown planthopper30005335
2Whitebacked planthopper18002770
3Rice leaf miner200410
Table 3. The details of the deep learning models in contrast experiment.
Model FeaturesArchitecturesModelsReferences
Transformer-basedSwin Transformer-basedCascade-Mask R-CNN-Swin-Based[25]
RT-DETRRT-DETRx[34]
CNN-basedFaster R-CNNFaster R-CNN-ResNet50-FPN[35]
YOLOv5YOLOv5x[36]
YOLOv8YOLOv8x[29]
YOLOv8-p2YOLO8x-p2[29]
YOLOv10YOLOv10x[30]
YOLOv11YOLOv11x[37]
Table 4. The planthopper detection results from different models and their details.
Model FeaturesDetection ModelsmAP50mAP50:95F1-ScoreRecallPrecisionFPSFLOPsParameters
Transformer-basedCascade-Mask R-CNN-Swin-based0.7050.5260.6610.7780.57420.19738.6258.9M
RT-DETRx0.7550.5430.7300.8450.64369.44279.3120M
CNN-basedFaster R-CNN-ResNet50-FPN0.8120.5910.7750.8760.6958.33245.645.2M
YOLOv5x0.8440.7630.8870.9690.81784.75236.086.7M
YOLOv8x0.8400.7590.8890.9710.82086.96257.468.2M
YOLOv8x-p20.8470.8350.8990.9850.82616.69316.167.1M
YOLOv10x0.8450.7520.8790.9620.80997.09171.361.2M
YOLOv11x0.8420.7810.8910.9760.82190.65194.456.9 M
YOLOv8x-p2 (SCConv)0.8510.8400.9010.9850.82825.85261.260.1M
HybridSwinT YOLOv8x-p2 (Non-SCConv)0.8600.8480.9030.9860.8326.48360.876.8M
SwinT YOLOv8x-p20.8680.8510.9050.9890.83517.42307.465.2 M
Table 5. The performance of the SwinT YOLOv8-p2, YOLOv8-p2 and YOLO v11 models in repetitive contrast experiment across detection task.
Number of TestsSwinT YOLOv8-p2YOLOv8-p2YOLO v11
mAP50mAP50:95mAP50mAP50:95mAP50mAP50:95
10.8650.8500.8470.8350.8420.781
20.8690.8520.8450.8320.8380.780
30.8600.8490.8490.8370.8370.782
40.8640.8510.8420.8300.8390.779
50.8680.8520.8460.8330.8400.781
Table 6. The error analysis of metric indicators based on SwinT YOLOv8-p2 in 5 independent runs across different tasks.
Number of TestsSwinT YOLOv8-p2 (Detection Task)
mAP50mAP50 (Mean)mAP50 (Standard Deviation)mAP50:95mAP50:95 (Mean)mAP50:95 (Standard Deviation)
10.8650.8650.003560.8350.8330.00270
20.8690.832
30.8600.837
40.8640.830
50.8680.833
Number of testsSwinT YOLOv8-p2 (Counting Task)
R2R2 (Mean)R2 (Standard Deviation)RMSERMSE (Mean)RMSE (Standard Deviation)MAEMAE
(Mean)
MAE
(Standard Deviation)
10.9280.9280.002600.2690.2680.003390.05250.05260.00136
20.9310.2640.0514
30.9250.2720.0548
40.9270.2700.0530
50.9310.2650.0516
Disclaimer/Publisher’s Note: The statements, opinions and data contained in all publications are solely those of the individual author(s) and contributor(s) and not of MDPI and/or the editor(s). MDPI and/or the editor(s) disclaim responsibility for any injury to people or property resulting from any ideas, methods, instructions or products referred to in the content.

