Article

Organic Acids Metabolic Response and Transcription Factor Expression Changes of Highland Barley Seedlings Under Na2SeO3 Treatment

1
Key Laboratory of Tibetan Plateau Medicinal Plant and Animal Resources, School of Life Sciences, Qinghai Normal University, Xining 810008, China
2
Qinghai South of Qilian Mountain Forest Ecosystem Observation and Research Station, Huzhu 810500, China
3
National Forestry Grassland Qinghai Tibet Plateau Characteristic Forest and Grassland Germplasm Resources Protection and Utilization Engineering Technology Research Center, Xining 810008, China
4
Academy of Agricultural and Forestry Sciences, Qinghai University, Xining 810016, China
5
Qinghai Provincial Key Laboratory of Plateau Climate Change and Corresponding Ecological and Environmental Effects, Qinghai Institute of Technology, Xining 810016, China
6
Academy of Plateau Science and Sustainability, Qinghai Normal University, Xining 810008, China
*
Authors to whom correspondence should be addressed.
Agriculture 2025, 15(13), 1364; https://doi.org/10.3390/agriculture15131364
Submission received: 6 May 2025 / Revised: 16 June 2025 / Accepted: 18 June 2025 / Published: 25 June 2025
(This article belongs to the Section Crop Genetics, Genomics and Breeding)

Abstract

Selenium (Se), as a vital trace element, plays an important role in regulating the antioxidant systems of plants, strengthening photosynthetic capacity, and enhancing their stress resistance. Selenate and selenite are the dominant forms of Se available to plants in soils. This research takes highland barley as the research object, aiming to assess the impacts of plant growth, organic acid metabolite, and six transcription factor families in highland barley seedlings under varying concentrations of Na2SeO3. The study indicated that compared to the control group (CK), the plant height of highland barley seedlings under Se1 (0.02 g/kg Na2SeO3) treatment significantly increased by 66%. Under the Se2 (0.2 g/kg Na2SeO3) treatment, plant height significantly decreased by 28%. With Na2SeO3 concentration increased, the pigment content, O2 production rate, and soluble protein content in highland barley seedlings decreased, while the contents of soluble sugar, MDA, and H2O2 increased. Se1 treatment was found to be more beneficial for the growth and development of seedlings. The organic selenium in leaves and roots under Se2 treatment significantly increased by 1105-fold and 188-fold, respectively. The most effective migration capability from soil to leaf under Se1 or Se2 treatment was up to 6.15 or 6.56, respectively. Based on metabolomics, 30 differential metabolites of organic acids were screened from highland barley seedlings under Na2SeO3 treatment and showed positive correlationships with organic selenium, inorganic selenium, and total selenium in highland barley seedling leaves. Through transcriptome analysis, heatmap analysis on six major categories of transcription factors (bHLH, MYB, NAC, WRKY, GATA, and HSF) was performed. Under Se2 treatment, approximately two-thirds of the transcription factors showed high expressions. We further screened 26 differentially expressed genes (DEGs) related to Na2SeO3 concentration. Based on correlation analysis, there were six genes in the bHLH family, five in MYB, three in NAC, five in WRKY, and three in the GATA and HSF families that showed positive correlations with 30 differential organic acid metabolites. These results enhance our understanding of the relationship between the organic acid metabolites and transcription factor expression in highland barley seedlings under Na2SeO3 treatment.

1. Introduction

Selenium (Se) is an essential trace mineral that plays a significant role in the normal physiological activities of organisms [1]. The objective of selenium biofortification is to enhance the absorption and accumulation of exogenous selenium in crops, thereby producing selenium-rich crops that contribute to human health. Recent studies have increasingly recognized that selenium can effectively promote crop growth and increase yields, thus helping to alleviate food shortages [2]. Plants utilize over 10 enzymes to convert inorganic selenium in soil into organic selenium. The absorption of selenium by plants depends on sulfur transporters. SeO32− enters plant chloroplasts and forms selenocysteine through sulfite reductase OAS thiol lyase [3,4,5]. Generally, young leaves have a greater Se concentration during seedling growth than older leaves [6,7]. As a metalloid mineral micronutrient, selenium, at certain concentrations, promotes growth, enhances resistance, improves yield, and elevates quality [8]. Research has demonstrated that moderate concentrations of selenium stimulate the growth and antioxidant capacity of Salvia miltiorrhiza [9]. An appropriate amount of exogenous selenium supports the photosynthesis and mineral absorption of plants, including tea [10] and rice [11]. Furthermore, the foliar application of low-concentration selenium can enhance the content of secondary metabolites in plants, thereby improving their nutritional quality and medicinal value. For example, it can elevate the levels of phenols, flavonoids, and terpenes in Aloe vera leaves [12], as well as increase the content of terpene trilactones in ginkgo leaves [13]. However, excessive doses of Se can reduce the survival rate and yield of Atractylodes macrocephala [14]. In plants, excess Se interferes with nutrient absorption, inhibits the formation of photosynthetic pigments, causes oxide damage, and induces genotoxic effects [15]. Additionally, elevated Se levels above this threshold impede plant growth and development, thus reducing grain yield [16]. High selenium concentrations can cause scorch-like damage to leaves, hinder branch development, reduce root growth, and even result in plant death [17]. These studies provide a foundation for understanding how plants respond to both low and high concentrations of selenium.
Organic acids are metabolites that are widely distributed in the leaves, roots, and fruits of plants. These compounds are beneficial to human health and are thus highly recommended as part of a healthy diet [18]. However, the levels of organic acids can fluctuate significantly under various stress conditions. For instance, research by Song et al. on maize demonstrated that drought stress significantly increased the content of organic acids such as malic acid, citric acid, lactic acid, succinic acid, maleic acid, and acetic acid in the roots, which can enhance the plant’s drought tolerance [19]. A study by Jiao [20] on rice indicated that nano-selenium primarily up-regulated metabolites, including organic acids, amino acids, and 2-hydroxyquinoline, thereby promoting the growth of rice and rhizosphere microorganisms. Xu and colleagues conducted cold treatment on highland barley and found that the most significantly up-regulated differential abundance metabolites (DAMs) included carbohydrates, amino acids and derivatives, organic acids and derivatives, terpenoids, and lipids, indicating that cold stress profoundly impacts the metabolism of highland barley [21]. Understanding the regulatory mechanisms behind the changes in organic acid metabolism is crucial for enhancing plant stress resistance.
Transcription factors (TFs) play a critical role in mediating the crosstalk between abiotic and biotic stresses, highlighting their significance in coordinating plant responses to complex environmental stimuli [22]. Extensively studied transcription factors, including NAC, MYB, WRKY, bHLH, and ERF/DREB, have been recognized for their substantial roles in responses to both abiotic and biotic stresses. Genes from the NAC and MYB families have been confirmed to regulate the synthesis, degradation, and transport of organic acids in various plants [16]. For instance, in strawberries, 38 transcription factors, including WRKY, MYB, NAC, bHLH, GATA, and AP2, are significantly associated with organic acid content during fruit ripening, indicating their potential role as regulatory factors in organic acid metabolism [23]. Furthermore, recent studies have identified transcription factors CitNAC62, CitWRKY1, CitMYB52, CitbHLH2, and CitERF13 as being involved in the accumulation of citric acid in citrus fruits [24,25,26]. In apples, MdMYB1/10 and MdMYB73 promoted malic acid accumulation [27,28], while MdMYB44 [29] and MdMYB21 [30] negatively regulate malic acid content in the fruit. The molecular mechanisms of these candidate genes, potentially involved in organic acid regulation, are currently being elucidated in ongoing research.
Highland barley (Hordeum vulgare L.) belongs to the genus Hordeum within the family Poaceae and is recognized as one of the oldest cereal crops globally [31]. As the most significant food crop on the Qinghai-Tibet Plateau [32], it is renowned for its strong cold tolerance, high yield, and suitability for cultivation in the plateau’s cool climate [33]. Additionally, highland barley offers superior nutritional value, which can aid in disease prevention and enhance human immunity [34,35]. The rapid development of the highland barley industry has significantly contributed to increasing farmers’ income and improving the dietary quality of the Chinese population. According to World Health Organization (WHO) standards, the recommended dose of selenium for adults is 55 μg/d, while the maximum tolerable adult intake without side effects is set at 400 μg/d [36]. Cereal crops serve as the primary source of dietary selenium for humans. Nonetheless, their selenium content is typically low, ranging from 0.01 to 0.55 μg/g in cereals [37]. Therefore, enhancing selenium levels in food crops to improve human selenium nutritional intake is essential and urgently required. Low doses of selenite have been shown to increase the biomass, respiratory rate, and root activity of highland barley while maintaining a homeostatic balance between reactive oxygen species (ROS) and antioxidant enzymes [38]. Treatment of highland barley with 5 mg/L selenium nanoparticles (Se NPs) yielded the most favorable effects on root number and thickness, whereas concentrations exceeding this level resulted in toxic effects on the highland barley [39]. Presently, research primarily focuses on the mechanisms by which selenium alleviates environmental stress in plants, as well as the role of transcription factors in the accumulation of anthocyanins in highland barley [40], lodging resistance [41], and identifying candidate genes. However, there is limited elucidation of transcription factors related to metabolic changes in highland barley under Na2SeO3 treatment.
In this study, we treated highland barley seedlings with varying concentrations of Na2SeO3 and measured their morphological, physiological, and quality traits, including soluble protein, soluble sugar, chlorophyll content, antioxidant enzyme activity, and selenium content. Based on a series of concentrations (Figure S1), we selected CK, low selenium concentration Se1 (0.02 g/kg), and high selenium concentration Se2 (0.2 g/kg) to perform transcriptomic and metabolomic analysis on the aboveground parts of barley seedlings using Illumina and LC-MS/MS systems. This approach allowed us to preliminarily identify differentially accumulated metabolites and differentially expressed transcription factor genes in response to Na2SeO3 treatment. The findings provide a valuable reference for further research into the biological functions of the related transcription factors and metabolites in highland barley seedlings under Na2SeO3 treatment.

2. Materials and Methods

2.1. Plant Materials and Processing

The cultivated variety is Kunlun 14 highland barley, provided by the Crop Research Institute of the Qinghai Academy of Agricultural Sciences. The selenium source used in the study was sodium selenite (Na2SeO3, analytical grade, purity 99%, Qinghai Lainer Biotechnology, Xining, China). The sand was sieved to obtain fine particles, sterilized in an autoclave at 120 °C for 20 min, and then spread out to dry. A sand–vermiculite mixed cultivation substrate was prepared by mixing sand and vermiculite in a 1:1 volume ratio. A total of 720 g of this mixed substrate was weighed per pot, ensuring that the substrate surface was positioned 2 cm below the rim of the pot, and placed in individual plastic pots for highland barley seedling cultivation. Plump and healthy highland barley seeds were selected, washed 3~4 times with tap water to remove surface dust and impurities, treated with 75% ethanol for 5 min, and rinsed 2~3 times with distilled water. The sterilized highland barley seeds were sown in the plastic pots filled with the mixed substrate, with 25 seeds per pot and a sowing depth of approximately 2 cm. The seeded plastic pots were placed in a greenhouse maintained at a temperature of 25 ± 3 °C, humidity of 40~50%, photoperiod of 12 h/d, and sunshine intensity ranging from 10,000 to 15,000 Lux for cultivation. Every 3 days, the pots were irrigated with 1 × Hoagland [33] nutrient solution (500 mL per pot), and the growth of the seedlings was observed and recorded daily. After one week of highland barley seed germination and seedling growth, the highland barley plants exhibited robust growth, showing no signs of pests or diseases, with an average plant height of approximately 5 cm. Twenty uniformly growing seedlings were selected from each pot. Different concentrations of selenium were administered to the highland barley, utilizing eight concentration gradients of Na2SeO3 solution: 0.01 g/kg, 0.02 g/kg (Se1), 0.05 g/kg, 0.075 g/kg, 0.1 g/kg, 0.15 g/kg, and 0.2 g/kg (Se2) and the control plant (Figure S1), which were prepared using 1×Hoagland nutrient solution. Each concentration was replicated three times, resulting in a total of 24 pots. The control group received an equivalent volume of 1×Hoagland nutrient solution. The Na2SeO3 solution was applied every three days. After a continuous treatment period of 15 days, samples were collected for subsequent analysis. We selected CK, low selenium concentration Se1 (0.02 g/kg), and high selenium concentration Se2 (0.2 g/kg) to conduct analysis.

2.2. Determination of Physiological Indicators

To determine the height of the highland barley plant, use a tape measure to measure from the base of the plant, near the roots, straight up to the top of the plant. Select the maximum leaf length and width from 3 to 5 healthy leaves located near the top of the plant for measurement. Randomly select 10 plants from a single pot, and calculate the average values of the measured plant height, leaf length, and leaf width to represent the data for that pot. For the fresh weight measurement, select 10 highland barley seedlings with consistent growth, wash off any residual soil from the roots, blot the surface moisture with absorbent paper, and weigh the fresh weight using an electronic balance. Record this weight. Next, place the seedlings in an oven at 105 °C for 30 min to deactivate enzymes, then transfer them to an 80 °C oven to dry until reaching a constant weight, and weigh the dry weight for recording.
The chlorophyll content is determined using spectrophotometry [42]. The soluble sugar content was determined using the anthrone method [43]. Soluble protein content is measured using the Coomassie Brilliant Blue G-250 method [44]. Proline content is assessed using the acidic ninhydrin method [45]. The thiobarbituric acid method is employed to assess MDA content [46]. The content of hydrogen peroxide is determined using the xylenol orange method [47]. The production rate of O2·− is determined using the hydroxylamine hydrochloride method [48]. SOD activity is measured using the nitroblue tetrazolium photoreduction method [49]. POD activity is assessed using the guaiacol colorimetric method [50], and APX activity is determined using the hydrogen peroxide oxidation method [51]. The above reagents are all sourced from Qinghai Lainer Biotechnology in Xining, China.

2.3. Determination of Selenium Content

The preparation of samples for total selenium and inorganic selenium shall be conducted in accordance with Atomic Fluorescence Spectroscopy method. The determination of selenium shall follow GB/T 5009.93, which outlines the determination of selenium in foods using Method 1: Hydride Generation Atomic Fluorescence Spectrometry. Organic selenium is derived by subtracting inorganic selenium from total selenium. The calculation formula for the Se accumulation factor is the total selenium content of the measured plant or soil divided by the total Se content applied to the soil.

2.4. Transcriptome Sequencing and Analysis

The extraction of total RNA from samples, library construction, and transcriptome sequencing were outsourced to SHANGHAI BIOPROFILE TECHNOLOGY Company. The quality of the library was inspected using the Agilent 2100 Bioanalyzer (Santa Clara, CA, USA), followed by the measurement of both the total library concentration and the effective library concentration. Electrophoresis and gel imaging of the extracted RNA revealed clear and intact bands without smearing. The D260/D280 ratios ranged from 2.022~2.197, indicating that the extracted RNA was not degraded and met the requirements for sequencing and library construction. Paired-end (PE) sequencing was performed based on the Illumina sequencing platform. The raw data were filtered, and HISAT2, an upgraded version of TopHat2 (http://ccb.jhu.edu/software/hisat2/index.shtml, accessed on 1 December 2024), was used to align the filtered reads to the reference genome. Based on the alignment results, the expression level of each gene was calculated. Subsequently, differential expression analysis, enrichment analysis, and clustering analysis were conducted on the samples. The criteria for screening differentially expressed genes (DEGs) were |log2FoldChange| > 1 and a significance p-value < 0.05. We have summarized the transcript and FPKM of the genes used in our paper in Tables S6 and S7.

2.5. LC-MS/MS Analysis

Fifty milligrams of lyophilization sample was weighed, and then 200 μL of pre-cooled 80% methanol aqueous methanol solution (Millipore, Burlington, MA, USA) along with two steel beads were added. The tissue was homogenized and disrupted using a tissue disruptor at low temperature. Next, 800 μL of pre-cooled 80% methanol aqueous solution was added, the mixture was vortexed to mix, and sonicated (Diagenode, Liege, Belgium) in an ice bath for 20 min. The mixture was allowed to stay at −20 °C for 2 h, then centrifuged (Eppendorf, Hamburg, Germany) at 16,000× g at 4 °C for 20 min, and the supernatant was collected. The supernatant was dried using a high-speed vacuum concentrator (Eppendorf, Hamburg, Germany). Finally, the sample was redissolved in 100 μL of 50% methanol aqueous solution, centrifuged at 20,000× g at 4 °C for 15 min, and the supernatant was collected for mass spectrometry injection (AB SCIEX, Marlborough, MA, USA) analysis. Each sample was analyzed using electrospray ionization (ESI) in both positive ion (+) and negative ion (−) modes. The samples were separated by ultra-performance liquid chromatography (UPLC) (Shimadzu, Kyoto, Japan) and subsequently subjected to mass spectrometry analysis utilizing the QTRAP 5500 mass spectrometer (AB SCIEX), with ionization performed via the heated electrospray ionization (HESI) source. The parameters for the QTRAP 5500 ESI source were as follows: In positive ion mode, the source temperature was set to 550 °C, Ion Source Gas 1 (GAS1) was set at 40 °C, Ion Source Gas 2 (GAS2) was set at 50 °C, Curtain Gas (CUR) was set at 35 °C, and Ion Spray Voltage Floating (ISVF) was set at 5500 V. In negative ion mode, the source temperature remained at 550 °C, with Ion Source Gas 1 (GAS1) set at 40 °C, Ion Source Gas 2 (GAS2) set at 50 °C, Curtain Gas (CUR) set at 35 °C, and Ion Spray Voltage Floating (ISVF) set at −4500 V. The multiple reaction monitoring (MRM) mode was employed to detect the target ion pairs.

2.6. qRT-PCR for Gene Expression Validation

To determine the reliability of transcriptome data, quantitative reverse transcription polymerase chain reaction (qRT-PCR) was performed on the samples in a 96-well plate of iQ5 (Bio Rad, Hercules, CA, USA). Gene-specific primers were designed using Primer Premier 5 software and synthesized by BGI Corporation (Beijing, China), with EF1-α as the internal standard gene. Each qRT-PCR reaction contained 6.8 μL of RNase-free dH2O, 0.4 μL of the forward and reverse primers, 10 μL of 2 × SYBR real-time PCR premixture, 0.4 μL of Rox reference Dye II, and 2 μL of diluted cDNA. The amplification program was initiated by one cycle of 95 °C for 5 min, then followed by 40 cycles composed of 95 °C for 15 s and 60 °C for 30 s, and was finally completed with a melting curve analysis procedure. The relative expression level was calculated using the comparative 2−ΔΔCt method [52]. Three biological replicates were used for the qRT-PCR analysis.

2.7. Data Statistics

All the data are expressed as the mean values of three biological triplicates ± standard errors. One-way ANOVA was performed to compare the control and Se-treated groups using IBM SPSS Statistics 27. Multiple comparisons were performed using the least significant difference (LSD) test for significant differences. The figures were created using Origin 2024, OmicShare, and Adobe Illustrator 2024.

3. Results

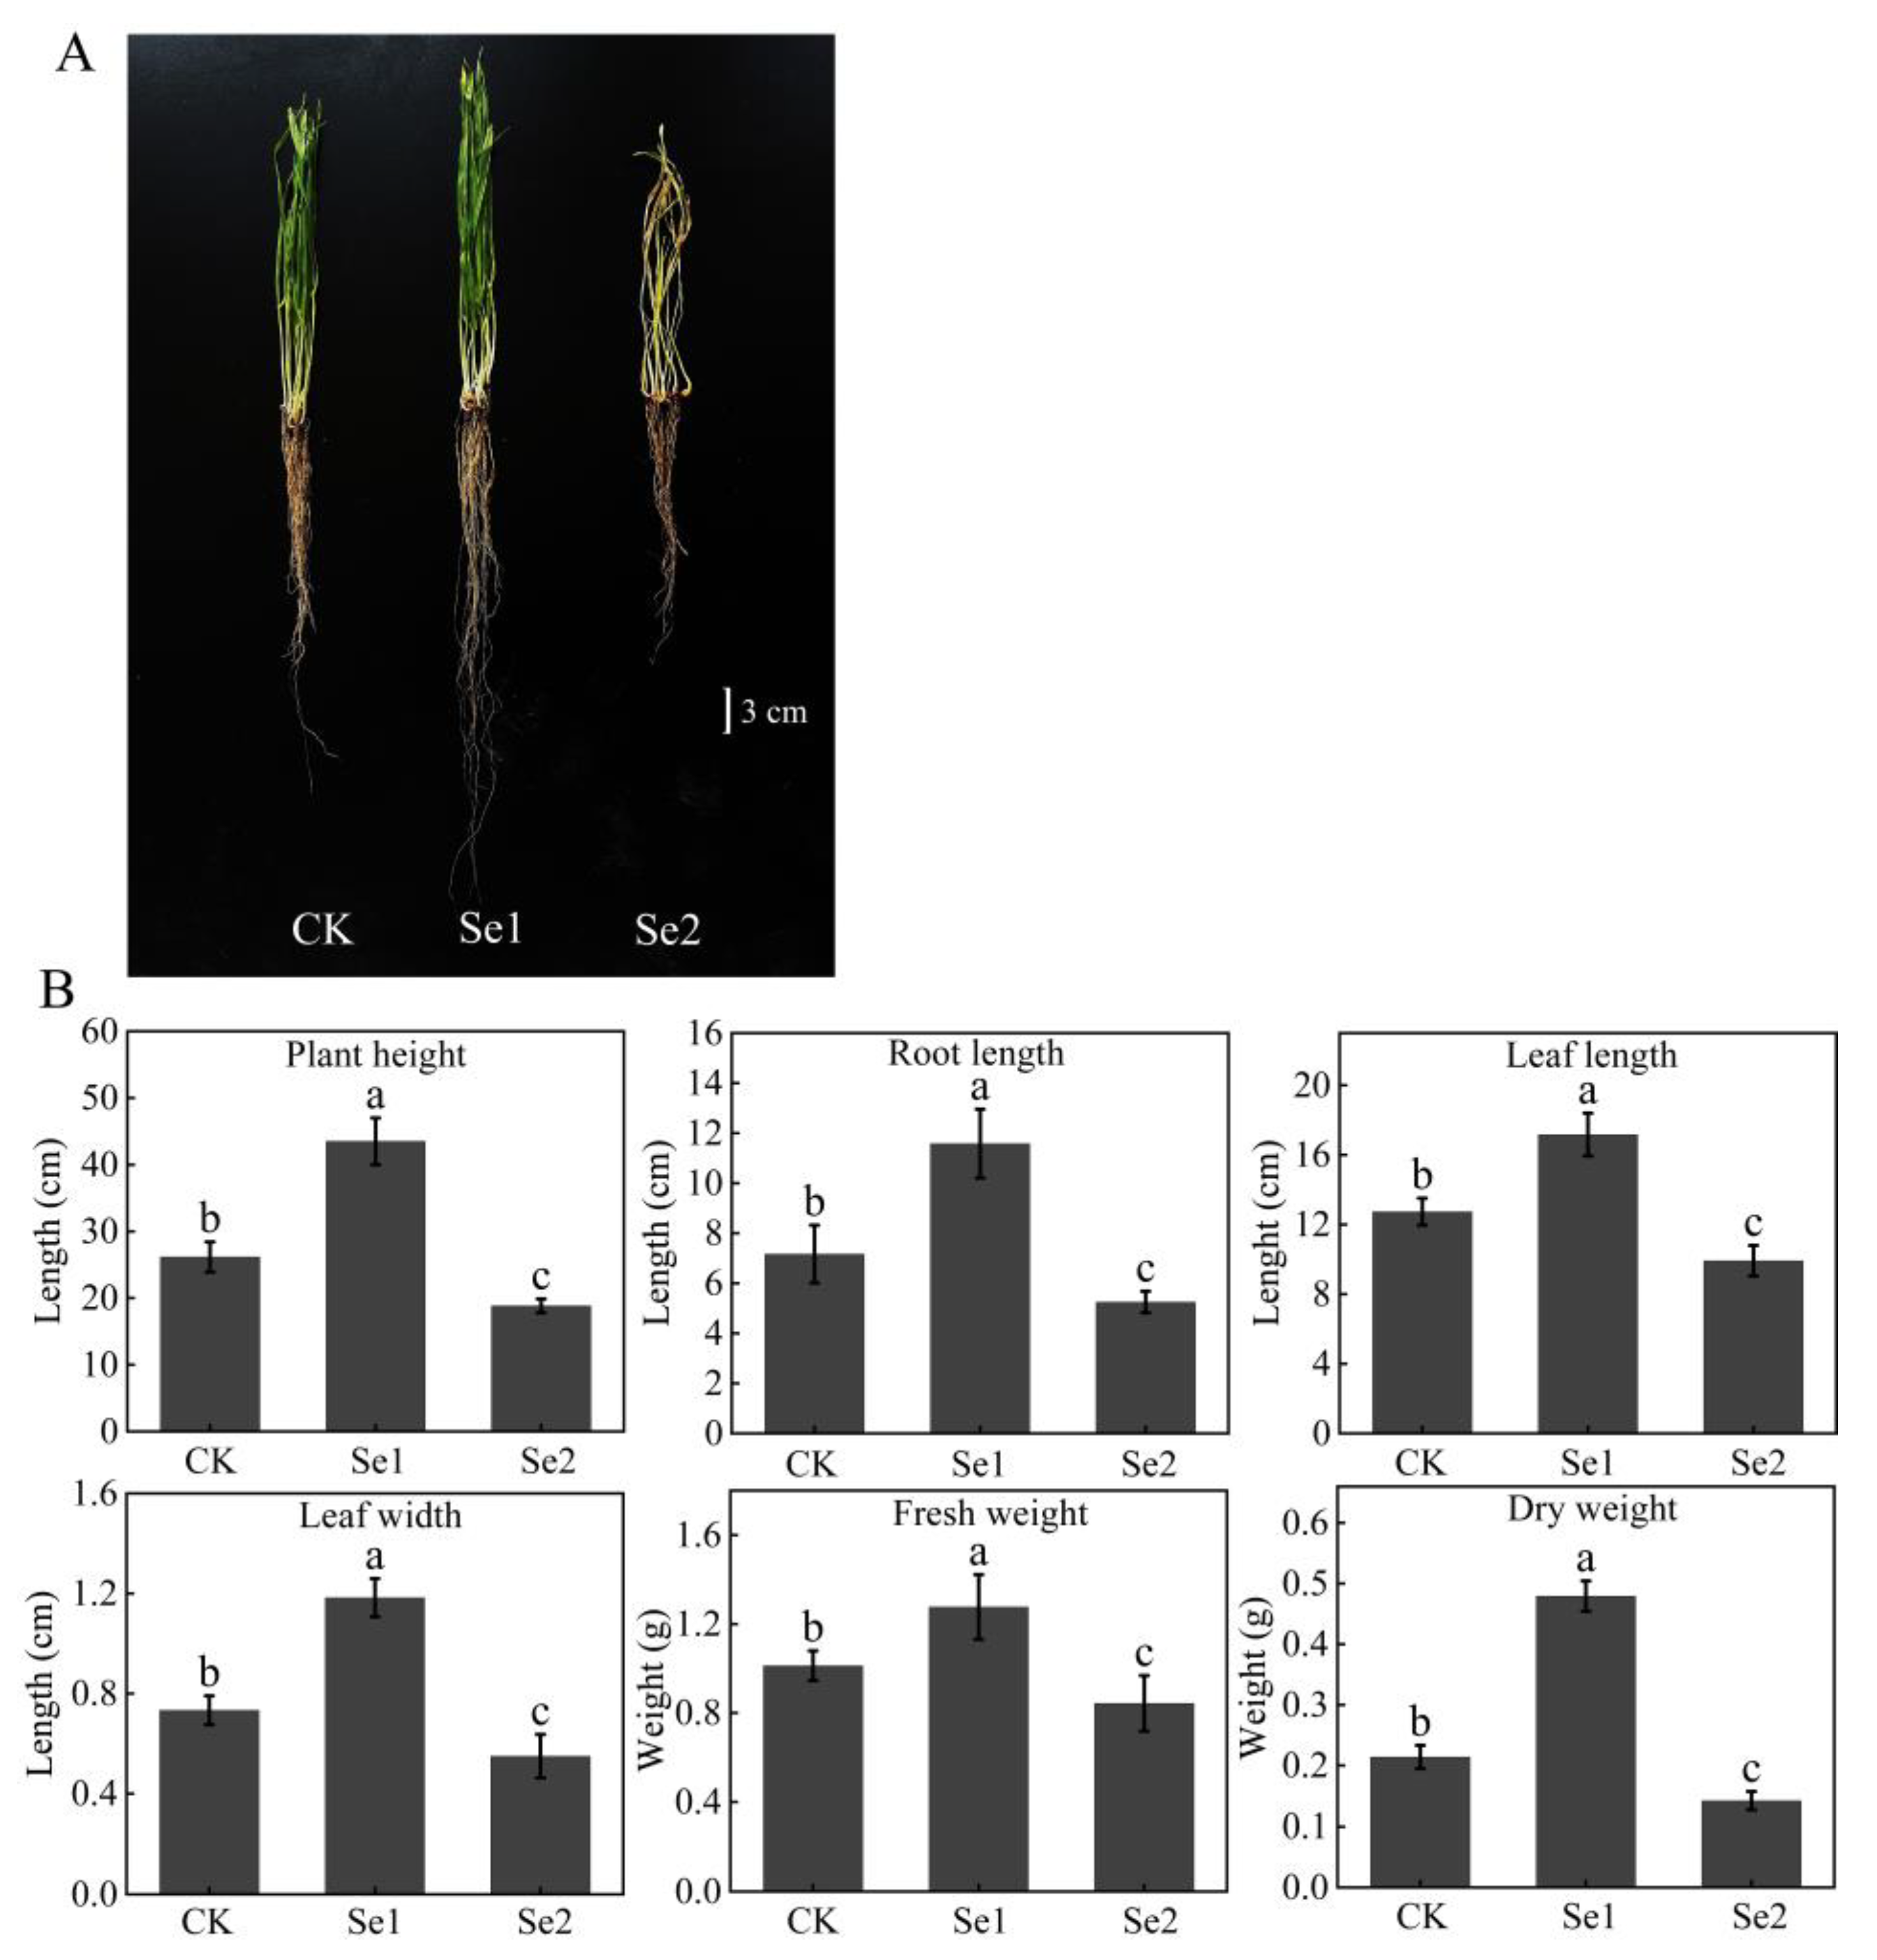
3.1. Growth Effects of Highland Barley Seedlings Under Na2SeO3 Treatment

The growth of highland barley seedlings was significantly influenced by different concentrations of Na2SeO3 (Figure 1). Compared to the CK, the growth of highland barley seedlings was enhanced under the Se1 treatment with 0.02 g/kg Na2SeO3 (Figure 1A). The plant height, root length, and leaf length under Se1 treatment were significantly greater than those of CK, with increases of 66%, 62%, and 35%, respectively (p < 0.05, Figure 1B). Additionally, the leaf width, fresh weight, and dry weight were significantly higher than those of CK, with increases of 62%, 26%, and 124%, respectively (p < 0.05, Figure 1B).
In contrast to the CK, the growth of highland barley seedlings subjected to the Se2 treatment with 0.2 g/kg Na2SeO3 was inhibited (Figure 1A). The seedlings displayed symptoms such as wilting, leaf yellowing, and senescence, ultimately resulting in abnormal growth. The plant height, root length, and leaf length under the Se2 treatment were significantly lower than those of the CK, exhibiting decreases of 28%, 27%, and 22%, respectively (p < 0.05, Figure 1B). Additionally, the leaf width, fresh weight, and dry weight were markedly lower than those of the CK, with decreases of 25%, 17%, and 34%, respectively (p < 0.05, Figure 1B). These findings suggest that a low concentration of Se1 can promote the growth of highland barley seedlings, whereas a high concentration of Se2 can inhibit growth and even induce toxicity symptoms in the plants. The growth and development of highland barley seedlings under Se1 treatment were promoted, while those under Se2 treatment were inhibited.

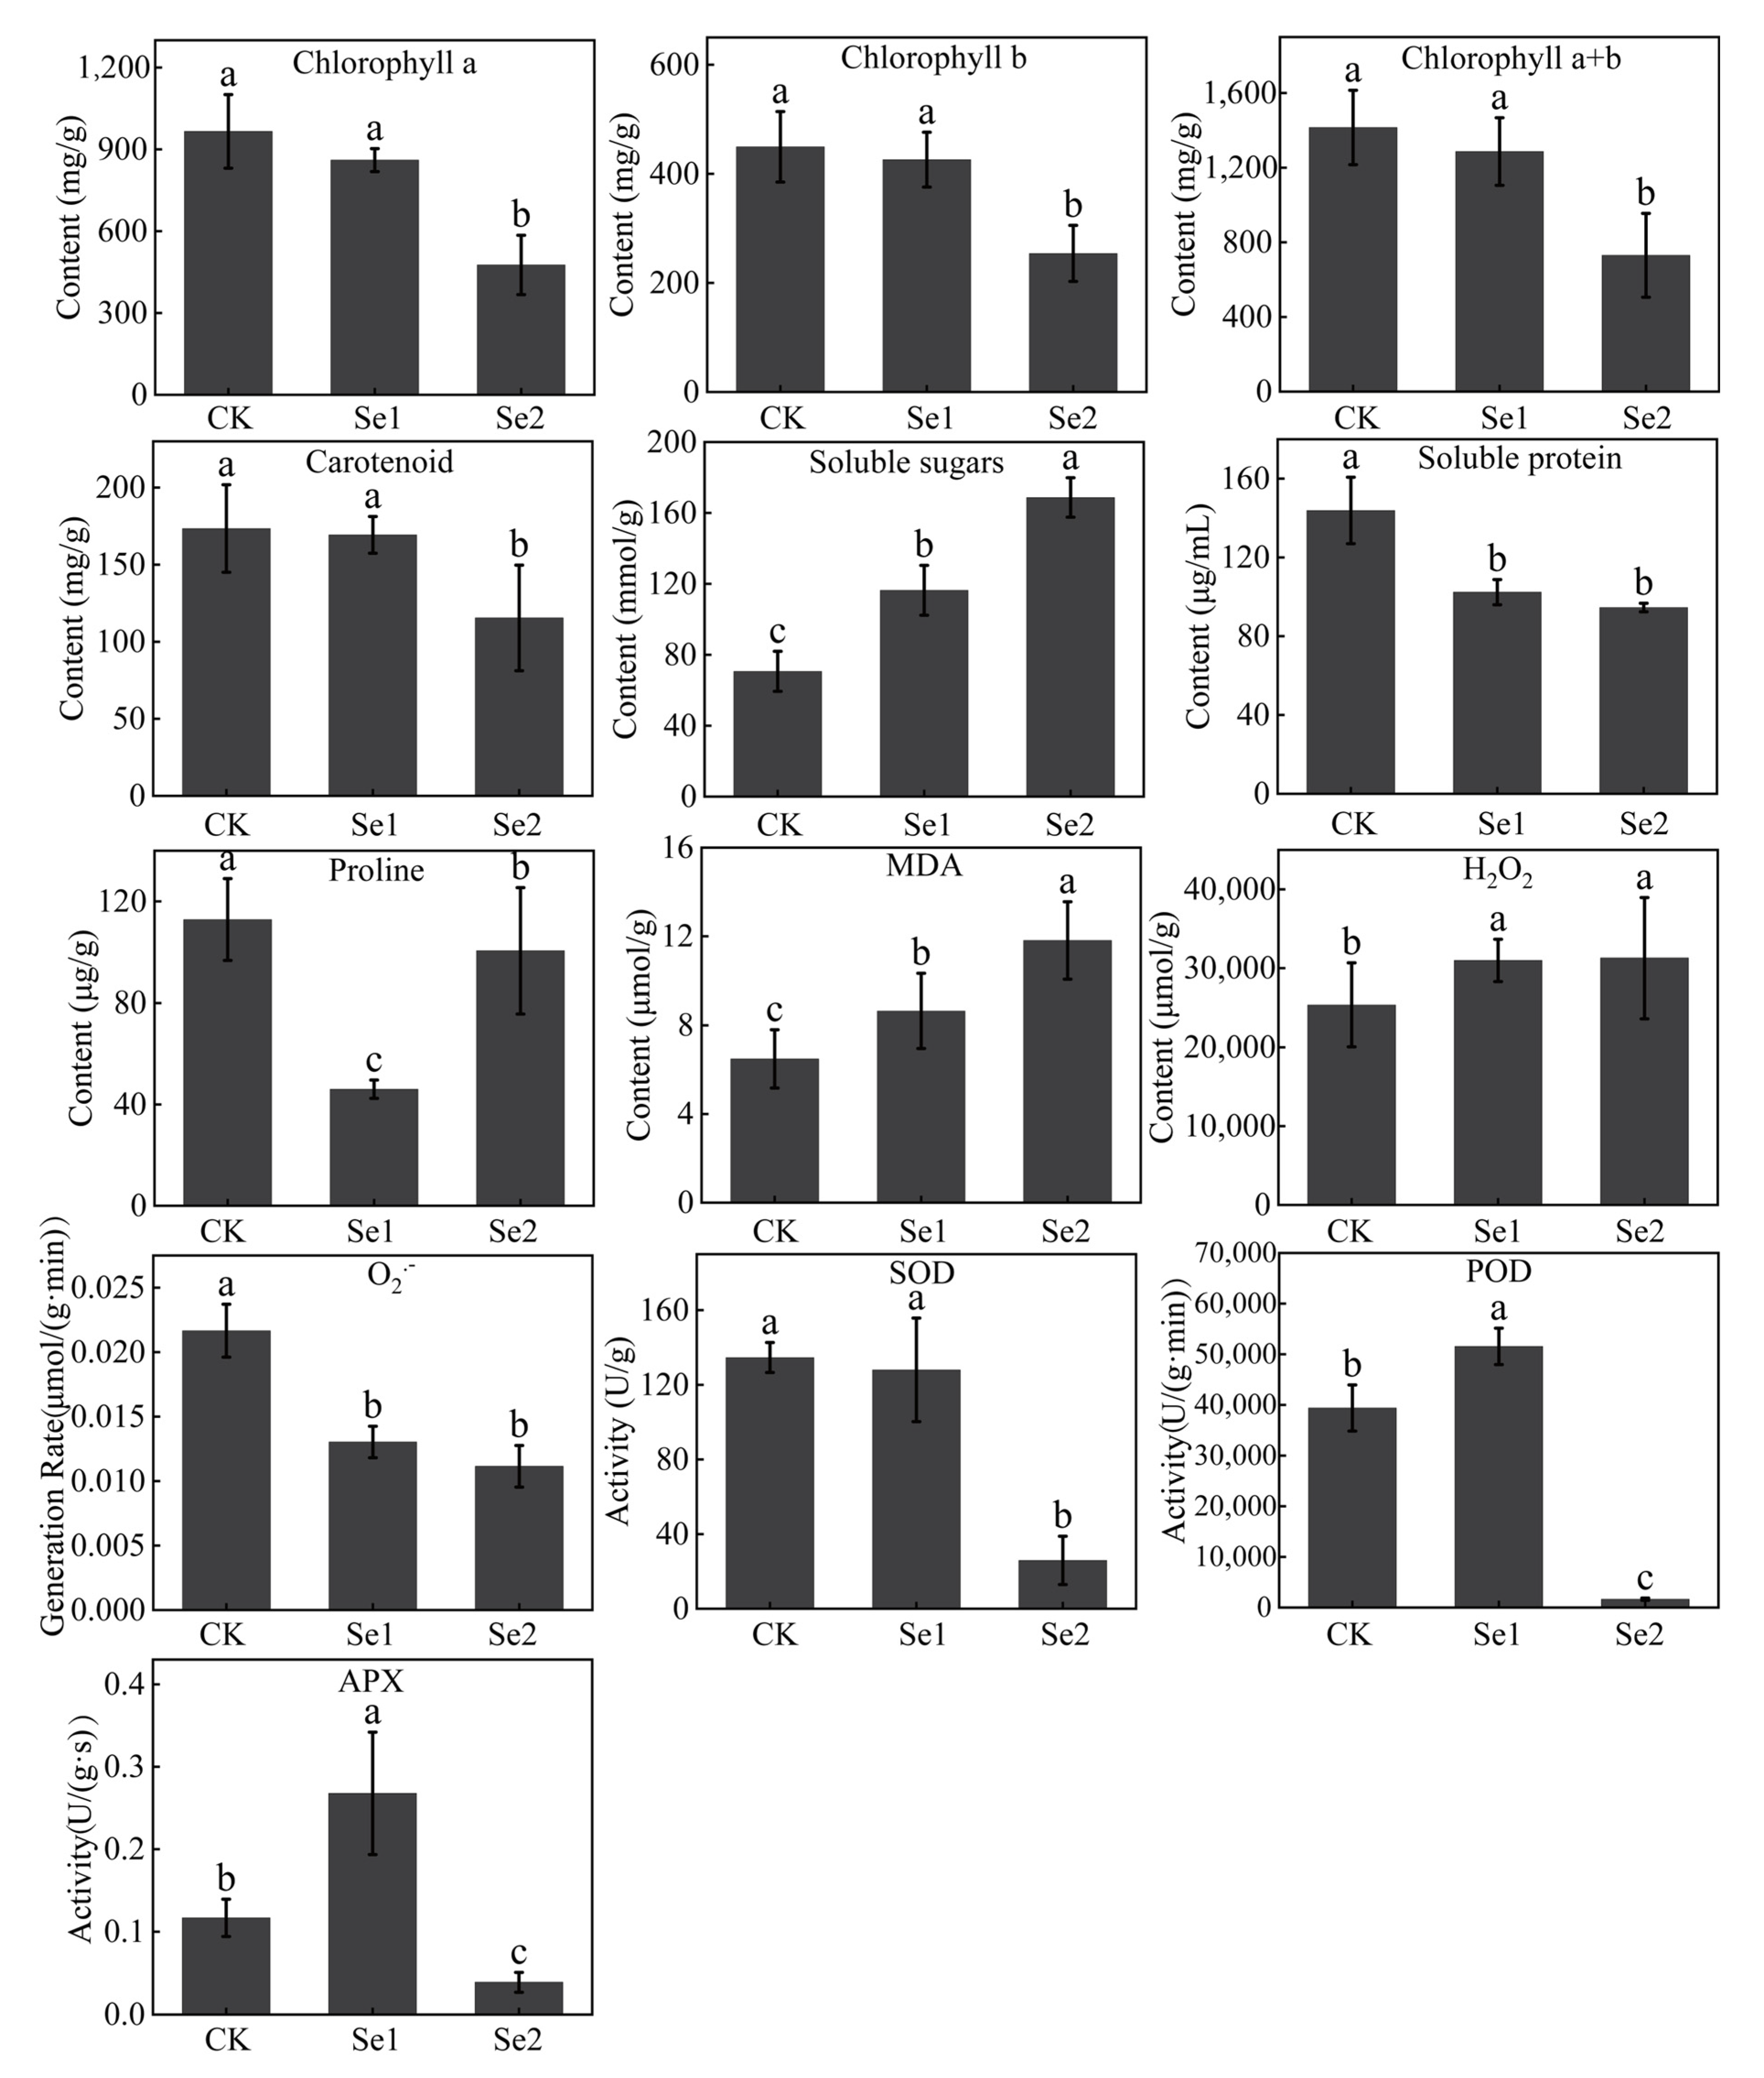
3.2. Physiological Effects of Highland Barley Seedlings Under Na2SeO3 Treatment

We investigated and evaluated the physiological indicators of highland barley seedlings subjected to Na2SeO3 treatment. As illustrated in Figure 2, thirteen physiological indicators, including chlorophyll content, soluble sugar content, proline content, and enzyme activity, were measured and analyzed. The results indicated that, compared to the CK, there were no significant changes in chlorophyll content and superoxide dismutase (SOD) activity under the Se1 treatment. However, both chlorophyll content and SOD activity under the Se2 treatment showed significant decreases of 33~51% and 81%, respectively (p < 0.05, Figure 2). With increasing concentrations of Na2SeO3, the soluble sugar content, malondialdehyde (MDA) content, and hydrogen peroxide (H2O2) content exhibited increasing trends of 65~139%, 33~82%, and 22~23%, respectively (p < 0.05, Figure 2). In contrast, the soluble protein content and O2 production rate displayed decreasing trends of 29~34% and 40~49%, respectively (p < 0.05, Figure 2). The activities of peroxidase (POD) and ascorbate peroxidase (APX) initially increased by 31% and 129%, respectively, before declining by 96% and 67%, respectively (p < 0.05, Figure 2). In summary, under Se2 treatment, the pigment content and antioxidant enzyme activity in highland barley seedlings were significantly decreased, while MDA content, soluble sugar, and H2O2 content were significantly increased.

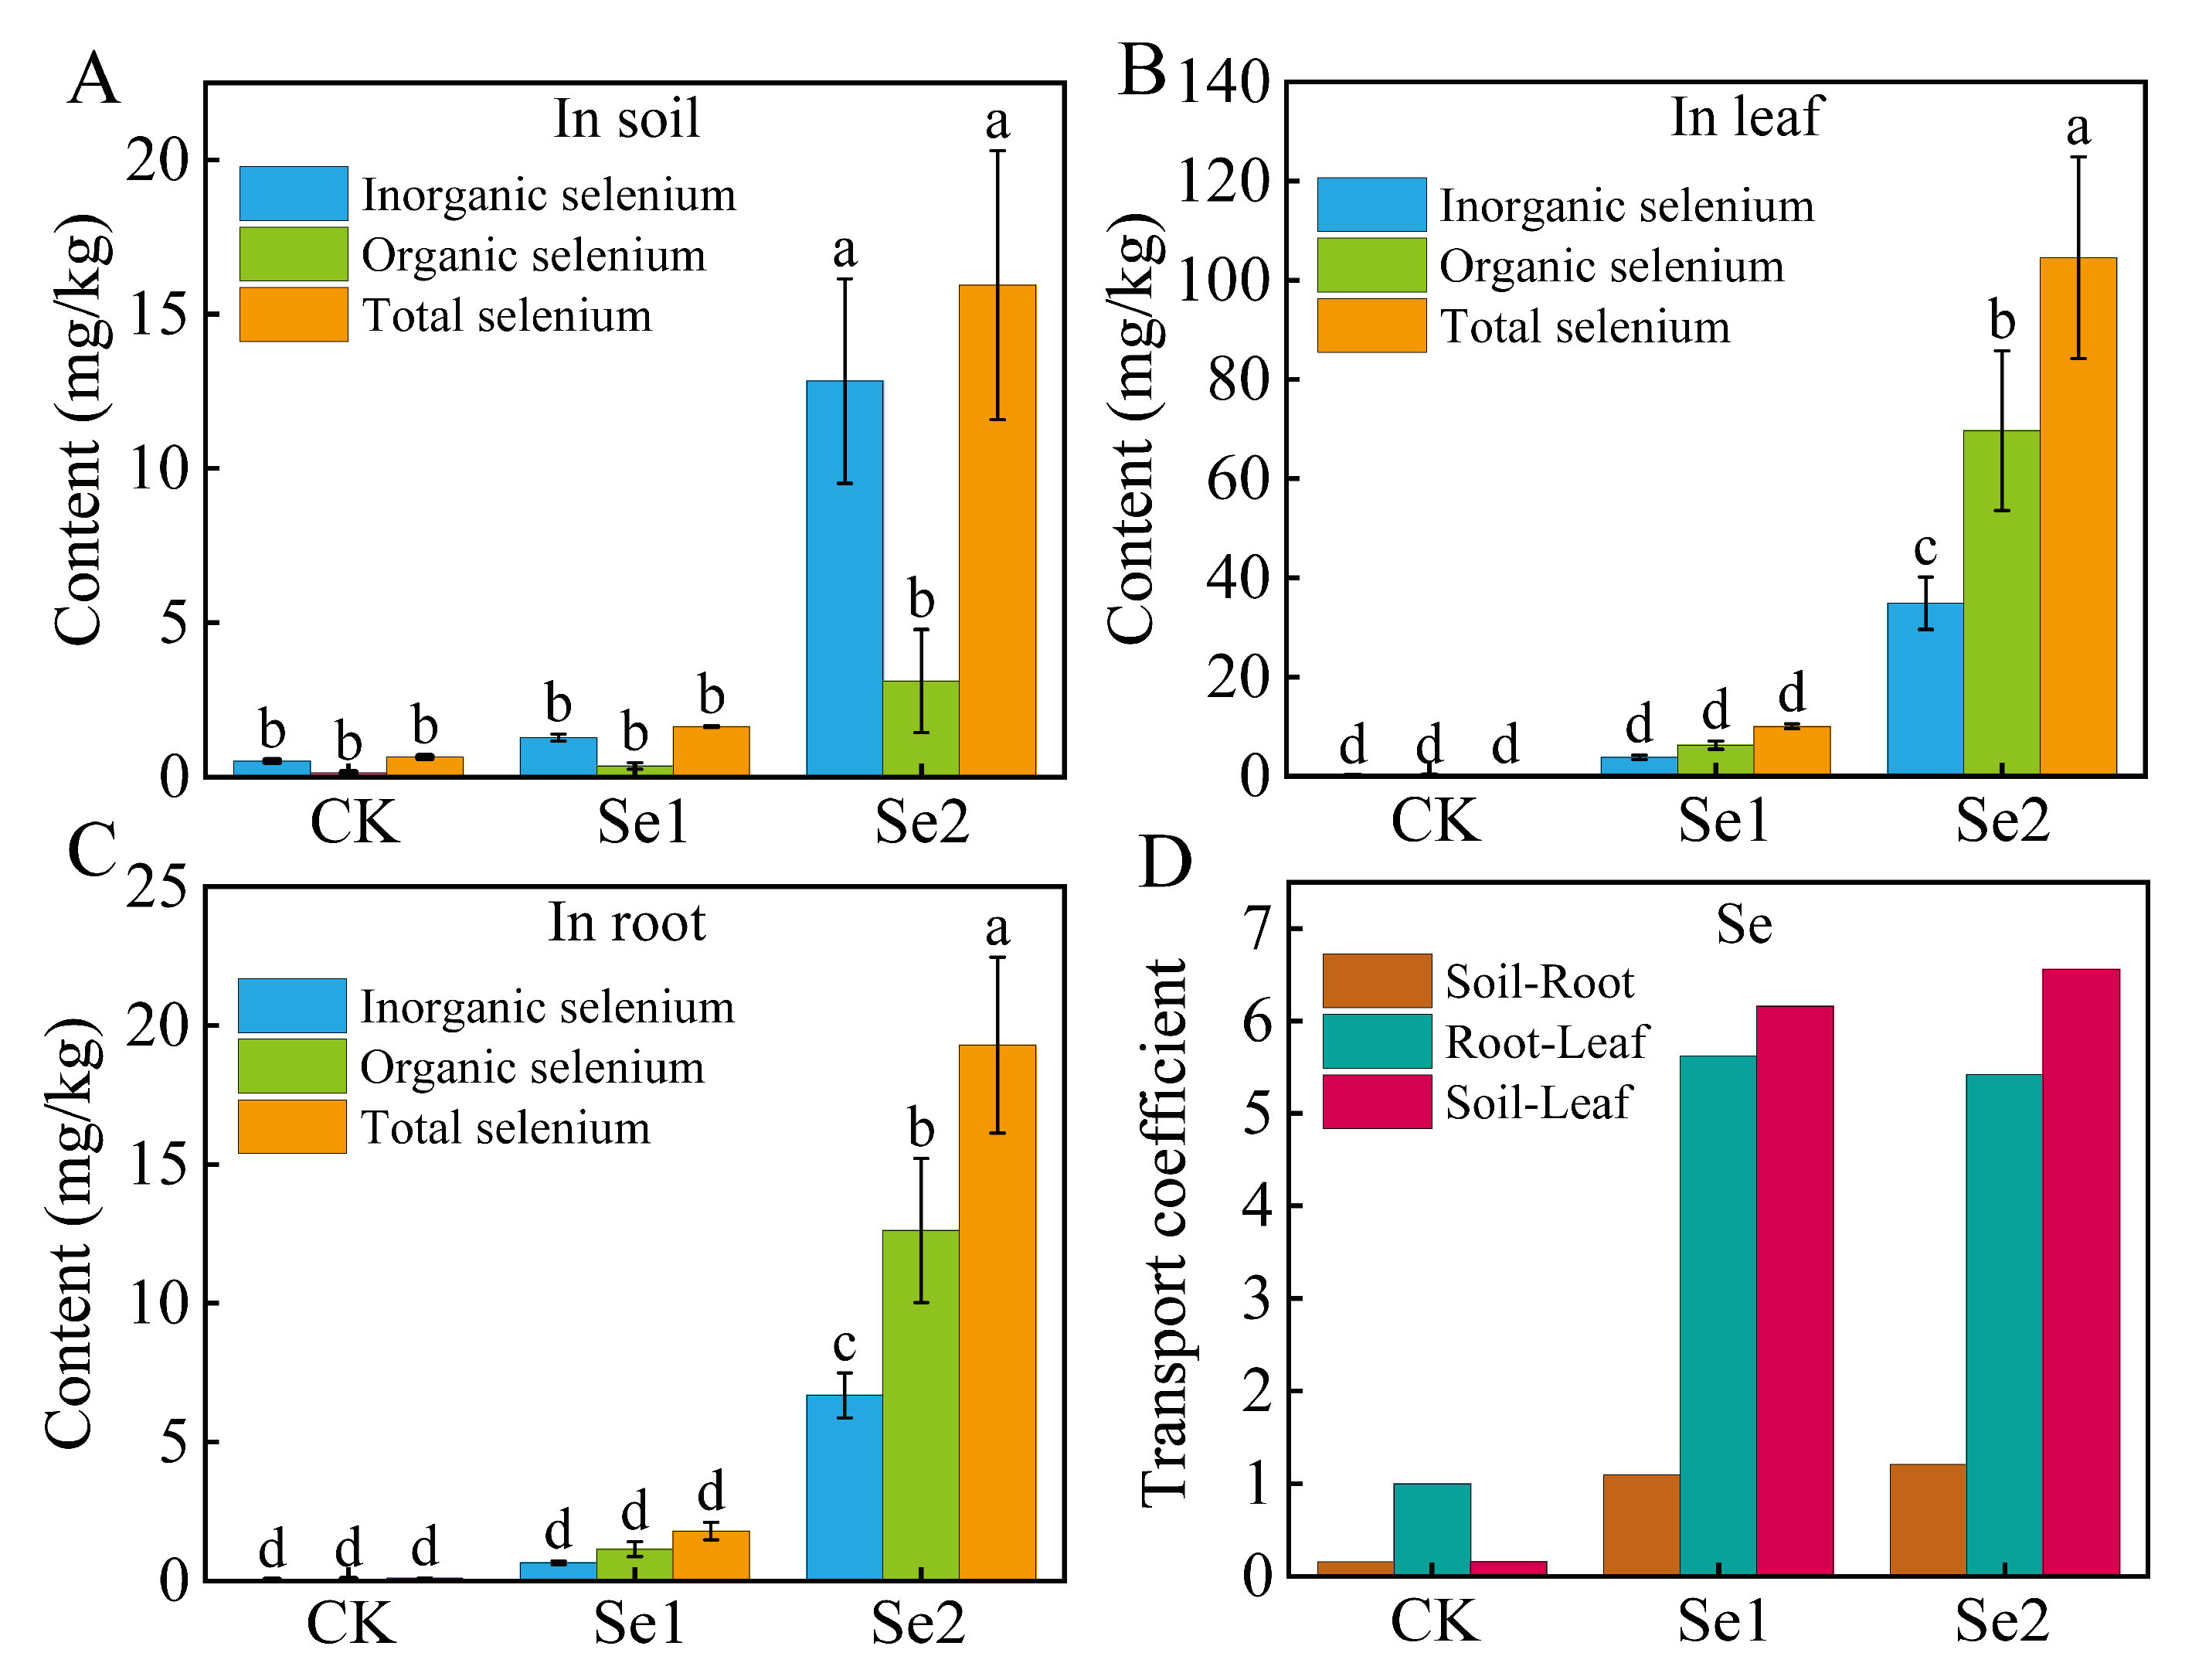
3.3. Selenium Content and Transport Coefficient of Soil and Highland Barley Seedlings Under Na2SeO3 Treatment

This study investigated the contents of inorganic selenium, organic selenium, and total selenium in both soil and highland barley seedlings (Figure 3). Compared to the CK, the contents of inorganic selenium, organic selenium, and total selenium in the soil under Se1 treatments increased and did not reach a statistically significant level (Figure 3A). In contrast, under Se2 treatment, the inorganic selenium and total selenium content in the soil increased from 0.51 mg/kg and 0.649 mg/kg to 13 mg/kg and 16 mg/kg, respectively (p < 0.05, Figure 3A).
Compared to the control group, the content of inorganic selenium was increased from 0.04 mg/kg to 35 mg/kg, organic selenium was increased from 0.06 mg/kg to 70 mg/kg, and total selenium was increased from 0.103 mg/kg to 105 mg/kg in the leaves under Se2 treatments (p < 0.05, Figure 3B). Similarly, the content of inorganic selenium was increased from 0.04 mg/kg to 7 mg/kg, organic selenium was increased from 0.07 mg/kg to 13 mg/kg, and total selenium was increased from 0.103 mg/kg to 20 mg/kg in the roots under Se2 treatments (p < 0.05, Figure 3C).
The transport coefficient of selenium reflects its mobility within plant and soil systems (Figure 3D). Notably, significant differences in the migration coefficients of selenium were observed among the soil, roots, and leaves of highland barley seedlings. In the CK, the migration coefficients from soil to root, from root to leaf, and from soil to leaf were 0.158, 1.001, and 0.158, respectively (Figure 3D). Under Se1 treatment, the migration coefficients from soil to root, from root to leaf, and from soil to leaf were 1.096, 5.618, and 6.157, respectively (Figure 3D). Under Se2 treatment, the migration coefficients from soil to root, from root to leaf, and from soil to leaf were 1.210, 5.419, and 6.558, respectively (Figure 3D). Under Se1 treatment, the Se accumulation factor in soil or plant was 0.0283 or 0.2057, respectively. Under Se2 treatment, the Se accumulation factor in soil or plant was 0.0276 or 0.2149, respectively. There was no significant change in the Se accumulation factor of plants or soil.
Overall, with the increase in selenium treatment concentration, the selenium content in the leaves and roots of highland barley seedlings was gradually increased significantly. Under Se1 and Se2 treatments, the selenium transfer coefficient from soil to leaves was the highest, followed by roots to leaves.

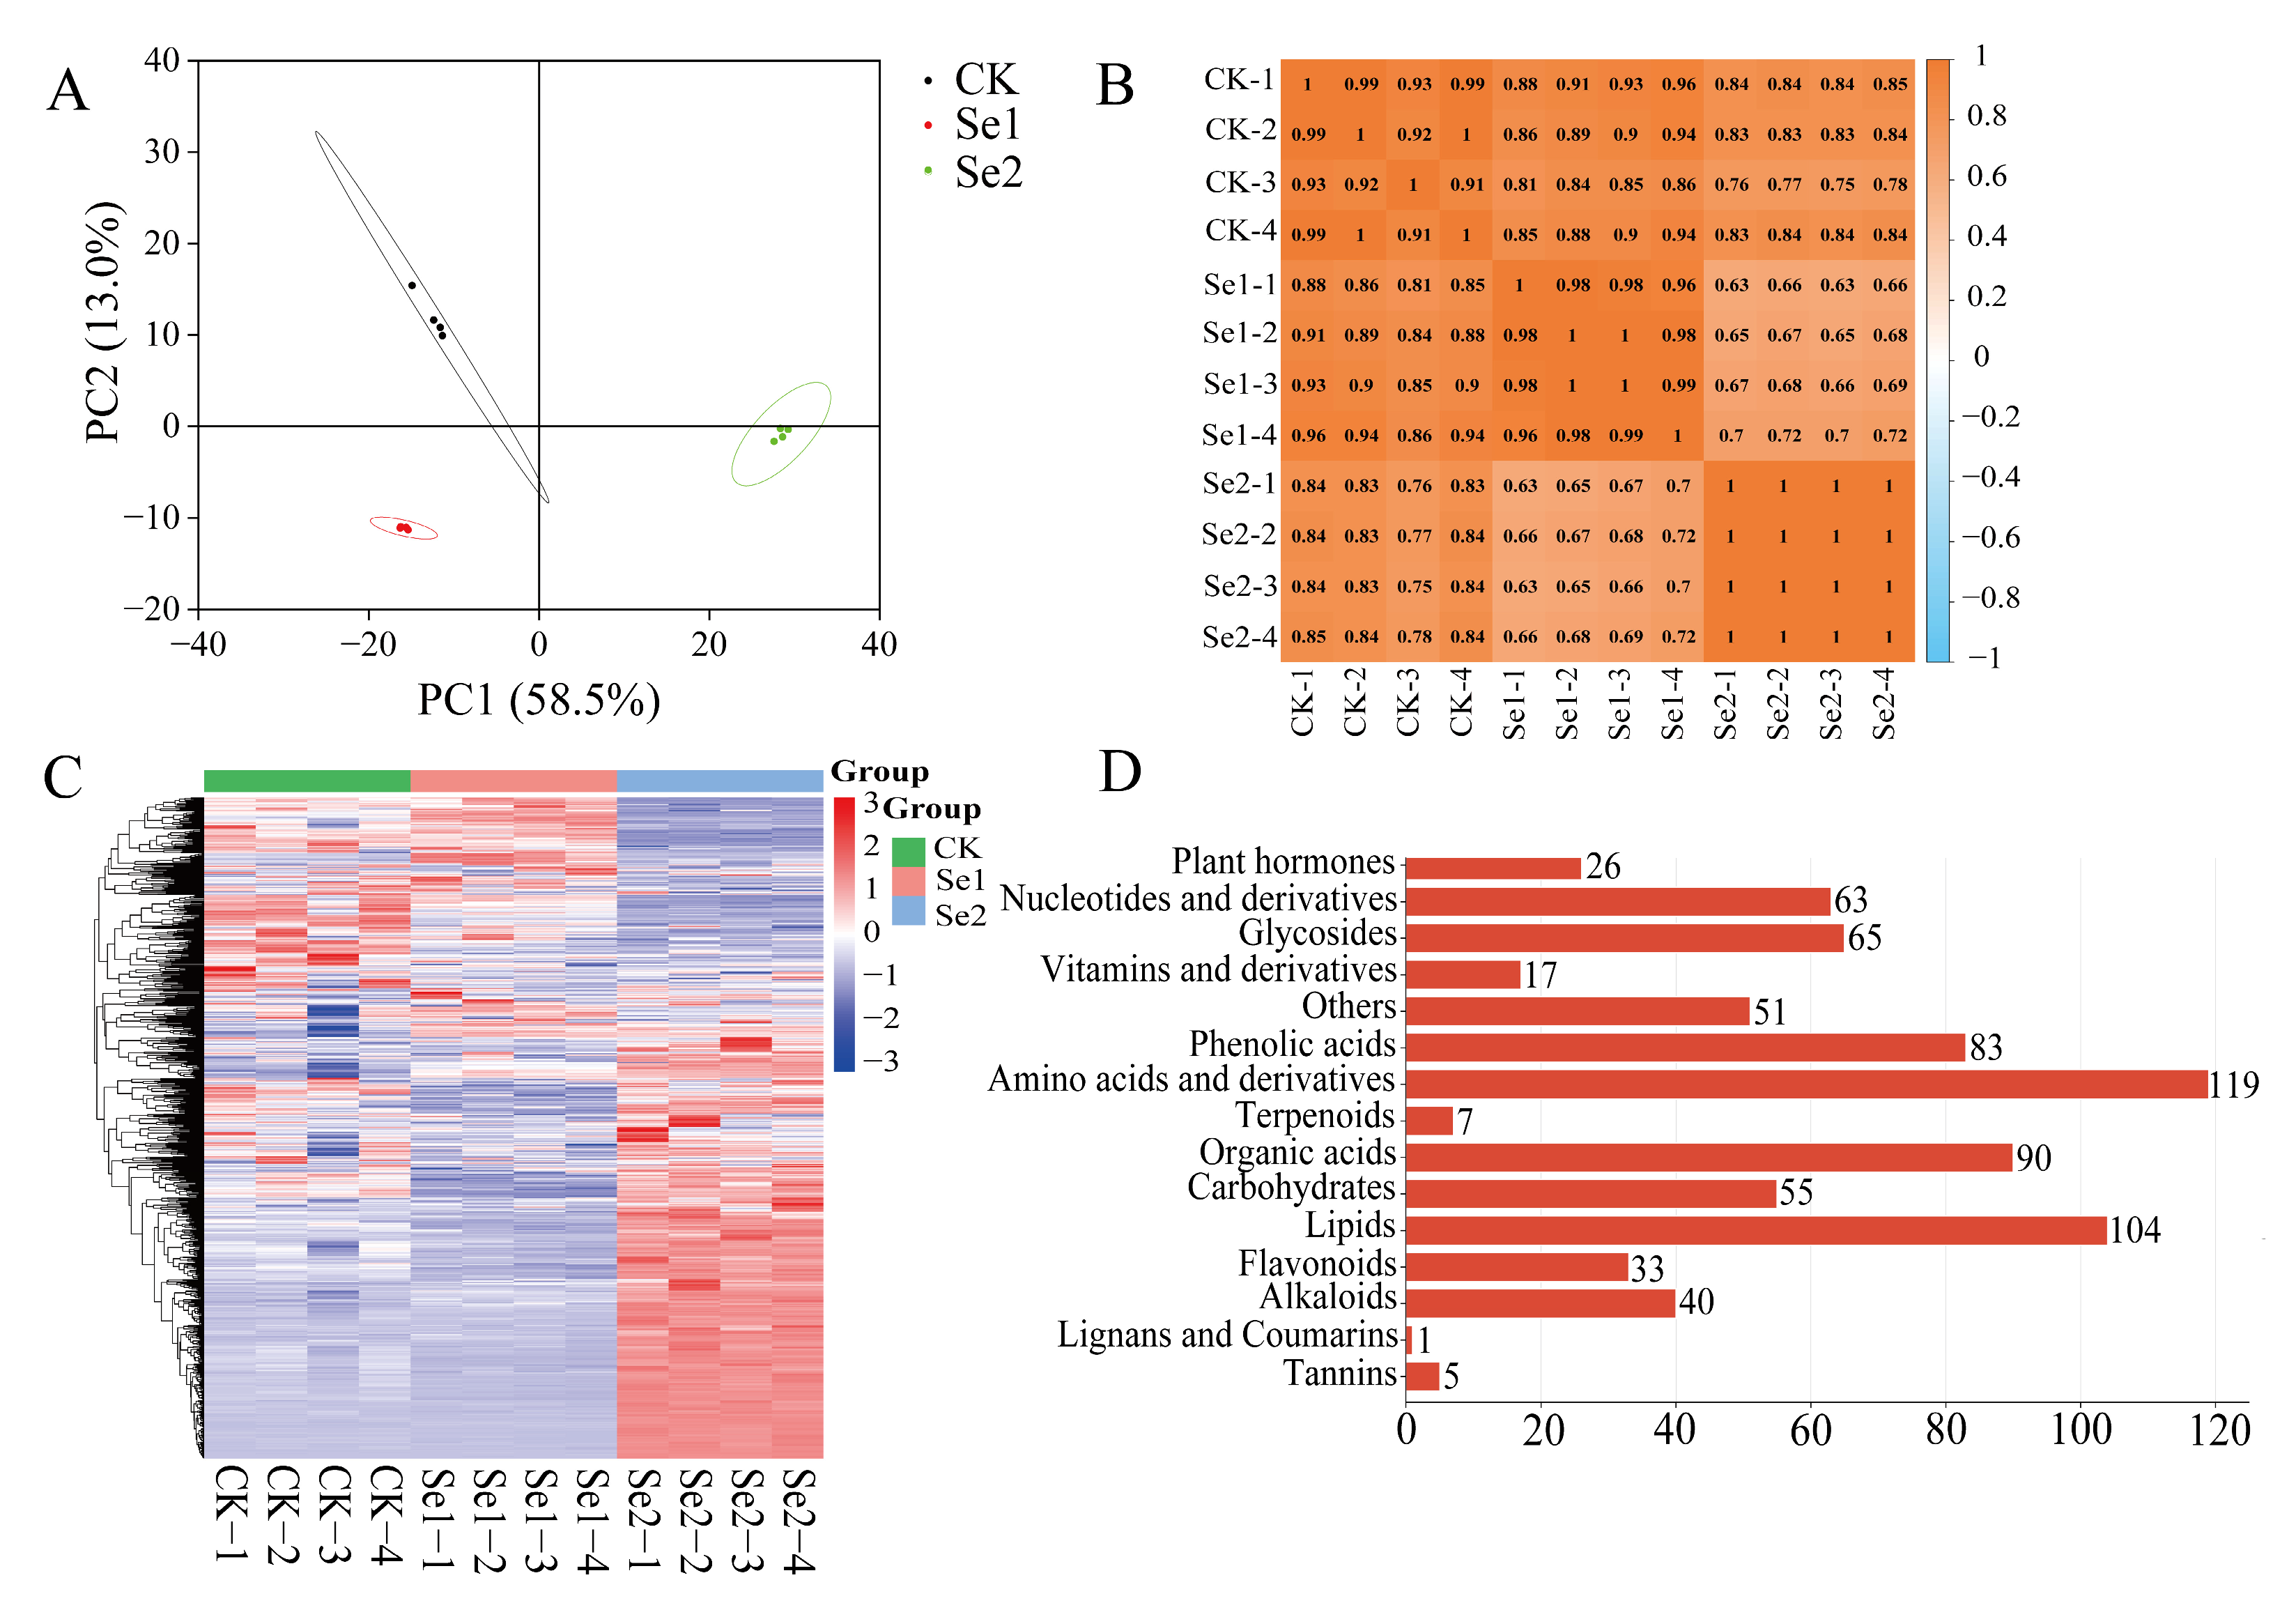
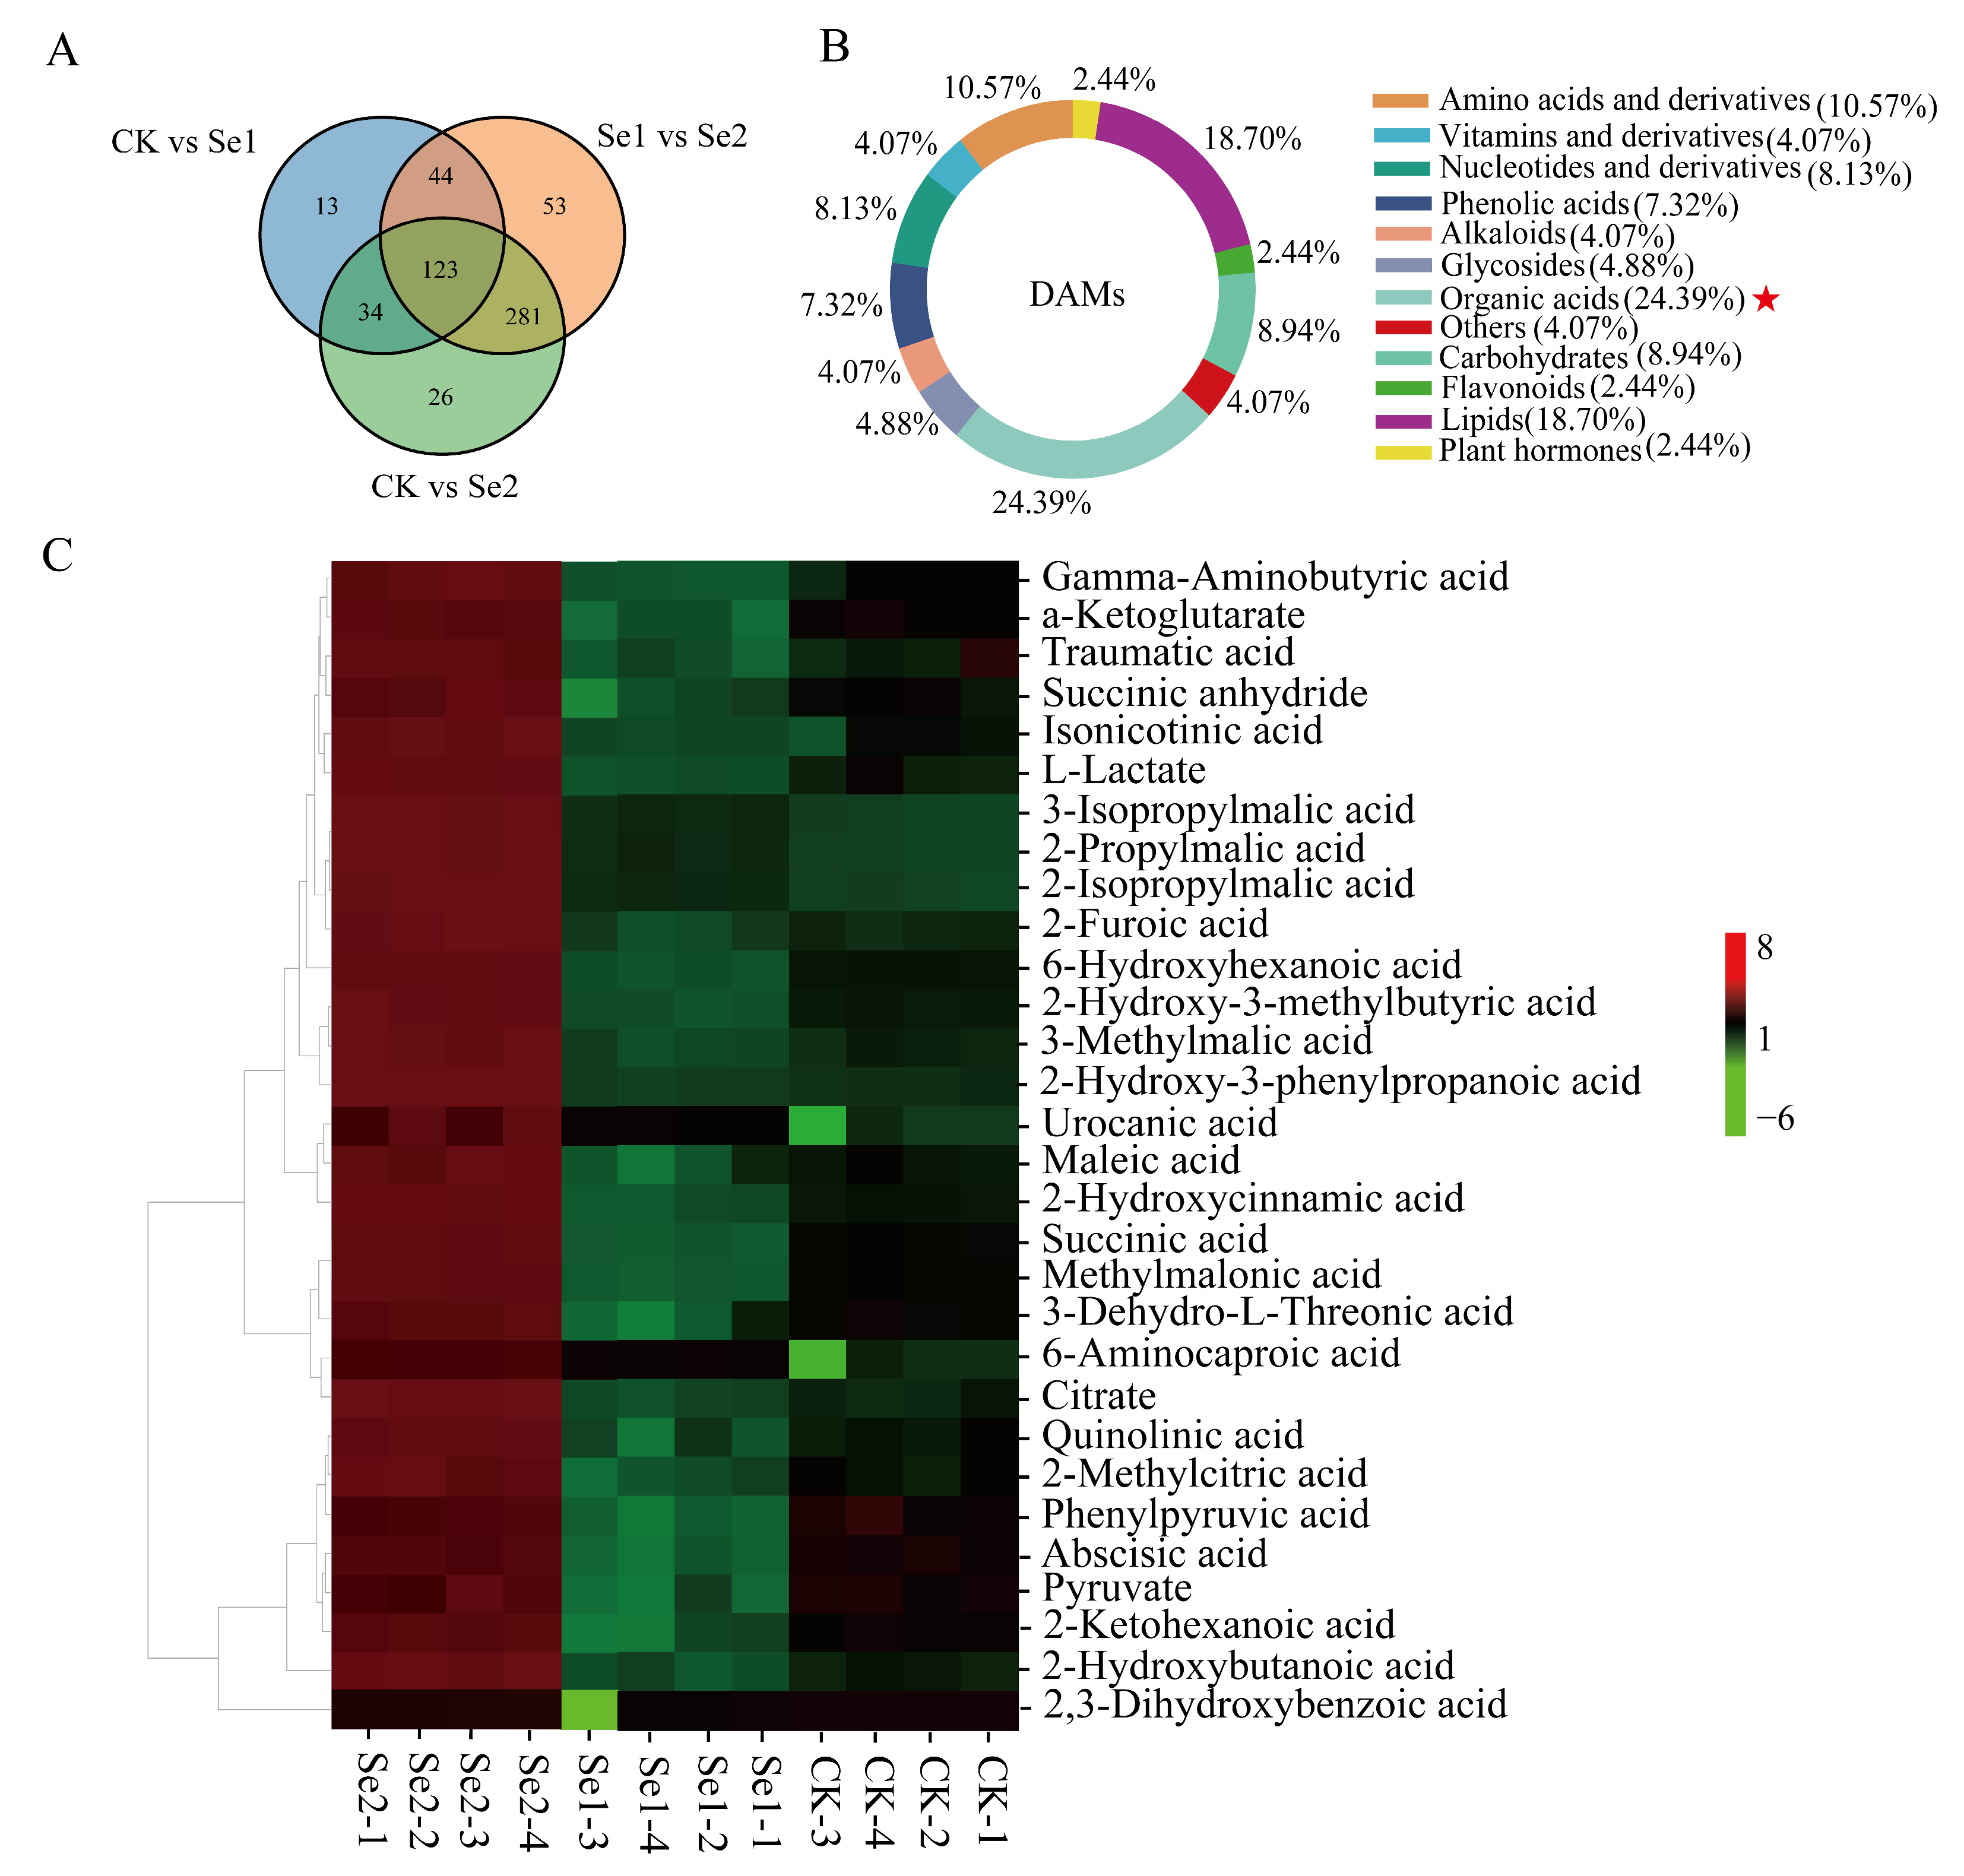
3.4. Metabonomic Analysis of Highland Barley Seedlings Under Na2SeO3 Treatment

To further investigate the molecular mechanisms underlying the effects of various selenium concentrations on highland barley seedlings, we conducted a non-targeted metabolomic analysis of the aboveground samples from seedlings treated with Na2SeO3. Principal component analysis (PCA) was utilized to assess the overall distribution trends among the samples and to evaluate the degree of variation both within and between sample groups. The PCA results revealed significant differences in metabolite profiles among the three sample groups (Figure 4A). The first principal component accounted for 58.5% of the metabolic variance, effectively differentiating between CK, Se1, and Se2. The second principal component explained 13.0% of the variance and highlighted a notable separation among CK, Se1, and Se2. This indicated that the metabolic characteristics within the same groups were similar, while there were substantial distinctions among different groups. Furthermore, correlation analysis demonstrated that the correlation within groups was significantly higher than that between different groups, thereby confirming the stability and reliability of the metabolomic data from seedlings treated with Na2SeO3 (Figure 4B).
A total of 759 metabolites were identified in the samples treated with CK, Se1, and Se2. The cluster heat map indicated significant alterations in the abundance patterns of these metabolites across the different treatment samples (Figure 4C). These metabolites were primarily categorized into 15 groups, including 119 amino acids and their derivatives, 104 lipids, 90 organic acids, 83 phenolic acids, 65 glycosides, and 63 nucleotides along with their derivatives (Figure 4D, Table S1). In metabolomics analysis, around two-thirds of metabolites increased and one-third of metabolites decreased under Se2 treatment.

3.5. Thirty DAMs of Organic Acids in Highland Barley Seedlings Under Na2SeO3 Treatment

Differentially abundant metabolites (DAMs) were identified using the criteria of VIP > 1 and p value < 0.05. Unique differential metabolites included 13 in the comparison of Se1 vs. CK, 53 in Se1 vs. Se2, and 26 in Se2 vs. CK. A total of 123 DAMs coexisting among the three groups were identified (Figure 5A). These 123 DAMs were categorized into 12 groups: organic acids (30) accounting for 24.39%, lipids (23) for 18.70%, amino acids and their derivatives (13) for 10.57%, carbohydrates (11) for 8.94%, nucleotides and their derivatives (10) for 8.13%, phenolic acids (9) for 7.32%, glycosides (6) for 4.88%, alkaloids (5) for 4.07%, others (5) for 4.07%, vitamins and their derivatives (5) for 4.07%, flavonoids (3) for 2.44%, and plant hormones (3) for 2.44% (Figure 5B, Table S2).
Thirty DAMs of organic acids in highland barley seedlings treated with Na2SeO3 were screened (Table S3). We further analyzed the heatmap of 30 DAMs of organic acids. Compared with the CK, 5 compounds (2-Isopropylmalic acid, 3-Isopropylmalic acid, 2-Propylmalic acid, Urocanic acid, and 6-Aminocaproic acid) increased in content, and the other 25 compounds declined under Se1 treatment. The contents of 30 compounds all greatly rose under Se2 treatment (Figure 5C). The correlation between 30 organic acid metabolites and the levels of total selenium, organic selenium, and inorganic selenium in the aerial parts was analyzed (Figure S2). The results indicated that 30 metabolites exhibited a highly significant positive correlation with selenium content, with correlation coefficients ranging from 0.788~0.988 ((p < 0.05, p < 0.01, p < 0.001, Figure S2).

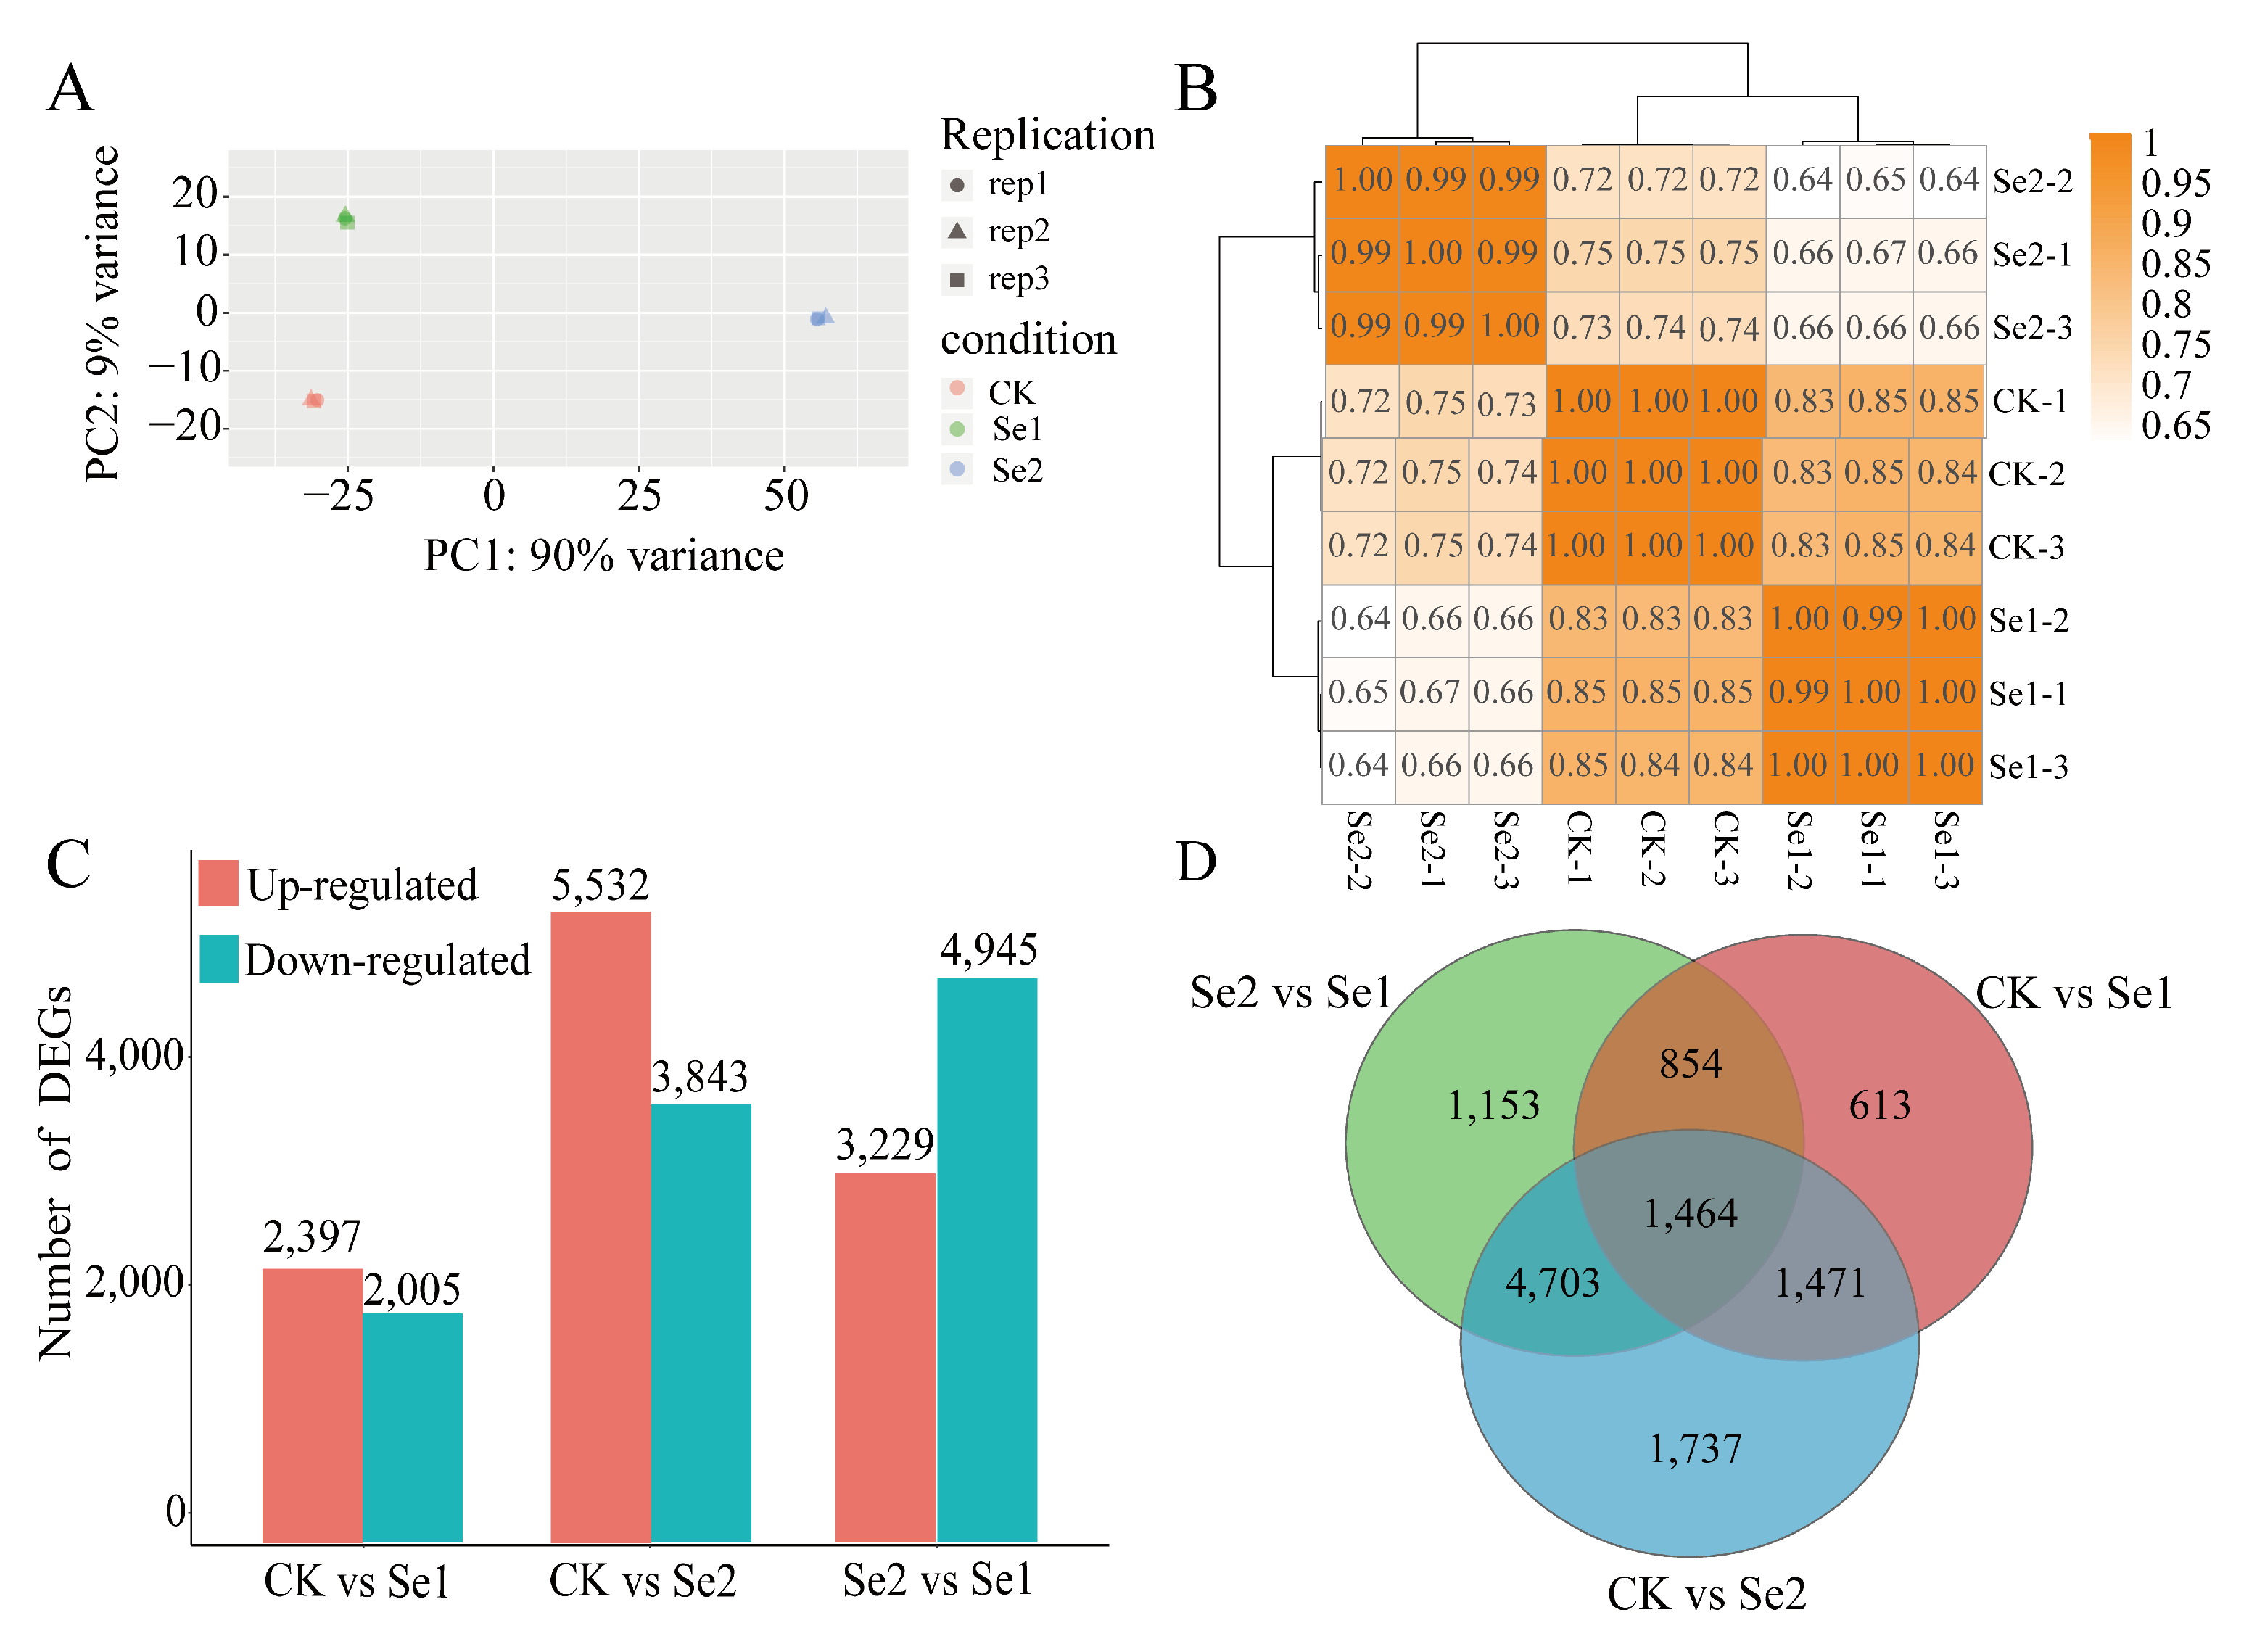
3.6. Transcriptome Analysis of Highland Barley Seedlings Under Na2SeO3 Treatment

To gain a comprehensive understanding of the transcriptomic changes in highland barley seedlings under varying selenium concentrations, transcriptome sequencing was conducted using the same samples as in the metabolomic analysis to assess gene expression alterations across the CK, Se1, and Se2 groups. Nine libraries were constructed, and after the removal of adapter-containing and low-quality reads, an average of approximately 47.85 million clean reads per library was obtained. The Q30 values for each library exceeded 96.14%, with over 94.81% of the clean reads mapping to the highland barley reference genome, indicating that the quality of the transcriptome data was sufficiently high for subsequent analyses (Table S4). To preliminarily examine the transcriptional differences between the non-treatment control and selenium treatments, principal component analysis (PCA) based on RNA-seq data was performed. The first principal component accounted for 90% of the variance among the samples, effectively distinguishing CK from Se1 and Se2. The second principal component explained 9% of the variance, leading to a notable spatial separation of CK and Se2 from Se1 (Figure 6A). Additionally, the Pearson correlation coefficient demonstrated a strong correlation within the CK, Se1, and Se2 treatment groups (Figure 6B). The correlation coefficient within the same treatment ranged from 0.99~1, while the correlation coefficient between different treatments ranged from 0.64~0.85 (Figure 6B).
DEGs were identified using a threshold of |log2FC| > 1 and p < 0.05. An overview of gene expression responses to selenium treatment is presented below. A total of 4402 DEGs were identified between CK and Se1, comprising 2397 up-regulated and 2005 down-regulated genes (Figure 6C). In contrast, 9375 genes were expressed between CK and Se2, with 5532 up-regulated and 3843 down-regulated genes (Figure 6C). The number of up-regulated genes in Se2 compared to CK was significantly greater than that in Se1 compared to CK, indicating a more pronounced response to selenium at elevated levels (Figure 6C). A Venn diagram was constructed to examine the DEGs across different treatments. It was found that there were 613 unique DEGs in CK vs. Se1, 1737 in CK vs. Se2, and 1153 in Se1 vs. Se2. Additionally, 1464 DEGs were coexistent among CK, Se1, and Se2 (Figure 6D).

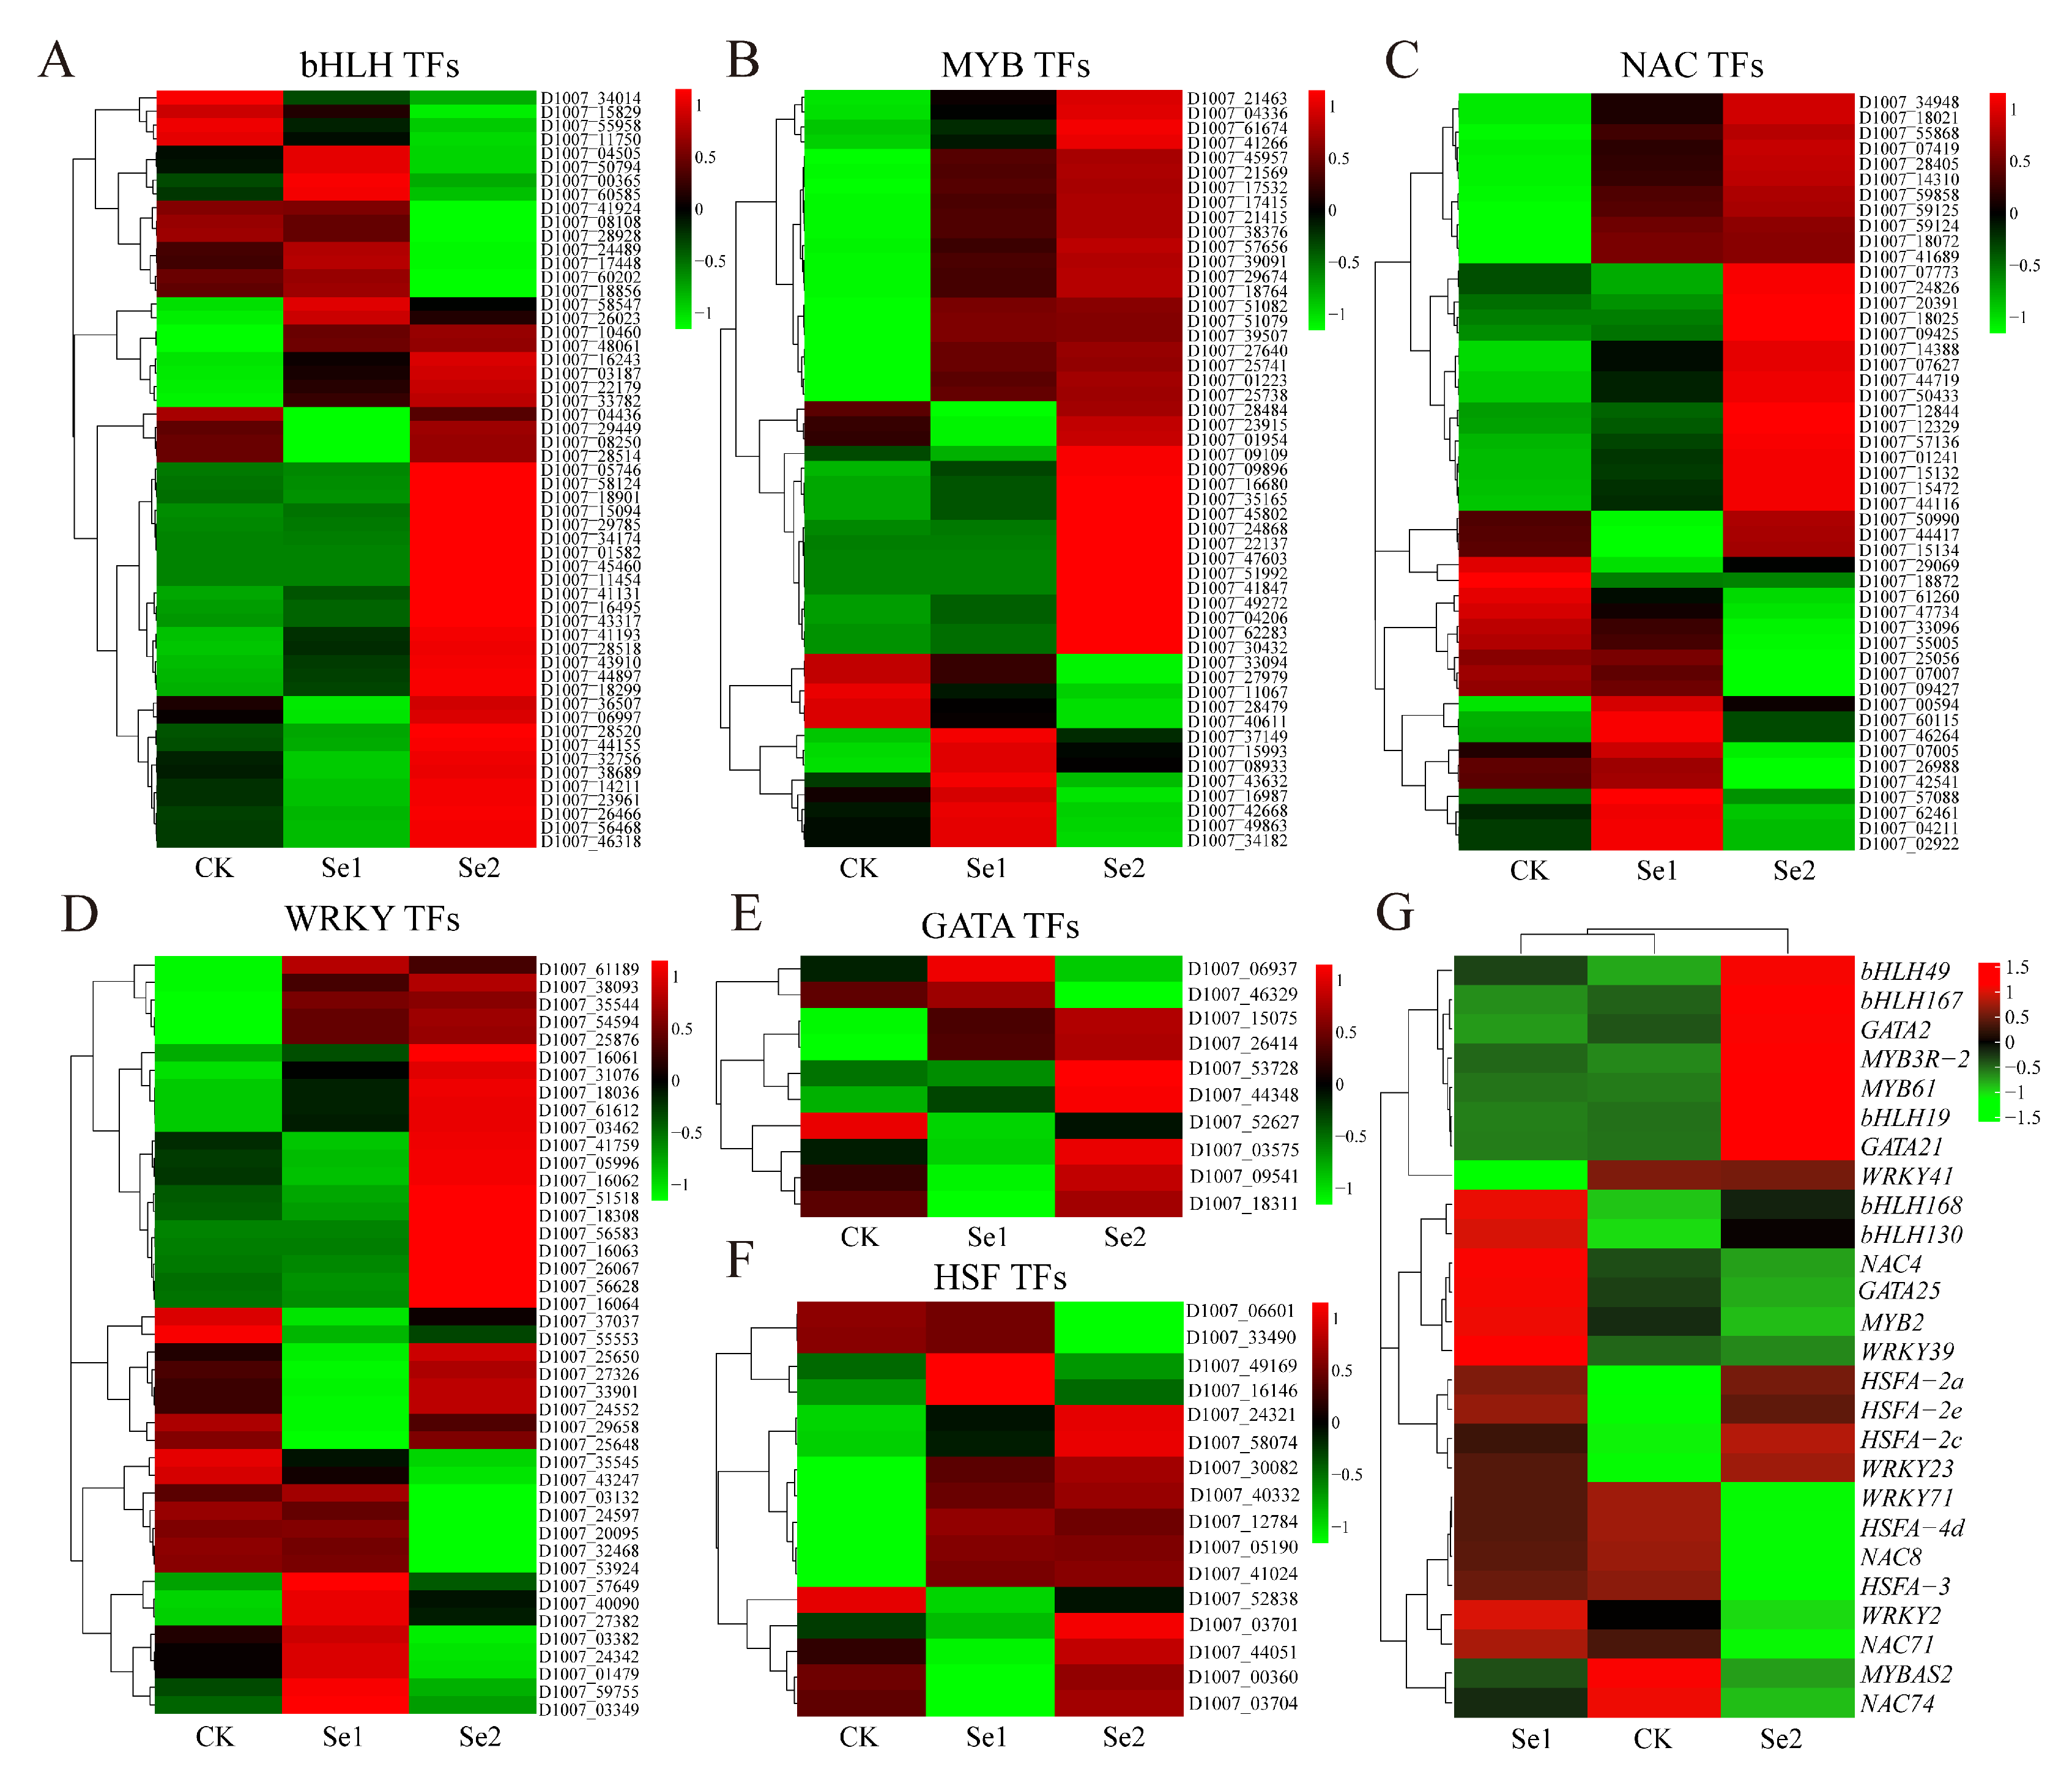
3.7. Differential Expression of Transcription Factors of Highland Barley Seedlings Under Na2SeO3 Treatment

Transcription factors are important upstream regulatory elements that can directly modulate the expression levels of genes responding to exogenous treatments, thus playing a crucial role in plants’ responses to abiotic stresses. In this study, we identified a total of 2306 genes classified as transcription factors across 55 families (Table S5). Among these families, the bHLH (Figure 7A) transcription factors comprised 55 DEGs, the MYB (Figure 7B) family contains 51 DEGs, the NAC (Figure 7C) family included 49 DEGs, the WRKY (Figure 7D) family has 43 DEGs, the GATA (Figure 7E) family consists of 10 DEGs, and the HSF (Figure 7F) family encompassed 16 DEGs; the FPKM values are shown in Table S6.
Heatmaps were created for DEGs associated with six transcription factor families: bHLH, MYB, NAC, WRKY, GATA, and HSF. Compared to the CK and Se1, the number of highly expressed genes in each transcription factor family under Se2 treatment was the highest. For instance, compared to the control group, under Se2 treatment, the expression levels of 39 genes in the bHLH family showed increases ranging from 0.43-fold to 178-fold, while the expression levels of 16 genes showed decreases ranging from 0.19-fold to 0.81-fold (Figure 7A). Similarly, the expression levels of 41 genes in the MYB family showed increases ranging from 0.27-fold to 720-fold, whereas the expression levels of 10 genes showed decreases ranging from 0.34-fold to 0.88-fold (Figure 7B). In summary, under Se2 treatment, more than two-thirds of the transcription factors showed high expression.
Based on cluster analysis of all differentially expressed genes in six transcription factor families under different concentrations of Na2SeO3 treatment, we selected 26 genes with significant differences in FPKM with varying Na2SeO3 concentrations (Figure 7G, Table S7). The resulting 26 DEGs were mapped and analyzed using a cluster heatmap. Each gene exhibited a specific response to selenium concentration, suggesting their distinct roles in the physiological processes of highland barley seedlings in response to varying levels of selenium. The results indicated that bHLH168, bHLH130, NAC4, GATA25, MYB2, WRKY39, WRKY2, HSFA-2e, and NAC71 genes were highly expressed under Se1 treatment, whereas bHLH49, bHLH167, GATA2, MYB3R-2, MYB61, bHLH19, GATA21, HSFA-2c, and WRKY23 genes were highly expressed under Se2 treatment (Figure 7G). This finding highlights selenium concentration as a crucial factor influencing the expression of these genes. Additionally, the results revealed that WRKY41 was expressed at low levels under Se1 treatment, while WRKY71, HSFA-4d, NAC8, HSFA-3, WRKY2, NAC71, MYBAS2, and NAC74 genes were expressed at low levels under Se2 treatment.

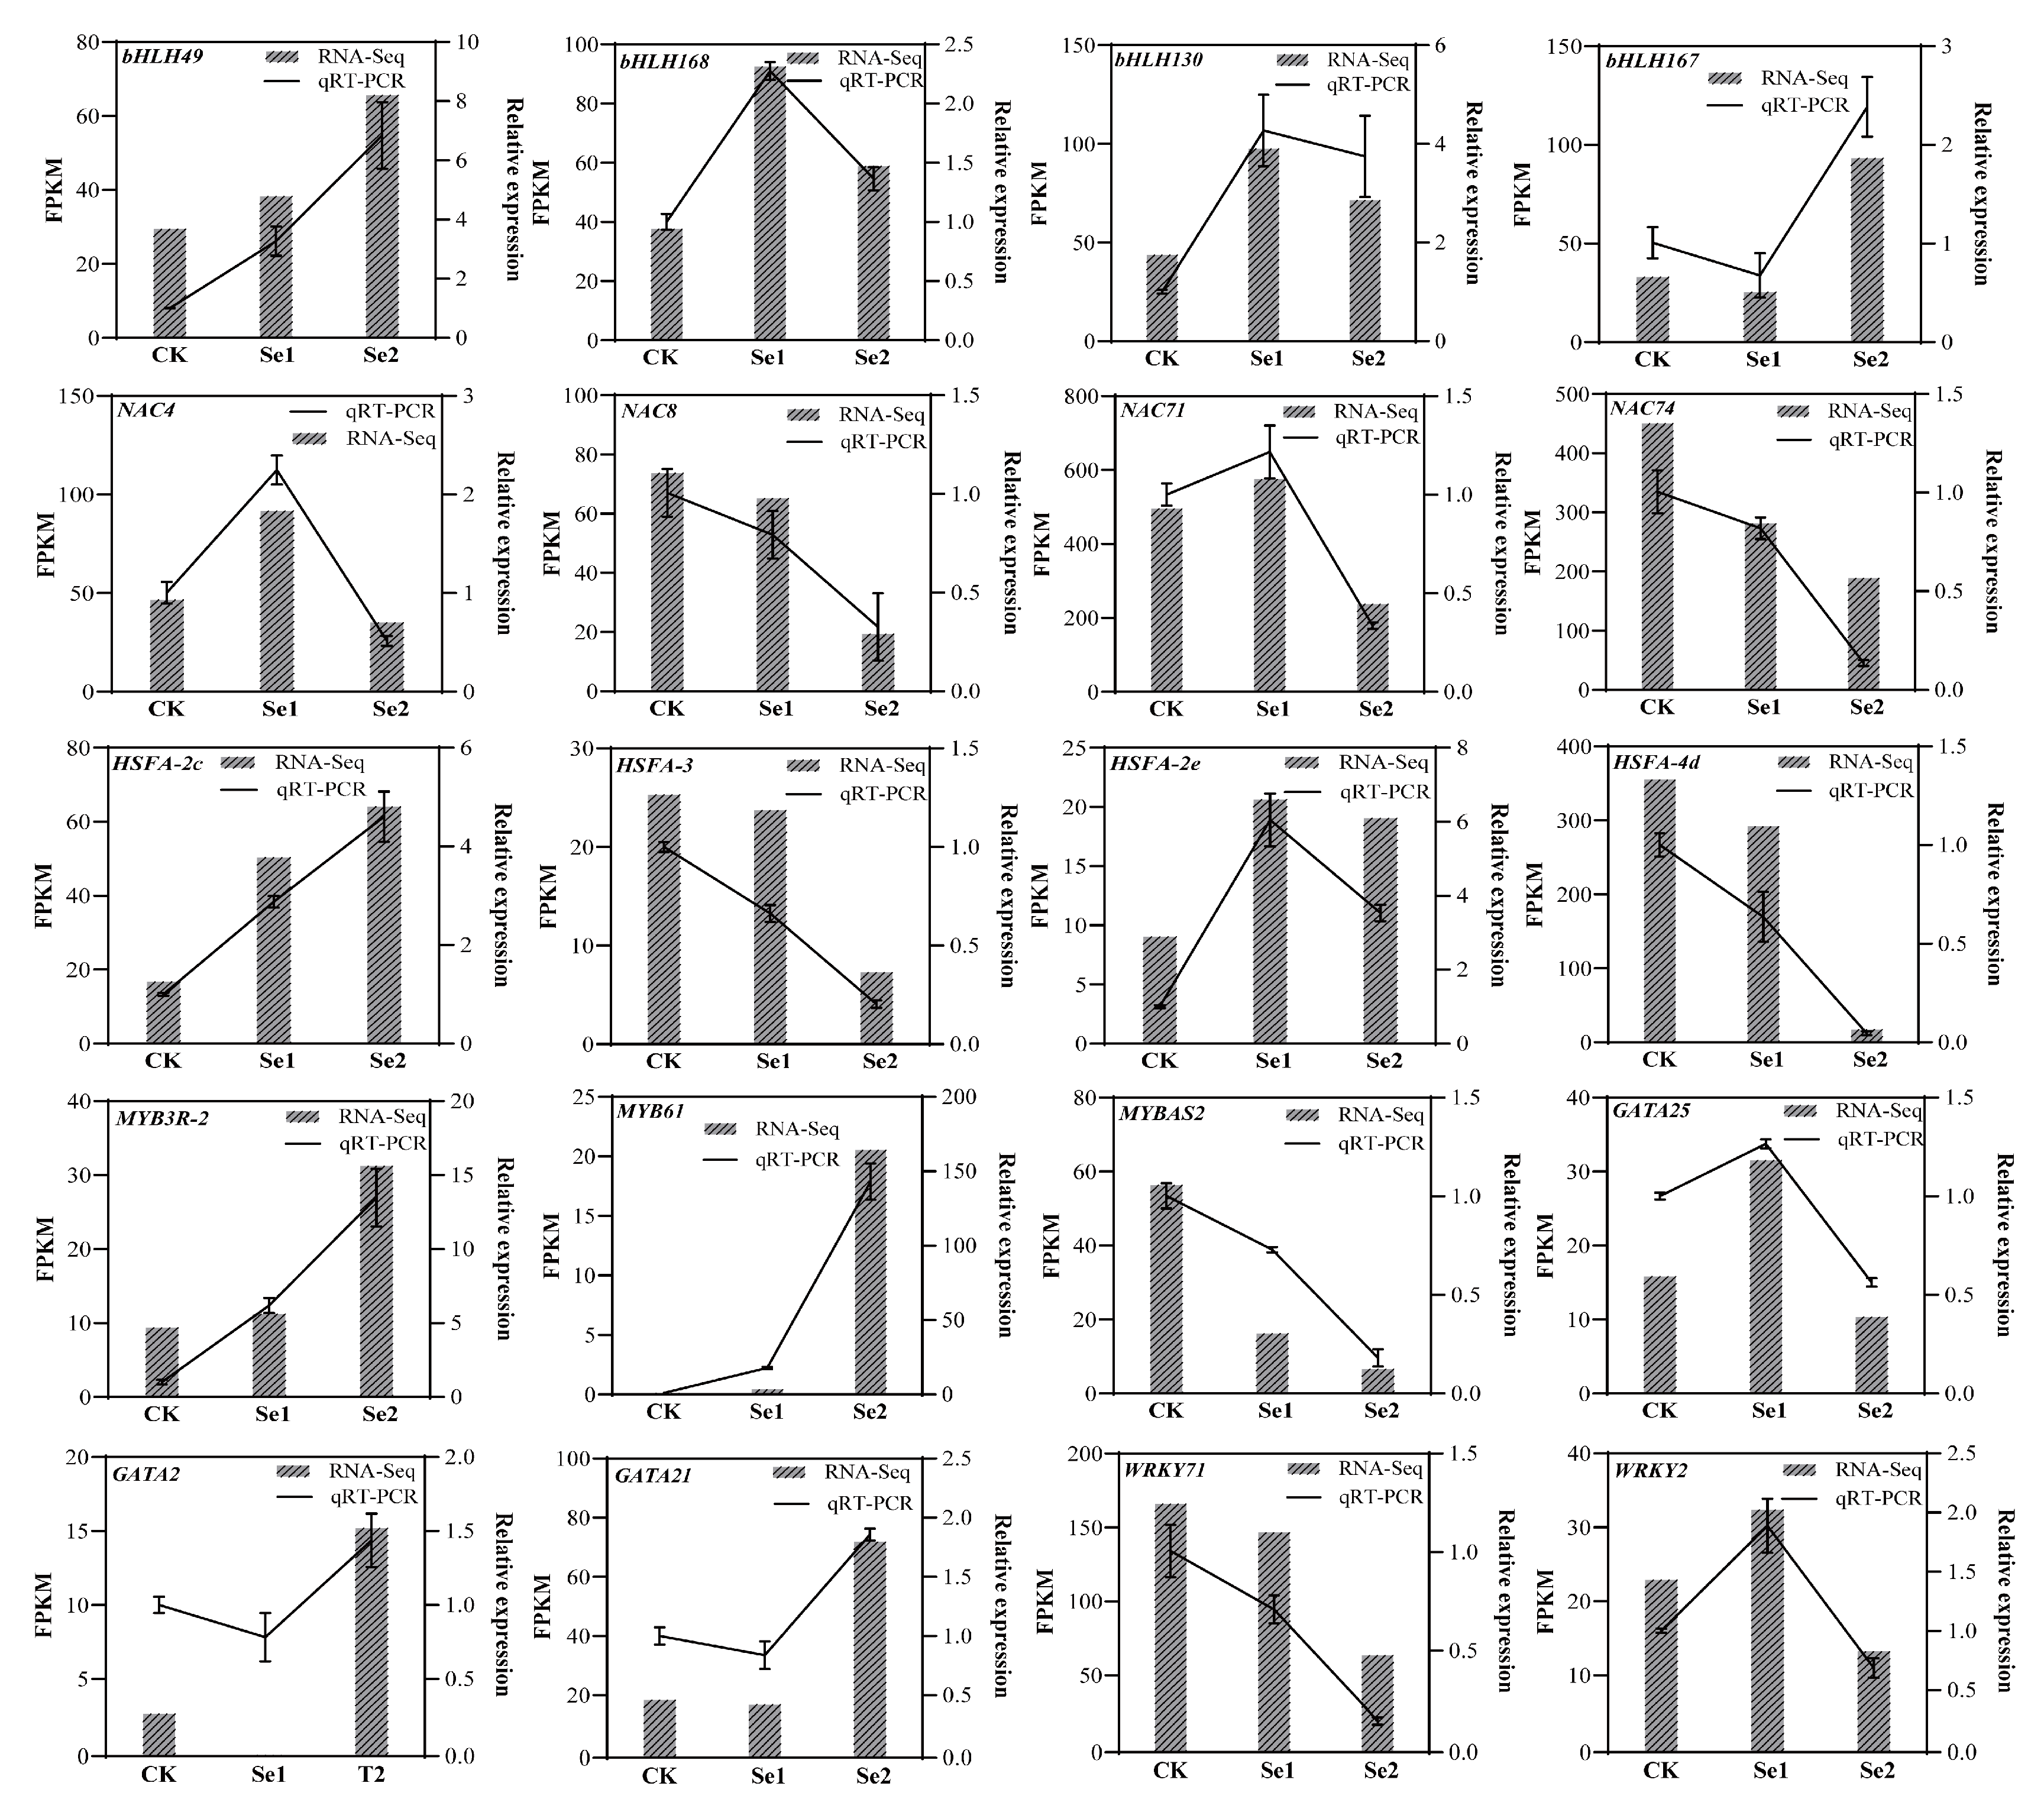
3.8. qRT—PCR Validation of Transcription Factors of Highland Barley Seedlings Under Na2SeO3 Treatment

In this study, we further screened 20 major DEGs from six families: bHLH, MYB, NAC, HSF, WRKY, and GATA (Figure 8). The EF1α housekeeping gene was employed as an endogenous reference to normalize the expression levels of the target genes. Gene-specific primers were shown in Table S8. The results indicated that the trend of qRT-PCR results for the 20 genes was consistent with the trend observed in the transcriptome expression. These findings demonstrated the reliability and accuracy of the transcriptome expression data.
Among these genes, the expression levels of bHLH49, HSFA-2c, MYB3R-2, and MYB61 increased with rising selenium concentrations. In contrast, the expression levels of NAC8, NAC74, HSFA-3, HSFA-4d, MYBAS2, and WRKY71 decreased. Notably, the expression of bHLH168, bHLH130, NAC4, NAC71, HSFA-2e, GATA25, and WRKY2 first increased and then decreased.

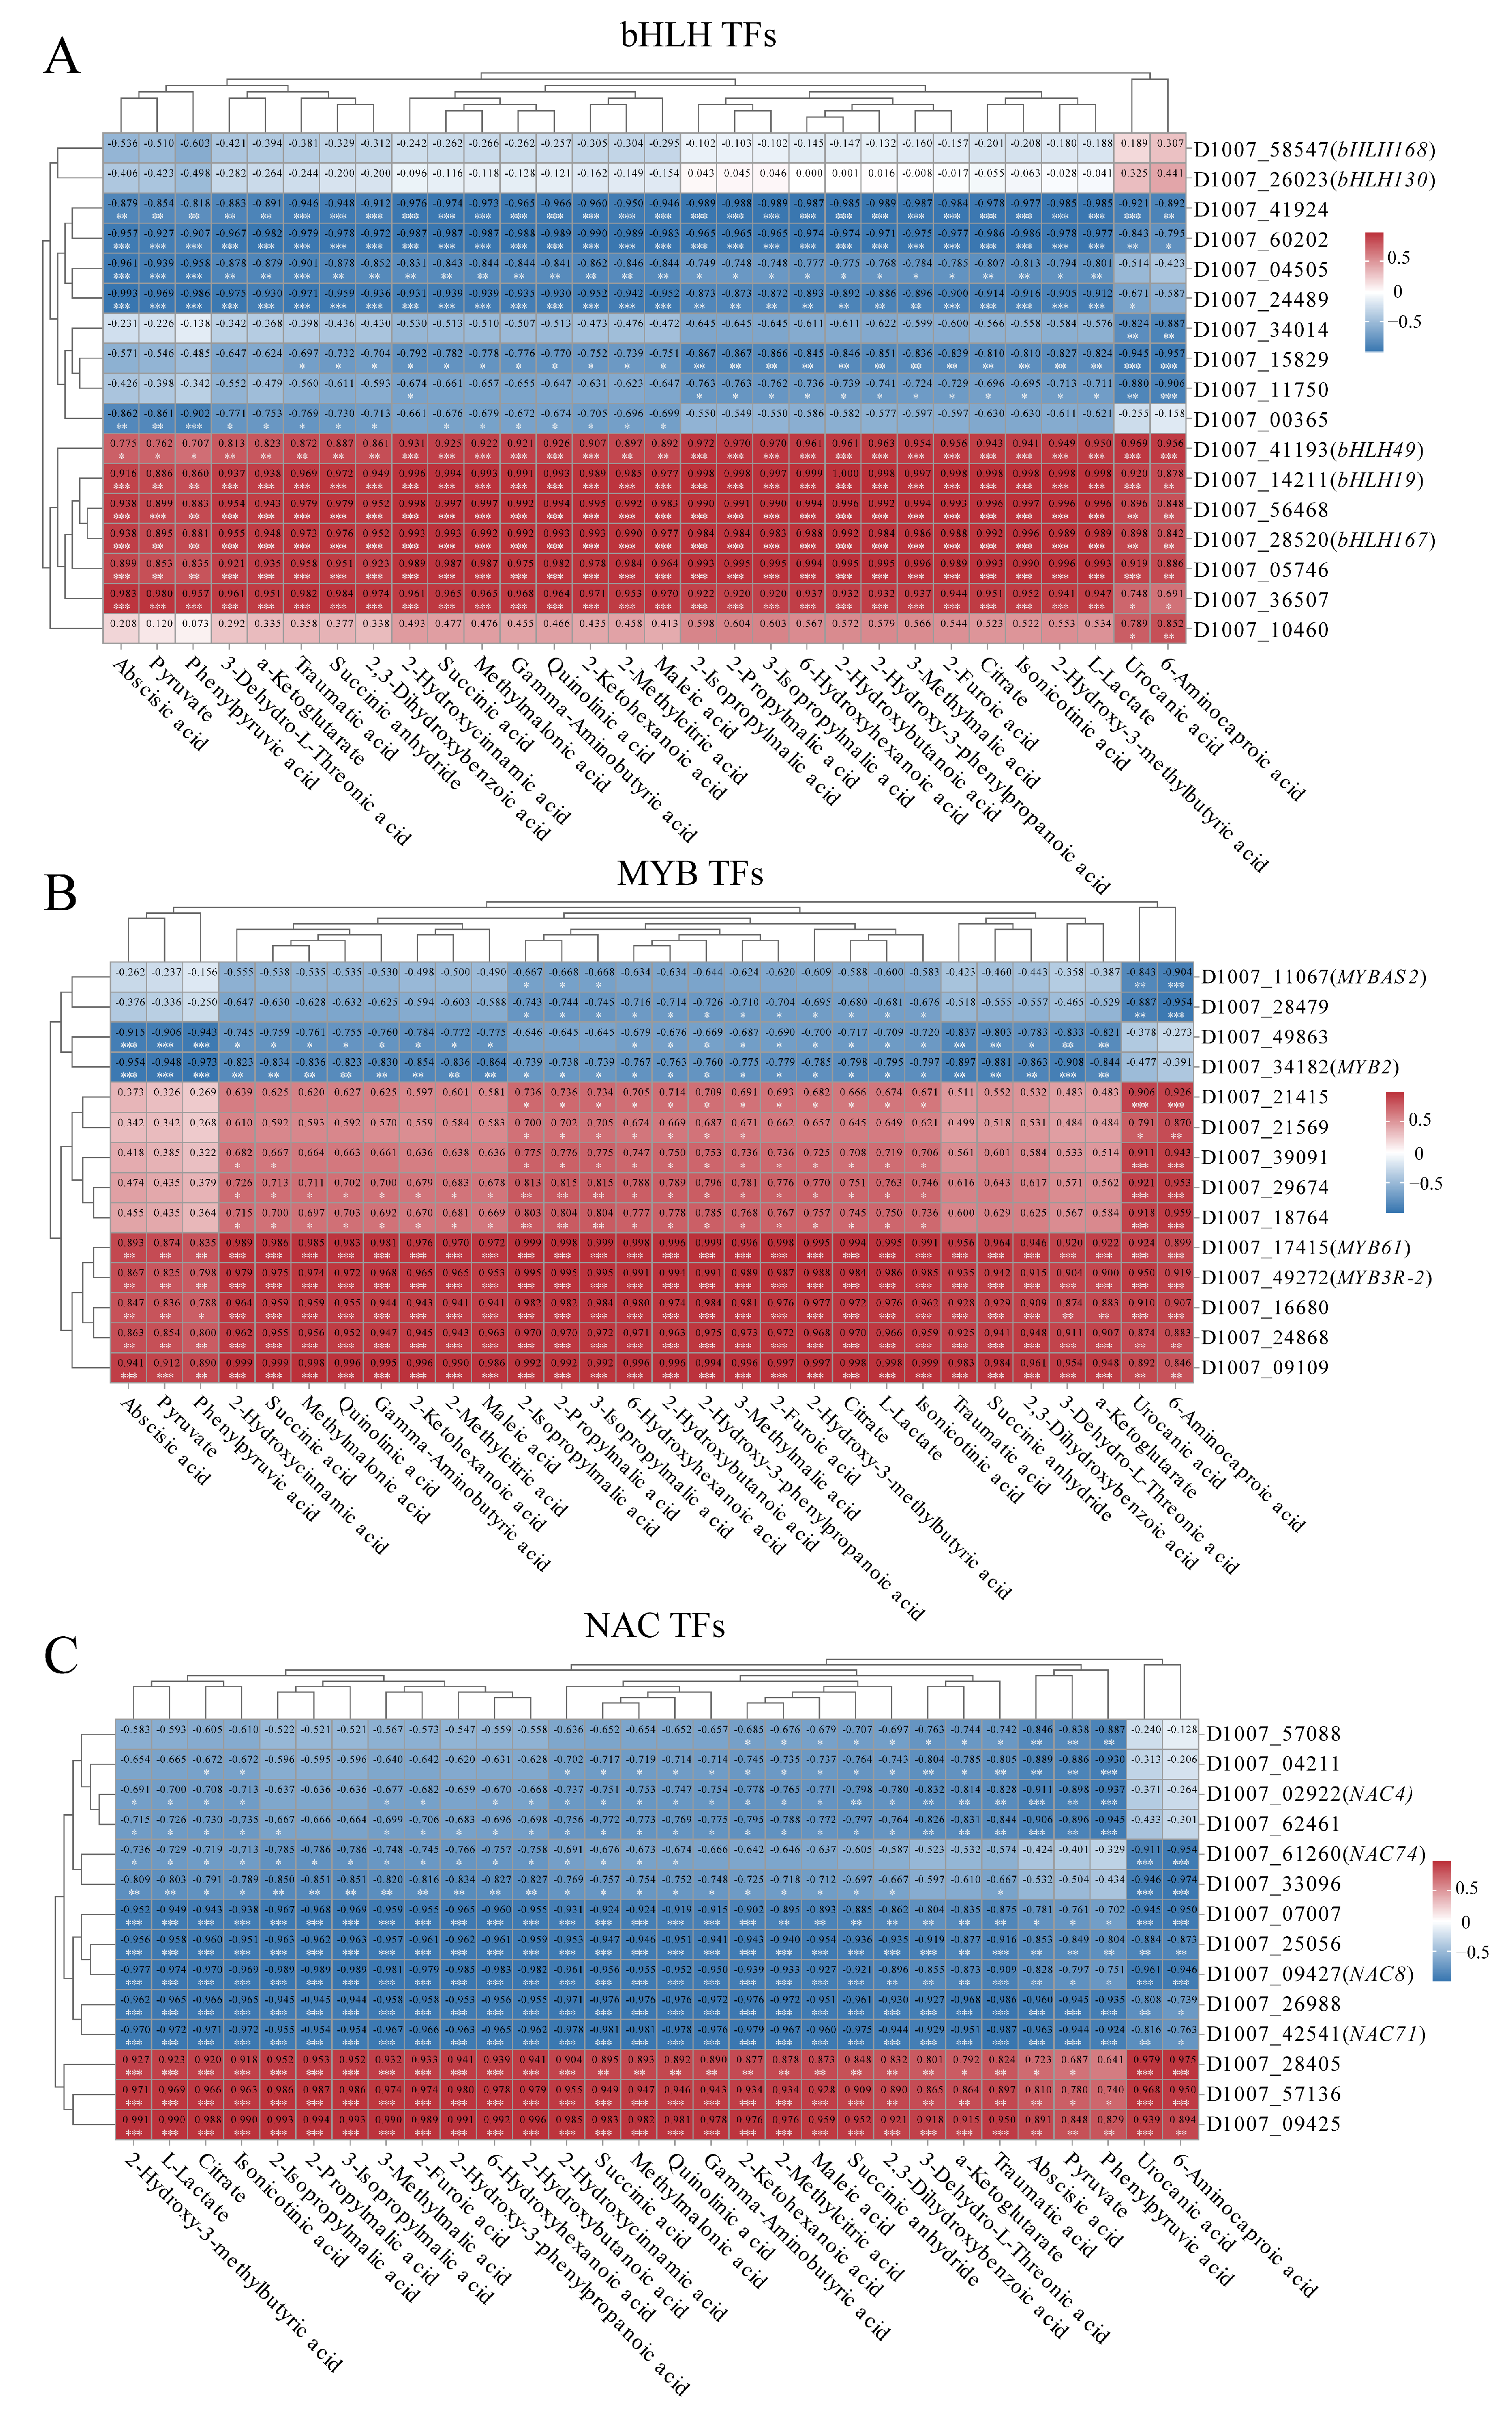
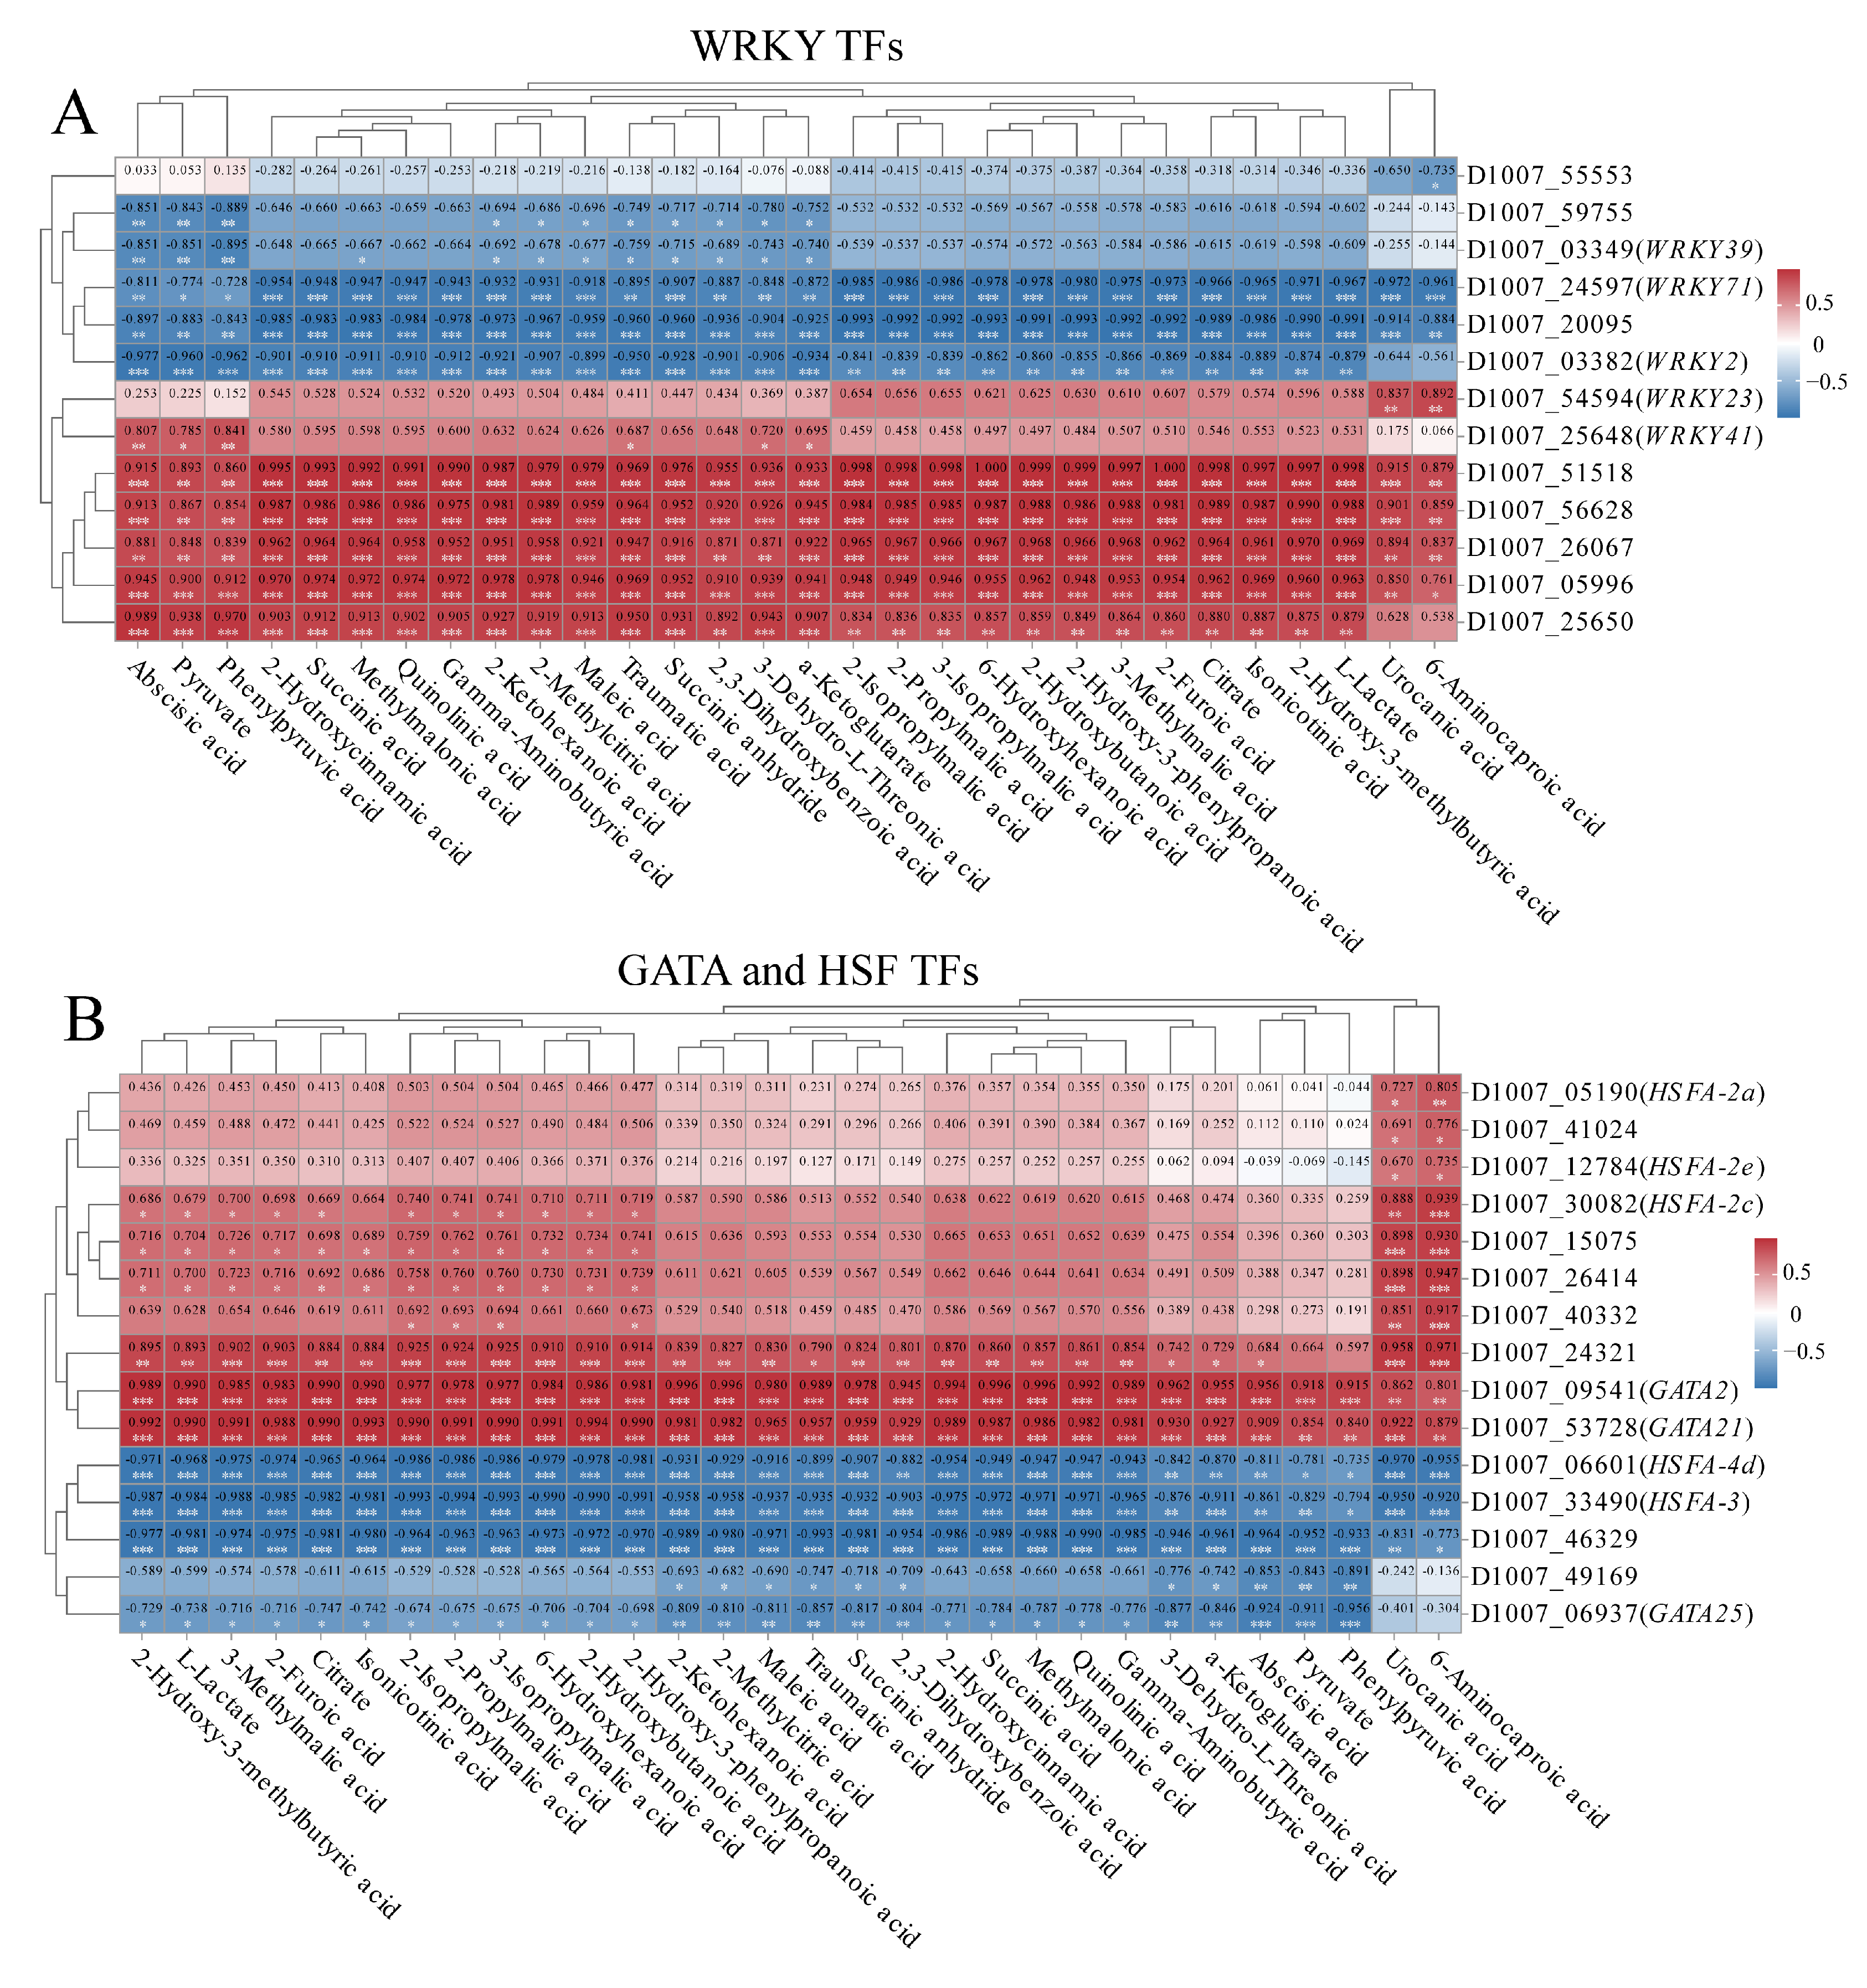
3.9. Correlation Analysis of Key Transcription Factors, Physiological Indexes and Metabolites Under Na2SeO3 Treatment

We removed some transcription factors, as they have no correlation with organic acid metabolites. Some transcription factors were used for Figure 9 and Figure 10. To enhance our understanding of the physiological and molecular response mechanisms of seedlings treated with varying concentrations of selenium, we analyzed the correlations among physiological, transcriptional, and metabolic data. The results indicated that in the correlation analysis of six families of transcription factors and organic acid metabolites, there were 182 positive correlations and 174 negative correlations between 30 organic acid compounds and 17 bHLH transcription factor genes (p < 0.05, p < 0.01, p < 0.001) (Figure 9). Notably, the transcripts D1007_41193 (bHLH49), D1007_14211 (bHLH19), D1007_56468, D1007_28520 (bHLH167), D1007_05746, and D1007_36507 exhibited significant positive relationships with the 30 organic acid compounds. Conversely, the transcripts D1007_41924, D1007_60202, D1007_04505, D1007_24489, and D1007_15829 demonstrated significant negative relationships with 25 to 30 organic acid compounds (Figure 9A).
A total of 233 positive correlations and 72 negative correlations were identified between 30 organic acid compounds and 14 MYB transcription factor genes (p < 0.05, p < 0.01, p < 0.001). Notably, the transcripts D1007_17415 (MYB61), D1007_49272 (MYB3R-2), D1007_16680, D1007_24868, and D1007_09109 exhibited significant positive correlations with the 30 organic acid compounds. Conversely, the transcripts D1007_49863 and D1007_34182 (MYB2) displayed significant negative correlations with 25 to 28 organic acid compounds (Figure 9B).
In our study, we identified a total of 89 positive correlations and 272 negative correlations between 30 organic acid compounds and 14 NAC transcription factor genes (p < 0.05, p < 0.01, p < 0.001). Notably, the transcripts D1007_28405, D1007_57136, and D1007_09425 exhibited significant positive correlations with 29 to 30 organic acid compounds. Conversely, transcripts such as D1007_02922 (NAC4), D1007_62461, D1007_61260 (NAC74), D1007_33096, D1007_07007, D1007_25056, D1007_09427 (NAC8), D1007_26988, and D1007_42541 (NAC71) demonstrated significant negative correlations with 18 to 30 organic acid compounds (Figure 9C).
A total of 156 positive correlations and 112 negative correlations were identified between 30 organic acid compounds and 13 WRKY transcription factor (TF) genes (p < 0.05, p < 0.01, p < 0.001). Notably, the transcripts D1007_25648 (WRKY41), D1007_51518, D1007_56628, D1007_26067, D1007_05996, and D1007_25650 exhibited significant positive correlations with 6 to 30 organic acid compounds. Conversely, transcripts D1007_03349 (WRKY39), D1007_24597 (WRKY71), D1007_20095, and D1007_03382 (WRKY2) demonstrated significant negative correlations with 12 to 30 organic acid compounds (Figure 10A).
In this study, we identified 141 positive correlations and 129 negative correlations between 30 organic acid compounds and 15 GATA and HSF transcription factor (TF) genes (p < 0.05, p < 0.01, p < 0.001). Notably, the transcripts D1007_30082 (HSFA-2c), D1007_15075, D1007_26414, D1007_24321, D1007_09541 (GATA2), and D1007_53728 (GATA21) exhibited significant positive associations with 13 to 30 organic acid compounds. In contrast, transcripts D1007_06601 (HSFA-4d), D1007_33490 (HSFA-3), D1007_46329, and D1007_06937 (GATA25) demonstrated significant negative relationships with 28 to 30 organic acid compounds (Figure 10B).

4. Discussion

Selenium significantly influences the growth and development of plants. The biomass of plants, along with the lengths of their aboveground and underground parts, serves as a critical indicator for assessing their growth and development status. A concentration of 10 μM of selenium resulted in increased root length and dry weight compared to CK, whereas higher selenium concentrations of 40 or 80 μM hindered tomato plant growth and development, adversely affecting growth indicators [53]. A previous study indicated that selenium concentrations ranging from 0.1 to 0.4 mmol/L promoted the growth of cabbage (Brassica oleracea var. capitata L.), while concentrations exceeding 0.4 mmol/L had the opposite effect, leading to symptoms of wilting, yellowing, and senescence in the plants [54]. In this study, under low Se1 treatment (0.02 g/kg Na2SeO3), the plant height, root length, leaf length, leaf width, and both dry and fresh weights of highland barley seedlings significantly increased. However, under Se2 treatment (0.2 g/kg Na2SeO3), the highland barley seedlings exhibited poor development, yellowing leaves, and inhibited growth (Figure 1A,B). Under Se1 low concentration treatment, the pigment content was not affected, and the activities of POD and APX increased in highland barley seedlings, which could clear the oxidative damage caused by MDA and H2O2 to seedlings. On the contrary, under Se2 high concentration treatment, the pigment content significantly decreased, and the antioxidant enzyme activity significantly decreased, which could not effectively eliminate the oxidative damage of MDA and H2O2 to seedlings. These effects may be attributed to excessive selenium concentrations disrupting the structure and stability of root cells in highland barley seedlings, resulting in cell deformation and death.
Photosynthesis is the most critical process for the physiological and biochemical reactions in plants, serving as the foundation for their growth and development [55]. In this study, we observed a significant decrease in the chlorophyll II content of highland barley seedlings subjected to high selenium treatment. This reduction may be attributed to excessive selenium disrupting the photosynthetic electron transport chain, consequently leading to a diminished photosynthetic rate [56]. MDA is a key indicator of the stress resistance capability of plants, while soluble sugars and soluble proteins are essential for assessing the nutritional value of crops. Previous studies have demonstrated that the content of soluble sugars and soluble proteins in broccoli sprouts significantly increases following selenium treatment [57]. In our study, as the concentration of sodium selenite increased, the content of soluble protein decreased, whereas the levels of soluble sugar and MDA increased significantly. This suggested that high concentrations of selenium exacerbate the degree of membrane lipid oxidation in highland barley seedlings, thereby inhibiting their antioxidant capacity and reducing their resistance to exogenous selenium.
Under abiotic environmental stress, plants generate reactive oxygen species (ROS) [58], with O2.- being one of the significant forms of ROS. The production rate of superoxide under selenium treatment was significantly lower than that in the control group (CK), indicating that Na2SeO3 solution effectively reduces superoxide levels in highland barley seedlings. Proline exists in the cytoplasm in a free state and accumulates in large quantities in response to environmental challenges [59]. Djanaguiraman et al. [60] found that selenium can induce proline accumulation in soybeans, thereby enhancing their stress resistance. In this study, the Se2 treatment resulted in greater proline accumulation compared to the Se1 treatment, suggesting that plants regulate cellular osmotic pressure through proline accumulation to better adapt to selenium stress in high-selenium environments.
The antioxidant system serves as the primary mechanism for antioxidant defense [61]. Plants maintain intracellular redox balance by producing antioxidant enzymes such as superoxide dismutase (SOD), peroxidase (POD), and ascorbate peroxidase (APX), which scavenge reactive oxygen species. Previous studies have indicated that selenium enhances the antioxidant capacity of various plants, including wheat [62], strawberry [63], and tea [64], particularly in low-temperature environments, thereby aiding their resilience to cold stress. Hartikainen et al. suggested that an optimal concentration of selenium functions as an antioxidant for ryegrass; however, excessive selenium concentrations can act as a pro-oxidant [65]. In our experiment, under low selenium treatment (Se1), the activities of POD and APX significantly increased compared to CK, while under high selenium treatment (Se2), the activities of SOD, POD, and APX significantly decreased, consistent with previous research findings. Under low selenium treatment, highland barley seedlings exhibit enhanced antioxidant enzyme activity, which mitigates oxidative damage to cells caused by the accumulation of reactive oxygen species. This enhancement ensures the normal physiological functions and metabolic activities of the cells.
Selenium positively influences both crop quality and the accumulation of selenium content. Research conducted by Luo indicates a dose-dependent increase in selenium content in peanuts [66]. Numerous studies have shown that organic selenium is safer and exhibits greater biological efficacy for humans compared to inorganic selenium [67]. However, the capacity to convert inorganic selenium into organic selenium varies among different crops and varieties. Existing research has demonstrated that the organic selenium content in Lilium lancifolium is equivalent to the total selenium content, indicating that inorganic selenium is easily absorbed and completely converted into organic selenium [68]. In this study, total selenium and organic selenium contents increased with rising selenium concentrations, reaching their maximum levels in the leaves of young highland barley seedlings under the Se2 treatment. Inorganic selenium was not entirely converted into organic selenium, potentially due to the limited capability for organic selenium conversion in highland barley seedlings. Furthermore, we observed that under selenium treatment, the migration ability of selenium from soil to leaves was strongest.
Organic acids play a crucial role in determining the acidity and sensory quality of fleshy fruits, as well as regulating intracellular osmotic pressure, pH homeostasis, and stress resistance [69]. Furthermore, organic acids are involved in the photosynthetic and respiratory processes of plants, with their accumulation regulated by multiple metabolic pathways, including the tricarboxylic acid cycle, glycolysis, and gluconeogenesis throughout fruit development [70]. Research has demonstrated that selenium treatment enhances the accumulation of organic acid compounds in highland barley seedlings. Studies by Roberto D’Amato et al. have shown that as selenium levels increase, selenium biofortification not only enhances the content of organic and inorganic selenium in rice shoots but also significantly boosts the levels of organic acids [71]. By applying different concentrations of selenium to apple plants, Liu found that high concentrations of selenium (≥24 μM) may enhance resistance to osmotic stress through the accumulation of substantial amounts of organic acids in the plants [72]. In this study, we identified 123 identical differential metabolites across the three comparison groups, with the largest number belonging to organic acid (30) metabolites. Under the low concentration (Se1) treatment, the levels of 2-Isopropylmalic acid, 3-Isopropylmalic acid, 2-Propylmalic acid, Urocanic acid, and 6-Aminohexanoic acid increased. Conversely, under the high selenium (Se2) treatment, the levels of all 30 metabolites increased. This suggests that high selenium treatment may enhance the content of organic acids in plants by inducing specific genes, thereby aiding the plants in resisting exogenous selenium stress. This result is consistent with the findings of Liu [72], which indicated that among the 45 identical differentially accumulated metabolites (DAMs) identified across three comparison groups, there was a notable increase in the accumulation of phenolic acids, organic acids, terpenoids, and alkaloids, as well as amino acids and their degradation products.
Transcription factors play a crucial role in regulating gene expression in plants. Research on Aloe vera has shown that the transcriptional levels of MYB, bHLH, GATA, and IBH1 genes under treatment with 400 mg/L Na2SeO4 were higher than those under treatment with 200 mg/L Na2SeO4, suggesting that MYB, bHLH, GATA, and IBH1 are significantly induced by high selenium treatment, which is often accompanied by antioxidant and pathogen defense responses [12]. A study on mulberry trees revealed that BpNAC59 and BpNAC62 were significantly up-regulated under sodium selenite treatment, while BpNAC55 was significantly up-regulated under selenate treatment, indicating that BpNAC55, BpNAC59, and BpNAC62 may play important roles in selenium metabolism in mulberry trees [73]. The expression levels of the bHLH49, HSFA-2c, MYB3R-2, and MYB61 genes were significantly up-regulated with increasing concentrations of sodium selenite, while the NAC4, NAC74, HSFA-3, HSFA-4d, MYBAS2, and WRKY71 genes were significantly down-regulated. This indicates that the bHLH49, HSFA-2c, MYB3R-2, MYB61, NAC4, NAC74, HSFA-3, HSFA-4d, MYBAS2, and WRKY71 genes are the most responsive to selenium levels, consistent with previously mentioned findings [73]. The involvement of transcription factors from the MYB, bHLH, WRKY, and ERF families is crucial for activating or inhibiting the production of transport proteins and proton pumps, thereby facilitating or obstructing the process of organic acid transfer [69]. In this study, based on correlation analysis, there were six genes in the bHLH family, five in MYB, three in NAC, five in WRKY, and three in the GATA and HSF families that showed positive correlation with 30 differential organic acid metabolites. There were five genes in the bHLH family, two in MYB, seven in NAC, three in WRKY, and five in the GATA and HSF families that showed negative correlation with 30 differential organic acid metabolites (Figure 11).
These findings suggest that plants respond to environmental changes by modulating gene expression to influence the synthesis and accumulation of secondary metabolites. We speculate that these transcription factors may serve as genetic resources impacting the quality of highland barley under selenium treatment. Further experimental validation is necessary to uncover the biological functions of the candidate factors, elucidate the intricate regulatory network between transcription factors and organic acid metabolites, and ultimately apply these genetic resources in a rational manner in molecular breeding.

5. Conclusions

This study employs a multi-omics analytical approach to investigate the response mechanisms of highland barley seedlings to varying selenium concentrations. Growth and physiological levels exhibited positive responses at the low selenium concentration Se1 (0.02 g/kg). However, the high selenium concentration Se2 (0.2 g/kg) significantly disrupted photosynthesis and altered the levels of soluble sugars, malondialdehyde, and antioxidant enzymes, ultimately inhibiting plant growth. As sodium selenite concentration increased, the total selenium content in the soil, leaves, and roots rose significantly, with the strongest migration capability from soil to leaves observed in both Se1 and Se2 treatments. We further screened 26 DEGs with the highest expression differences under different concentrations of Na2SeO3 treatment. There is a significant positive correlation between 22 DEGs in six transcription factor families and 30 differential organic acid metabolites.

Supplementary Materials

The following supporting information can be downloaded at: https://www.mdpi.com/article/10.3390/agriculture15131364/s1, Figure S1: Changes in highland barley seedlings growth under different concentrations of Na2SeO3 treatment; Figure S2: A correlation analysis was conducted between organic acid metabolites and selenium content in highland barley seedlings under Na2SeO3 treatments. Metabolites were significantly positively correlated with selenium contents; Table S1: Annotated to all metabolites with four repeats in highland barley seedlings under Na2SeO3 treatments; Table S2: Coexisting DAMs in three comparison groups with four repeats in highland barley seedlings under Na2SeO3 treatments; Table S3: 30 DAMs of organic acids with four repeats in highland barley seedlings under Na2SeO3 treatments; Table S4: Statistical analysis of the transcriptome data with three repeats in highland barley seedlings under Na2SeO3 treatments; Table S5: Transcription factor family and family members in highland barley seedlings under Na2SeO3 treatments; Table S6: FPKM of six transcription factor family genes with three repeats in highland barley seedlings under Na2SeO3 treatments; Table S7: FPKM of 26 transcription factors genes with three repeats in highland barley seedlings under Na2SeO3 treatments; Table S8: The primers and sequences of 20 genes used for RT-qPCR.

Author Contributions

F.Q. designed the experiments; G.G. and H.X. prepared the plant samples; J.M. and X.Y. conducted the experiments and analyzed the data; X.W. conducted most experiments and wrote the manuscript. F.Q. revised the manuscript. All authors have read and agreed to the published version of the manuscript.

Funding

This research was funded by the Science and Technology Department of Qinghai Province (2025-ZJ-718 to F.Q.). Formation mechanism and utilization team of characteristic germplasm resources in the Qinghai Tibet Plateau (QHKLYC-GDCXCY-2024-597). Metabolic formation mechanism and high-value utilization team of plateau characteristic biological resources in Qinghai Normal University.

Institutional Review Board Statement

Not applicable for studies not involving humans or animals.

Data Availability Statement

The raw RNA-seq datasets can found in the NCBI SRA under the project number: PRJNA1266111. Available online: https://dataview.ncbi.nlm.nih.gov/object/PRJNA1266111?reviewer=bmhd9p8e0vrrap3tllce83v243, accessed on 1 December 2024.

Conflicts of Interest

The authors declare that they have no known competing financial interests or personal relationships that could have appeared to influence the work reported in this paper.

Abbreviations

The following abbreviations are used in this manuscript:
MDAMalondialdehyde
O2.−Superoxide anion radical
H2O2Hydrogen peroxide
SODSuperoxide dismutase
PODPeroxidase
APXAscorbate peroxidase
TFsTranscription factors
bHLHBasic helix-loop-helix
MYBv-myb avian myeloblastosis viral oncogene homolog
NACNAM, ATAF1/2 and CUC2
HSFHeat stress transcription factor
GATAGATA-binding protein
WRKYWRKY DNA-binding protein
I(Se)Inorganic selenium
O(Se)Organic selenium
T(Se)Total selenium

References

  1. Kieliszek, M. Selenium-Fascinating Microelement, Properties and Sources in Food. Molecules 2019, 24, 1298. [Google Scholar] [CrossRef]
  2. Zhou, B.; Cao, H.; Wu, Q.; Mao, K.; Yang, X.; Su, J.; Zhang, H. Agronomic and Genetic Strategies to Enhance Selenium Accumulation in Crops and Their Influence on Quality. Foods 2023, 12, 4442. [Google Scholar] [CrossRef] [PubMed]
  3. Mangiapane, E.; Pessione, A.; Pessione, E. Selenium and Selenoproteins: An Overview on Different Biological Systems. Curr. Protein Pept. Sci. 2014, 15, 598–607. [Google Scholar] [CrossRef]
  4. Winkel, L.H.E.; Vriens, B.; Jones, G.D.; Schneider, L.S.; Pilon-Smits, E.; Bañuelos, G.S. Selenium Cycling across Soil-Plant-Atmosphere Interfaces: A Critical Review. Nutrients 2015, 7, 4199–4239. [Google Scholar] [CrossRef] [PubMed]
  5. Ahmad, Z.; Anjum, S.; Skalicky, M.; Waraich, E.A.; Muhammad Sabir Tariq, R.; Ayub, M.A.; Hossain, A.; Hassan, M.M.; Brestic, M.; Sohidul Islam, M.; et al. Selenium Alleviates the Adverse Effect of Drought in Oilseed Crops Camelina (Camelina sativa L.) and Canola (Brassica napus L.). Molecules 2021, 26, 1699. [Google Scholar] [CrossRef] [PubMed]
  6. Cappa, J.J.; Cappa, P.J.; El Mehdawi, A.F.; McAleer, J.M.; Simmons, M.P.; Pilon-Smits, E.A.H. Characterization of Selenium and Sulfur Accumulation across the Genus Stanleya (Brassicaceae): A Field Survey and Common-Garden Experiment. Am. J. Bot. 2014, 101, 830–839. [Google Scholar] [CrossRef] [PubMed]
  7. Harris, J.; Schneberg, K.A.; Pilon-Smits, E.A.H. Sulfur-Selenium-Molybdenum Interactions Distinguish Selenium Hyperaccumulator Stanleya Pinnata from Non-Hyperaccumulator Brassica Juncea (Brassicaceae). Planta 2014, 239, 479–491. [Google Scholar] [CrossRef]
  8. Wang, Z.; Huang, W.; Pang, F. Selenium in Soil-Plant-Microbe: A Review. Bull. Environ. Contam. Toxicol. 2022, 108, 167–181. [Google Scholar] [CrossRef]
  9. Zhang, Y.; Zhang, T.; Pan, Y.; Ma, L.; Fang, Y.; Pan, C.; Qiang, Y.; Cao, X.; Xu, H. Nano-Selenium Promotes the Product Quality and Plant Defense of Salvia Miltiorrhiza by Inducing Tanshinones and Salvianolic Acids Accumulation. Ind. Crops Prod. 2023, 195, 116436. [Google Scholar] [CrossRef]
  10. Xiang, J.; Rao, S.; Chen, Q.; Zhang, W.; Cheng, S.; Cong, X.; Zhang, Y.; Yang, X.; Xu, F. Research Progress on the Effects of Selenium on the Growth and Quality of Tea Plants. Plants 2022, 11, 2491. [Google Scholar] [CrossRef]
  11. Yi, Q.; Sun, X.; Tang, S.; Xu, P.; Pang, Y.; Huang, X.; Huang, Q.; Huang, J.; Zhang, M. Comparation of Se Accumulation and Distribution of Two Rice (Oryza sativa L.) Cultivars with High- and Low- Se Efficiency as Affected by Exogenous Application of Selenite. J. Cereal Sci. 2022, 105, 103475. [Google Scholar] [CrossRef]
  12. Zou, Y.; Han, C.; Wang, F.; Tan, Y.; Yang, S.; Huang, C.; Xie, S.; Xiao, X. Integrated Metabolome and Transcriptome Analysis Reveal Complex Molecular Mechanisms Underlying Selenium Response of Aloe vera L. J. Plant Biol. 2021, 64, 135–143. [Google Scholar] [CrossRef]
  13. Li, L.; Yu, J.; Li, L.; Rao, S.; Wu, S.; Wang, S.; Cheng, S.; Cheng, H. Treatment of Ginkgo biloba with Exogenous Sodium Selenite Affects Its Physiological Growth, Changes Its Phytohormones, and Synthesizes Its Terpene Lactones. Molecules 2022, 27, 7548. [Google Scholar] [CrossRef]
  14. Zhou, W.; Duan, Y.; Zhang, Y.; Wang, H.; Huang, D.; Zhang, M. Effects of Foliar Selenium Application on Growth and Rhizospheric Soil Micro-Ecological Environment of Atractylodes macrocephala Koidz. S. Afr. J. Bot. 2021, 137, 98–109. [Google Scholar] [CrossRef] [PubMed]
  15. Qu, L.; Xu, J.; Dai, Z.; Elyamine, A.M.; Huang, W.; Han, D.; Dang, B.; Xu, Z.; Jia, W. Selenium in Soil-Plant System: Transport, Detoxification and Bioremediation. J. Hazard. Mater. 2023, 452, 131272. [Google Scholar] [CrossRef]
  16. Tao, J.; Leng, J.; Lei, X.; Wan, C.; Li, D.; Wu, Y.; Yang, Q.; Wang, P.; Feng, B.; Gao, J. Effects of Selenium (Se) Uptake on Plant Growth and Yield in Common Buckwheat (Fagopyrum esculentum Moench). Field Crops Res. 2023, 302, 109070. [Google Scholar] [CrossRef]
  17. Hawrylak-Nowak, B.; Matraszek, R.; Pogorzelec, M. The Dual Effects of Two Inorganic Selenium Forms on the Growth, Selected Physiological Parameters and Macronutrients Accumulation in Cucumber Plants. Acta Physiol. Plant 2015, 37, 41. [Google Scholar] [CrossRef]
  18. Silva, A.R.; Fernandes, Â.; García, P.A.; Barros, L.; Ferreira, I.C.F.R. Cytinus hypocistis (L.) L. Subsp. macranthus Wettst.: Nutritional Characterization. Molecules 2019, 24, 1111. [Google Scholar] [CrossRef]
  19. Song, F.; Han, X.; Zhu, X.; Herbert, S.J. Response to Water Stress of Soil Enzymes and Root Exudates from Drought and Non-Drought Tolerant Corn Hybrids at Different Growth Stages. Can. J. Soil. Sci. 2012, 92, 501–507. [Google Scholar] [CrossRef]
  20. Jiao, L.; Cao, X.; Wang, C.; Chen, F.; Zou, H.; Yue, L.; Wang, Z. Crosstalk between in Situ Root Exudates and Rhizobacteria to Promote Rice Growth by Selenium Nanomaterials. Sci. Total Environ. 2023, 878, 163175. [Google Scholar] [CrossRef]
  21. Xu, C.; Gui, Z.; Huang, Y.; Yang, H.; Luo, J.; Zeng, X. Integrated Transcriptomics and Metabolomics Analyses Provide Insights into Qingke in Response to Cold Stress. J. Agric. Food Chem. 2023, 71, 18345–18358. [Google Scholar] [CrossRef] [PubMed]
  22. Liu, F.; Xi, M.; Liu, T.; Wu, X.; Ju, L.; Wang, D. The Central Role of Transcription Factors in Bridging Biotic and Abiotic Stress Responses for Plants’ Resilience. New Crops 2024, 1, 100005. [Google Scholar] [CrossRef]
  23. Wei, L.; Liu, H.; Ni, Y.; Xiong, R.; Li, S.; Sun, R.; Wei, Y.; Zhang, H.; Dong, J.; Chang, L.; et al. Integrative Analysis of Metabolome and Transcriptome Reveals New Insights into Major Quality Formation and Regulation in Two Strawberry Cultivars with Different Fruit Flavor. Veg. Res. 2024, 4, e012. [Google Scholar] [CrossRef]
  24. Li, S.-J.; Yin, X.-R.; Wang, W.-L.; Liu, X.-F.; Zhang, B.; Chen, K.-S. Citrus CitNAC62 Cooperates with CitWRKY1 to Participate in Citric Acid Degradation via Up-Regulation of CitAco3. J. Exp. Bot. 2017, 68, 3419–3426. [Google Scholar] [CrossRef] [PubMed]
  25. Liu, S.; Liu, X.; Gou, B.; Wang, D.; Liu, C.; Sun, J.; Yin, X.; Grierson, D.; Li, S.; Chen, K. The Interaction Between CitMYB52 and CitbHLH2 Negatively Regulates Citrate Accumulation by Activating CitALMT in Citrus Fruit. Front. Plant Sci. 2022, 13, 848869. [Google Scholar] [CrossRef]
  26. Li, S.; Yin, X.; Xie, X.; Allan, A.C.; Ge, H.; Shen, S.; Chen, K. The Citrus Transcription Factor, CitERF13, Regulates Citric Acid Accumulation via a Protein-Protein Interaction with the Vacuolar Proton Pump, CitVHA-C4. Sci. Rep. 2016, 6, 20151. [Google Scholar] [CrossRef]
  27. Hu, D.-G.; Sun, C.-H.; Ma, Q.-J.; You, C.-X.; Cheng, L.; Hao, Y.-J. MdMYB1 Regulates Anthocyanin and Malate Accumulation by Directly Facilitating Their Transport into Vacuoles in Apples. Plant Physiol. 2016, 170, 1315–1330. [Google Scholar] [CrossRef]
  28. Hu, D.-G.; Li, Y.-Y.; Zhang, Q.-Y.; Li, M.; Sun, C.-H.; Yu, J.-Q.; Hao, Y.-J. The R2R3-MYB Transcription Factor MdMYB73 Is Involved in Malate Accumulation and Vacuolar Acidification in Apple. Plant J. 2017, 91, 443–454. [Google Scholar] [CrossRef]
  29. Jia, D.; Wu, P.; Shen, F.; Li, W.; Zheng, X.; Wang, Y.; Yuan, Y.; Zhang, X.; Han, Z. Genetic Variation in the Promoter of an R2R3-MYB Transcription Factor Determines Fruit Malate Content in Apple (Malus domestica Borkh.). Plant Physiol. 2021, 186, 549–568. [Google Scholar] [CrossRef]
  30. Peng, Y.; Yuan, Y.; Chang, W.; Zheng, L.; Ma, W.; Ren, H.; Liu, P.; Zhu, L.; Su, J.; Ma, F.; et al. Transcriptional Repression of MdMa1 by MdMYB21 in Ma Locus Decreases Malic Acid Content in Apple Fruit. Plant J. 2023, 115, 1231–1242. [Google Scholar] [CrossRef]
  31. Pankin, A.; von Korff, M. Co-Evolution of Methods and Thoughts in Cereal Domestication Studies: A Tale of Barley (Hordeum Vulgare). Curr. Opin. Plant Biol. 2017, 36, 15–21. [Google Scholar] [CrossRef]
  32. Zeng, X.; Guo, Y.; Xu, Q.; Mascher, M.; Guo, G.; Li, S.; Mao, L.; Liu, Q.; Xia, Z.; Zhou, J.; et al. Origin and Evolution of Qingke Barley in Tibet. Nat. Commun. 2018, 9, 5433. [Google Scholar] [CrossRef]
  33. Liang, J.; Chen, X.; Deng, G.; Pan, Z.; Zhang, H.; Li, Q.; Yang, K.; Long, H.; Yu, M. Dehydration Induced Transcriptomic Responses in Two Tibetan Hulless Barley (Hordeum Vulgare Var. Nudum) Accessions Distinguished by Drought Tolerance. BMC Genom. 2017, 18, 775. [Google Scholar] [CrossRef] [PubMed]
  34. Xie, J.; Hong, Y.; Gu, Z.; Cheng, L.; Li, Z.; Li, C.; Ban, X. Highland Barley Starch: Structures, Properties, and Applications. Foods 2023, 12, 387. [Google Scholar] [CrossRef]
  35. Zhu, F.; Du, B.; Xu, B. A Critical Review on Production and Industrial Applications of Beta-Glucans. Food Hydrocoll. 2016, 52, 275–288. [Google Scholar] [CrossRef]
  36. Institute of Medicine (US) Panel on Dietary Antioxidants and Related Compounds. Dietary Reference Intakes for Vitamin C, Vitamin E, Selenium, and Carotenoids; National Academies Press (US): Washington, DC, USA, 2000; ISBN 978-0-309-06949-6. [Google Scholar]
  37. Dumont, E.; Vanhaecke, F.; Cornelis, R. Selenium Speciation from Food Source to Metabolites: A Critical Review. Anal. Bioanal. Chem. 2006, 385, 1304–1323. [Google Scholar] [CrossRef]
  38. Cheng, C.; Zhao, X.; Yang, H.; Coldea, T.E.; Zhao, H. Mechanism of Selenite Tolerance during Barley Germination: A Combination of Tissue Selenium Metabolism Alterations and Ascorbate-Glutathione Cycle Modulation. Plant Physiol. Biochem. 2023, 205, 108189. [Google Scholar] [CrossRef] [PubMed]
  39. Nagdalian, A.A.; Blinov, A.V.; Siddiqui, S.A.; Gvozdenko, A.A.; Golik, A.B.; Maglakelidze, D.G.; Rzhepakovsky, I.V.; Kukharuk, M.Y.; Piskov, S.I.; Rebezov, M.B.; et al. Effect of Selenium Nanoparticles on Biological and Morphofunctional Parameters of Barley Seeds (Hordéum vulgáre L.). Sci. Rep. 2023, 13, 6453. [Google Scholar] [CrossRef]
  40. Yao, X.; Yao, Y.; An, L.; Li, X.; Bai, Y.; Cui, Y.; Wu, K. Accumulation and Regulation of Anthocyanins in White and Purple Tibetan Hulless Barley (Hordeum vulgare L. var. Nudum Hook. F.) Revealed by Combined de Novo Transcriptomics and Metabolomics. BMC Plant Biol. 2022, 22, 391. [Google Scholar] [CrossRef]
  41. Yu, M.; Wang, M.; Gyalpo, T.; Basang, Y. Stem Lodging Resistance in Hulless Barley: Transcriptome and Metabolome Analysis of Lignin Biosynthesis Pathways in Contrasting Genotypes. Genomics 2021, 113, 935–943. [Google Scholar] [CrossRef]
  42. Li, J.; Zhou, X.; Zhou, J.; Shang, R.; Wang, Y.; Jing, P. Comparative Study on Several Determination Methods of Chlorophyll Content in Plants. IOP Conf. Ser. Mater. Sci. Eng. 2020, 730, 012066. [Google Scholar] [CrossRef]
  43. Liu, Y.; Li, J.; Shi, J.; Pan, Y.; Yang, S.; Xue, Y. Combined Metabolome and Transcriptome Analysis Reveals the Key Pathways Involved in the Responses of Soybean Plants to High Se Stress. Ecotoxicol. Environ. Saf. 2024, 287, 117262. [Google Scholar] [CrossRef]
  44. He, Y.; Zhang, M.; Zhou, W.; Ai, L.; You, J.; Liu, H.; You, J.; Wang, H.; Wassie, M.; Wang, M.; et al. Transcriptome Analysis Reveals Novel Insights into the Continuous Cropping Induced Response in Codonopsis Tangshen, a Medicinal Herb. Plant Physiol. Biochem. 2019, 141, 279–290. [Google Scholar] [CrossRef]
  45. Ghaffari, H.; Tadayon, M.R.; Nadeem, M.; Cheema, M.; Razmjoo, J. Proline-Mediated Changes in Antioxidant Enzymatic Activities and the Physiology of Sugar Beet under Drought Stress. Acta Physiol. Plant 2019, 41, 23. [Google Scholar] [CrossRef]
  46. Mas-Bargues, C.; Escrivá, C.; Dromant, M.; Borrás, C.; Viña, J. Lipid Peroxidation as Measured by Chromatographic Determination of Malondialdehyde. Human Plasma Reference Values in Health and Disease. Arch. Biochem. Biophys. 2021, 709, 108941. [Google Scholar] [CrossRef] [PubMed]
  47. Ni, X.; Li, X.; Shen, T.-L.; Qian, W.-J.; Xian, M. A Sweet H2S/H2O2 Dual Release System and Specific Protein S-Persulfidation Mediated by Thioglucose/Glucose Oxidase. J. Am. Chem. Soc. 2021, 143, 13325–13332. [Google Scholar] [CrossRef] [PubMed]
  48. Liu, Z.; Wang, P.; Zhang, T.; Li, Y.; Wang, Y.; Gao, C. Comprehensive Analysis of BpHSP Genes and Their Expression under Heat Stresses in Betula Platyphylla. Environ. Exp. Bot. 2018, 152, 167–176. [Google Scholar] [CrossRef]
  49. Hadwan, M.H.; Hussein, M.J.; Mohammed, R.M.; Hadwan, A.M.; Saad Al-Kawaz, H.; Al-Obaidy, S.S.M.; Al Talebi, Z.A. An Improved Method for Measuring Catalase Activity in Biological Samples. Biol. Methods Protoc. 2024, 9, bpae015. [Google Scholar] [CrossRef]
  50. Sadak, M.S.; Abd El-Hameid, A.R.; Zaki, F.S.A.; Dawood, M.G.; El-Awadi, M.E. Physiological and Biochemical Responses of Soybean (Glycine Max L.) to Cysteine Application under Sea Salt Stress. Bull. Natl. Res. Cent. 2019, 44, 1. [Google Scholar] [CrossRef]
  51. Hosseini, F.; Mosaddeghi, M.R.; Dexter, A.R.; Sepehri, M. Maize Water Status and Physiological Traits as Affected by Root Endophytic Fungus Piriformospora Indica under Combined Drought and Mechanical Stresses. Planta 2018, 247, 1229–1245. [Google Scholar] [CrossRef]
  52. Livak, K.J.; Schmittgen, T.D. Analysis of Relative Gene Expression Data Using Real-Time Quantitative PCR and the 2(-Delta Delta C(T)) Method. Methods 2001, 25, 402–408. [Google Scholar] [CrossRef]
  53. Saleem, M.; Fariduddin, Q. Novel Mechanistic Insights of Selenium Induced Microscopic, Histochemical and Physio-Biochemical Changes in Tomato (Solanum lycopersicum L.) Plant. An Account of Beneficiality or Toxicity. J. Hazard. Mater. 2022, 434, 128830. [Google Scholar] [CrossRef] [PubMed]
  54. Yang, X.; Liao, X.; Yu, L.; Rao, S.; Chen, Q.; Zhu, Z.; Cong, X.; Zhang, W.; Ye, J.; Cheng, S.; et al. Combined Metabolome and Transcriptome Analysis Reveal the Mechanism of Selenate Influence on the Growth and Quality of Cabbage (Brassica oleracea var. capitata L.). Food Res. Int. 2022, 156, 111135. [Google Scholar] [CrossRef]
  55. Sun, B.; Liu, G.-L.; Phan, T.T.; Yang, L.-T.; Li, Y.-R.; Xing, Y.-X. Effects of Cold Stress on Root Growth and Physiological Metabolisms in Seedlings of Different Sugarcane Varieties. Sugar Tech. 2017, 19, 165–175. [Google Scholar] [CrossRef]
  56. Banerjee, M.; Kalwani, P.; Chakravarty, D.; Singh, B.; Ballal, A. Functional and Mechanistic Insights into the Differential Effect of the Toxicant “Se(IV)” in the Cyanobacterium Anabaena PCC 7120. Aquat. Toxicol. 2021, 236, 105839. [Google Scholar] [CrossRef] [PubMed]
  57. He, R.; Gao, M.; Shi, R.; Song, S.; Zhang, Y.; Su, W.; Liu, H. The Combination of Selenium and LED Light Quality Affects Growth and Nutritional Properties of Broccoli Sprouts. Molecules 2020, 25, 4788. [Google Scholar] [CrossRef] [PubMed]
  58. Xu, H.; Biswas, D.K.; Li, W.-D.; Chen, S.-B.; Zhang, L.; Jiang, G.-M.; Li, Y.-G. Photosynthesis and Yield Responses of Ozone-Polluted Winter Wheat to Drought. Photosynthetica 2007, 45, 582–588. [Google Scholar] [CrossRef]
  59. Hayat, S.; Hayat, Q.; Alyemeni, M.N.; Wani, A.S.; Pichtel, J.; Ahmad, A. Role of Proline under Changing Environments: A Review. Plant Signal Behav. 2012, 7, 1456–1466. [Google Scholar] [CrossRef]
  60. Djanaguiraman, M.; Devi, D.D.; Shanker, A.K.; Sheeba, J.A.; Bangarusamy, U. Selenium – an Antioxidative Protectant in Soybean during Senescence. Plant Soil. 2005, 272, 77–86. [Google Scholar] [CrossRef]
  61. Pandey, P.; Srivastava, R.K.; Rajpoot, R.; Rani, A.; Pandey, A.K.; Dubey, R.S. Water Deficit and Aluminum Interactive Effects on Generation of Reactive Oxygen Species and Responses of Antioxidative Enzymes in the Seedlings of Two Rice Cultivars Differing in Stress Tolerance. Environ. Sci. Pollut. Res. Int. 2016, 23, 1516–1528. [Google Scholar] [CrossRef]
  62. Chu, J.; Yao, X.; Zhang, Z. Responses of Wheat Seedlings to Exogenous Selenium Supply under Cold Stress. Biol. Trace Elem. Res. 2010, 136, 355–363. [Google Scholar] [CrossRef]
  63. Huang, C.; Qin, N.; Sun, L.; Yu, M.; Hu, W.; Qi, Z. Selenium Improves Physiological Parameters and Alleviates Oxidative Stress in Strawberry Seedlings under Low-Temperature Stress. Int. J. Mol. Sci. 2018, 19, 1913. [Google Scholar] [CrossRef]
  64. Liu, K.; Li, S.; Han, J.; Zeng, X.; Ling, M.; Mao, J.; Li, Y.; Jiang, J. Effect of Selenium on Tea (Camellia sinensis) under Low Temperature: Changes in Physiological and Biochemical Responses and Quality. Environ. Exp. Bot. 2021, 188, 104475. [Google Scholar] [CrossRef]
  65. Hartikainen, H.; Xue, T.; Piironen, V. Selenium as an Anti-Oxidant and pro-Oxidant in Ryegrass. Plant Soil 2000, 225, 193–200. [Google Scholar] [CrossRef]
  66. Luo, L.; Zhang, J.; Zhang, K.; Wen, Q.; Ming, K.; Xiong, H.; Ning, F. Peanut Selenium Distribution, Concentration, Speciation, and Effects on Proteins after Exogenous Selenium Biofortification. Food Chem. 2021, 354, 129515. [Google Scholar] [CrossRef] [PubMed]
  67. Chen, J.; Feng, T.; Wang, B.; He, R.; Xu, Y.; Gao, P.; Zhang, Z.-H.; Zhang, L.; Fu, J.; Liu, Z.; et al. Enhancing Organic Selenium Content and Antioxidant Activities of Soy Sauce Using Nano-Selenium during Soybean Soaking. Front. Nutr. 2022, 9, 970206. [Google Scholar] [CrossRef] [PubMed]
  68. Jiang, X.; Zhou, W.; Li, D.; Wang, H.; Yang, Y.; You, J.; Liu, H.; Ai, L.; Zhang, M. Combined Transcriptome and Metabolome Analyses Reveal the Effects of Selenium on the Growth and Quality of Lilium Lancifolium. Front. Plant Sci. 2024, 15, 1399152. [Google Scholar] [CrossRef]
  69. Huang, X.-Y.; Wang, C.-K.; Zhao, Y.-W.; Sun, C.-H.; Hu, D.-G. Mechanisms and Regulation of Organic Acid Accumulation in Plant Vacuoles. Hortic. Res. 2021, 8, 227. [Google Scholar] [CrossRef]
  70. Tang, M.; Bie, Z.; Wu, M.; Yi, H.; Feng, J. Changes in Organic Acids and Acid Metabolism Enzymes in Melon Fruit during Development. Sci. Hortic. 2010, 123, 360–365. [Google Scholar] [CrossRef]
  71. D’Amato, R.; Fontanella, M.C.; Falcinelli, B.; Beone, G.M.; Bravi, E.; Marconi, O.; Benincasa, P.; Businelli, D. Selenium Biofortification in Rice (Oryza sativa L.) Sprouting: Effects on Se Yield and Nutritional Traits with Focus on Phenolic Acid Profile. J. Agric. Food Chem. 2018, 66, 4082–4090. [Google Scholar] [CrossRef]
  72. Liu, C.; Zhou, G.; Qin, H.; Guan, Y.; Wang, T.; Ni, W.; Xie, H.; Xing, Y.; Tian, G.; Lyu, M.; et al. Metabolomics Combined with Physiology and Transcriptomics Reveal Key Metabolic Pathway Responses in Apple Plants Exposure to Different Selenium Concentrations. J. Hazard. Mater. 2024, 464, 132953. [Google Scholar] [CrossRef] [PubMed]
  73. Guo, L.; Liao, Y.; Deng, S.; Li, J.; Bu, X.; Zhu, C.; Zhang, W.; Cong, X.; Cheng, S.; Chen, Q.; et al. Genome-Wide Analysis of NAC Transcription Factors and Exploration of Candidate Genes Regulating Selenium Metabolism in Broussonetia Papyrifera. Planta 2024, 260, 1. [Google Scholar] [CrossRef] [PubMed]
Figure 1. Impact of selenium (Se) treatment on the growth of highland barley seedlings. (A) The phenotype. (B) Effects of the growth indicators. The vertical bars represent the standard deviation of three replications. Different lowercase letters above the bars indicate a significant difference at p < 0.05. CK: control group; Se1: 0.02 g/kg Na2SeO3 treatment; Se2: 0.2 g/kg Na2SeO3 treatment.
Agriculture 15 01364 g001
Figure 2. Physiological index changes of highland barley seedlings under Se treatments. The vertical bars represent the standard deviation calculated from three replicates. Different lowercase letters positioned above the bars indicate a statistically significant difference at p < 0.05. CK: control group; Se1: 0.02 g/kg Na2SeO3 treatment; Se2: 0.2 g/kg Na2SeO3 treatment.
Agriculture 15 01364 g002
Figure 3. Effects of the selenium content and transport coefficient in soil and highland barley seedlings. (A) Selenium content in soil. (B) Selenium content in highland barley leaf. (C) Selenium content in highland barley root. (D) Transport coefficient among soil, highland barley leaf, highland barley root. Different lowercase letters above the bars indicate a significant difference at p < 0.05. CK: control group; Se1: 0.02 g/kg Na2SeO3 treatment; Se2: 0.2 g/kg Na2SeO3 treatment.
Agriculture 15 01364 g003
Figure 4. Metabolomics analysis of highland barley seedlings under selenium treatment. (A) PCA analysis. (B) Correlation analysis. (C) Accumulation patterns of 759 identified metabolites. The color gradient represents the accumulation levels of each metabolite, ranging from low (blue) to high (red). (D) Types and quantities of all annotated metabolites in highland barley seedlings. CK: control group; Se1: 0.02 g/kg Na2SeO3 treatment; Se2: 0.2 g/kg Na2SeO3 treatment.
Agriculture 15 01364 g004
Figure 5. Metabolomic analysis of highland barley seedlings under selenium treatments. (A) Pairwise comparisons of metabolites among different groups, where the overlapping sections indicate the number of metabolites common to the compared groups, while the non-overlapping sections represent the number of metabolites unique to each comparison group. (B) The types and proportions of coexisting differential metabolites among the three groups. (C) The heatmap of differentially expressed organic acid metabolites, with a color gradient indicating accumulation levels; green represents low levels, and red indicates high levels. CK: control group; Se1: 0.02 g/kg Na2SeO3 treatment; Se2: 0.2 g/kg Na2SeO3 treatment. ★: organic acid.
Agriculture 15 01364 g005
Figure 6. Comprehensive transcriptome analysis of highland barley seedlings under selenium concentrations. (A) The principal component analysis (PCA). (B) A correlation analysis of gene expression. (C) The up-regulated and down-regulated DEGs. (D) Pairwise gene comparisons within each group, where the overlap indicates the number of genes shared among the comparison groups, while the non-overlap signified the number of genes unique to each comparison group. CK: Control group; Se1: 0.02 g/kg Na2SeO3 treatment; Se2: 0.2 g/kg Na2SeO3 treatment.
Agriculture 15 01364 g006
Figure 7. DEGs heatmap of transcription factors in highland barley seedlings under selenium concentrations. (A) bHLH family. (B) MYB family. (C) NAC family. (D) WRKY family. (E) GATA family. (F) HSF family. The color gradient indicates the expression levels of transcription factors, with red representing up-regulated genes and green indicated down-regulated genes. (G) The differential expression of 26 DEGs. CK: control group; Se1: 0.02 g/kg Na2SeO3 treatment; Se2: 0.2 g/kg Na2SeO3 treatment.
Agriculture 15 01364 g007
Figure 8. Comprehensive transcriptome analysis and quantitative qRT-PCR verification of differentially expressed transcription factors across various treatment groups. The accompanying bar chart illustrated the FPKM values of the genes, while the line chart depicted the relative gene expression as determined by qRT-PCR. The relative gene expression was calculated using the 2−ΔΔCt method. Vertical lines represent the standard deviation (SD) ± average based on three replicates. CK: control group; Se1: 0.02 g/kg Na2SeO3 treatment; Se2: 0.2 g/kg Na2SeO3 treatment.
Agriculture 15 01364 g008
Figure 9. Correlation analysis between transcription factors and 30 organic acid metabolites. (A) Correlation between bHLH transcription factors and organic acid metabolites. (B) Correlation between MYB transcription factors and organic acid metabolites. (C) Correlation between NAC transcription factors and organic acid metabolites. In the figures, red and blue colors indicated positive and negative correlations, respectively. The significance levels were denoted as follows: *: p < 0.05; **: p < 0.01; ***: p < 0.001. CK: control group; Se1: 0.02 g/kg Na2SeO3 treatment; Se2: 0.2 g/kg Na2SeO3 treatment.
Agriculture 15 01364 g009
Figure 10. Correlation analysis of transcription factors and 30 organic acid metabolites. (A) Correlation between WRKY transcription factors and organic acid metabolites. (B) Correlation between HSF and GATA transcription factors and organic acid metabolites. Red and blue colors represented positive and negative correlations, respectively. The significance levels are denoted as follows: *: p < 0.05; **: p < 0.01; ***: p < 0.001. CK: control group; Se1: 0.02 g/kg Na2SeO3 treatment; Se2: 0.2 g/kg Na2SeO3 treatment.
Agriculture 15 01364 g010
Figure 11. Possible roles of plants, transcription factors, and organic acid metabolites in highland barley seedlings under selenium treatment.
Agriculture 15 01364 g011
Disclaimer/Publisher’s Note: The statements, opinions and data contained in all publications are solely those of the individual author(s) and contributor(s) and not of MDPI and/or the editor(s). MDPI and/or the editor(s) disclaim responsibility for any injury to people or property resulting from any ideas, methods, instructions or products referred to in the content.

