Article

Application of Seed Miss Prevention System for a Spoon-Wheel Type Precision Seed Metering Device: Effectiveness and Limitations

by
Aldiyar Bakirov
*,
Nikolay Kostyuchenkov
,
Oksana Kostyuchenkova
,
Alexsandr Grishin
,
Aruzhan Omarbekova
and
Nikolay Zagainov
Technical Faculty, S. Seifullin Kazakh Agrotechnical Research University, Zhenis Avenue, 62, Astana 010000, Kazakhstan
*
Author to whom correspondence should be addressed.
Agriculture 2025, 15(13), 1363; https://doi.org/10.3390/agriculture15131363
Submission received: 27 May 2025 / Revised: 17 June 2025 / Accepted: 23 June 2025 / Published: 25 June 2025
(This article belongs to the Section Agricultural Technology)

Abstract

Precision seeding plays a critical role in optimizing crop yield and resource efficiency. This study evaluates the application of a Seed Miss Prevention System (SMPS) integrated with a spoon-wheel precision metering device to mitigate seed misses and enhance its performance. A combination of Discrete Element Method (DEM) simulations, electrical hardware design, mechanical retrofitting, software development and laboratory experiments was employed to assess the effectiveness of the system across multiple seed cultivars and operating speeds. Experimental results demonstrated that the SMPS significantly reduced seed misses at lower operational speeds (3–10 rpm), with the implementation of a dual-sensor configuration further improving detection accuracy by filtering out false positives. At higher speeds (≥15 rpm), however, seed miss rates increased, particularly for irregularly shaped seeds like white beans ‘Great Northern’, due to the mechanical limitations of the metering device. Statistical analyses, including Tukey’s HSD test, confirmed the effectiveness of the SMPS in reducing miss rates across different seed types. Despite these improvements, complete elimination of seed misses was not achieved, highlighting the need for further optimization in seed miss detection. Future research should explore adaptations for higher-speed metering devices and field-scale validations. The findings underscore the potential of SMPS technology in advancing precision agriculture by improving seeding accuracy and operational efficiency.

1. Introduction

Precision agriculture technologies, including variable rate seeding, are instrumental in optimizing input usage and improving crop performance. By targeting inputs to the specific spatial and temporal needs of fields, these technologies enhance farm productivity and economics, providing higher or equal yields with lower production costs compared to conventional practices [1,2].
Precision seeding ensures that seeds are placed at the correct depth and spacing, which is crucial for uniform germination and optimal plant density. For instance, Ahmed et al. [3] found that uniform plant spacing significantly improves crop establishment and yield by ensuring consistent plant-to-plant and row-to-row spacing. Similarly, research conducted by Xu et al. [4] on soybean cultivation revealed that uniform plant distribution enhances canopy light interception and dry matter accumulation, leading to increased yield.
The attainment of uniform plant emergence, which is a critical determinant of potential crop yield and overall agricultural productivity, is fundamentally reliant on the precision and consistency of seed placement throughout the planting operation [5]. The precise application not only enhances crop establishment and resilience against environmental variability but also contributes to efficient resource use and sustainable farming practices [6].
Spoon-wheel seed metering devices are widely adopted for their mechanical simplicity, reliability, and cost-effectiveness [7,8]. The mechanism utilizes a rotating wheel equipped with spoon-shaped cavities to pick up and deposit individual seeds into the soil at predefined intervals. Its design is suitable for seeds of different sizes and shapes, especially for row crops like corn, legumes, and sunflowers. However, challenges like seed misses or irregular distribution persist due to mechanical limitations, environmental factors, or seed variability, leading to gaps between plants and compromised yields [9,10]. Addressing these inefficiencies is essential for advancing sustainable farming practices, as even minor seeding errors can escalate into significant economic and agronomic losses [11,12].
There are many scientific works aimed to mitigate the seed missing problem and improve the overall precision of seed metering devices. Zhang et al. [13] developed a pressure-holding precision seed metering device for maize, achieving a missed seeding rate of 3% by optimizing the installation diameter, torsion spring wire diameter, and rotational speed. Kai-xing et al. [14] designed a pneumatic drum type device for beans to handle seeds of varying sizes without changing the roller, achieving a seed miss rate of 3.74%. For rice, a rotary precision hill direct seed metering device was designed by Tian et al. [15], achieving a seed miss rate of 1.74% by optimizing the speed of the seed metering plate and seed capacity height. However, the mentioned studies only mitigated the problem and failed to completely prevent seed misses.
Different researchers utilized a variety of monitoring and control systems. A study on soybean precision seed metering devices introduced a real-time monitoring system using photoelectric sensors to evaluate seeding performance accuracy [16]. Similarly, a performance monitoring system based on LED visible photoelectric seed sensing technology was developed by Liu et al. [17] to ensure real-time and accurate monitoring of seed metering devices, achieving high accuracy in detecting seed misses. Wang et al. [8] developed a compensating control system that integrates a one-way clutch mechanism which allows for flexible switching between normal and compensating power, effectively reducing the seed miss rate by accelerating seeds to fill detected misses. Another study conducted by Borja et al. [18] focused on a mechatronic seed meter for corn, which utilized machine vision to detect unfilled holes and adjust the seeding rate, thereby reducing missed seeding, while advanced control systems certainly improve the quality of seeding, they also fail to completely eliminate seed misses. A recent study conducted by Nikolay et al. [19] introduced a novel Seed Miss Prevention System that adjusts the rotational speed of single seed metering devices to eliminate missed seeds, demonstrating its effectiveness in laboratory tests with a significantly reduced seed miss rate and the potential to completely eliminate them. The current research builds upon these findings by adapting the system for spoon-wheel type precision seed metering devices, further evaluating its performance across multiple seed cultivars and various operational speeds.
The most important component of the Seed Miss Prevention System is the sensor and its location. Sensor placement in precision metering machinery remains a critical yet complex challenge due to the dynamic operational conditions and internal obstructions [17]. For this task, motion analysis can be used [20]. Traditional motion analysis relies on direct observation [21], but internal dynamics are often inaccessible in real systems [16]. Computational simulations, validated against theoretical models, offer a robust alternative for predicting performance and optimizing design [22,23]. For instance, studies conducted by [22] on terrain-dependent track tension and hole-forming devices for buckwheat seeding [23] highlight the synergy of simulation, experimentation, and design. However, granular interactions in seed metering systems necessitate advanced modeling tools like the Discrete Element Method (DEM).
DEM has evolved from simulating basic granular flows [24] to complex agricultural applications, including soil dynamics [25] and material stress analysis [26]. EDEM, a leading DEM software (version 9.1.0), enables precise modeling of bulk materials, from seeds to soil [27,28,29,30,31]. In agricultural contexts, EDEM has been successful in analyzing corn seed dynamics in grain augers [32,33], threshing drums [34,35], and high-speed metering devices [36]. Key parameters such as particle friction coefficients, inlet velocity, and pile porosity [37], as well as material properties like elasticity and restitution [38], have been validated for accuracy. Recent work by Boac et al. [39] further optimized DEM for corn kernels, balancing computational efficiency and bulk behavior fidelity using single-sphere models. These advancements underscore DEM’s potential in simulating seed dynamics, directly guiding the design and analysis of precision metering systems.
The current paper presents the experimental setup and analysis of EDEM modeling to find the best possible location for the sensor used in real-time seed monitoring systems (described by Nikolay et al. [19]) on a spoon-wheel type precision metering device taken from the Chinese serially produced 2BJG-3 seeder, which was also modified for this purpose. The retrofitting process involved integrating a further modified Seed Miss Prevention System specifically engineered to detect and mitigate seed miss events in a spool wheel type precision seed metering device, marking a key advancement in the practical applicability of the system.

2. Materials and Methods

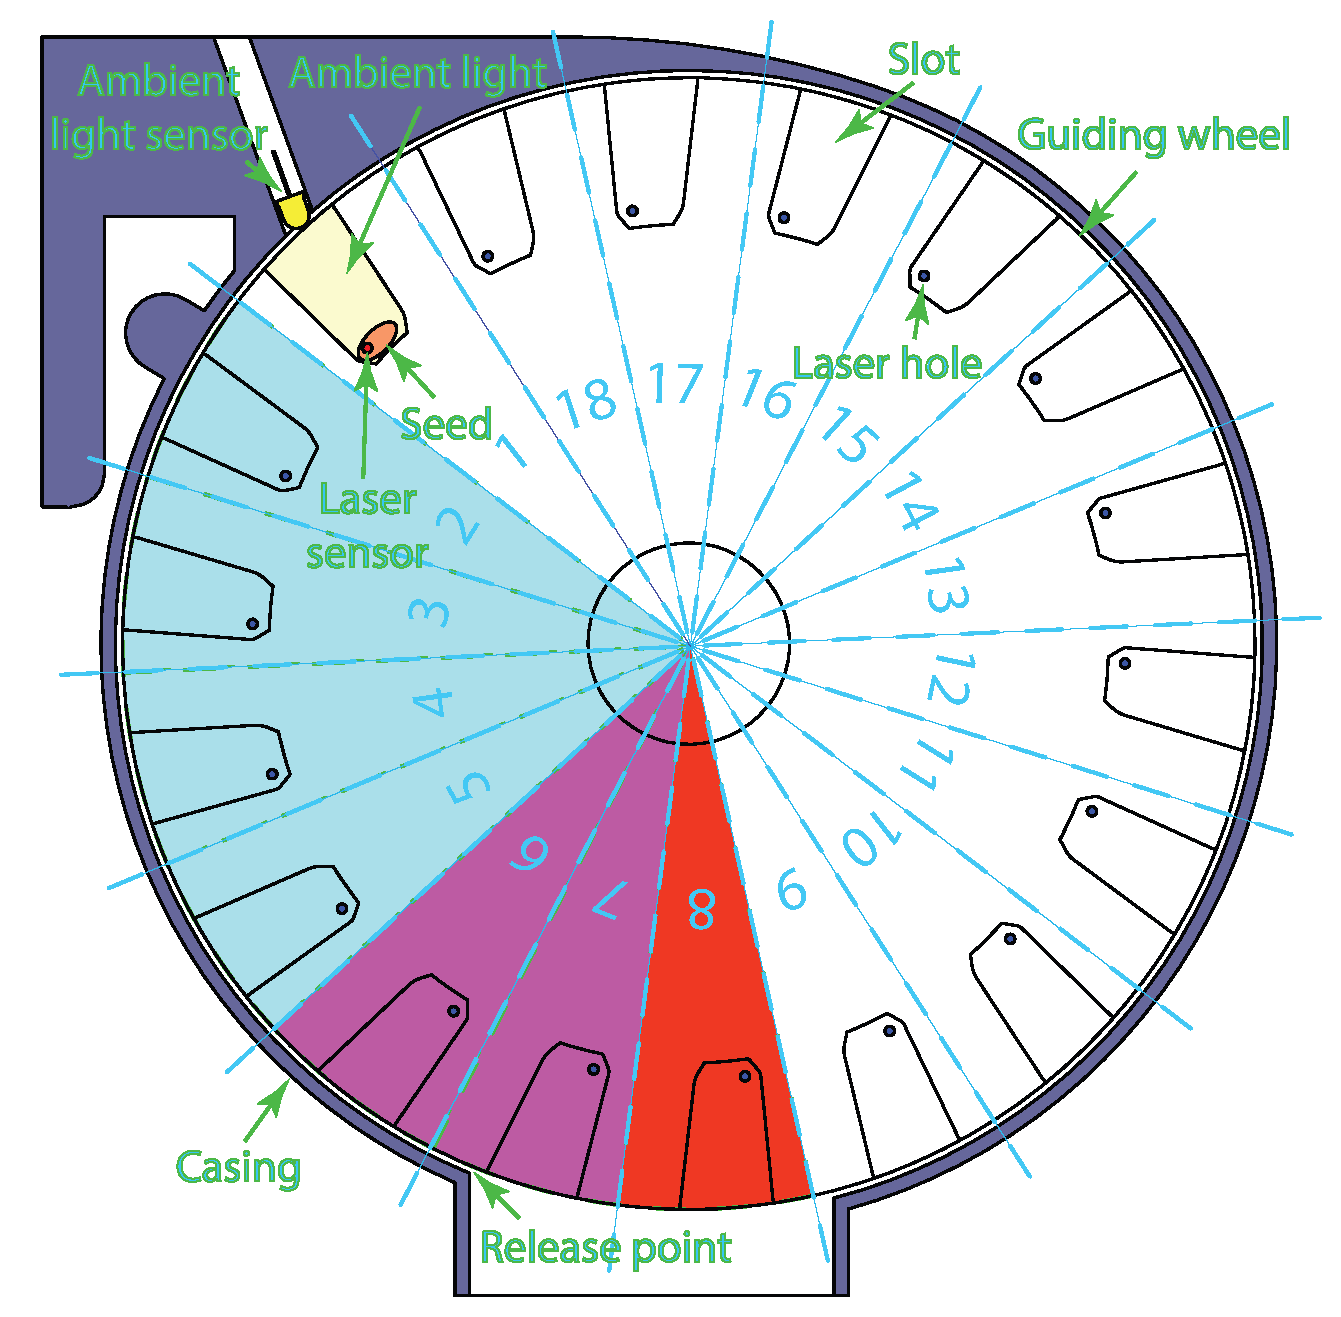
2.1. CAD Model of the Spoon-Wheel Type Precision Seed Metering Device

The CAD model was created by reverse engineering an existing spoon-wheel type precision seed metering device using SolidWorks 2023 SP3.0 (Zhengzhou, Henan, China) Key measurements including the spoon-wheel diameter, grooves dimensions, angular spacing between metering pockets, and additional critical components of the metering device were precisely captured to reproduce the spoon-wheel type precision seed metering device geometry, as presented in Figure 1.

2.2. Working Principle of the System

The Seed Miss Prevention System operates similarly to the original system described in the research by Nikolay et al. [19]. Since the system utilizes the guiding wheel of the metering device (Figure 2), the number of grooves (slots) is predetermined and, for this particular model, is equal to 18. The selected sensor position was determined based on the results of the DEM simulation. If a single or double seed miss is detected, the system waits for four sectors (2–5) before applying a speed increase for two sectors (6 and 7) in the case of a single miss or three sectors (6–8) in the case of a double miss.
A key difference from the original system is the presence of an ambient light sensor (added at later stage), which serves as a confirmation signal to filter out false seed miss detections. If the main sensor (laser sensor) detects a seed miss, the algorithm checks whether the ambient light level has increased. If no increase is detected, the miss is registered; otherwise, it is discarded. The additional (ambient light) sensor was added after obtaining unsatisfactory results with a single sensor setup (see Section 3).

2.3. DEM Simulation

In this study, Altair EDEM 2023.1 (version 9.1.0) was utilized to simulate the seed flow inside the metering device. By analyzing simulation results such as a detailed analysis of seed trajectories, accumulation points, and dispersion patterns, research aimed to determine the optimal location for the laser sensor.

2.3.1. Bulk Material Properties

To accurately define the bulk material in EDEM, the following properties are required:
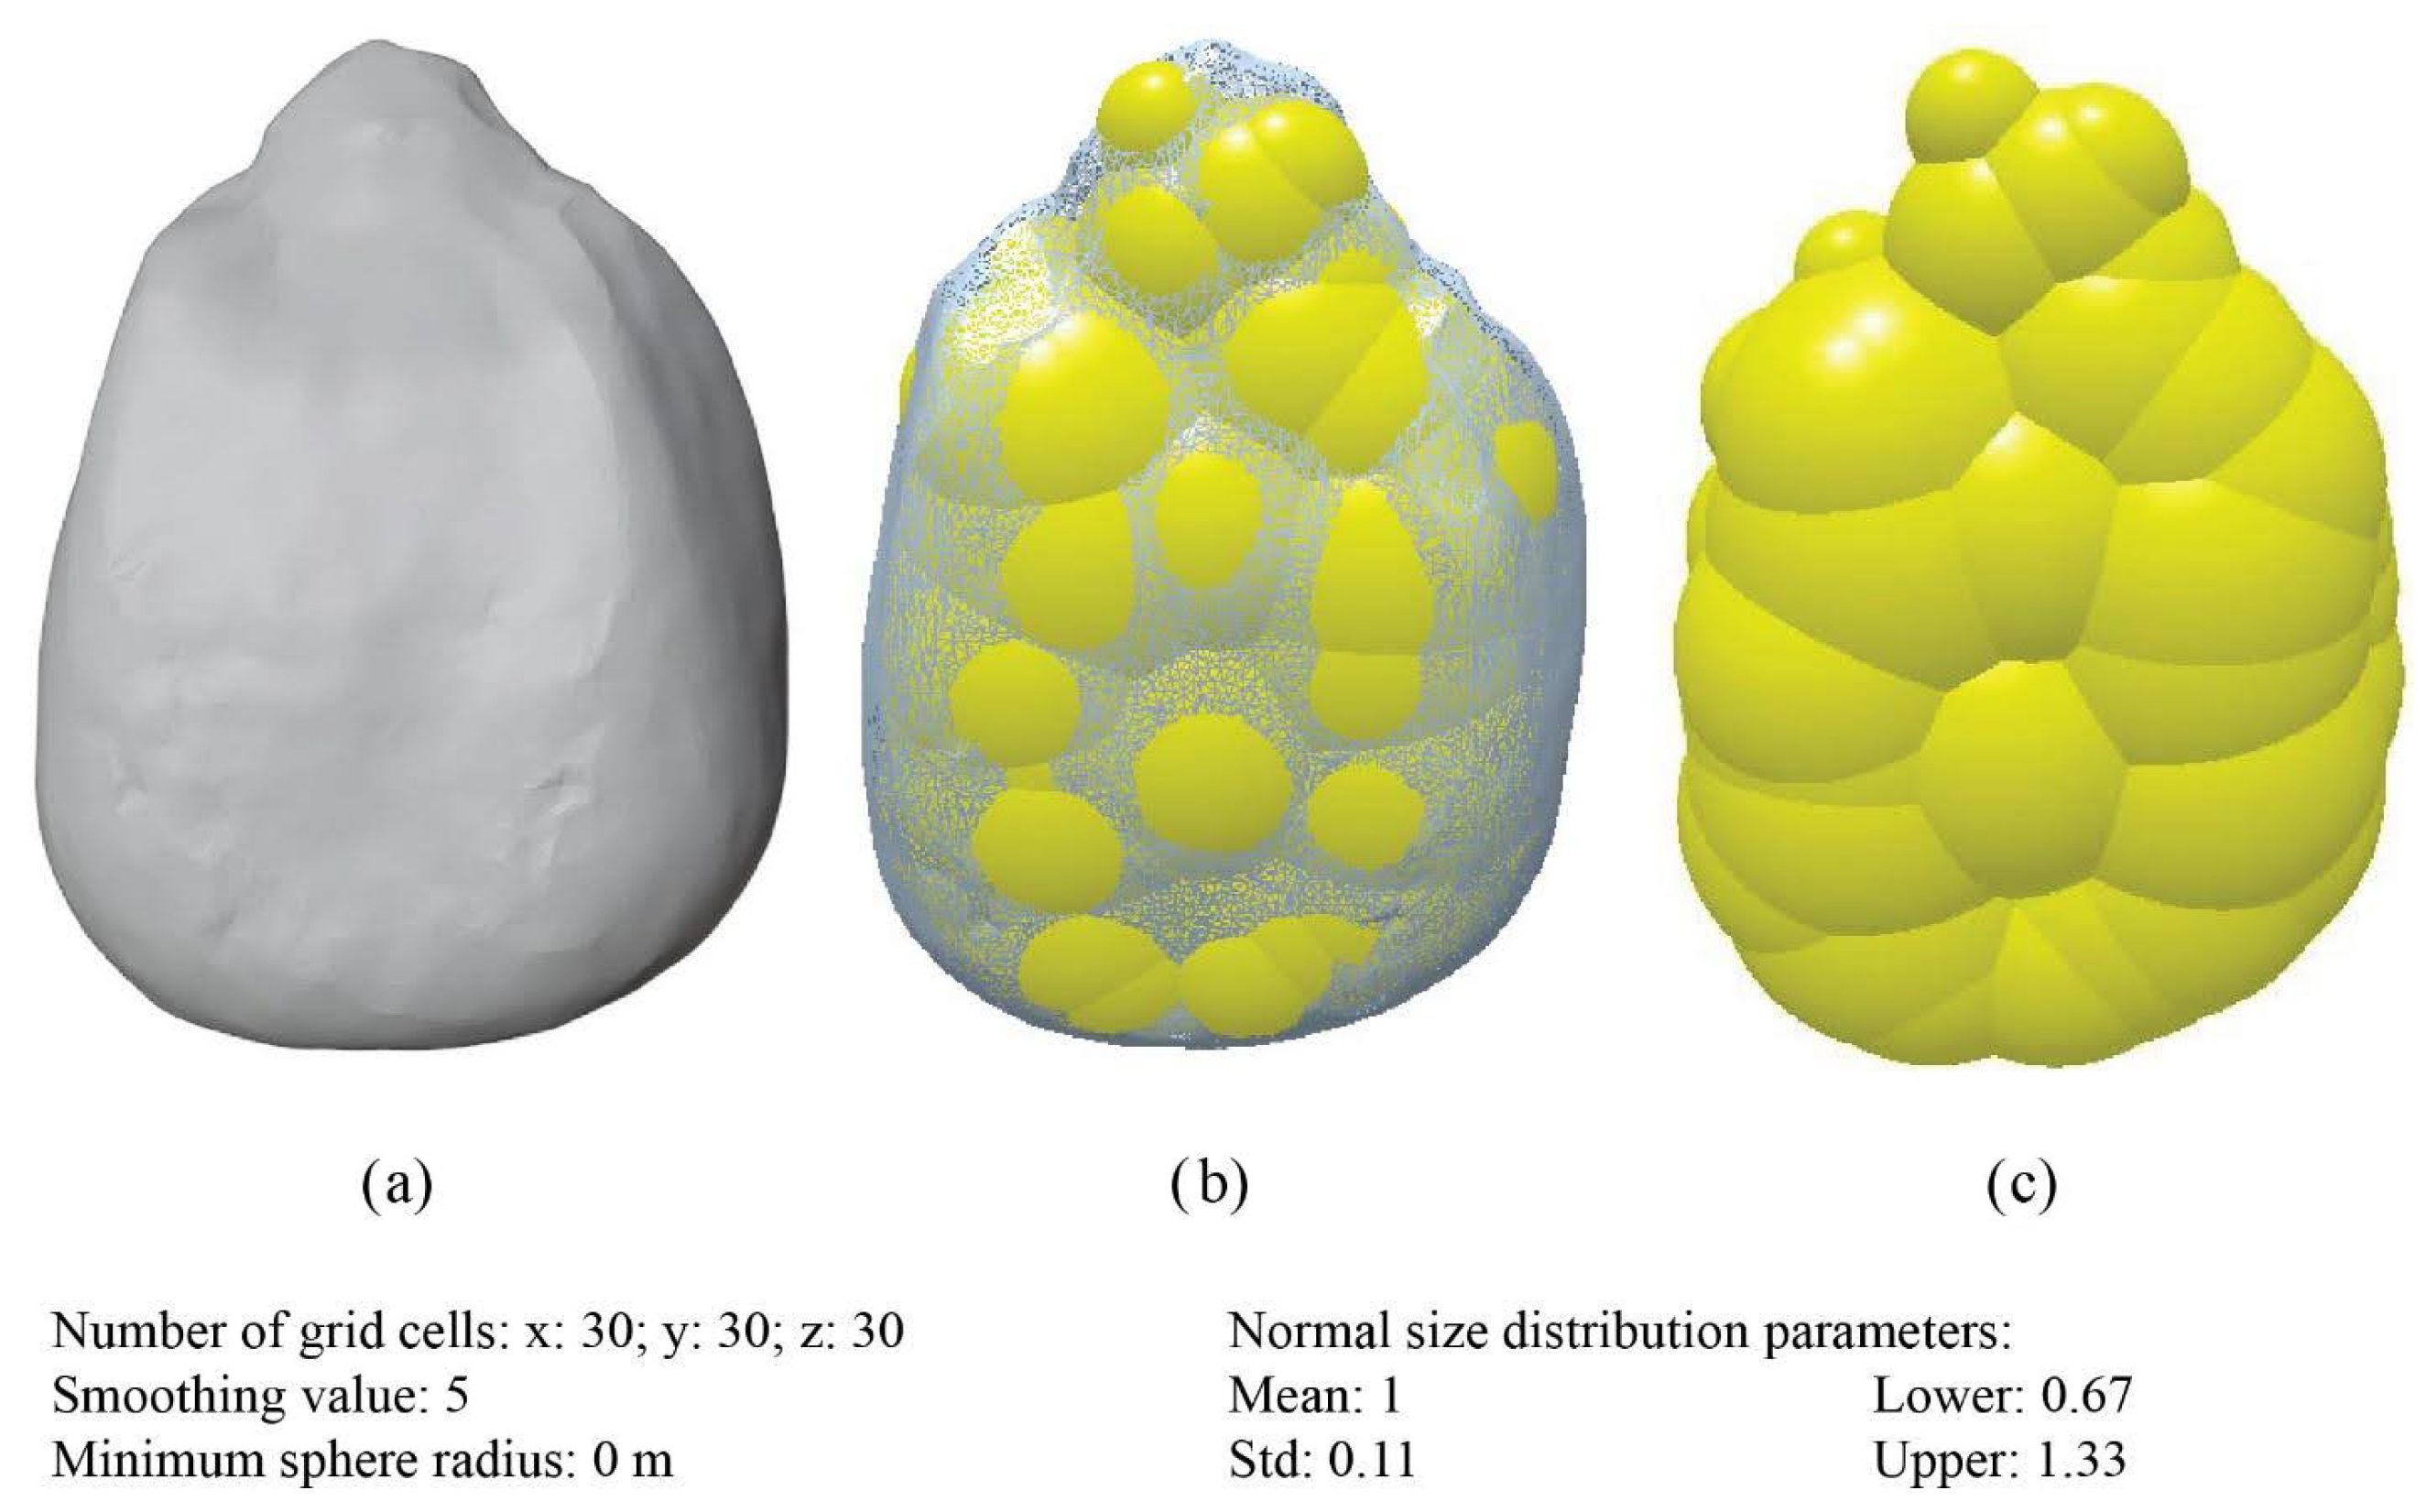
  • Particle shape: The particle shapes were created by scanning 10 randomly selected corn seeds (Figure 3a) using a 3D scanner, similar to Li et al. [40]. Scanned seed meshes were then imported into EDEM software (Figure 3b) as seed templates. To create final particle shapes (Figure 3c), EDEM Particle Shape Editor was used. These particle shapes were then used to create a granular material model of corn seeds similar to Chen et al. [9] but more detailed, varying from 40 up to 70 spheres per particle.
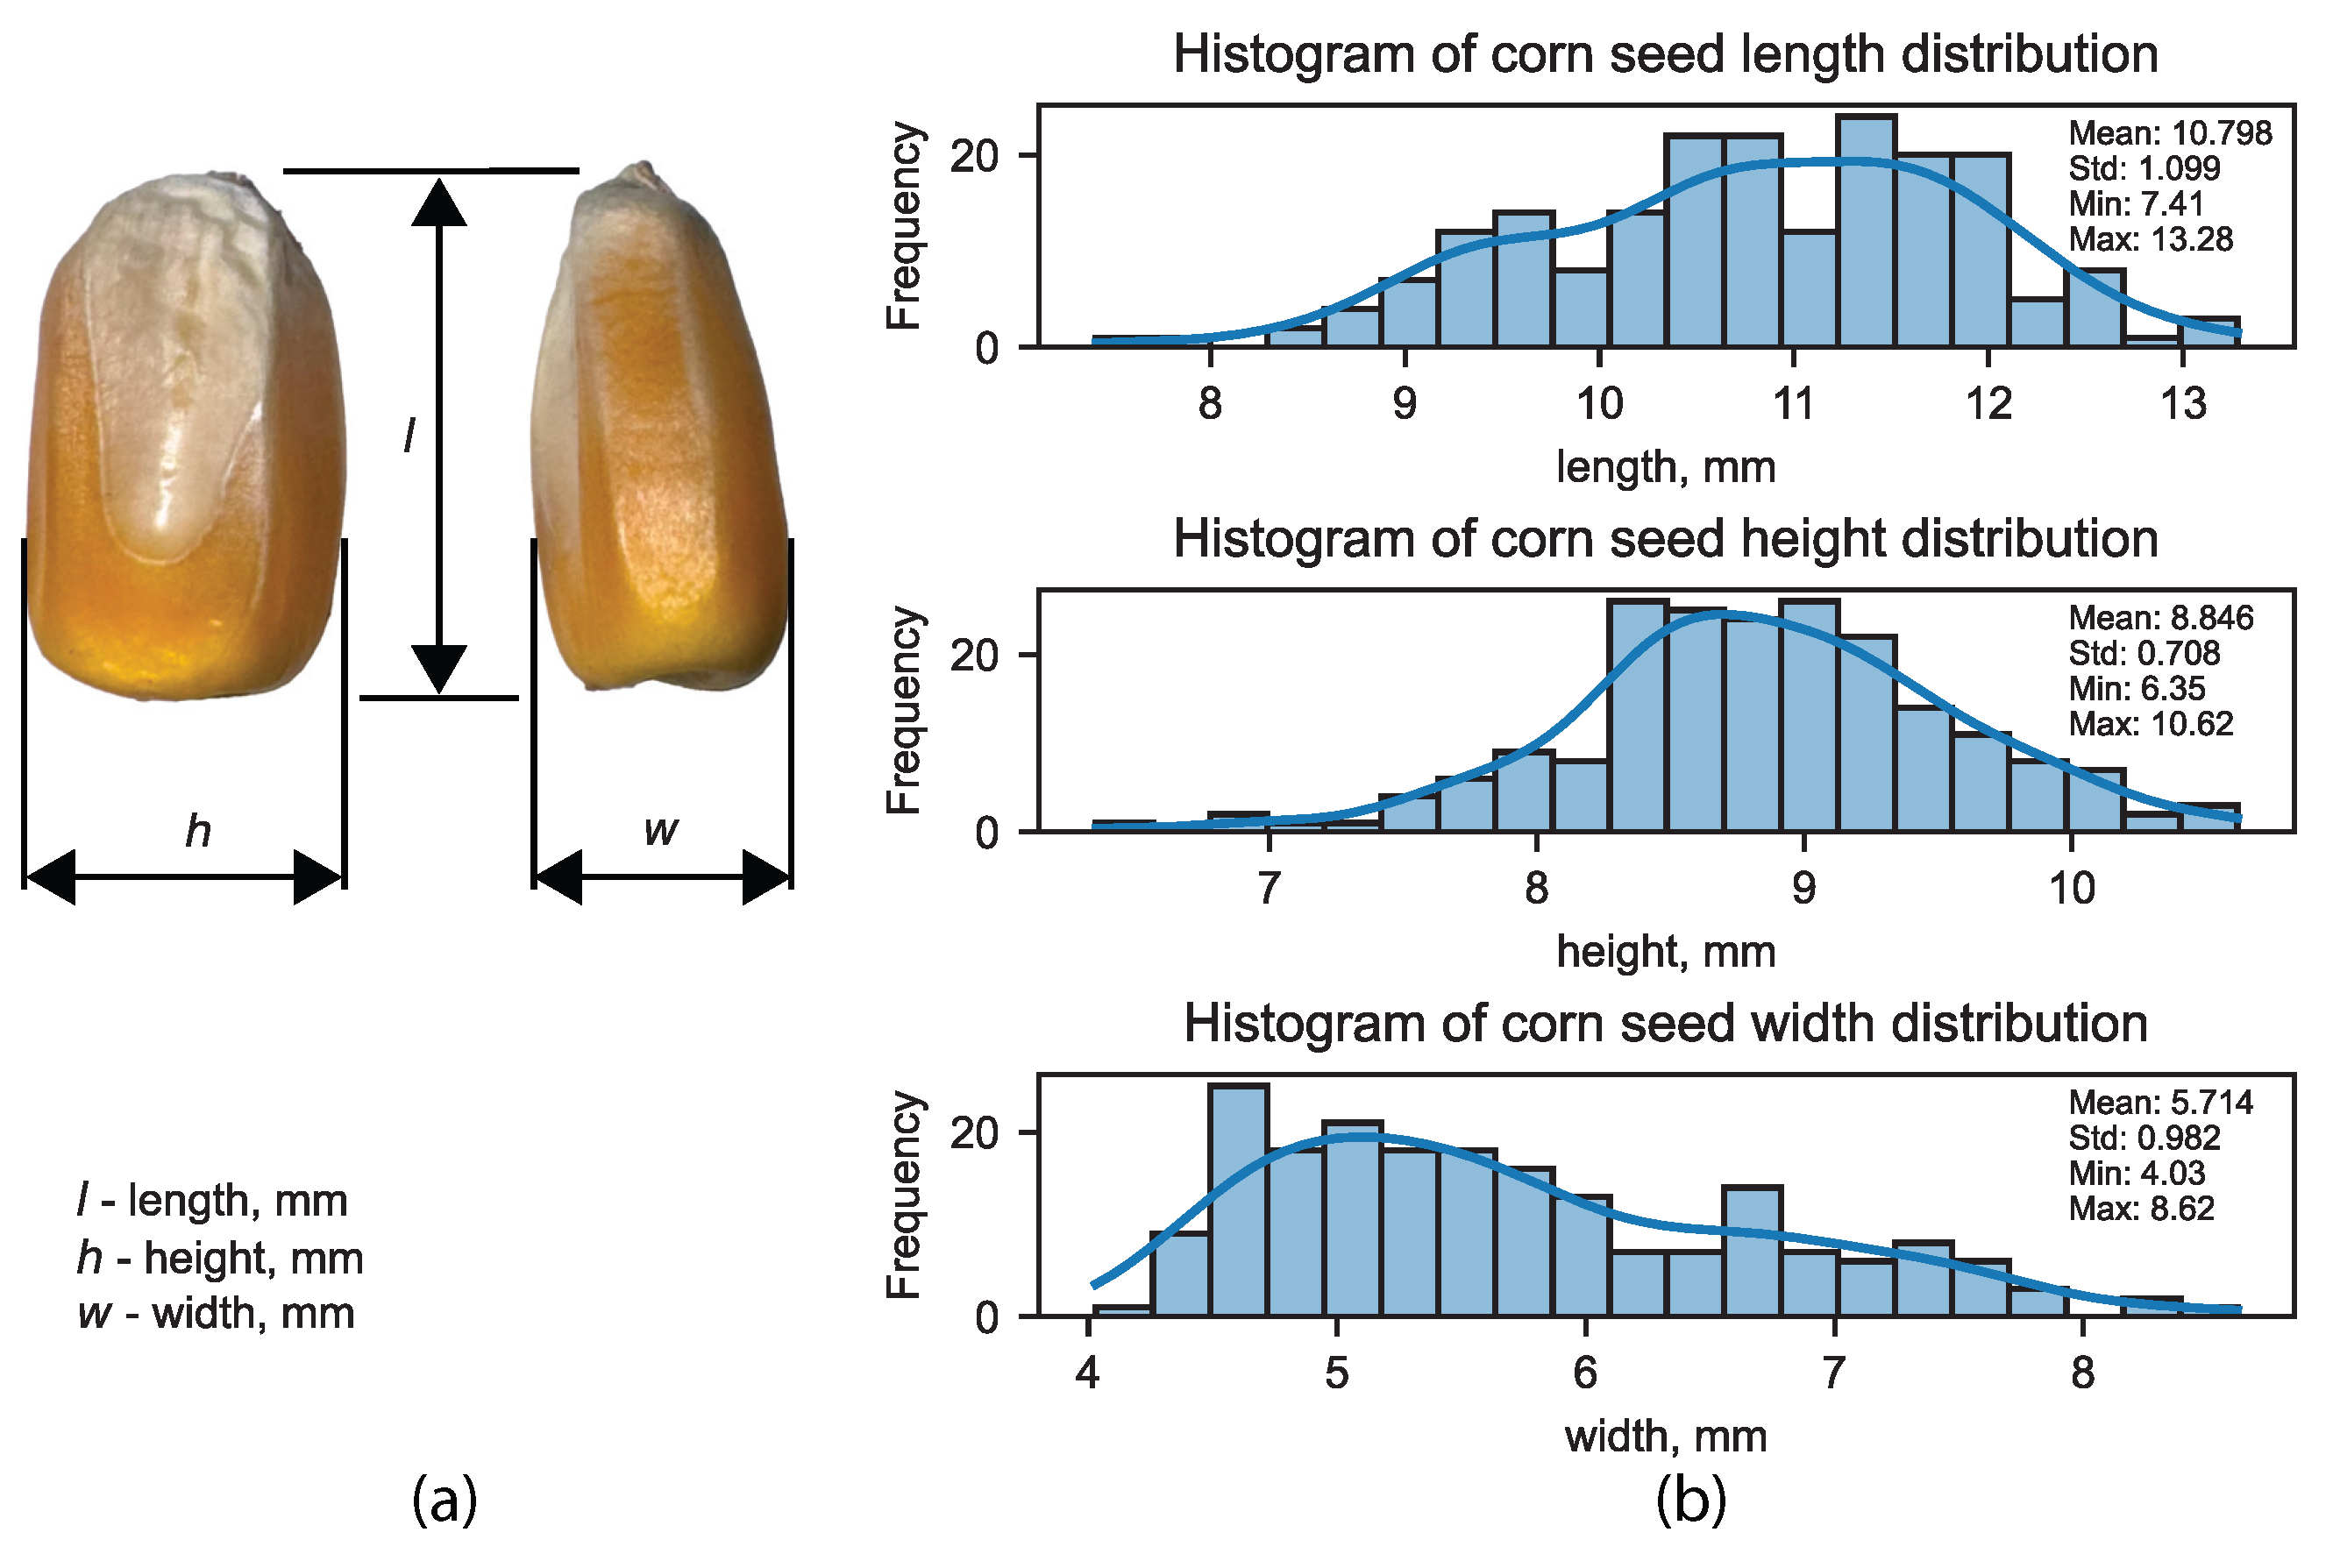
  • Particle size distribution: The size distribution of the particles in the bulk material should be defined. This can be carried out using experimental data or by generating, though less precise, an approximate size distribution. To analyze the seed distribution, 200 randomly chosen corn seeds were measured with the 3-dimensional parameters as shown in Figure 4a. The resulting standard deviation value was formed by taking an average from all 3 dimensions (Figure 4b) in order to obtain the single scale factor for DEM. In order to obtain this value, the average standard deviation value was scaled by the average dimensions, Equation (1). The resulting scale factor was then used, and then, the particle was generated using normal distribution.
    S = H s t d + L s t d + W s t d H x ¯ + L x ¯ + W x ¯
    where
    S—scale factor for EDEM simulation;
    H s t d —standard deviation of the seed height, mm;
    L s t d —standard deviation of the seed length, mm;
    W s t d —standard deviation of the seed width, mm;
    H x ¯ —average height of the seed, mm;
    L x ¯ —average length of the seed, mm;
    W x ¯ —average width of the seed, mm.
    For each particle, upper and lower bounds were defining by adding and subtracting 3× of the scaler factor value, Equations (2) and (3).
    B min = 1 3 S
    B max = 1 + 3 S
    where
    B m i n —minimum scale factor of randomly generated seeds;
    B m a x —maximum scale factor of randomly generated seeds.
  • Material properties: The material properties of the particles, such as density, elasticity, coefficient of friction, and coefficient of restitution, should be defined. The material properties of the simulation materials including corn grains, galvanized steel, and acrylic plastic (polymethyl methacrylate PMMA) in EDEM have been well-defined in Chen et al. [41]; Simões et al. [42]; Wang et al. [43] Horabik and Molenda [44]; Stigh and Biel [45]; and Pawar [46]. The parameters used in the modeling are presented in Table 1.
  • Particle–particle interaction properties: The properties that govern the interaction between particles, such as the contact stiffness, damping, and friction coefficients were obtained in the literature González-Montellano et al. [38]; Wang et al. [47]; and Batista et al. [48].
  • Particle–wall interaction properties: The properties that govern the interaction between particles and walls, such as the wall roughness and the coefficient of friction, were defined. Based on the material composition of the metering device, corn–acrylic, corn–galvanized, steel and corn–corn interactions must be defined; the properties of these interactions are obtained from previous research Chen et al. [41]; Chen et al. [49]; Hastie [50]; and Adilet et al. [31].
  • Loading conditions: The loading conditions such as the velocity and mass flow rate of the particles are normally defined at the start of the simulation. However, for ease of simulation, particles were pregenerated to fill the inlet of the seed metering device model, and simulation time was reset to 0. Therefore, these parameters were not further required for the simulation.
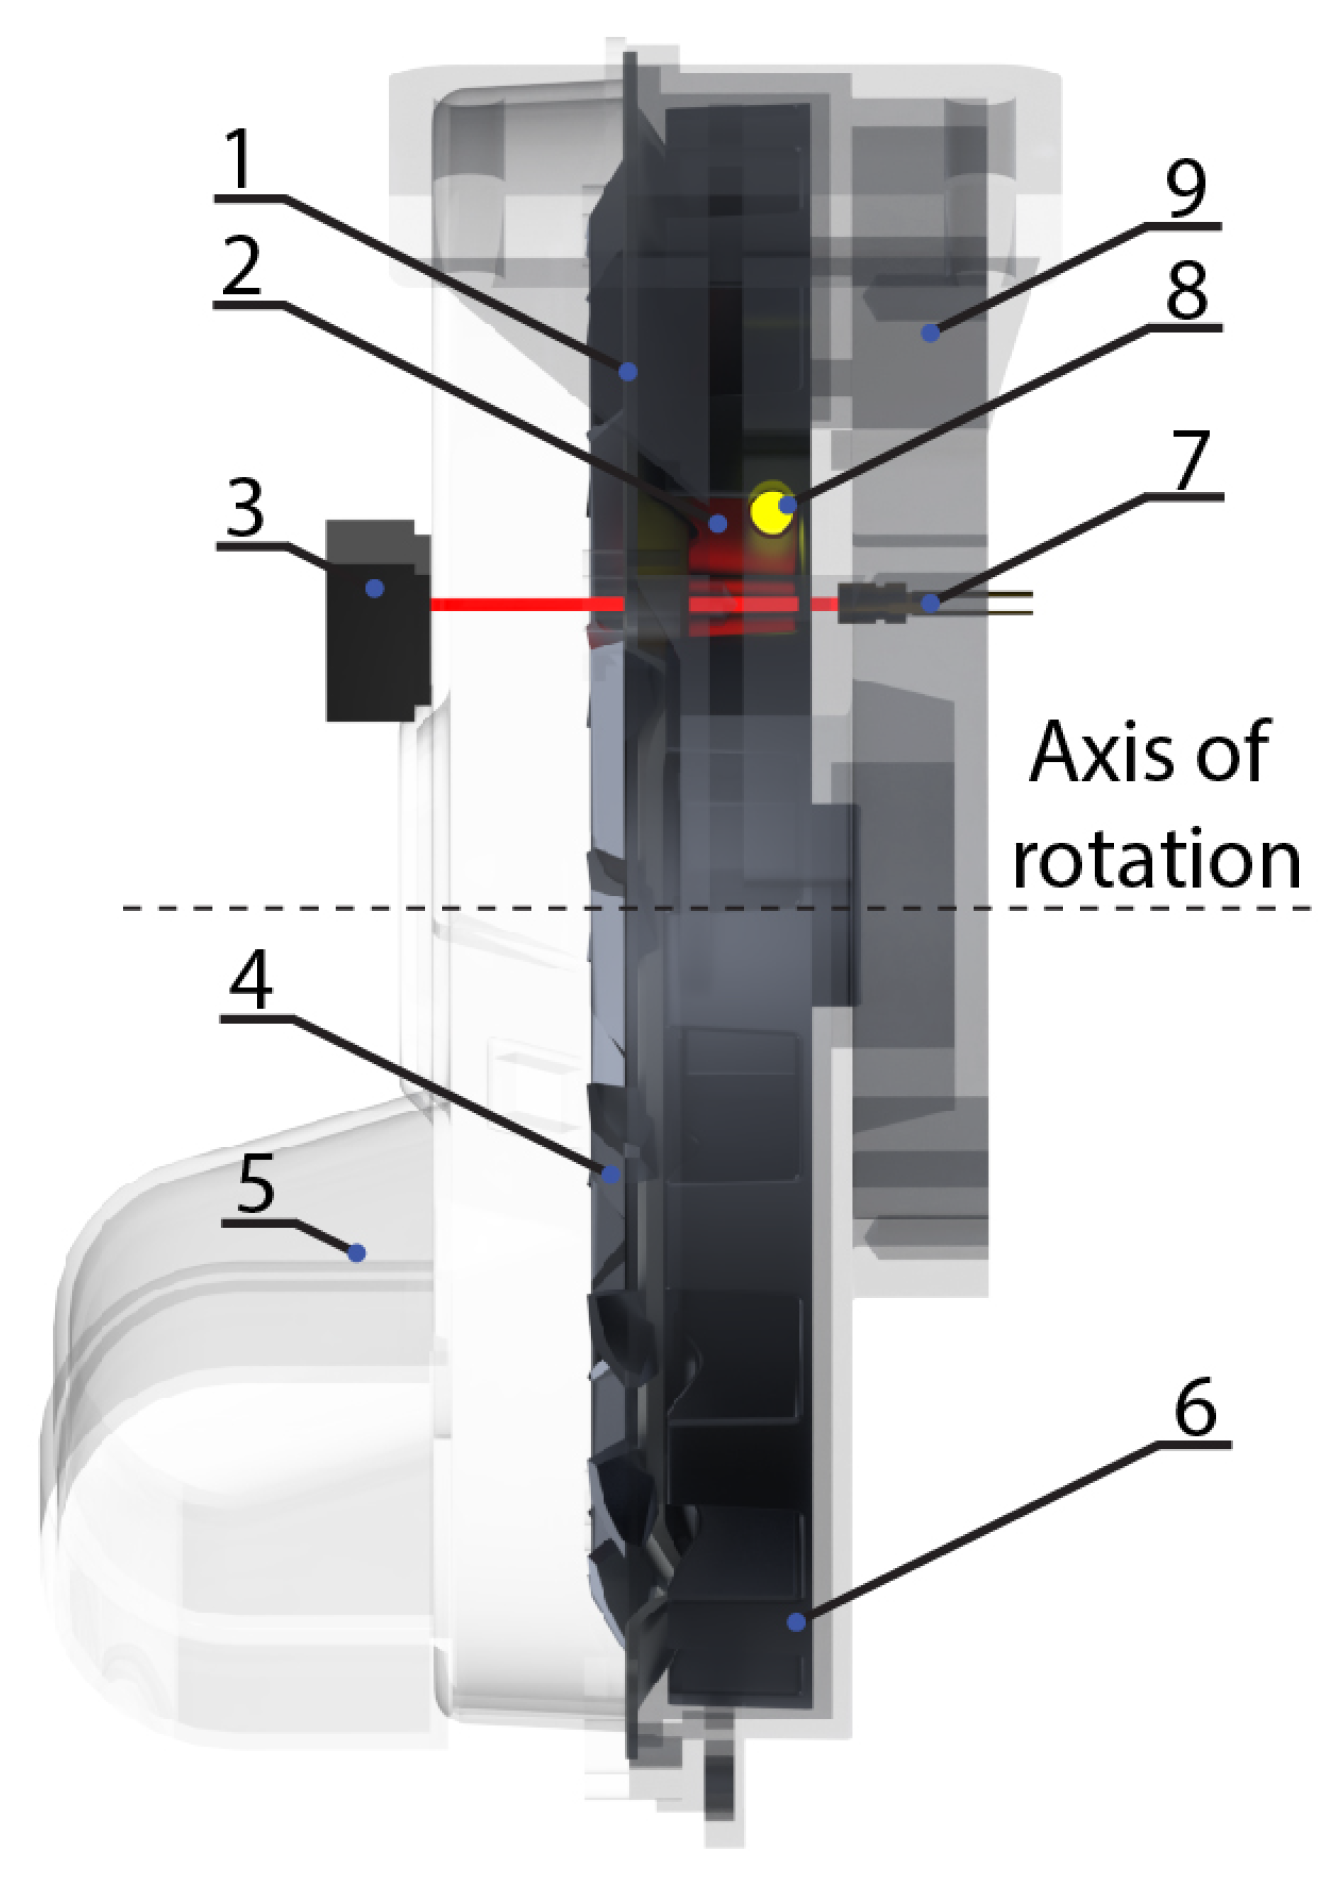
  • Geometry of the simulation domain: The geometry of the simulation domain, including the size and shape of the container, is obtained by simplifying the SolidWorks model of the seed metering device (Figure 1).
  • Simulation parameters: The time integration method was set to Euler, with a fixed time step of 3.45 × 10 6 s. The total simulation time was 30 s. The simulation utilized a GPU solver with NVIDIA RTX3060 GPU. The smallest particle radius was set to 0.00033953 m, and the grid cell size was approximately 1 m.

2.3.2. EDEM Simulation Scenarios

Virtual DEM experiments were performed by rotating a guiding wheel (Figure 1) at the following varying speeds: 2 rpm, 5 rpm, 10 rpm, 15 rpm, and 20 rpm. Each experiment lasted 30 s with the above-mentioned parameters.

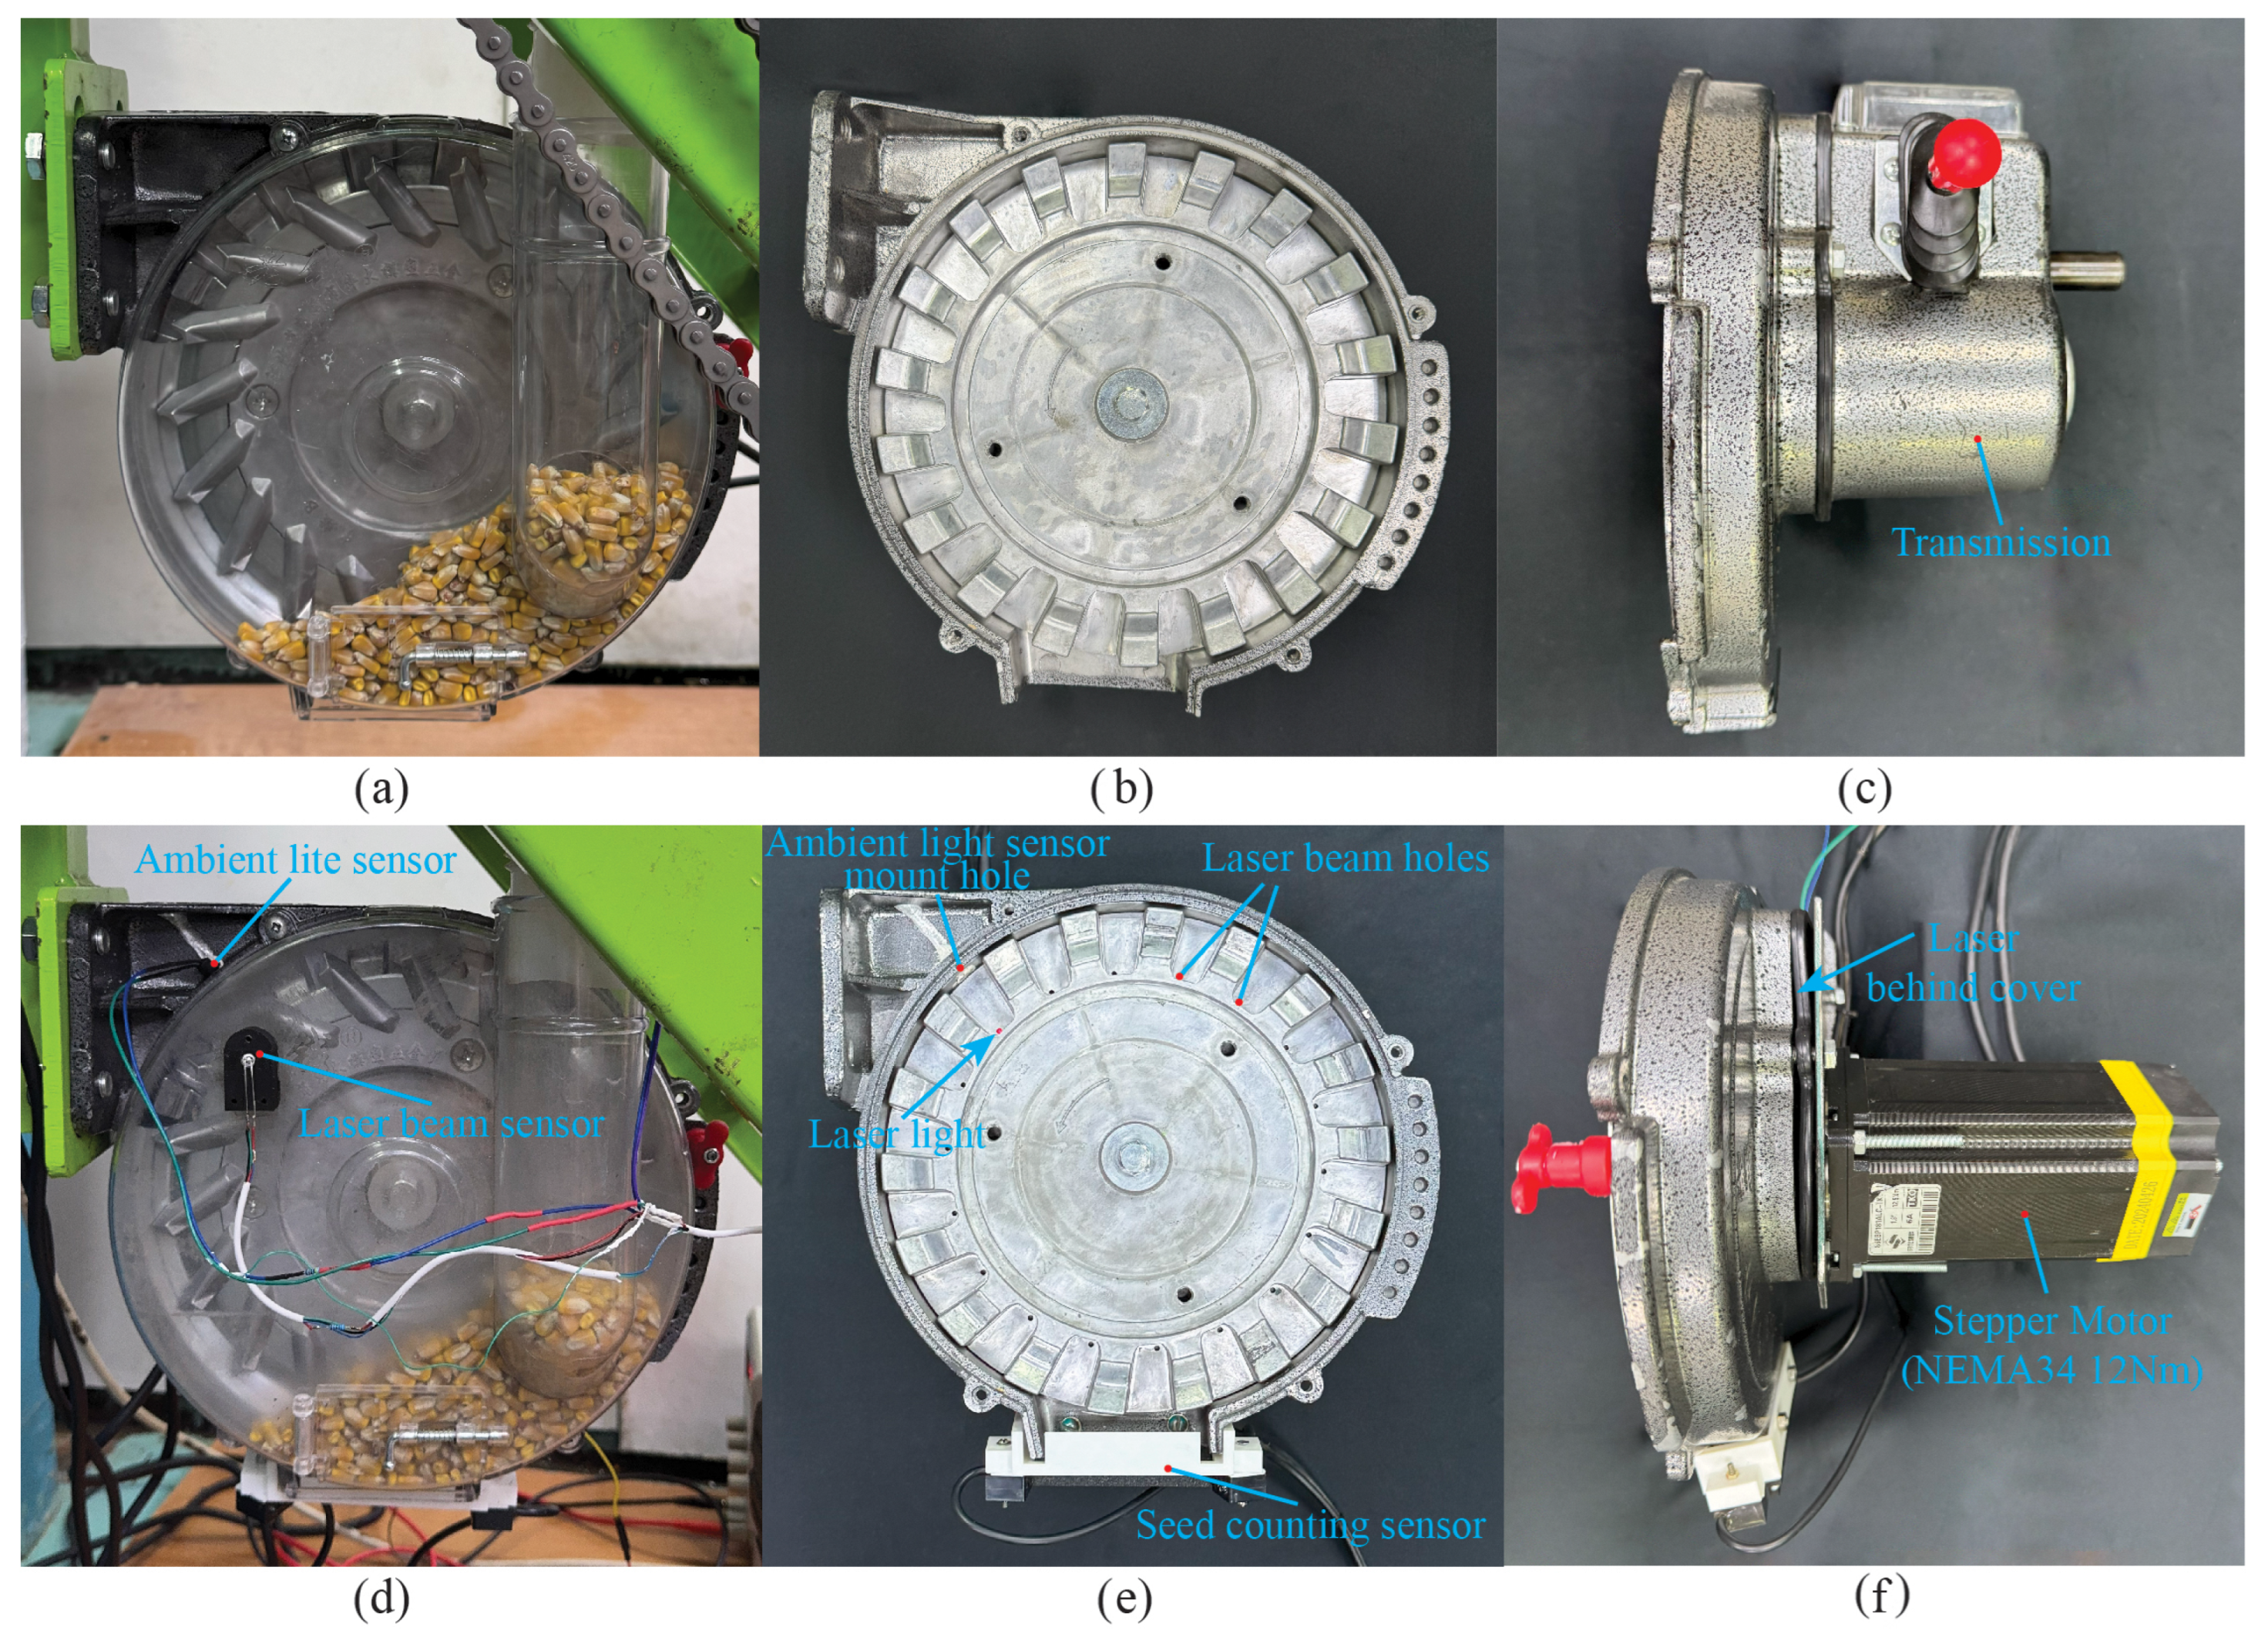
2.4. Retrofitting the Spoon-Wheel Precision Seed Metering Device with a Seed Miss Prevention System

Because of the installation of an additional sensor, the necessity of which was revealed on the later stage of the research, the retrofitting procedure was divided into two stages. The first stage included the installation of the laser receiver pair similar to those presented in research conducted by Nikolay et al. [19]. The second stage included the installation of an additional sensor to detect ambient light reflected from seeds hitting the laser beam to correct false positive seed miss detection; sensor wirings are presented in Figure A1.

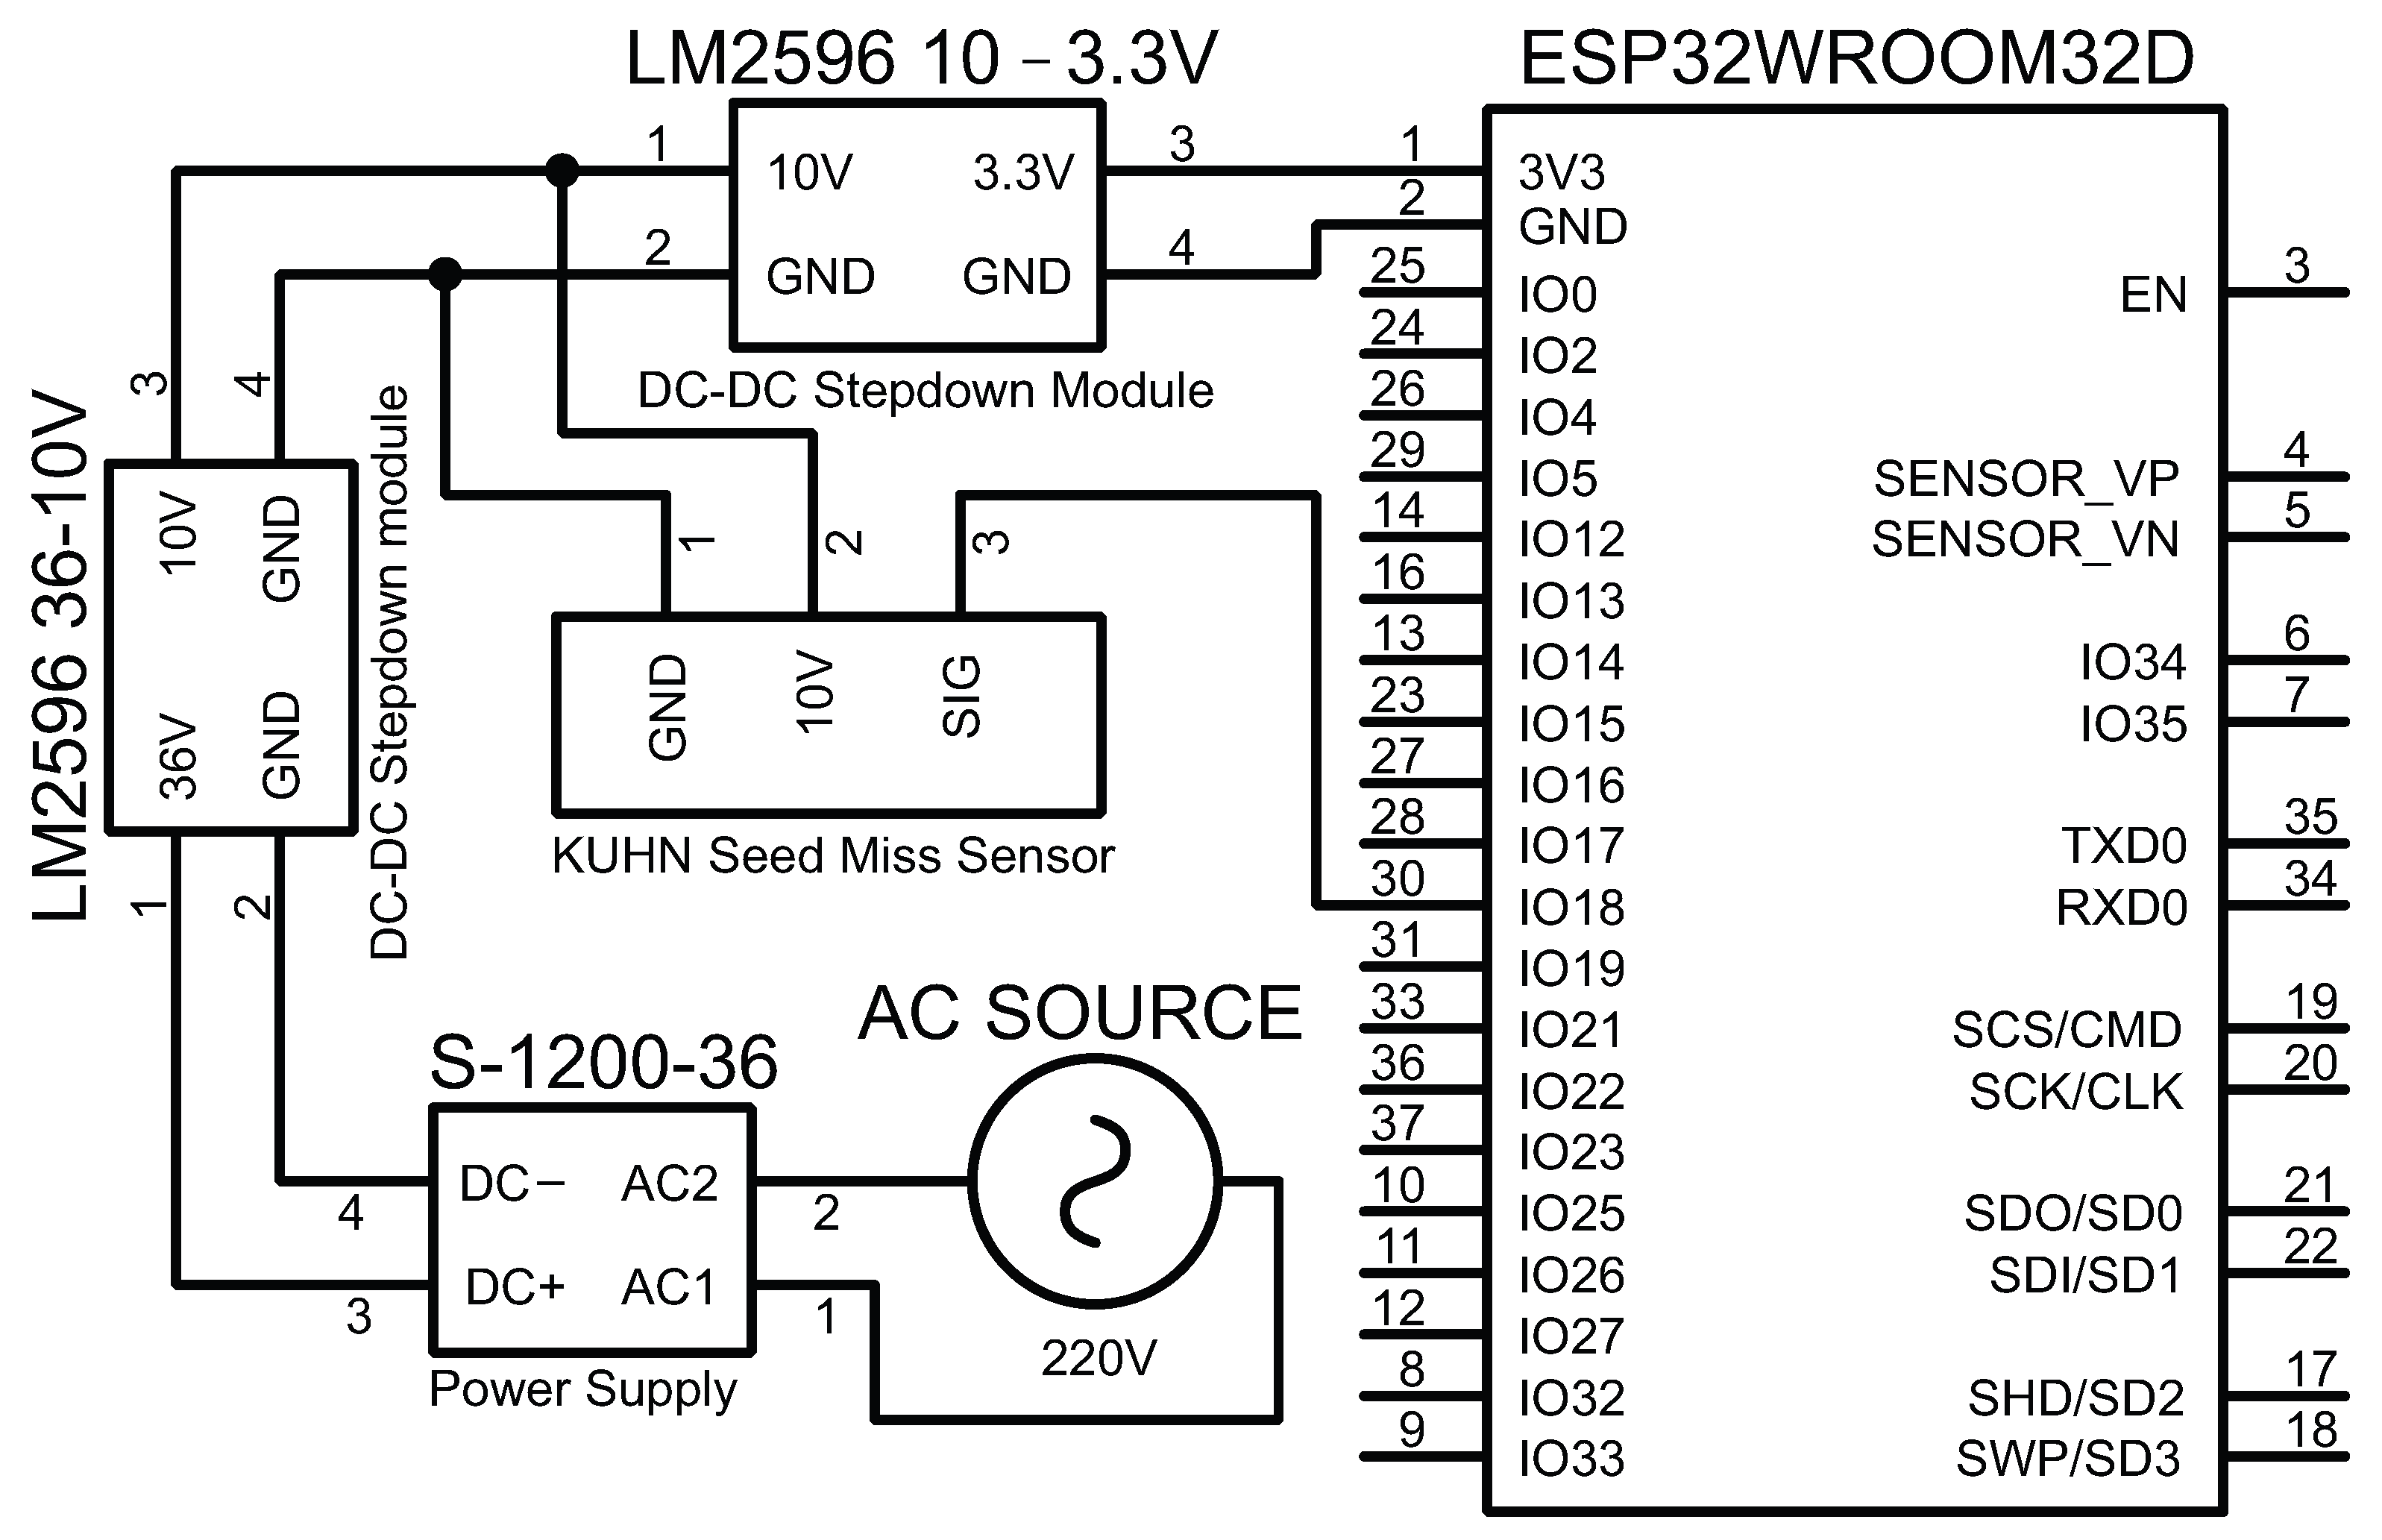
2.4.1. Adapting Seed Miss Prevention System Electronics for Spoon-Wheel Type Precision Seed Metering Device

The control system was implemented on a custom 2-layer PCB, designed in Proteus Software 8.16, featuring the WROOM ESP32 MCU (Figure A2). All seed miss prevention components and the MCU are mounted on a single top layer, with additional routing on the bottom. The MCU (comparable to the WEMOS LOLIN 32) handles the logic and computation. The stepper motor drive and seed miss sensors are connected to sockets 3 and 10, respectively. A total of 5 V power is supplied to the MCU by an AJ32 buck converter via socket 6. Indicator LEDs (7 and 9) and a reset button (9) are also included as power and Bluetooth Low Energy (BLE) connection indicators.
The electronic component’s outside the PCB board includes two SFH314 Silicon NPN Phototransistors for detecting direct beam and ambient light. The power is supplied by variable power supply directly to the stepper motor driver and to the PCB board via an LM2596 stepdown module. Since the intensity of ambient light is lower than the intensity of laser beam; therefore, the resistivity of the voltage divider resistor for the ambient light sensor is significantly higher, Figure 5.

2.4.2. Mechanical Modification of the Seed Metering Device

After determining the location of the sensor in one of the sectors and knowing the required electrical components, retrofitting followed according to the schematic in Figure 2. To ensure the unobstructed passage of the laser beam to the externally mounted laser emmiter (7), precision drilled holes on the guiding wheel (6) were introduced parallel to the axes of rotation of the seed metering device, Figure 6. Specifically, 18 equidistant holes were machined into the circumference of the guiding wheel, while a single hole was integrated into both the partition plate and the front cover to facilitate the beam’s passage. Additionally, an extra opening was provided for an ambient light sensor (Figure 6) positioned at the upper section of the metering device.

2.4.3. Software Implementation and Control System

The software of the system is realized on ESP32 and programmed on C using the Arduino framework and Platform.io add-on of VS Code software (version 1.90.2). The software is similar to those presented in the research of Nikolay et al. [19]. The new additions are BLE communication with an Android device and saving the configurable parameters to Electrically Erasable Programmable Read-Only Memory (EEPROM).
The user interacts with the board via specially developed software implemented on Android device, Figure A3. The software version 1.0.3 (Android app) was developed in Android Studio using Kotlin programming language. All testing was performed on a Samsung Galaxy Tab S10 tablet (manufactured by Samsung Electronics Co., Ltd., Suwon, Republic of Korea). The application allows us to choose different rotational speeds for the seed metering device, count and reset detected seed misses, start and stop the motor as well as set the calibration coefficients and mode settings which are retrieved and saved in EEPROM of ESP32 using BLE in a similar way to the research conducted by Zagainov et al. [51].

2.5. Laboratory Experimentation

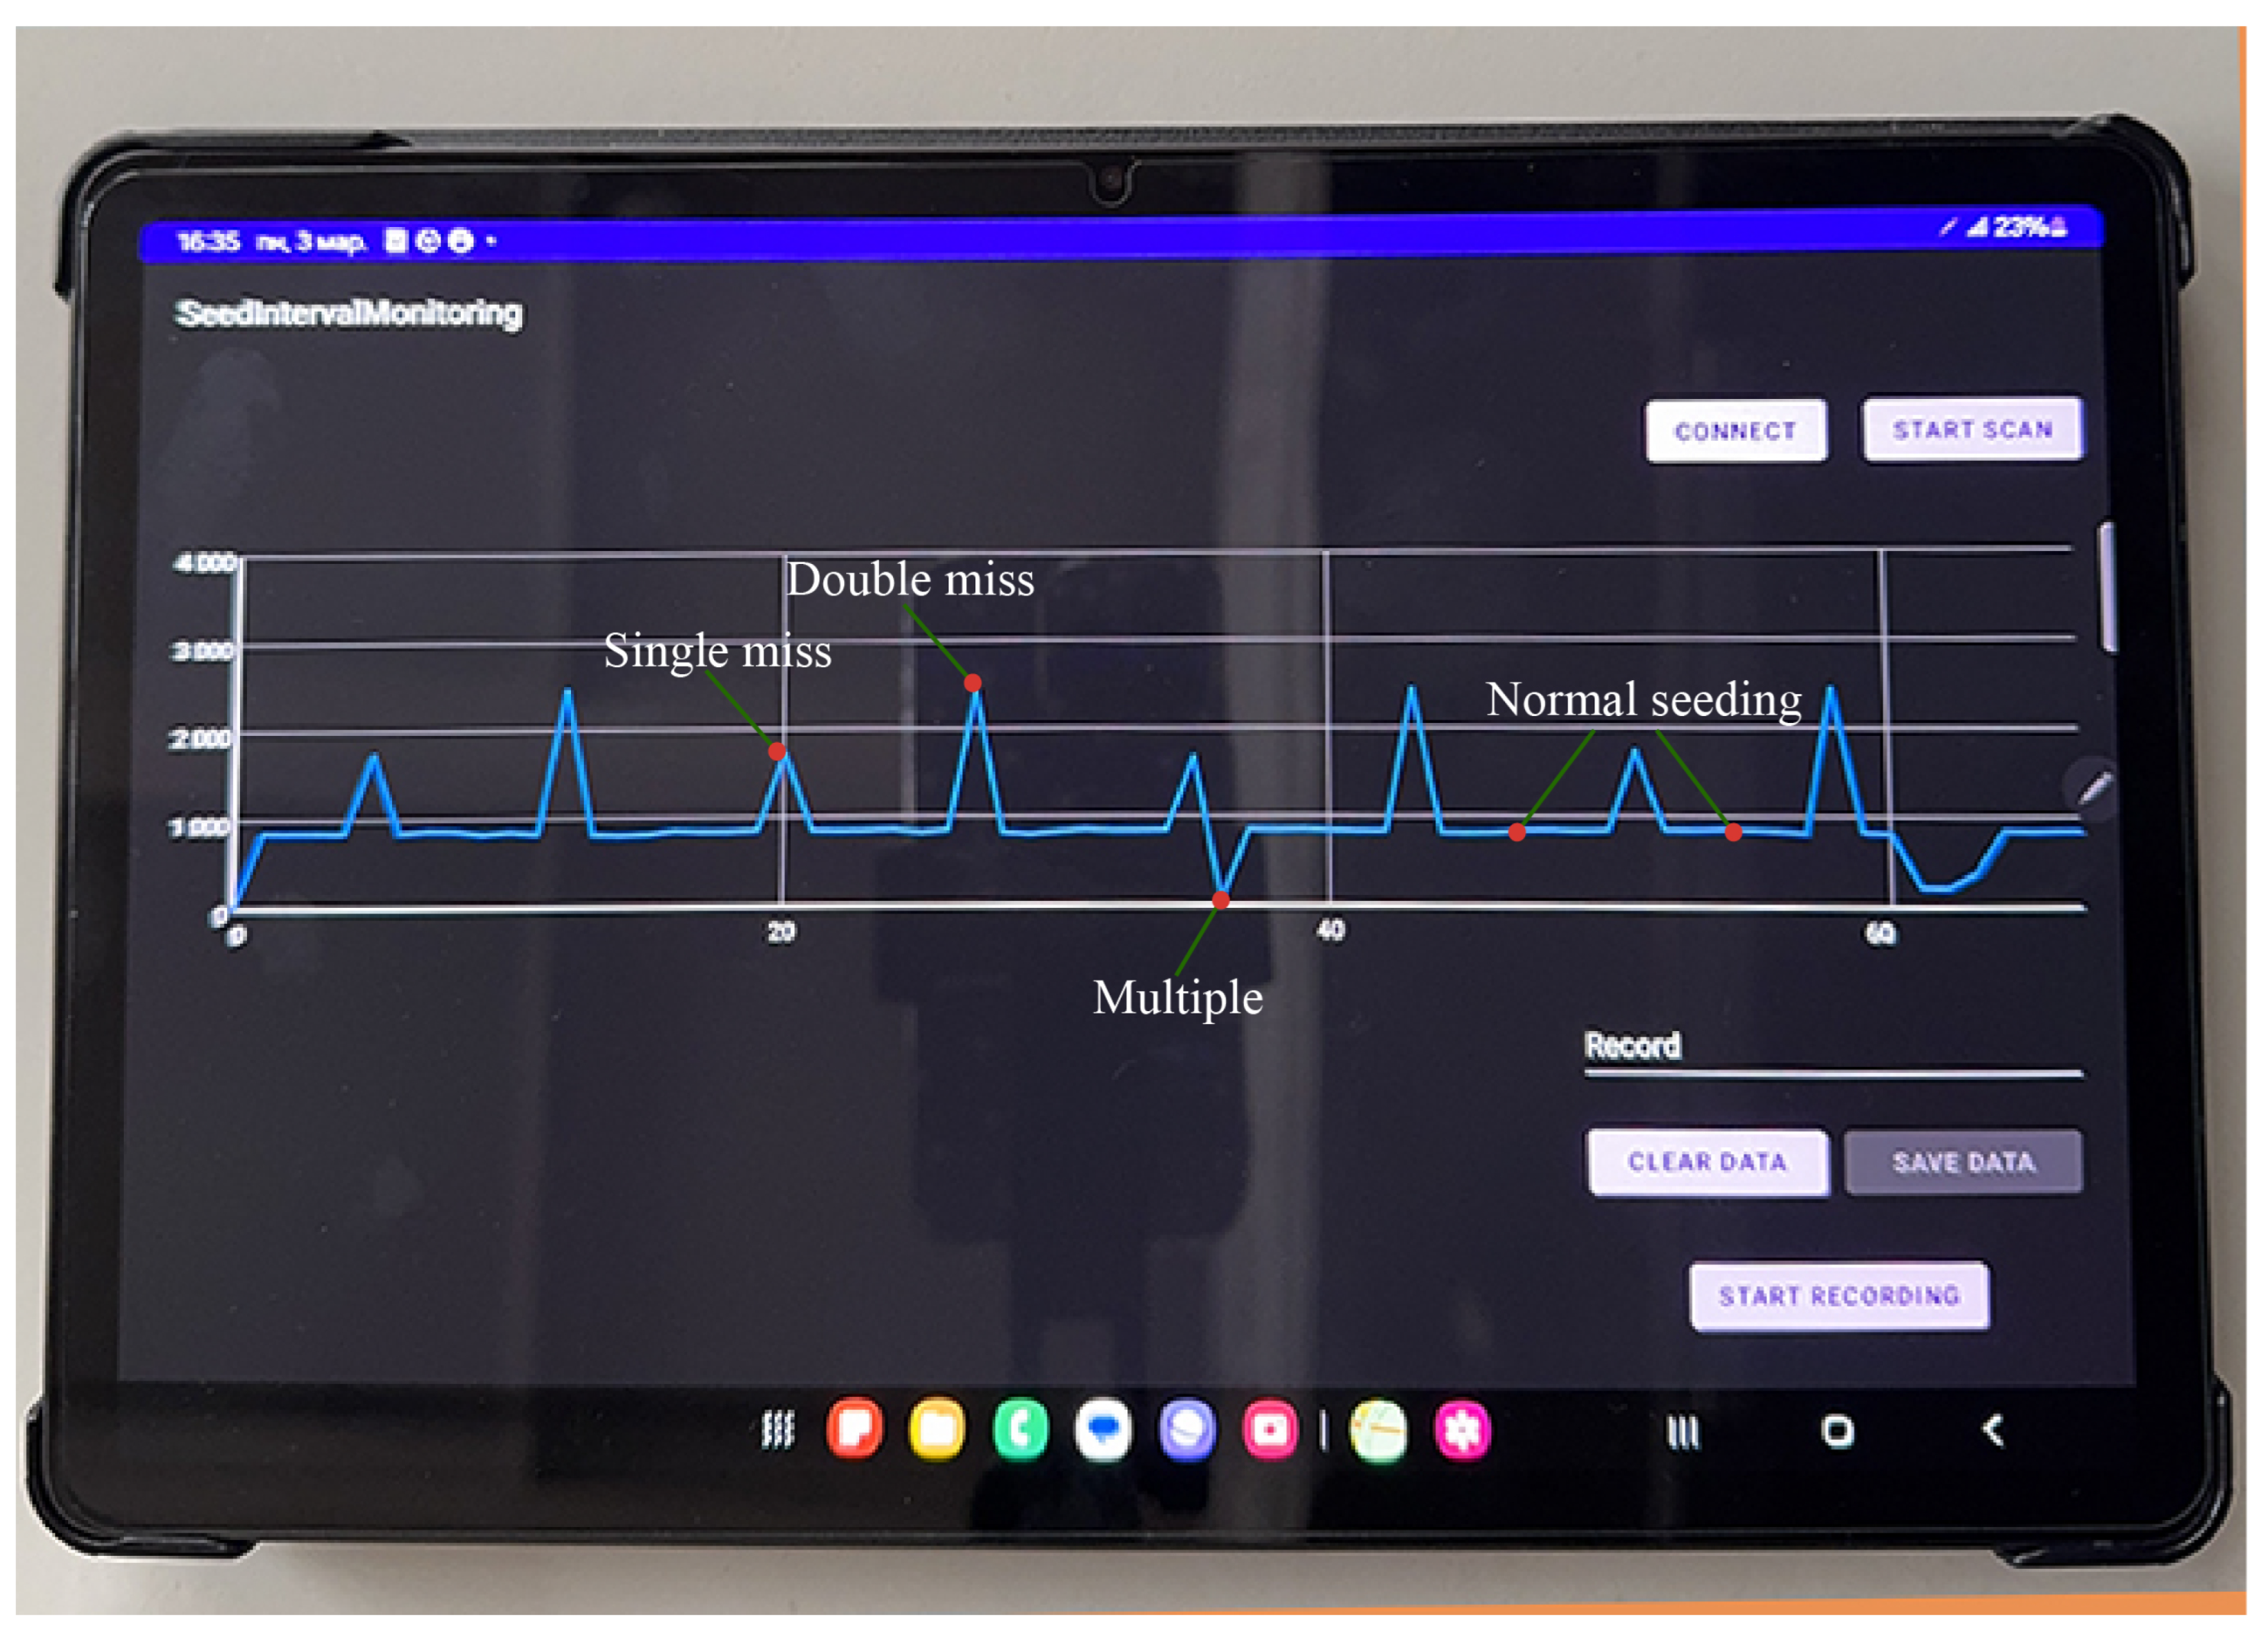
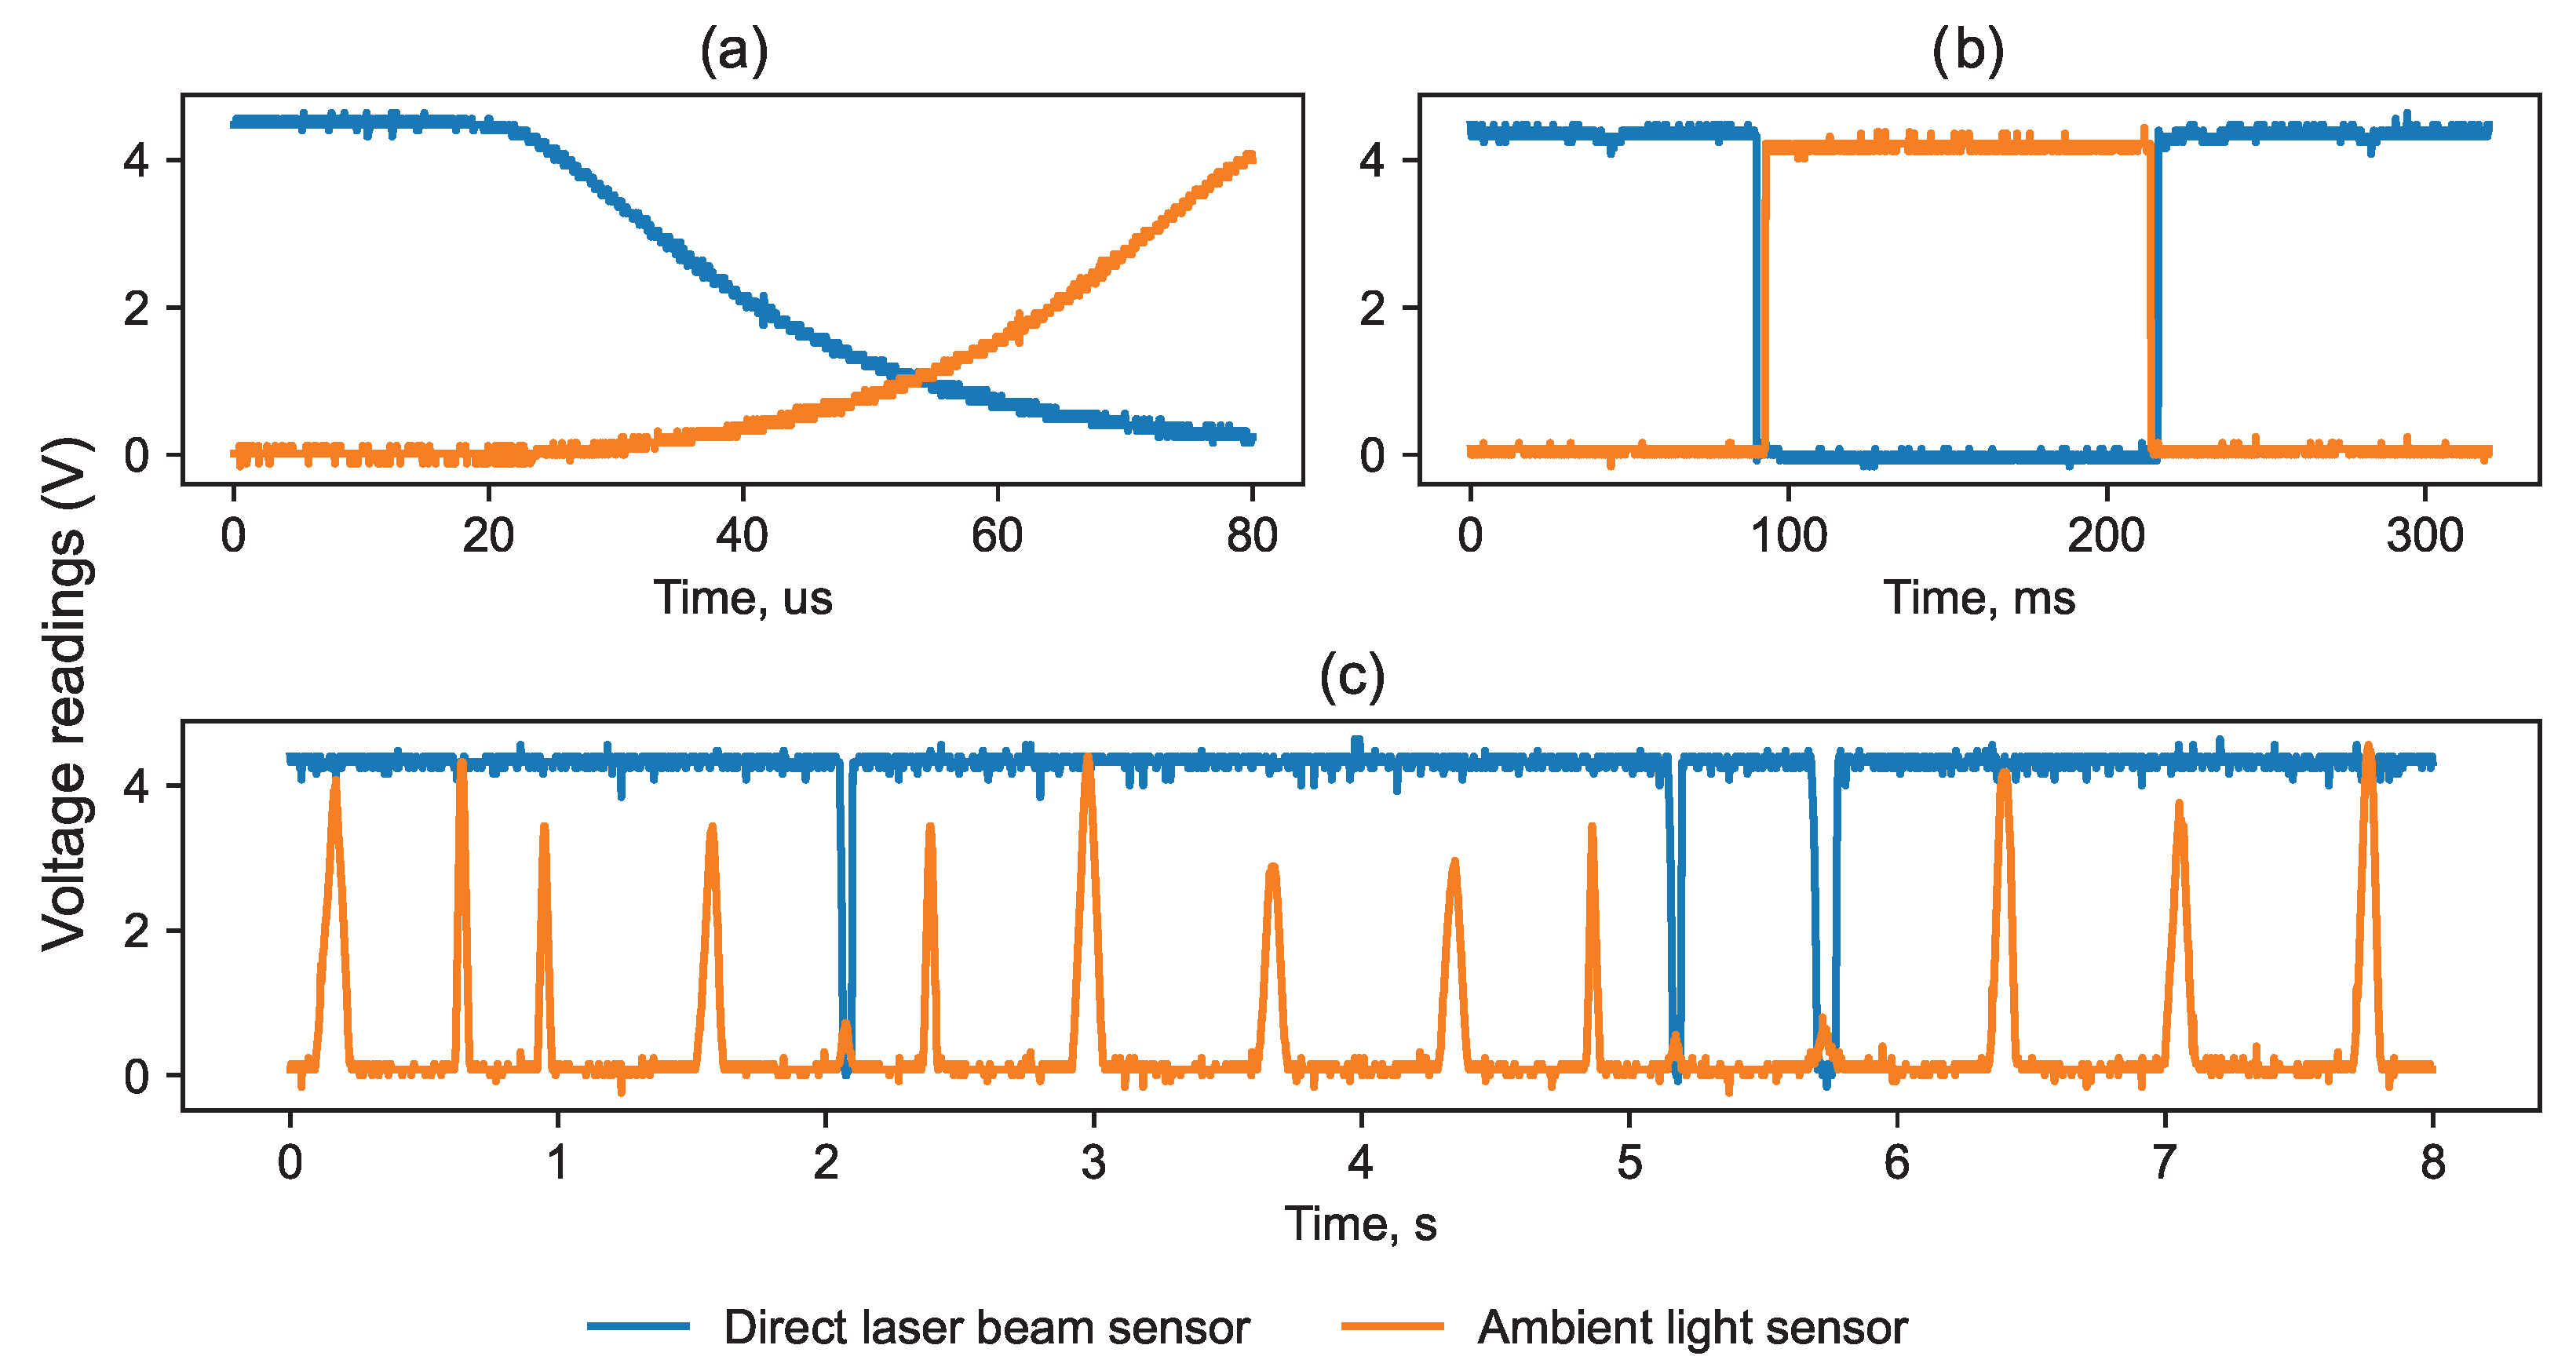
2.5.1. Design of Data Acquisition Instrumentation

Seed metering during sowing occurs within millisecond intervals, making precise speed control essential. To accurately record both the timing of seed releases and any missed seeds, a dedicated seed miss counting sensor was installed The experiment was conducted using the proprietary seed counting sensor Planter 2NPN KUHN (Figure A4) in combination with previously developed software (Figure A5), as described by Zagainov et al. [51]. The sensor and its controller have an 8 V to 10 V input voltage range and a 0.05 A current, and therefore, they required a different voltage range than ESP32 (3.3 V). Since the data acquisition hardware are intended to be powered from the same source (36 V), two voltage step-down modules were installed into the casing along with ESP3, Figure A4. The full electric schematic is presented in Figure A6. Similar to previously conducted research, data were transmitted from ESP32 to an Android device with the above-mentioned software for data storage and transmission.

2.5.2. Design Experiment

To evaluate the performance of the modified Seed Miss Prevention System under controlled laboratory conditions, a comparative research was conducted between the retrofitted seed metering device (experimental unit) and its conventional counterpart shown in Figure 8. The experiment was designed to assess the system’s performance across several agricultural row crops, including corn (Zea mays), sunflower (Helianthus annuus), common bean (Phaseolus vulgaris), and pea (Pisum sativum). Furthermore, by considering variations in seed physical properties such as size, shape, density, and friction. The following two distinct types of corn seeds were used: conventional hybrid breed seeds (specifically Dekalb DKC5032) and seeds extracted directly from corncob obtained from the seed bank of Saken Seifullin Kazakh Agrotechnical Research University. The latter, predominantly of the horse-tooth type (Zea mays indentata), as exemplified by the ‘Flint Dent’ variety, were larger than the conventional hybrids. In addition, the study investigates the common black sunflower, represented by the ‘Black Oil’ variety; two common bean varieties such as red beans from the “Dark Red Kidney” and white beans from the ‘Great Northern’ variety and the common pea, represented by the ‘Little Marvel’ variety, were used to capture a broader range of seed characteristics. Furthermore, polyoxymethylene spherical balls (white balls) were used as a control, each with a diameter of 8 mm, emulating ideal seeds; owing to their uniform spherical shape and identical physical properties, the missing ratio was very close to 0.
Both devices were tested systematically under controlled conditions, with rotational speeds set at 3, 5, 10, and 15 revolutions per minute (rpm). Both EDEM results and pre-experiment runs were made to determine upper boundary for experimental range. It was shown that speeds above 15 rpm lead to significant degradation of the quality of seeding. It is not economically feasible or practical to set speed lower than 3 rpm. The speed adjustments were executed using a dedicated application interface, ensuring precise control throughout the experimentation process. To mitigate bias, the experimental and control units were operated alternately, with data collection initiated after system stabilization. Data acquisition continued until 1000 seeds were dispensed for each crop type at every designated speed setting.
Experimental data were recorded digitally and time-stamped for subsequent analysis by the seed counting sensor presented in Section 2.5.1. The comparative assessment between the upgraded and control systems provided quantitative metrics regarding the efficiency improvement achieved through the technological enhancement, particularly with respect to consistent seed spacing and reduced miss rates across the tested speed spectrum. Statistical analysis of the collected data was performed using the Python NumPy computational stack within the Anaconda data analysis environment. Theoretical seed release time intervals ( Δ t ) in milliseconds were calculated according to the following equation:
Δ t = 60,000 rpm × N
where rpm is the rotational speed of the seed metering drum in revolutions per minute, and N is the number of grooves on the seed metering drum (equals 18 for this seed metering device). The number of consequent seed misses was estimated using the following formula:
M c = I m T t h 0.5
where M c is the number of consequent seed misses, and I m is the measured interval between seed releases.
The Miss Index, used by many researchers as one of the main estimators to evaluate the performance of seed metering devices [52,53], was calculated by the following formula:
I miss = n 1 N
where n 1 is the number of empty grooves that passed the seed release point, and N is the total number of grooves that passed the seed release point.
To assess the planting speed of the tractor, the formula based on rpm and seed intervals was derived (description of the formula presented in Jupyter Notebook),
S t r = 3 × I × r p m × S R 5000
where S t r is the speed of the tractor in km/h, I is the interval between released seeds in cm, and S R is the number of spoons on the circumference of the seeding spoon-wheel (equals to 18 for this metering device model).
In the initial configuration of the Seed Miss Prevention System, a single laser sensor was integrated into the spoon-wheel precision metering device, as depicted in Figure 8d. Later, an ambient light sensor (Figure 2 and Figure 6) was introduced to mitigate problems revealed after analyzing experimental results. Therefore, two sets of experiments (for a one- and two-sensor setup) were conducted and analyzed.
Before performing statistical analysis, the data were preprocessed. Miss events were categorized into single misses (M1), double misses (M2), and triple or more misses (M3+), and binary indicators were assigned accordingly. The dataset was encoded for statistical analysis as follows: D, seed prevention disabled; S1, seed prevention enabled, one sensor; S2, seed prevention enabled, two sensors. The ‘White Balls’ were excluded from further analysis, as perfect seeding action does not include valuable statistics.
A Tukey’s Honest Significant Difference (HSD) test was conducted using the Python ‘statsmodels’ library to determine whether seed miss prevention modes significantly affected the frequency of single, double, and triple or more misses across different cultivars. The test was performed independently for each cultivar and each seed miss category (M1,M2,M3+). For each Tukey test, differences in means between prevention modes were recorded, along with the adjusted p-values and confidence intervals.

3. Results and Discussion

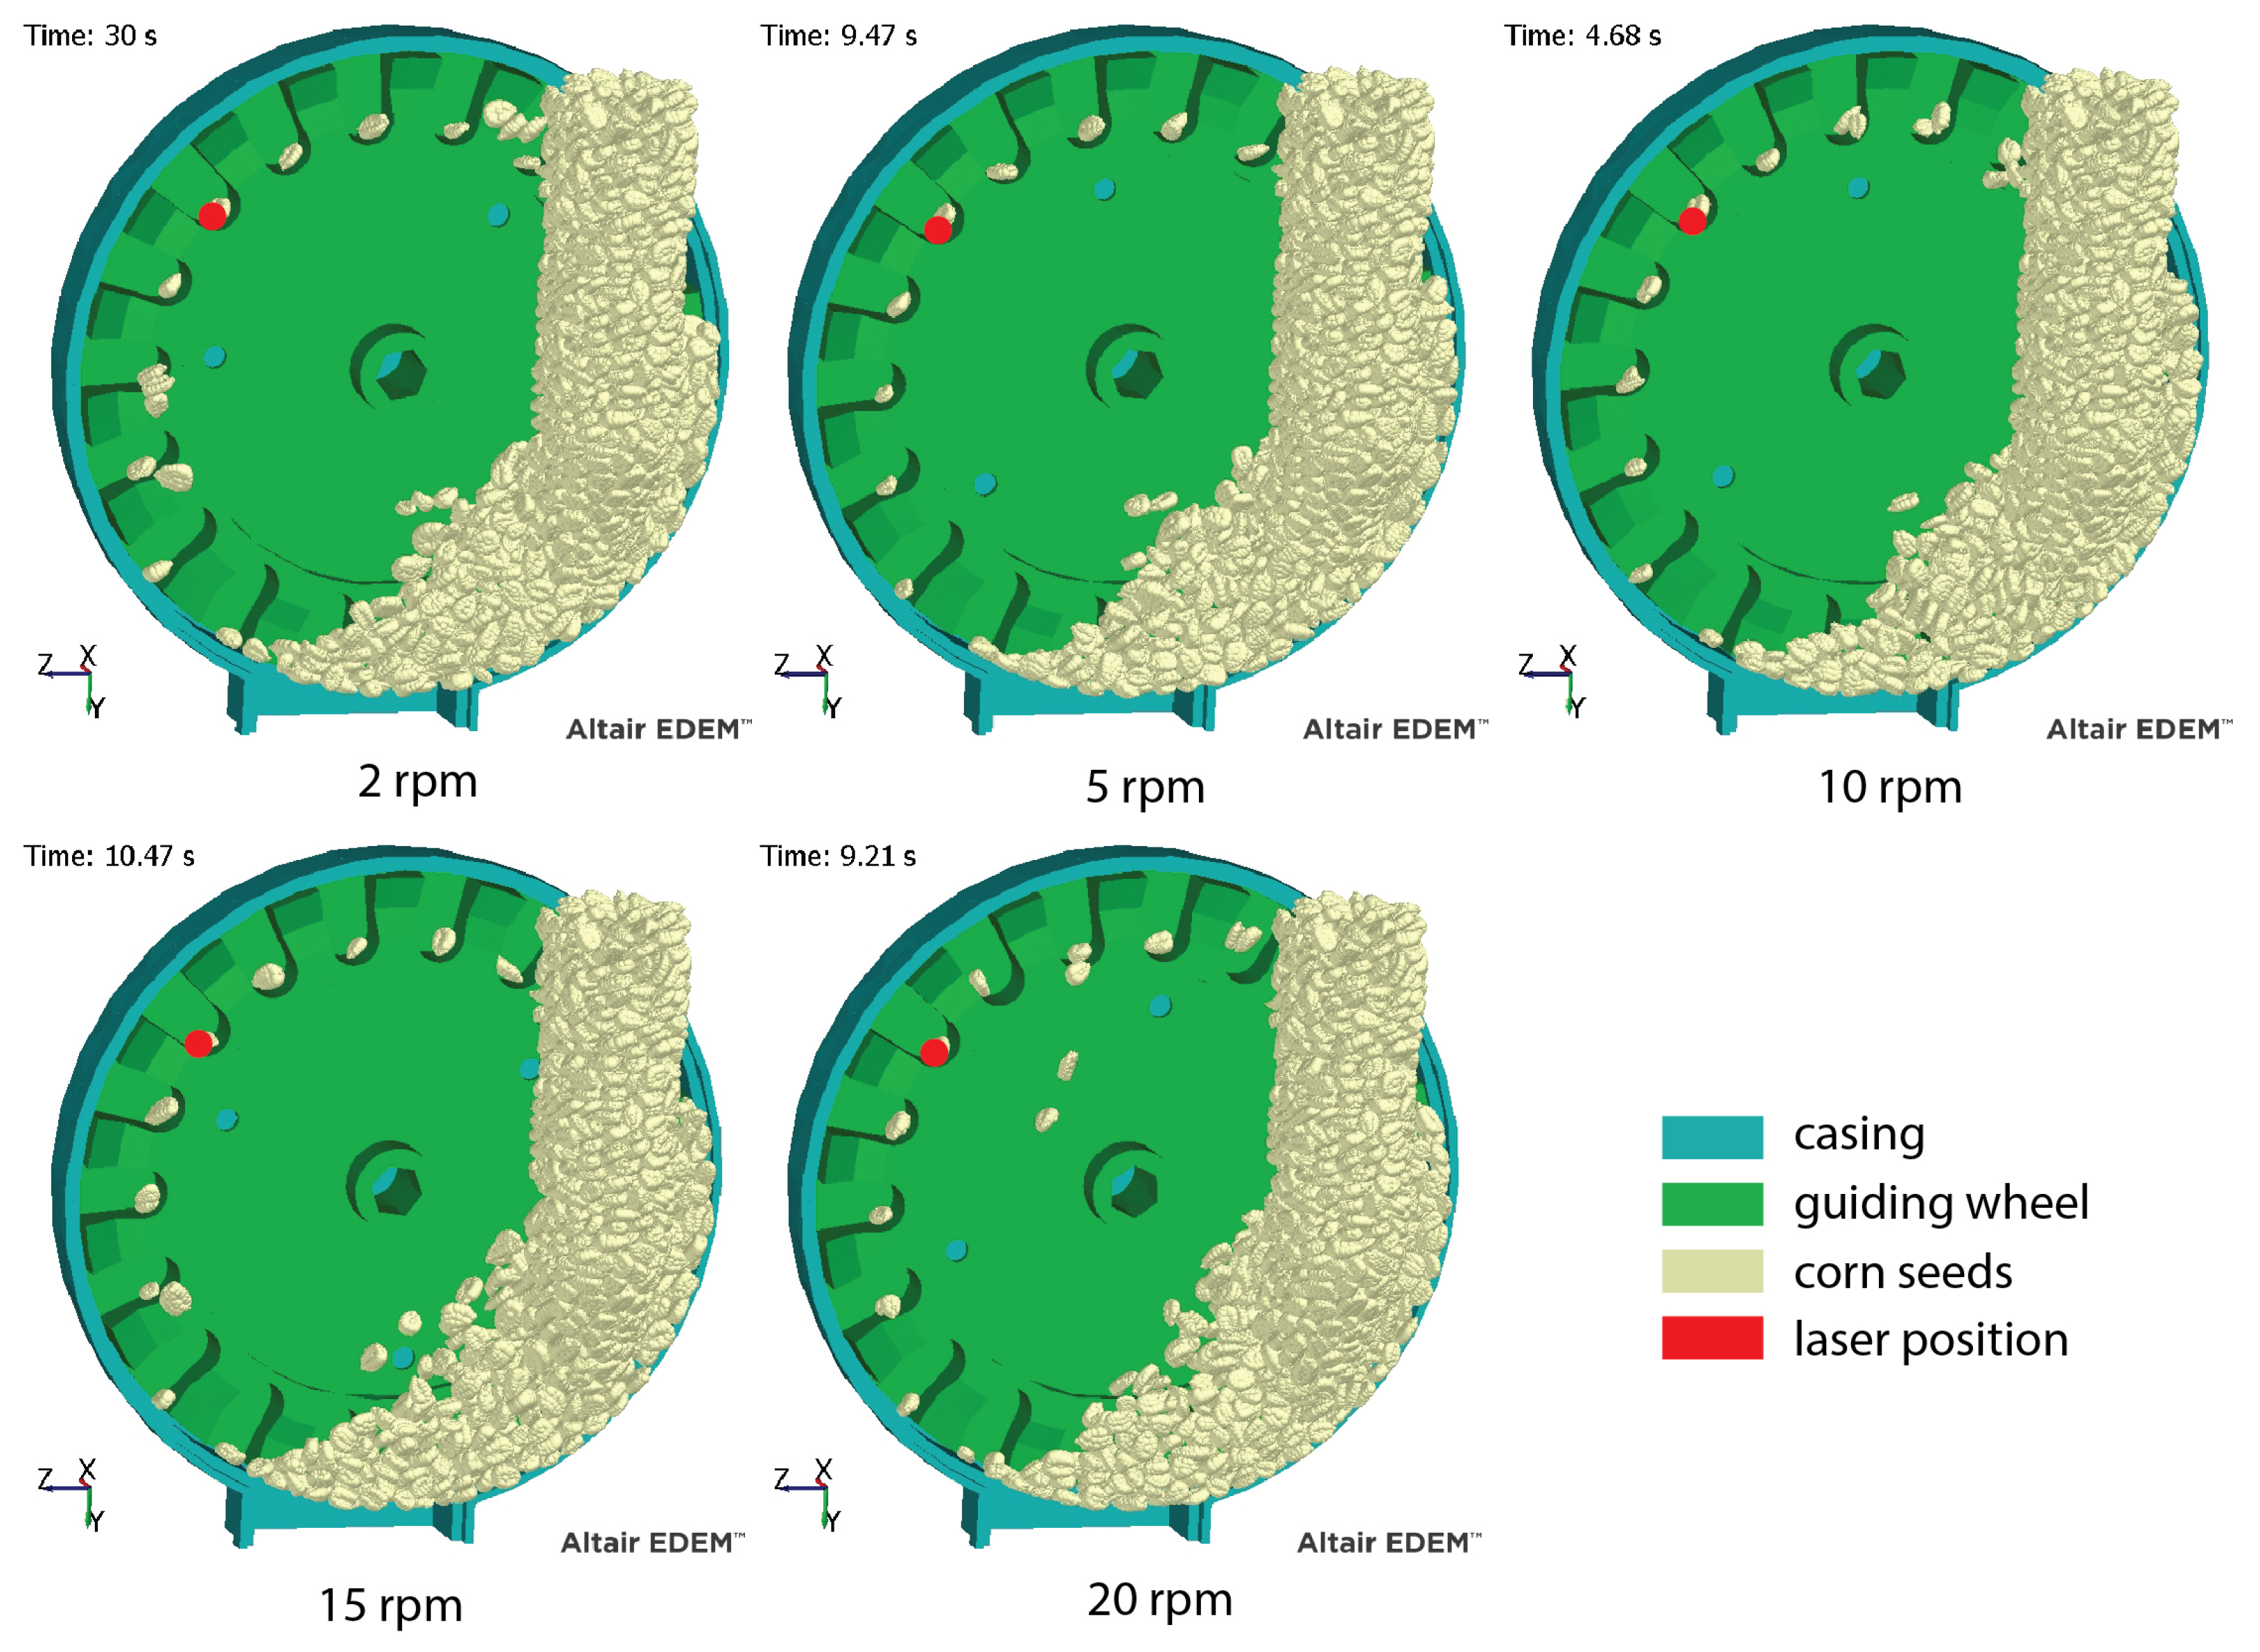
3.1. Results of DEM Simulation

To determine the optimal laser sensor location, the simulation results were analyzed to identify key regions where seed detection would be most effective, Figure 7. The following observations were made: The majority of the seeds followed a slow and predictable trajectory. Seed movement remained relatively stable, with a slight increase in dispersion. At lower speeds (2–5 rpm), the seeds tended to accumulate at the bottom of the chamber, making it easier to detect them near the guiding wheel’s lower section. At moderate speeds (10–15 rpm), seed flow stabilizes and slightly shifts toward the direction of rotation. At high speeds (20 rpm), significant dispersion led to fluctuations in seed trajectories. A sensor positioned at the lower part of the seeding wheel is accurate only at lower speeds, whereas a sensor positioned near the seed release point yielded less reliable detection due to seeds shifting away from the center of rotation. Thus, a sensor positioned slightly above the guiding wheel would provide more consistent detection results.
The results of DEM highlight that while low-speed operations (2–10 rpm) exhibit more predictable seed movement, higher speeds (15–20 rpm) introduce complexity in seed trajectories, increasing the risk of missing a stable position. The analysis of simulation allowed us to visually pinpoint the location of the laser sensor.

3.2. Results of Retrofitting and Signal Analysis

The seed metering system initially employed a chain-driven transmission mechanism (Figure 8c), where a stepper motor was connected to the metering unit via a chain and a series of transmission gears. However, motion inaccuracies were observed because of two primary factors as follows: chain sagging and backlash in the transmission gears due to loose spacing between them. The chain exhibited slight sagging, leading to inconsistencies in motion transmission, particularly under varying load conditions, while the gaps between the teeth of the transmission gears introduced backlash, further compromising accuracy. Although the chain sagging could potentially be mitigated by implementing a tensioning mechanism, the backlash in the gears could not be entirely eliminated through mechanical means. To address these limitations and ensure precise rotational motion control, the chain and transmission system were entirely removed, and the stepper motor was directly mounted onto the backside of the seed metering device, thus eliminating the influence of chain elasticity and gear backlash, Figure 8f.
Sensors and corresponding resistors were connected via insulated copper wires. The sensors were covered by 3D-printed casings, Figure A1.
To give a general idea on the types of the signals produced by both sensors, the sample signals were plotted on Figure 9. Signal rising (for ambient light sensor) and falling (for direct laser beam sensor) time was around 60 us, Figure 9a. The steeper slope of the direct sensor is corresponding to the lower resistance values associated with the direct laser beam sensor. Conversely, the shallower slopped line indicating the ambient light sensor is associated with higher resistivity values. The square-shaped signal lasted about 100 ms (for 5 rpm speed), Figure 9b. Sample 8, s interval signal, was also taken from the 5 rpm working mode of the seed metering device. It shows miss detection by the direct beam sensor and its verification by the absence of an ambient light signal (since no light is reflected from seeds), Figure 9c. Since both signals are crucial, the absence of an ambient light signal in between 1 and 1.5 s (Figure 9c) is not considered a miss by the controller. Furthermore, the spike of the direct laser beam curve is indicating a miss, since there is no spike for the other sensor.

3.3. Experimental Results

This chapter will introduce results from the one- and two-sensor setup in a chronological manner. However, the collected data are summarized together for presentation and comparison purposes in Table 2. More detailed graphical data visualization for corn as our primary target cultivar are presented in Figure 10.

3.3.1. One Sensor Setup

When the SMPS system with a single sensor was enabled, miss indices for most cultivars drop substantially at lower speeds (3 and 5 rpm). For example, at 5 rpm, the Miss Index for corn ‘Dekalb DKC5032’ drops to 0.001 compared to values observed without prevention. At higher rotation speeds, however, several cultivars, including white beans ‘Great Northern’, red beans ‘Dark Red Kidney’, and corn ‘Flint Dent’, exhibit an increased Miss Index, reaching 0.280, 0.186, and 0.159, respectively. This trend indicates that the one-sensor setup struggles to maintain accuracy at higher speeds (see corn ‘Dekalb DKC5032’, Figure 10). The figure also indicates that one sensor setup produces more low scattered intervals below the green line. This could be due to the detection of false seed miss readings by the direct beam sensor. Further visual in situ investigation confirmed this assumption.
The detection of false positives was due to the inherent variability in the volume and size of corn seed cultivars ‘Dekalb DKC5032’ and ‘Flint Dent’. Moreover, due to these differences, particularly with smaller seeds, the laser beam was not entirely obstructed as intended. In cases where only a portion of the beam was blocked, the sensor still received a fraction of the signal, Figure 11, leading it to incorrectly register a seed miss. This partial obstruction effect underscores a critical flaw in the single-sensor approach for reliably detecting seeds.
Scattering lower values and increase of 3+ seed misses, presented in Figure 10, could be explained as a consequence of false seed miss detection. Namely, the system had to execute speeding action too many times, which led to artificially created doubles (hence the presence of multiple low seed interval values) and subsequent increase of seeds thrown with high inertia out of spoons. The problem was approached by installing an additional seed miss verification sensor, which detects ambient light in the groove of the guiding wheel of the seed metering device.

3.3.2. Two-Sensor Setup

The two-sensor configuration further reduces the proportion of missed seeds, particularly at operational speeds that are realistic for this metering device (3, 5, and 10 rpm). For instance, at 10 rpm, miss indices for most cultivars (including the more problematic corn ‘Flint Dent’) are lower compared to the one-sensor setup. In the case of corn ‘Flint Dent’, it can be seen that it eliminated 3+ misses at 15 rpm and reduced the number of scattered low seed interval values, which indicate a reduction in false positive seed miss detection. Thus, while the two-sensor system is more effective overall, the data still show that irregular seed forms (like white beans ‘Great Northern’) tend to have slightly higher Miss Indexes than with more uniform seeds. Nevertheless, the two-sensor system minimizes overshoots and provides a more stable performance, making it preferable. The dual-sensor system achieved the lowest Miss Index values across rpms and cultivars, validating its effectiveness.

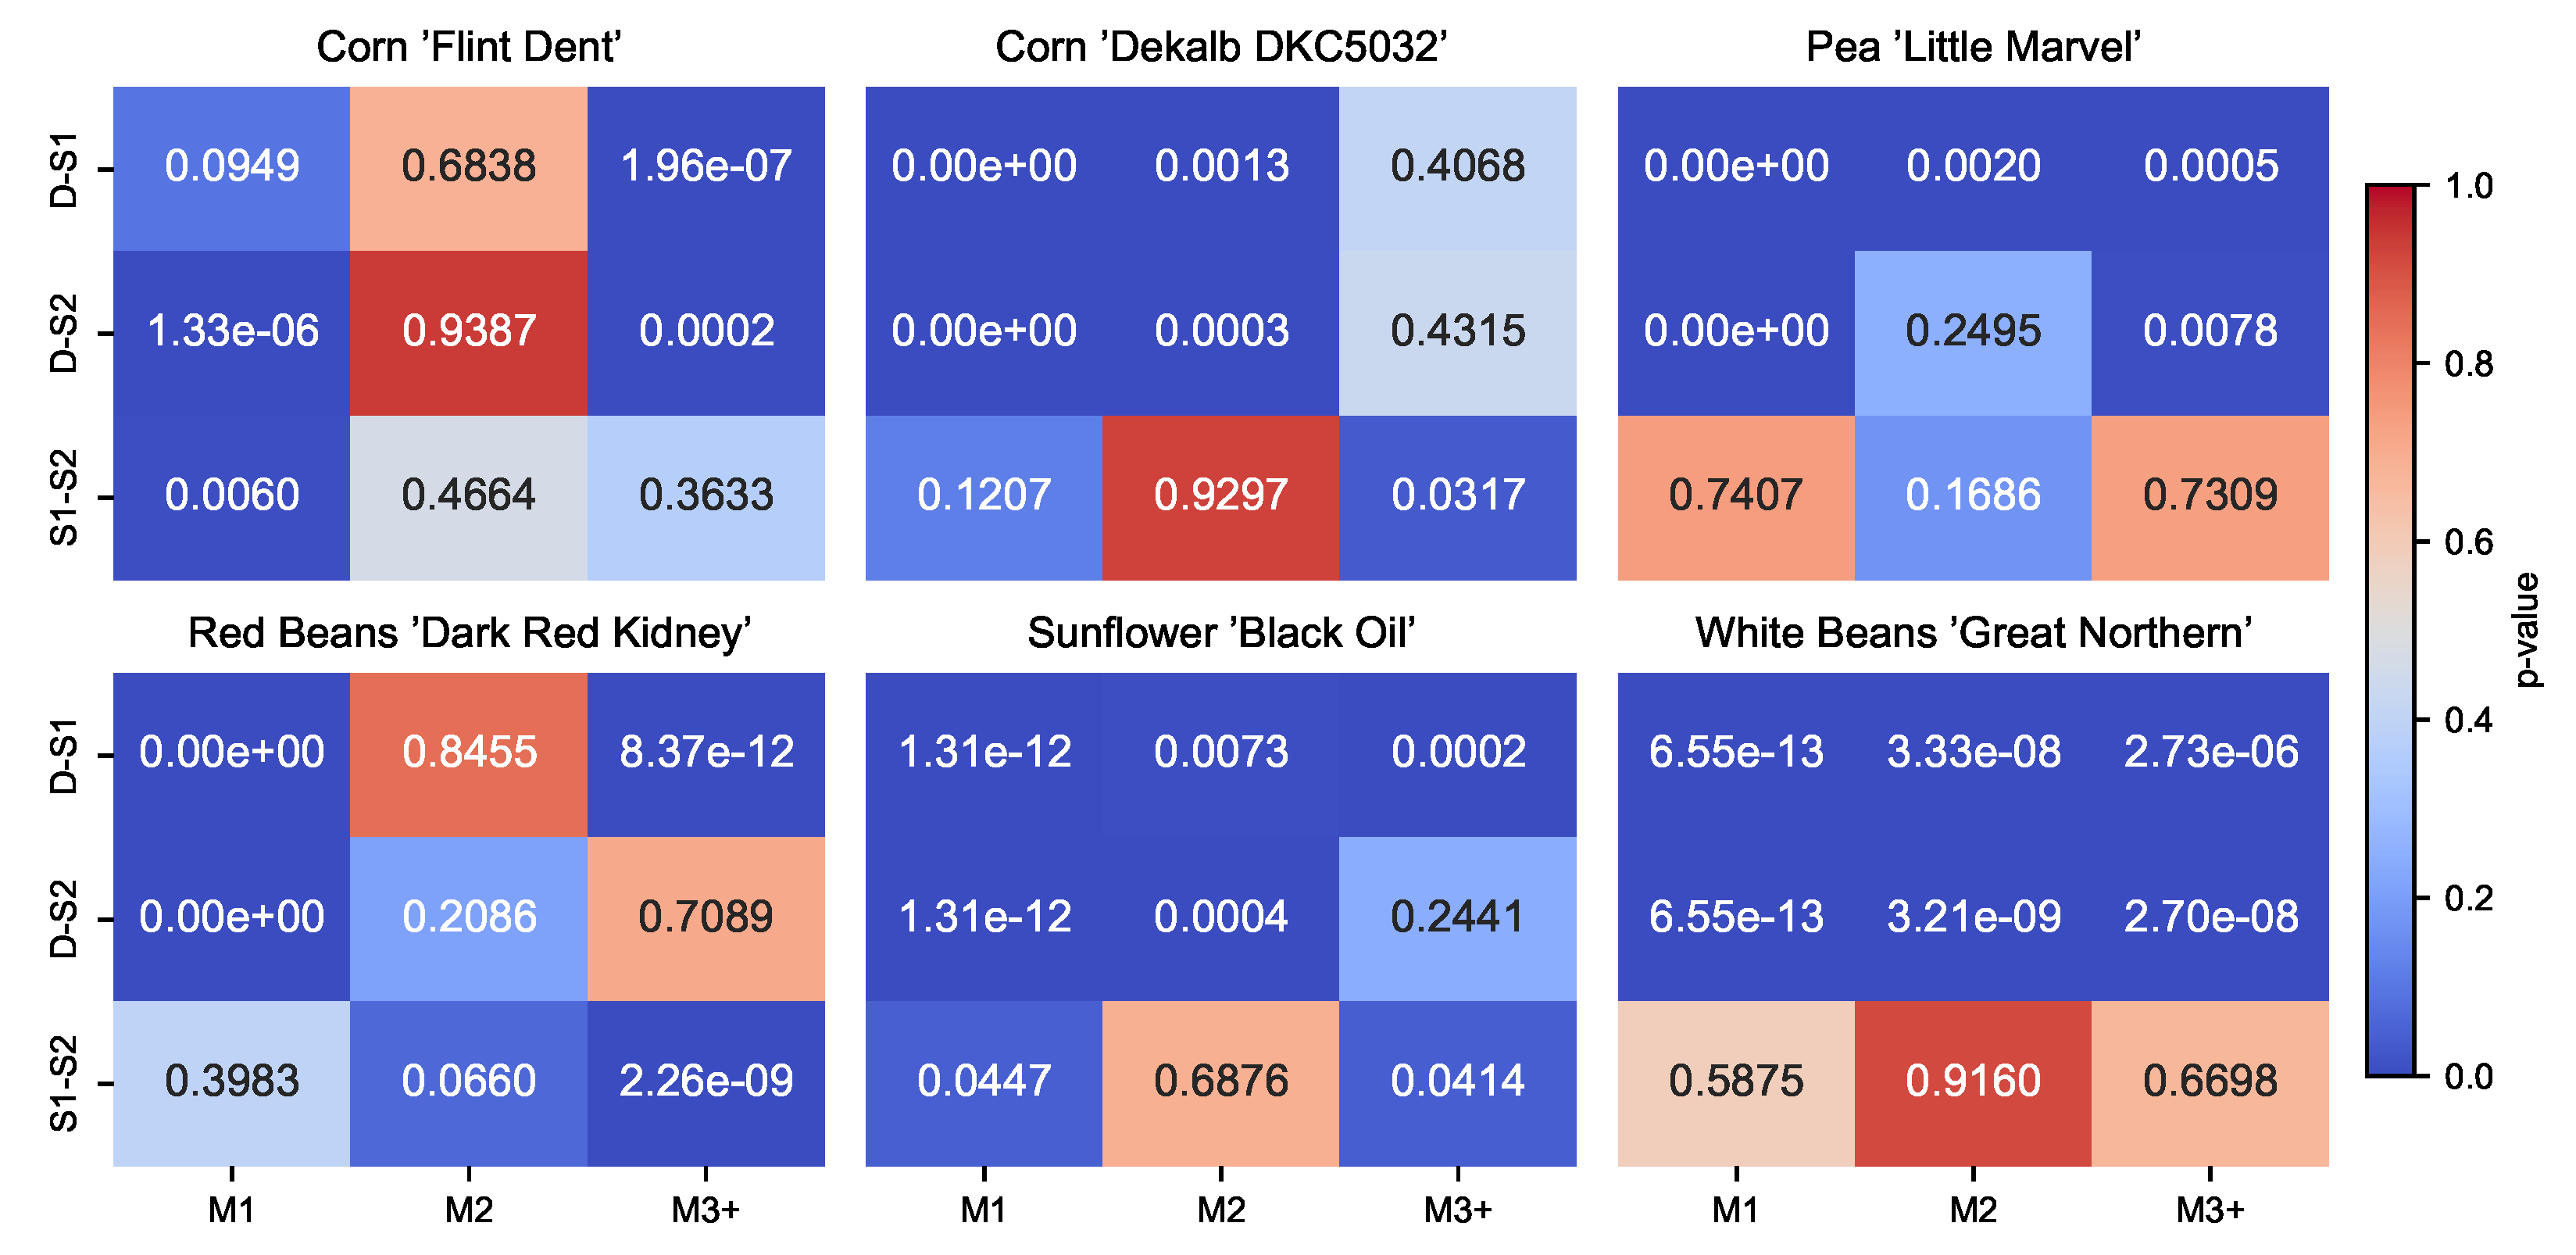
3.3.3. Tukey Test Results

The results of Tukey’s HSD (Figure 12) showed the following: For M1 misses, significant reductions ( p < 0.001 ) were observed for D vs. S2 across all cultivars, with reductions also significant for D vs. S1 in most cases. However, using two sensors (S2) further improved performance compared to a single sensor (S1) in corn ‘Flint Dent’ ( p = 0.006 ) and sunflower ‘Black Oil’ ( p = 0.0447 ), while other cultivars showed no significant S1–S2 differences.
For M2 misses, statistical differences were mainly found in corn ‘Dekalb DKC5032’, pea ‘Little Marvel’, and sunflower ‘Black Oil’, where D vs. S1 and D vs. S2 comparisons were significant ( p < 0.01 ). However, using two sensors (S2) instead of one (S1) did not result in further enhancements for any cultivar.
For M3+ misses, significant increases ( p < 0.001 ) in misses were observed in D vs. S1 for corn ‘Flint Dent’, Red Beans ‘Dark Red Kidney’, sunflower ‘Black Oil’, and white beans ‘Great Northern’. However, the S1 vs. S2 differences were only significant for red beans ‘Dark Red Kidney’ ( p < 0.001 ) and sunflower ‘Black Oil’ ( p = 0.0414 ), indicating a slight advantage of using two sensors in these cases.
It is worth mentioning that Tukey’s test reacts dramatically to the cases where certain types of the misses and cases without misses were present, so the p-values could go even below decimal precision levels, for example, Corn ‘Dekalb DKC5032’ (D-S1, D-S2). However, overall, it shows very low p-values for the disabled and enabled Seed Miss Prevention System, which assigns the significance of its impact on seed miss formation.

3.3.4. Real-World Applicability and Discussion

At rpms ≥ 15, the Miss Index values exceeded the practical thresholds for precision agriculture (e.g., 12.8% for peas at 15 rpm with two sensors), suggesting operational speeds should remain ≤ 10 rpm for irregular seeds. Based on Equation (7), for our target cultivar corn, if seeded at 15 rpm with 25 cm seed spacing, the seeder (tractor) speed would be 4.05 km/h, which is not high but within optimal operating limits [54].
Although increasing the rpm appears to compromise accuracy, as evidenced by rising miss indices at 15 rpm, the device is not typically operated at these high speeds. The practical operating range seems to be around from 3 to 10 rpm, where the two-sensor system offers a clear advantage. Higher rpms (15 rpm) increased misses even with prevention. For example, with two sensors at 15 rpm, white beans still had a Miss Index of 28.2%, likely due to mechanical limitations of the metering device at elevated speeds. Lower rpms (3–5 rpm) achieved near-zero misses for most cultivars, except irregularly shaped seeds.
The varying performance across different seed types suggests that physical characteristics such as shape and size play a role in detection accuracy. For instance, while the white balls (with their perfect shape) achieve near-zero misses regardless of configuration, the white beans, likely due to their irregular form, register higher miss indices, especially under less effective prevention configurations.
From a practical standpoint, the results support the use of a dual-sensor system in precision metering devices. By lowering the proportion of missed seeds, particularly at feasible operational speeds, the two-sensor system enhances both the technical performance and the real-world applicability of the device. This could be especially beneficial when handling a variety of seed types where accuracy is critical.
The study highlights the following limitations and future considerations:
-
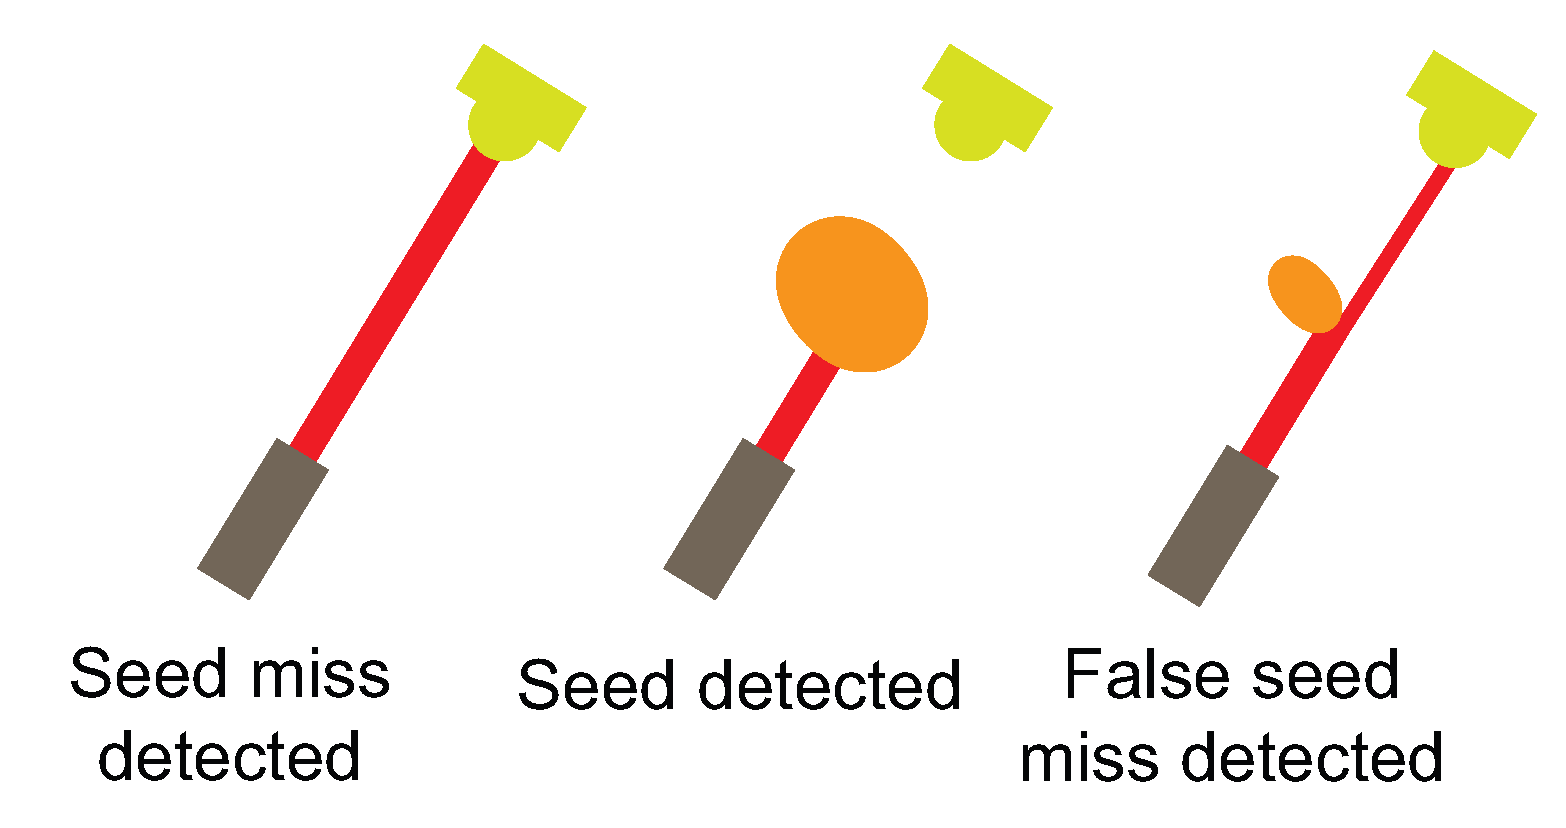
Miss detection accuracy. Although the system, especially with two sensors, clearly demonstrated significant seed miss prevention capability, the target zero or near-zero miss prevention was not achieved, as we could not bring the seed Miss Index to zero by using the system. Even though using an additional ambient light sensor seemed to solve the problem of false positive seed miss detection, it is not clear if this completely eliminated false positives, or whether some may still occur and hide among naturally occurring multiples.
-
Operational speed constraints. Although data at high rpms suggest a degradation in performance, practical operation likely remains within the threshold due to the relatively poor seeding speed characteristic of the metering device itself. Future studies might focus on refining the system on better-performing seed metering devices that are less affected by centrifugal and inertial forces.

4. Conclusions

This study examined the effectiveness of a Seed Miss Prevention System (SMPS) applied to a spoon-wheel type precision seed metering device. Through DEM simulations, experimental retrofitting, and laboratory testing, the system’s performance across multiple seed cultivars and varying operational speeds was evaluated. The findings demonstrate that integrating SMPS significantly reduces seed misses compared to the system being disabled. The additional ambient light sensor in the dual sensor setup helped mitigate false positive detections, leading to improved accuracy at different speeds.
Key results indicate that at lower speeds (3–10 rpm), the SMPS achieved near-optimal performance, minimizing miss indices across tested seed types. However, at higher speeds (≥15 rpm), miss rates increased, particularly for irregularly shaped seeds like white beans ‘Great Northern’. The system performed best with uniform seed types, such as corn ‘Dekalb DKC5032’, where it effectively maintained seeding precision. A comparative analysis of seeding performance for various crops, along with their recommended operational parameters, is summarized in Table A1. Statistical analysis confirmed the significant impact of the SMPS in reducing missed seeds, as evidenced by the Tukey HSD test results.
Despite these improvements, limitations remain. While the two-sensor system reduces miss occurrences, the complete elimination of missed seeds was not achieved. The metering device’s mechanical constraints, especially at higher speeds, still pose challenges. Future research should focus on optimizing sensor detection and testing the system on different metering devices with improved mechanical performance.
In conclusion, the developed SMPS represents a valuable advancement in precision seeding technology. Its integration enhances seeding accuracy, which is critical for improving crop yield and operational efficiency in precision agriculture. Further refinements and field-scale validations will be necessary to maximize its potential for widespread adoption.

Author Contributions

Conceptualization, N.Z. and A.B.; Data acquisition, A.B.; Data curation, N.Z. and O.K.; Experiment assistance, A.O.; Experimental preparation setup, A.B.; Formal analysis, O.K. and A.O.; Funding acquisition, N.K.; Hardware retrofitting, A.B.; Investigation, A.B. and A.G.; Mechanical retrofitting, A.G.; Methodology, N.Z. and N.K.; Project administration, N.K. and O.K.; Resources, N.Z.; Simulation, A.B.; Software, N.Z.; Software retrofitting, A.B.; Supervision, N.Z. and N.K.; Validation, N.Z.; Visualization, N.Z.; Writing—original draft, A.B.; Writing—review and editing, A.B. and N.Z. All authors have read and agreed to the published version of the manuscript.

Funding

This research was funded by the Science Committee of the Ministry of Science and Higher Education of the Republic of Kazakhstan (Grant No. AP19678776), “Development of a novel seed miss prevention system and modernization of a precision seed metering device”.

Institutional Review Board Statement

Not applicable.

Data Availability Statement

The data can be made available by contacting the corresponding author.

Acknowledgments

This work builds upon foundational research initiated at Northwest A&F University (NWAFU) with the paper titled “Design and Testing of a Novel Seed Miss Prevention System for Single Seed Precision Metering Devices”, where the methodological framework and preliminary experimental protocols were first established.

Conflicts of Interest

The authors declare no conflict of interest.

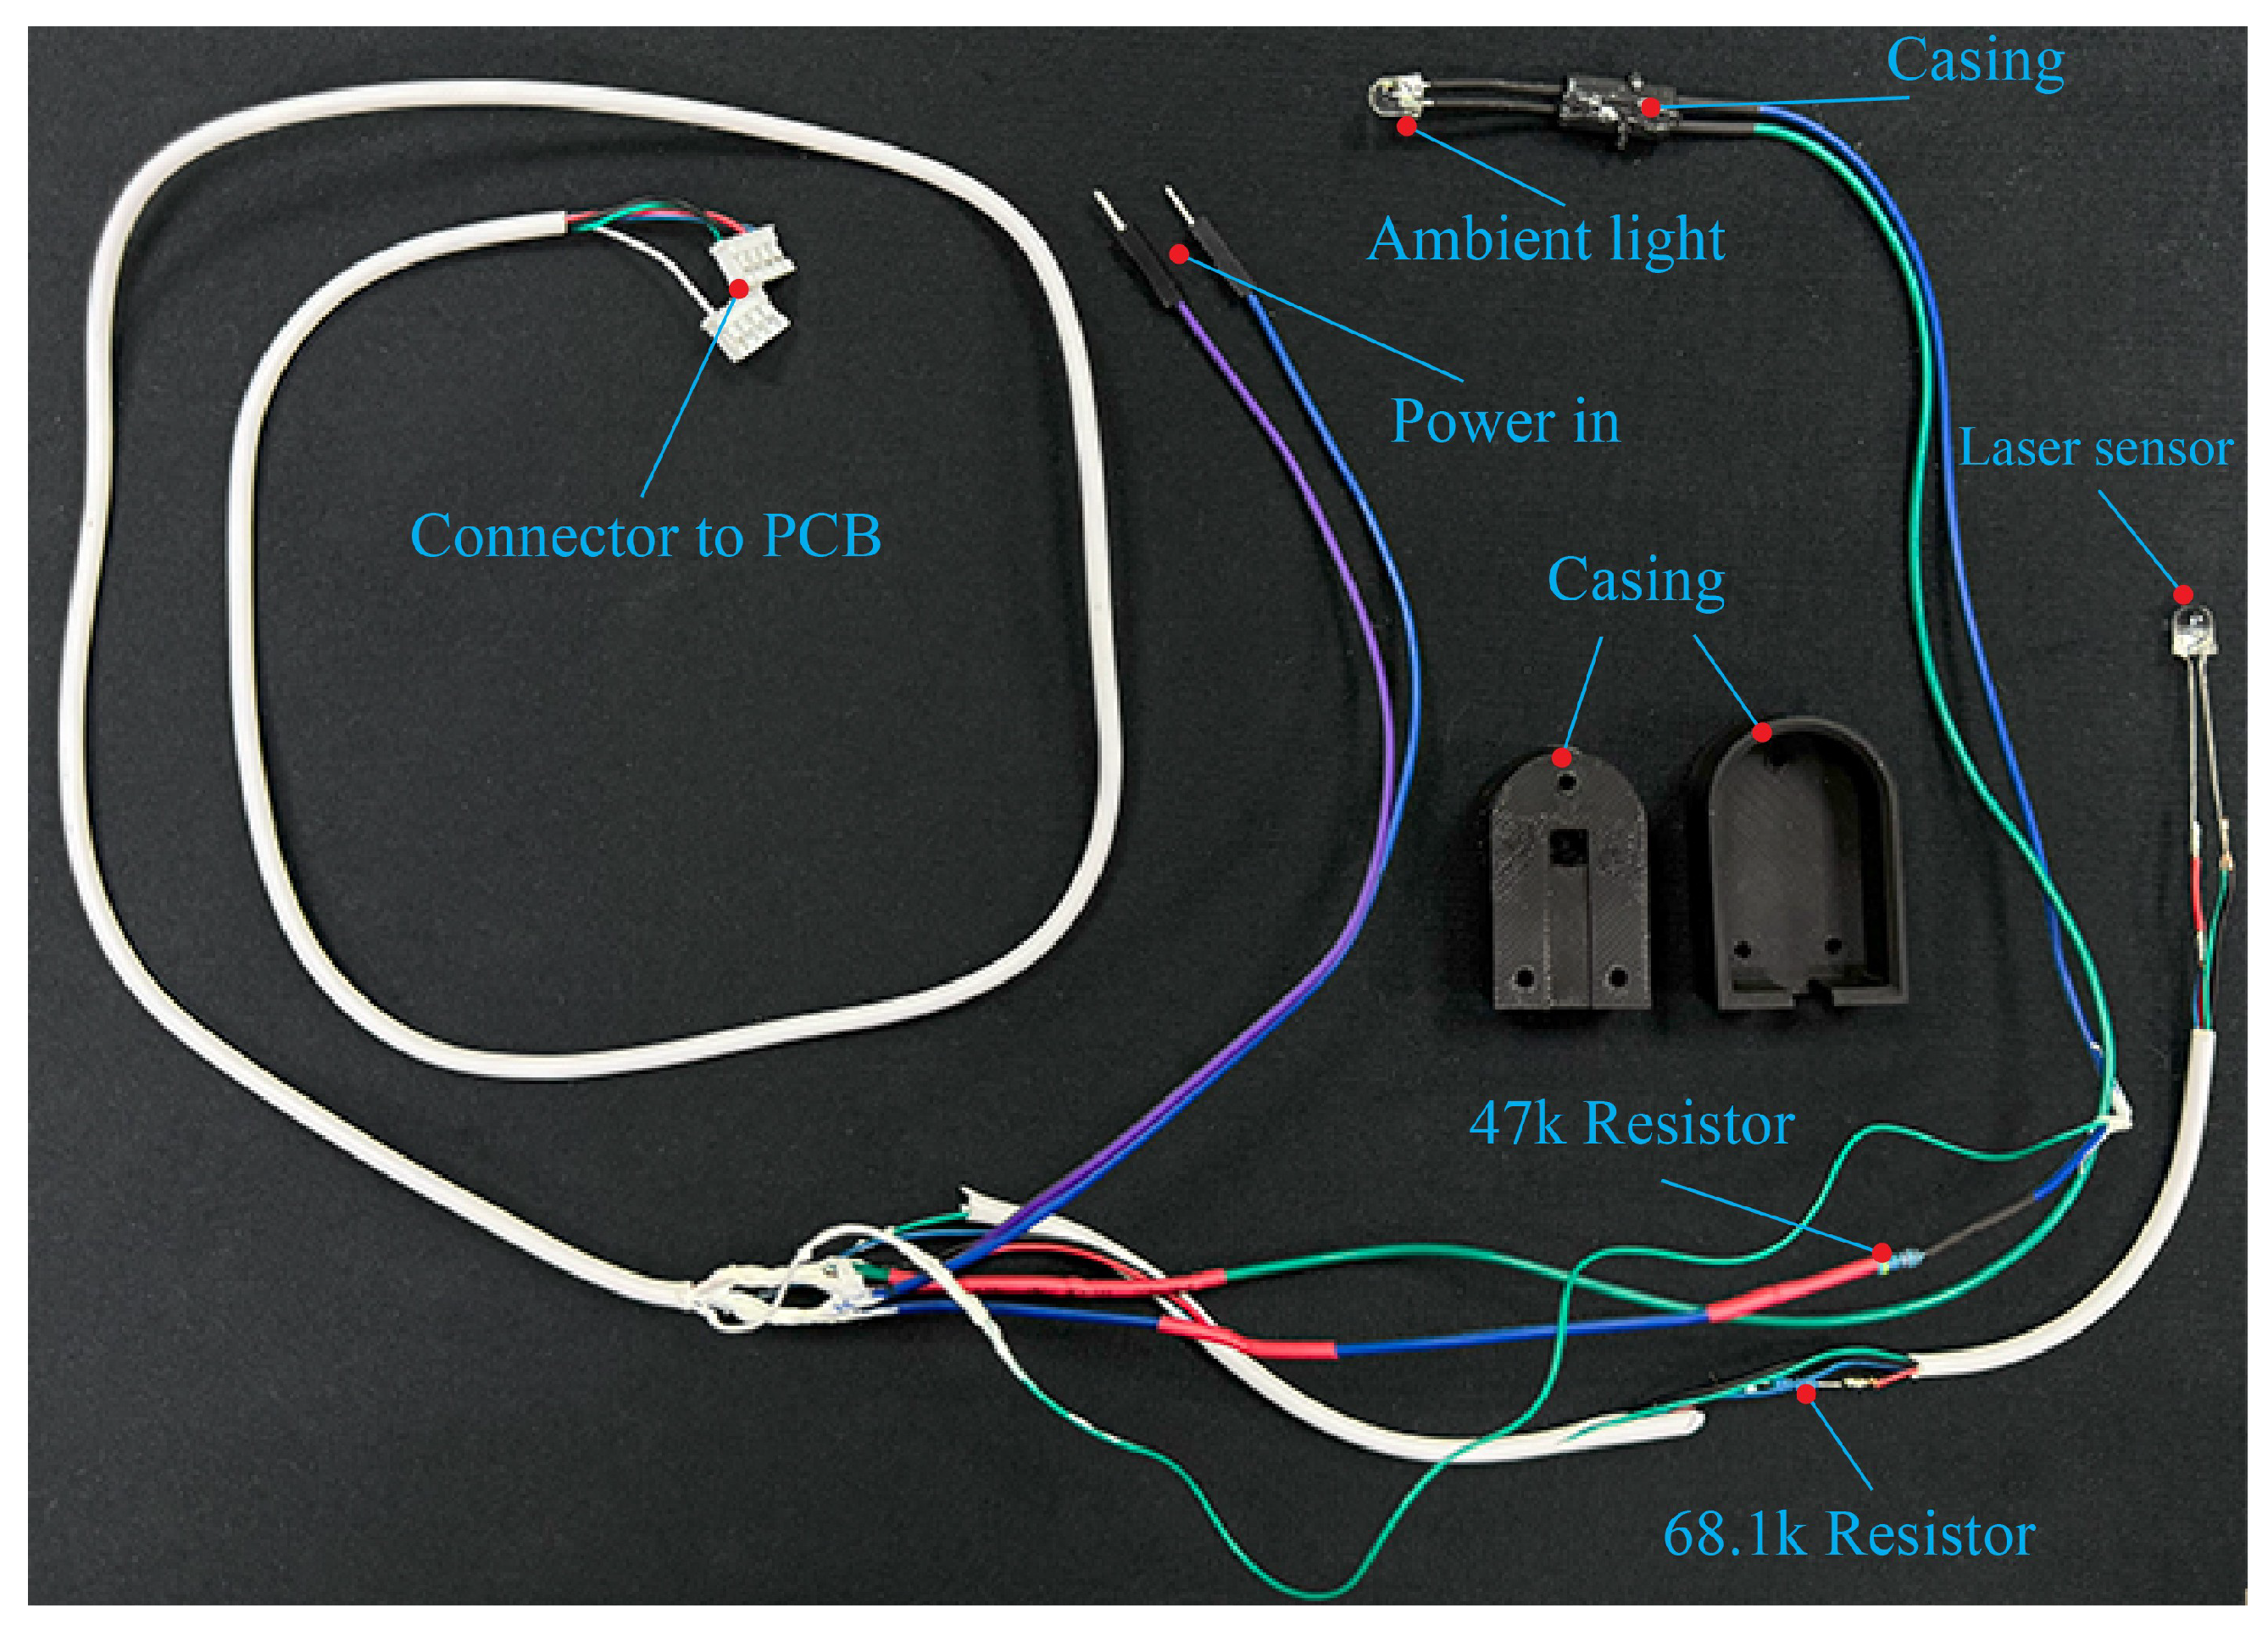
Appendix A. Seed Miss Prevention System Hardware

Figure A1. Wiring configuration of the laser sensor and ambient light module.
Agriculture 15 01363 g0a1
Figure A2. Control PCB board of the seed metering device. 1—WROOM ESP32; 2—4-pin UART socket; 3—4-pin Stepper motor driver socket; 4—2-pin boot mode jumpers; 5—buck converter; 6—2-pin 5 V socket; 7—green LED; 8—reset push button; 9—blue LED; 10—3-pin seed miss sensor socket.
Agriculture 15 01363 g0a2
Figure A3. Android application for seed count data acquisition. 1—Bluetooth connection panel; 2—parameter indication panel; 3—rpm control panel; 4—start/stop button; 5—settings; 6—parameter value input field; 7—parameter selector; 8—parameter control panel; 9—close setting page button.
Agriculture 15 01363 g0a3

Appendix B. Data Acquisition Hardware

Figure A4. Components of the data acquisition hardware.
Agriculture 15 01363 g0a4
Figure A5. Android application for data acquisition.
Agriculture 15 01363 g0a5
Figure A6. Electrical schematic connection of data acquisition sensor.
Agriculture 15 01363 g0a6

Appendix C. Recommended Operational Parameters

Table A1. Seeding performance comparison across different crops and varieties.
Crop & VarietyRecommended Operational Parameters 1Baseline Performance (No SMPS at 10 rpm)Miss Index in Recomemded RangePerformance Metrics at 10 rpm 2Key Finding and Limitation
Corn ‘Dekalb DKC5032’Optimal Speed: 3–10 rpm. Est. Tractor Speed:  0.8–2.7 km/h. (at seed spacing 25 cm)4.8% Miss Index0.001–0.007Baseline (No SMPS): 4.8% With SMPS (S2): 0.7% Effectiveness: 85.4% ImprovementThe system performs best with uniform seeds, effectively maintaining precision.
Corn ‘Flint Dent’Optimal Speed: 3–10 rpm. Est. Tractor Speed:  1.6–5.4 km/h. (at seed spacing 25 cm)2.9% Miss Index0.007–0.022Baseline (No SMPS): 2.2% With SMPS (S2): 1.2% Effectiveness: 45.5% ImprovementMore challenging than uniform hybrids due to variable seed size. The SMPS provides a notable, but not total, reduction in misses.
Sunflower ‘Black Oil’Optimal Speed: 3–15 rpm. Est. Tractor Speed:  4.5–9.0 km/h. (at seed spacing 35 cm)3.6% Miss Index0.001–0.029Baseline (No SMPS): 6.4% With SMPS (S2): 1.3% Effectiveness: 79.7% ImprovementShows excellent performance and stability even at higher operational speeds compared to irregular seeds.
Pea ‘Little Marvel’Optimal Speed: 3–10 rpm. Est. Tractor Speed:  0.9–2.4 km/h. (at seed spacing 8 cm)2.7% Miss Index0.001–0.025Baseline (No SMPS): 5.0% With SMPS (S2): 0.5% Effectiveness: 90.0% ImprovementAt speeds above 10 rpm, miss indices exceed practical thresholds for precision agriculture.
Beans, Red ‘Dark Red Kidney’Optimal Speed: 3–10 rpm. Est. Tractor Speed:  1.8–6.0 km/h. (at seed spacing 15 cm)5.0% Miss Index0.002–0.017Baseline (No SMPS): 4.6% With SMPS (S2): 0.4% Effectiveness: 91.3% ImprovementHigher miss rates at increased speeds due to the mechanical limitations of the metering device handling irregular forms.
Beans, White ‘Great Northern’Optimal Speed: 3–10 rpm. Est. Tractor Speed:  1.8–3.0 km/h. (at seed spacing 15 cm)6.1% Miss Index0.003–0.015Baseline (No SMPS): 8.1% With SMPS (S2): 2.9% Effectiveness: 64.2% ImprovementAt higher speeds (≥15 rpm), miss rates increase significantly, particularly for irregularly shaped seeds like white beans.
1 Est. Tractor Speed is calculated based on the formula Equation (7). 2 Performance Gain vs. Baseline shows the reduction in Miss Index from the baseline (No SMPS) to the dual-sensor SMPS, calculated as ( ( Baseline Miss Index SMPS Miss Index ) / Baseline Miss Index ) × 100 using data from the 10 rpm tests.

References

  1. Balafoutis, A.; Beck, B.; Fountas, S.; Vangeyte, J.; Wal, T.V.D.; Soto, I.; Gómez-Barbero, M.; Barnes, A.; Eory, V. Precision Agriculture Technologies positively contributing to GHG emissions mitigation, farm productivity and economics. Sustainability 2017, 9, 1339. [Google Scholar] [CrossRef]
  2. Zatserkovny, V.; Vorokh, V. Differential technologies of precision agriculture. Tech. Sci. Technol. 2024, 2024, 1–5. [Google Scholar] [CrossRef]
  3. Ahmed, K.; Saleh, A.; Musa, A.; Kalu, G. Determination of selected parameters that influence planting space uniformity on maize seed. Fudma J. Sci. 2023, 7, 30–33. [Google Scholar] [CrossRef]
  4. Xu, C.; Li, R.; Song, W.; Wu, T.; Sun, S.; Han, T.; Wu, C. High Density and Uniform Plant Distribution Improve Soybean Yield by Regulating Population Uniformity and Canopy Light Interception. Agronomy 2021, 11, 1880. [Google Scholar] [CrossRef]
  5. Badua, S.; Sharda, A.; Flippo, D. Sensing system for real-time measurement of seed spacing, depth, and geo-location of corn: A proof-of-concept study. Trans. ASABE 2019, 62, 1779–1788. [Google Scholar] [CrossRef]
  6. Ahmad, S.F.; Dar, A.H. Precision farming for resource use efficiency. In Resources Use Efficiency in Agriculture; Springer: Singapore, 2020; pp. 109–135. [Google Scholar]
  7. Xiyin, W. Improve design and experiment on spoon of spoon precision seed metering device. J. Northeast Agric. Univ. 2015, 46, 79–85. [Google Scholar]
  8. Wang, G.; Sun, W.; Zhang, H.; Liu, X.; Li, H.; Yang, X.; Zhu, L. Research on a kind of seeding-monitoring and compensating control system for potato planter without additional seed-metering channel. Comput. Electron. Agric. 2020, 177, 105681. [Google Scholar] [CrossRef]
  9. Chen, Z.; Xue, D.; Guan, W.; Guo, J.; Liu, Z. Performance Optimization of a Spoon Precision Seed Metering Device Based on a Maize Seed Assembly Model and Discrete Element Method. Processes 2023, 11, 3076. [Google Scholar] [CrossRef]
  10. Wang, Q.; Han, D.D.; Xu, Y.Z.; Huang, Y.; Tang, C.; Li, W. Experimental study on the seeding performance of the spoon-wheel maize seed-metering device under vibration conditions. INMATEH Agric. Eng. 2024, 72, 324–338. [Google Scholar] [CrossRef]
  11. Chakraborty, D.; Ladha, J.K.; Rana, D.S.; Jat, M.L.; Gathala, M.K.; Yadav, S.; Rao, A.N.; Ramesha, M.S.; Raman, A. A global analysis of alternative tillage and crop establishment practices for economically and environmentally efficient rice production. Sci. Rep. 2017, 7, 9342. [Google Scholar] [CrossRef]
  12. Barr, J.B.; Desbiolles, J.M.; Fielke, J.M.; Ucgul, M. Development and field evaluation of a high-speed no–till seeding system. Soil Tillage Res. 2019, 194, 104337. [Google Scholar] [CrossRef]
  13. Zhang, Y.; Cheng, J.; Zhang, X.; Shi, Z.; Wang, M.; Wu, H.; Fu, H. Design and experiment of pressure-holding precision seed-metering device for maize. INMATEH Agric. Eng. 2023, 69, 13–25. [Google Scholar] [CrossRef]
  14. Kai-xing, Z.; Yuanyuan, S.; Lei, L.; Xianxi, L.; Xiuyan, Z. Design and test of variable diameter pneumatic drum type bean seed metering device. INMATEH-Agric. Eng. 2020, 60, 9–18. [Google Scholar] [CrossRef]
  15. Tian, L.; Ding, Z.; Su, Z.; Li, L.; Wang, Z. Design and experiment of rotary precision hill direct seed-metering device for rice. INMATEH Agric. Eng. 2022, 66, 311. [Google Scholar] [CrossRef]
  16. Zhang, J.; Hou, Y.; Ji, W.; Zheng, P.; Yan, S.; Hou, S.; Cai, C. Evaluation of a Real-Time Monitoring and Management System of Soybean Precision Seed Metering Devices. Agronomy 2023, 13, 541. [Google Scholar] [CrossRef]
  17. Liu, Z.; Xia, J.; Hu, M.; Du, J.; Luo, C.; Zheng, K. Design and analysis of a performance monitoring system for a seed metering device based on pulse width recognition. PLoS ONE 2021, 16, e0261593. [Google Scholar] [CrossRef]
  18. Borja, A.A.; Amongo, R.M.C.; Suministrado, D.C.; Pabico, J.P. A machine vision assisted mechatronic seed meter for precision planting of corn. In Proceedings of the 2018 3rd International Conference on Control and Robotics Engineering (ICCRE), Nagoya, Japan, 20–23 April 2018; pp. 183–187. [Google Scholar]
  19. Nikolay, Z.; Nikolay, K.; Gao, X.; Li, Q.W.; Mi, G.P.; Huang, Y.X. Design and testing of novel seed miss prevention system for single seed precision metering devices. Comput. Electron. Agric. 2022, 198, 107048. [Google Scholar] [CrossRef]
  20. Goyal, D.; Vanraj; Pabla, B.; Dhami, S. Non-contact sensor placement strategy for condition monitoring of rotating machine-elements. Eng. Sci. Technol. Int. J. 2019, 22, 489–501. [Google Scholar] [CrossRef]
  21. Colyer, S.L.; Evans, M.; Cosker, D.P.; Salo, A.I. A review of the evolution of vision-based motion analysis and the integration of advanced computer vision methods towards developing a markerless system. Sport. Med.-Open 2018, 4, 24. [Google Scholar] [CrossRef]
  22. Li, Y.; Zang, L.; Shi, T.; Lv, T.; Lin, F. Design and dynamic simulation analysis of a wheel–track composite chassis based on RecurDyn. World Electr. Veh. J. 2021, 13, 12. [Google Scholar] [CrossRef]
  23. Chen, Y.; Cheng, Y.; Chen, J.; Zheng, Z.; Hu, C.; Cao, J. Design and experiment of the buckwheat hill-drop planter hole forming device. Agriculture 2021, 11, 1085. [Google Scholar] [CrossRef]
  24. Ishida, T. Application of distinct element analysis to three simple block models aimed at practical application to toppling failure of fissured rock slopes. Comput. Geotech. 1990, 9, 341–353. [Google Scholar] [CrossRef]
  25. Jensen, R.P.; Bosscher, P.J.; Plesha, M.E.; Edil, T.B. DEM simulation of granular media—structure interface: Effects of surface roughness and particle shape. Int. J. Numer. Anal. Methods Geomech. 1999, 23, 531–547. [Google Scholar] [CrossRef]
  26. Tan, Y.; Yang, D.; Sheng, Y. Discrete element method (DEM) modeling of fracture and damage in the machining process of polycrystalline SiC. J. Eur. Ceram. Soc. 2009, 29, 1029–1037. [Google Scholar] [CrossRef]
  27. Chen, L.; Mou, X.; Peng, Z. Application of discrete element method in agricultural engineering. Adv. Mod. Agric. 2022, 2, 2084. [Google Scholar] [CrossRef]
  28. Tijskens, E.; Ramon, H.; De Baerdemaeker, J. Discrete element modelling for process simulation in agriculture. J. Sound Vib. 2003, 266, 493–514. [Google Scholar] [CrossRef]
  29. Guzman, L.J.; Chen, Y.; Landry, H. Discrete element modeling of seed metering as affected by roller speed and damping coefficient. Trans. ASABE 2020, 63, 189–198. [Google Scholar] [CrossRef]
  30. Jun, G.; Yue, Y.; Memon, M.S.; Chuang, T.; Linyu, W.; Pei, T. Design and simulation for seeding performance of high-speed inclined corn metering device based on discrete element method (DEM). Sci. Rep. 2022, 12, 19415. [Google Scholar] [CrossRef]
  31. Adilet, S.; Zhao, J.; Sayakhat, N.; Chen, J.; Nikolay, Z.; Bu, L.; Sugirbayeva, Z.; Hu, G.; Marat, M.; Wang, Z. Calibration strategy to determine the interaction properties of fertilizer particles using two laboratory tests and DEM. Agriculture 2021, 11, 592. [Google Scholar] [CrossRef]
  32. Tekeste, M.Z.; Mousaviraad, M.; Rosentrater, K.A. Discrete element model calibration using multi-responses and simulation of corn flow in a commercial grain auger. Trans. ASABE 2018, 61, 1743–1755. [Google Scholar] [CrossRef]
  33. Mousaviraad, M.; Tekeste, M.Z.; Rosentrater, K.A. Calibration and validation of a discrete element model of corn using grain flow simulation in a commercial screw grain auger. Trans. ASABE 2017, 60, 1403. [Google Scholar] [CrossRef]
  34. Yu, Y.; Fu, H.; Yu, J. DEM-based simulation of the corn threshing process. Adv. Powder Technol. 2015, 26, 1400–1409. [Google Scholar] [CrossRef]
  35. Han, D.; Zhang, D.; Jing, H.; Yang, L.; Cui, T.; Ding, Y.; Wang, Z.; Wang, Y.; Zhang, T. DEM-CFD coupling simulation and optimization of an inside-filling air-blowing maize precision seed-metering device. Comput. Electron. Agric. 2018, 150, 426–438. [Google Scholar] [CrossRef]
  36. Gao, X.; Cui, T.; Zhou, Z.; Yu, Y.; Xu, Y.; Zhang, D.; Song, W. DEM study of particle motion in novel high-speed seed metering device. Adv. Powder Technol. 2021, 32, 1438–1449. [Google Scholar] [CrossRef]
  37. Wei, H.; Zan, L.; Li, Y.; Wang, Z.; Saxén, H.; Yu, Y. Numerical and experimental studies of corn particle properties on the forming of pile. Powder Technol. 2017, 321, 533–543. [Google Scholar] [CrossRef]
  38. González-Montellano, C.; Fuentes, J.; Ayuga-Téllez, E.; Ayuga, F. Determination of the mechanical properties of maize grains and olives required for use in DEM simulations. J. Food Eng. 2012, 111, 553–562. [Google Scholar] [CrossRef]
  39. Boac, J.; Casada, M.; Pordesimo, L.; Petingco, M.; Maghirang, R.; Harner III, J. Evaluation of particle models of corn kernels for discrete element method simulation of shelled corn mass flow. Smart Agric. Technol. 2023, 4, 100197. [Google Scholar] [CrossRef]
  40. Li, H.; Zeng, R.; Niu, Z.; Zhang, J. A calibration method for contact parameters of maize kernels based on the discrete element method. Agriculture 2022, 12, 664. [Google Scholar] [CrossRef]
  41. Chen, Z.; Wassgren, C.; Veikle, E.; Ambrose, K. Determination of material and interaction properties of maize and wheat kernels for DEM simulation. Biosyst. Eng. 2020, 195, 208–226. [Google Scholar] [CrossRef]
  42. Simões, B.D.; Marques, E.A.; Carbas, R.J.; Maul, S.; Stihler, P.; Weißgraeber, P.; da Silva, L.F. Rheological and Mechanical Properties of an Acrylic PSA. Polymers 2023, 15, 3843. [Google Scholar] [CrossRef]
  43. Wang, L.; Zheng, Z.; Yu, Y.; Liu, T.; Zhang, Z. Determination of the energetic coefficient of restitution of maize grain based on laboratory experiments and DEM simulations. Powder Technol. 2020, 362, 645–658. [Google Scholar] [CrossRef]
  44. Horabik, J.; Molenda, M. Parameters and contact models for DEM simulations of agricultural granular materials: A review. Biosyst. Eng. 2016, 147, 206–225. [Google Scholar] [CrossRef]
  45. Stigh, U.; Biel, A. Effects of strain rate on the cohesive properties and fracture process of a pressure sensitive adhesive. Eng. Fract. Mech. 2018, 203, 266–275. [Google Scholar] [CrossRef]
  46. Pawar, E. A review article on acrylic PMMA. IOSR J. Mech. Civ. Eng 2016, 13, 1–4. [Google Scholar]
  47. Wang, L.; Wu, B.; Wu, Z.; Li, R.; Feng, X. Experimental determination of the coefficient of restitution of particle-particle collision for frozen maize grains. Powder Technol. 2018, 338, 263–273. [Google Scholar] [CrossRef]
  48. Batista, J.; Santos, D.; Béttega, R. Determination of the physical and interaction properties of sorghum grains: Application to computational fluid dynamics–discrete element method simulations of the fluid dynamics of a conical spouted bed. Particuology 2021, 54, 91–101. [Google Scholar] [CrossRef]
  49. Chen, Z.; Wassgren, C.; Ambrose, K. Measurements of grain kernel friction coefficients using a reciprocating-pin tribometer. Trans. ASABE 2020, 63, 675–685. [Google Scholar] [CrossRef]
  50. Hastie, D. Experimental measurement of the coefficient of restitution of irregular shaped particles impacting on horizontal surfaces. Chem. Eng. Sci. 2013, 101, 828–836. [Google Scholar] [CrossRef]
  51. Zagainov, N.; Kostyuchenkov, N.; Huang, Y.X.; Sugirbay, A.; Xian, J. Line laser based sensor for real-time seed counting and seed miss detection for precision planter. Opt. Laser Technol. 2023, 167, 109742. [Google Scholar] [CrossRef]
  52. Singh, R.; Singh, G.; Saraswat, D. Optimisation of design and operational parameters of a pneumatic seed metering device for planting cottonseeds. Biosyst. Eng. 2005, 92, 429–438. [Google Scholar] [CrossRef]
  53. Xiong, D.; Wu, M.; Xie, W.; Liu, R.; Luo, H. Design and experimental study of the general mechanical pneumatic combined seed metering device. Appl. Sci. 2021, 11, 7223. [Google Scholar] [CrossRef]
  54. Wang, Q.; Han, D.; Chen, L.; Huang, Y.; Li, W.; Tang, C. Simulation and optimization of the spoon-wheel type maize precision seed-metering device based on vibration. INMATEH Agric. Eng. 2024, 73, 17–28. [Google Scholar] [CrossRef]
Figure 1. Structural diagram of the spoon-wheel type precision seed metering device. 1—front cover; 2—seeding spoon wheel; 3—partition plate; 4—guiding wheel; 5—casing; 6—transmission.
Agriculture 15 01363 g001
Figure 2. Working principle of the Seed Miss Prevention System for a spoon-wheel precision seed metering device.
Agriculture 15 01363 g002
Figure 3. Corn shape composition in EDEM Software 9.1.0.
Agriculture 15 01363 g003
Figure 4. Distribution of corn seed dimensions. (a) Corn seed dimension measurements; (b) histograms of corn seed dimension distributions.
Agriculture 15 01363 g004
Figure 5. Electrical schematic of the Seed Miss Prevention System for a spoon-wheel type precision seed metering device.
Agriculture 15 01363 g005
Figure 6. Sensors of the Seed Miss Prevention System. 1—partition plate; 2—ambient light; 3—laser receiver; 4—seeding spoon wheel; 5—front cover; 6—guiding wheel; 7—laser module; 8—ambient light receiver; 9—casing.
Agriculture 15 01363 g006
Figure 7. Laser position based on DEM simulation.
Agriculture 15 01363 g007
Figure 8. Retrofitting of spoon-wheel type seed metering device. (a) Non-retrofitted spoon-wheel type seed-metering device with chain-driven transmission; (b) non-retrofitted spoon-wheel type seed-metering device (partition plate and front cover not shown); (c) spoon-wheel type seed-metering device with transmission; (d) installation of a laser emitter–receiver pair for seed-miss detection, along with an ambient-light sensor module to minimize false positives; (e) precision-drilled holes in the guiding wheel to accommodate the laser beam, ambient-light sensor, and seed-counting sensor; (f) configuration with stepper motor directly mounted to the metering device, eliminating chain sagging and gear backlash.
Agriculture 15 01363 g008
Figure 9. Oscilloscope sensors reading data. (a) Signal behavior of laser-beam sensors and ambient-light showing rise and fall times; (b) Square pulse at 5 rpm during normal seed flow; (c) Signal spike from laser sensor with no ambient-light response, indicating a seed miss.
Agriculture 15 01363 g009
Figure 10. Detailed visualization of experimental data with corn ‘Dekalb DKC5032’.
Agriculture 15 01363 g010
Figure 11. Seed miss detection by the direct beam sensor.
Agriculture 15 01363 g011
Figure 12. p-values obtained from pairwise Tukey HSD statistical analysis. D—SMPS disabled; S1—SMPS enabled with one sensor; S2—SMPS enabled with two sensors; M1—comparison with single misses data; M2—comparison with double misses data; M3+—comparison with 3 or more misses data.
Agriculture 15 01363 g012
Table 1. Parameters used in the EDEM simulation.
Input ParameterValue
Particle shapeFigure 3
Particle massvaries
Corn particles
Young’s modulus (MPa)26
Poisson’s ratio0.4
Density (kg/m3)1450
Acrylic plastic (PMMA)
Young’s modulus (GPa)3.0
Poisson’s ratio0.37
Density (kg/m3)1180
Galvanized steel
Young’s modulus (GPa)208
Poisson’s ratio0.3
Density (kg/m3)7850
Coefficients of static friction
Corn–corn0.372
Corn–acrylic plastic0.22
Corn–galvanized steel0.45
Coefficients of restitution
Corn–corn0.3
Corn–acrylic plastic0.62
Corn–galvanized steel0.613
Coefficients of rolling friction
Corn–corn μ rcc = 0.0607
Corn–acrylic plastic μ rca = 0.0934
Corn–galvanized steel μ rcs = 0.0311
Particle generation properties
Standard deviation0.11
Lower limit0.67
Upper limit1.33
Note. Coefficients of rolling friction are equal to 0 since the simple Hertz–Mindlin model is used in EDEM and rolling friction is considered unimportant for this simulation.
Table 2. Experimental results.
ModeCultivarSMPS DisabledSMPS with 1 SensorSMPS with 2 Sensors
rpmrpmrpm
351015351015351015
CountCorn ‘Flint Dent’10091033101510001016123912289201001103810141028
Corn ‘Dekalb DKC5032’1006100010281013103910279639211057105010531017
Pea ‘Little Marvel’1049101410151018996101211299851021102110191031
Red beans ‘Dark Red Kidney’102510281082102610291003102810071005100310421057
Sunflower ‘Black Oil’100010251015103310141019101410211016100110291035
White balls (non-organic)102310161025104610111009102910461005101210111010
White beans ‘Great Northern’100210101001101510231015101510381014101110091026
Single MissesCorn ‘Flint Dent’2121872582600113
Corn ‘Dekalb DKC5032’22261216112130110
Pea ‘Little Marvel’39544741971442041839
Red beans ‘Dark Red Kidney’553948274261911311
Sunflower ‘Black Oil’484826325482712211
White balls (non-organic)000000000000
White beans ‘Great Northern’8271531562241069153761
Double MissesCorn ‘Flint Dent’112000340003
Corn ‘Dekalb DKC5032’218000010000
Pea ‘Little Marvel’7635001300013
Red beans ‘Dark Red Kidney’1324001110003
Sunflower ‘Black Oil’336300040001
White balls (non-organic)000000000000
White beans ‘Great Northern’796330001400011
More than
two Misses
Corn ‘Flint Dent’00000043200025
Corn ‘Dekalb DKC5032’000300060000
Pea ‘Little Marvel’01050132600025
Red beans ‘Dark Red Kidney’0000002330004
Sunflower ‘Black Oil’0000000150006
White balls (non-organic)000000000000
White beans ‘Great Northern’00070005000057
Miss IndexCorn ‘Flint Dent’0.0220.0220.0120.0070.0020.0040.0290.1590.0000.0000.0010.144
Corn ‘Dekalb DKC5032’0.0250.0270.0270.0250.0010.0010.0020.0460.0000.0010.0010.000
Pea ‘Little Marvel’0.0480.0640.0500.0630.0090.0100.0240.1310.0000.0040.0170.128
Red beans ‘Dark Red Kidney’0.0530.0420.0460.0330.0040.0020.0130.1860.0010.0010.0030.029
Sunflower ‘Black Oil’0.0510.0500.0360.0350.0050.0040.0080.0820.0010.0020.0020.030
White balls (non-organic)0.0000.0000.0000.0000.0000.0000.0000.0000.0000.0000.0000.000
White beans ‘Great Northern’0.0870.0810.0610.1940.0210.0040.0100.2800.0150.0030.0070.282
Disclaimer/Publisher’s Note: The statements, opinions and data contained in all publications are solely those of the individual author(s) and contributor(s) and not of MDPI and/or the editor(s). MDPI and/or the editor(s) disclaim responsibility for any injury to people or property resulting from any ideas, methods, instructions or products referred to in the content.

