Author Contributions
Conceptualization, H.D. and H.L.; methodology, H.D.; software, M.W.; validation, H.D., M.W. and Q.W.; formal analysis, M.W.; investigation, M.W. and Q.W.; resources, X.J.; data curation, M.W.; writing—original draft preparation, M.W.; writing—review and editing, H.D.; visualization, H.D.; supervision, H.L.; project administration, C.Z.; funding acquisition, X.J. All authors have read and agreed to the published version of the manuscript.
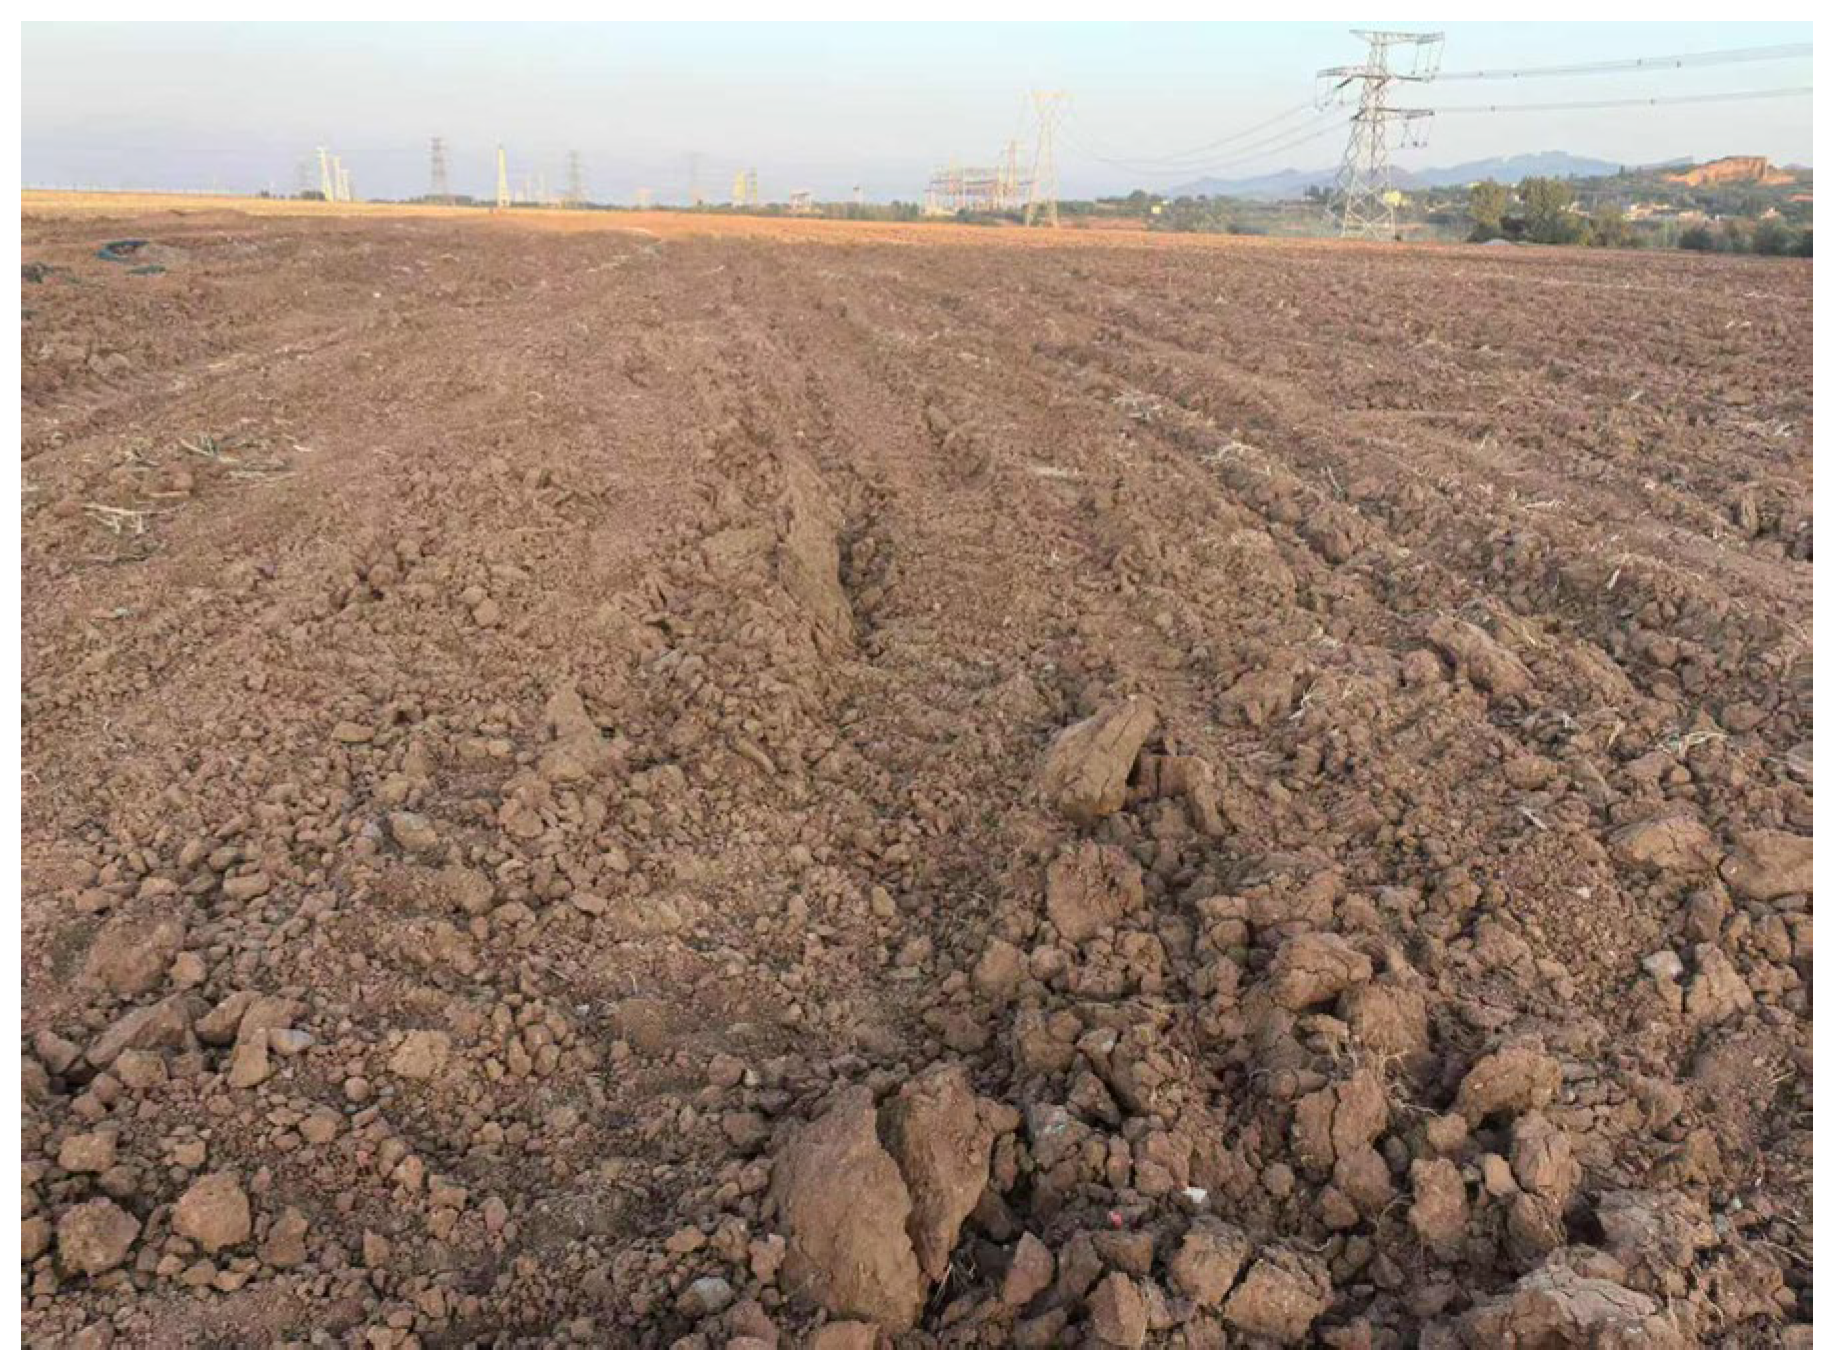
Figure 1.
Yellow cinnamon soil experimental field.
Figure 1.
Yellow cinnamon soil experimental field.
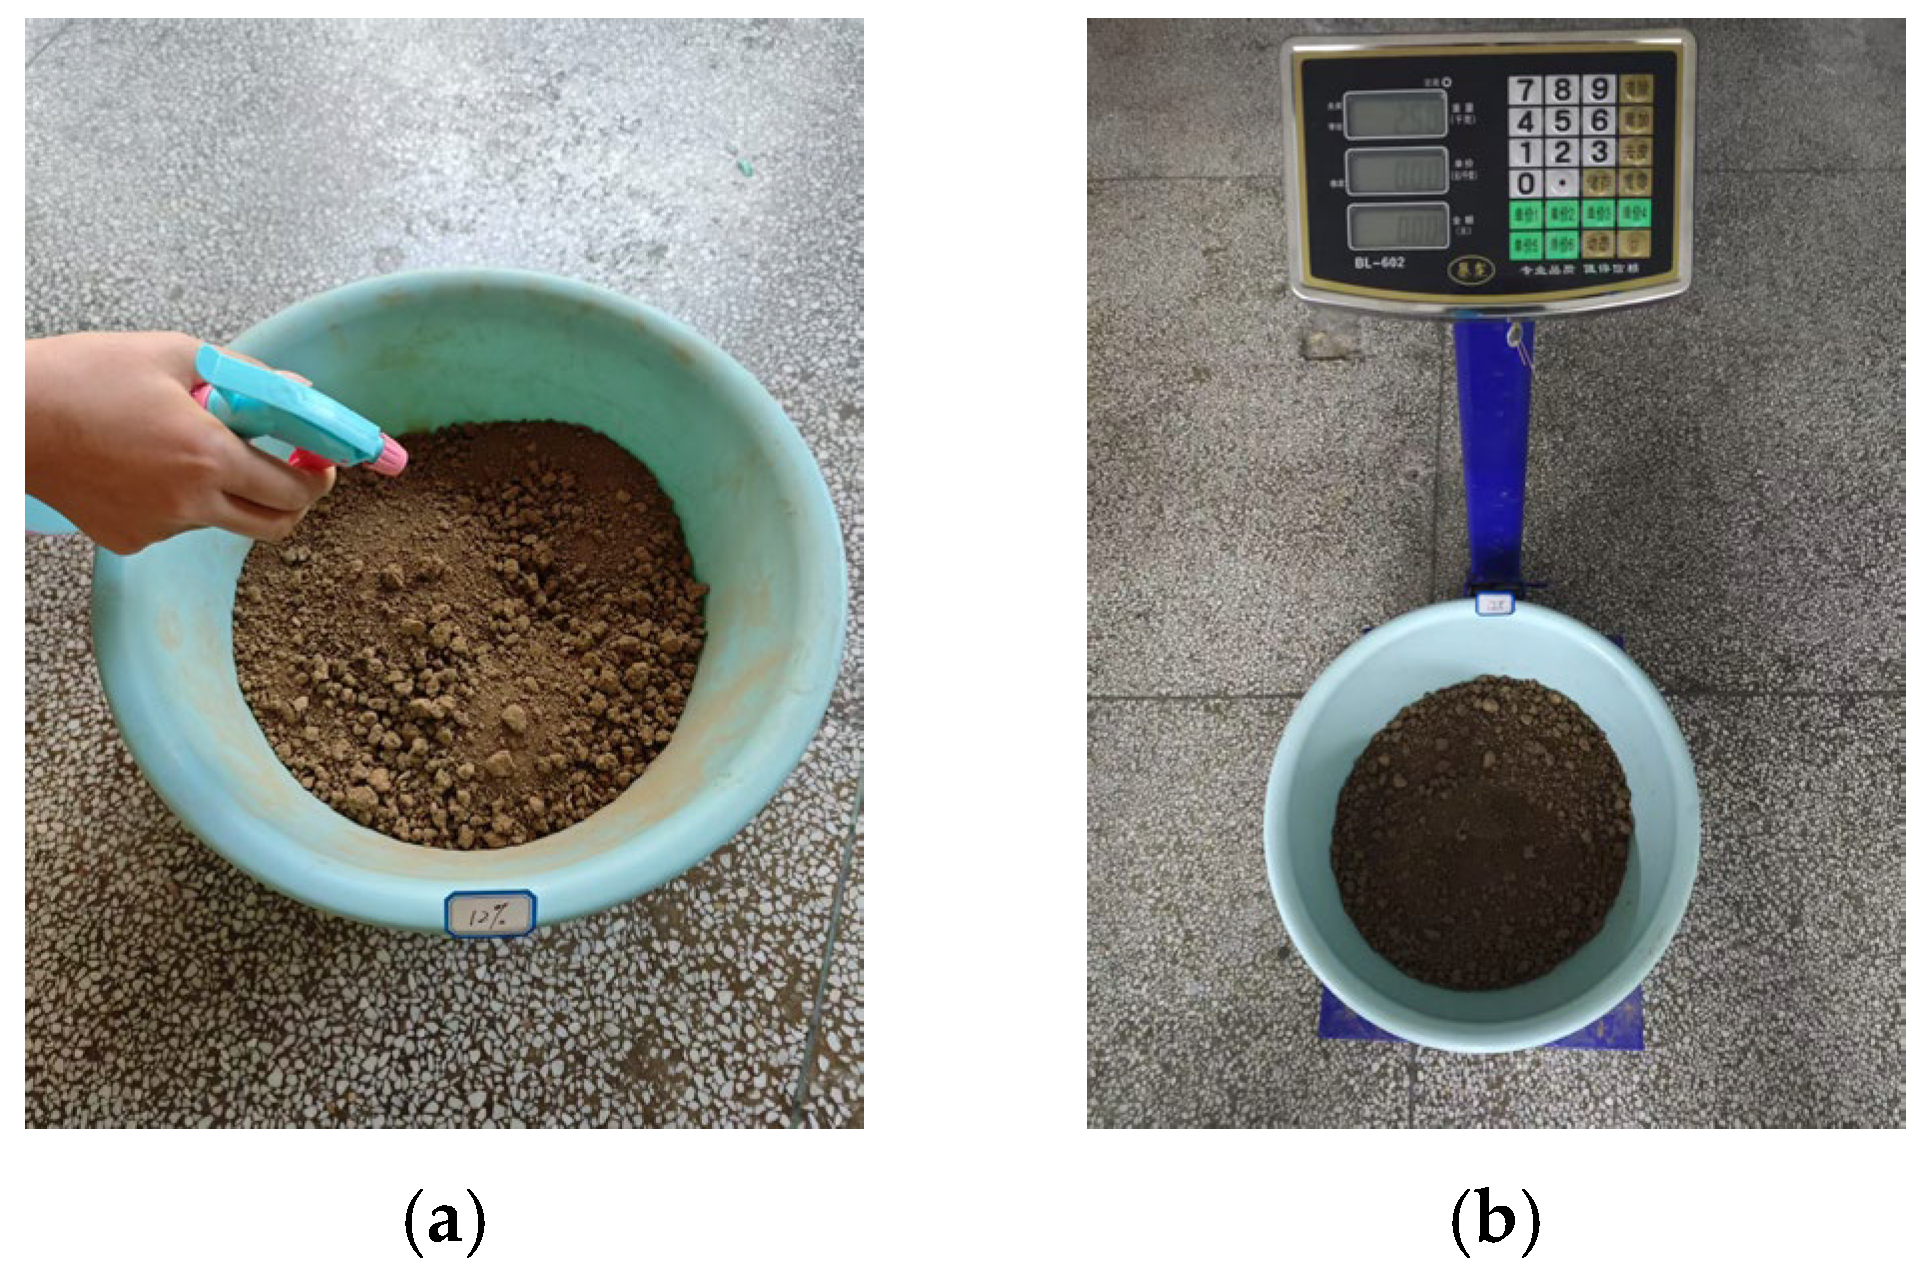
Figure 2.
The soil moisture content ratioing process. (a) Soil moisture content calibration process. (b) Soil mass determination.
Figure 2.
The soil moisture content ratioing process. (a) Soil moisture content calibration process. (b) Soil mass determination.
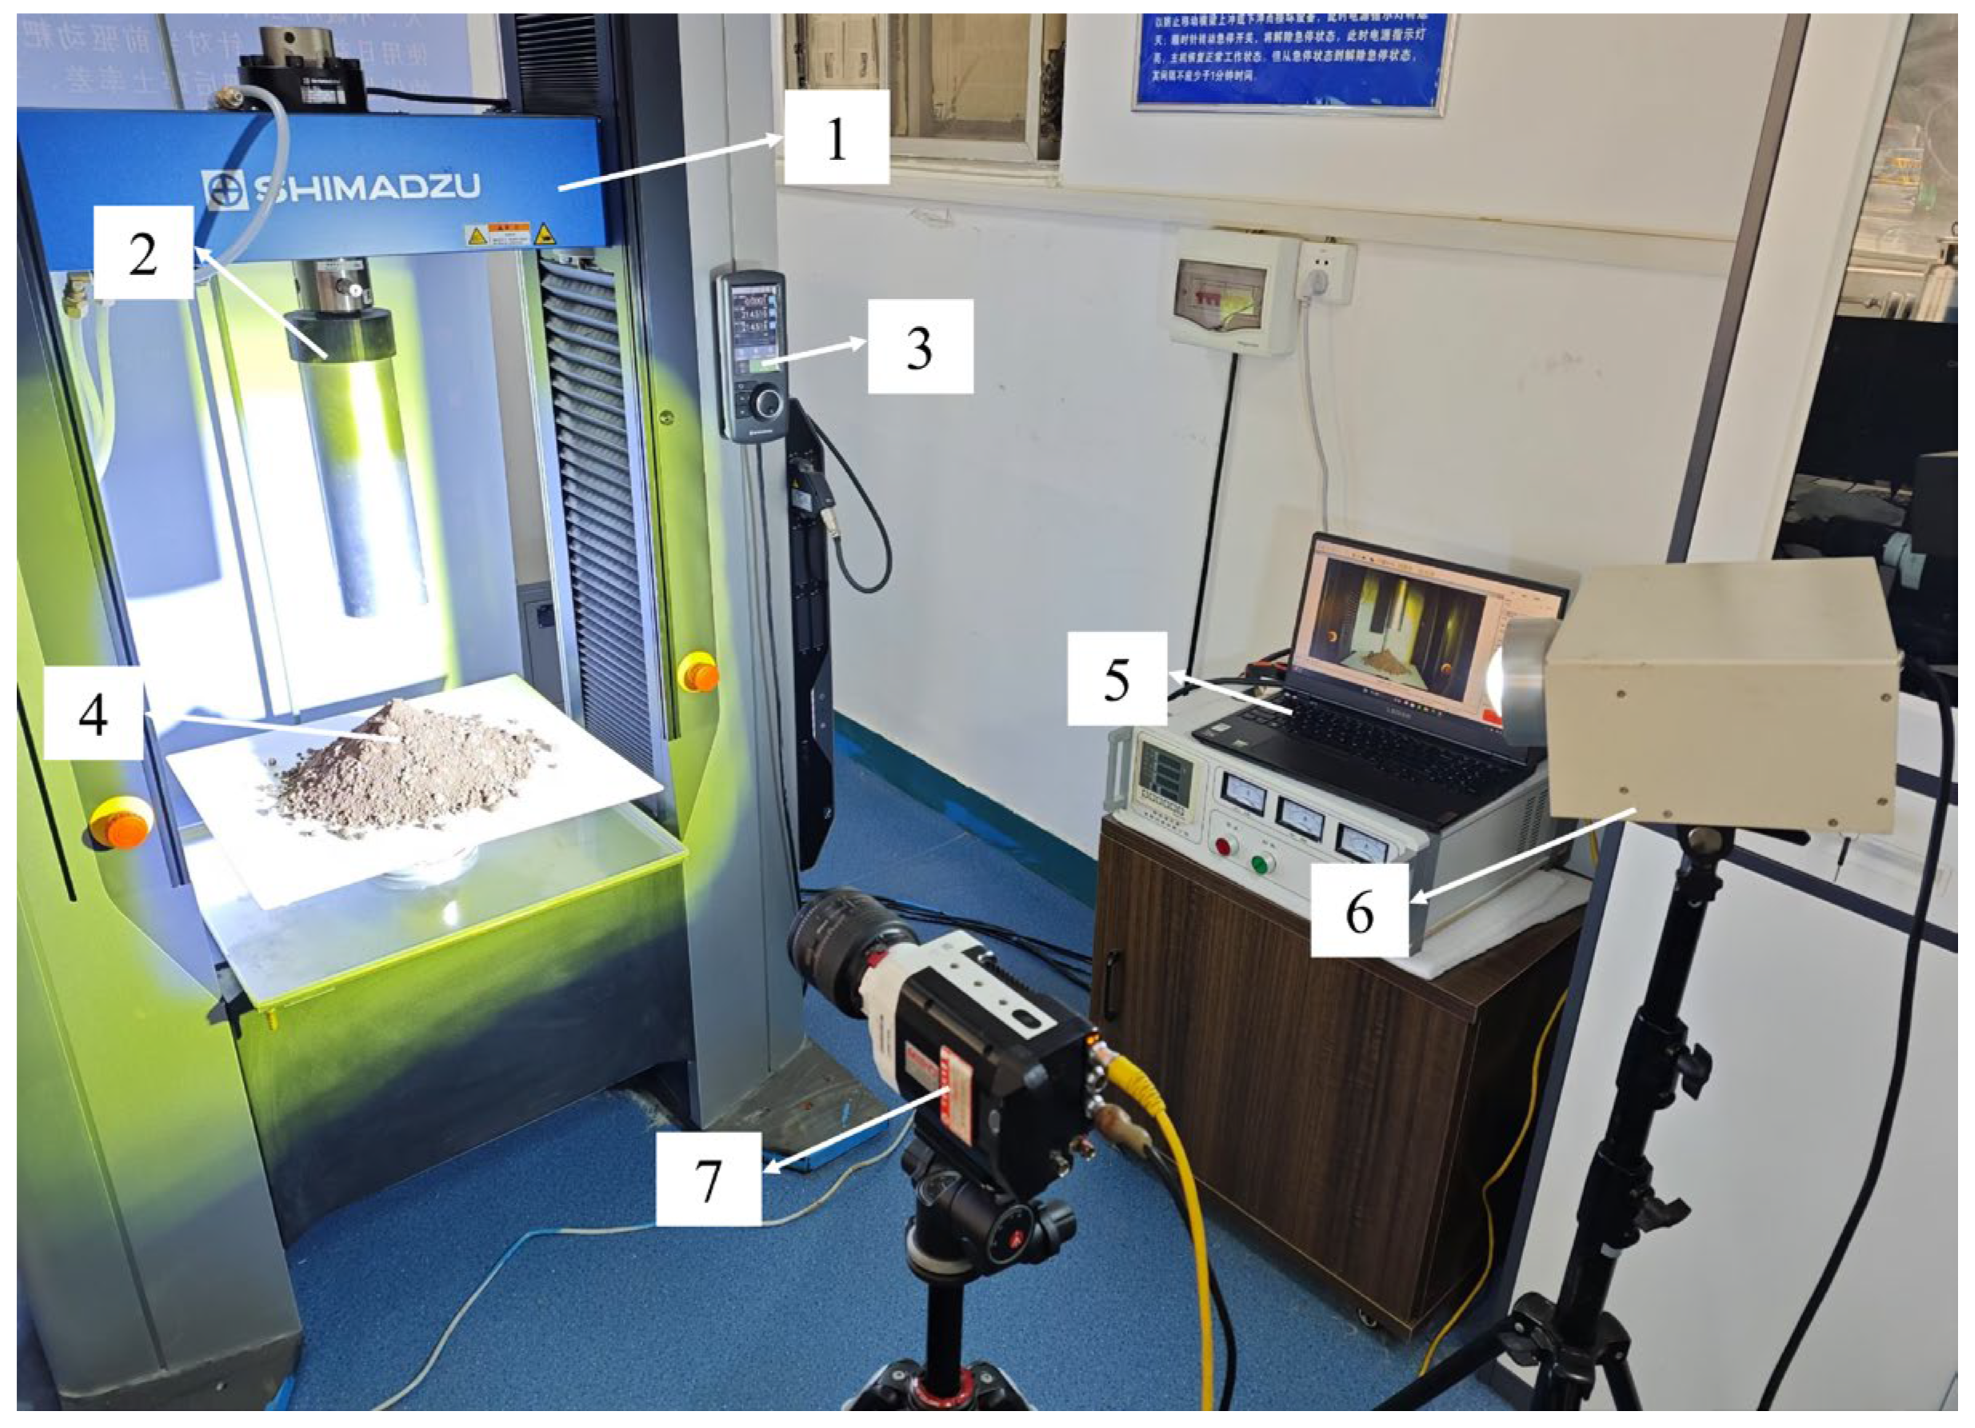
Figure 3.
Cylindrical lifting test device. 1—Universal testing machine; 2—test cylinder; 3—control unit; 4—experimental soil specimen; 5—image acquisition interface; 6—ring light; 7—high-speed imaging system.
Figure 3.
Cylindrical lifting test device. 1—Universal testing machine; 2—test cylinder; 3—control unit; 4—experimental soil specimen; 5—image acquisition interface; 6—ring light; 7—high-speed imaging system.
Figure 4.
Uniaxial compression physical test soil collapse. Phases: 1—Universal testing machine; 2—plexiglass cylinder; 3—clamp collar; 4—force and displacement transducer; 5—compression platen; 6—caked soil. (a) Soil compaction phase. (b) Soil crushing phase.
Figure 4.
Uniaxial compression physical test soil collapse. Phases: 1—Universal testing machine; 2—plexiglass cylinder; 3—clamp collar; 4—force and displacement transducer; 5—compression platen; 6—caked soil. (a) Soil compaction phase. (b) Soil crushing phase.
Figure 5.
Soil angle of repose at different moisture contents: (a) 4%, (b) 8%, (c) 12%, (d) 16%, (e) 20%, and (f) 24%.
Figure 5.
Soil angle of repose at different moisture contents: (a) 4%, (b) 8%, (c) 12%, (d) 16%, (e) 20%, and (f) 24%.
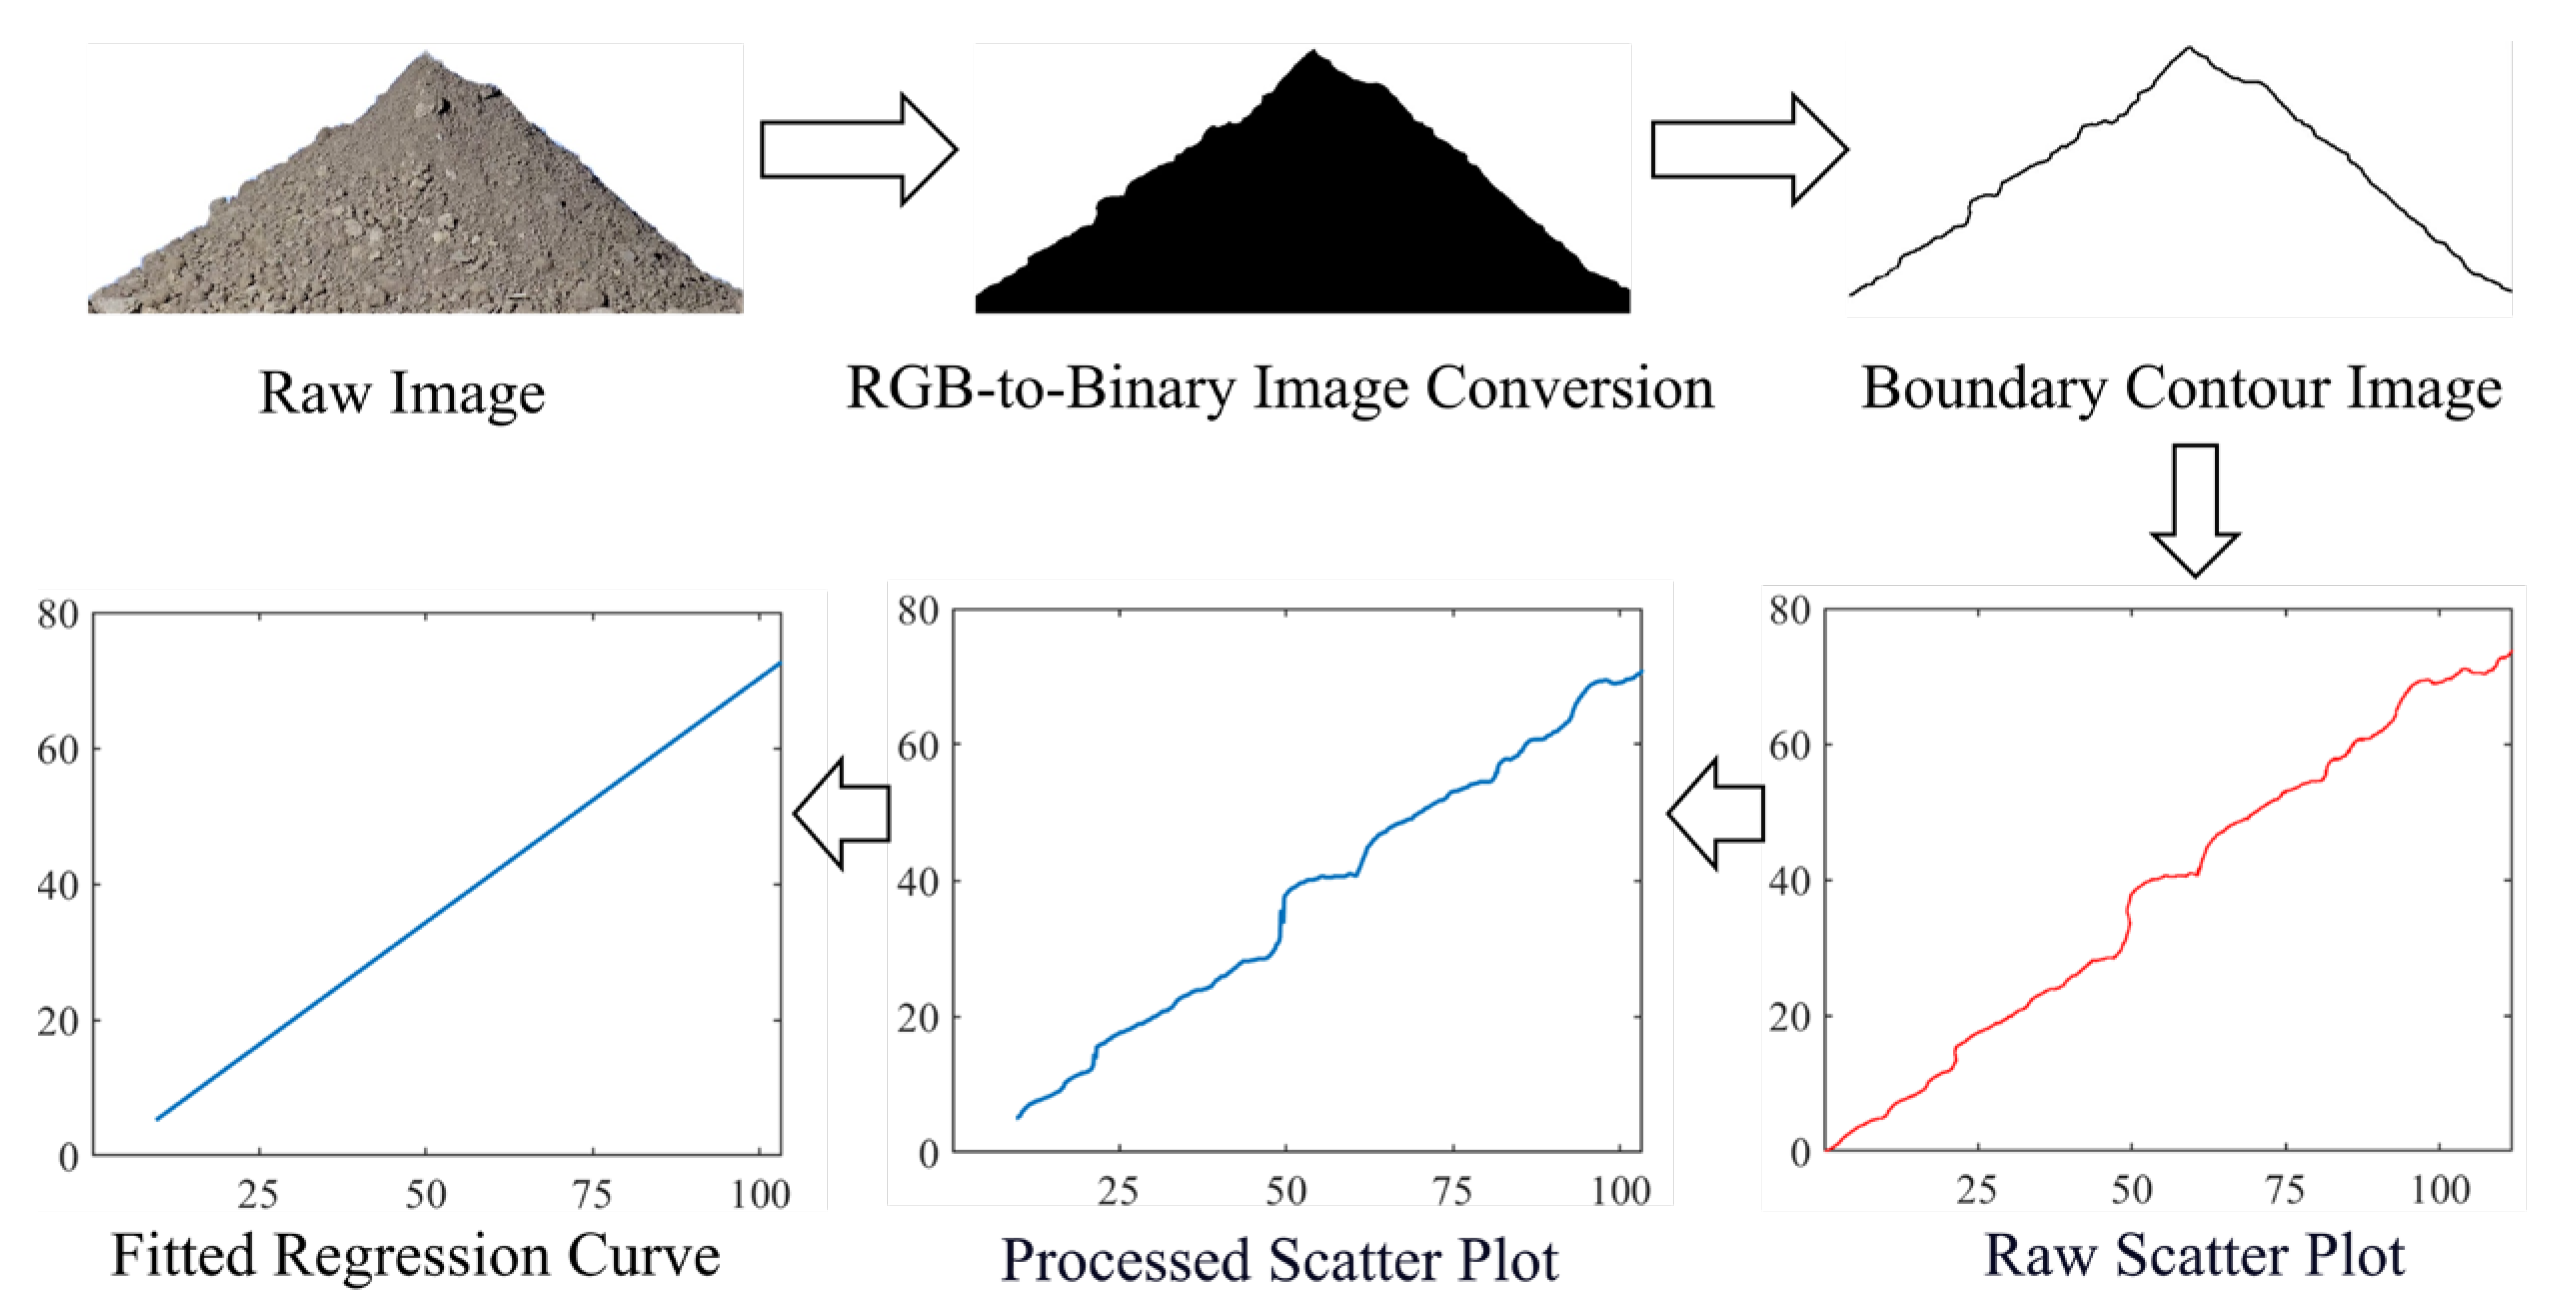
Figure 6.
The process of acquiring images for angle of repose measurement.
Figure 6.
The process of acquiring images for angle of repose measurement.
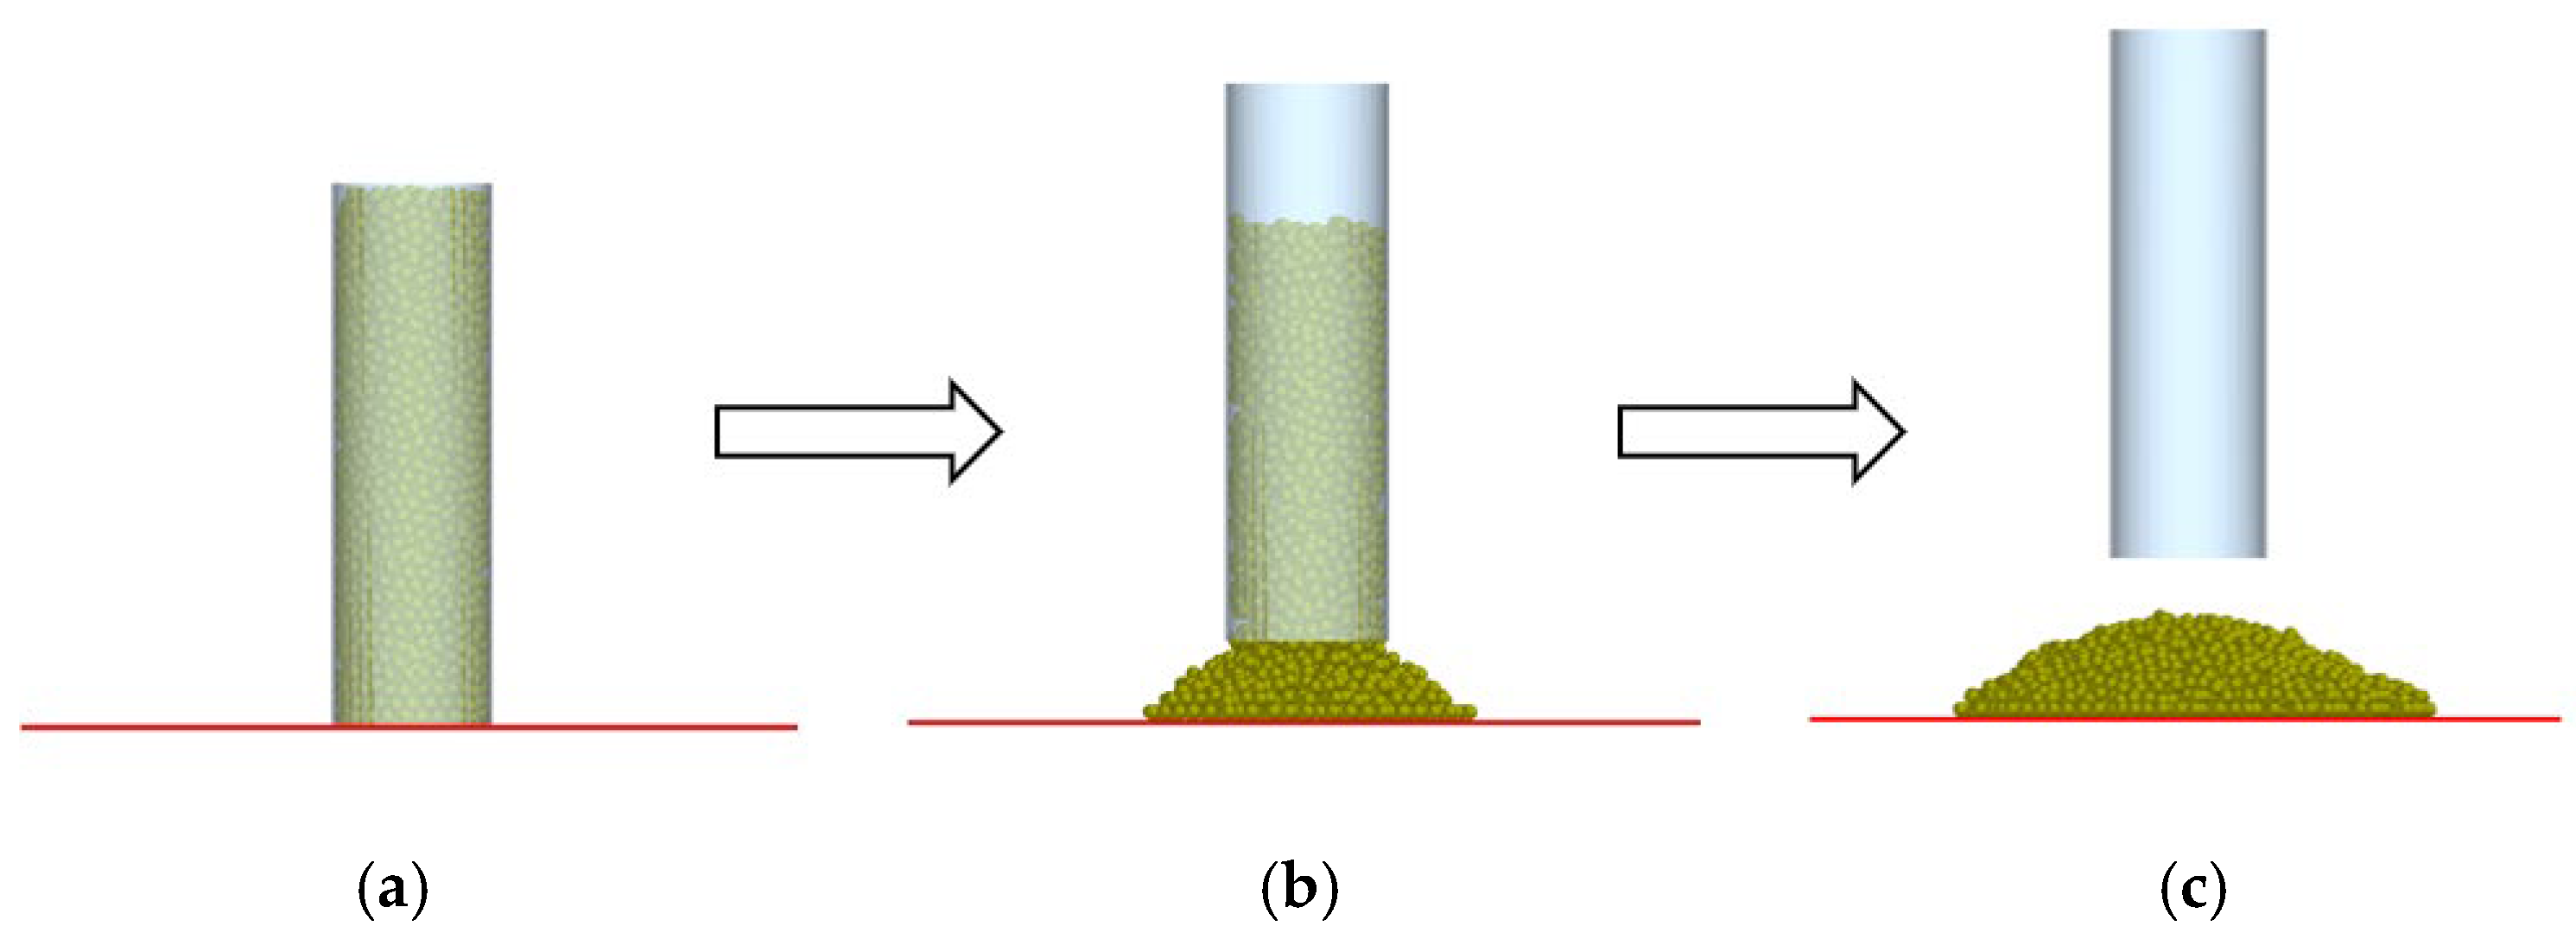
Figure 7.
Angle of repose formation process. (a) Initiation of elevation process. (b) Elevation in progress. (c) Completion of elevation sequence.
Figure 7.
Angle of repose formation process. (a) Initiation of elevation process. (b) Elevation in progress. (c) Completion of elevation sequence.
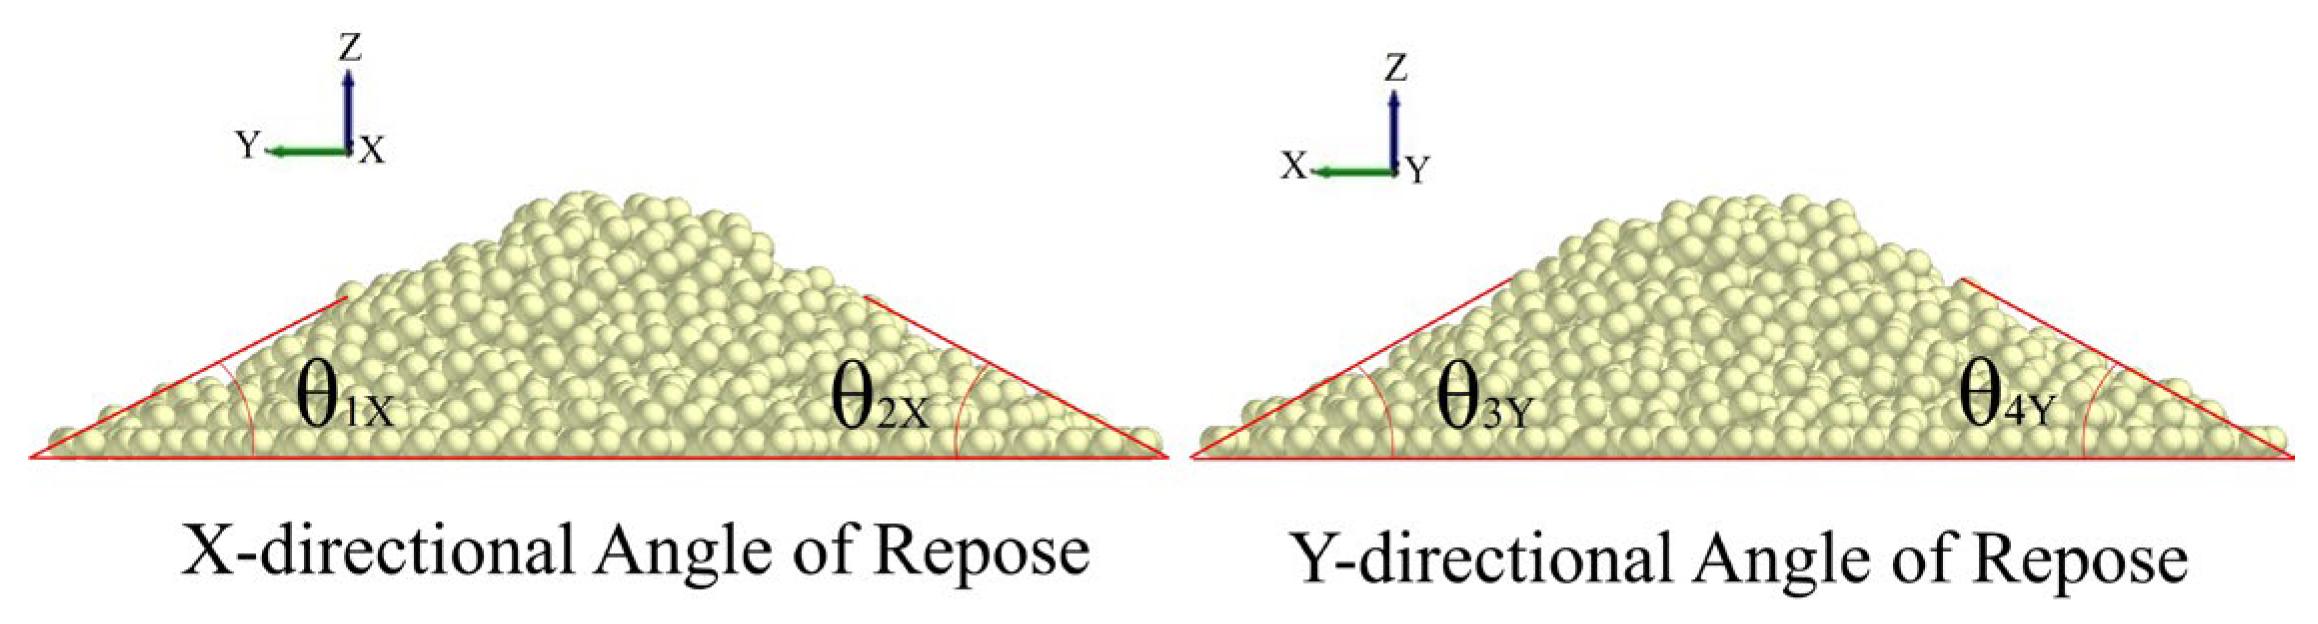
Figure 8.
Simulation test of soil angle of repose measurement.
Figure 8.
Simulation test of soil angle of repose measurement.
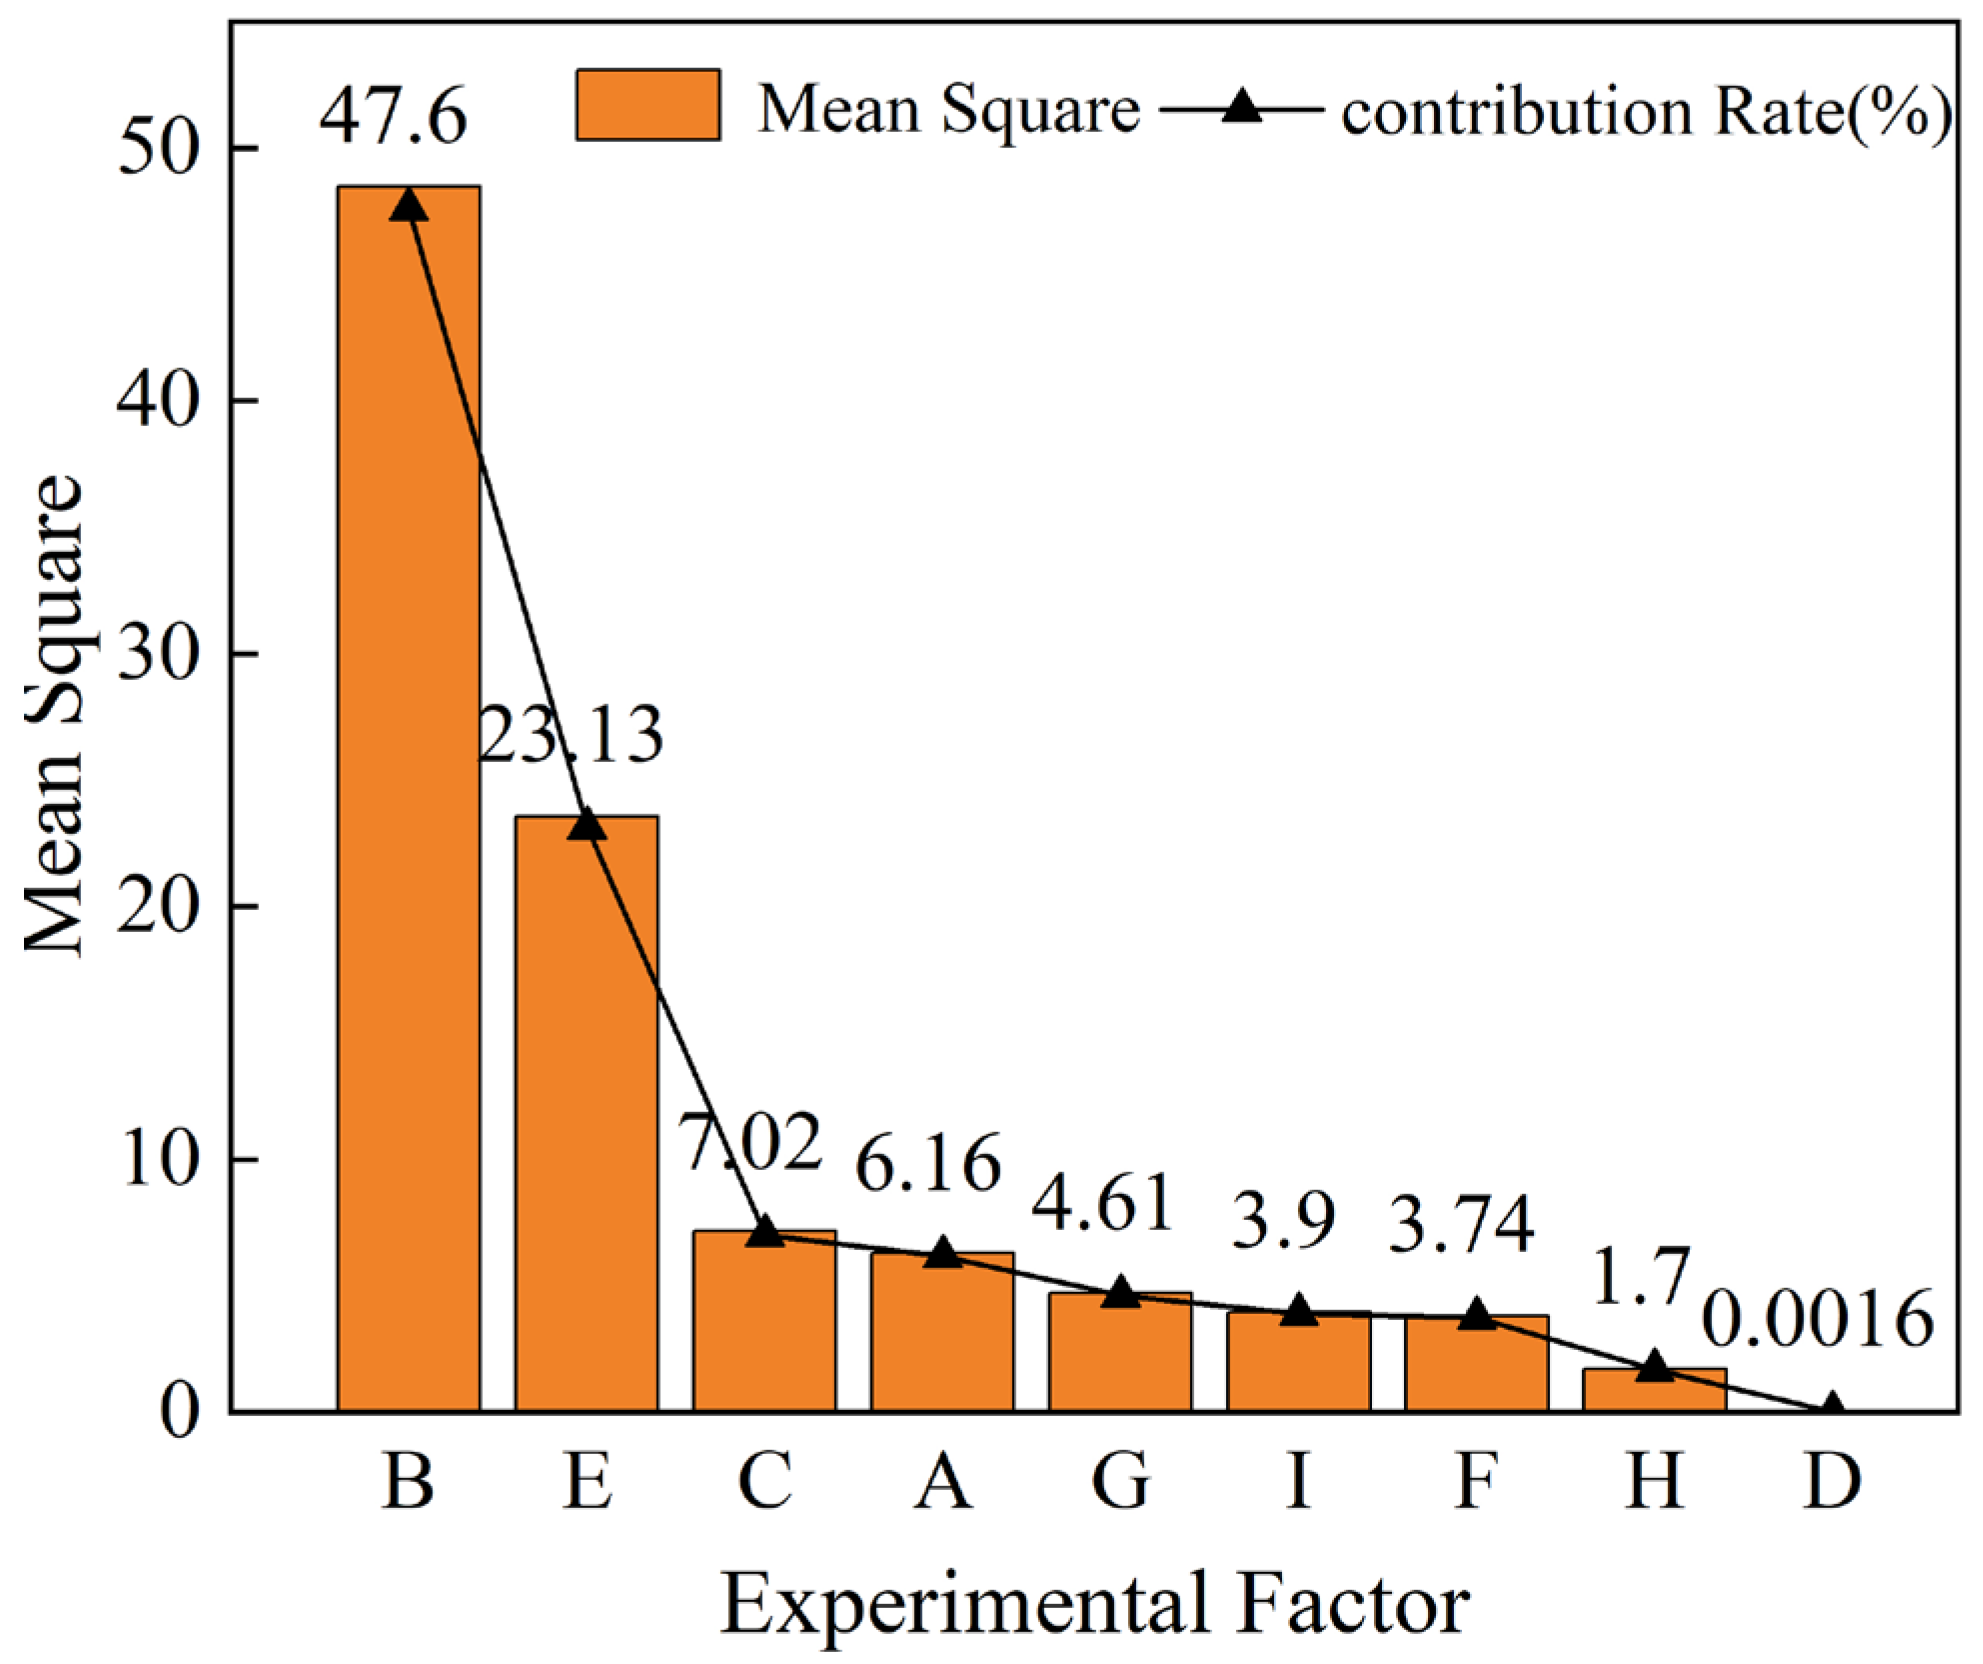
Figure 9.
Pareto graph of experimental results.
Figure 9.
Pareto graph of experimental results.
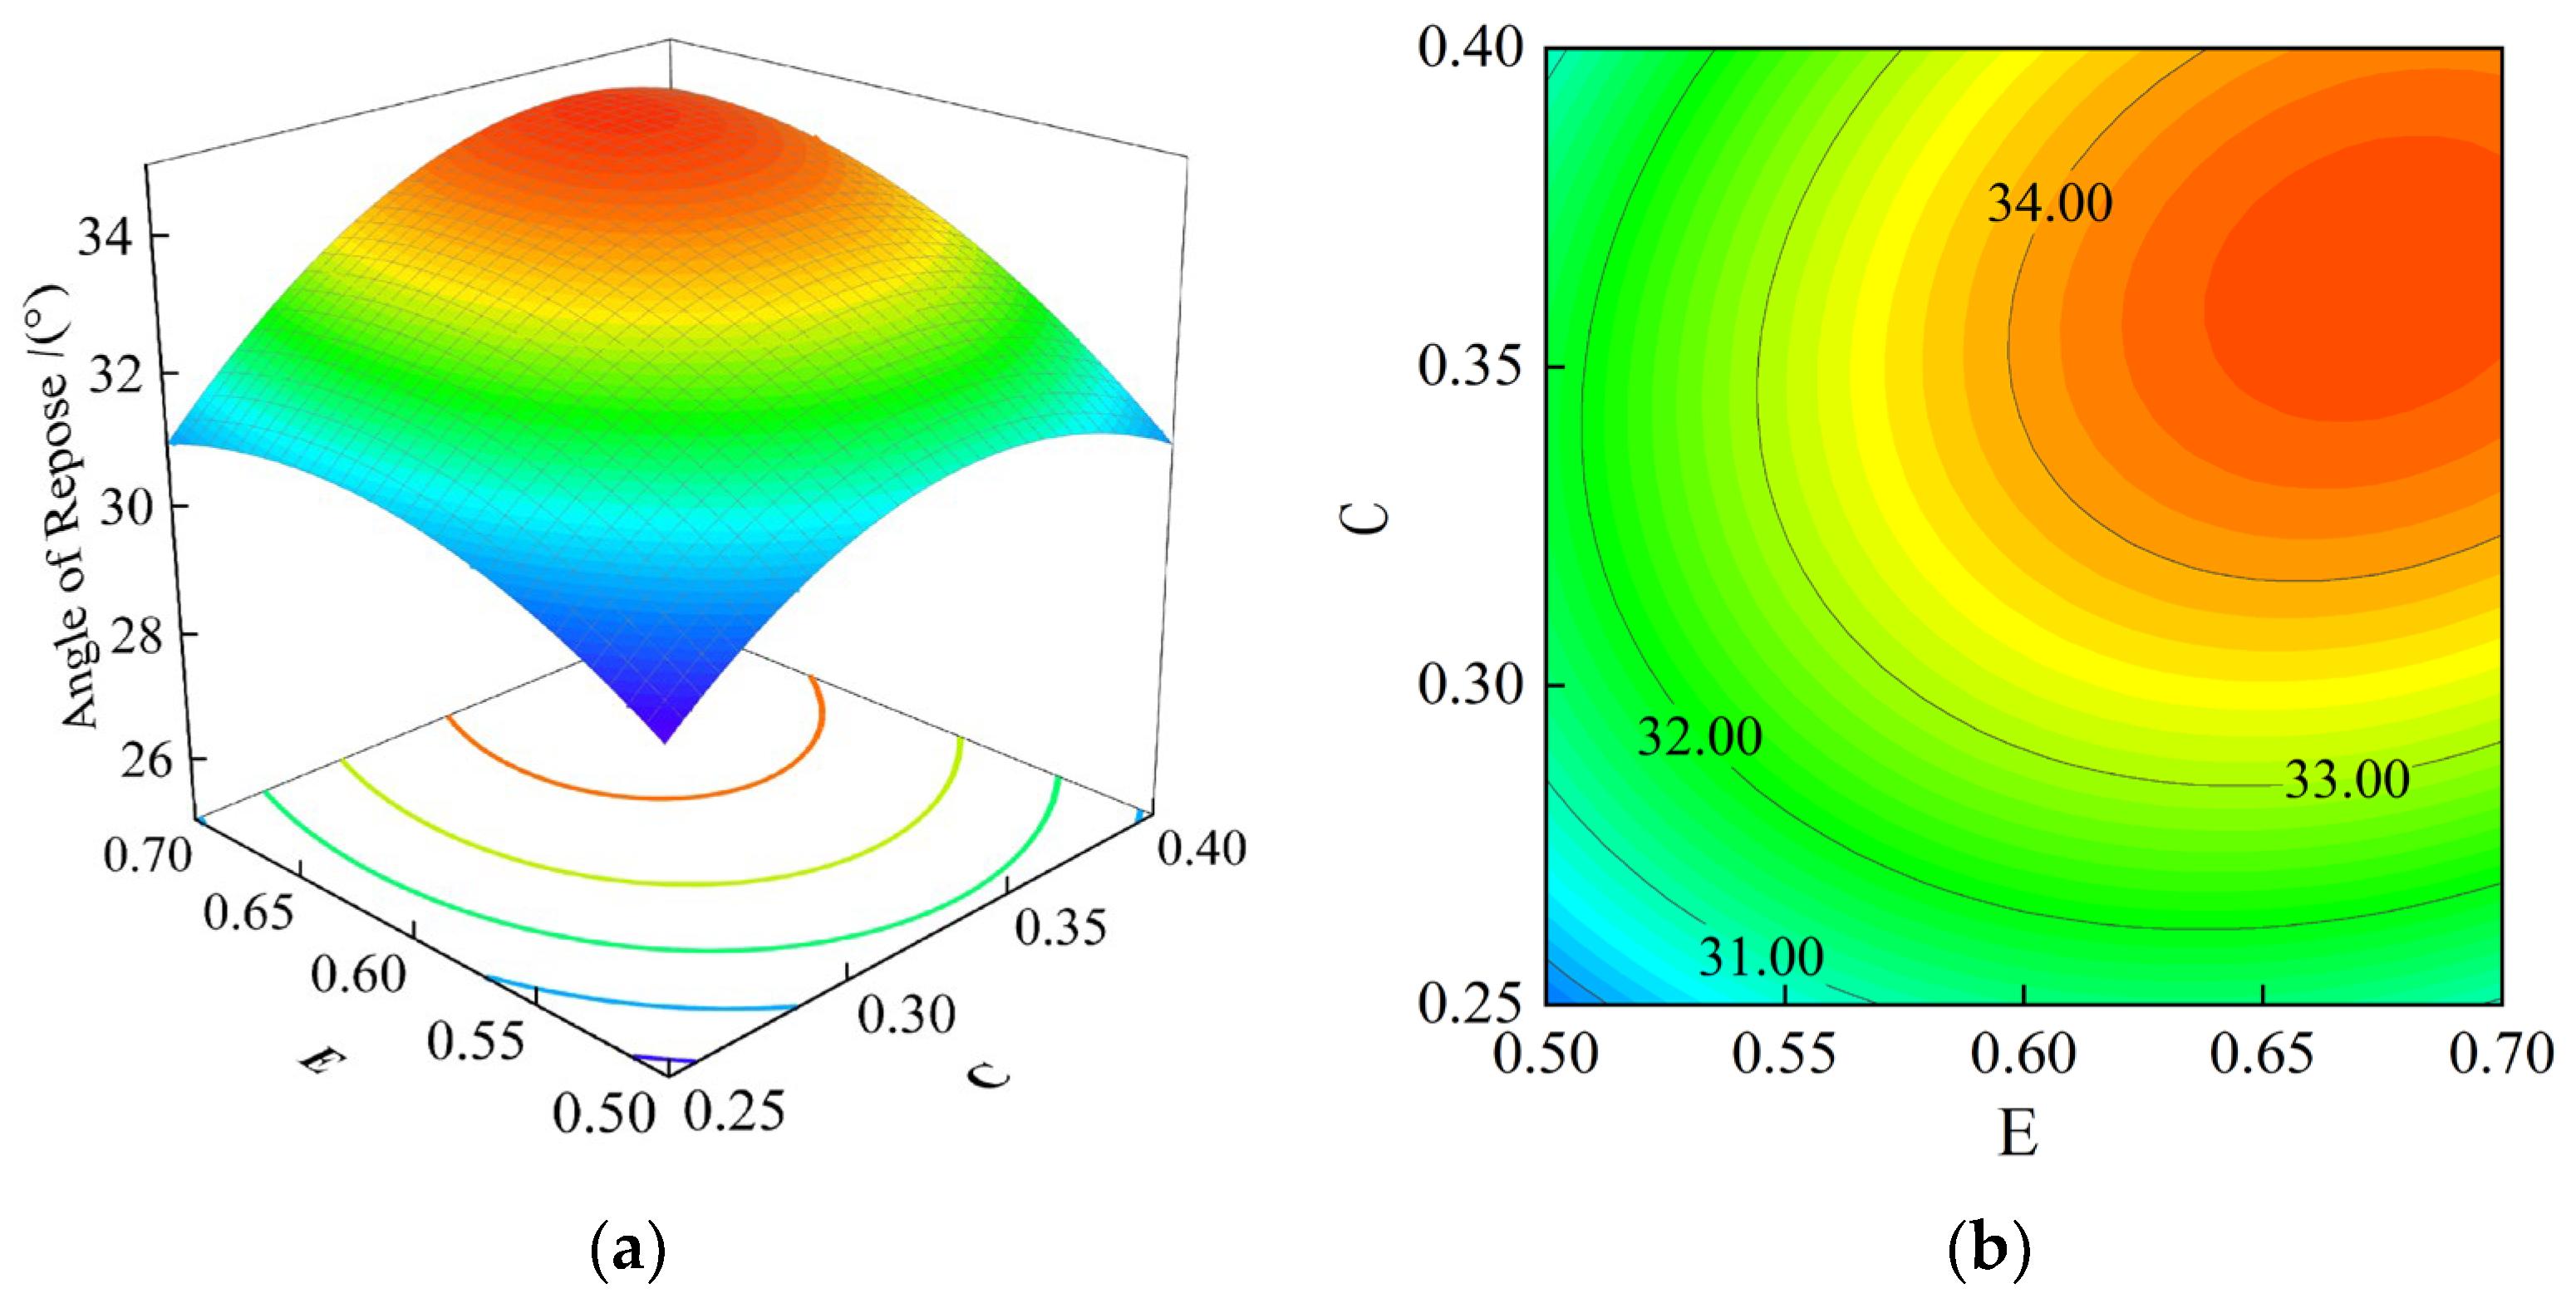
Figure 10.
The influence of interaction parameters on soil accumulation angle. (a) Three-dimensional response surface (EC). (b) Contour plot (EC). The blue, green, yellow, and red colors in the figure sequentially represent the increasing trend of accumulation angle from minimum to maximum values.
Figure 10.
The influence of interaction parameters on soil accumulation angle. (a) Three-dimensional response surface (EC). (b) Contour plot (EC). The blue, green, yellow, and red colors in the figure sequentially represent the increasing trend of accumulation angle from minimum to maximum values.
Figure 11.
Comparison of angle of repose between physical and simulation tests. (a) 4%. (b) 8%. (c) 12%. (d) 16%. (e) 20%. (f) 24%.
Figure 11.
Comparison of angle of repose between physical and simulation tests. (a) 4%. (b) 8%. (c) 12%. (d) 16%. (e) 20%. (f) 24%.
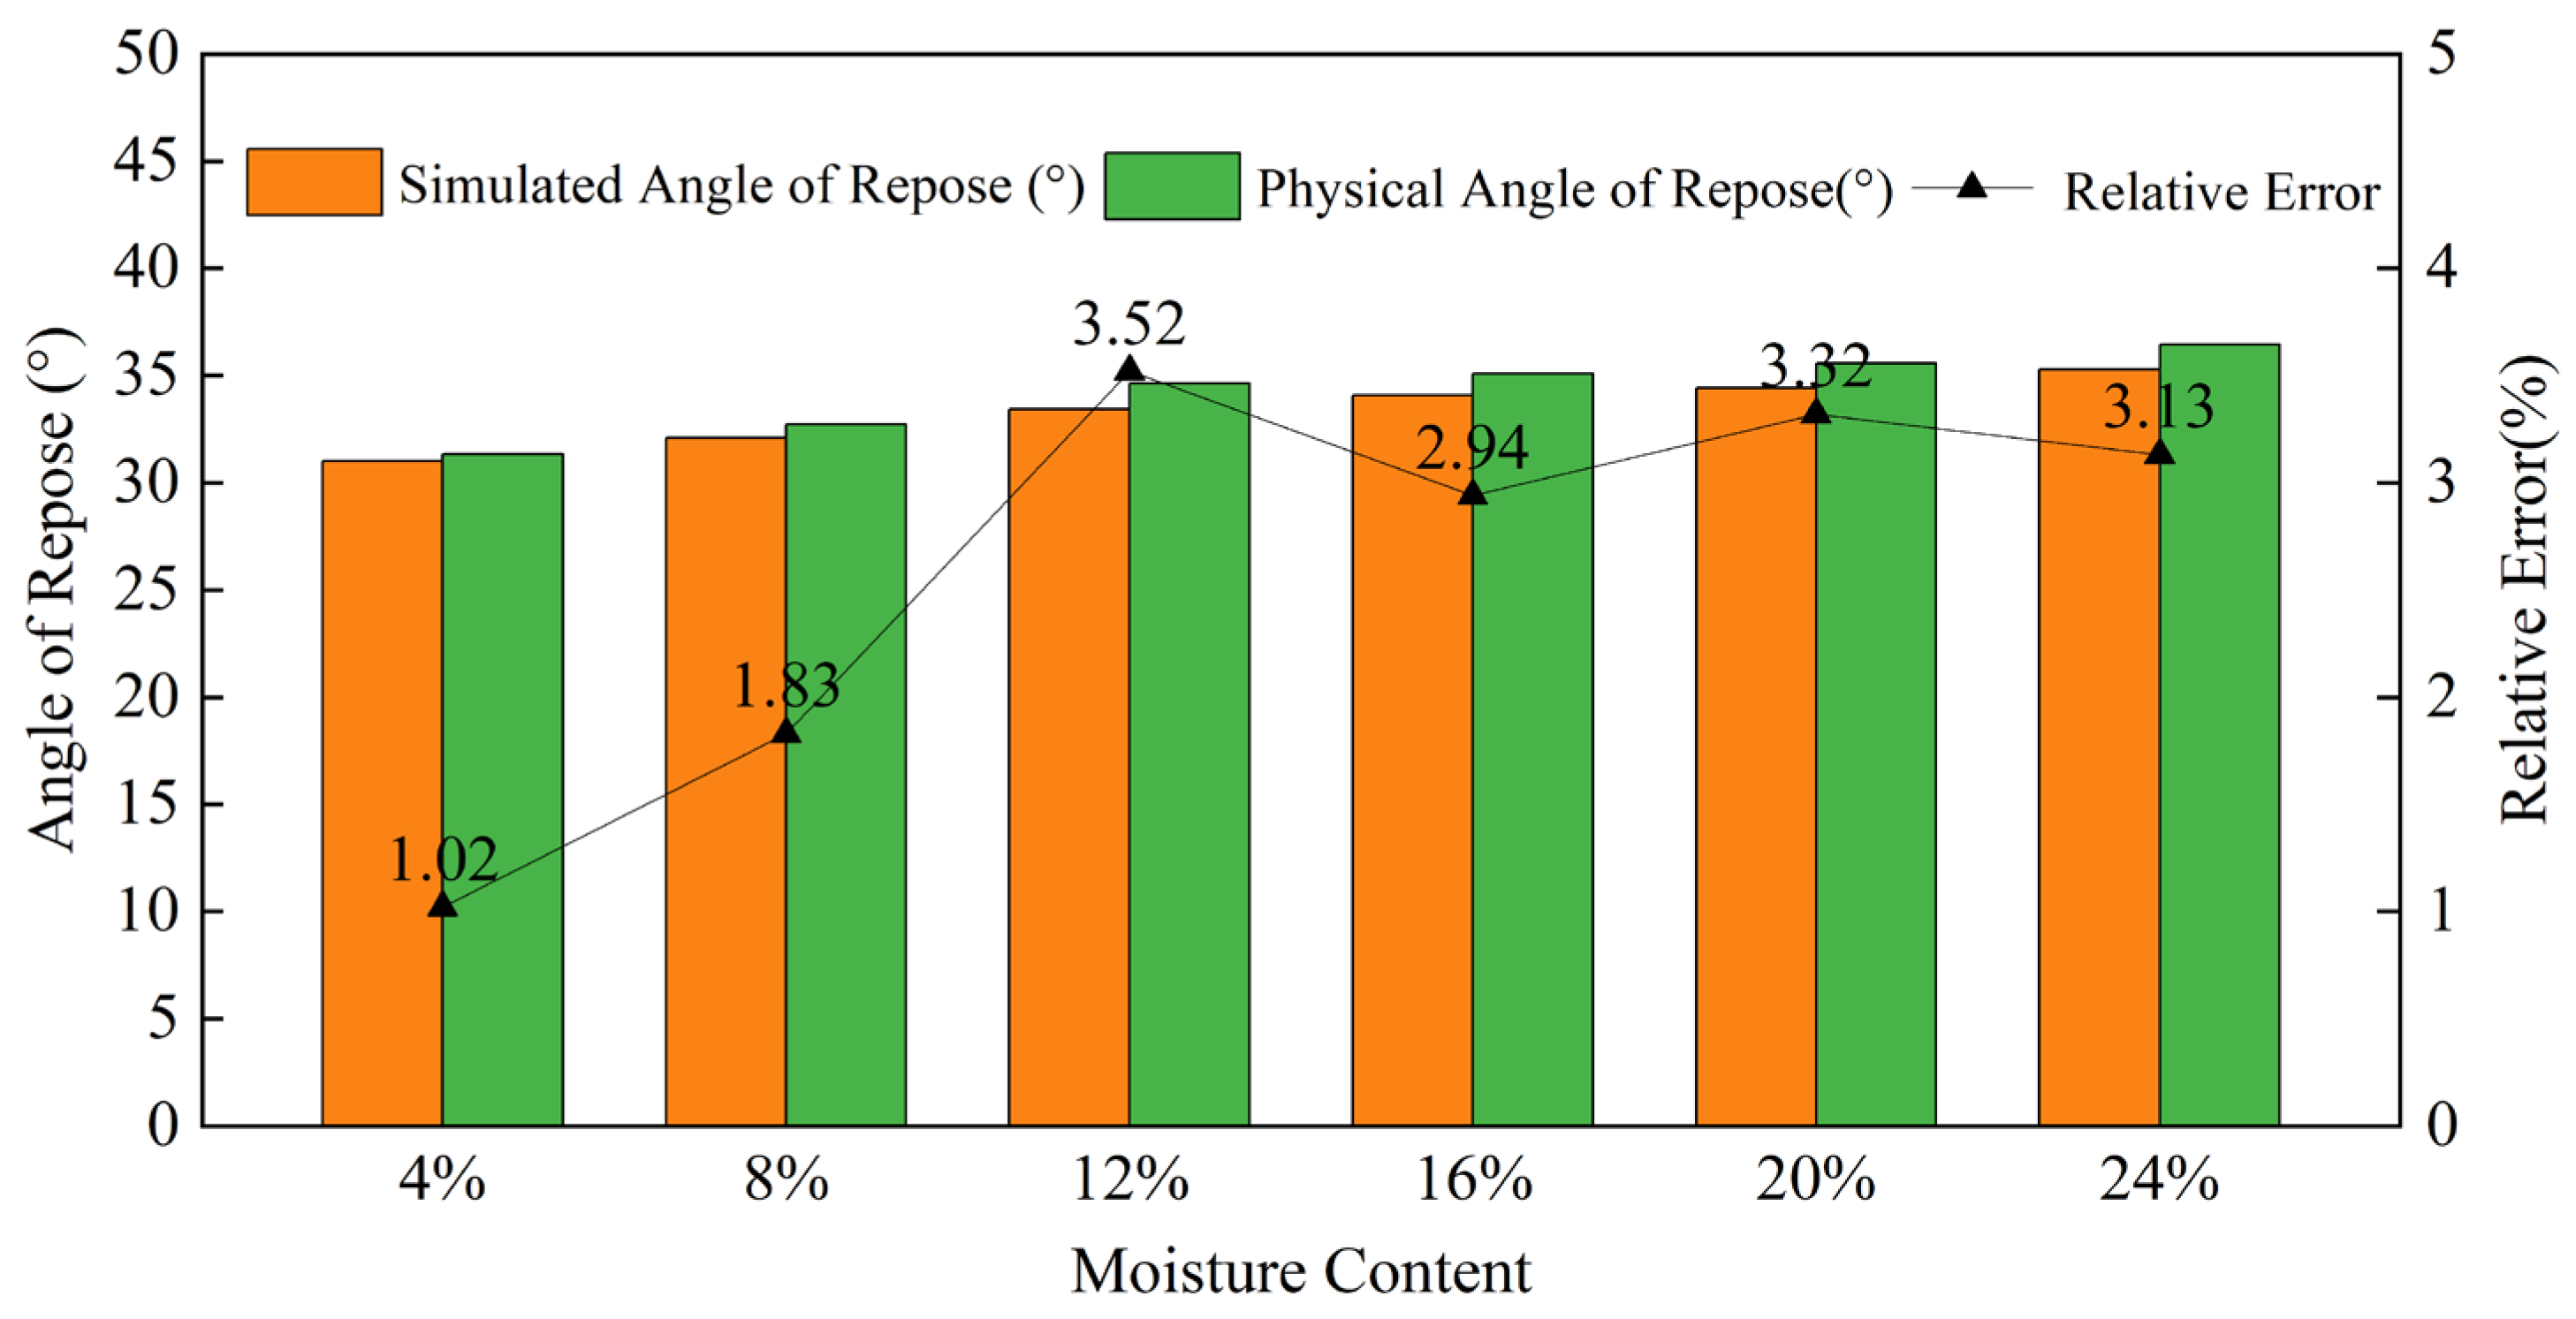
Figure 12.
Physical experiment and simulation experiment: angle of repose error analysis.
Figure 12.
Physical experiment and simulation experiment: angle of repose error analysis.
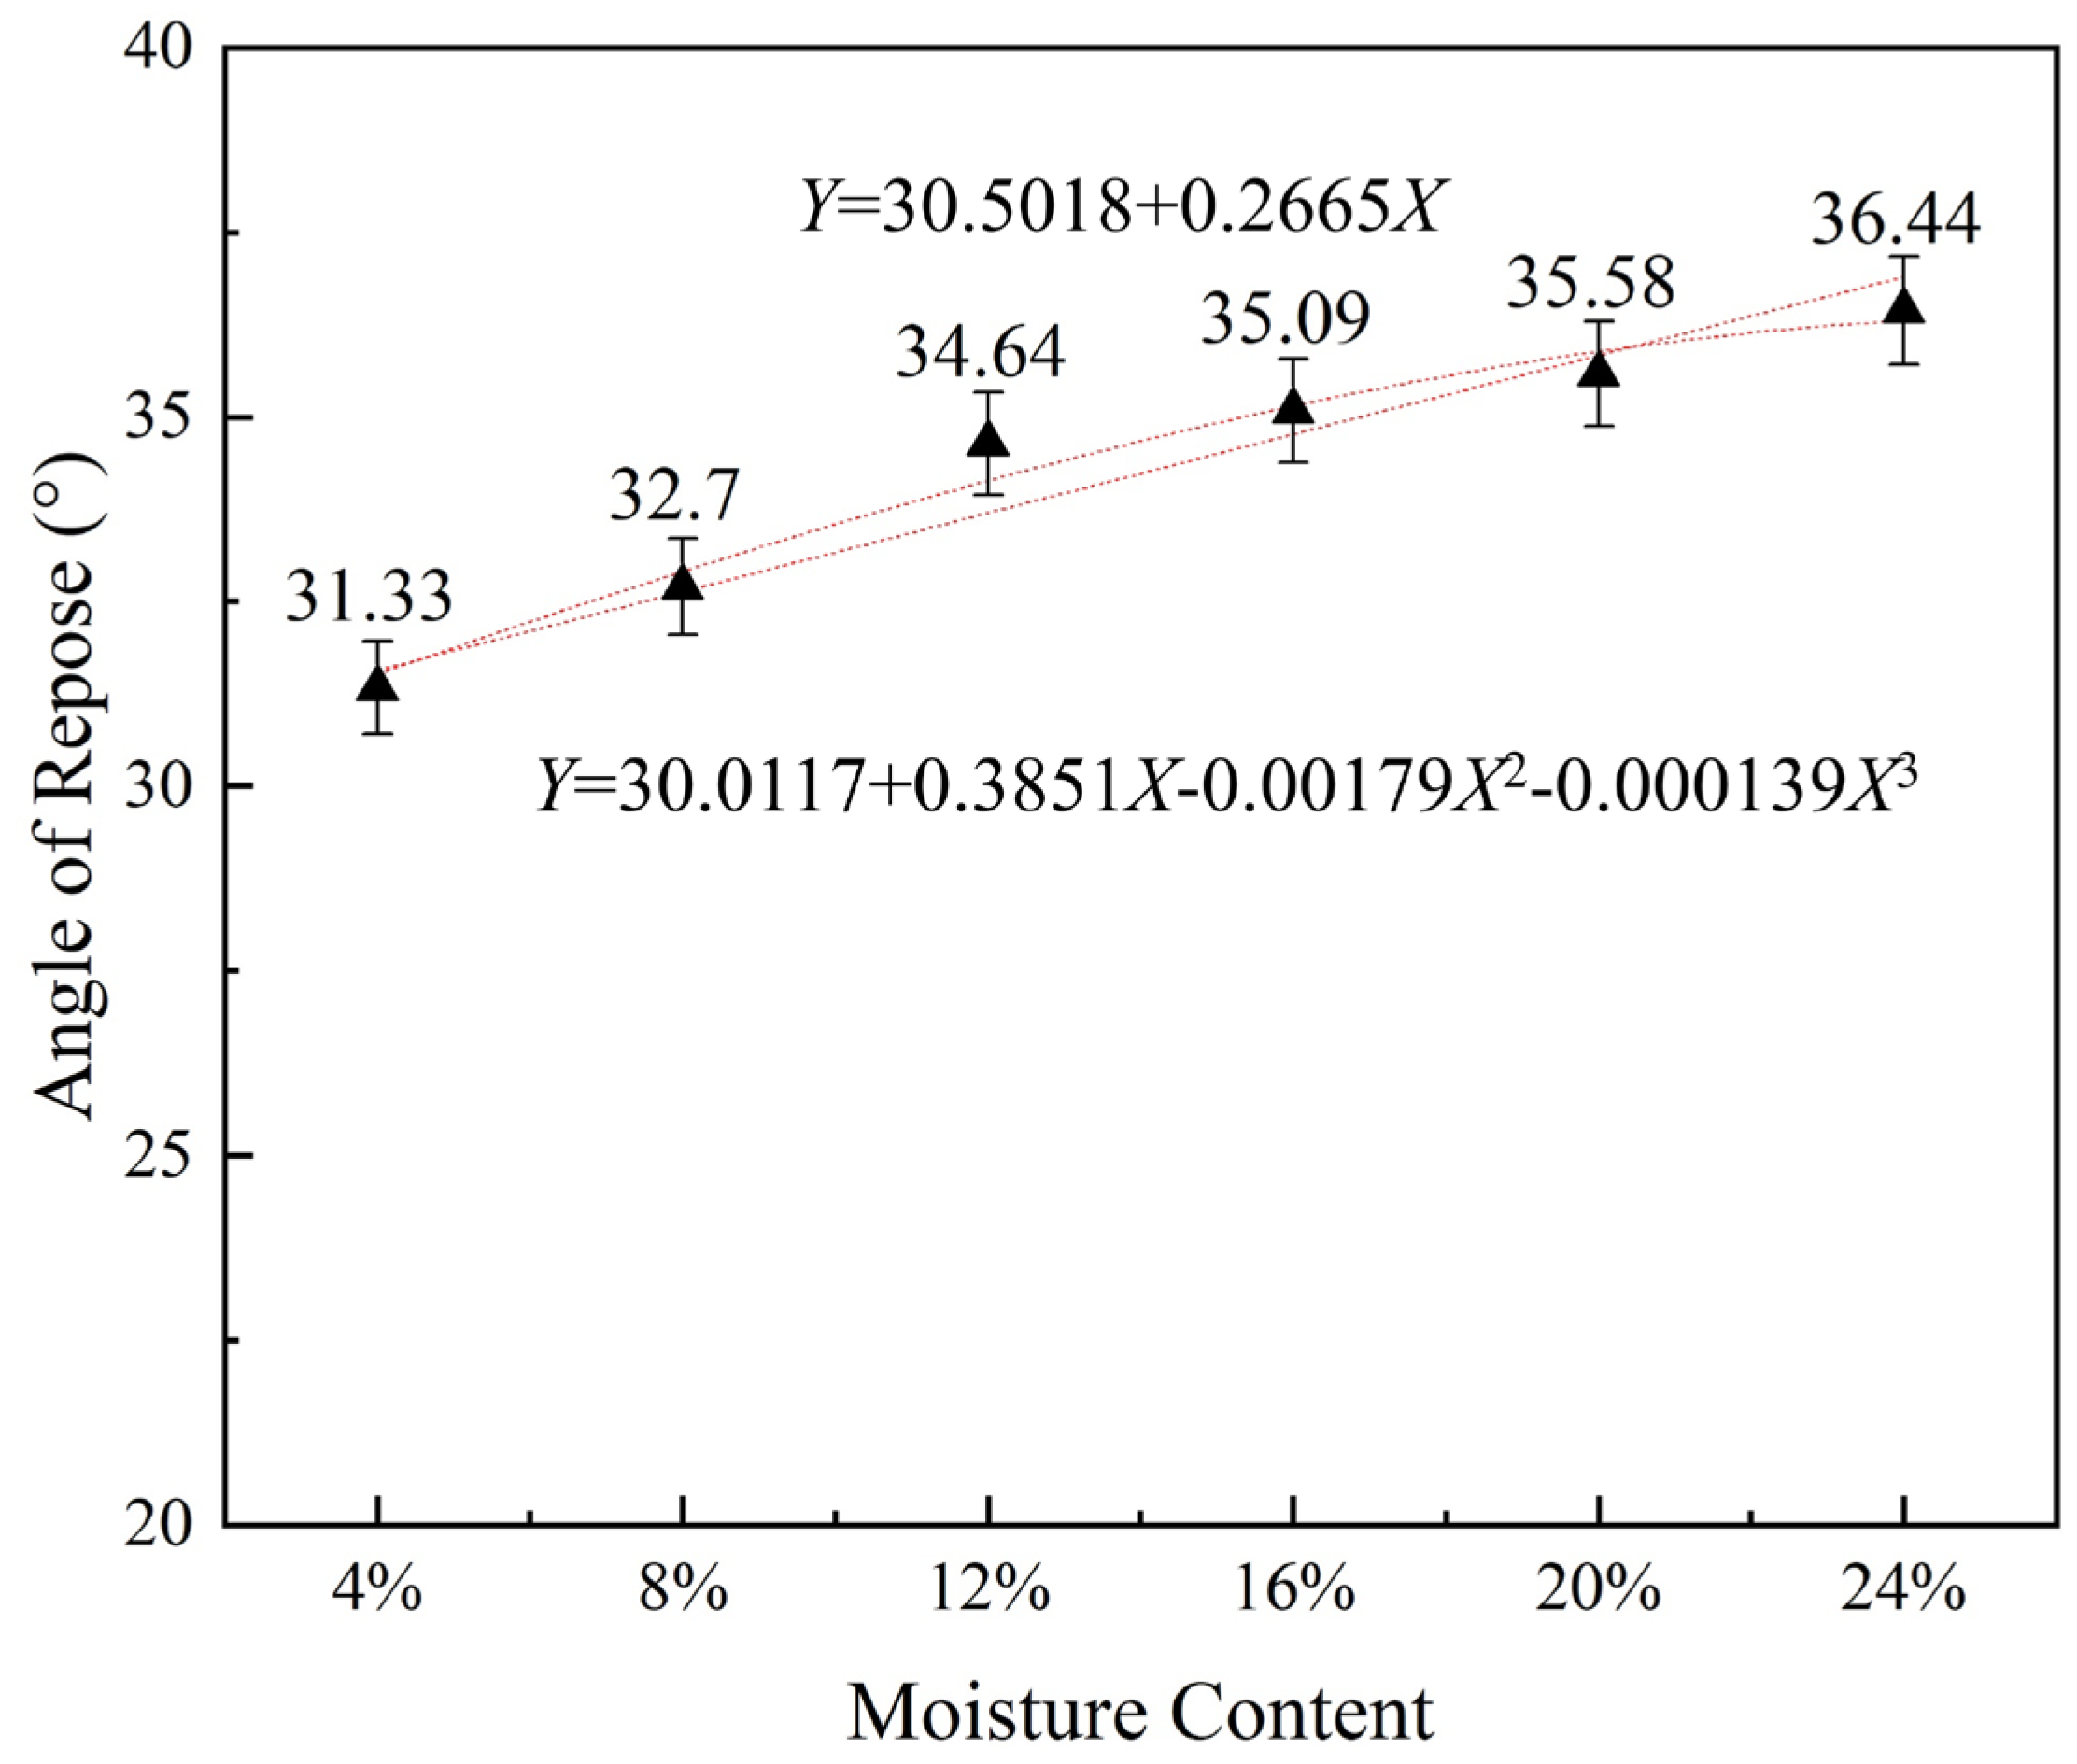
Figure 13.
Soil moisture content and angle of repose relationship curve.
Figure 13.
Soil moisture content and angle of repose relationship curve.
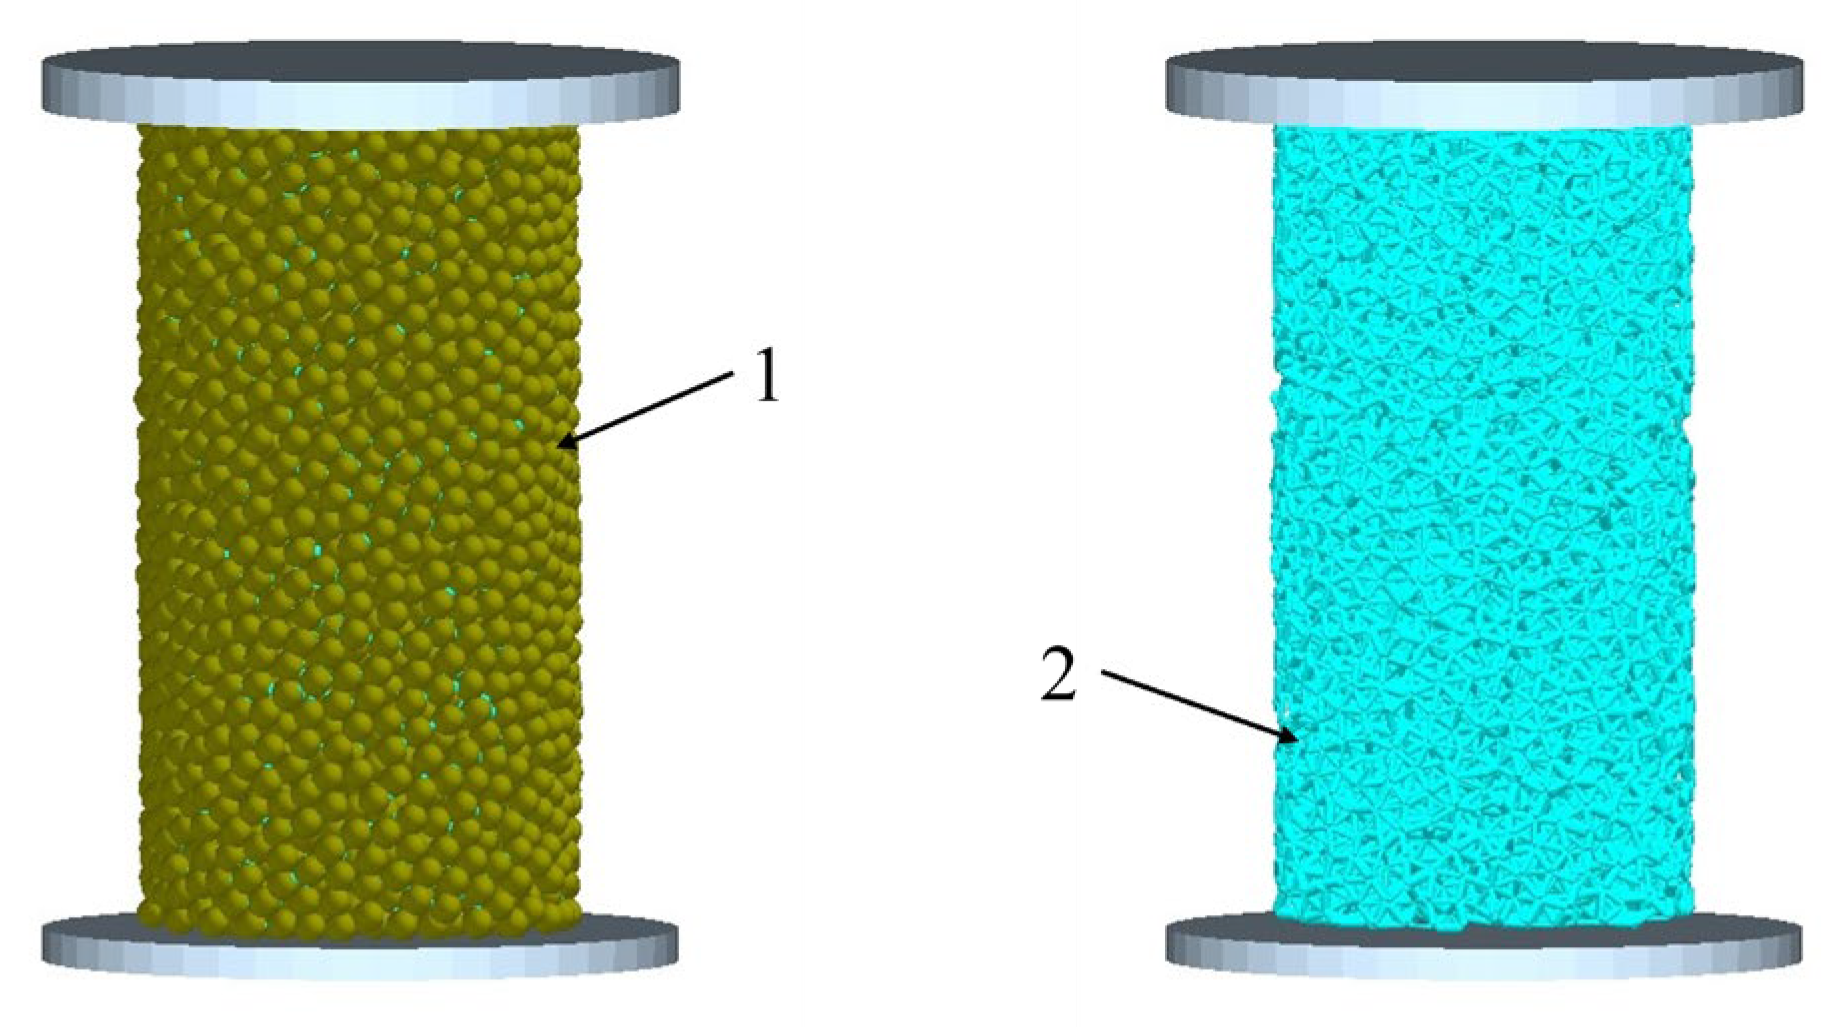
Figure 14.
Uniaxial compression simulation test. 1—Soil block model; 2—interparticle bond.
Figure 14.
Uniaxial compression simulation test. 1—Soil block model; 2—interparticle bond.
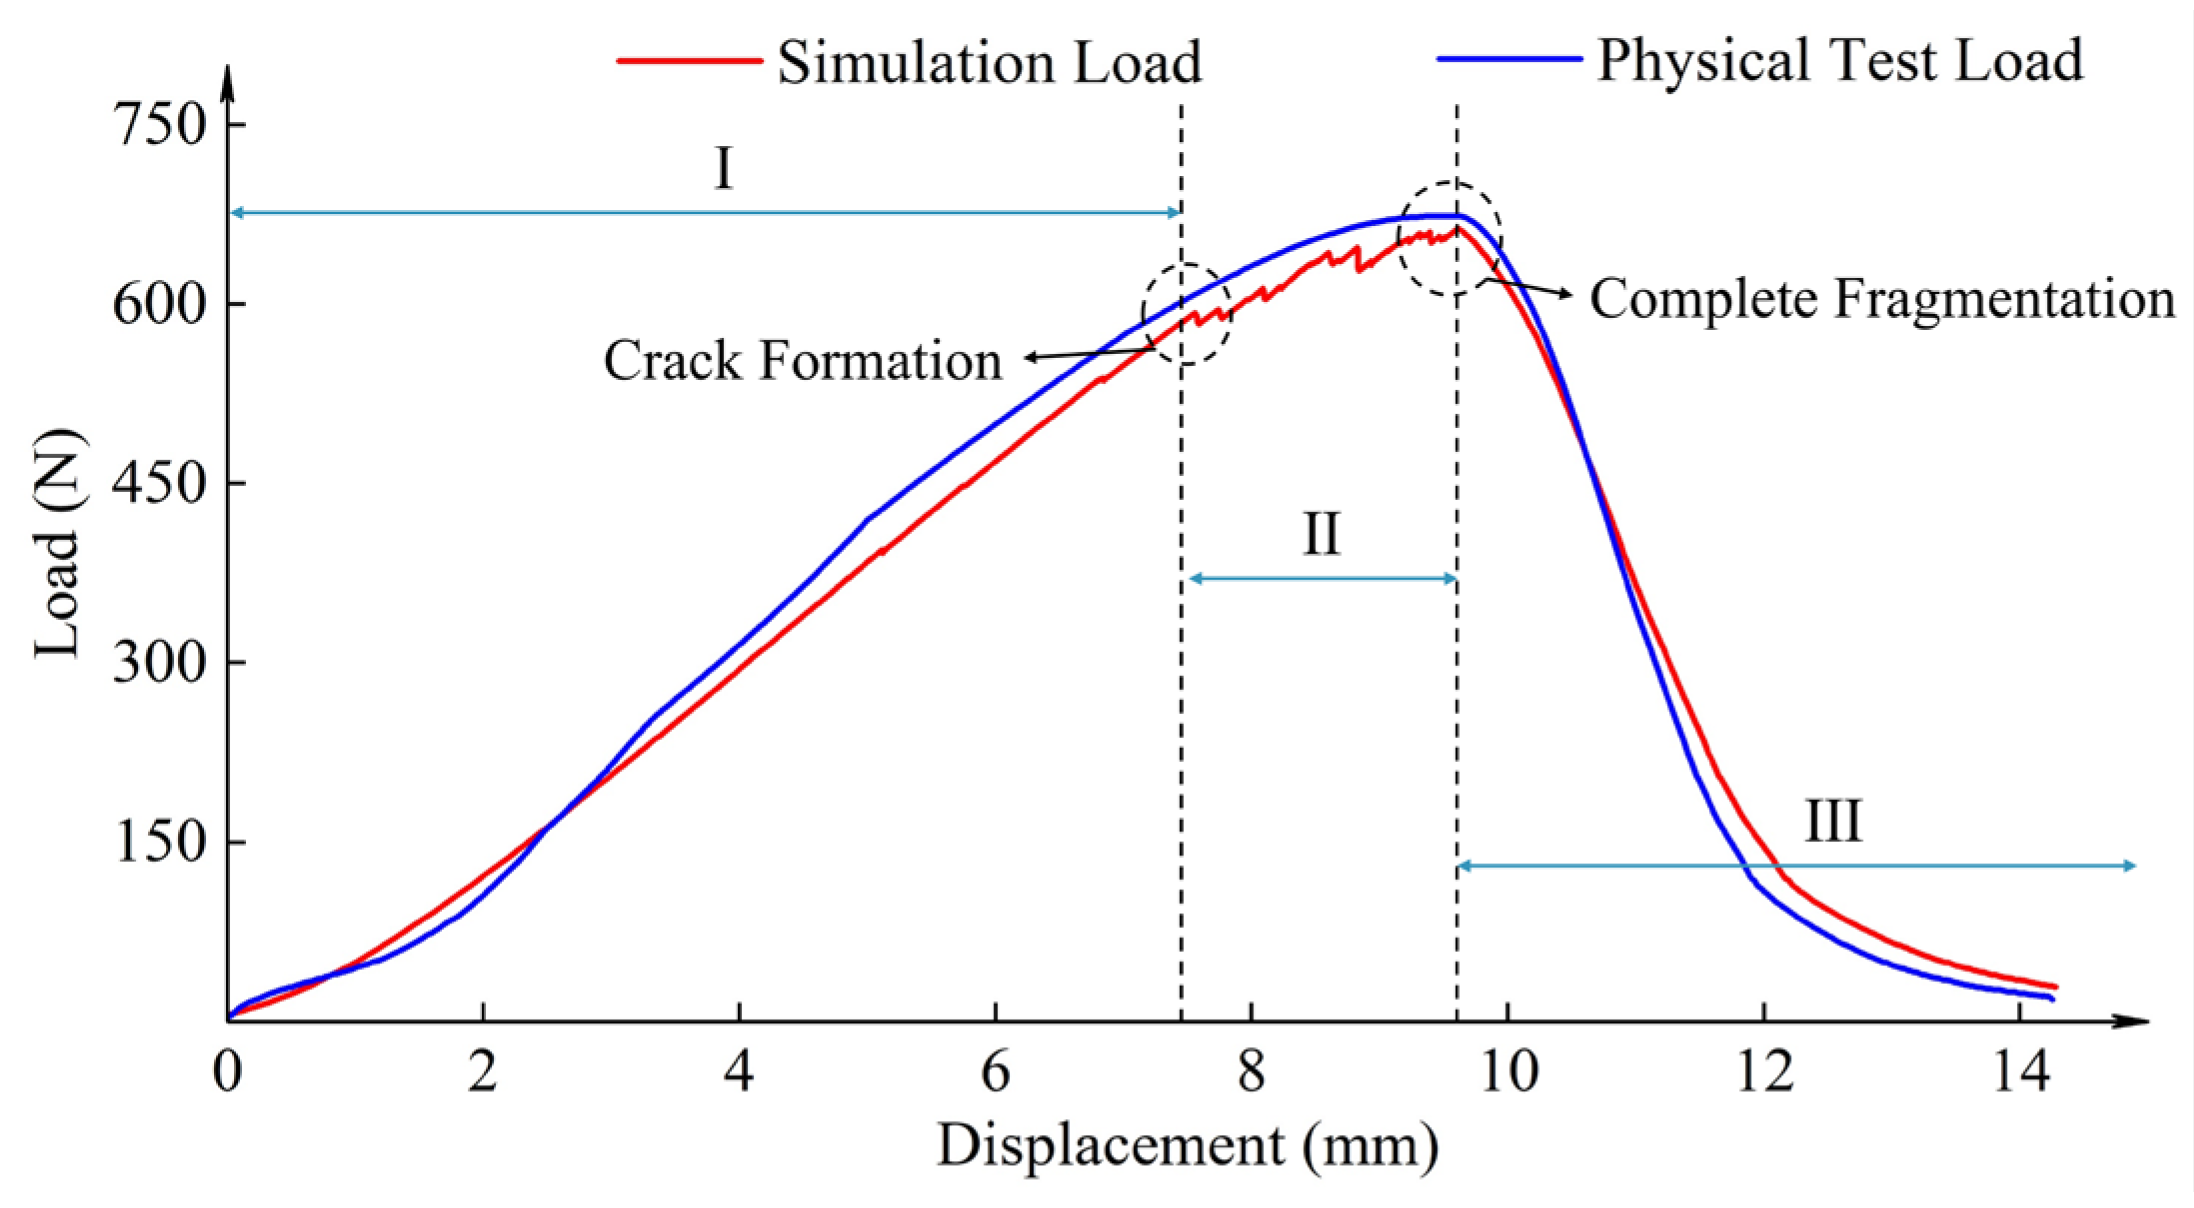
Figure 15.
Comparison of displacement–load variations between uniaxial compression simulation tests and physical experiments.
Figure 15.
Comparison of displacement–load variations between uniaxial compression simulation tests and physical experiments.
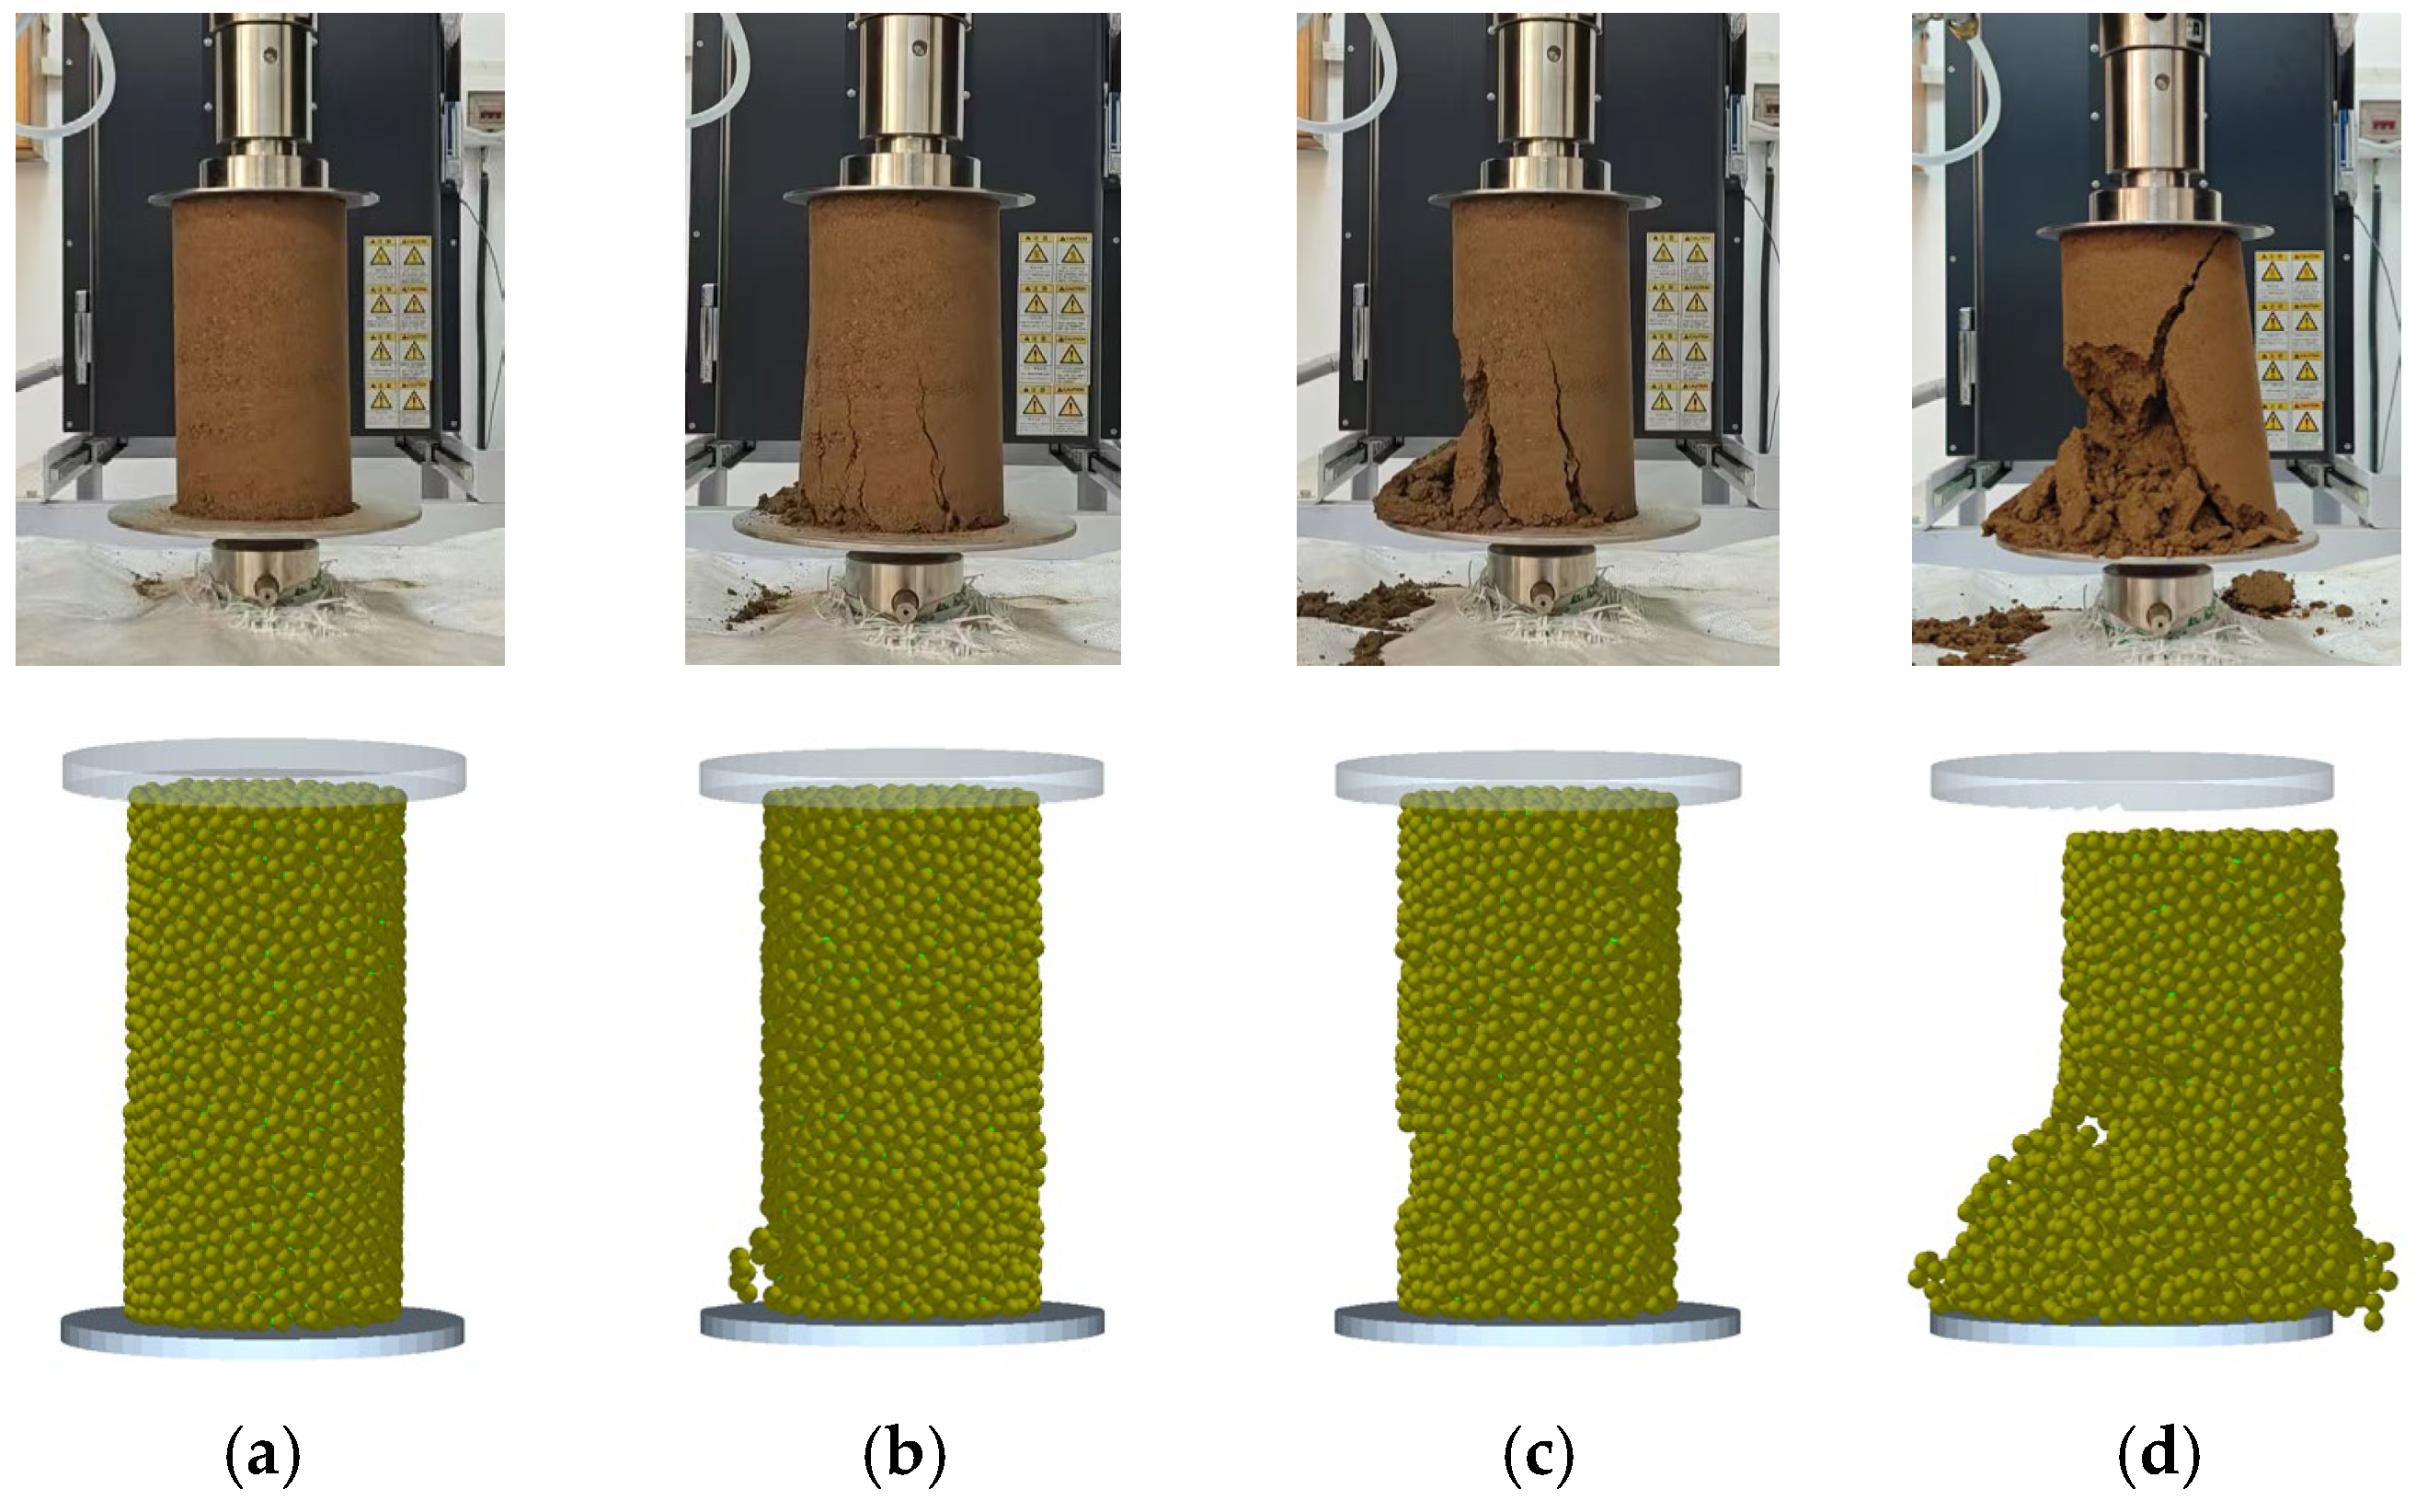
Figure 16.
Compressive deformation comparison. (a) Compression initiation. (b) Crack initiation. (c) Ultimate load. (d) Complete crushing.
Figure 16.
Compressive deformation comparison. (a) Compression initiation. (b) Crack initiation. (c) Ultimate load. (d) Complete crushing.
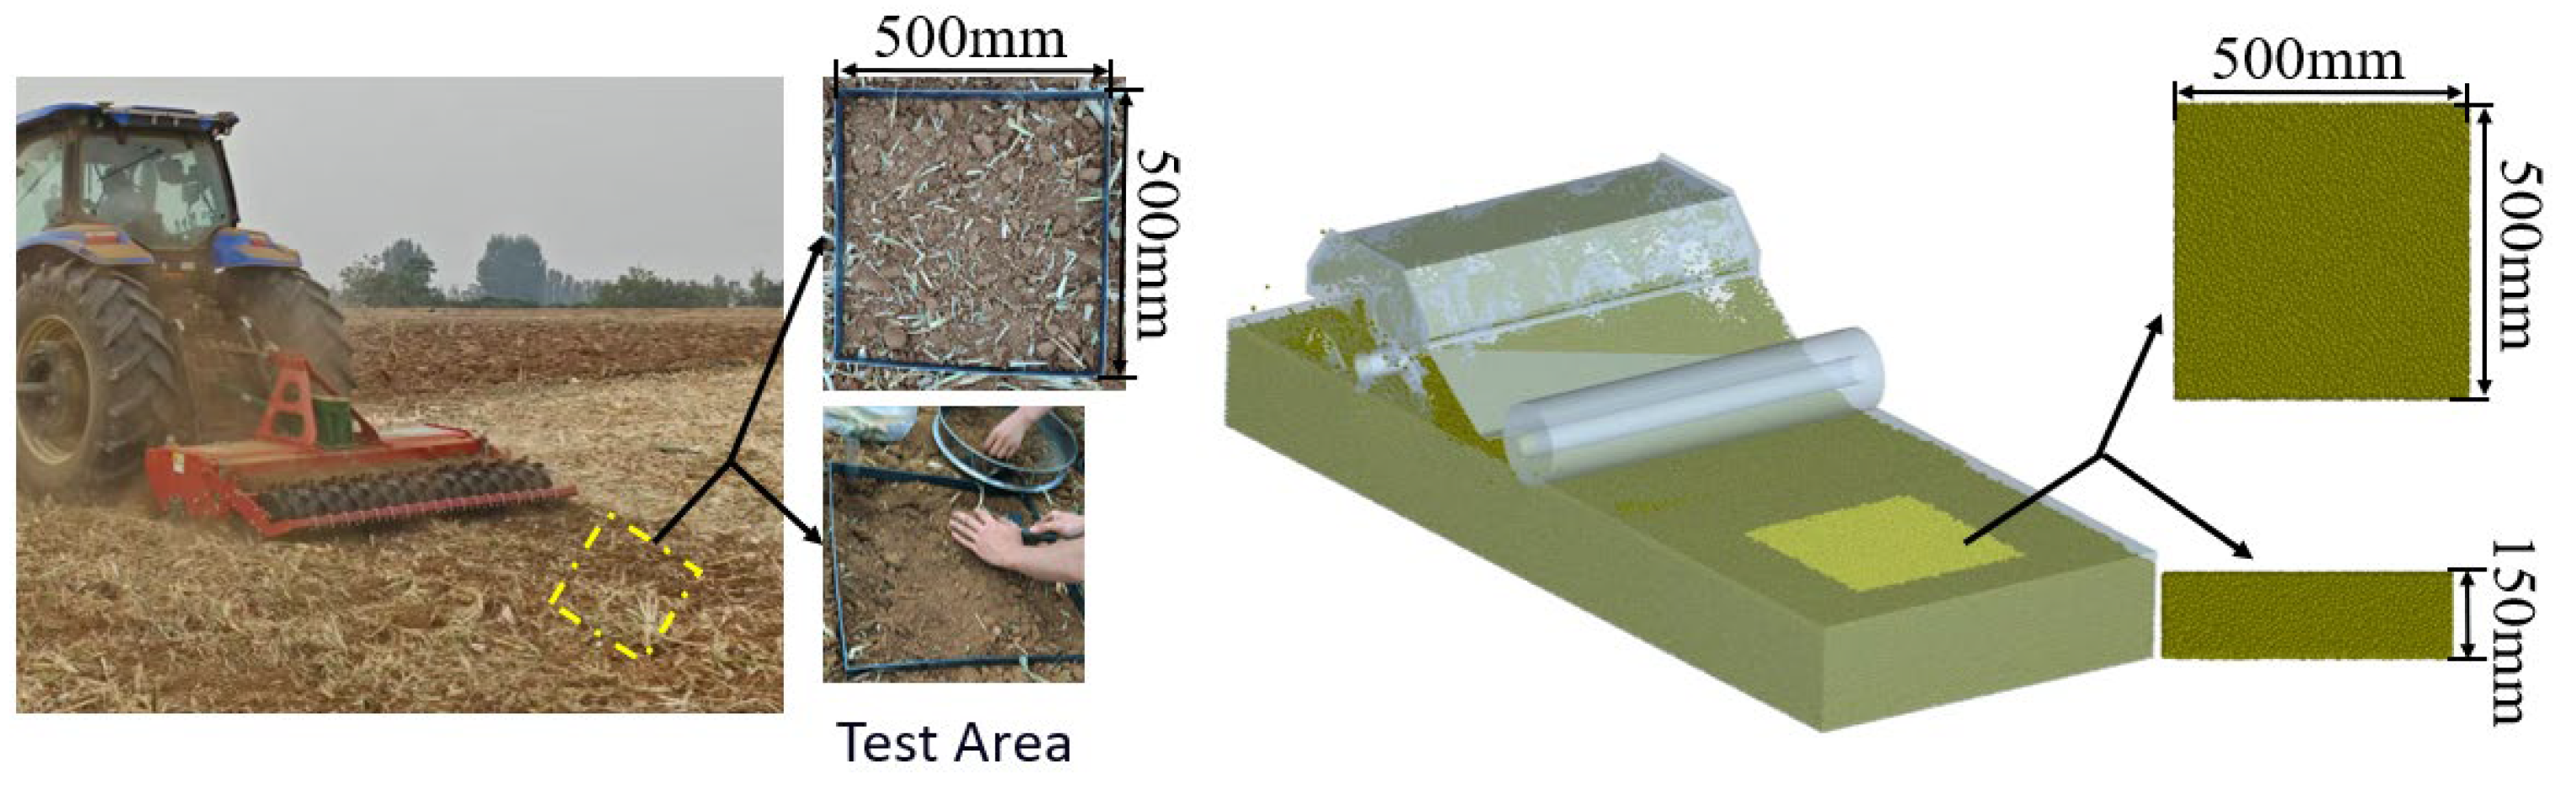
Figure 17.
Comparison chart of rotary tiller field test and simulation experiments.
Figure 17.
Comparison chart of rotary tiller field test and simulation experiments.
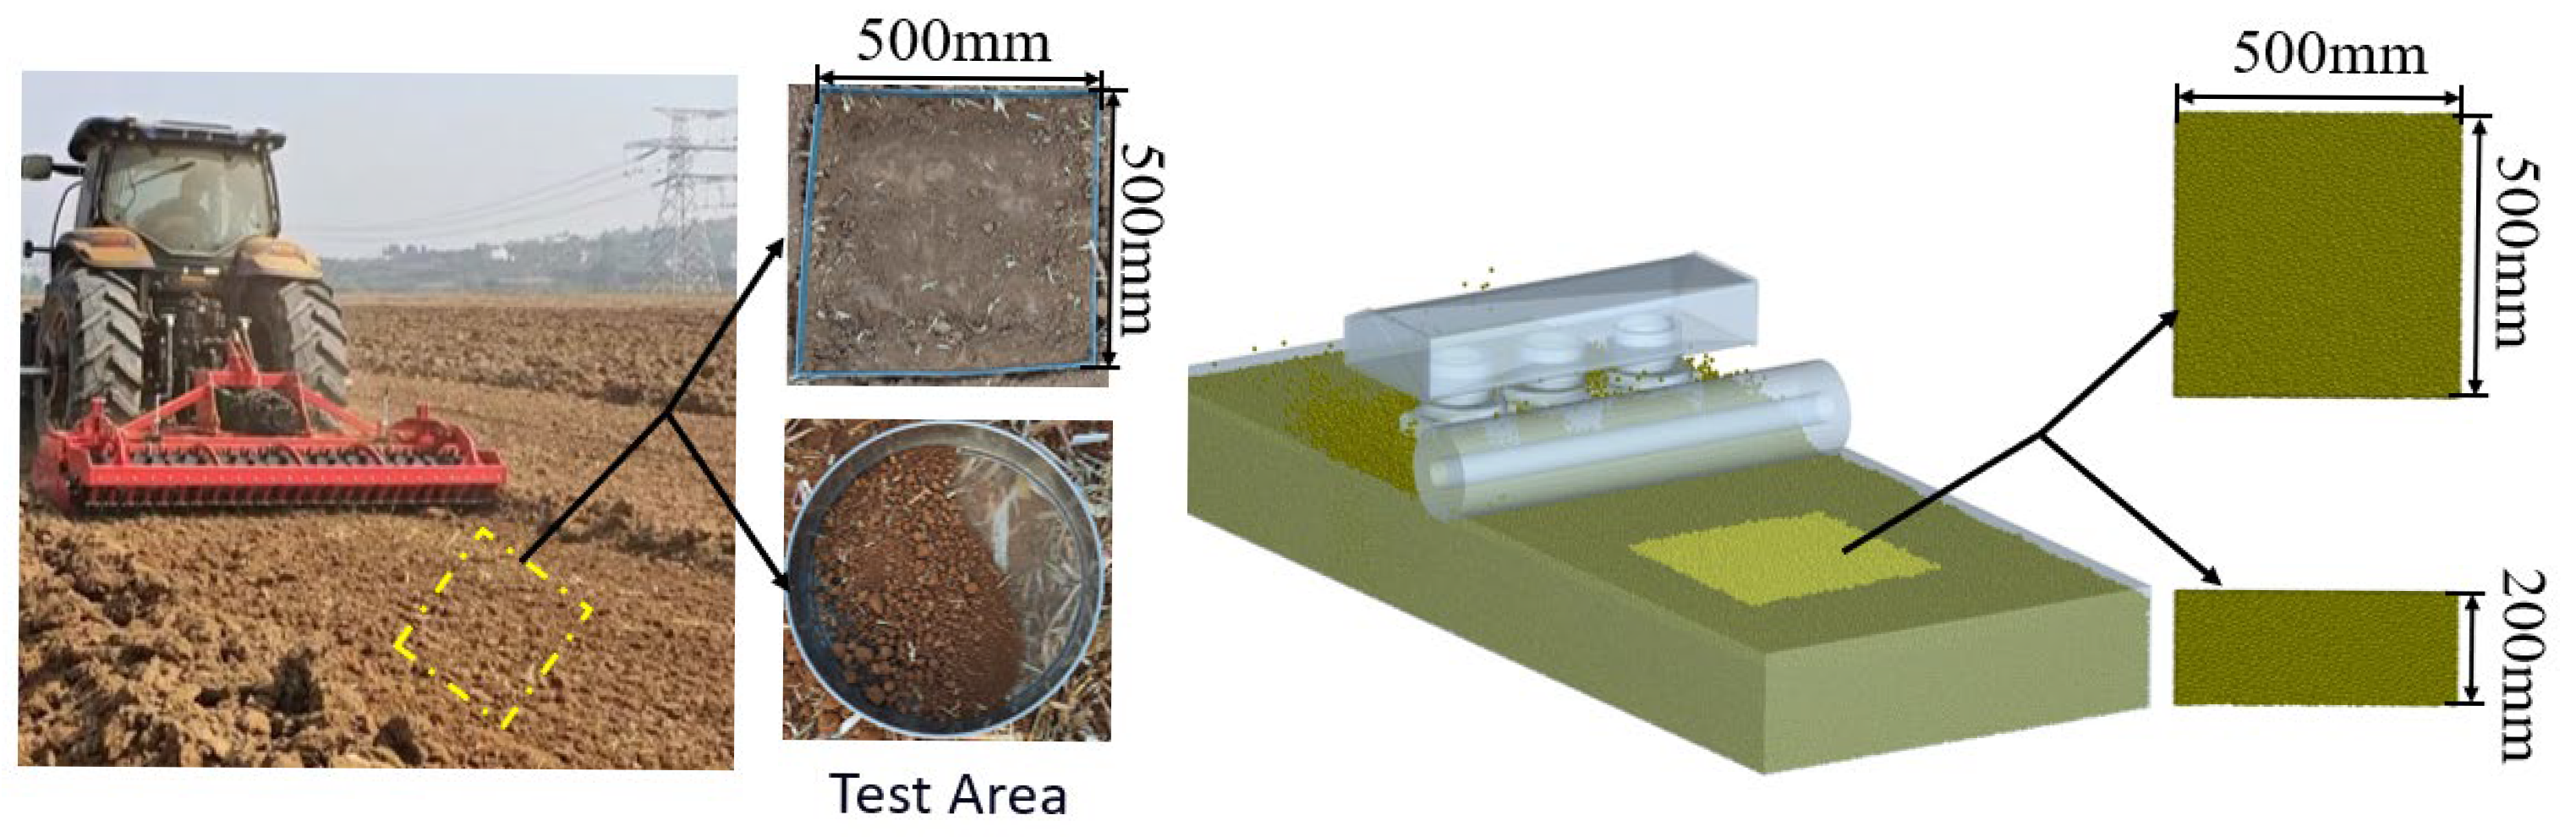
Figure 18.
Comparison chart of power-driven harrow field experiment and simulation experiments.
Figure 18.
Comparison chart of power-driven harrow field experiment and simulation experiments.
Table 1.
Physical angle of repose test results.
Table 1.
Physical angle of repose test results.
| Moisture Content | Angle of Repose (°) |
|---|
| 1 | 2 | 3 | 4 | 5 | Average |
|---|
| 0% | 33.3 | 32.9 | 33.8 | 32.7 | 26.6 | 30.12 |
| 4% | 32.5 | 31.1 | 33.3 | 32.8 | 31.5 | 31.33 |
| 8% | 31.5 | 33.2 | 33 | 30.5 | 35.2 | 32.7 |
| 12% | 35.75 | 35.2 | 35.5 | 32.4 | 34.9 | 34.64 |
| 16% | 35.53 | 35.1 | 34.83 | 36.8 | 36.05 | 35.09 |
| 20% | 35.7 | 33.2 | 33.4 | 34.2 | 35.2 | 35.58 |
| 24% | 33.1 | 33.9 | 35 | 34.4 | 36.7 | 36.44 |
Table 2.
Plackett–Burman test parameters.
Table 2.
Plackett–Burman test parameters.
|
Symbol
|
Parameter
|
Unit
|
Factor Level
|
|---|
|
Level −1
|
Level +1
|
|---|
| A | Coefficient of restitution between soil particles | / | 0.1 | 0.6 |
| B | Coefficient of the static friction between soil particles | / | 0.3 | 0.7 |
| C | Coefficient of rolling friction between soil particles | / | 0.1 | 0.4 |
| D | Coefficient of restitution between soil particles and 65Mn | / | 0.16 | 0.6 |
| E | Coefficient of static friction between soil particles and 65Mn | / | 0.3 | 0.7 |
| F | Coefficient of rolling friction between soil particles and 65Mn | / | 0.01 | 0.4 |
| G | Soil particle Poisson’s ratio | / | 0.25 | 0.4 |
| H | Soil particle shear modulus | MPa | 1 | 2.99 |
| I | Soil particle density | kg·m−3 | 1200 | 2680 |
Table 3.
Plackett–Burman experimental protocol and results.
Table 3.
Plackett–Burman experimental protocol and results.
| No. | A | B | C | D | E | F | G | H | I | Angle of Repose (°) |
|---|
| 1 | 1 | 1 | −1 | 1 | 1 | 1 | −1 | −1 | −1 | 29.10 |
| 2 | −1 | 1 | 1 | −1 | 1 | 1 | 1 | −1 | −1 | 30.10 |
| 3 | 1 | −1 | 1 | 1 | −1 | 1 | 1 | 1 | −1 | 25.55 |
| 4 | −1 | 1 | −1 | 1 | 1 | −1 | 1 | 1 | 1 | 27.09 |
| 5 | −1 | −1 | 1 | −1 | 1 | 1 | −1 | 1 | 1 | 24.85 |
| 6 | −1 | −1 | −1 | 1 | −1 | 1 | 1 | −1 | 1 | 20.96 |
| 7 | 1 | −1 | −1 | −1 | 1 | −1 | 1 | 1 | −1 | 25.97 |
| 8 | 1 | 1 | −1 | −1 | −1 | 1 | −1 | 1 | 1 | 25.60 |
| 9 | 1 | 1 | 1 | −1 | −1 | −1 | 1 | −1 | 1 | 26.80 |
| 10 | −1 | 1 | 1 | 1 | −1 | −1 | −1 | 1 | −1 | 26.85 |
| 11 | 1 | −1 | 1 | 1 | 1 | −1 | −1 | −1 | 1 | 23.80 |
| 12 | −1 | −1 | −1 | −1 | −1 | −1 | −1 | −1 | −1 | 19.70 |
Table 4.
Plackett–Burman analysis of test results.
Table 4.
Plackett–Burman analysis of test results.
| Parameter | Mean Sum of Squares | Contribution Rate (%) | p-Value | Priority Ranking |
|---|
| A | 4.40 | 4.50 | 0.0624 * | 5 |
| B | 50.88 | 51.95 | 0.0059 *** | 1 |
| C | 7.57 | 7.73 | 0.0378 ** | 3 |
| D | 0.0091 | 0.009 | 0.8785 | 9 |
| E | 19.89 | 20.31 | 0.0149 ** | 2 |
| F | 2.95 | 3.01 | 0.0892 * | 7 |
| G | 3.60 | 3.67 | 0.0749 * | 6 |
| H | 2.48 | 2.53 | 0.1037 | 8 |
| I | 5.56 | 5.68 | 0.0504 * | 4 |
Table 5.
Design and results of steepest ascent experiment.
Table 5.
Design and results of steepest ascent experiment.
| No. | Coefficient of Static Friction between Soil Particles (B) | Coefficient of Static Friction Between Soil Particles and 65Mn (E) | Coefficient of Rolling Friction Between Soil Particles (C) | Angle of Repose (°) |
|---|
| 1 | 0.3 | 0.3 | 0.1 | 21.80 |
| 2 | 0.4 | 0.4 | 0.175 | 26.08 |
| 3 | 0.5 | 0.5 | 0.25 | 32.03 |
| 4 | 0.6 | 0.6 | 0.325 | 34.60 |
| 5 | 0.7 | 0.7 | 0.4 | 35.90 |
Table 6.
Box–Behnken experimental factors and levels.
Table 6.
Box–Behnken experimental factors and levels.
| Coding | Parameters |
|---|
| B | E | C |
|---|
| +1 | 0.5 | 0.5 | 0.25 |
| 0 | 0.6 | 0.6 | 0.325 |
| −1 | 0.7 | 0.7 | 0.4 |
Table 7.
Box–Behnken experimental design plan and results.
Table 7.
Box–Behnken experimental design plan and results.
| No. | Factor Levels | Angle of Repose (°) |
|---|
| B | E | C |
|---|
| 1 | 0.5 | 0.6 | 0.25 | 28.1 |
| 2 | 0.7 | 0.6 | 0.25 | 33.15 |
| 3 | 0.5 | 0.6 | 0.4 | 30.9 |
| 4 | 0.7 | 0.6 | 0.4 | 34.3 |
| 5 | 0.5 | 0.5 | 0.325 | 29.3 |
| 6 | 0.7 | 0.5 | 0.325 | 32.8 |
| 7 | 0.5 | 0.7 | 0.325 | 31.3 |
| 8 | 0.7 | 0.7 | 0.325 | 35.4 |
| 9 | 0.6 | 0.5 | 0.25 | 29.26 |
| 10 | 0.6 | 0.5 | 0.4 | 31.2 |
| 11 | 0.6 | 0.7 | 0.25 | 30.68 |
| 12 | 0.6 | 0.7 | 0.4 | 34.4 |
| 13 | 0.6 | 0.6 | 0.325 | 34.42 |
| 14 | 0.6 | 0.6 | 0.325 | 33.62 |
| 15 | 0.6 | 0.6 | 0.325 | 33.8 |
| 16 | 0.6 | 0.6 | 0.325 | 33.5 |
Table 8.
Pile angle regression model analysis of variance.
Table 8.
Pile angle regression model analysis of variance.
| Source of Variance | Sum of Squares | Degree of Freedom | Mean Square | F-Value | p-Value | |
|---|
| Model | 67.11 | 9 | 7.46 | 44.89 | <0.0001 *** | significant |
| B | 30.62 | 1 | 30.62 | 184.31 | <0.0001 *** | |
| C | 9.83 | 1 | 9.83 | 59.21 | 0.0003 *** | |
| E | 10.76 | 1 | 10.76 | 64.81 | 0.0002 *** | |
| BE | 0.3906 | 1 | 0.3906 | 2.35 | 0.1760 | |
| BC | 0.1600 | 1 | 0.1600 | 0.9633 | 0.3643 | |
| EC | 1.12 | 1 | 1.12 | 6.76 | 0.0406 * | |
| B2 | 2.08 | 1 | 2.08 | 12.53 | 0.0122 ** | |
| E2 | 8.42 | 1 | 8.42 | 50.72 | 0.0004 *** | |
| C2 | 3.72 | 1 | 3.72 | 22.37 | 0.0032 *** | |
| Residual | 0.9966 | 6 | 0.1661 | | | |
| Lack of fit | 0.4947 | 3 | 0.1649 | 0.9857 | 0.5046 | not significant |
| Pure error | 0.5019 | 3 | 0.1673 | | | |
| Sum | 68.11 | 15 | | | | |
Table 9.
Simulation experiment and physical experiment error analysis results.
Table 9.
Simulation experiment and physical experiment error analysis results.
Moisture
Content | B | E | C | Simulated Angle of Repose (°) | Physical Angle of Repose (°) | Relative
Error |
|---|
| 4% | 0.502 | 0.602 | 0.338 | 31.01 | 31.33 | 1.02% |
| 8% | 0.638 | 0.587 | 0.267 | 32.10 | 32.7 | 1.83% |
| 12% | 0.673 | 0.626 | 0.3 | 33.42 | 34.64 | 3.52% |
| 16% | 0.636 | 0.683 | 0.359 | 34.06 | 35.09 | 2.94% |
| 20% | 0.688 | 0.683 | 0.337 | 34.40 | 35.58 | 3.32% |
| 24% | 0.7 | 0.688 | 0.349 | 35.30 | 36.44 | 3.13% |
Table 10.
Optimal parameters for soil simulation with the actual moisture content.
Table 10.
Optimal parameters for soil simulation with the actual moisture content.
| Moisture Content (%) | Parameters | Simulated Angle of Repose (°) |
|---|
| B | E | C |
|---|
| 17.3 | 0.6 | 0.69 | 0.358 | 34.84 |
Table 11.
Calibration range of bonding parameters for soil blocks.
Table 11.
Calibration range of bonding parameters for soil blocks.
| Level | Normal Stiffness per Unit Area A (×107 N·m−3) | Shear Stiffness per Unit Area B (×107 N·m−3) | Critical Normal Stress C (×104 Pa) | Critical Shear Stress D (×104 Pa) | Bonded Disk Radius E (mm) |
|---|
| 1 | 7 | 7 | 5 | 2.7 | 4.8 |
| 2 | 8 | 7.5 | 6 | 3.4 | 5 |
| 3 | 9 | 8 | 7 | 4.1 | 5.2 |
| 4 | 10 | 8.5 | 8 | 4.8 | 5.4 |
Table 12.
Calibration test scheme and results for soil blocks.
Table 12.
Calibration test scheme and results for soil blocks.
| No. | A | B | C | D | E | Load (N) | Displacement (mm) |
|---|
| 1 | 7 | 7 | 5 | 2.7 | 4.8 | 182.81 | 9.08 |
| 2 | 7 | 7.5 | 6 | 3.4 | 5 | 578.38 | 9.57 |
| 3 | 7 | 8 | 7 | 4.1 | 5.2 | 858.20 | 12.32 |
| 4 | 7 | 8.5 | 8 | 4.8 | 5.4 | 234.59 | 5.94 |
| 5 | 8 | 7 | 6 | 4.1 | 5.4 | 965.89 | 11.07 |
| 6 | 8 | 7.5 | 5 | 4.8 | 5.2 | 1269.13 | 14.29 |
| 7 | 8 | 8 | 8 | 2.7 | 5 | 152.93 | 6.71 |
| 8 | 8 | 8.5 | 7 | 3.4 | 4.8 | 1127.95 | 12.48 |
| 9 | 9 | 7 | 7 | 4.8 | 5 | 1279.15 | 14.48 |
| 10 | 9 | 7.5 | 8 | 4.1 | 4.8 | 947.00 | 11.66 |
| 11 | 9 | 8 | 5 | 3.4 | 5.4 | 564.71 | 8.48 |
| 12 | 9 | 8.5 | 6 | 2.7 | 5.2 | 152.19 | 5.04 |
| 13 | 10 | 7 | 8 | 3.4 | 5.2 | 845.83 | 10.26 |
| 14 | 10 | 7.5 | 7 | 2.7 | 5.4 | 454.01 | 5.98 |
| 15 | 10 | 8 | 6 | 4.8 | 4.8 | 1110.93 | 12.71 |
| 16 | 10 | 8.5 | 5 | 4.1 | 5 | 809.05 | 9.52 |
Table 13.
Variance analysis of the soil block calibration test results.
Table 13.
Variance analysis of the soil block calibration test results.
| Source | Source of Variation | Degree of Freedom | Sum of Squares | Mean Square | F-Value | p-Value |
|---|
| Displacement | Regression | 5 | 95.0073 | 19.002 | 5.01 | 0.015 ** |
| Error | 10 | 37.9436 | 3.794 | | |
| Total | 15 | 132.9508 | | | |
| Load | Regression | 5 | 1,522,849.65 | 304,569.9 | 3.59 | 0.041 ** |
| Error | 10 | 848,541.87 | 84,854.19 | | |
| Total | 15 | 2,371,391.52 | | | |
Table 14.
Critical bonding parameters of the soil.
Table 14.
Critical bonding parameters of the soil.
| Model | Bonding Parameter | Data |
|---|
| Hertz–Mindlin with bonding | Normal stiffness per unit area/×107 N·m−3 | 8.8 |
| Tangential stiffness per unit area/×107 N·m−3 | 6.85 |
| Critical normal stress/×104 Pa | 6 |
| Critical shear stress/×104 Pa | 3.15 |
| Bond radius/mm | 5.2 |
Table 15.
Critical contact parameters of the soil.
Table 15.
Critical contact parameters of the soil.
| Parameter | Data |
|---|
| The coefficient of restitution between soil particles | 0.35 |
| Coefficient of the static friction between soil particles | 0.6 |
| Coefficient of rolling friction between soil particles | 0.358 |
| Coefficient of restitution between soil particles and 65Mn | 0.38 |
| Coefficient of static friction between soil particles and 65Mn | 0.69 |
| Coefficient of rolling friction between soil particles and 65Mn | 0.205 |
| Soil particle Poisson’s ratio | 0.325 |
| Soil particle shear modulus | 1.995 |
| Soil particle density | 1940 |


