1. Introduction
The waterfowl farming industry in China rapidly advanced towards large-scale, standardized, and intelligent production. The research and application of intelligent farming equipment and information technology were crucial for promoting the healthy and sustainable development of waterfowl farming, improving production efficiency, reducing dependence on manual labor, and meeting the demands of modern agricultural practices [
1,
2]. The Lion-Head Goose is one of the largest goose species in the world, providing an ideal source of animal protein through egg and meat products, which are widely appreciated by consumers over extended periods [
3,
4]. The low reproductive efficiency of the lion’s head goose has also made it a rare goose [
5]. Research suggests that geese raised in non-cage systems exhibited higher egg production rates and better egg quality compared to those in cage systems [
6,
7]. Additionally, as aquatic poultry species, the biological habits of geese dictate that their breeding and selection practices primarily adopt free-range or flat rearing systems, which pose challenges to the accurate collection of egg production data from female geese [
8]. At the time, the pedigree selection method was the only viable option for Lion-Head breeding geese in flat rearing systems, as individual selection was impractical under these conditions due to the difficulty in accurately matching individual Lion-Head Geese with the eggs they produced [
9,
10]. The main drawbacks of the pedigree selection method were its complexity, high labor intensity, and low accuracy, which severely affected the precision and efficiency of breeding [
11,
12]. In contrast, individual selection methods offered several advantages, including the ability to fully leverage the biological characteristics and instincts of the animals, as well as the use of egg production as a key heritable trait. This approach shortened the generation interval, providing a clear advantage over pedigree selection [
13]. The key to achieving efficient breeding of Lion-Head Geese is, therefore, to develop an accurate method for identifying individual Lion-Head breeders and matching them to their respective breeding eggs based on individual selection methods in a flat rearing environment.
At present, there are not many studies related to Lion-Head Geese, so this article can only choose some common geese and other poultry research as a reference. Non-contact monitoring utilized sensors, cameras, and other technologies to observe and monitor poultry from a distance [
14]. Sun et al. [
15] recorded the egg-laying activities of individual geese through video. This method provided a visual link between the goose and its eggs, offering a manual approach to review previous video recordings. However, it did not achieve the ideal precision required for accurate brooding monitoring. Chien and Chen [
16] designed an Internet of Things (IoT) platform based on Radio Frequency Identification (RFID), deploying RFID-based sensors and egg detection sensors. Their study demonstrated the effectiveness of RFID-based smart nest boxes in monitoring the egg-laying frequency and behavior of individual hens. Zhang et al. [
17] proposed an IoT-based breeding egg identification and coding system, utilizing RFID to identify the geese’s individual identities but without determining their brooding status. Xu et al. [
5] introduced an egg-laying monitoring and positioning method for breeding geese based on photoelectric sensing technology, which combined RFID and photoelectric sensor technology for detecting and locating geese. However, when excessive movement of the geese obstructed the sensors, accurate monitoring could not be achieved. Additionally, most methods used multiple sensors in fixed nesting areas for individual goose identification, which restricted the movement space of the geese and compromised their welfare needs.
Computer vision technology had been widely applied in livestock and poultry object detection as well as egg detection, yielding significant results. With ongoing technological advancements, distinct features and advantages emerged. Sunardi et al. [
18] applied smartphones, thermal imaging, and MATLAB for poultry egg identification, achieving 100% accuracy. Ying et al. [
19] proposed a method combining robotics for statistical counting and egg collection in free-range poultry farms, achieving a positioning error within 2 cm. Ab Nasir et al. [
20] designed an automated egg grading system with a positioning and identification accuracy of over 95%. Wang et al. [
21] used deep learning with YOLOv3 to classify six different behaviors (standing, sitting, sleeping, preening, scratching, and pecking) of laying hens. Li et al. [
22] developed a robot for automatically collecting ground-laying eggs, embedding YOLOv3 in the vision system, and achieved 93% performance in egg detection and positioning. Bist et al. [
23] used YOLOv5 to detect ground-laying eggs with an accuracy of 99.9%. Subedi et al. [
24] proposed YOLOv7-egg, achieving detection accuracy exceeding 85%. Zhang et al. [
25] demonstrated the accurate identification and localization of goose eggs in free-range environments using YOLOv5 object detection combined with segmentation algorithms. Li et al. [
26] employed an improved YOLOv7 network (MobileOne-YOLO) to detect fertilized duck eggs, significantly improving FPS performance by 41.6% while maintaining the same accuracy as YOLOv7. Jie et al. [
27] achieved 98.85% and 96.67% recall in detecting and identifying duck eggs in free-range environments using an improved YOLOv4 model. Jiang et al. [
28] used an improved YOLOv8-PG based on YOLOv8n to recognize pigeon eggs, distinguishing between real and fake eggs, thereby improving the model’s recognition rate and reducing its parameters and computational load. However, most of these studies focused only on detecting and identifying ground-laying eggs in free-range environments without identifying the egg-laying poultry or matching individuals with their eggs. For the rare Lion-Headed Goose breed, each egg carries significant genetic value due to its low fecundity. Thus, implementing non-contact real-time parentage matching in flat rearing systems using computer vision algorithms, without relying on invasive markers or constrained nesting structures, becomes critical.
This study specifically targets the Lion-Headed Goose to fill this void by designing breed-specific visual identifiers (geometric neck rings) and developing the lightweight computer vision framework YOLO-Goose, which is used to identify individual Lion-Headed Geese and match them with their eggs. By uploading detection data to a cloud database, this algorithm enabled managers to filter and process the data. The method emphasized real-time monitoring and recording of nesting behaviors and egg-laying data of Lion-Head Geese, thereby accurately matching eggs with their respective mothers. In doing so, it not only overcame the limitations of existing technologies in directly identifying and matching individuals with their products but also provided a more efficient and cost-effective solution.
The main contributions of this paper are summarized as follows:
We introduced the YOLO-Goose object detection method, which improves model performance in complex environments by incorporating a lightweight backbone network and using the GIoU loss function. The model achieved an F1 Score of 93.8% and a mAP50 of 96.4%.
We developed a matching algorithm based on Euclidean distance and time series analysis, which accurately matched individual Lion-Head Geese with the eggs they laid, and uploaded the relevant data to a cloud database. The MR reached 95%, the MAR reached 94.7%, and the MMR was 5.3%.
We optimized the deployment of the model on a local computer using TensorRT, significantly enhancing detection speed to meet practical application requirements. The detection speed increased by approximately 1.4×.
2. Materials and Methods
2.1. Ethical Statement
The experiment was performed in accordance with the guidelines approved by the Experimental Animal Administration and Ethics Committee of South China Agricultural University (SYXK-2019-0136).
2.2. Implementation of Individual Selection Method
2.2.1. Differences Between Individual Selection Method and Pedigree Selection Method
The current selection and breeding of geese is mainly based on the flat rearing mode [
17]. As shown in
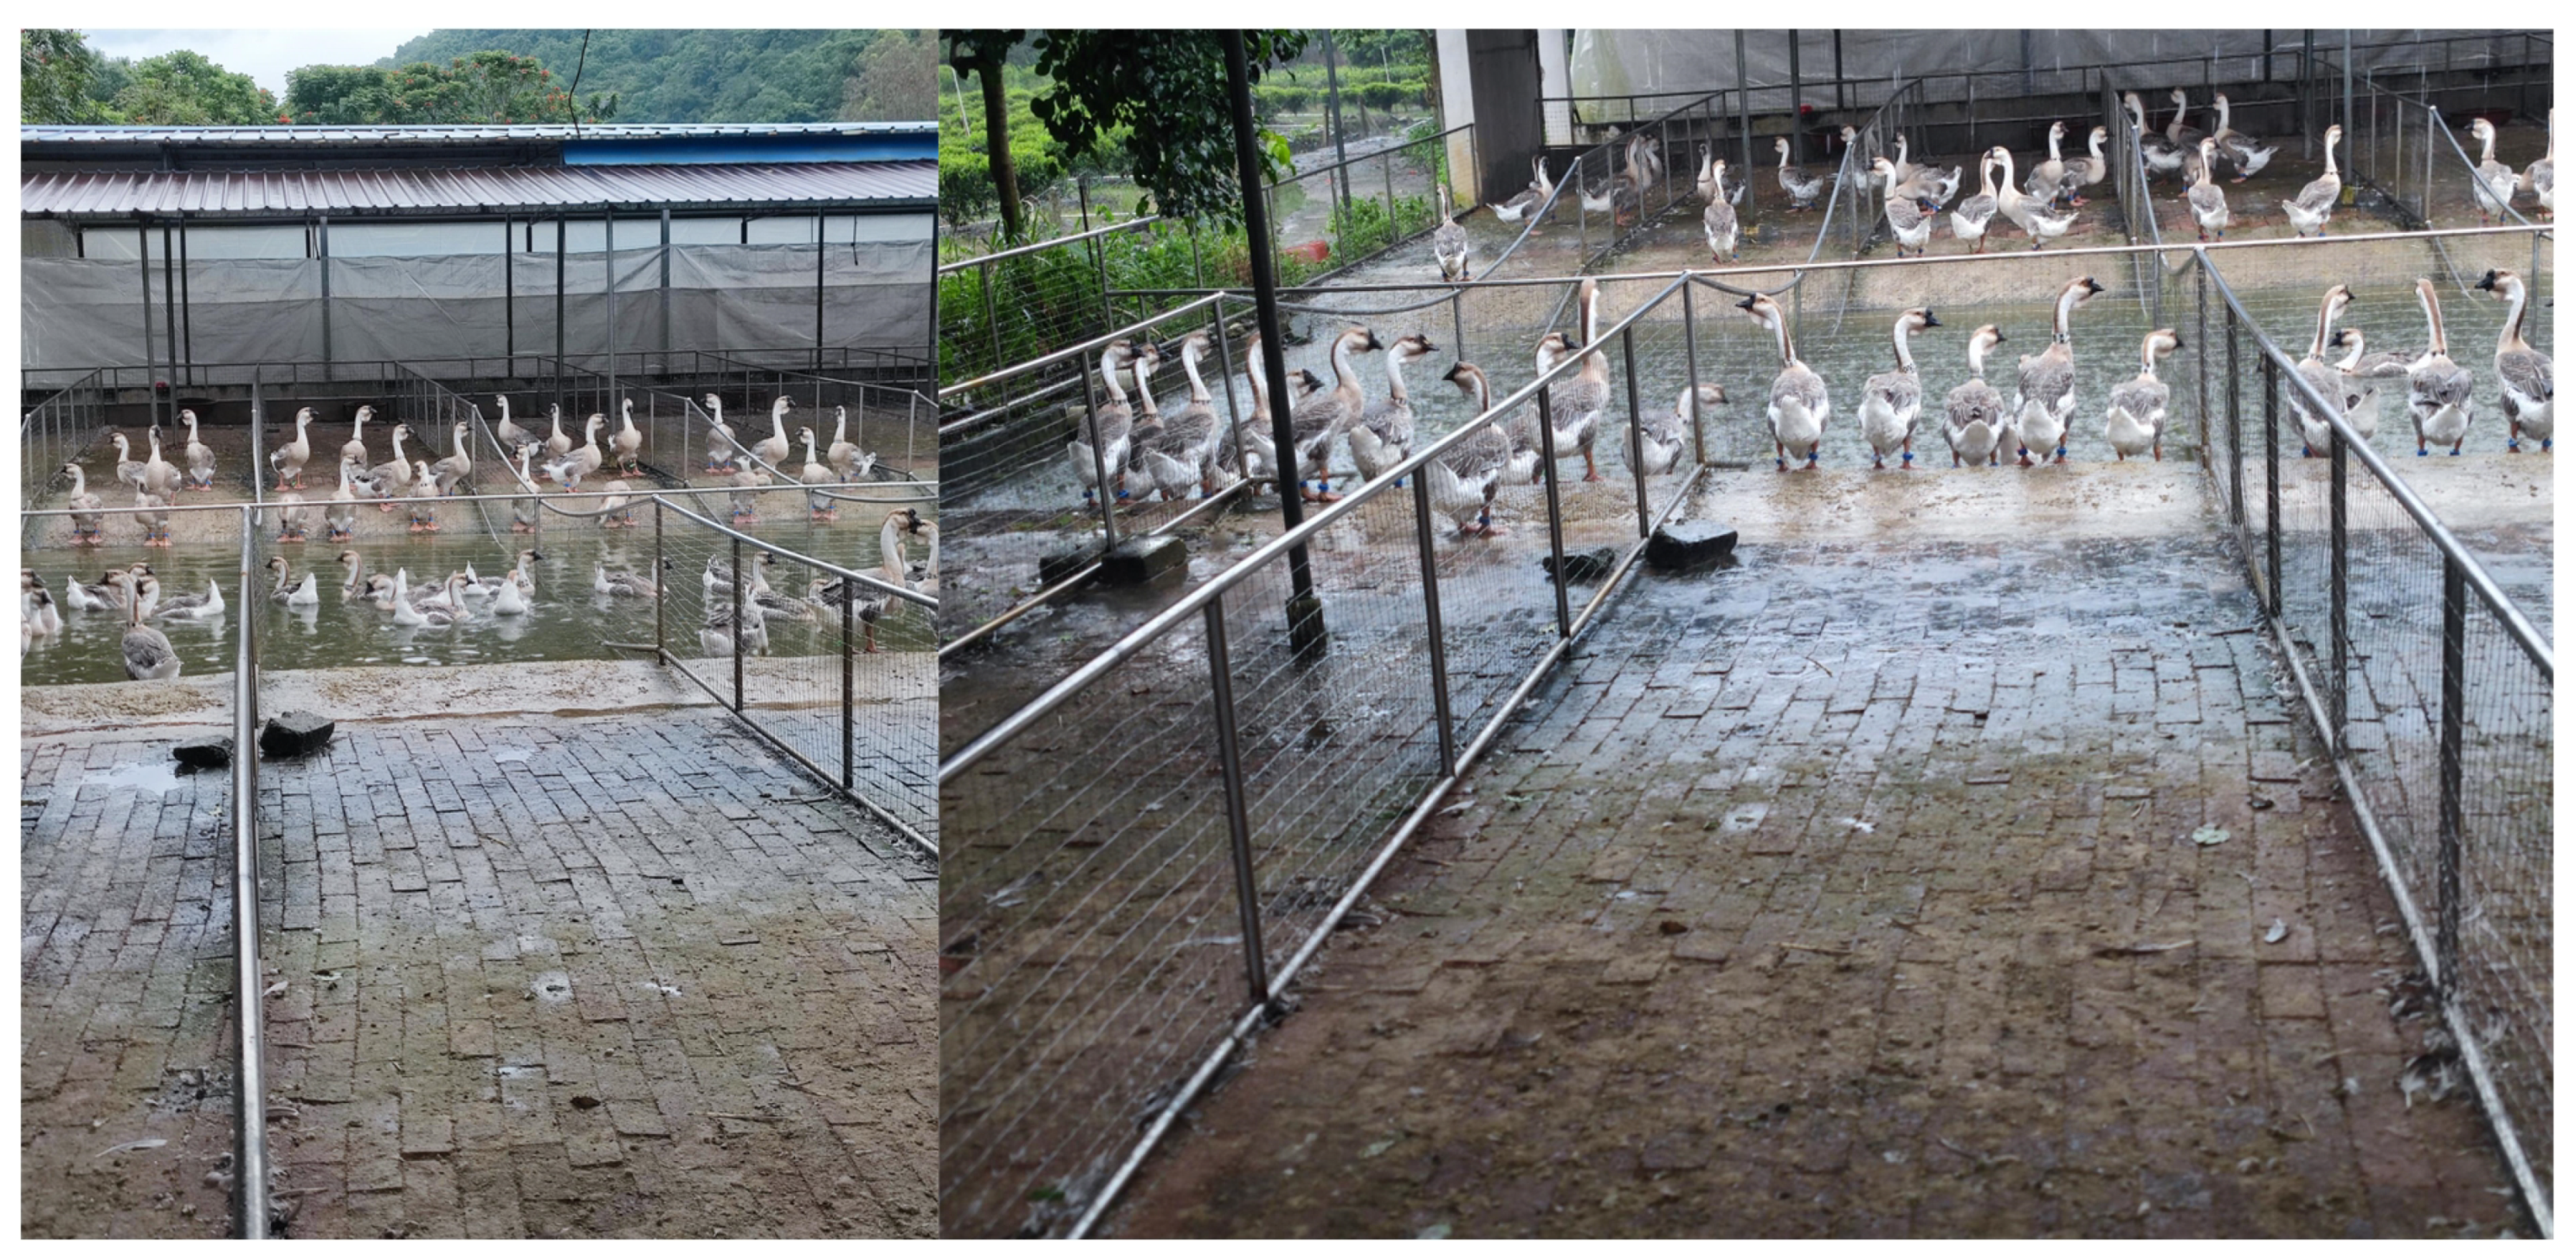
Figure 1, the flat rearing goose house optimizes population data tracking through refined zoning such as egg-laying areas and activity areas, and is equipped with monitoring devices to collect accurate data, facilitating centralized recording of population reproductive performance to support breed improvement. In comparison, large-scale free range goose houses adopt open fuzzy zoning, focus on group scale breeding, implement extensive management, and mainly focus on overall growth efficiency and survival rate indicators.
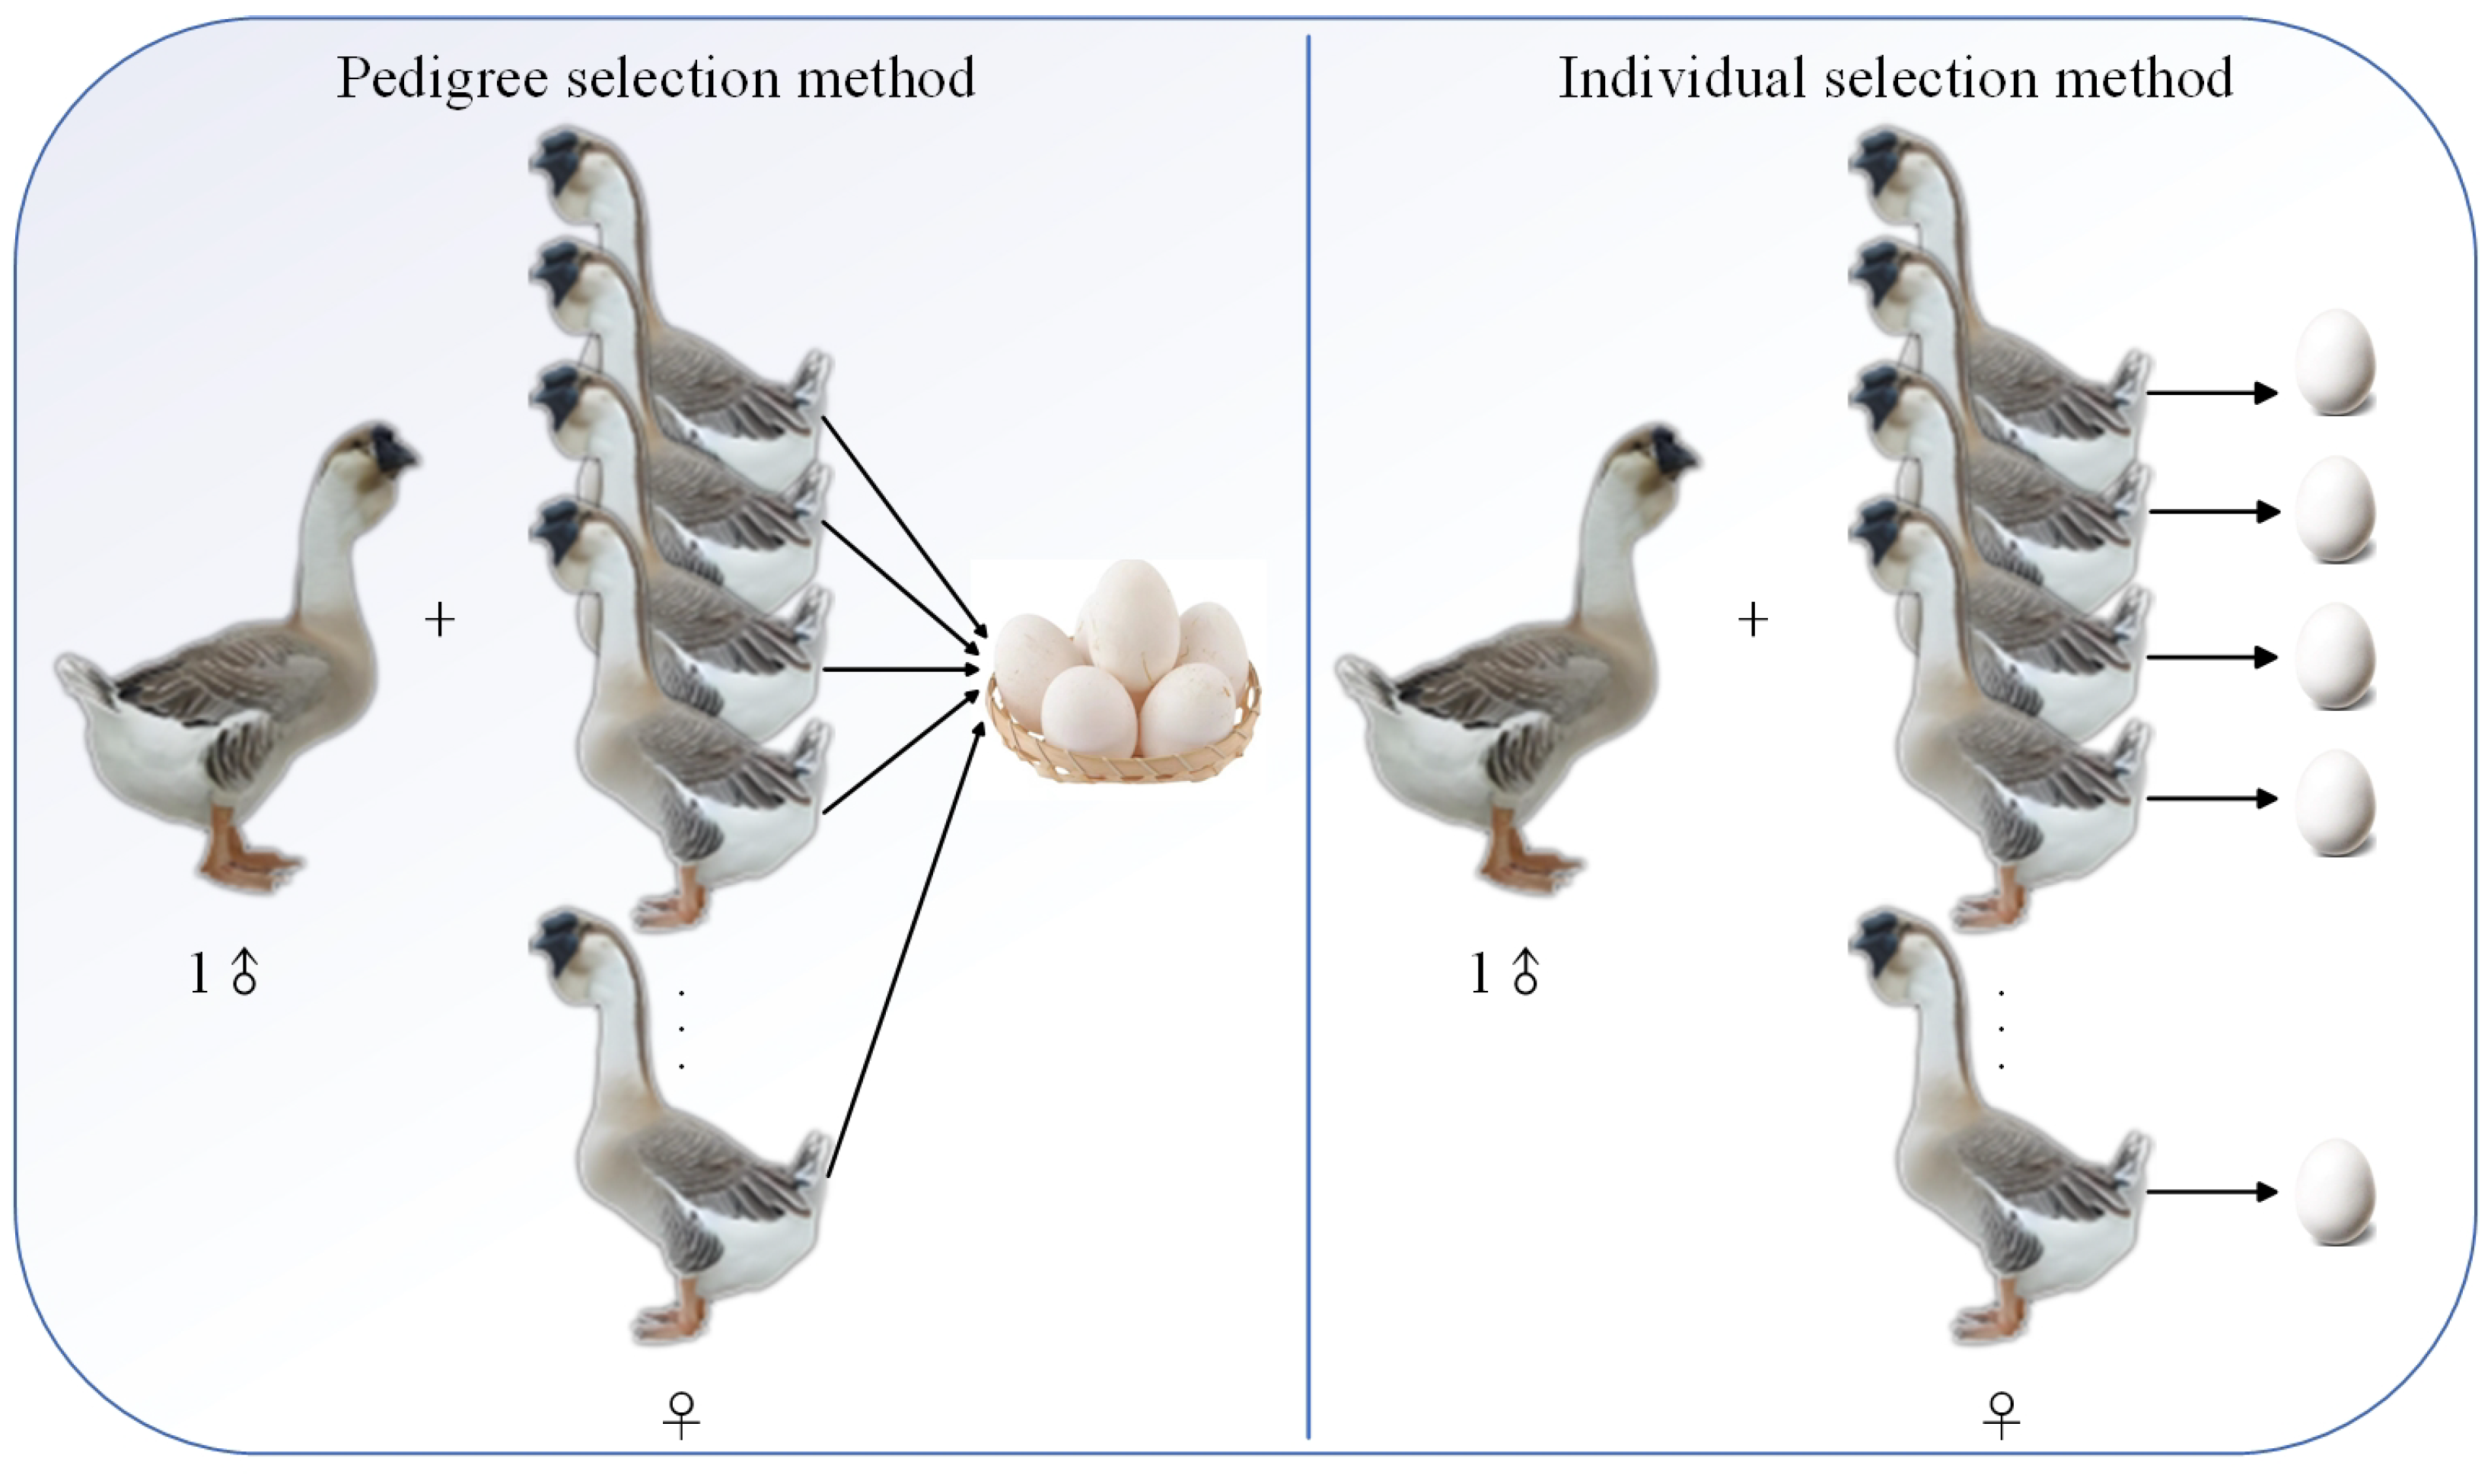
The current mainstream breeding strategies include two categories: pedigree selection method and individual selection method. The pedigree selection method takes patrilineal pedigree as the basic unit, using a group breeding model with multiple females and a single male to screen pedigree populations with target traits. Its core lies in evaluating the overall genetic stability of pedigree and the multigenerational phenotypic mean, requiring long-term tracking of genetic parameters within pedigree [
29]. Although this method can reduce environmental interference in genetic evaluation, it faces technical bottlenecks such as long breeding cycles (≥3 generations), high risks of inbreeding depression, and complex operations [
30].
In contrast, the individual selection method focuses on single individuals, achieving precise selection through direct quantification of individual phenotypic characteristics (e.g., egg production, egg quality) or genotypic information. This approach offers significant advantages of shorter decision-making cycles and faster genetic progress, enabling effective reduction of the screening period for high-quality germplasm resources [
31].
Figure 2 illustrates the conceptual framework and practical workflows of both methods.
2.2.2. Design of Individual Identification Markers for Lionhead Geese
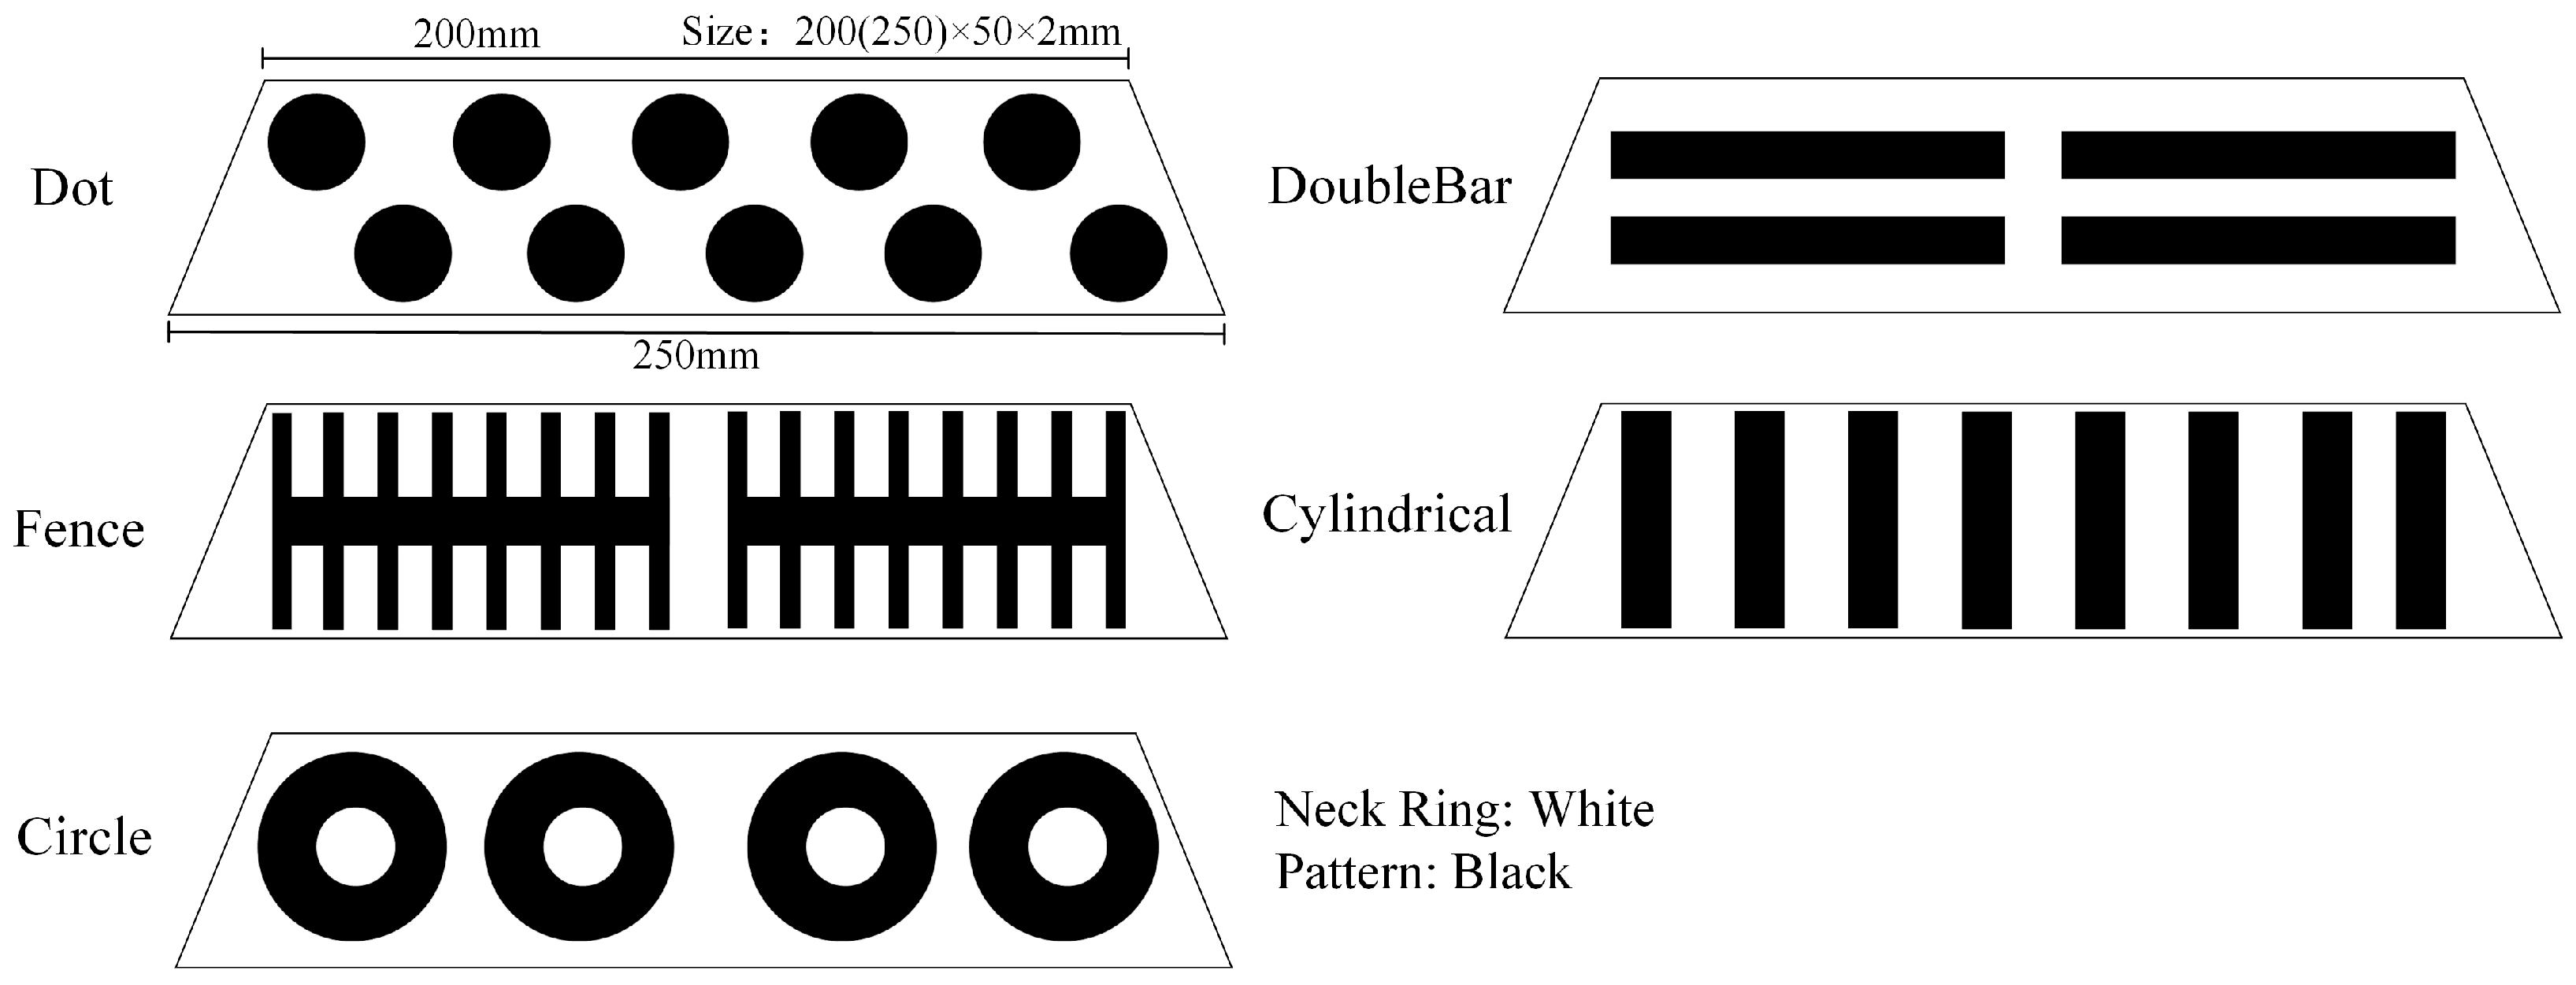
To address the challenge of high phenotypic similarity among lionhead goose maternal individuals and the difficulty in distinguishing them using traditional visual features, this study proposes an individual recognition scheme based on structured neck ring markers. The design adheres to three principles: identifiability, animal welfare compatibility, and engineering feasibility. The neck ring features a truncated conical structure (upper diameter of 200 mm, lower diameter of 250 mm, thickness of 1.5 mm), conforming to the anatomical features of the lionhead goose neck to ensure secure attachment and wearability without dropping off, while avoiding tracheal and esophageal compression.
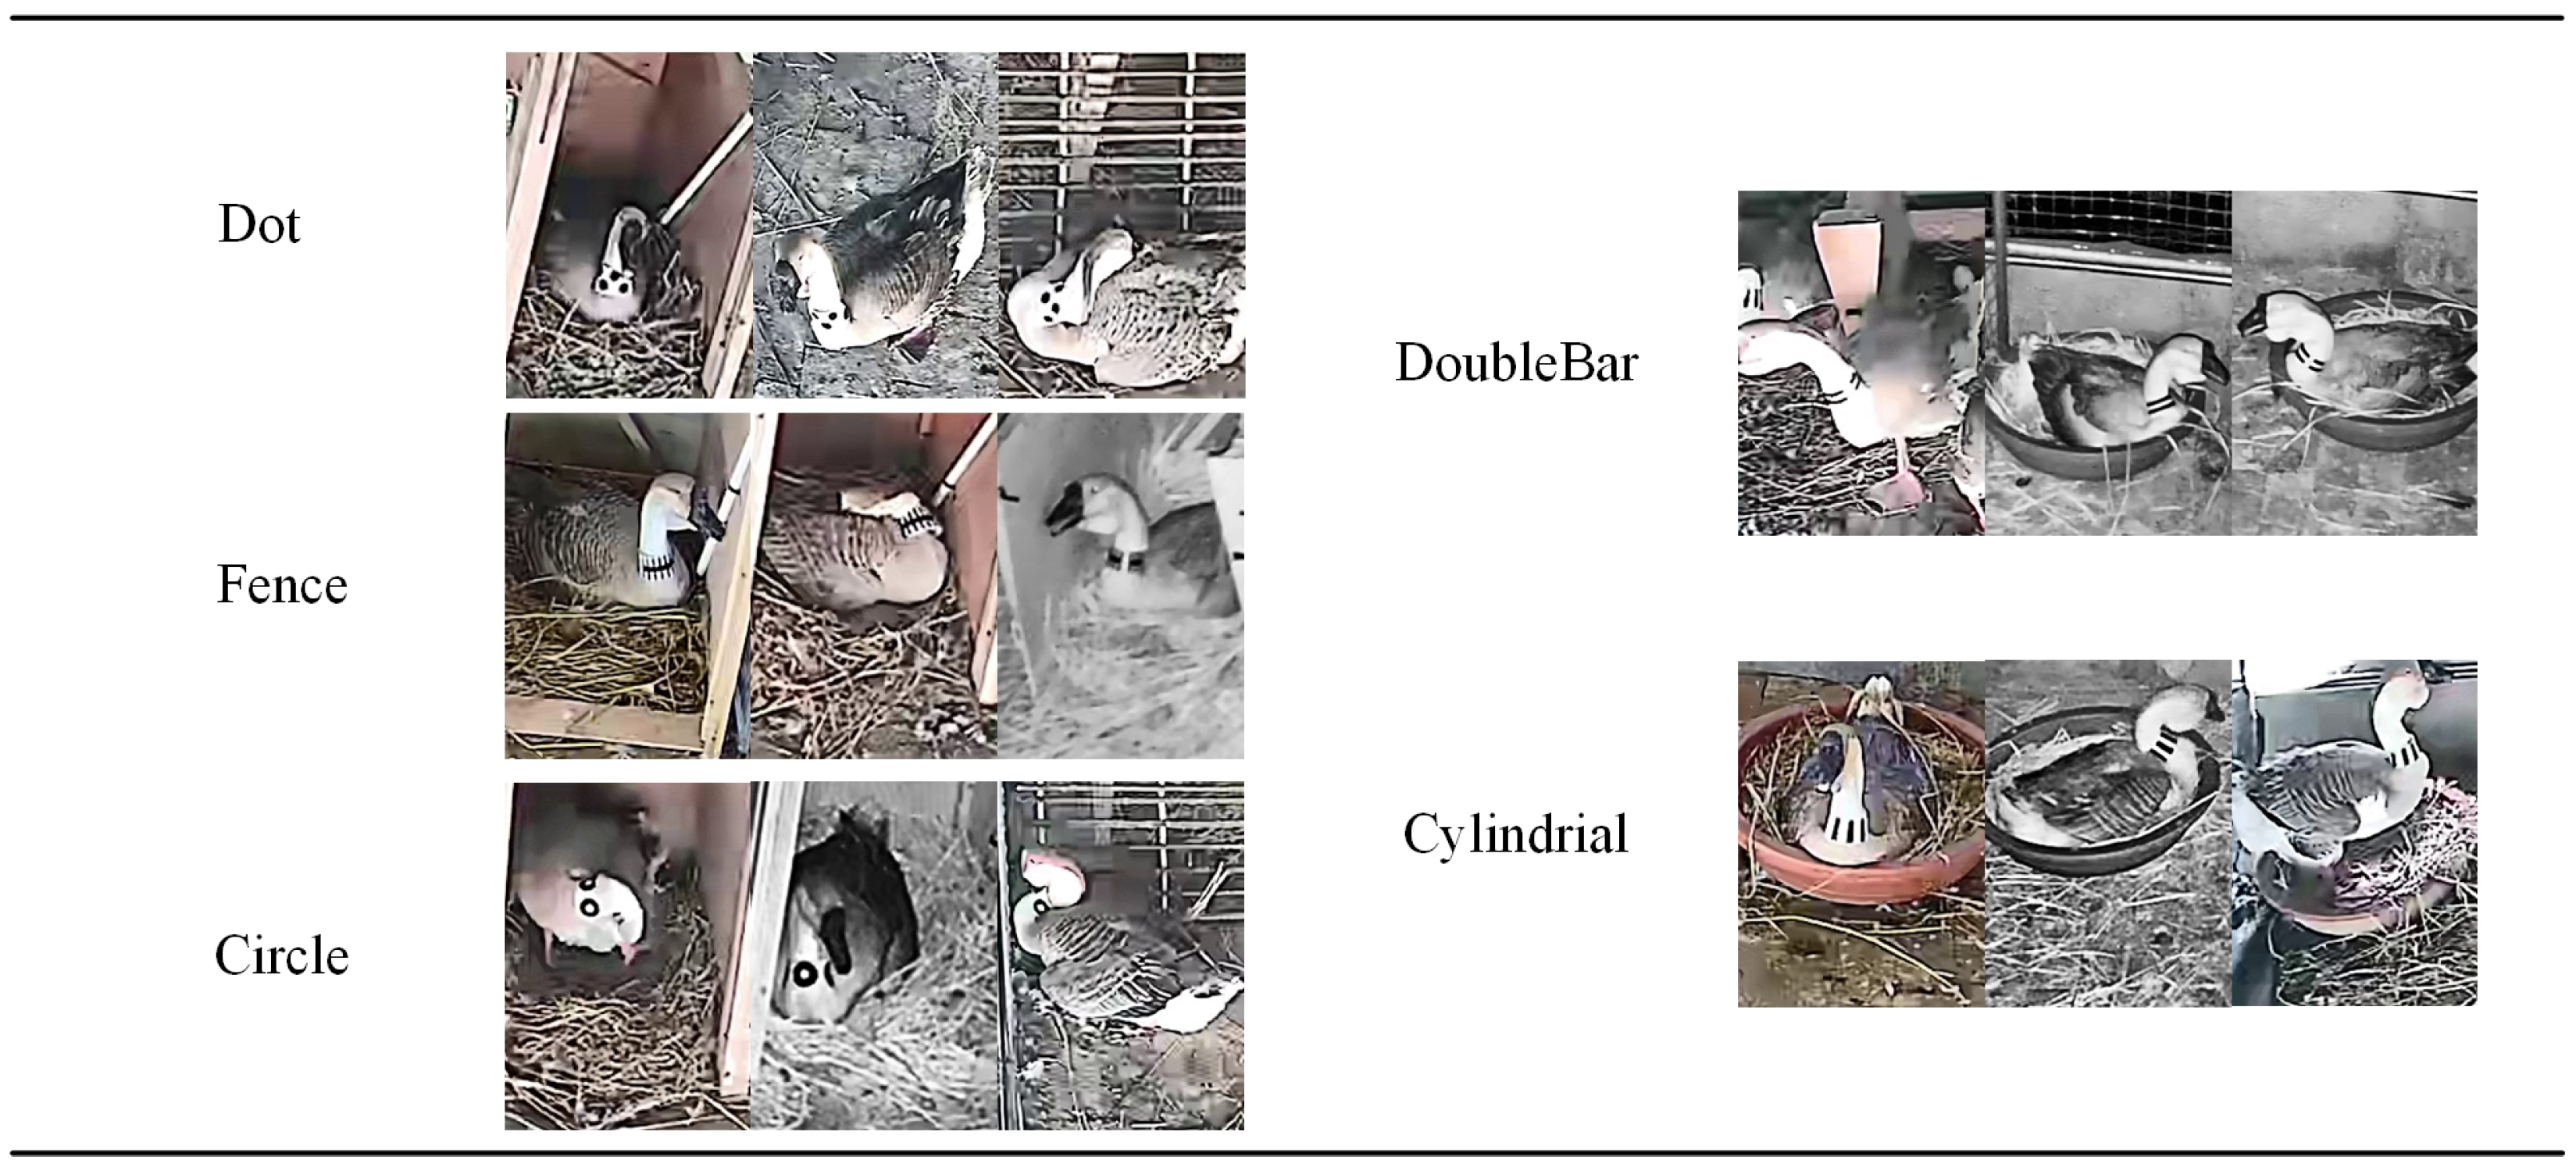
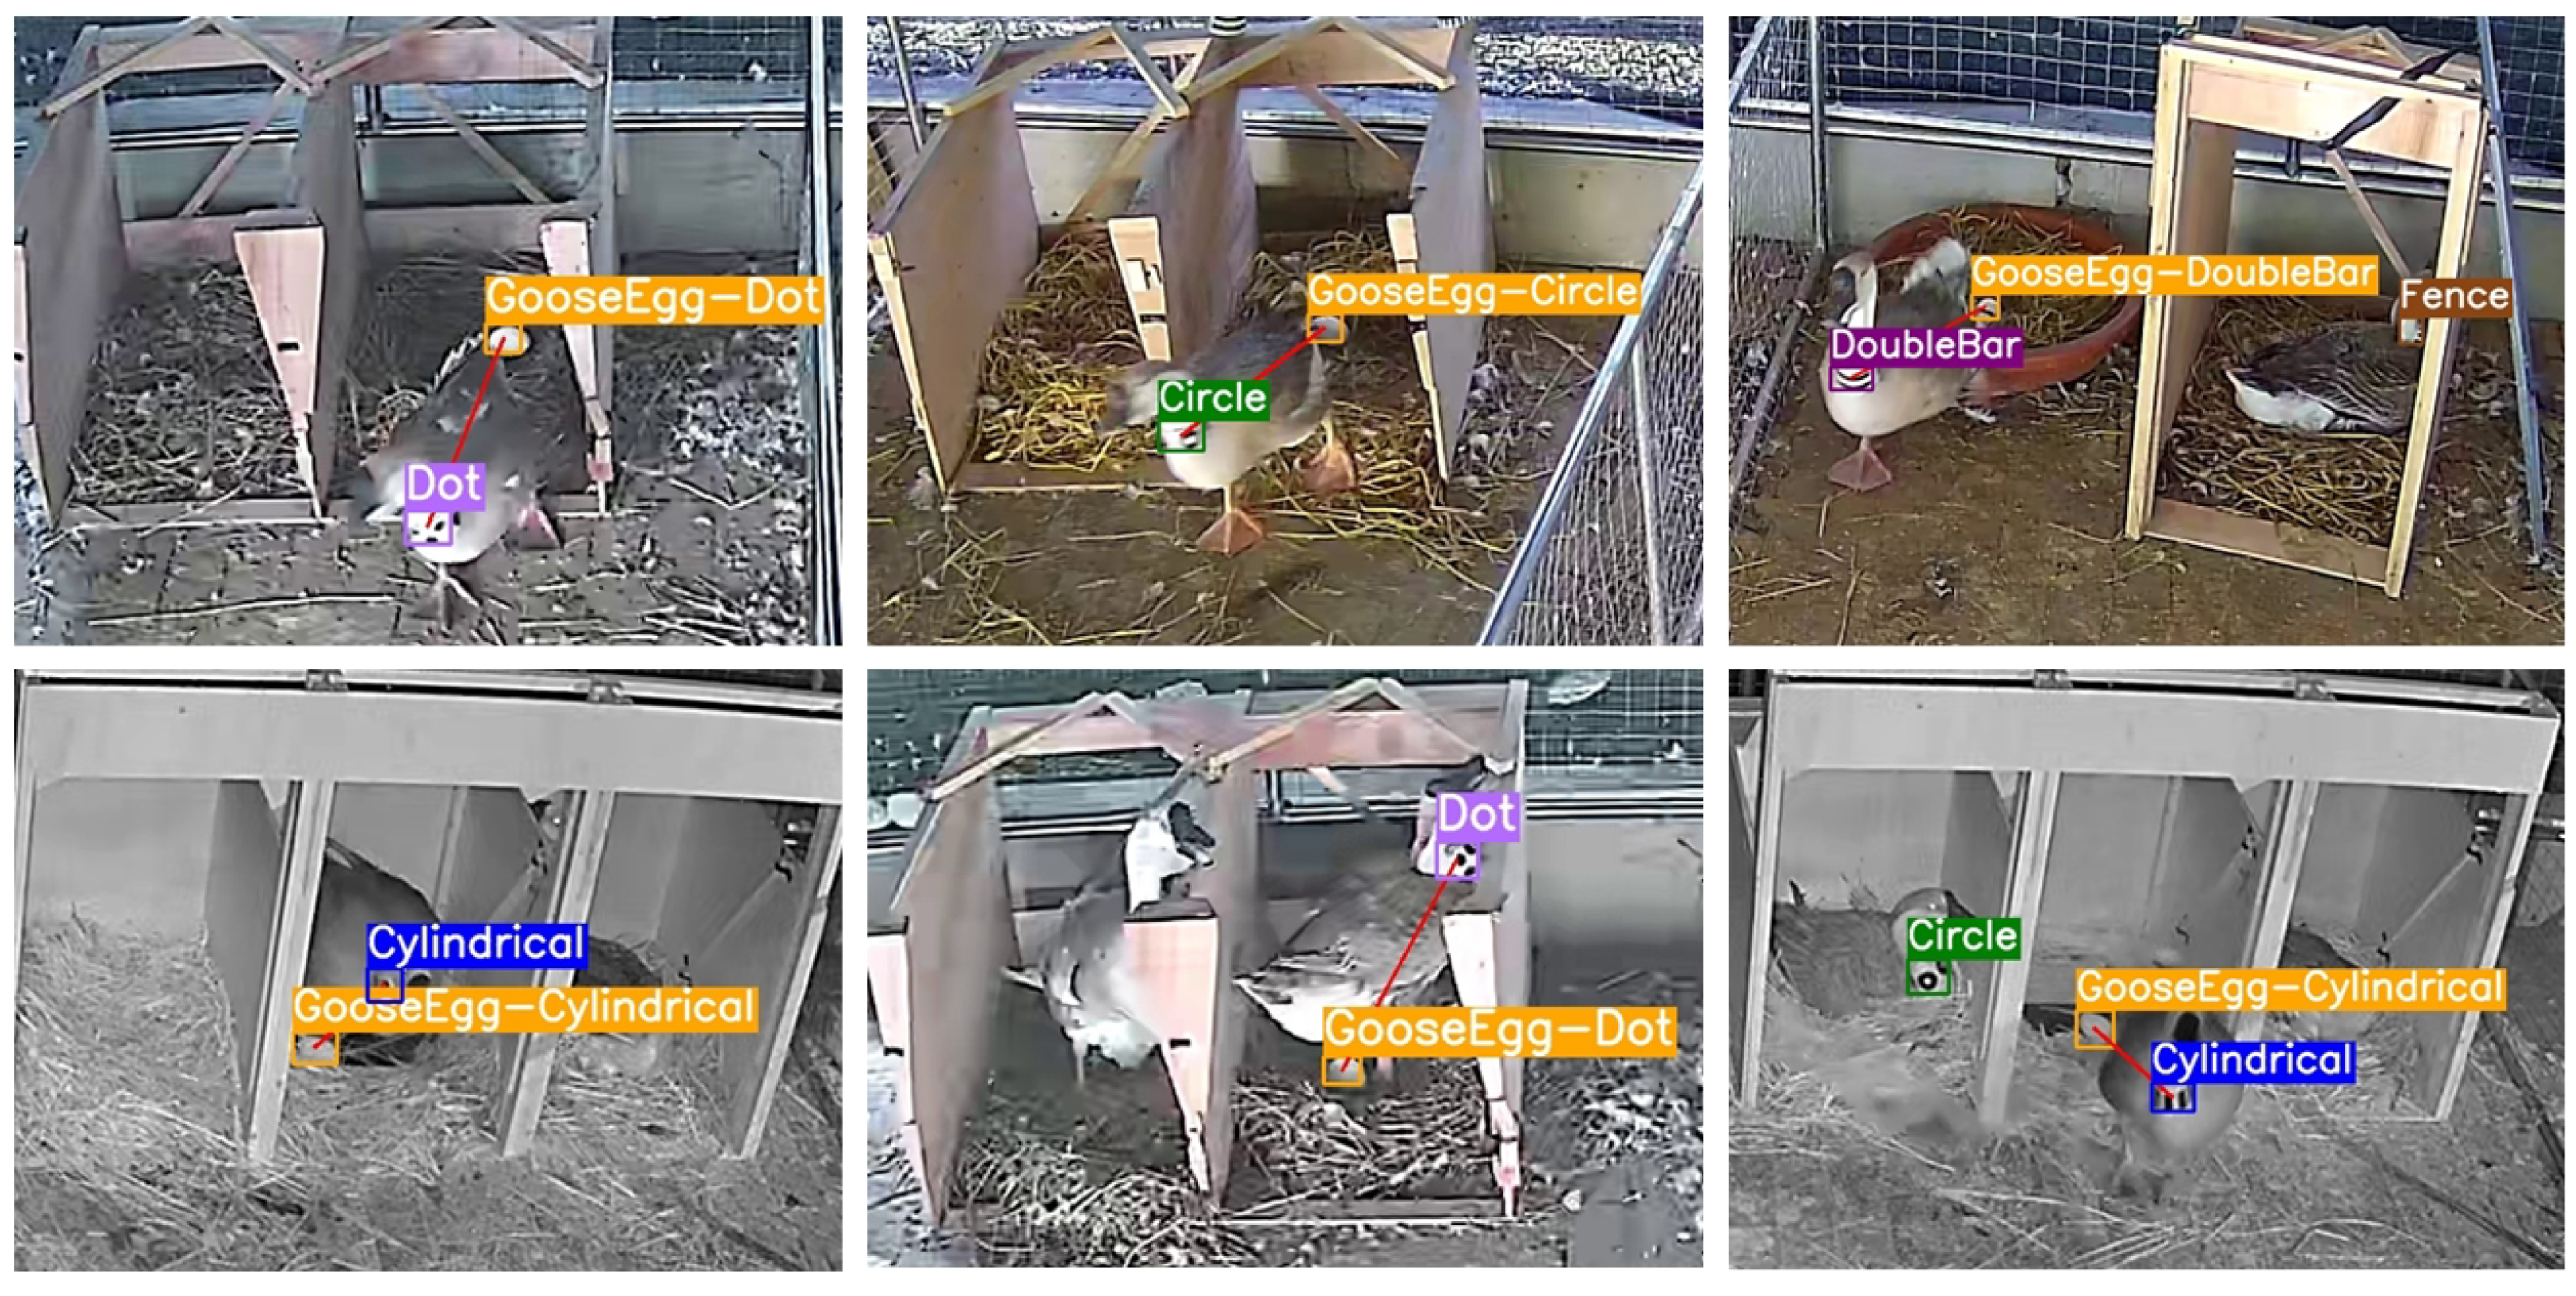
A flexible fluorescent silicone material (10 g weight) with a white background and black characters is selected, offering high contrast in both visible and infrared bands to enable round-the-clock monitoring while minimizing interference with natural goose behavior. The neck ring width is optimized to maximize the visible area for target detection algorithms while allowing unrestricted neck movement. To prevent misrecognition by the algorithm, the pattern design followed geometric exclusivity criteria, was designed for the ratio of males to females in the goose barn where the experiments were conducted in this study, with five females and one male, and consisted of five types: DoubleBar, Circle, Dot, Fence, and Cylindrical. These patterns exhibit significant differences in edge complexity, symmetry, and spatial frequency, effectively enhancing classifier decision boundary clarity. The binary (black/white) pattern design suppresses color dependency and improves algorithm robustness against illumination variations. The view of the neck ring is shown in
Figure 3.
2.3. Datasets
2.3.1. Acquisition of Datasets
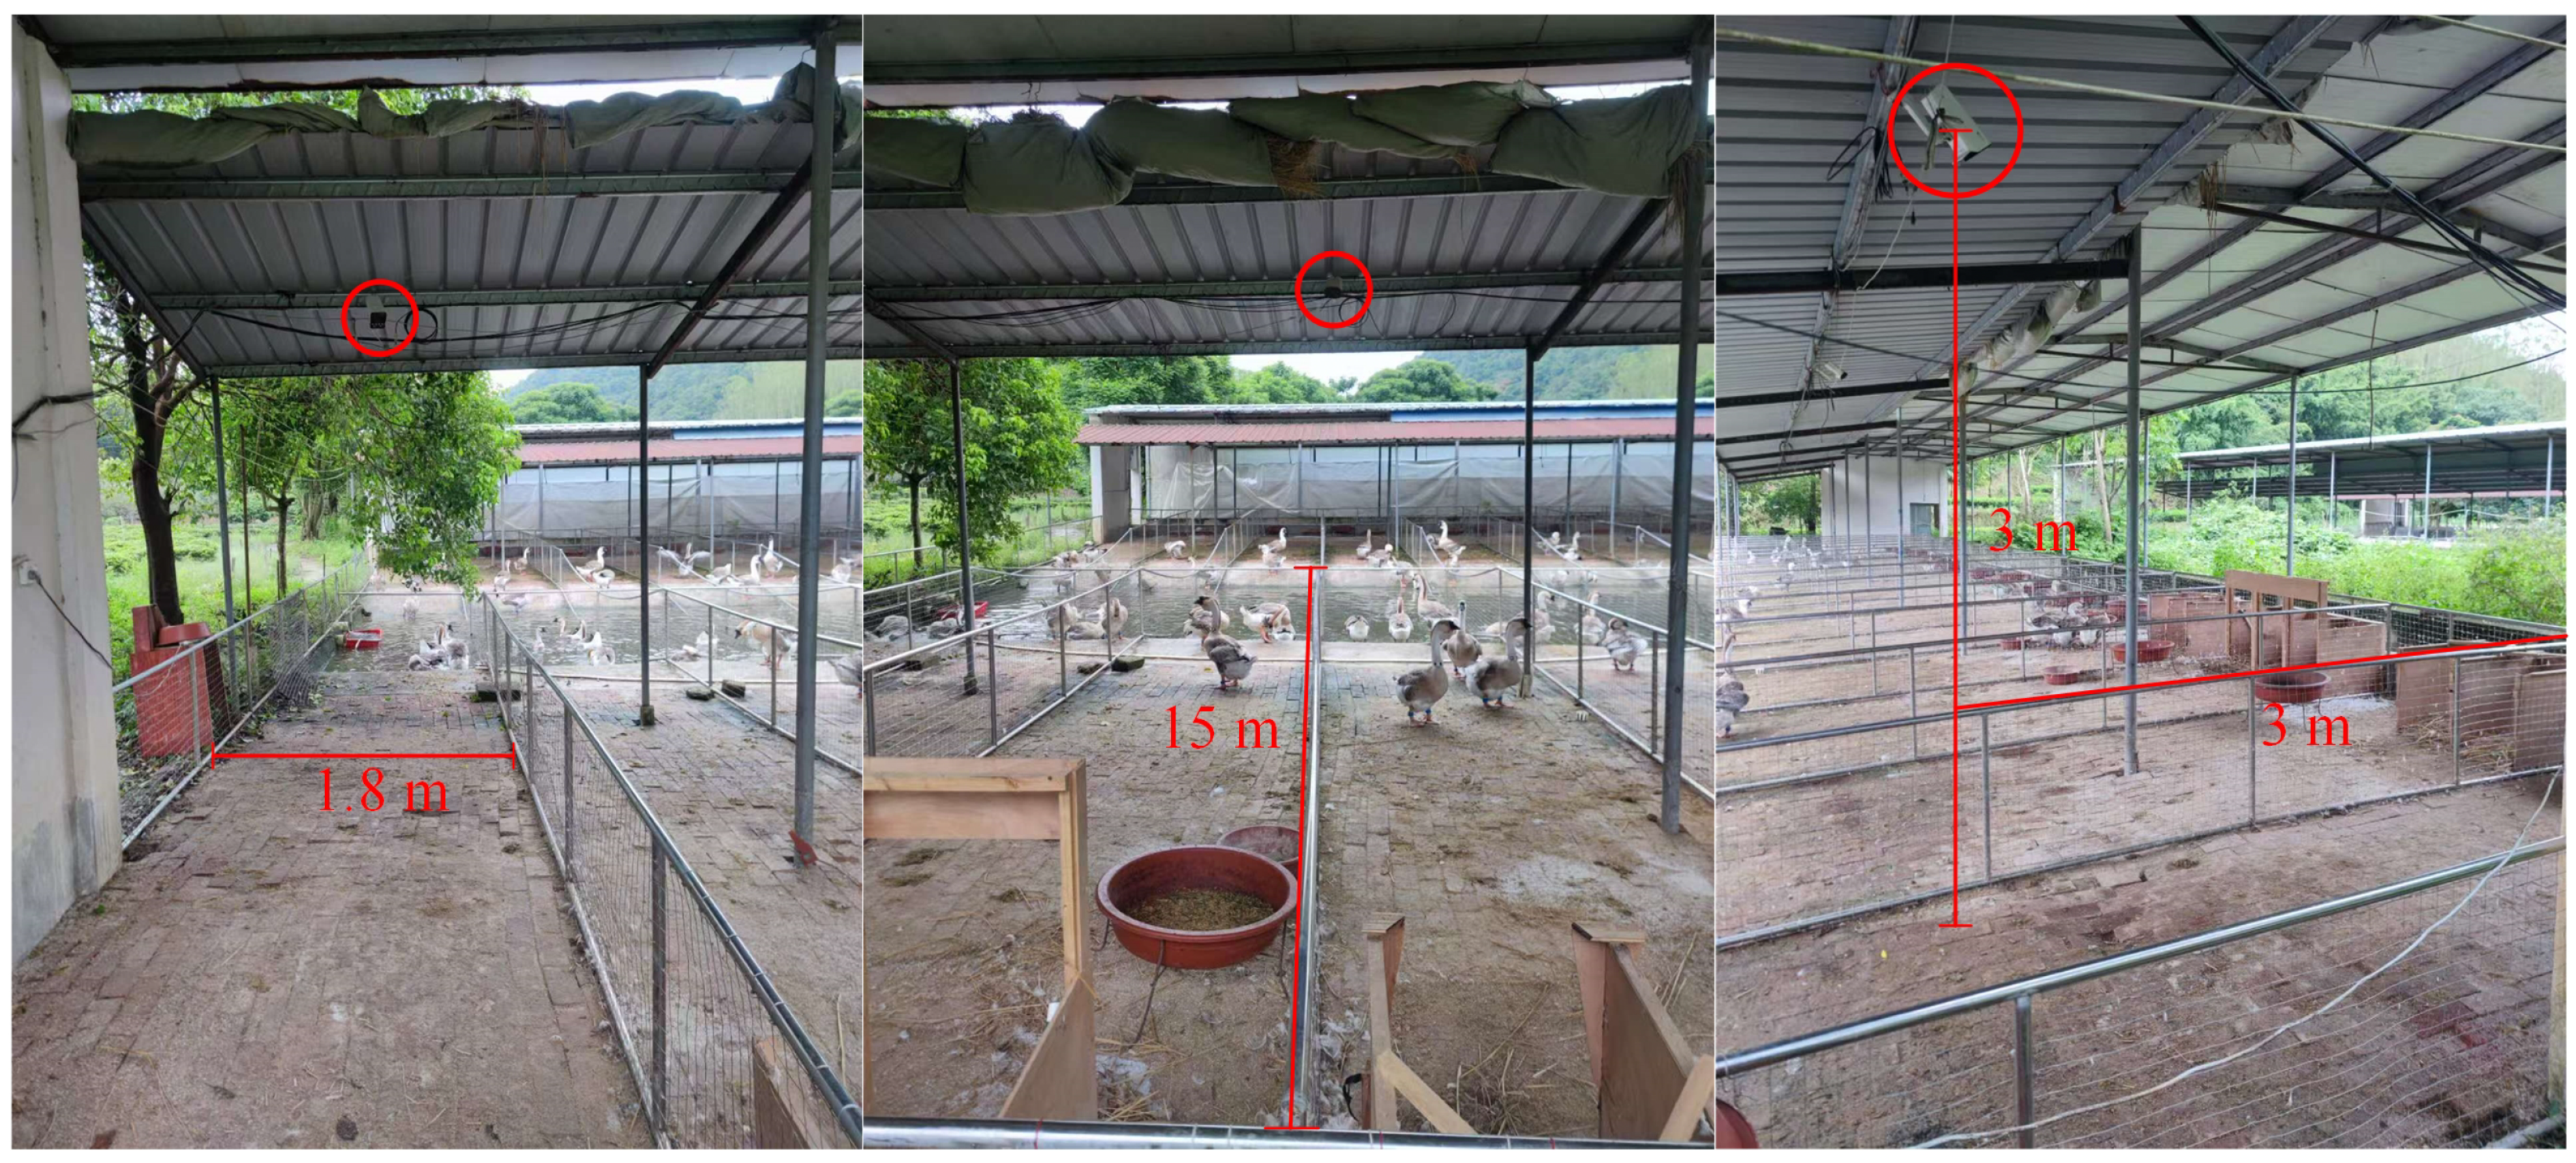
The dataset used in this study was collected from a Lion-Head Goose farm located in Zhanxi Town, Raoping County, Chaozhou City, Guangdong Province. The video data were sourced from surveillance cameras operated by Chaozhou Lixing Agriculture Co., Ltd., Chaozhou, China. The camera was mounted in the top center between the two coops, about 3 m above the ground. The area of each coop was approximately 1.8 m by 15 m (including the water portion), as shown in
Figure 4.
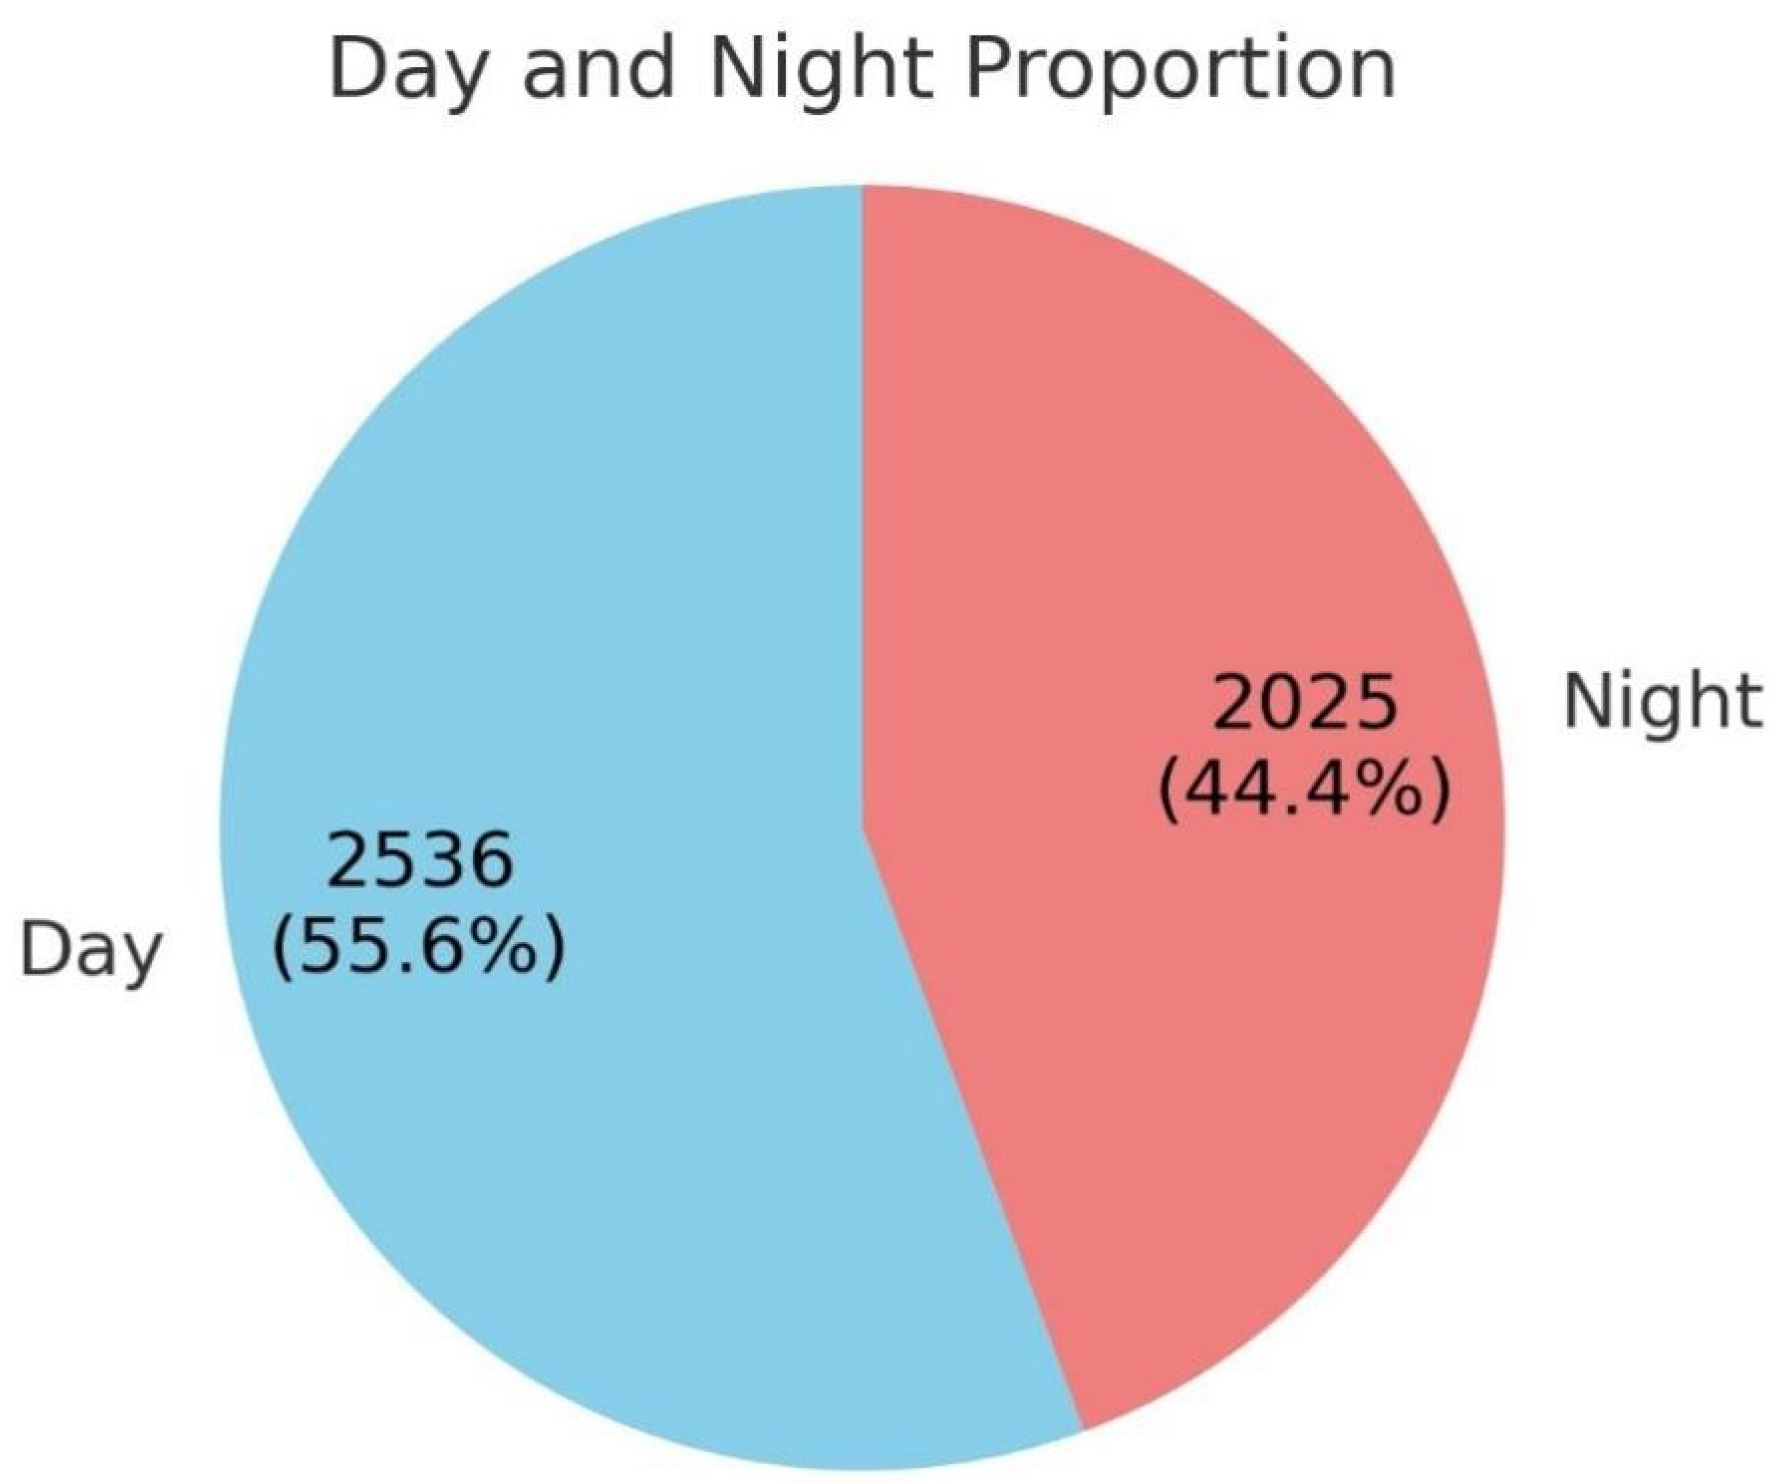
There were a total of four goose coops in this research experiment, and one camera was used for data acquisition in each of the two coops. The video resolution was 2304 × 1296 pixels, with a frame rate of 15 FPS. The surveillance cameras used were HIKVISION models (DS-2CDT46WDV3-I3). It is capable of capturing both color and infrared black and white images. The video was recorded from 10–18 July 2024, capturing RGB images during the day and infrared images at night, resulting in a total of 4561 raw images. The proportion of daytime and nighttime data in the dataset was as follows: daytime images constituted 55.6%, including 2536 images, while nighttime images constituted 44.4%, including 2025 images, as shown in
Figure 5.
One of the housings housed six geese, consisting of five females and one male. Only female geese wore neck rings as individual identification markers, while male geese did not. Therefore, the dataset consists of 20 different female geese in total. A total of 20 breeding geese were used as experimental subjects. The patterns on the neck rings of the five female geese included DoubleBar, Circle, Dot, Fence, and Cylindrical. The quantity of each label is as follows: Circle has 2587, Fence has 1631, Dot has 1199, Cylindrical has 1919, Doublebar has 1479, and GooseEgg has 1275, The total number of labels is 10,090.
Figure 6 presents a schematic of individual Lion-Head Geese, where different patterns represent distinct individuals within the same goose housing.
2.3.2. Data Preprocessing
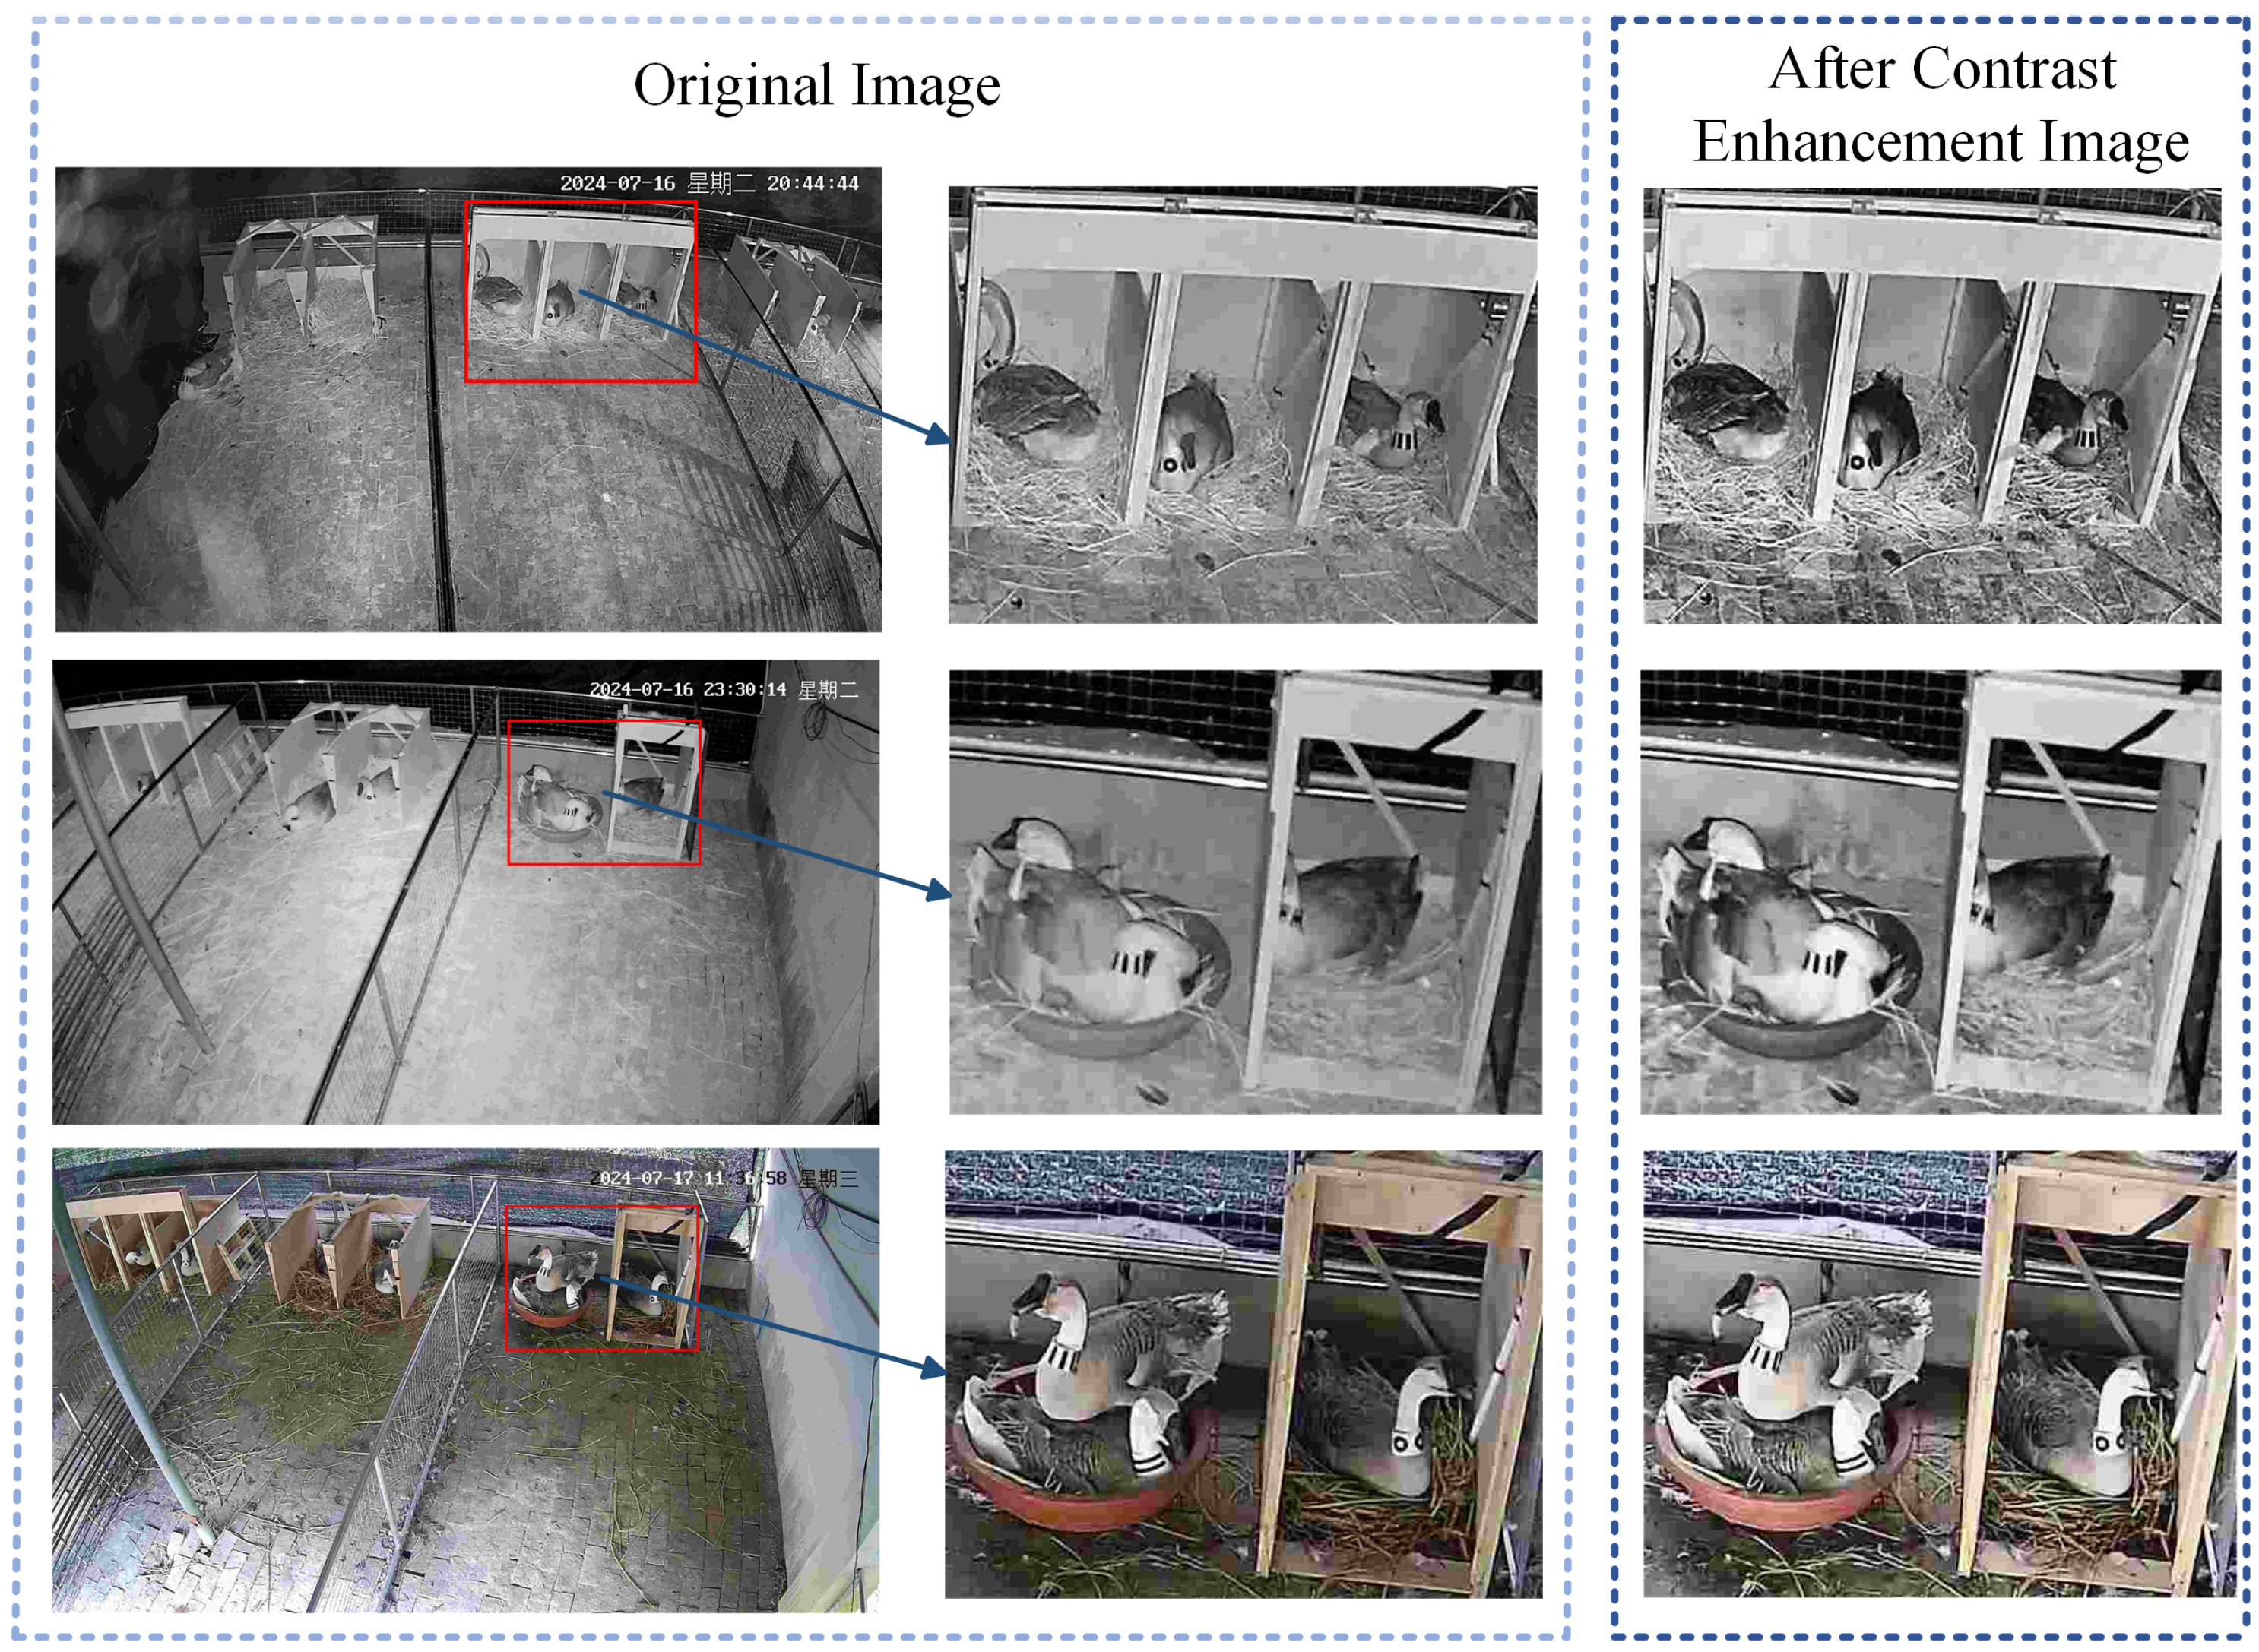
The acquired images were filtered and then processed into individual frames, resulting in 2991 images. The dataset did not adopt data augmentation, as it inherently covers natural variations such as lighting and shooting angles, providing sufficient diversity. There is no need to introduce artificial augmentation to avoid biases. To improve the accuracy of identifying the black character patterns on the neck rings in subsequent steps, contrast enhancement was applied to the images after extraction.
Figure 7 shows a comparison of the images before and after contrast enhancement.
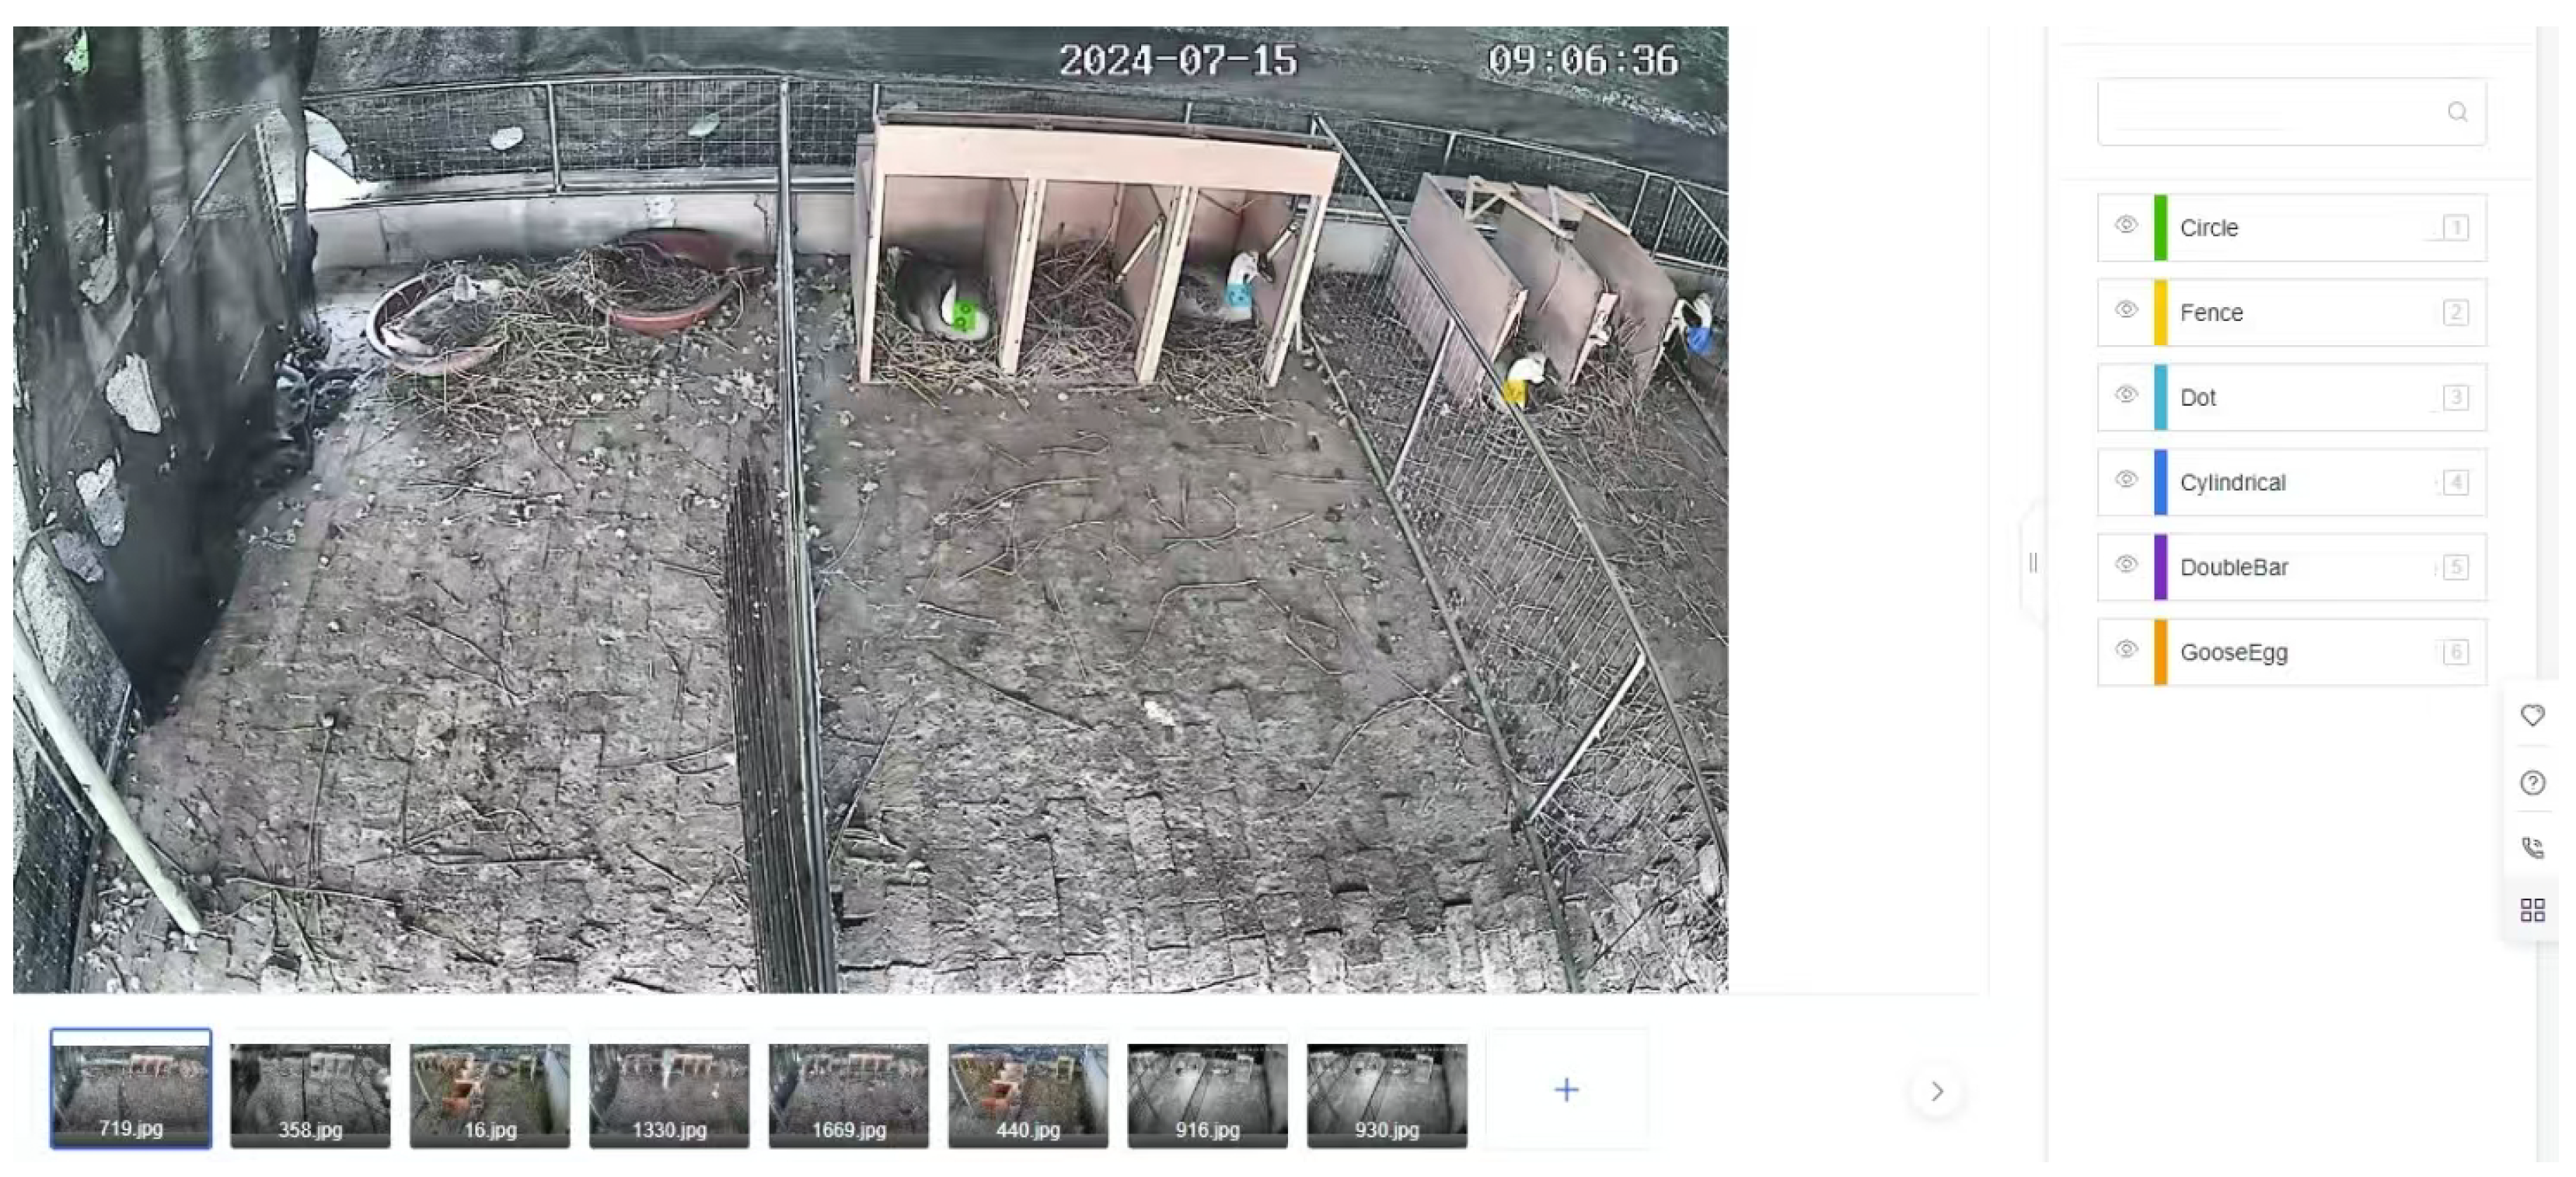
In order to better achieve the final matching of goose eggs, the neck rings of the breeding geese and goose eggs were annotated using the EasyDL platform, based on Baidu’s PaddlePaddle [
32]. The resulting VOC format dataset was manually converted to a format suitable for YOLO for algorithm training and testing. All visible neck ring objects and goose eggs were annotated, while those obstructed by feathers or other geese were left unmarked. This approach prevents unannotated objects from being treated as negative samples, which could weaken the algorithm’s ability to distinguish between positive and negative samples. To evaluate the model’s performance, the dataset was randomly divided into training, validation, and test sets in an 8:1:1 ratio. Both the validation and test sets contained 299 images each.
Figure 8 displays the label management interface. There are a total of six classes: GooseEgg, DoubleBar, Circle, Dot, Fence, and Cylindrical.
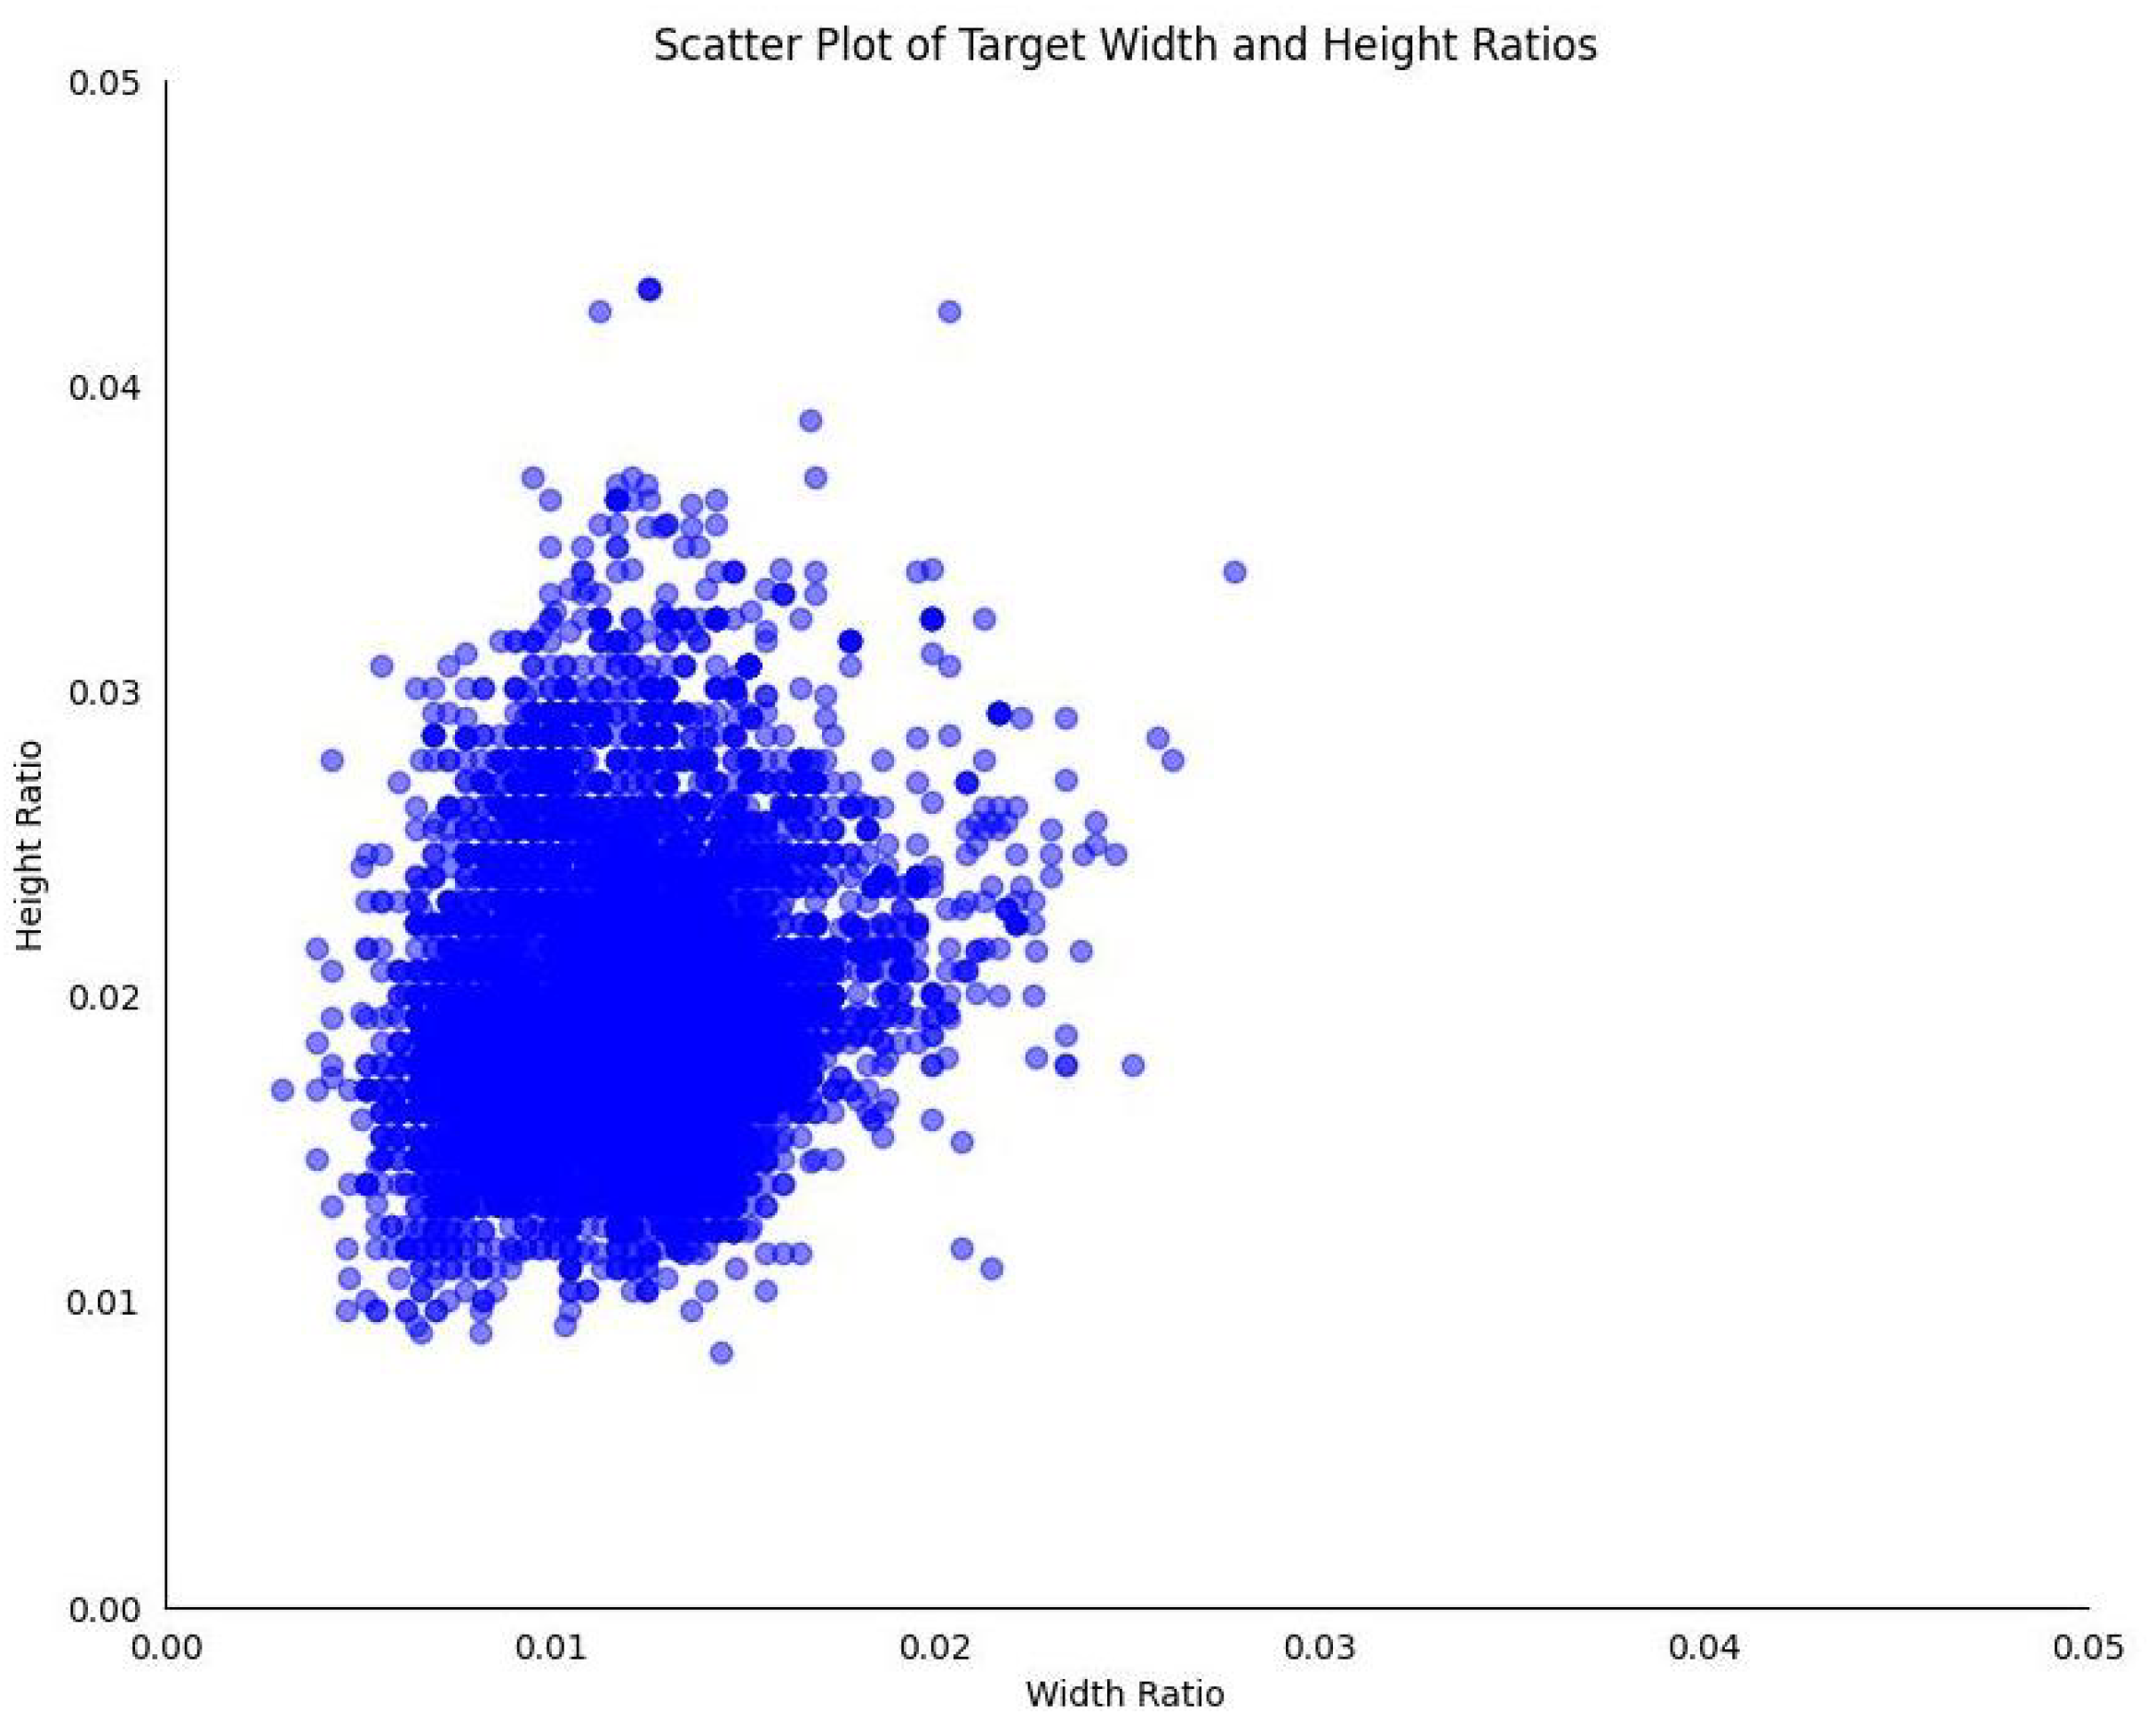
To facilitate future algorithm improvements and optimizations, an analysis was conducted on the annotated neck ring and goose egg objects based on the final labeling results. The X-axis represented the ratio of the bounding box width to the total image width, while the Y-axis represented the ratio of the bounding box height to the total image height.
Figure 9 illustrates the scatter plot.
The results indicated that the ratios of the bounding box dimensions to the total image dimensions for all objects were less than 0.05. This meant that the object sizes were less than 0.25% of the original image size, and any object size below 1% of the original image was considered a small object [
33]. Therefore, for the Lion-Head Goose individual and goose egg identification dataset, the proportion of small objects was 100%. These characteristics pose significant challenges for training detection models to recognize individual Lion-Headed Geese and match them with their eggs.
2.4. Overall Process Flow Diagram
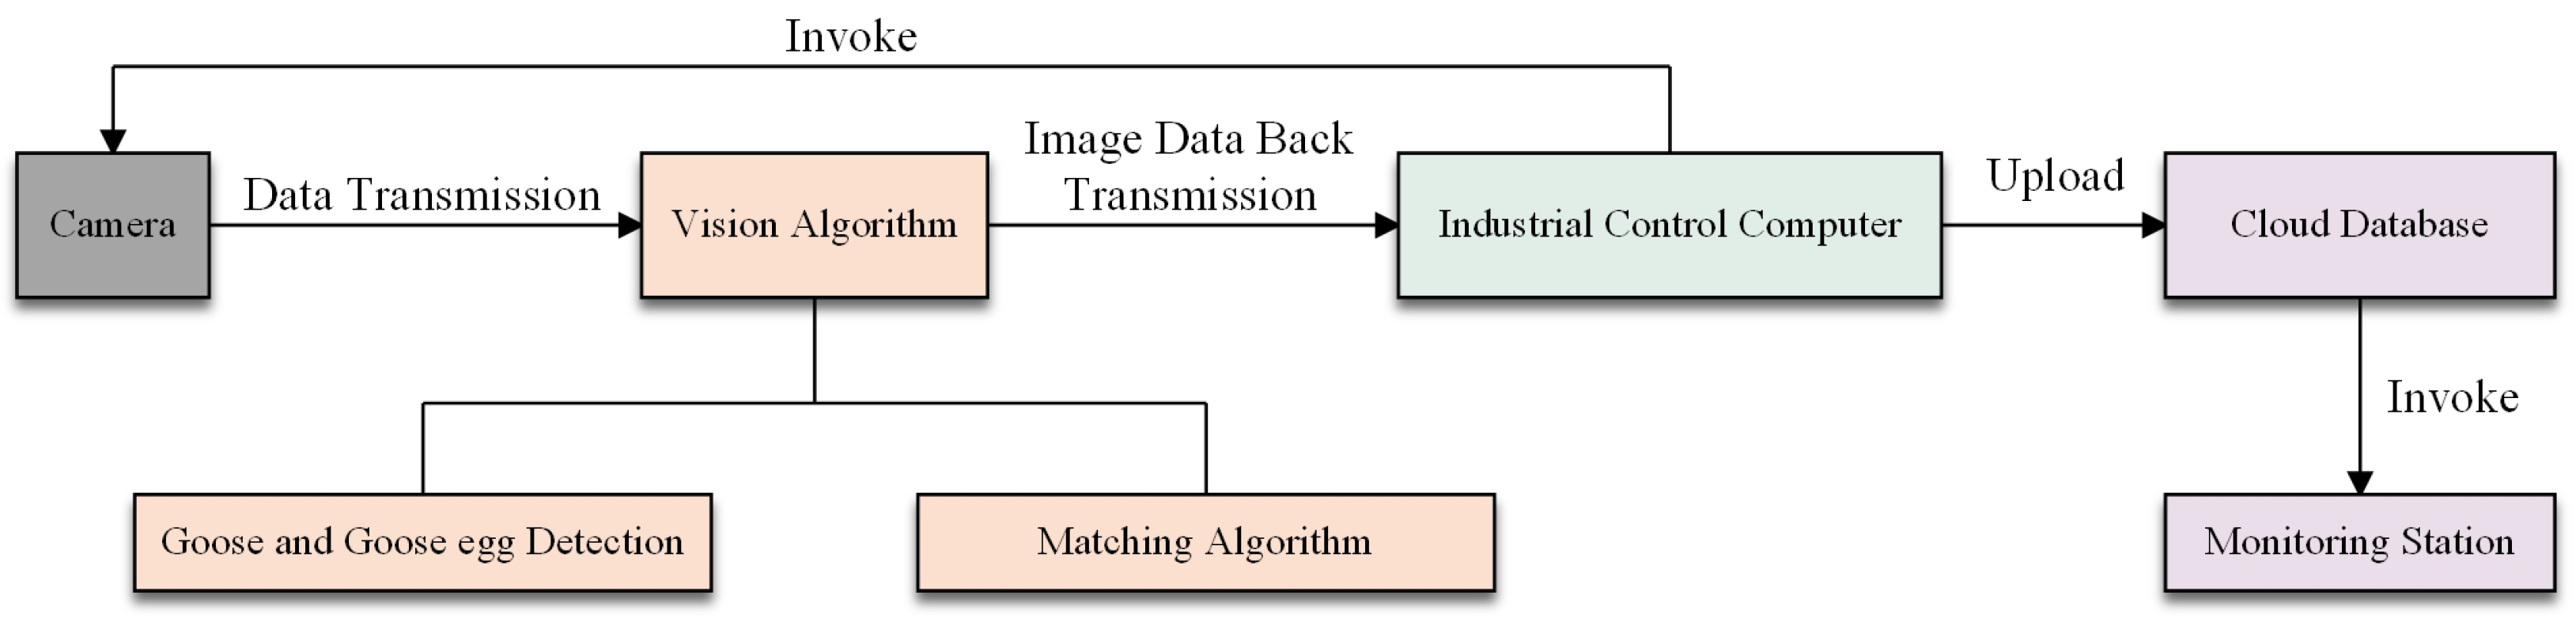
The neck rings served as identification markers for the Lion-Head Geese, placed around the necks of the breeding geese. Video streams were captured by cameras installed above the goose housings, and these streams were processed using image processing algorithms to detect both the neck ring patterns and goose eggs. When an egg was detected, the system matched it with a mother goose based on the shortest Euclidean distance and time sequence, then captured a screenshot and uploaded it to a cloud database, generating a chronological table for easy access by management personnel.
The process framework employed in this study is depicted in
Figure 10. Initially, cameras mounted above the goose housing captured video streams. These streams were then processed through a series of image processing algorithms to identify individual Lion-Head Geese and their locations, as well as to detect and locate goose eggs. The analysis incorporated time series data and continuous frame recognition of positional changes, aiding in accurately determining each goose’s position and timing, thereby enhancing the precision and reliability of subsequent matching and data analysis.
A local network, established through multiple access points connected to the internet, allowed the industrial control computer to efficiently upload the processed data. Once processed, the maximum number of geese in each shed, along with related images and timestamps, was uploaded to an Alibaba Cloud server. Additionally, management personnel could utilize the pedigree Lion-Head Goose management system developed by our research team to view data in real time via the cloud database at monitoring stations and make informed decisions [
34]. The availability of this real-time data enabled users to quickly respond to various situations, such as a reduction in the number of geese due to mortality. The system could immediately detect such events and issue alerts, allowing managers to take timely actions to ensure the health and productivity of the remaining geese.
2.5. YOLO-Goose Model Based on YOLOv8
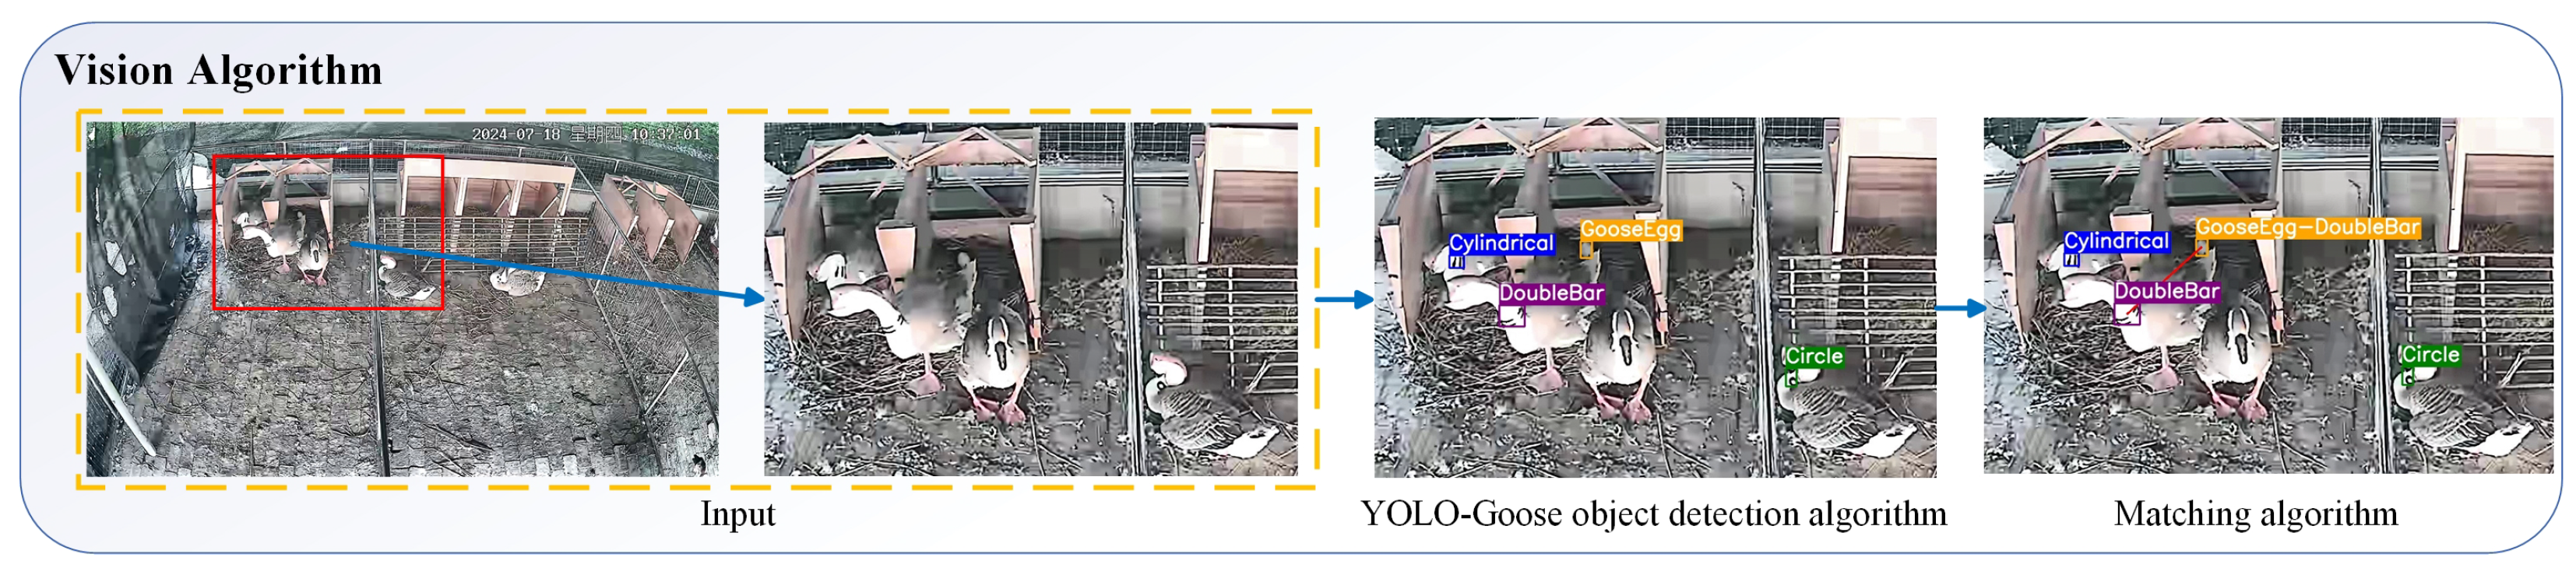
2.5.1. Overall Flow of the Visual Algorithm
The Lion-Head Goose egg matching algorithm presented in this paper was primarily divided into two parts: object detection and matching processing. First, the video stream captured by the camera was fed into an enhanced YOLOv8s object detection model for analysis, aiming to identify the categories of individual Lion-Head Geese and goose eggs, as well as determining their pixel coordinates. Next, the data generated by image recognition was processed using a matching algorithm. This algorithm iteratively calculated the coordinate changes of identified geese to determine whether a specific goose was nesting to lay eggs. It then identified and filtered all geese within the object enclosure, ultimately producing the desired results.
Figure 11 illustrates the overall workflow of the Lion-Head Goose egg matching algorithm.
2.5.2. Structure and Features of the YOLOv8 Algorithm
The object detection algorithm plays a crucial role in the method for individual identification of Lion-Head Geese and goose egg matching within the same pedigree, serving as the key to recognizing and locating individual geese and eggs. YOLO, as an end-to-end object detector, is renowned for its ease of training, fast speed, and high accuracy. YOLOv8, released by Ultralytics in 2023, is an updated network that builds upon the previously developed YOLOv5 [
35], integrating tasks such as object detection, keypoint detection, instance segmentation, and real-time tracking. YOLOv8 comes in various models including n, s, m, l, and x. To avoid computational redundancy and the consequent slowdown in detection speed, YOLOv8s was chosen as the base model, balancing detection accuracy and model size.
The YOLOv8 algorithm model is primarily composed of three parts: Input, Backbone, and Head, where the Head includes the Neck and Detection Head components. The Input section features mosaic data augmentation, adaptive anchor calculation, and other data augmentation techniques. The Backbone section, while retaining the Cross Stage Partial Networks (CSPDarkNet) structure from YOLOv5, replaces the initial 6 × 6 convolutional kernel with a 3 × 3 one, and incorporates the Efficient Layer Aggregation Network (ELAN) concept from YOLOv7, substituting the C3 module with the C2F module. The final Spatial Pyramid Pooling Fusion (SPPF) module is composed of convolutional blocks and max pooling layers. The Head section adopts a decoupled head approach, separating classification tasks and detection tasks, allowing the model to better focus on each task individually, thus improving efficiency. These enhancements enable YOLOv8 to achieve faster detection speeds, higher accuracy, and greater ease of use, making it suitable for various tasks including object detection, tracking, instance segmentation, image classification, and pose estimation.
YOLOv8 fundamentally frames object detection as a bounding box regression task, dividing input images into S×S grids to concurrently estimate object presence, position, and size. By predicting multiple bounding boxes per grid, each encoded with center coordinates, width/height parameters, and a confidence score, its grid-based regression mechanism enables efficient end-to-end detection. Thus, its real-time bounding box prediction capability serves as a foundational framework for executing rapid object localization and classification in dynamic visual scenes.
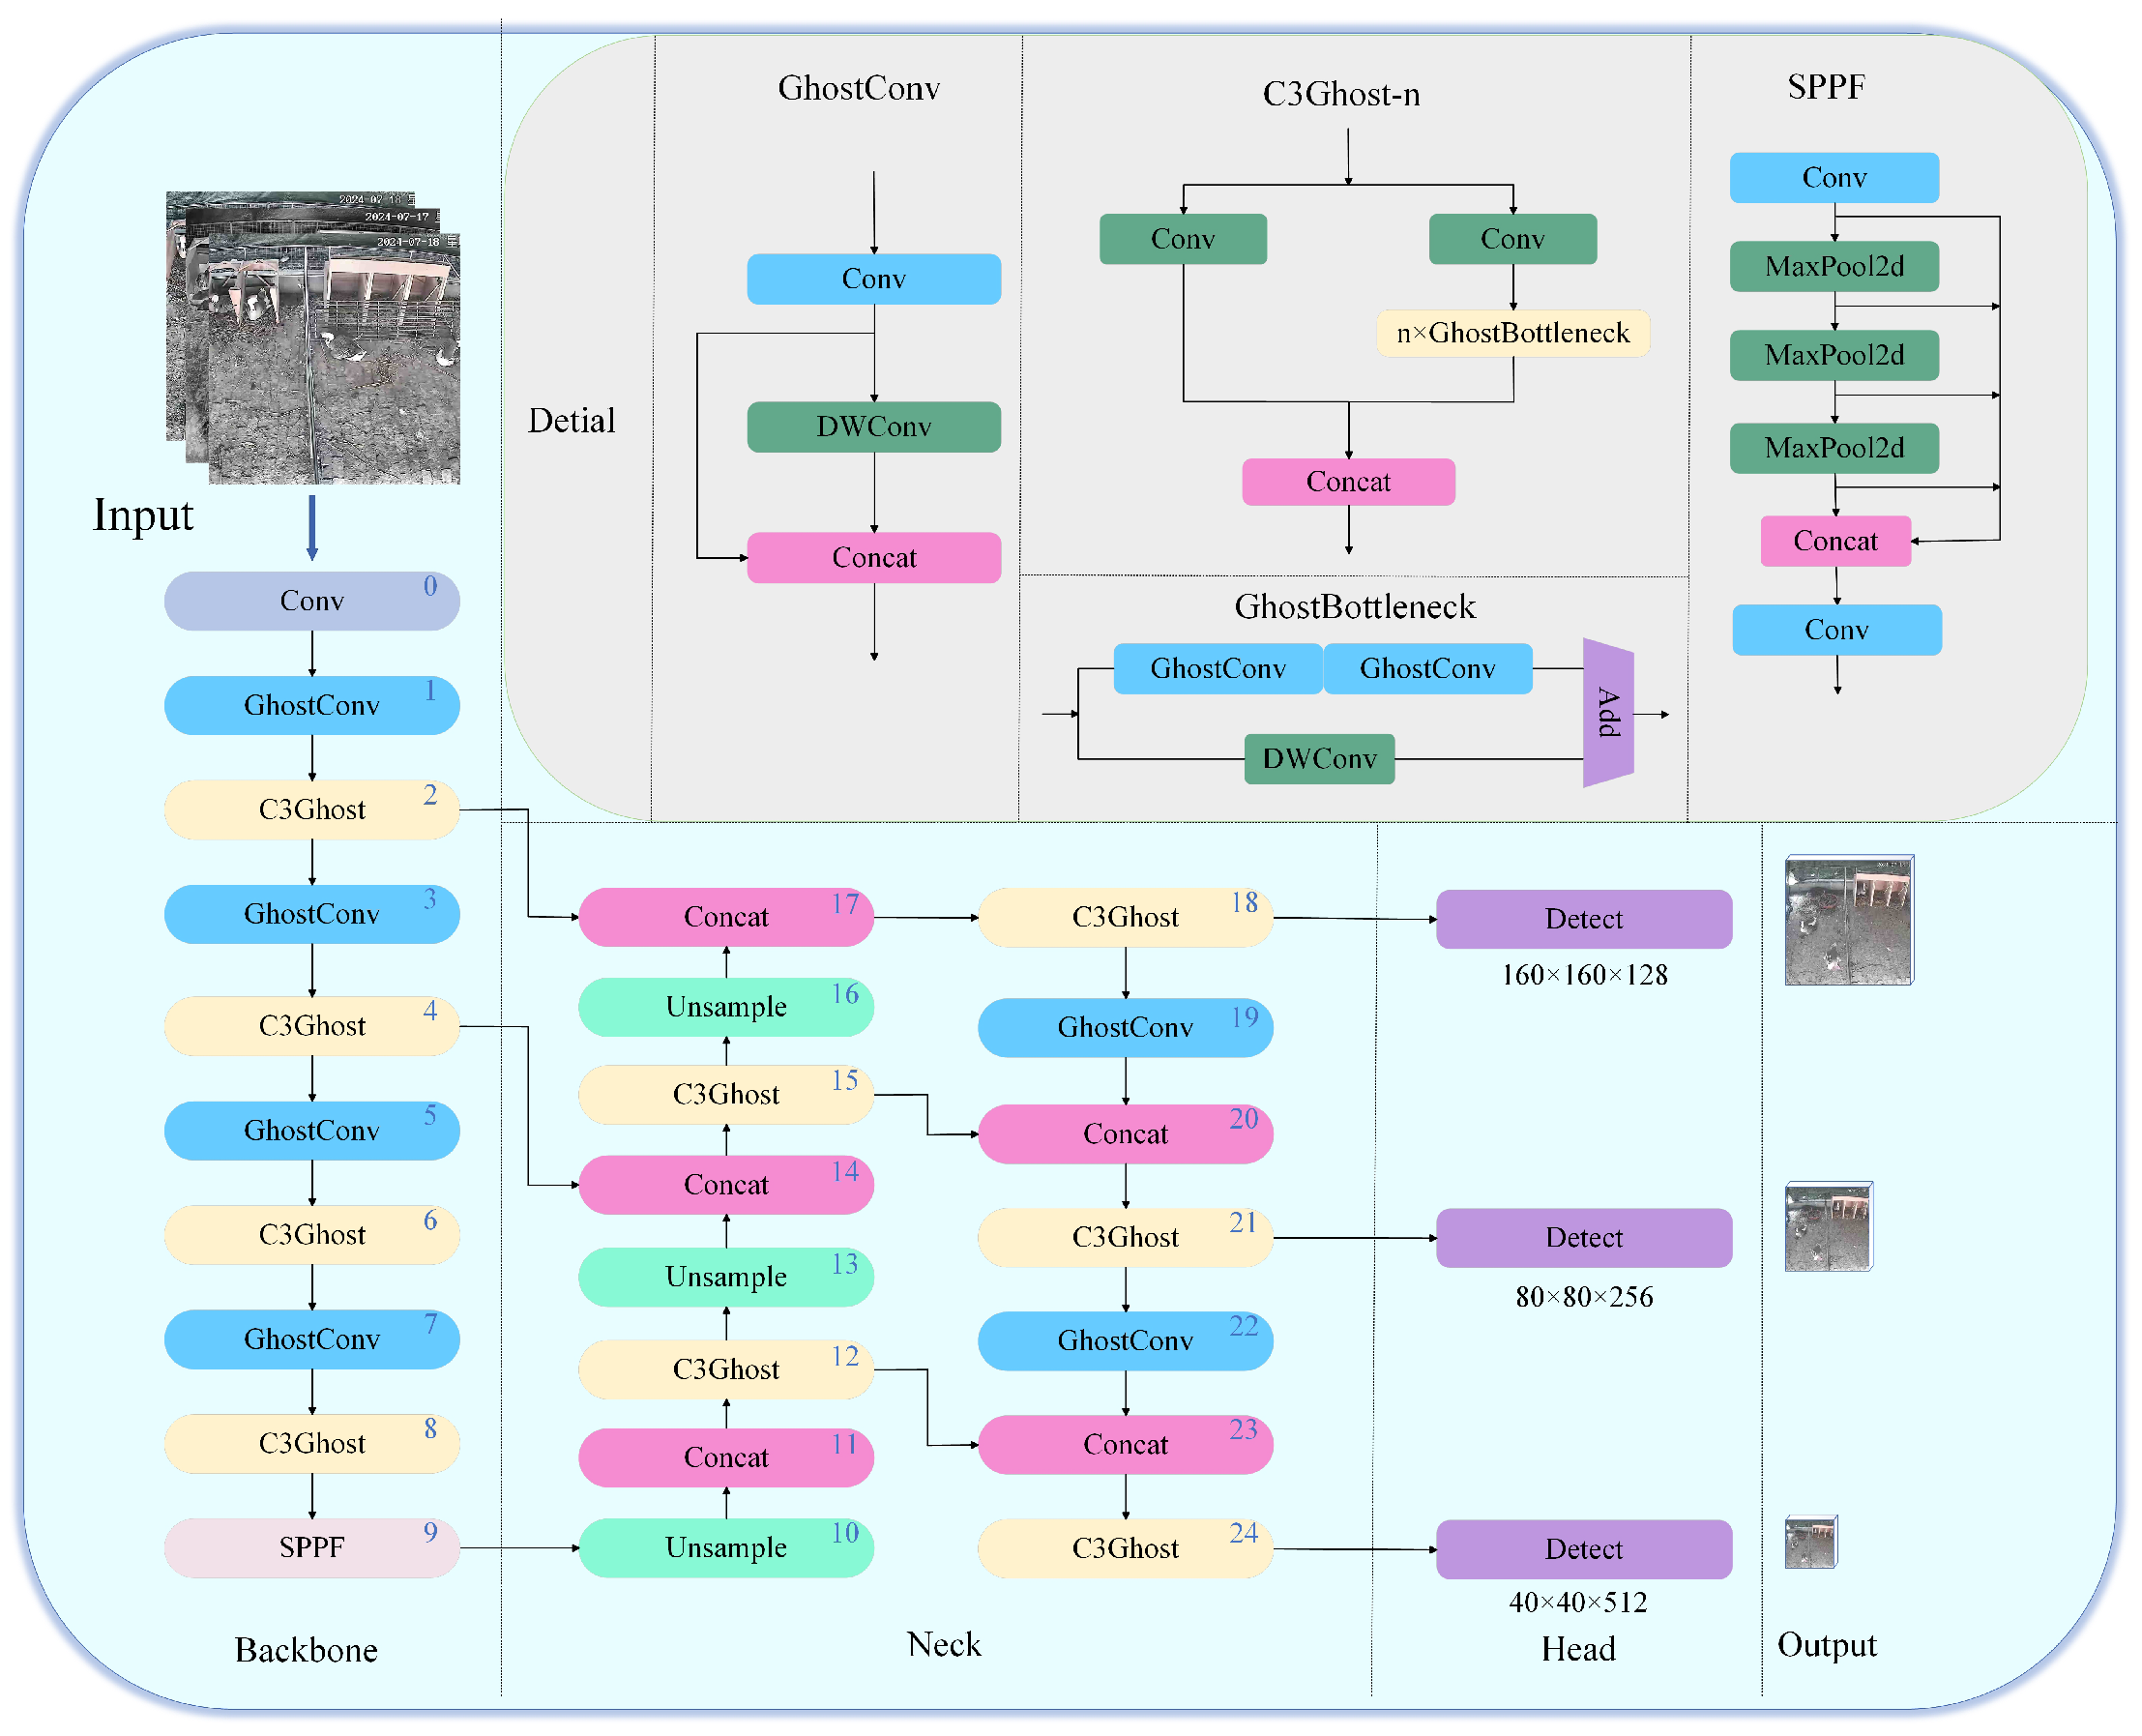
2.5.3. Design of YOLO-Goose
Considering the requirements for deploying the pedigree Lion-Head Goose matching algorithm on industrial monitoring systems in goose farms, we selected YOLOv8s as the initial object detection model. To improve the detection accuracy of small objects, such as individual Lion-Head Geese and goose eggs, we proposed an enhanced algorithm based on YOLOv8s, named YOLO-Goose. This work provides a foundation for optimizing goose egg matching accuracy in future studies.
Figure 12 illustrates the detailed network structure of the object detection model, with the numbers indicating the sequential order of the layers.
The main improvements and innovations compared to the YOLOv8s model are as follows:
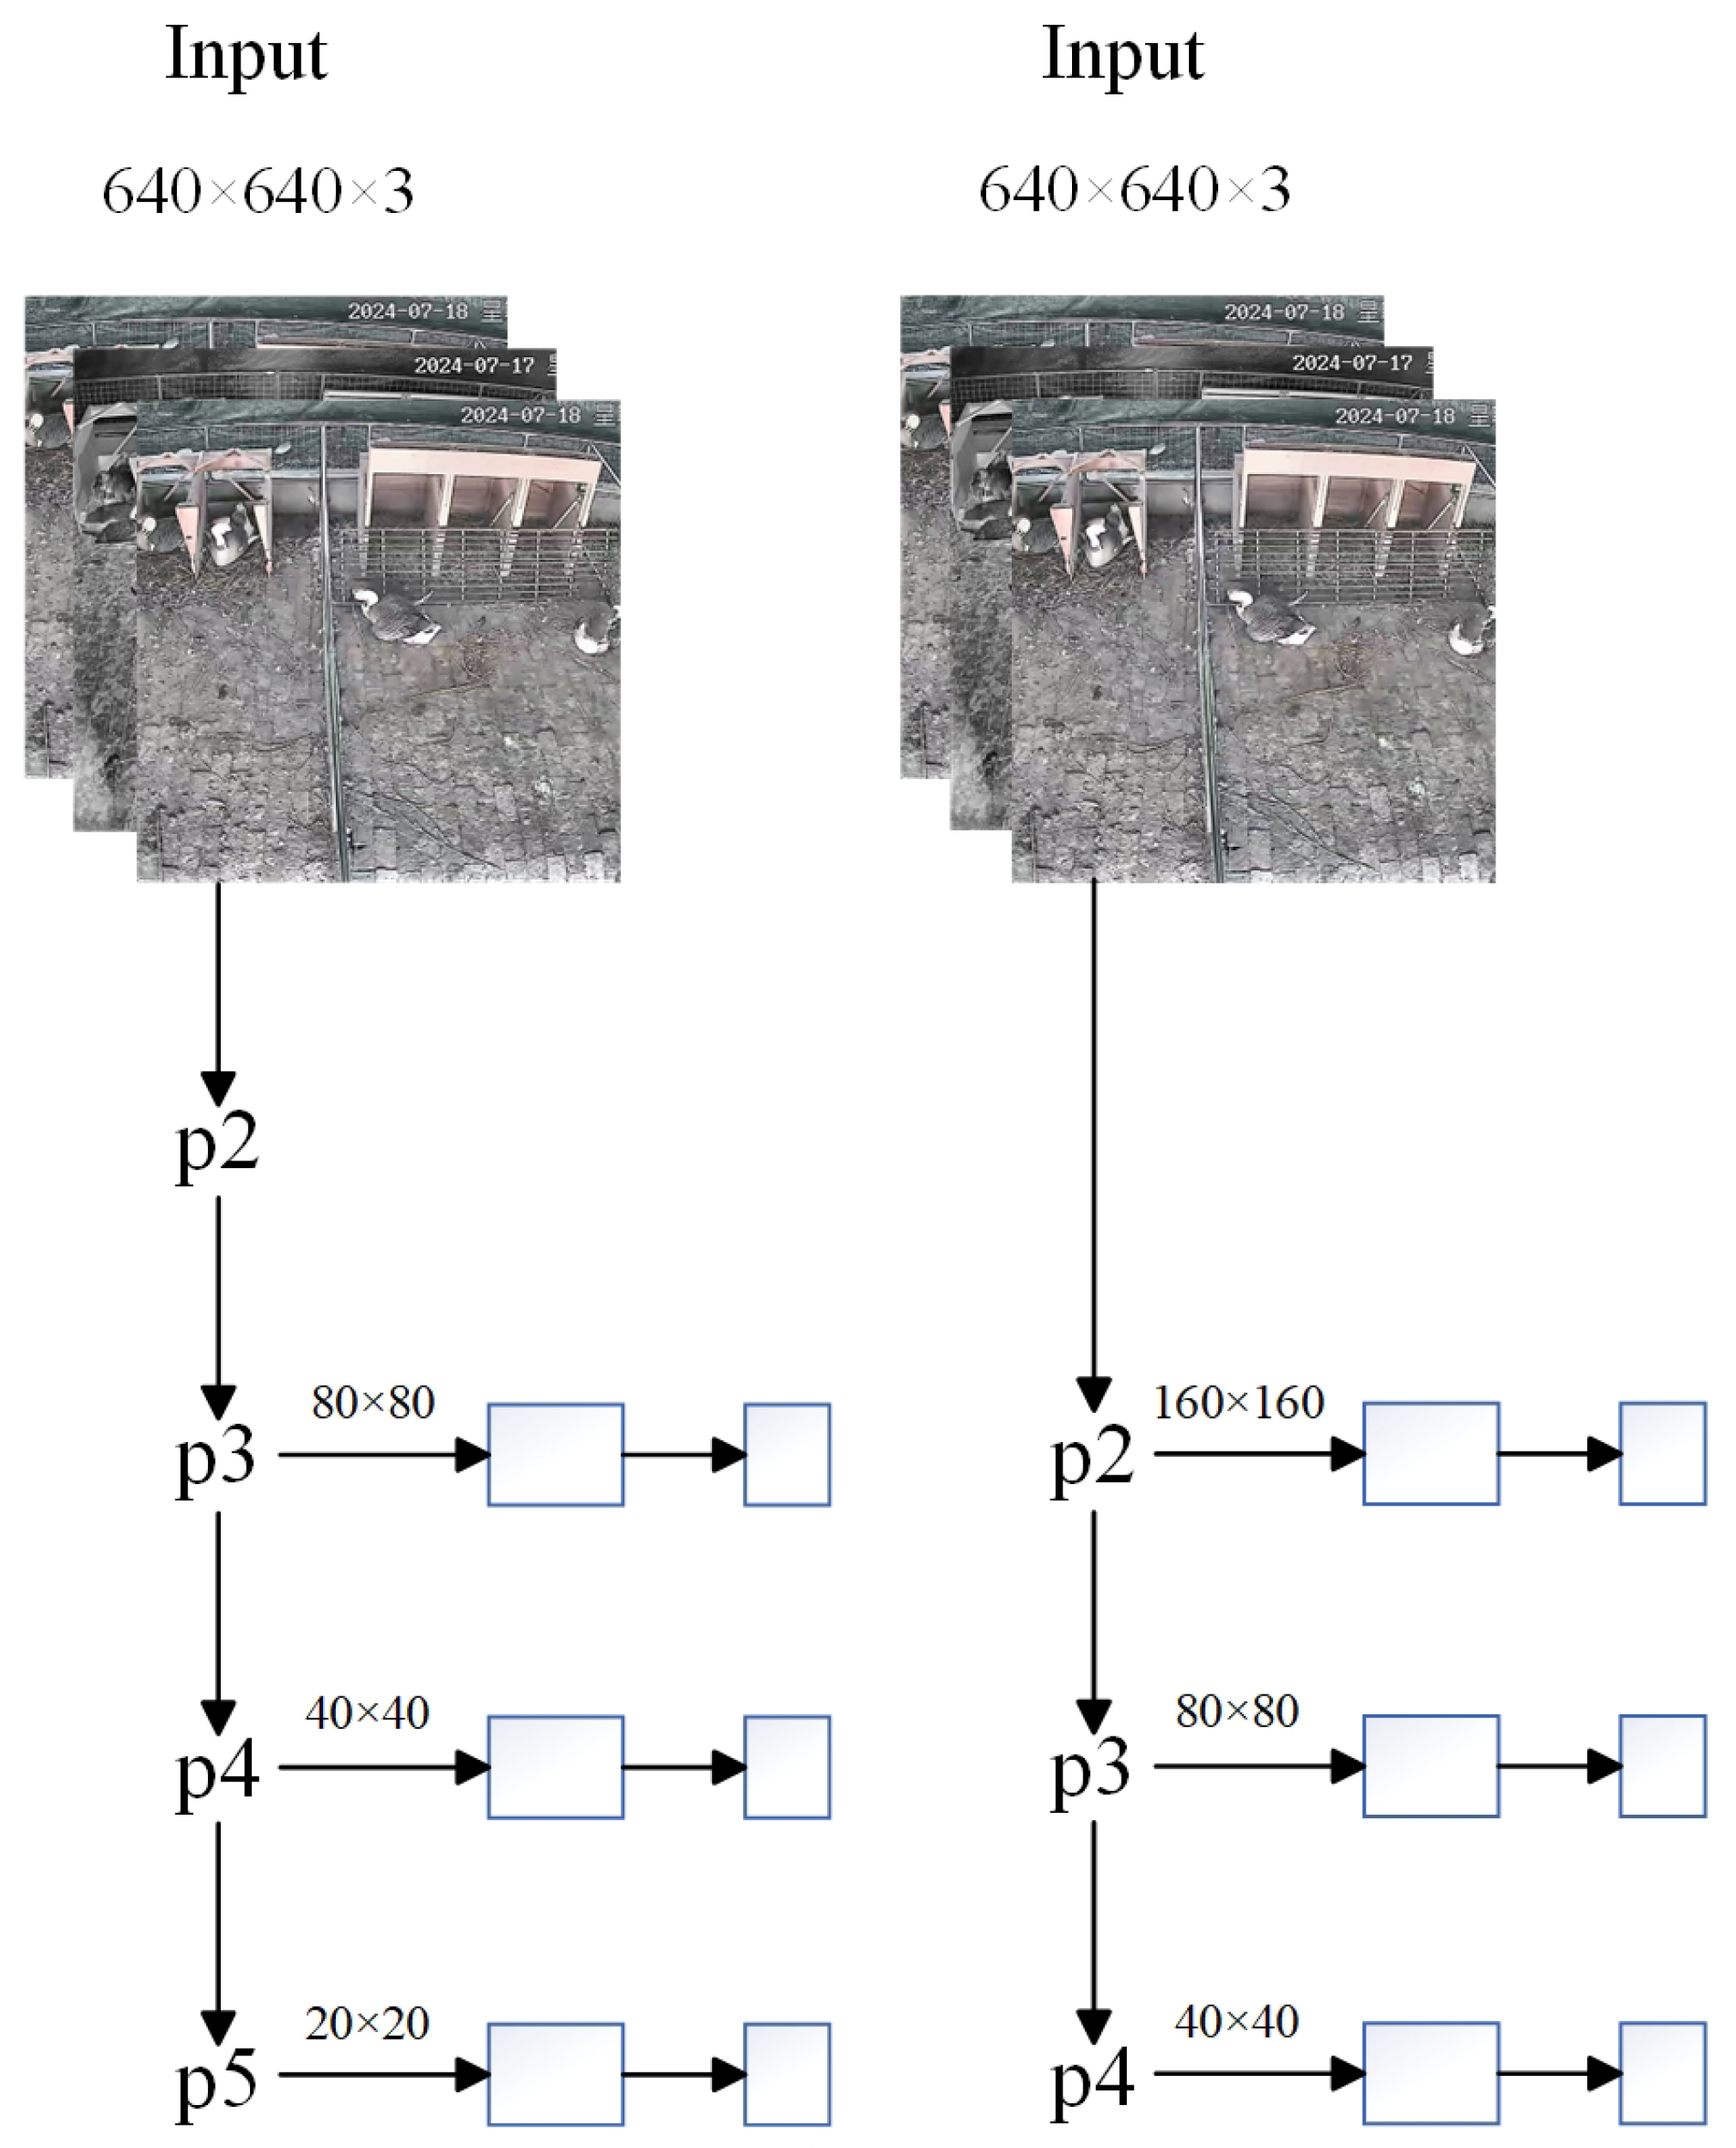
Refinement of Detection Layers: The standard YOLOv8s model included three detection layers: p3, p4, and p5. However, since the bounding boxes for Lion-Head Geese and goose eggs occupied less than 0.05 of the total image area, we optimized the network structure of the detection layers to enhance small object detection capabilities. A new small object detection layer was added, and layers that were insensitive to small objects were removed. This optimization increased the feature map size to capture more shallow information while reducing the number of network parameters and computational costs, all while retaining the original three detection layers. The original and improved structures are illustrated in
Figure 13.
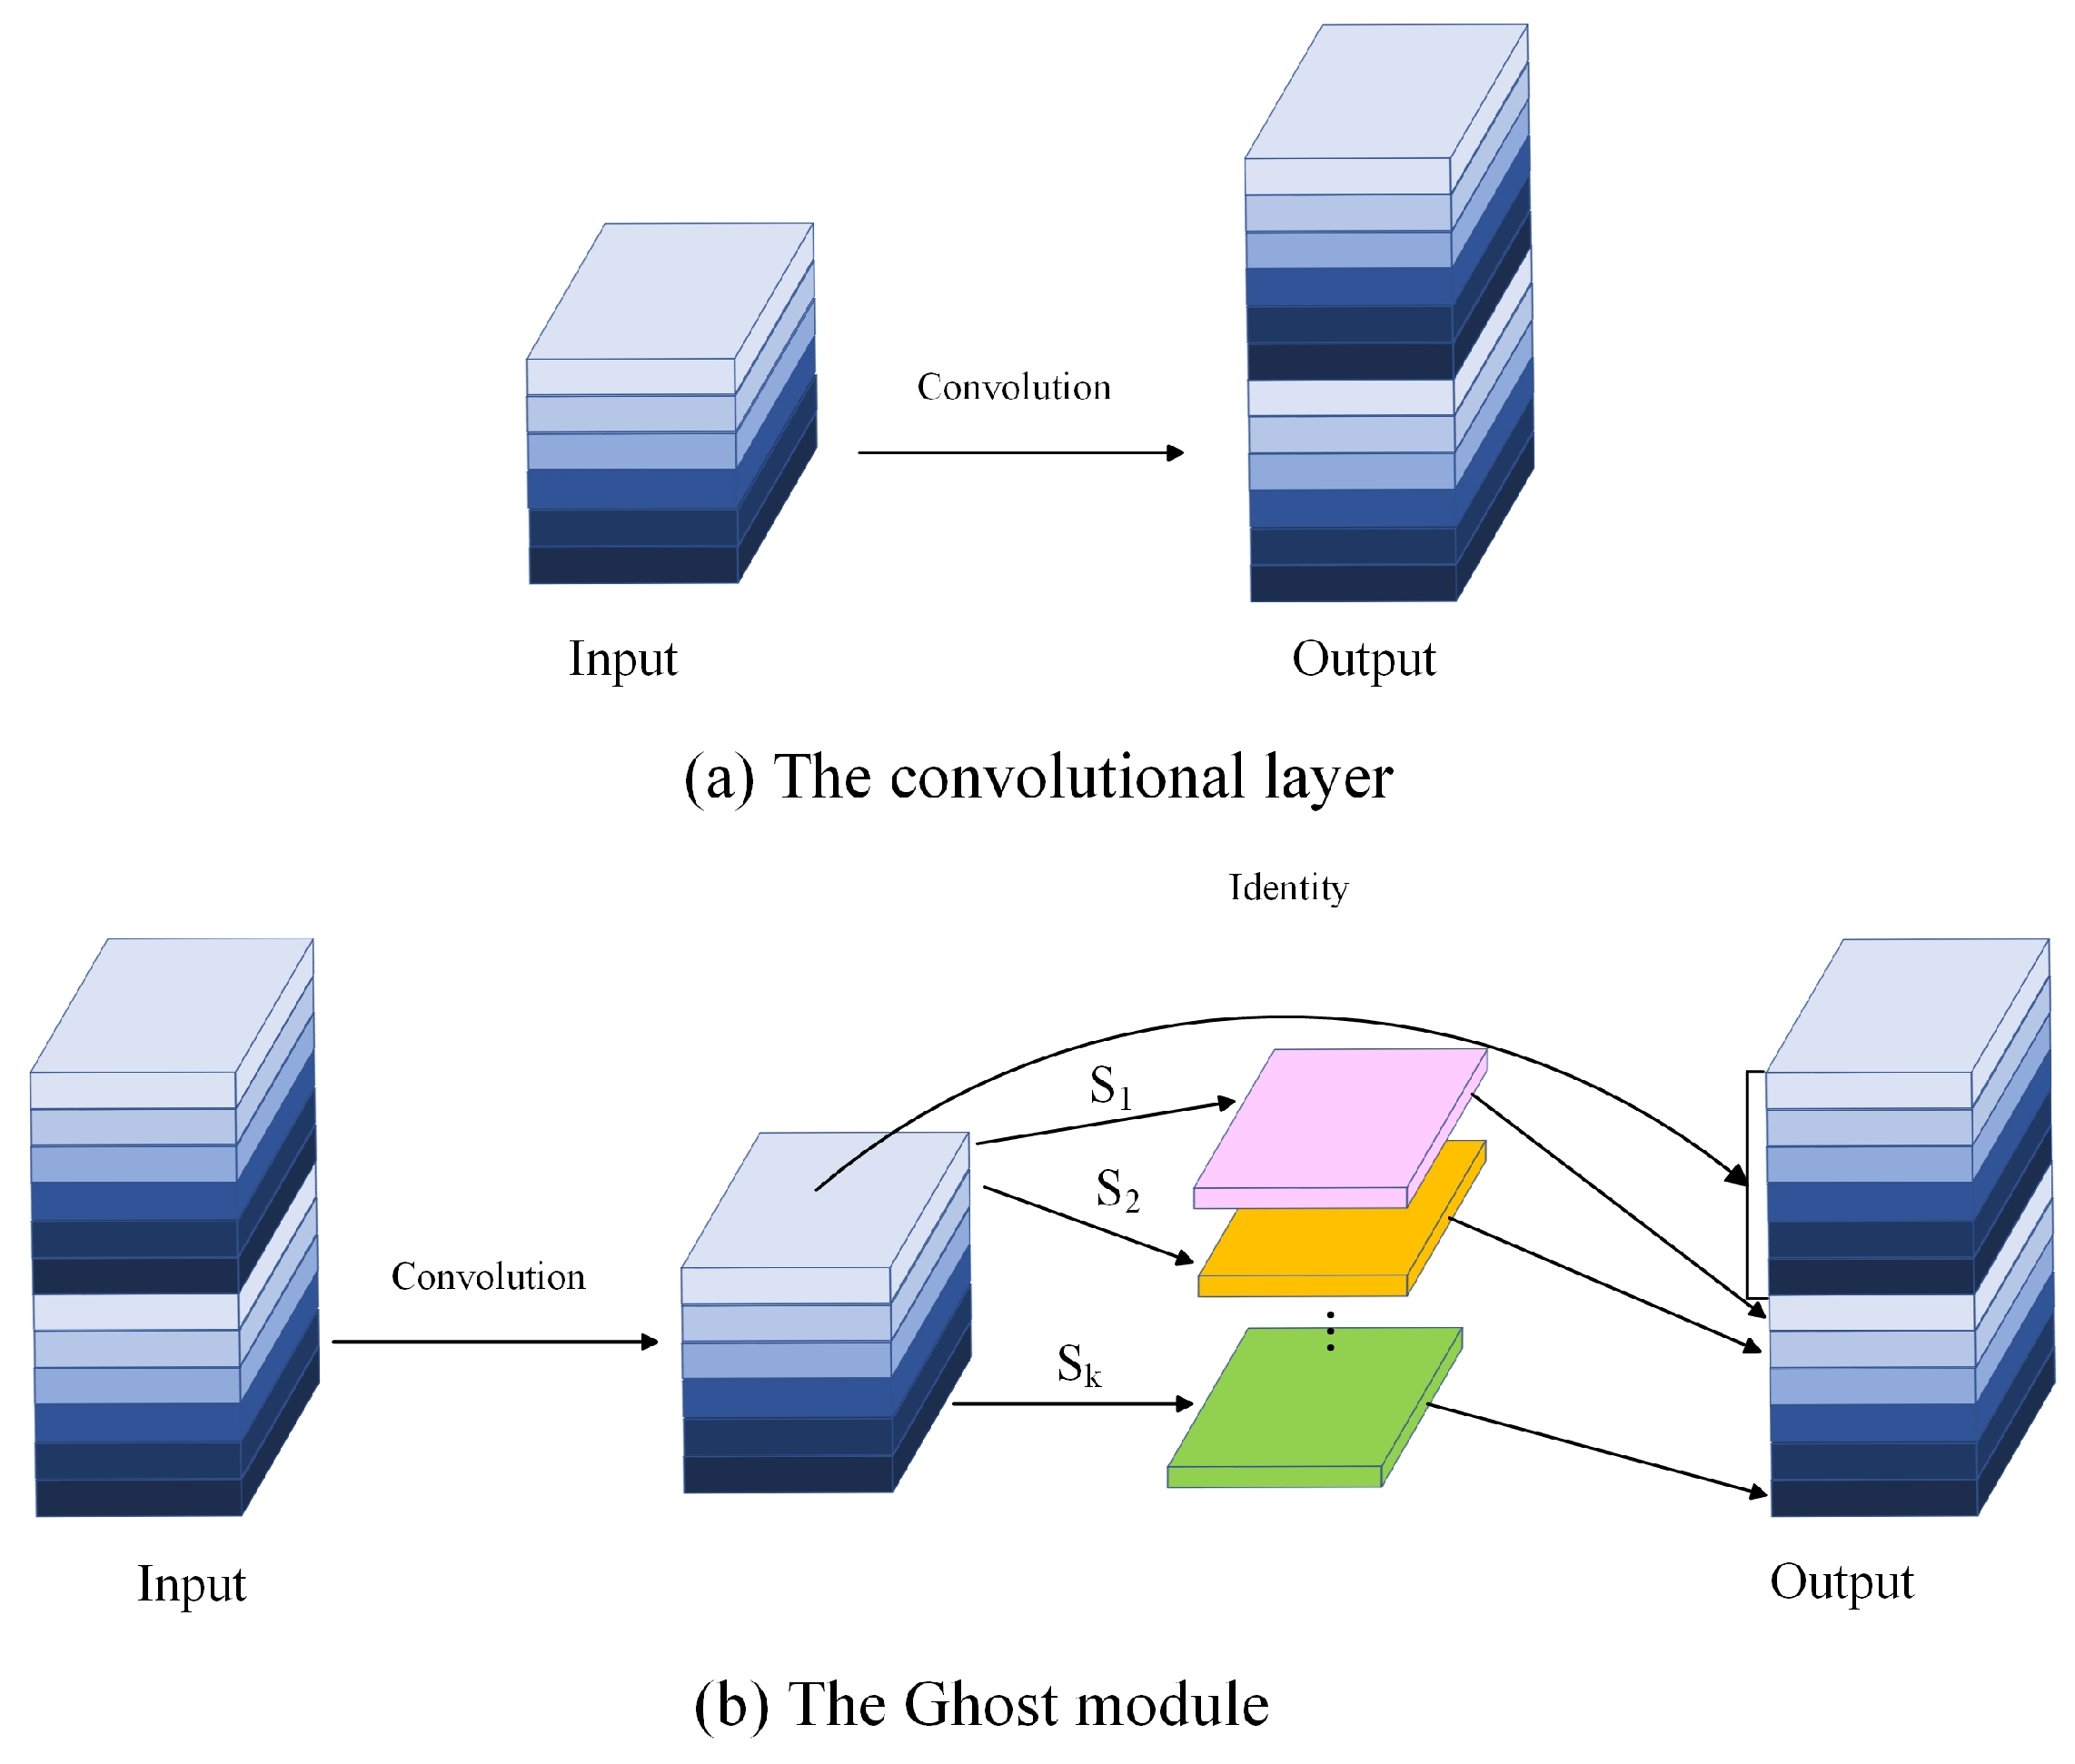
Lightweight Design: The addition of the p2 detection layer inevitably increased the model’s parameters and computational load. To ensure that the model met the post-processing detection speed requirements for the subsequent matching algorithm and practical deployment, we applied lightweight processing to reduce the model’s parameter count and computational cost. Specifically, we replaced the original C2f module and Conv layers in the Backbone and Neck with C3Ghost and GhostConv modules. The design of the Ghost module effectively reduced the computational complexity of the model, making it more lightweight and efficient. The comparison between standard convolution and the Ghost module is illustrated in
Figure 14.
The C3Ghost module was inspired by the Ghost Bottleneck concept [
36], which enhanced the feature extraction capabilities of the standard C3 module. By utilizing multiple GhostConv modules in sequence, it improved the ability to capture finer details in images, thereby increasing the accuracy of identifying the neck rings of individual Lion-Head Geese and detecting goose eggs. Compared to traditional network models, this approach not only enhanced performance but also significantly reduced the parameter count. By leveraging the low parameter count and low computational cost of the Ghost module, the parameters in the backbone layer were greatly reduced, achieving the goal of lowering model complexity.
Additionally, to enhance the model’s detection accuracy, we integrated an improved loss function into the detection head. This allowed the loss function to more accurately measure the overlap between the object frame and the predicted frame, thereby improving the detection precision of the Lion-Head Goose neck rings. In this study, we introduced the Generalized Intersection over Union (GIoU) loss function [
37], which provided a better measure of the overlap between the predicted box and the ground truth box. Compared to the traditional IoU loss function, GIoU accounted for the distance between the predicted and ground truth boxes, making it more precise. GIoU first calculated the intersection and union of the two boxes, then derived IoU by subtracting the intersection area from the union area. As illustrated in
Figure 15, A represents the ground truth box, B represents the predicted box, and C is the smallest enclosing rectangle for both boxes.
Subsequently, the GIoU loss function introduces a correction term to penalize the relative position and scale differences between the predicted and ground truth boxes, thereby providing a more accurate measure of similarity between the two boxes. Depending on the specific visual task, the same loss function may perform inconsistently, but GIoU often delivers superior results in certain specialized tasks. Therefore, in this study, we tested various commonly used loss functions and ultimately selected GIoU as the model’s loss function, as depicted in Equation (
1).
where
represents the ground truth bounding box,
represents the predicted bounding box, and
represents the area of the smallest enclosing rectangle that contains both boxes.
2.5.4. Matching Algorithm Description
To eliminate matching errors caused by the movement of Lion-Head Geese within the same shed, we introduced a post-processing step into the algorithm to further optimize the matching mechanism and ensure accuracy in practical applications. Since geese typically enter a nesting state before laying eggs, characterized by remaining stationary in the nesting area for an extended period [
38], we observed that the prelaying nesting time for Lion-Head Geese exceeds 5 min.
After initially detecting the individual geese, a nesting behavior assessment was incorporated into the algorithm. This final matching process not only matches the nearest goose to the egg based on spatial proximity but also considers the time sequence of the goose’s stationary nesting behavior before laying eggs. This post-processing step significantly improves the accuracy of the matching, ensuring that each egg is correctly associated with its corresponding goose. The processing flow of the matching algorithm is illustrated in
Figure 16.
The algorithm begins by performing real-time detection of Lion-Head Geese and eggs through video streams, identifying and extracting the bounding boxes and center coordinates for each object. Utilizing an enhanced YOLO model, the algorithm captures key elements in the images with high precision and low latency. To ensure data continuity and reliability, the algorithm records the position of the neck ring in each frame and calculates the Euclidean distance between consecutive frames of the goose, as illustrated in Equation (
2).
where
and
denote the horizontal and vertical coordinates of the center point of a goose egg within the image, while
and
represent the horizontal and vertical coordinates of the center point at the neck ring of a Lion-Headed Goose.
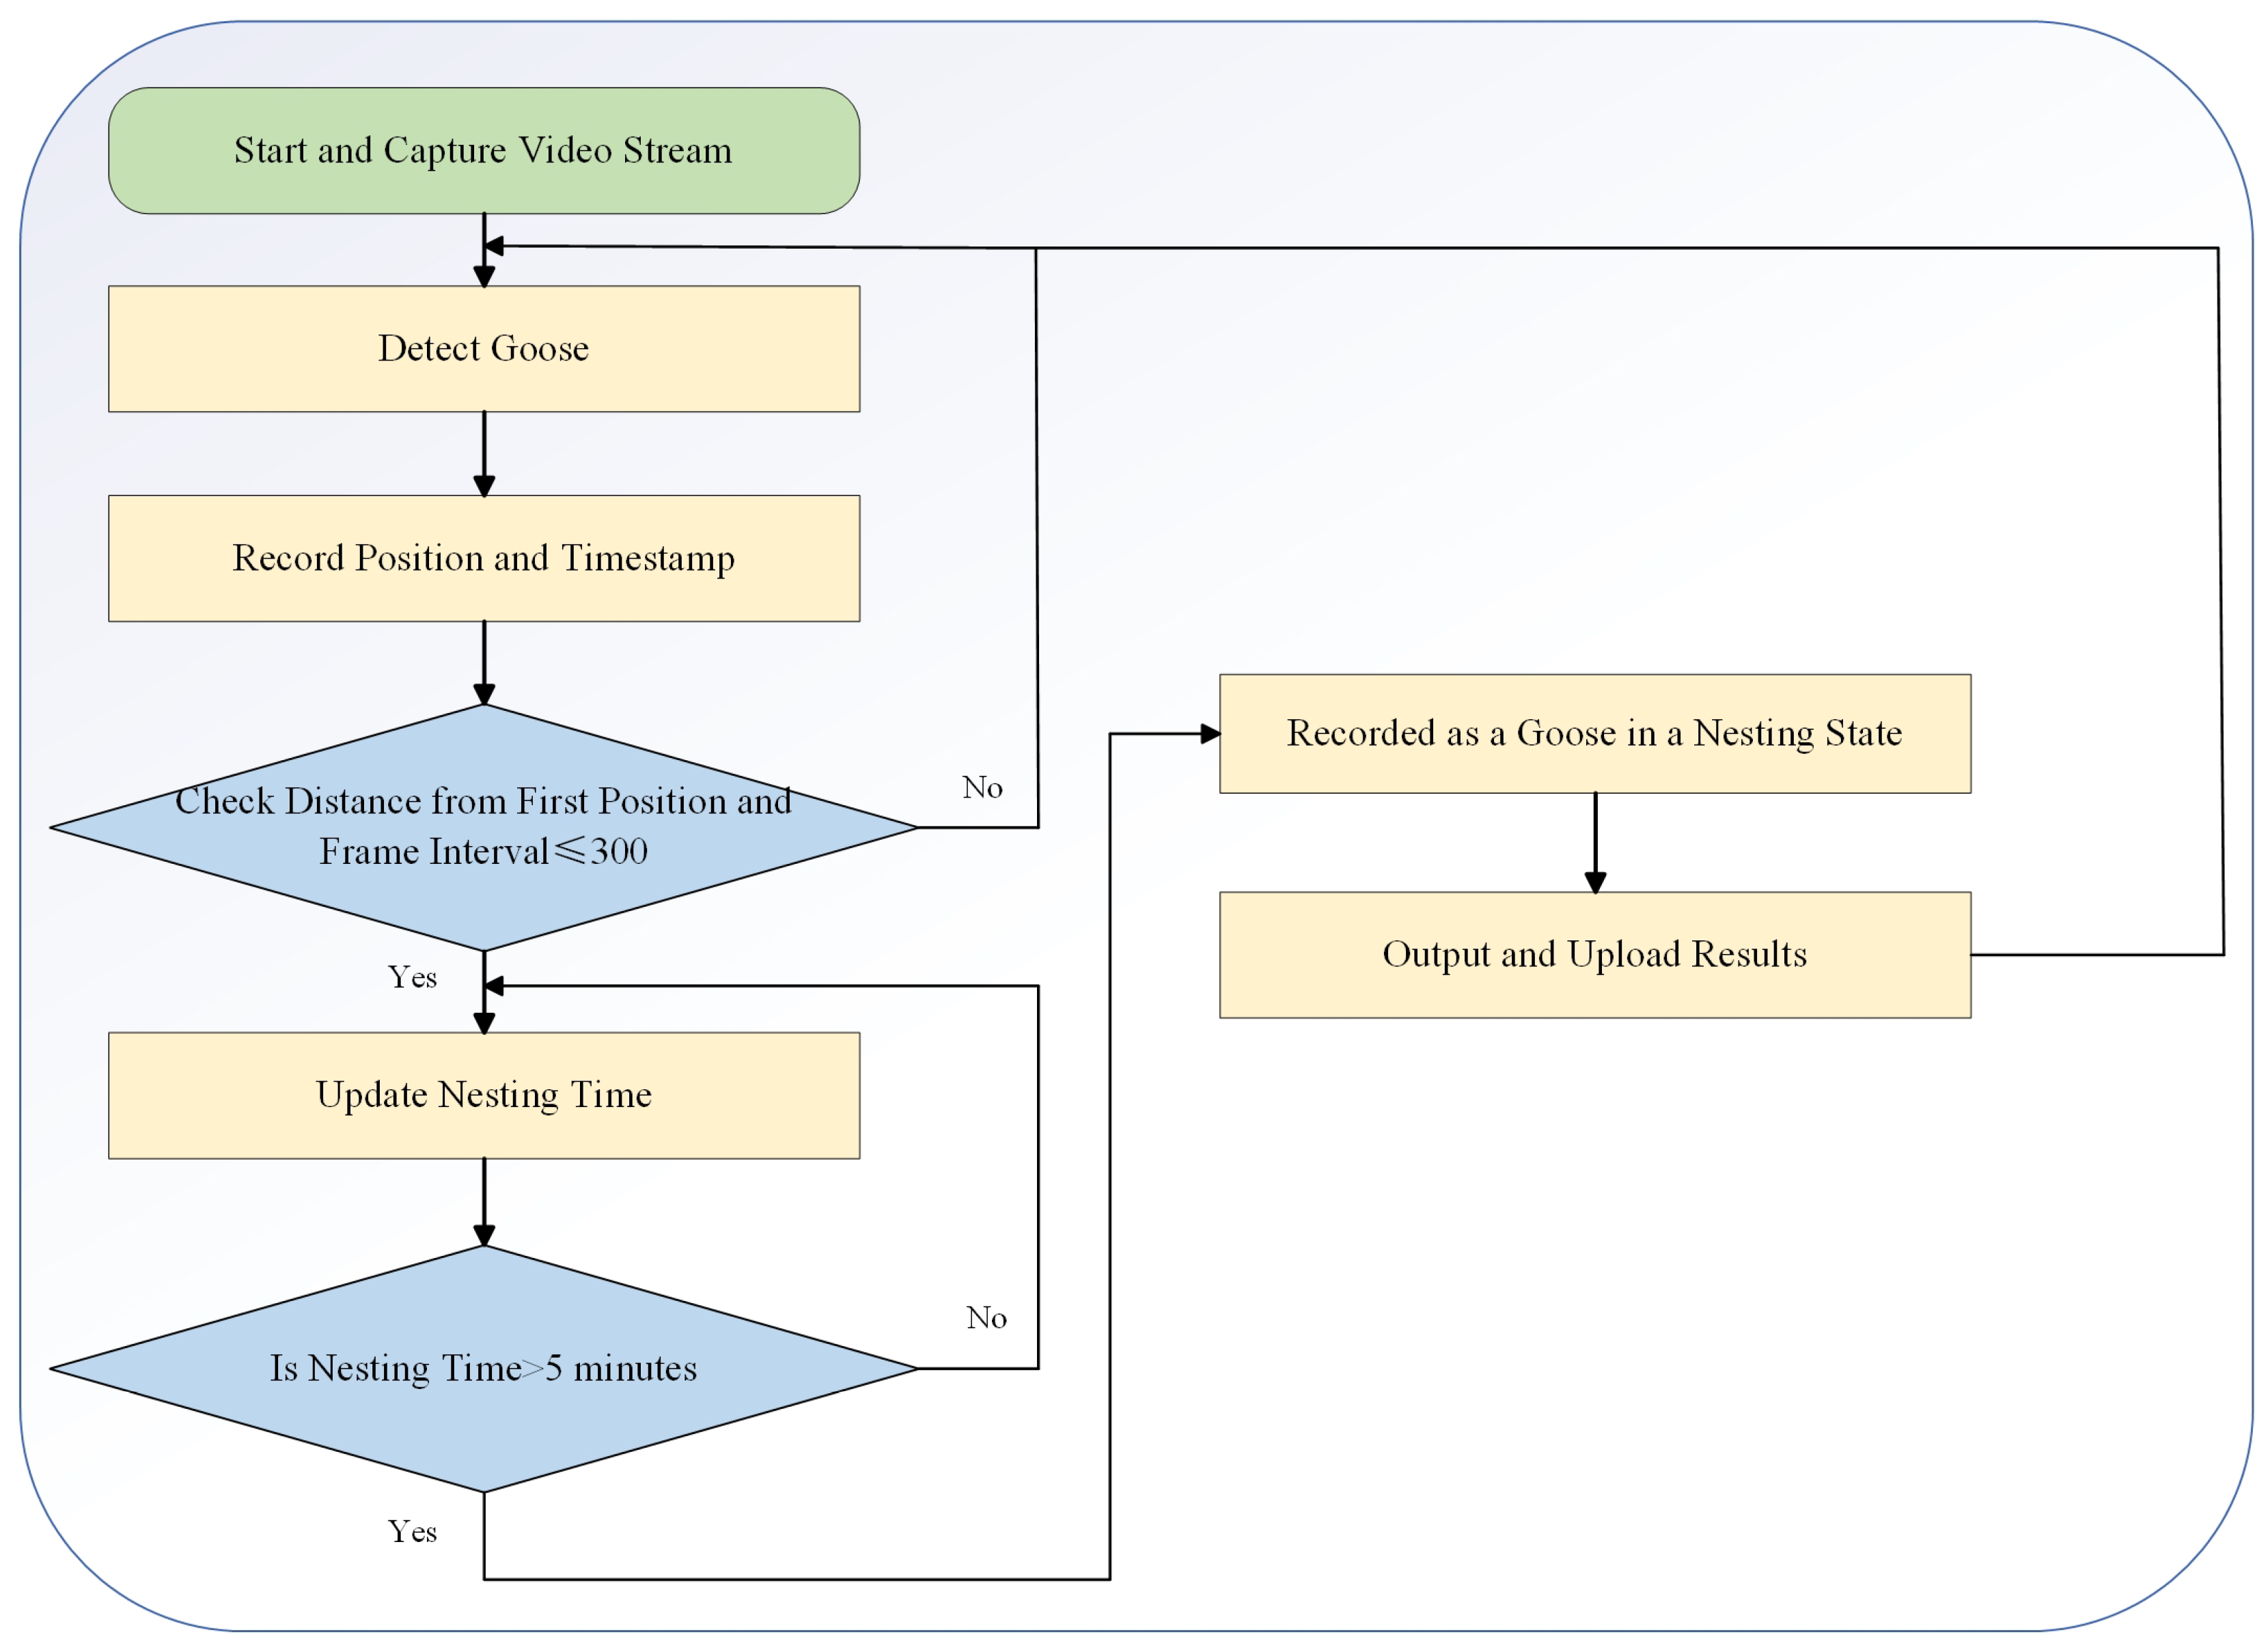
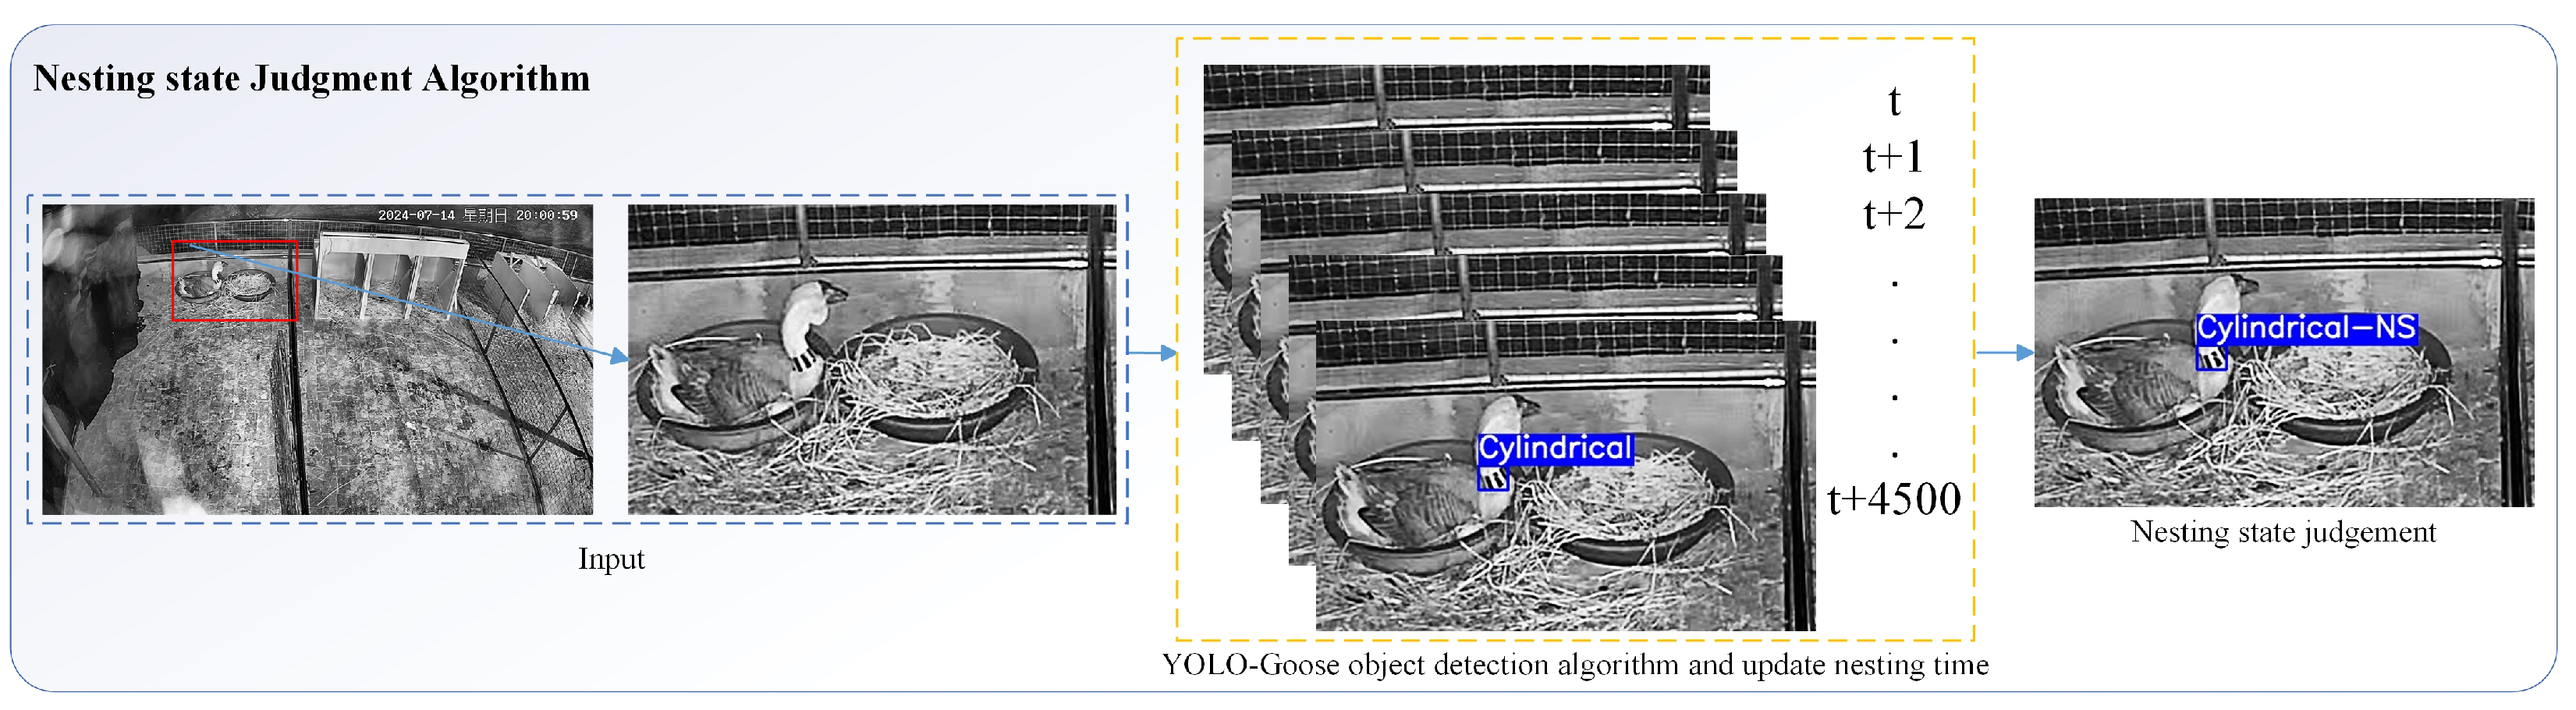
In identifying the nesting time of Lion-Headed Geese, the algorithm determines whether the goose is stationary by monitoring changes in the position of these center points. Specifically, when the detected positional variation of the neck ring is smaller than a predefined threshold and this condition persists for more than five minutes, the algorithm classifies the behavior as nesting. The algorithmic process is illustrated in
Figure 17. To prevent misclassification due to temporary occlusions or detection failures, the algorithm continuously tracks these positions across multiple frames. Moreover, the algorithm allowed for continued tracking of the goose’s state within a maximum detection interval of 300 frames (20 s) to ensure accurate detection of prolonged nesting behavior.
In the egg-matching process, when the algorithm detected a new egg, it backtracked up to 300 frames (20 s) of nesting time records to identify all Lion-Headed Geese that met the nesting criteria. By calculating the Euclidean distance between the egg and these geese, the algorithm accurately matched the individual goose to the egg it had laid. Upon a successful match, the algorithm recorded the pairing information, including the goose’s ID, the egg’s location, and the timestamp. All matching results were aggregated and uploaded to a database for subsequent behavioral analysis and management.
Finally, the algorithm processed all detection and matching results, storing and uploading key information, such as the nesting time of the Lion-Headed Geese, as well as the time and location of egg occurrences, to a cloud database. This information was integrated with data from other management algorithms to support further research and optimization of the system.
2.5.5. Algorithm Deployment
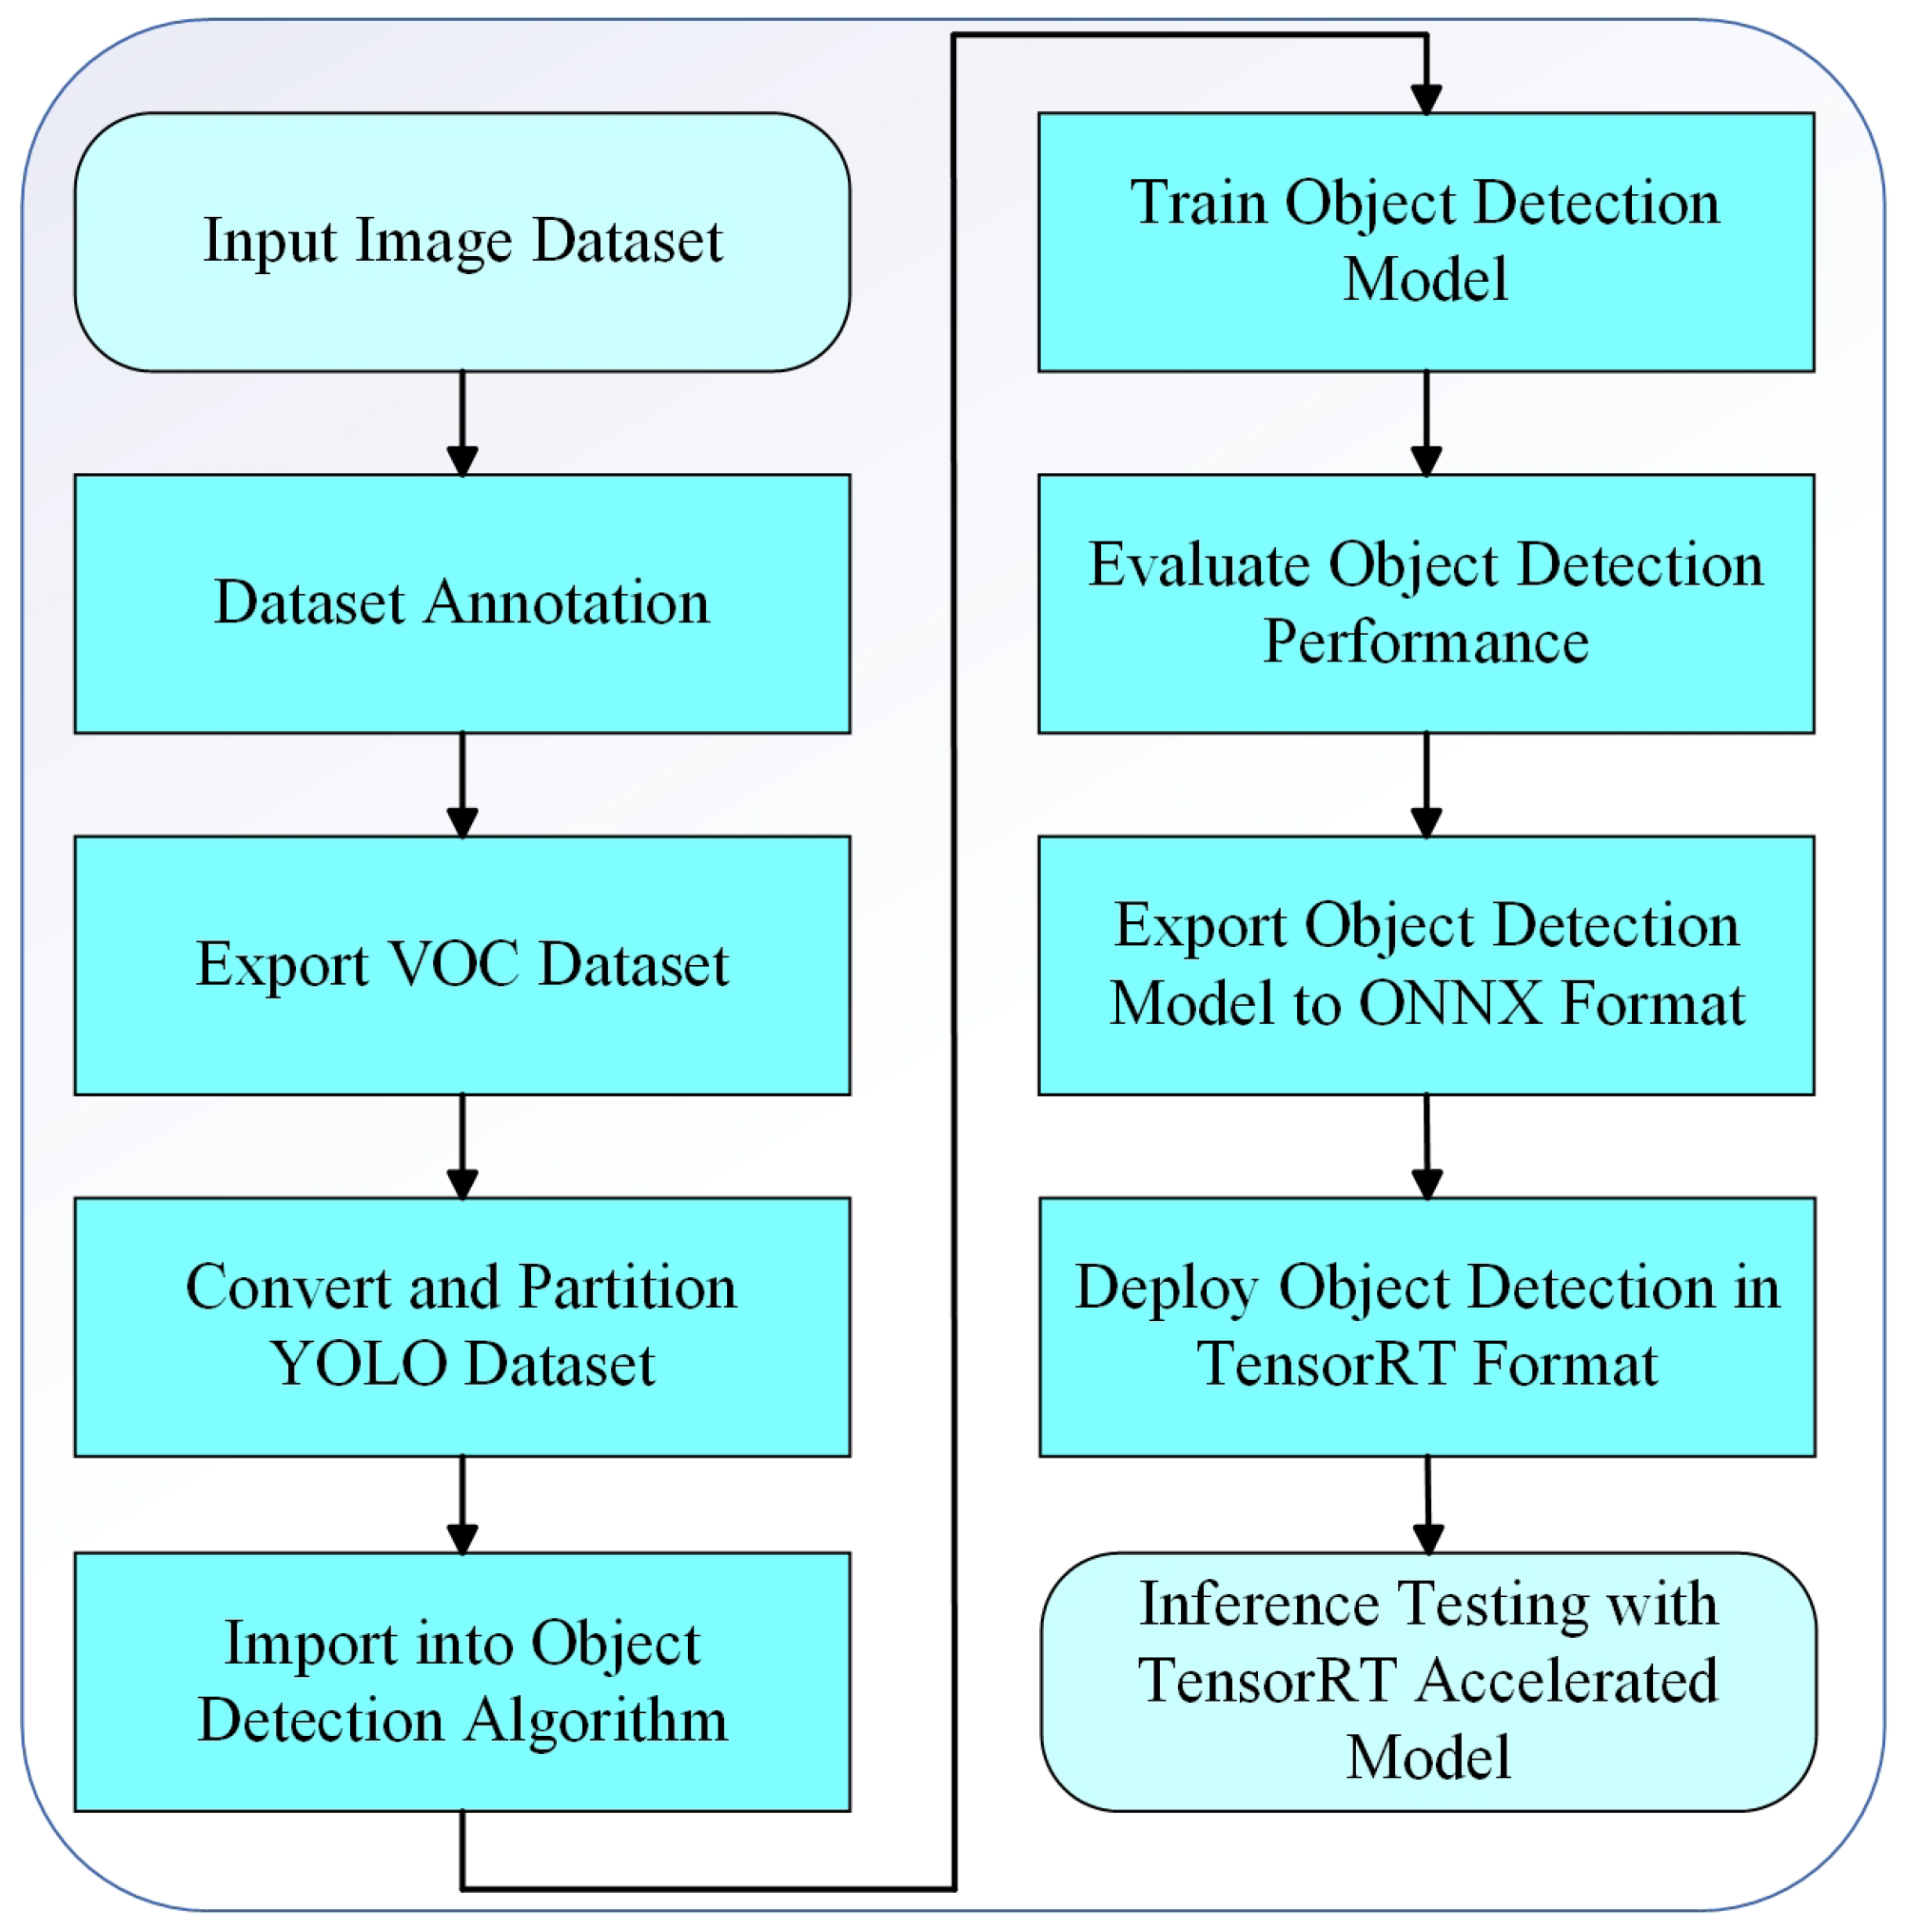
To facilitate the deployment of the algorithm on the industrial control computers in the goose farm, the object detection model was first converted to the Open Neural Network Exchange (ONNX) format. Subsequently, the ONNX model was converted to the TensorRT format. TensorRT is an optimized runtime library specifically designed for environments with low computational power and energy efficiency, enhancing the model’s operational efficiency.
Figure 18 illustrates the entire process of model training and deployment.
Input Image Dataset: Begin with a collection of images to be processed.
Dataset Annotation: Perform appropriate annotation and classification of the images.
Export VOC Dataset: Export the annotated dataset in the VOC format, which is a widely used standard format.
Convert and Split YOLO Dataset: Convert the VOC dataset into YOLO format suitable for object detection models, and then divide it into training, validation, and test sets.
Integrate Object Detection Algorithm: Integrate the dataset into the selected object detection framework.
Train Object Detection Model: Train the object detection model using the imported dataset.
Evaluate Object Detection Performance: Assess the performance of the trained model using relevant metrics and compare it to benchmark models.
Deploy the Detection Model in TensorRT Format: Convert the ONNX model to TensorRT format and initiate TensorRT for efficient inference.
Inference Testing with TensorRT Accelerated Model: Performance and functionalities are verified using the TensorRT accelerated model.
2.6. Evaluation Criteria
To evaluate the performance of the proposed YOLO-Goose object detection algorithm, several metrics were employed, including precision (P), recall (R), F1 Score, mean Average Precision (mAP50) at an IoU threshold of 0.5 and at IoU thresholds from 0.50 to 0.95 (mAP50:95), Floating-Point Operations (FLOPs), and parameters. P measures the accuracy of the model’s predictions, with higher values indicating greater accuracy. R assesses the model’s ability to detect instances, where a higher value indicates a lower miss rate. The F1 Score evaluates the balance between P and R, with values closer to 1 indicating better overall model performance. mAP50 represents the mean Average Precision at an IoU threshold of 0.5, while mAP50:95 represents the mean Average Precision across different IoU thresholds (ranging from 0.50 to 0.95), with higher values indicating better performance. FLOPs denote the number of floating-point operations required, and parameters represent the total number of learnable elements in the model, both of which are key indicators of model complexity.
P is the ratio of correctly predicted positive samples (True Positives,
TP) to the total number of samples predicted as positive. This includes both
TP and False Positives (
FP). A higher
P value indicates greater prediction accuracy, as shown in Equation (
3):
R represents the proportion of correctly predicted positive samples among all actual positive samples, including both true positives and false negatives. A higher
R value indicates fewer missed detections, as shown in Equation (
4):
The
F1 Score is the harmonic mean of
P and
R, giving equal importance to both when evaluating model performance. A score close to 1 indicates that both
P and
R are relatively high, as shown in Equation (
5):
AP represents the proportion of correct positive predictions, with higher values indicating fewer detection errors. The calculations are shown in Equations (
6) and (
7):
Since we are developing a six-class classification model, we set .
FLOPs are used to describe the computational complexity or execution speed of a neural network model. Specifically, FLOPs indicate the number of floating-point operations required for one forward pass through the model. Higher FLOPs values imply a greater computational demand by the model. In the context of convolutional neural networks (CNNs), FLOPs are calculated by considering the operations involved in applying convolutional filters across input feature maps, accounting for both multiplication and addition operations. The calculation for the FLOPs of a convolutional layer is expressed in Equation (
8):
where:
N: number of input feature maps (batch size or 1);
H: height of input feature maps;
W: width of input feature maps;
C: number of input channels;
K: number of output channels (filters);
R: height of convolution kernel;
S: width of convolution kernel.
Parameters refer to the total number of learnable elements in a neural network model, including weights and biases. The number of parameters in a convolutional layer depends on the number of convolutional kernels, the size of these kernels, and the number of input channels. Each kernel typically has an associated bias term, which is also counted as a parameter. The calculation for the parameters of a convolutional layer is given in Equation (
9):
where
K denotes the number of convolutional kernels (i.e., output channels),
C is the number of input channels,
R and
S represent the height and width of the convolutional kernels, respectively, and
b accounts for the bias term associated with each kernel.
For the evaluation of the matching algorithm and deployment performance, we established three key metrics: matching rate (MR), mismatching rate (MMR), and matching accuracy rate (MAR). MR represents the ratio of correctly matched goose eggs to the total, MMR indicates the proportion of incorrect matches, and MAR reflects the accuracy of successful matches. Additionally, FPS measures the speed at which the model processes data, with higher values indicating faster processing. Higher MR and MAR, alongside lower MMR and higher FPS, indicate superior matching performance, providing a comprehensive assessment of the YOLO-Goose algorithm’s effectiveness in both object detection and goose egg matching tasks.
MAR is calculated as the ratio of the number of correctly matched goose eggs to geese, divided by the total number of matching attempts. This metric measures the algorithm’s ability to accurately match goose eggs with the corresponding individual geese. A higher matching accuracy rate indicates better performance of the algorithm in matching, as shown in Equation (
10):
MMR is calculated as the ratio of the number of incorrectly matched goose eggs to geese, divided by the total number of matching attempts. This metric measures the incidence of incorrect matches made by the algorithm. A lower
MMR indicates fewer matching errors, as shown in Equation (
11):
MR is calculated as the ratio of the number of goose eggs successfully matched to geese, divided by the total number of goose eggs. This metric measures the algorithm’s ability to match goose eggs to geese. A higher matching rate indicates stronger recognition and matching capabilities of the algorithm, as shown in Equation (
12):
2.7. Experimental Setting
For this research, an Intel(R) Xeon(R) CPU E5-2620 v3 @ 2.40 GHz with 16 GB of RAM and an NVIDIA GeForce RTX 3060 GPU with 12 GB of RAM were utilized. The operating system was Windows 10 Home Edition, and the software environment included Python 3.9.0, CUDA 11.3, CUDNN 8.4.1, torch-1.12.1, and Visual Studio 2019. The hyperparameters used for model training are detailed in
Table 1.
The Batch_size and Num of workers directly impact the efficiency of data loading and training speed, and were configured to balance the computational load on the available hardware. The learning rate is a critical factor that influences the convergence of the model; if set too low, the model may converge slowly, while a rate that is too high can lead to divergence or oscillation in the loss function. To determine the optimal learning rate, we started with standard values and performed iterative adjustments based on the model’s performance during training. The epochs were set to ensure that the model undergoes sufficient learning without overfitting, with each epoch representing a full pass over the training dataset. The total number of iterations is directly related to the size of the dataset and the batch size, and is crucial for achieving an optimal balance between underfitting and overfitting. Momentum was carefully chosen to accelerate convergence and to stabilize the learning process by dampening oscillations in the gradient descent. The Optimizer employed for this model was Adam, selected for its adaptive learning rate capabilities and effectiveness in optimizing deep learning models.
The optimal learning rate (0.001) was selected based on convergence speed, loss stability, and validation performance. SGD was initially tested but replaced by Adam due to unstable gradient descent within 30 epochs. No scheduler or early stopping was used, as Adam maintained training stability and validation loss showed continuous improvement.
4. Discussion
In this study, to solve the problem of distinguishing individual Lion-Headed Geese and matching them with their eggs, we designed neck ring markers and developed the YOLO-Goose model. It uses lightweight computer vision for better neck-ring recognition, overcoming the drawbacks of manual and traditional methods. By integrating visual and spatiotemporal data, it enables non-contact, real-time parentage tracking in flat rearing settings. However, there are still some issues that need to be addressed during the trial.
In constructing the dataset, we focused on capturing the diversity and complexity of real-world goose farms. The collected dataset included geese of various ages and scenes under different lighting conditions, ensuring consistent model performance in dynamic farm environments. However, the limited angles of surveillance cameras in goose farms resulted in occasional occlusions or identity recognition failures. Future iterations of this project could consider using multiple cameras to enhance the comprehensiveness of the captured images within the goose houses.
The introduction of a spatiotemporal matching algorithm enabled the identification of Lion-Headed Geese with neck rings within an effective area, providing corresponding identity and spatial information. This allowed for the determination of nesting behavior based on the continuity of the geese’s spatiotemporal presence, thereby refining the accuracy of egg matching. However, the current localization method primarily relied on temporal and spatial positioning to achieve precise egg-laying identification and behavioral analysis. Future work will explore more advanced identification and localization techniques, such as incorporating temperature variations during nesting, to further enhance the accuracy and reliability of egg matching [
39].
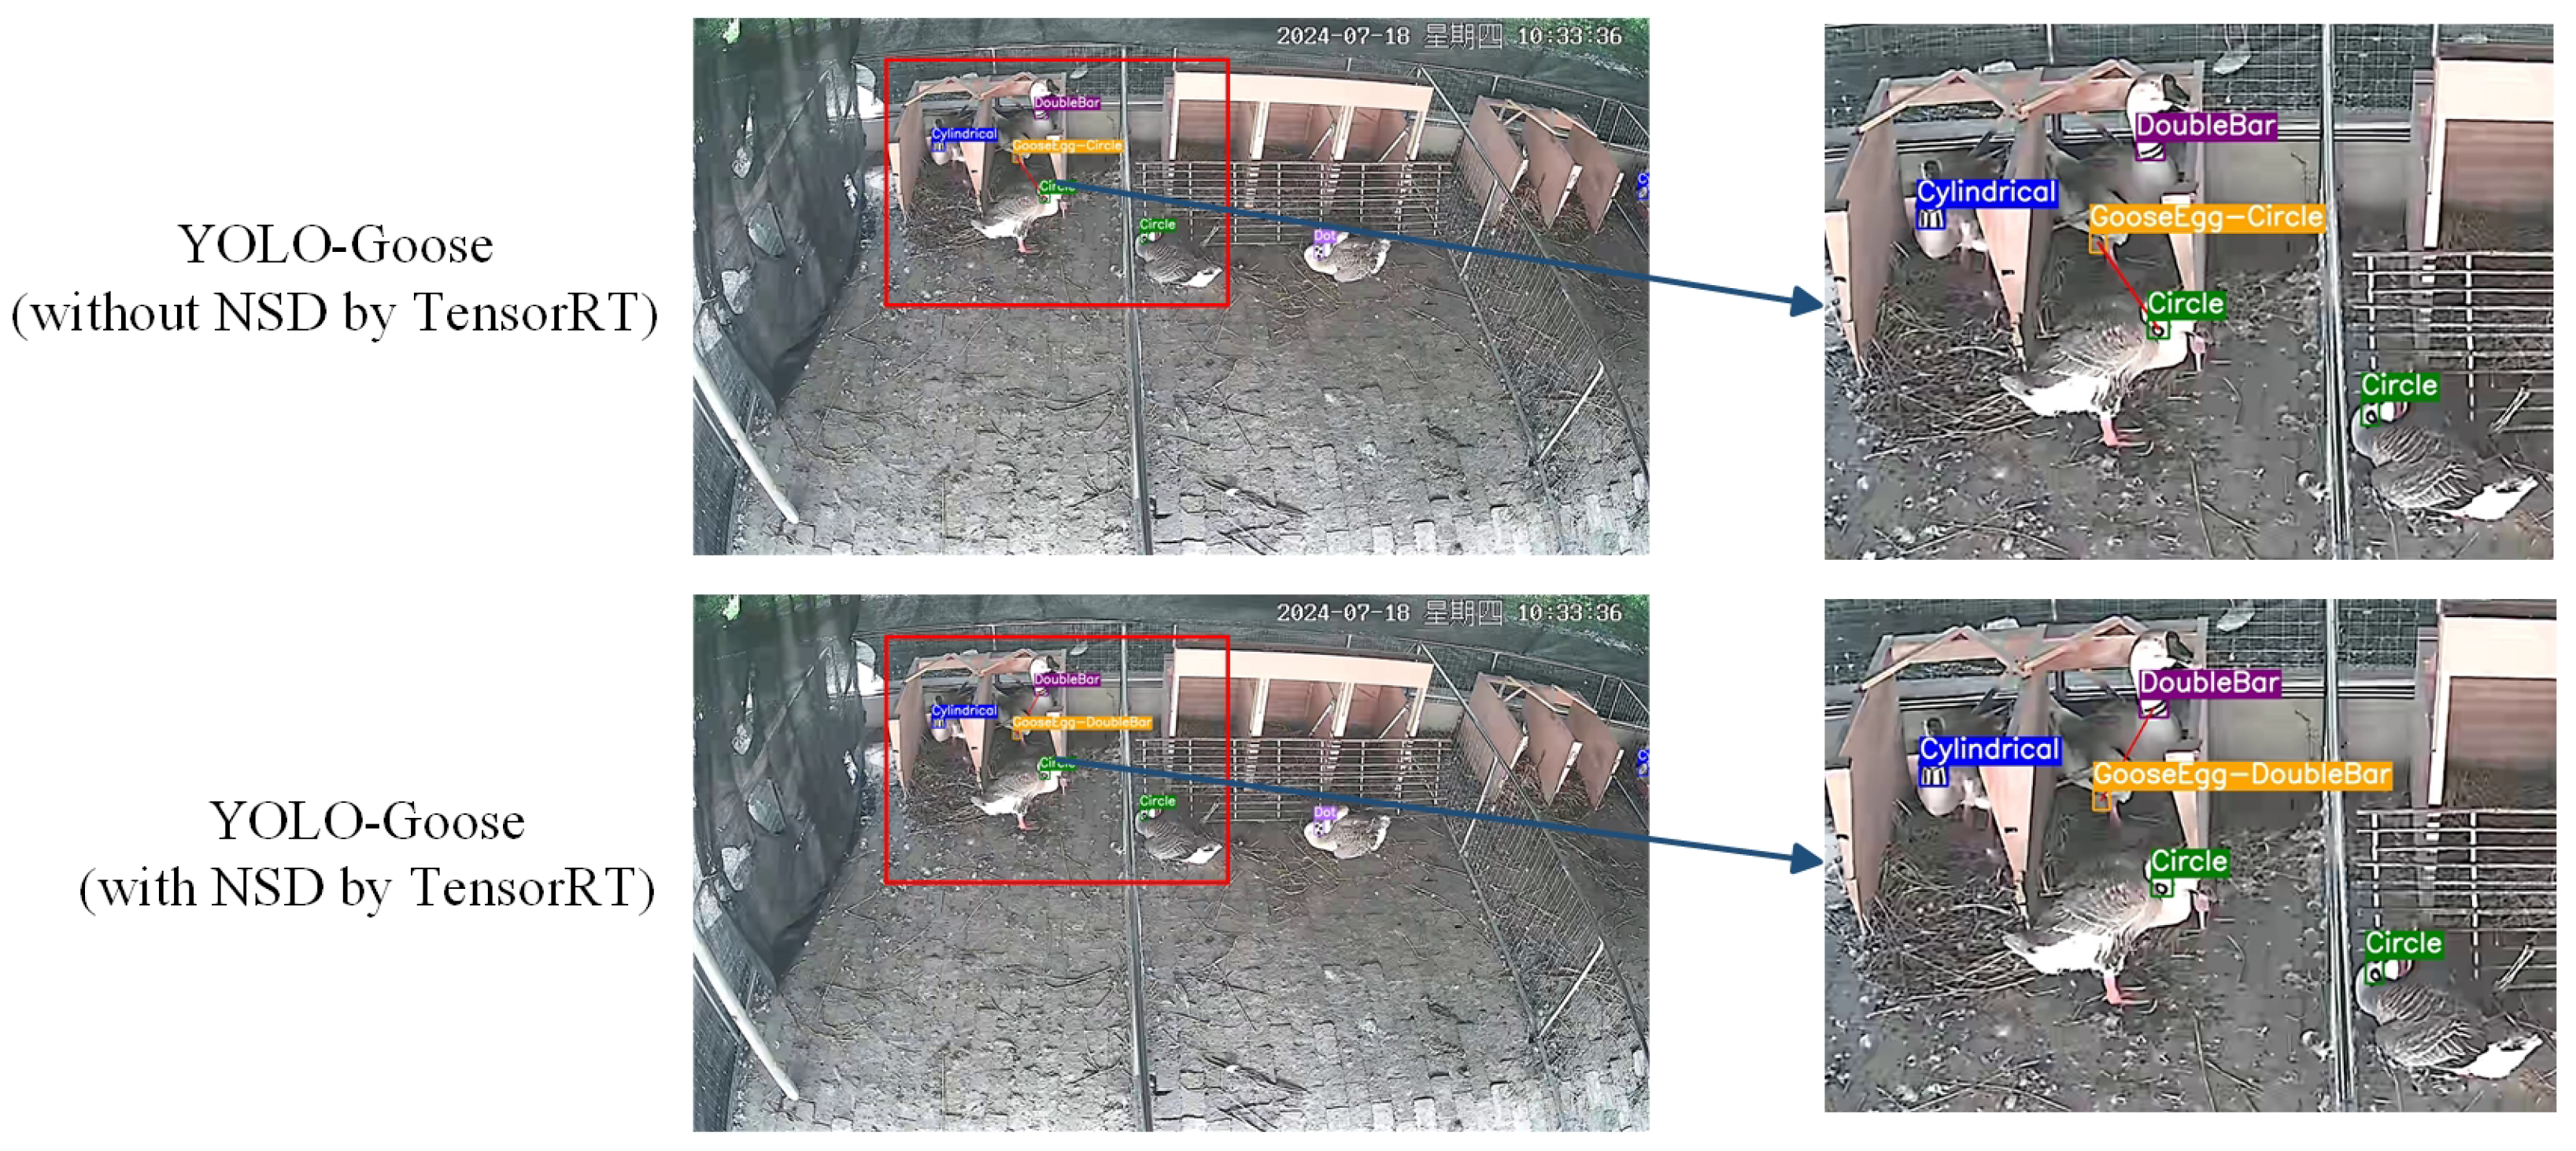
During the matching accuracy experiments of the matching algorithm, there was a problem that the camera was blocked for a long time, which was mainly due to the fact that the Lion-Headed Geese were far away from the camera, and their neck rings were blocked by the laying nests, as shown in
Figure 23. This prevented the system from recognizing the individuals in a timely manner. The design of the structure of the egg-laying area, therefore, has an impact on the accuracy of the algorithm. Specifically, optimizing the egg-laying region to ensure that the camera angle is not obstructed and to enhance the visibility of the neck ring is critical to improving recognition reliability in future iterations.
Overall, this study provides new perspectives and tools for breeding Lion-Headed Geese, though there remains room for further optimization and refinement. Through continuous technological iteration and algorithmic innovation, we aim to achieve more efficient and accurate systems for individual goose identification, egg matching, and breeding monitoring in the future.
5. Conclusions
As a rare waterfowl species of high economic value characterized by low annual fecundity, the Lion-Headed Goose presents critical challenges in precision breeding management due to its flat rearing behavior and phenotypic homogeneity within lineages. Conventional methods for parentage tracking, manual observation and invasive RFID systems, prove inadequate for reliable real-time identification in dynamic farm environments. To address these limitations, we propose YOLO-Goose, a specialized computer vision framework that simultaneously resolves two fundamental challenges: individual identification through geometric neck ring patterns, and spatiotemporal egg-laying event attribution in non-cage rearing systems. Our architecture integrates three key innovations: integration of an enhanced small target detection layer, a GhostNet-optimized backbone for efficient edge computing, and a GIoU-optimized loss function for precise ring localization. Comprehensive experiments demonstrate the model’s superiority over baseline YOLOv8s, with Lionhead Goose Individual and Egg Identification achieving mAP50 of (96.4%) and MAR of (94.7%), while reducing parameters by (67.2%) and maintaining real-time processing capabilities. Through spatiotemporal fusion of detection outputs and behavioral trajectory analysis, the system enables reliable goose–egg matching without dependency on static nesting assumptions or physical tags.
Current limitations involve intermittent identifier occlusions from fixed camera perspectives and ambiguous scenarios in densely populated nesting zones. Future development will prioritize two strategic enhancements: multimodal sensor fusion incorporating thermal imaging and pressure-sensitive flooring to complement visual data during occlusion events, and adaptive anomaly detection through machine learning-powered behavioral analytics, identifying deviations from typical laying patterns (e.g., prolonged nest loitering without oviposition or aberrant egg placement) to enable predictive husbandry interventions.
Overall, the development of the YOLO-Goose model not only enhances the operational efficiency of waterfowl farming but also demonstrates the practicality and potential of deep learning technologies in automating the waterfowl industry. This study provides technical support and new research avenues for the field, contributing to the advancement and development of precision livestock farming technologies.


 ,
, 


