Abstract
This study develops a synergistic optimization method of multiple gates integrating hydrodynamic simulation and data-driven methods, with the goal of improving the accuracy of water distribution and regulation efficiency. This approach addresses the challenges of large prediction deviation of hydraulic response and unclear synergy mechanisms in the coupled regulation of multiple gates in irrigation areas. The NSGA-II multi-objective optimisation algorithm is used to minimise the water distribution error and the water level deviation before the gate as the objective function in order to achieve global optimisation of the regulation of the complex canal system. A one-dimensional hydrodynamic model based on St. Venant’s system of equations is built to generate the feature dataset, which is then combined with the random forest algorithm to create a nonlinear prediction model. An example analysis demonstrates that the optimal feedforward time of the open channel gate group is negatively connected with the flow condition and that the method can manage the water distribution error within 13.97% and the water level error within 13%. In addition to revealing the matching mechanism between the feedforward time and the flow condition, the study offers a stable and accurate solution for the cooperative regulation of multiple gates in irrigation districts. This effectively supports the need for precise water distribution in small irrigation districts.
1. Introduction
Long water transmission distances, huge water delivery, intricate management and scheduling procedures, and the dynamic regulation of any building will result in changes in local water conditions, which are all features of irrigation district water transmission and distribution systems [1,2]. The fine control of irrigation channel control buildings is necessary to ensure that water flows from the upstream propagation of water distribution points to complete the distribution of water. This is because improper regulation makes it easy for channel overflow, abnormal fluctuations in water level, and other phenomena to occur. This control and distribution of water has become the key component of agricultural water conservation and efficiency. Distribution is now the crucial component of agricultural water efficiency and conservation [3,4,5]. Large-scale water transfer projects are regulated by single gates in existing research, which lacks systematic analysis of transient flow characteristics, model applicability boundaries, and other important issues under the coupled action of multiple gates in small canals [6]. This coupled action of multiple gates frequently faces issues like large deviations of hydraulic response prediction and unclear synergistic mechanisms of multiple gates, leading to theoretical results that can hardly support the demand for precise water distribution on the field scale.
When the control gate and sluice gate are operated jointly, the hydraulic time lag phenomena in the small channel system are substantial. The water transmission delay manifests as the time difference between the upstream water flow changes in the channel and the downstream monitoring points because of the intricate relationship between hydraulic response and spatial and temporal changes in water conditions. This causes the downstream water level and flow rate to be unable to react in real-time to the upstream regulation, which has a significant impact on the channel’s water transmission efficiency and control accuracy. The feedforward control strategy is a highly effective way to address the lagging issue of channel water transmission [7]. Its main goal is to reduce the impact of the lagging effect by actively intervening in the water flow state before the actual water demand occurs and by developing and implementing the control rules of upstream boundary conditions and hydraulic buildings along the line in advance, based on the trend of changes in water demand. The volume compensation method has been successfully applied to the Salt River Water Transmission Project in the United States [8] and integrated into the automatic channel control software Sacman (https://selfassessedclearance.com.au/index.php/how-to-arrange-a-sac-declaration-clearance/-for-SELF-ASSESSED-CLEARANCE-SAC-DECLARATIONS/, (accessed on 20 May 2025)), which has fully verified the method’s feasibility and dependability. Scholars have conducted extensive research on feedforward control of channel operation since the 1970s. A crucial component of accomplishing feedforward control is figuring out the advanced operating time of upstream hydraulic systems. Two primary technical approaches are currently available: one is based on wave propagation theory [9], which calculates the time it takes for a water disturbance wave to travel from upstream to downstream in order to precisely set the feedforward control trigger time; the other is based on the water’s state transition characteristics [10], which analyzes the dynamic process of the water flow from one steady state transition to another steady state in order to estimate the feedforward control start time. These two approaches offer a theoretical foundation and useful recommendations for feedforward control time optimization from several angles.
It has been confirmed that timing research in certain domains is beneficial. In recent years, researchers have kept looking into new scheduling techniques and technological systems that, by combining intelligent algorithms, dynamic modelling, and cross-domain collaborative strategies, systematically improve the operational effectiveness and resource allocation efficiency of complex systems. These systems offer state-of-the-art solutions for solving scheduling optimization problems in a variety of domains, including energy networks, transportation systems, industrial production, and others. Xue et al. develop a combined heat and power dispatch (CHPD) model by considering the flexibility of heat sources, pipelines and DHS loads and proposes a decentralised algorithm based on a heterogeneous decomposition method to solve the model [11]; Zhang et al. solves a reconfigurable distributed flow shop scheduling problem (RDFGSP), develops constructive heuristics to meet real-time requirements, and verifies the solution accuracy and efficiency of the generated heuristics when solving a small-scale problem [12]; Wei et al. proposed a multi-objective fuzzy optimisation model for multi-type aircraft flight scheduling problem using NSGA-II optimisation algorithm [13]. The gate group regulation scheme, which is used in traditional water conservation project management, is based on the accumulation of historical data and human experience judgment. It has drawbacks, including high operating costs, delayed system response, information transmission lag, and strong decision-making randomness. With the advent of genetic algorithms [14], simulated annealing algorithms [15], ant colony optimization algorithms [16], and other global search techniques, multi-objective optimal scheduling of water conservation projects has emerged as a hotspot for industry research. The goal is to improve water use safety, water supply reliability, and operating costs while demonstrating notable benefits. Moradi-Jalal et al. used a genetic algorithm to reduce the pumping station’s running costs while maintaining the desired hydraulic performance [17]; Arunkumar et al. combined the chaotic algorithm and evolutionary algorithm to generate the initial population, which accelerated the speed of convergence and better met the demand for scheduling and allocation of water from multiple reservoirs [18]; Zhu et al. created a two-layer optimization model for an inter-basin water transfer and supply reservoir system and employed an adaptive genetic algorithm (AGA) to solve it effectively [19]; Liu et al. introduced a genetic algorithm to improve the gate group opening controller based on the automatic control model of water transmission during the ice period of the South-to-North Water Diversion Middle Line [20]; In order to balance several competing water needs, Ouyang et al. built a water supply scheduling model for Danjiangkou Reservoir using the Inter-basin Diversion Reservoir Dispatch (IDR) model [21]; In order to improve the efficiency of hydropower generation, Anderson et al. created a reservoir scheduling optimization model based on network flow and particle swarm optimization algorithm (PSO) [22]; Khatavkar et al. combined genetic algorithms with the HEC-RAS simulation model to create a real-time control and optimization scheduling system by combining short-term and long-term emergency water supply needs [23]; Katakam et al. Genetic Algorithm Optimised Rule Curve (RC) Model for Multipurpose Reservoir Operation with Significantly Improved Power Generation Benefits without Affecting Irrigation Requirements [24]; Zhang separated the full hydraulic model into an optimized segmented hydraulic model and a non-optimized segmented hydraulic model, and he suggested a real-time optimization method for segmented hydraulic based on the combination of rule-based simulation and real-time optimization [25]; Gan used the standard canal segment of the Jiaodong water transfer project as the study subject, sets the scheduling goal as the pumping station’s least energy consumption, and uses a reinforcement learning algorithm to execute the best possible scheduling [26]; Du presented a Pareto-optimal solution for efficient identification of high quality that maximises the resilience of the water distribution system under cost constraints [27]. The findings of this study offer significant theoretical justification and real-world examples for the scientific and intelligent scheduling of water conservation initiatives. The hydrodynamic model serves as the foundation for the non-constant flow simulation, and the majority of current research focuses on the cooperative regulation of several control gates working together in large-scale water transfer projects. The model must be called repeatedly for calculations in the ensuing optimization calculation process, which causes the scheduling research as a whole to consume a lot of time and incur large computational costs. In order to provide a thorough and complete dataset for the machine learning exploration of hydrodynamic laws, this study aims to determine the relationship between pertinent hydraulic elements and prioritize the simulation work based on this relationship for the multi-gate coordination problem encountered in real small-scale irrigation districts.
The hydraulic components of the channel’s water movement are intricately connected to gate opening and closing control and variations in water distribution. An ideal irrigation scheduling model based on numerical modelling of channel hydrodynamics must be built in order to faithfully represent the dynamic variations of water flow in irrigation areas. In order to accomplish dynamic simulation and optimal scheduling of water movement in the irrigation area, the model uses the Saint-Venant equations as the fundamental theory [28,29] and fully accounts for changes in water level and flow rate over time and space brought on by non-constant flow [30]. It is challenging to meet the technical demands of real-time decision-making since the actual model has low model-solving efficiency and high requirements for the quality of water data, which include precise topographic information and correctly measured data. With the rapid advancement of artificial intelligence, the regression algorithm in machine learning takes a data-driven approach to directly explore the potential laws between the data, gradually becoming a new technical means to simulate and predict the water level. Traditionally, channel operation scheduling is controlled by the constant water level before the gate [31]. Construction of a CMAC neural network-based adaptive channel water distribution automatic control system by Han et al. [32]; For groundwater level prediction, Behzad and Asghari et al. used Support Vector Machines and Neural Networks, respectively [33]; Sahoo et al. developed a predictive model for instantaneous water levels in the floor of the groundwater basin using a multiple linear regression model [34]; Yu et al. combined fuzzy neural networks and discrete wavelet variations to create a joint prediction model for daily water level dynamics in the Yangtze River estuary [35]; Tang et al. used a long and short-term memory network to create a water level prediction model for the central line of the South-to-North Water Diversion [36]; Gao et al. carried out a thorough investigation on gate control and water level and flow prediction using deep learning frameworks like LSTM [37]. Most current research relies on measured data, which is susceptible to measurement errors, the complexity of the real operating conditions, and the completeness of the topographical data. This kind of data has a high rate of missing samples and is subject to unpredictability. Furthermore, the model may not be able to generalize when processing severe conditions or uncommon combinations because observed data cannot cover all operating conditions. This could lead to erroneous water level estimates. This work constructs a fine-grained hydrodynamic model based on the theoretical foundation of the Saint-Venant equations. All potential operating situations under non-steady flow circumstances are systematically simulated using this model, encompassing all gate control scenarios. The study produces a large-scale, high-quality, full-condition coverage data collection that offers enough accurate training samples for algorithm optimization. This effectively makes up for the inherent shortcomings of traditional data-driven approaches in terms of data completeness and operating condition coverage by enabling the very accurate prediction of the dynamic reaction of water elements to changes in decision variables.
In order to identify the best schedule control scheme, this study builds a hydraulic simulation model of a water transmission and distribution system and applies intelligence approaches, including machine learning and optimization theory, to perform global gate joint control. The prediction model is trained using the dataset created by the one-dimensional hydrodynamic model in conjunction with the multi-objective optimization algorithm (NSGA-II). The feedforward control mode optimization objective is established by analyzing the scheduling requirements and the characteristics of the engineering process’s adjustment stage. The control scheme of local operation is quickly generated using the change amount of the gate openings as the decision variable, and the optimal gate group scheduling scheme under component flow regulation is generated using the actual irrigation canal system as an example. Using the real irrigation canal system as an example, the best gate group scheduling plan is created under component flow regulation, and the impact of the regulation at various feedforward timings is examined.
2. Models and Algorithms
A number of channels and gates make up the actual water transmission and distribution project. Water will be transported from the main canal to the various branch canals via the gate control. If the gate group control is implemented after the amount of water distribution changes, the water level will fluctuate significantly in a short amount of time, which could compromise the project’s safety. In order to create a feedforward control model based on prediction and compensation, this study integrates optimization approaches with the simulation model. Prior to training the Random Forest prediction model to predict the water level and flow rate at the key sections of the channel under any combination of openings, the hydrodynamic model is used to simulate the hydraulic process of the entire system under various gate openings. A significant amount of simulation data is then collected to serve as a data source for machine learning. Lastly, various objective functions are set up in the optimization model in accordance with the actual engineering scheduling requirements under various control modes. The water level and flow value at the important channel segments are then predicted by the optimization model under any combination of openings. The computational framework is depicted in Figure 1. The control strategy for the optimal gate opening change is computed by forecasting the system inputs or external perturbations, which can fully take into account the hydraulic processes within the water conveyance system as well as the centralised optimal management of the system.
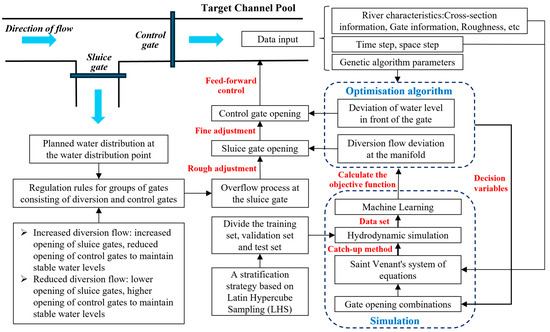
Figure 1.
Simulation-based optimization method’s computational framework.
2.1. Hydrodynamic Model
Each hydraulic portion of an irrigation canal system is surrounded by upstream and downstream control gates, forming cascaded open-channel reaches. Upstream channels typically have low longitudinal gradients, and the diversion infrastructure is usually located next to the headgate. In hydraulic operations, unstable flow regimes with non-uniform spatial-temporal variations are produced by gate changes or flow withdrawals. Cross-sectional hydraulic parameters (velocity, water depth, and flow rate) exhibit dynamic spatial gradients and temporal evolution in such circumstances. The Saint-Venant equations, a one-dimensional hydrodynamic formulation that describes mass and momentum conservation, primarily control these transient flow dynamics in open channels [38,39,40]:
where BT is the section water surface width, m; Z is the channel section water level, m; t is the time, s; Q is the section flow rate, m3/s; x is the flow, m; q is the lateral diversion flow of the channel per unit length, m2/s; α is the power correction coefficient; A is the section area, m2; g is the gravity acceleration, m/s2; n is the roughness; R is the hydraulic radius, m; Vx is the diversion along the direction of the water flow velocity, m/s.
The Saint-Venant system of equations is discretized in this study using the Preissmann four-point implicit finite difference approach, which has strong stability and fast convergence. This turns the nonlinear system of equations into a system of difference equations. In order to guarantee the continuity transfer of the catching-up coefficients of the river channel, special treatment is made on the inner boundary based on the hydraulic characteristics. The inner boundary treatment method generalizes the control gates and diversion points in the water conveyance channel, and the catching-up method solves the difference equations:
(1) Gate
The equation for the over-gate flow rate is:
where: Q is the control gate overflow flow, m3/s; b is the net width of the gate hole, m; e is the gate opening, m; σs is the inundation coefficient; Zi is the water level before the gate, m; Zi+1 is the water level after the gate, m.
The pre-gate and post-gate flow relationship can be used to determine the continuity of water flow conditions in the actual computation of the default control gate before and after no flow loss:
where: denotes the flow rate of section i at time j, and denotes the flow rate of section i + 1 (i.e., the post-gate section) at time j, m3/s.
(2) Water distribution channel
Through the diversion port, irrigation canal systems move water from dry canals to branch canals and from the branch canals to agricultural canals for distribution and transmission. The diversion outlet’s control equation satisfies the energy and flow compatibility requirements, meaning that the water flow at the outlet follows the water balancing principle and that there are no abrupt fluctuations in the water level during the water flow in and out of the outlet. The equation for compatibility is:
where: Zi−1, Zi, Zi+1 denote the water level in the main canal pool and side canal section before and after the diversion, m. Qi, Qi+1 denote the flow rate in the main canal pool section before and after the diversion, respectively, and Qout denotes the withdrawal flow rate at the diversion, m3/s.
The St. Venant system of equations’ precision and usefulness primarily rely on the mechanism of synergistic interaction between parameter properties, numerical computation techniques, and physical process cognition. Among these, the river’s topography and longitudinal slope, which serve as the fundamental restrictions on water movement, directly affect the flow characteristics and evolution of the water flow; these factors must be adequately represented by the high-order numerical format and meticulous grid division of rapid flow, water jump, and other hydraulic mutation phenomena. The resistance characteristics of water flow and the setting of boundary conditions are greatly influenced by the riverbed roughness and gate structure parameters. Frequently, water level and flow monitoring data are used to build dynamic parameter inversion models, which include real-time calibration and optimization of key parameters like Manning’s coefficient, flow coefficient, etc., to improve the model’s simulation accuracy and generalizability for complex hydraulic processes.
2.2. Random Forest Prediction Model
When dealing with real water transmission and distribution projects that have intricate topological links and vast sizes, the hydrodynamic model must be repeatedly called during the computing process of the optimal scheduling algorithm. This takes time. In this study, the intelligent algorithm is used in place of the hydrodynamic model. The full-arrangement parameter space is generated using the randomly generated control of the opening degree of the sluice gate and the control gate as input features. The output key cross sections’ water level and flow rate values are simulated using the previously established hydrodynamic model of the water transmission system. The dataset is established, and the prediction of water level and flow rate is realized through the extraction of nonlinear mapping relations embedded in the data. Table 1 lists the specific feature variables and output variables.

Table 1.
Feature Variables and Output Variables.
In contrast to the deep learning model, which is prone to deteriorating generalization performance due to overfitting in the case of insufficient data, Random Forest, as a nonparametric model, is not easily overfitted on small and medium-sized datasets due to the limited simulation data (8450 samples) and the strong nonlinear relationship between gate opening and hydrodynamic response. Additionally, the research must provide an interpretable optimization strategy for actual gate group scheduling, and Random Forest can directly specify the influence weight of each gate opening on the output variables through feature importance analysis, which makes the computational system clear and easy to use. This study chooses to use Random Forest, an integrated learning algorithm, for regulation prediction. It uses a Decision Tree as the base learner, integrates it through Bagging, and introduces random attribute selection. This is due to the algorithm’s effective balance between robustness, interpretability, computational efficiency, and engineering reliability when modelling small and medium-sized data. In other words, the model’s classification outputs are highly accurate and capable of generalization since several decision trees are combined to vote on or average the final result. Figure 2 illustrates the algorithm’s structure.
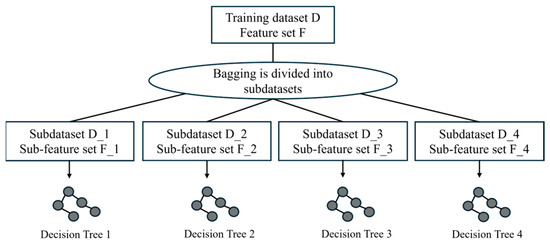
Figure 2.
Random Forest Algorithm Structure.
To prevent overfitting and guarantee model generalization, data splitting and cross-validation are essential steps in the random forest model-building process. This study uses a stratified partitioning technique based on Latin Hypercube Sampling (LHS) to separate the simulation dataset into training, validation, and test sets while taking into account the entire permutation properties of the opening combinations of two gates in irrigation channels. A two-dimensional grid space is created by discretizing each gate opening into 15 cm intervals; each grid corresponds to a distinct sub-space of opening combinations. In order to guarantee a balanced sample distribution across various operating condition intervals and prevent the absence of extreme opening combinations brought on by conventional random partitioning, samples are randomly chosen from each sub-space using Latin hypercube sampling at a predetermined ratio (for example, 70% for the training set, 15% for the validation set, and 15% for the test set). Model parameter learning is performed on the training set, hyperparameter tweaking (such as the number of trees or minimum leaf node size) is performed on the validation set, and model generalization performance is assessed on the test set, which is totally unrelated to the training process. Random indexing is used to allocate data and to prevent data leakage; Min–Max normalization of input features and output labels is carried out using the training set. In order to do implicit cross-validation utilizing bootstrap-generated OOB samples for hyperparameter tweaking and feature importance assessment, the model makes use of the built-in out-of-bag (OOB) error mechanism of random forests. K-fold cross-validation, which repeatedly splits the training and validation sets and averages performance metrics over several cycles, is also added to further improve model robustness. By segregating data utilization, assessing model performance from many perspectives, and implementing stratified sampling to maintain input space coverage integrity, the aforementioned techniques successfully reduce overfitting. Given the opening values of check gates and diversion gates, this guarantees that the model exhibits dependable generalization ability in predicting outputs like diversion flow and water level upstream of gates, especially boosting the predictive credibility for extreme operating conditions. This gives the prediction of gate operating states in irrigation channels based on simulation data and scientific methodological support.
2.3. Optimized Scheduling Model
2.3.1. Objective Function
The water level immobility point canal section is fixed in the downstream section of the canal section in front of the gate, typically using the normal water level in front of the gate to maintain the relative stability of the depth of the water in front of the control gate. In operation scheduling, irrigation canals are typically used in front of the gate in constant water level scheduling mode. During water distribution changes, the sluice gate and control gate are regulated to ensure that the diversion gate overflows to meet the water distribution requirements. The objective function is specifically defined as follows:
(1) The diversion flow’s minimum average absolute deviation from the target flow at the diversion point
where: W is the average deviation of the branch channel diversion flow from the target distribution flow, m3/s; T is the number of time periods in the whole scheduling period; N is the number of control gates; t is the time; n is the number of the branch channel; QMtn is the simulated water delivery of the tth time slot of the nth channel; QNn is the planned water distribution of the nth section of the channel, m3/s.
(2) The water level’s minimum average absolute deviation from the target water level prior to the operation gate
where: D is the average deviation of the water level in front of the gate of each control gate from the target water level, m; Ztn is the water level in front of the gate of the nth canal pool at time t, m; Zgn is the target water level of the nth canal pool, m.
2.3.2. Decision Variables and Constraints
The amount of change in the opening of each gate in each time period is chosen as an independent decision variable in this model, which optimizes the gate regulation process in accordance with the requirements of the actual project scheduling. The amount of change in the opening of each gate at each moment is independent of the others, and the optimization process can be modified independently without limiting the time period or the coupling constraints of the gates. Additionally, the amount of change in the opening of the gates between each time period is directly superimposed.
where: is the minimum permissible opening amplitude of the ith gate for a single adjustment in time period t; is the maximum permissible opening amplitude of the ith gate for a single adjustment in time period t.
In the past, the sluice facts of the case occasionally occurred due to damage to the gate and its opening and closing equipment caused by not following the gate operation procedures. Therefore, in accordance with the People’s Republic of China’s Ministry of Water Resources, which approved the release of the sluice gate technical management regulations on 31 December 2024, the gate should be raised gradually to a height of 0.2 to 0.5 m in order to meet the water in the dissipation pool. The opening of the divided time should be spaced out according to the downstream water level, which tends to stabilize the time needed to be determined [41].
2.3.3. Model Solution
The field of solving complex optimization models has made extensive use of many intelligent optimization algorithms in recent years due to the deep development of optimization theory and technology. Genetic Algorithm (GA), one of the traditional intelligent optimization algorithms, has garnered a lot of interest because of its many benefits, including its robustness, great adaptability, and easy-to-understand premise. In essence, it is a stochastic search technique grounded in natural genetics. The algorithm, which is essentially a stochastic search algorithm founded on the natural genetics principle, simulates genetic operations like selection, crossover, and mutation in biological evolution to continuously increase the fitness of individuals in the population before progressively approaching the global optimal solution. This allows the algorithm to perform an adaptive search in the solution space.
While traditional genetic algorithms perform well when solving single-objective optimization problems, multi-objective optimization problems are more prevalent in scientific research and practical engineering, and the algorithm’s performance is subject to greater demands due to the complexity of their solution space. This study uses the Non-dominated Sorting Genetic Algorithm II (NSGA-II) with an elite strategy to solve such problems more efficiently. The algorithm is very effective and robust in solving multi-objective optimization problems. It uses non-dominated sorting to divide the population into different tiers, maintains the diversity of solutions by combining it with crowding calculation, and introduces the elite retention mechanism to effectively prevent the loss of excellent individuals.
3. Example Applications
3.1. Study Area
Using an irrigation district in Shaanxi Province’s east as the study area, the generalized canal system is depicted in Figure 3. The irrigation system consists of three branch canals totalling 18.50 km in length, each of which is pressurized gradually by seven pumping stations. Water is then transferred to the various branch canals via the east and west branch canals. According to the “Channel Seepage Control Lining Engineering Design Standard” (GB/T50600-2020) [42] and the actual project, the channel is U-shaped, has a strong overflow capacity, good hydraulic conditions, and strong structural stability. The entire section is lined with cast-in-place concrete, and the channel is level and smooth with a roughness of 0.015.
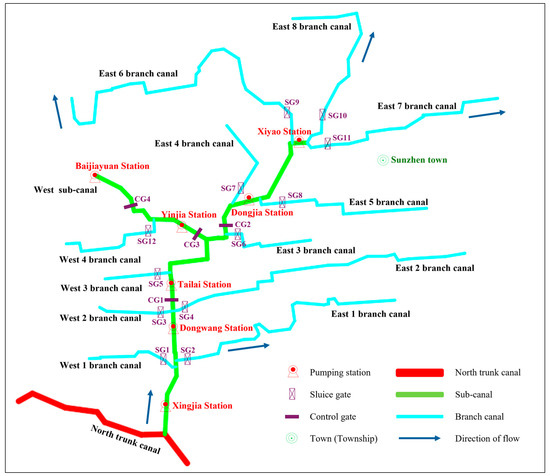
Figure 3.
Overview of a canal system in an Eastern Shaanxi Province irrigation area.
After careful consideration, the downstream section of the canal following Sunzhen East Diversion is chosen as the core research object. The research area covers SG6 sluice gates and CG2 control gates and a mathematical model is constructed, and systematic calculations are conducted to explore the joint dispatching strategy of the sluice gate and the control gate for the efficient allocation of water resources of the irrigation area. The related gate information of the irrigation area is shown in Table 2 and Table 3. This is conducted in order to realize the water demand of the diversion and the downstream area while also ensuring the precise regulation of the water level in front of the gates to the target level. The joint scheduling strategy of sluice gates and control gates will be examined by building a mathematical model and performing methodical calculations for this canal section. This will give the theoretical foundation and technical assistance for the effective distribution of water resources in the irrigation area.
Table 2.
Sluice of irrigation system statistics.
Table 3.
Key Sluice Information Parameters.
3.2. Predictive Performance Evaluation
The evaluation criteria of the random forest prediction model select the coefficient of determination (R2), the average absolute error (MAE), the root-mean-square error (RMSE), and the physical consistency (flow conservation) in order to achieve the closest possible match between the model prediction and the actual action variability during the application process. The computations’ outcomes are displayed in Table 4. Although the flow prediction error is marginally higher than the water level prediction error, it can still support the quick generation of workable scheduling solutions in the feedforward mode, and the model’s high water level prediction accuracy can offer stable constraints for gate regulation and control. In line with the need for real-time optimization, the model can still support the quick generation of workable scheduling schemes in the feedforward mode, even though the flow prediction error is marginally higher than the water level. Additionally, its millisecond computational efficiency is noticeably better than that of the one-dimensional hydrodynamic model at the minute-second level.
Table 4.
Evaluation Indicators of the Prediction Model.
The influence of feature perturbation on model prediction performance is measured using Permutation Importance based on Out-Of-Bag Data. The correlation coefficients of each feature are displayed in Figure 4, which demonstrates that the response of various output variables to the input features varies significantly and that the normalized importance of the input features takes the value of Input feature normalized significance falls between 0.233 and 0.454.
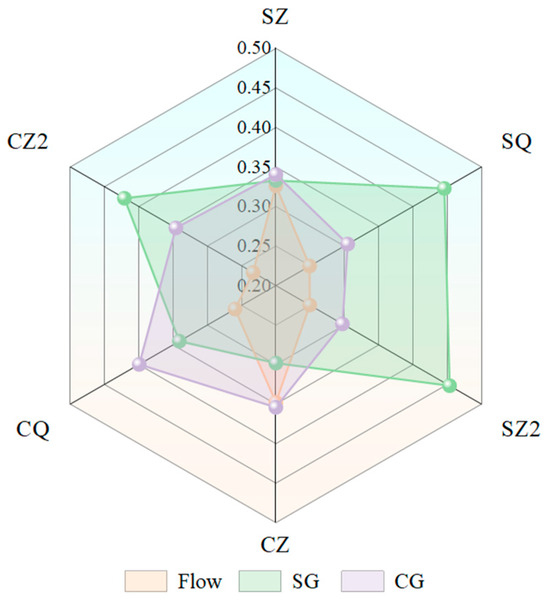
Figure 4.
Impact of Input Parameter Weights on Output.
The findings indicate that both the sluice gate opening (0.3329) and the control gate opening (0.3407) have a similar impact on the water level in front of the sluice gate, and both are at a high level. This suggests that the downstream control gate’s regulating action creates feedback between the sluice gate’s upstream level and that the linkage effect between the two may be coupled through the water flow propagation path. The opening degree of the sluice gate has a significant impact on both the diversion flow and the water level after the sluice gate (0.4459, 0.4535). This indicates that gate regulation is a crucial way to control the flow distribution in the established incoming water conditions because the gate opening has a dominant role as a direct control variable on the overflow capacity, while the incoming flow has a weak influence on both.
The water level in front of the control gate is most sensitive when the control gate is opened (0.3541), after the incoming flow (0.3478), and least sensitive when the sluice gate is opened (0.2981). This suggests that the water level upstream of the control gate is primarily regulated by its own regulating behaviour and the total amount of incoming water in the system and that the upstream sluice gate’s diversion may have an indirect effect on the water level in front of the control gate by changing the main canal’s flow rate. The opening degree of the control gate (0.3994) is the most significant factor in the control gate overflow, followed by the sluice gate’s opening degree (0.3410) and the incoming flow rate (0.2596). This suggests that the effectiveness of the main canal water transmission is determined by both the opening degree of the control gate and the residual flow rate after it passes through the sluice gate.
3.3. Optimized Regulation of Gate Groups Under Typical Operating Conditions
The branch canal water distribution process is divided into four 5-min time periods with water volumes of 0.48, 1.00, 1.27, and 0.85 m3/s, respectively, in order to examine the impact of gate regulation on water level and flow accuracy. Table 5 lists the particular water distribution conditions. In order to minimize mechanical loss from frequent operation, the calculation process first determines the initial opening value through iterative calculation. Then, the opening change values of the next three periods are used as decision variables, totalling 6 (3 periods × 2 gates). The adjustment frequency of gate opening (5 min) is set to match the division of water distribution periods.
Table 5.
Water Distribution Conditions Settings.
By precisely estimating the feedforward operating time of upstream buildings, the water level fluctuation caused by the time lag of flow control may be efficiently compensated for, thereby resolving the issue of water transmission delay. In order to offer data support for the optimization of the feedforward control strategy and to systematically explore the impact of various feedforward times on the accuracy of water level control, a range of feedforward time conditions is set in this study (see Table 6 for details). The simulation calculation assumes a lower boundary water level condition of 0.94 m and an upper boundary flow condition of 1.5 m3/s.
Table 6.
Feedforward Condition Settings.
4. Results and Analyses
4.1. Algorithm Iteration Process
This study used two computational paths—directly invoking the hydrodynamic model and machine learning-based hydraulic element prediction—to compare the performance differences between the traditional hydrodynamic model and the machine learning method in the iterative computation of the optimization algorithm. The traditional method requires the hydrodynamic model to be solved again for every optimization iteration in order to determine the hydraulic element response. Because of the intricate numerical calculations and parameter iterations required for the model solving, a single computation cycle can take up to 12 h. The machine learning-based computational approach, on the other hand, rapidly forecasts the hydraulic elements using an intelligent model that has already been trained. This transforms the computational process from depending on laborious physical model solving to an effective model inference procedure. The test results demonstrate a 75% increase in computational efficiency and a significant reduction in single computation time to 3 h following the adoption of the machine learning technology. The findings confirm that machine learning offers a new technical avenue for quick scheduling decisions of intricate water conservation systems and that it has notable time-cost savings in the iterative calculation of optimization algorithms.
Figure 5 illustrates how the optimization algorithm computes the Pareto frontier. The frontier’s shape is a smooth concave curve, the water distribution error (f1) is distributed between 0 and 0.25, and the water level error in front of the gate is distributed between 0 and 0.05. The solution’s distribution is more uniform; there is no clear outlying point, and the algorithm’s convergence and congestion distance mechanism functions well, covers the entire decision space, and clearly shows the relationship between f1 and f2. The middle area shows the balance point of the two objectives. It is evident how f1 and f2 relate to one another. When f1 approaches zero, f2 reaches a maximum value of 0.045, and when f2 approaches zero, f1 reaches a maximum value of 0.024. The middle area illustrates where the two goals are balanced. Four typical solutions are chosen from the solution space for comparison in accordance with the real engineering requirements, and Table 7 displays the detailed schemes. Therefore, the solution with the smallest deviation in the dispensing is chosen as the optimal control scheme for the current study. This is because the flow regulation is small, the water level deviation is small, and the average water level deviation does not change significantly as the dispensing error in the game relationship increases.
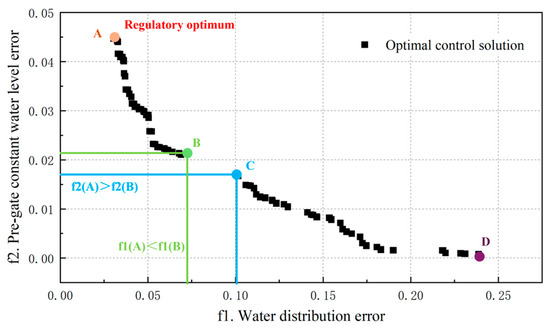
Figure 5.
Pareto Front Diagram of Optimal Scheduling.
Table 7.
Summary of solutions.
4.2. Optimize Scheduling Results
Through iterative calculations, the optimization algorithm employed in this study successfully achieved the balance between water distribution accuracy and water level stability during the dynamic regulation of the gate-opening process. Table 8 displays the specific scheduling solutions that were generated. According to the study, there is a notable staged characteristic in the match between the gate opening regulation and the water distribution aim in each time period. The sluice gate’s opening in the four water distribution time periods is 0.13 m and 0.51 m. The optimization algorithm’s ability to flexibly adjust the combination of gates to adapt to the demand of water distribution at different stages is fully reflected in the dynamic change of 0.85 m and 0.30 m. The control gate’s opening degrees are 0.85 m, 0.71 m, 0.39 m, and 0.79 m, respectively, and the sectional gate’s opening degrees are 0.85 m, 0.71 m, 0.39 m, and 0.79 m in the same period.
Table 8.
Optimal Scheduling Schemes and Index Analysis.
Regarding water distribution control, the optimized scheme simulates a total water distribution of 153.21 m3, 341.91 m3, 371.40 m3, and 243.78 m3, with relative errors of 6.4%, 13.97%, 2.5%, and 4.4%, respectively, compared to the planned total water distribution in the four stages, which is 144 m3, 300 m3, 381 m3, and 255 m3. According to the data, the algorithm’s performance steadily increases in the middle and late phases before progressively approaching the optimal state.
The simulated average water levels in each phase are 1.13 m, 1.01 m, 0.94 m, and 0.96 m. The desired constant water level in front of the control gate is set at 1 m. While the water level errors in time periods two and four are kept under ±1%, the significant variations are focused in time periods one (13%) and three (−6%). The aforementioned findings demonstrate how well the optimization algorithm balances water level stability and flow allocation, and it may offer trustworthy technical assistance for the best possible scheduling of water resources in the irrigation region.
The change process of hydraulic elements in 20 min was determined using the hydrodynamic model’s dynamic simulation, as seen in Figure 6. The findings demonstrate that there is a notable temporal coupling and nonlinear response characteristics in the simultaneous regulation of the sluice gate and control gate. The diversion flow at the sluice gate had mean values of 0.532 m3/s, 1.007 m3/s, 1.22 m3/s, and 0.814 m3/s across the four time periods. The absolute errors were 10.83%, 0.70%, 3.94%, and 4.24%, respectively, when compared to the target values.
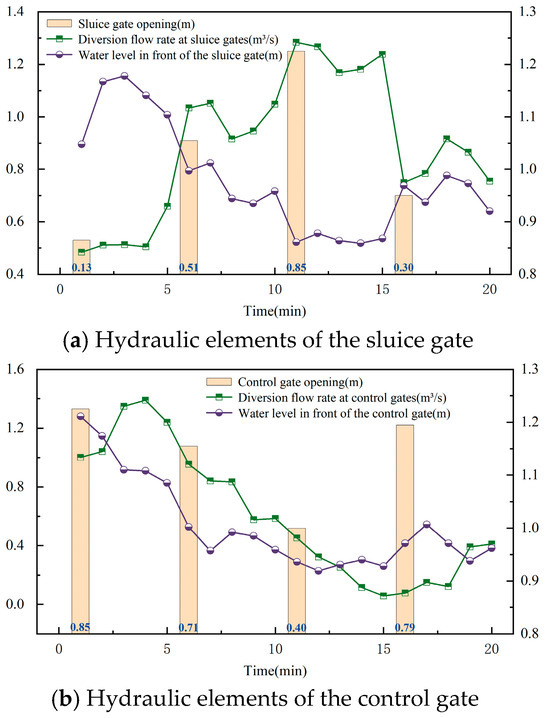
Figure 6.
Real-time Changes of Hydraulic Elements Under the Optimal Scheduling Scheme.
There is a cyclic fluctuation in the water level in front of the control gate, ranging from 0.859 to 1.211 m. The water level in front of the sluice gate builds up and rises to 1.211 m during the first phase because of the gate’s modest opening degree. The water level quickly drops to 0.957 m in the second period as the diversion flow increases, then drops even more to 0.928 m in the third period before rising again to 0.971 m at the end of the period after control. The current control strategy has some inertia when dealing with the step change of flow, as evidenced by the average water level of 0.997 m and the standard deviation of 0.117 m. However, dynamic regulation effectively maintains the stability of the channel water level while achieving the precise distribution of flow. The diversion flow and the constant water level error in front of the control gate are shown in Figure 7.
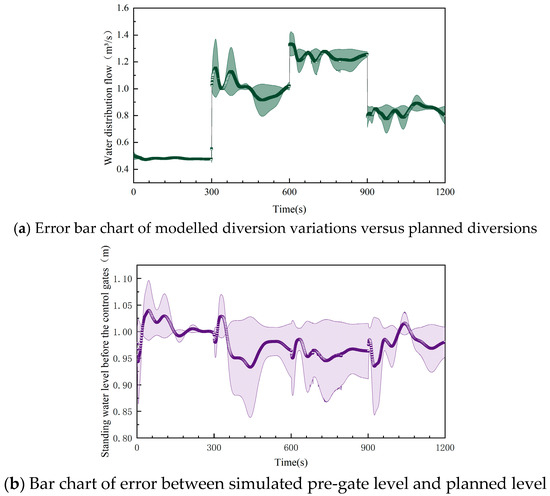
Figure 7.
Errors in partial flow and water level over time.
4.3. Feedforward Time
The total water level errors under gate synchronous regulation conditions (C10–C30) without feedforward control (feedforward time of 0 s) reached 28.876 m, 37.67 m, and 39.162 m, respectively, according to the simulation results of the feedforward condition in this study, which were obtained by comparing multiple conditions as shown in Table 9. This suggested that the delay in water flow transmission caused a significant deviation in water level control.
Table 9.
Simulation Calculation Results of Feedforward Conditions.
The cumulative water level inaccuracy for each condition exhibits a trend of dropping and then increasing when the feedforward time is progressively increased from 10 s to 90 s. In particular, under the low-flow condition (C1 series), the cumulative water level error drops from 28.876 m to 28.649 m with a maximum optimization error of 0.227 m and a relative optimization rate of 0.79% when the feedforward time is increased from 0 s to 50 s. After 50 s, the error rises to 29.307 m. With a maximum optimization error of 0.312 m and a relative optimization rate of 0.83%, the cumulative water level error drops from 37.67 m to 37.358 m for the medium flow condition (C2 series) when the feedforward time is increased from 0 s to 30 s. After 30 s, it rises to 42.283 m. With a maximum optimization error of 0.384 m and a relative optimization rate of 0.98%, the cumulative error decreases from 39.162 m to 38.778 m in the high-flow situation (C4 series) when the feedforward duration is increased from 0 s to 20 s. With a maximum optimization error of 0.384 m and a relative optimization rate of 0.98%, the cumulative error drops from 39.162 m to 38.778 m in the high flow condition (C4 series), and after 20 s, it rises to 45.515 m.
The findings demonstrate that different flow circumstances correlate to varied ideal feedforward times and that accurate pre-adjustment can successfully compensate for water transfer delays. Excessive feedforward time prolongation, on the other hand, can result in uncontrollably high upstream water levels. The optimal feedforward time for low, medium, and high flow conditions is 50 s, 30 s, and 20 s, respectively, according to the nullah flow delay formula td = L/v (where L is the distance between the two gates and v is the average flow rate). This study confirms the positive correlation between the flow rate and the delay time and further reveals that the main goal of feedforward control is to eliminate the time-consuming flow propagation by using a pre-adjustment strategy to increase the scheduling accuracy of the gates. It also shows that the main goal of feedforward control is to increase the scheduling accuracy of the gate group by using the pre-regulation technique to counteract the time consumption of water propagation.
Figure 8, which illustrates the fundamental mechanism of maintaining the water level stable during feedforward control for the gate group system with joint regulation of sluice gates and control gates, shows the change of the water level at the control section in relation to the target level under the optimization scheme. While a large gate opening causes a rapid response of the water flow and the feedforward time is too long to make the sectional gates enter the small-opening throttling state in advance, causing the phenomenon of the upstream water level congestion, low-amplitude changes (C1 series) have a small water flow inertia, a relatively mild delay effect, and a wide range of feedforward time to achieve error optimization. To adapt the pre-adjustment time to the real-time flow, a dynamic feedforward method is used.

Figure 8.
Comparison of Water Level Deviations Under Different Feedforward Conditions. (a) Variation of water level error corresponding to different feedforward times for 0.31 m3/s change in partial flow rate; (b) Variation of water level error corresponding to different feedforward times for 0.55 m3/s change in partial flow rate; (c) Variation of water level error corresponding to different feedforward times for 0.70 m3/s change in partial flow rate.
5. Discussion
This study focuses on the issue of joint scheduling and control of sectional gates and diversion gates at important water distribution nodes of minor irrigation canal systems, based on several joint scheduling studies of tandem sectional gates in water transfer projects. The research focuses on analyzing how gate opening and closing operations affect the hydraulic components of the key cross-section. It also creatively suggests a gate group scheduling model that is based on the Random Forest algorithm’s hydrodynamic model in conjunction with the NSGA-II multi-objective optimization algorithm. The model can quickly find the relative optimization solution, achieve the short-term water allocation of refinement for the water transfer project, improve the efficiency of water transmission, and increase water transmission safety. It also has a high degree of parallel computing ability, fast information processing speed, and strong computational efficiency.
(1) The Random Forest model predicts the certainty coefficients R2 of each output variable above 0.95, which leads to the quickest possible convergence to the optimal scheme, increases the speed of the model calculation, and resolves the issue that the model of the large-scale water transmission project takes too long to calculate. This study attempts to replace the hydrodynamic model for calculation using machine learning. Furthermore, it is demonstrated through examples that the NSGA-Ⅱ algorithm, using the multi-objective optimization framework built by embedding the prediction model, generates short-term scheduling commands that bring the water transmission system into a stable and efficient operation state. It also obtains the Pareto optimal solution set with the goal of minimizing the distribution error (≤13.97%) and water level error (≤13%) based on the water distribution demand.
(2) The feedforward control technique can effectively compensate for the dynamic error produced by the water flow delay, and there is a considerable temporal connection between the control gate and the sluice gate’s opening degree adjustment in the joint control of the gate group. The feedforward time optimization must be adjusted to various flow and opening changes according to a multi-case simulation. For low flow small opening conditions (0.15→0.29 m), medium flow conditions (0.15→0.61 m), and high flow large opening conditions (0.15→0.9 m), the ideal feedforward time is 50 s, 30 s, and 20 s, respectively. This can reduce the cumulative water level error by 0.79%, 0.83%, and 0.98%, respectively.
In this study, we have developed an offline optimization system based on the NSGA-II algorithm for irrigation district gates. By presetting multi-objective functions and using batch computation mode, we generate long-term scheduling strategies with minimal demand for real-time computation. This system exhibits good applicability in static scenarios, such as the creation of seasonal irrigation schedules and the macroscopic allocation of water resources, and it successfully strikes a balance between multi-objective optimization and project implementation costs. In order to achieve adaptive regulation and control of the channel water flow delays, fluctuations in water demand, and other dynamic processes, the model predictive control builds a rolling optimization framework that is driven by real-time data. It takes as input the current state of the system, which includes gate opening, channel water level, real-time flow, and other monitoring data. Then, by building a predictive model of the channel water flow dynamics, it solves the optimal control sequences within a finite time domain on a rolling basis. Adaptive management of water demand variations, channel water flow delays, and other dynamic processes. A layered collaborative optimization approach can be used in subsequent studies to naturally combine contemporary control theory and conventional optimization algorithms. In other words, the lower layer of MPC technology is based on high-frequency monitoring data on the short-term control strategy (like intraday gate opening and closing time sequence) for dynamic correction; the upper layer of the intelligent optimization method for long-term strategy planning, which uses a quarterly or monthly cycle to generate the water resources allocation framework and gate scheduling baseline scheme. In addition to fully utilizing the benefits of conventional algorithms in global optimization, this hierarchical architecture compensates for the lack of dynamic adaptability by offering real-time response capability. This results in a solution that balances engineering viability and optimization accuracy for intricate irrigation systems.
An excessive heat loss will increase the energy consumption of water transmission and decrease the efficiency of water resources, particularly in the high-head irrigation area. The current study only considers flow rate and water level deviation when choosing the objective function, ignoring gate opening and closing, energy consumption, and equipment wear and tear. In the future, economic and engineering indicators can be incorporated into the scheduling model to reduce the number of gate changes based on maintaining the balance of water level and flow rate. By adjusting the gate openings, one can avoid local congestion or precipitation, which reduces head loss, lowers the need for pumping station lifting, and ultimately maximizes the comprehensive benefits of water resources. Modern irrigation districts strive for the comprehensive benefits of water conservation, energy savings, and cost reduction.
Additionally, in real-world applications, sensor ambiguity, delayed feedback, and unmodeled interference are some of the difficulties that arise when scheduling irrigation canal system gate groups optimally. Delays in data transmission, model computation, and equipment response may result in control lag, sensor measurement errors, missing data, and calibration drift, which will directly affect the scheduling model input accuracy. In addition, unmodeled factors like extreme weather and artificial water diversion will render the optimization scheme invalid. Technical techniques, including sensor redundancy design, Kalman filtering, predictive control, and scenario library building, can be used to improve system robustness in order to overcome these problems. A crucial component in facilitating the conversion of theoretical research into engineering practice is the actual deployment test, which plays an indispensable role in confirming the technical viability, adjusting the model parameters, assessing the financial advantages, and optimizing the system’s usability. In order to continually raise the standard of intelligent management in irrigation districts, future research will concentrate on cooperative quantification of multi-source uncertainty, optimization of dynamic adaptive scheduling algorithms, and long-term field trials.
Author Contributions
Conceptualization, W.W., X.H. and Y.D.; methodology, Y.D. and C.Z.; validation, Y.D. and L.C.; formal analysis, Y.D.; investigation, W.W. and R.W.; resources, Y.D., C.Z. and R.W.; data curation, Y.D., L.C. and T.Z.; writing—original draft preparation, Y.D.; writing—review and editing, W.W.; visualization, Y.D. and T.Z.; supervision, R.W.; project administration, W.W.; funding acquisition, W.W. All authors have read and agreed to the published version of the manuscript.
Funding
This work was funded by the National Natural Science Foundation of China [U2243235] and the National Key Research and Development Program of China [2022YFD1900402-01].
Institutional Review Board Statement
Not applicable.
Data Availability Statement
The original contributions presented in the study are included in the article; further inquiries can be directed to the corresponding author.
Acknowledgments
Thanks to the irrigation district staff for providing the base data and the Key Laboratory of Agricultural Soil and Water Engineering in Arid and Semiarid Areas for providing the drone.
Conflicts of Interest
The authors declare no conflicts of interest.
References
- Karami, S.; Heidari, M.M.; Rad, M.H.A. Investigation of Free Flow Under the Sluice Gate with the Sill Using Flow-3D Model. Iran. J. Sci. Technol.-Trans. Civ. Eng. 2020, 44, 317–324. [Google Scholar] [CrossRef]
- Abdelhaleem, F.S.; Basiouny, M.; Ashour, E.; Mahmoud, A. Application of remote sensing and geographic information systems in irrigation water management under water scarcity conditions in Fayoum, Egypt. J. Environ. Manag. 2021, 299, 9. [Google Scholar] [CrossRef] [PubMed]
- Kaghazchi, A.; Shahdany, S.M.H.; Roozbahani, A. Simulation and evaluation of agricultural water distribution and delivery systems with a Hybrid Bayesian network model. Agric. Water Manag. 2021, 245, 12. [Google Scholar] [CrossRef]
- Kailin, Y. Review and frontier scientific issues of hydraulic control for long distance water diversion. J. Hydraul. Eng. 2016, 47, 424–435. [Google Scholar]
- Cao, Y.; Chang, J.; Huang, Q.; Chen, X.; Huang, H. Real-time control strategy for water conveyance of Middle Route Project of South-to-North Water Diversion in China. Shuikexue Jinzhan/Adv. Water Sci. 2017, 28, 133–139. [Google Scholar]
- Masseroni, D.; Castagna, A.; Gandolfi, C. Evaluating the performances of a flexible mechanism of water diversion: Application on a northern Italy gravity-driven irrigation channel. Irrig. Sci. 2021, 39, 363–373. [Google Scholar] [CrossRef]
- Cui, W.; Chen, W.; Mu, X.; Bai, Y. Canal Controller for the Largest Water Transfer Project in China. Irrig. Drain. 2014, 63, 501–511. [Google Scholar] [CrossRef]
- Wahlin, B.; Zimbelman, D. Canal Automation for Irrigation Systems: American Society of Civil Engineers Manual of Practice Number 131. Irrig. Drain. 2018, 67, 22–28. [Google Scholar] [CrossRef]
- Liu, F.; Feyen, J.; Malaterre, P.-O.; Baume, J.-P.; Kosuth, P. Development and evaluation of canal automation algorithm CLIS. J. Irrig. Drain. Eng. 1998, 124, 40–46. [Google Scholar] [CrossRef]
- Bautista, E.; Clemmens, A.J. Volume compensation method for routing irrigation canal demand changes. J. Irrig. Drain. Eng. 2005, 131, 494–503. [Google Scholar] [CrossRef]
- Xue, Y.; Li, Z.; Lin, C.; Guo, Q.; Sun, H. Coordinated Dispatch of Integrated Electric and District Heating Systems Using Heterogeneous Decomposition. IEEE Trans. Sustain. Energy 2020, 11, 1495–1507. [Google Scholar] [CrossRef]
- Zhang, B.; Meng, L.; Lu, C.; Han, Y.; Sang, H. Automatic design of constructive heuristics for a reconfigurable distributed flowshop group scheduling problem. Comput. Oper. Res. 2024, 161, 106432. [Google Scholar] [CrossRef]
- Wei, M.; Yang, S.; Wu, W.; Sun, B. A Multi-Objective Fuzzy Optimization Model for Multi-Type Aircraft Flight Scheduling Problem. Transport 2024, 39, 313–322. [Google Scholar] [CrossRef]
- Zhang, S.; Tang, Y. Optimal schedule of grid-connected residential PV generation systems with battery storages under time-of-use and step tariffs. J. Energy Storage 2019, 23, 175–182. [Google Scholar] [CrossRef]
- Zhang, J.; Li, Z.; Wang, B. Within-day rolling optimal scheduling problem for active distribution networks by multi-objective evolutionary algorithm based on decomposition integrating with thought of simulated annealing. Energy 2021, 223, 18. [Google Scholar] [CrossRef]
- Omran, M.G.H.; Al-Sharhan, S. Improved continuous Ant Colony Optimization algorithms for real-world engineering optimization problems. Eng. Appl. Artif. Intell. 2019, 85, 818–829. [Google Scholar] [CrossRef]
- Moradi-Jalal, M.; Rodin, S.I.; Mariño, M.A. Use of genetic algorithm in optimization of irrigation pumping stations. J. Irrig. Drain. Eng. 2004, 130, 357–365. [Google Scholar] [CrossRef]
- Arunkumar, R.; Jothiprakash, V. Chaotic Evolutionary Algorithms for Multi-Reservoir Optimization. Water Resour. Manag. 2013, 27, 5207–5222. [Google Scholar] [CrossRef]
- Zhu, X.; Zhang, C.; Fu, G.; Li, Y.; Ding, W. Bi-Level Optimization for Determining Operating Strategies for Inter-Basin Water Transfer-Supply Reservoirs. Water Resour. Manag. 2017, 31, 4415–4432. [Google Scholar] [CrossRef]
- Liu, M.; Xu, Z.; Guan, G.; Guo, X.; Huang, M.; Wen, L. Impact analysis of short-term air temperature changes on water transfer scheduling during the ice period of the Middle Route of the South-to-North Water Diversion project. J. Hydrol. 2025, 651, 132583. [Google Scholar] [CrossRef]
- Ouyang, S.; Qin, H.; Shao, J.; Lu, J.; Bing, J.; Wang, X.; Zhang, R. Multi-objective optimal water supply scheduling model for an inter-basin water transfer system: The South-to-North Water Diversion Middle Route Project, China. Water Supply 2020, 20, 550–564. [Google Scholar] [CrossRef]
- Passos de Aragão, A.; Teixeira Leite Asano, P.; de Andrade Lira Rabêlo, R. A Reservoir Operation Policy Using Inter-Basin Water Transfer for Maximizing Hydroelectric Benefits in Brazil. Energies 2020, 13, 2564. [Google Scholar] [CrossRef]
- Khatavkar, P.; Mays, L.W. Real-Time Operation of Water-Supply Canal Systems under Limited Electrical Power and/or Water Availability. J. Water Resour. Plan. Manag. 2020, 146, 10. [Google Scholar] [CrossRef]
- SeethaRam, K. Three Level Rule Curve for Optimum Operation of a Multipurpose Reservoir using Genetic Algorithms. Water Resour. Manag. 2021, 35, 353–368. [Google Scholar] [CrossRef]
- Zhang, L.; Wang, C.; Yu, Y.; Duan, C.; Lei, X.; Chen, B.; Wang, H.; Zhang, R.; Wang, Y. Real-time optimization of urban channel gate control based on a segmentation hydraulic model. J. Hydrol. 2023, 625, 11. [Google Scholar] [CrossRef]
- Gan, T.; Jiang, Y.; Zhao, H.; He, J.; Duan, H. Research on low-energy consumption automatic real-time regulation of cascade gates and pumps in open-canal based on reinforcement learning. J. Hydroinform. 2024, 26, 1673–1691. [Google Scholar] [CrossRef]
- Du, K.; Yang, S.; Xu, W.; Zheng, F.; Duan, H. A novel optimization framework for efficiently identifying high-quality Pareto-optimal solutions: Maximizing resilience of water distribution systems under cost constraints. Reliab. Eng. Syst. Saf. 2025, 261, 111136. [Google Scholar] [CrossRef]
- Litrico, X.; Fromion, V.; Baume, J.-P.; Arranja, C.; Rijo, M. Experimental validation of a methodology to control irrigation canals based on Saint-Venant equations. Control Eng. Pract. 2005, 13, 1425–1437. [Google Scholar] [CrossRef]
- Anand, P.V.; Rajeev, R.; Velavendan, P.; Pandey, N.; Mudali, U.K. Modeling and simulation of diluent recovery unit in PUREX solvent regeneration system. Prog. Nucl. Energy 2018, 104, 359–367. [Google Scholar] [CrossRef]
- Wu, J.; Chen, J.; Han, Y.; Li, T. Study on Unsteady Flow Based on Optimized Water Distribution Model in Irrigation District. Sustainability 2020, 12, 1580. [Google Scholar] [CrossRef]
- Ruiz-Carmona, V.M.; Clemmens, A.J.; Schuurmans, J. Canal control algorithm formulations. J. Irrig. Drain. Eng. 1998, 124, 31–39. [Google Scholar] [CrossRef]
- Han, Y.; Gao, X.; Tu, X. Self-adapting Canal Automation Control Method Based on CMAC Neural Network. J. Irrig. Drain. 2007, 26, 76–79. [Google Scholar]
- Behzad, M.; Asghari, K.; Eazi, M.; Palhang, M. Generalization performance of support vector machines and neural networks in runoff modeling. Expert Syst. Appl. 2009, 36, 7624–7629. [Google Scholar] [CrossRef]
- Sahoo, S.; Jha, M.K. Groundwater-level prediction using multiple linear regression and artificial neural network techniques : A comparative assessment. Hydrogeol. J. 2013, 21, 1865–1887. [Google Scholar] [CrossRef]
- Yu, S.; Yang, J.; Liu, G. Estuarine daily river stage predicting based on discrete wavelet transform and neuro-fuzzy algorithm. Shuili Fadian Xuebao/J. Hydroelectr. Eng. 2014, 33, 39–45. [Google Scholar]
- Tang, M.; Lei, X. Water level forecasting in middle route of the South-to-North Water Diversion Project (MRP) based on long short-term memory (LSTM). China Rural Water Hydropower 2020, 10, 189–193. [Google Scholar]
- Gao, S.; Huang, Y.; Zhang, S.; Han, J.; Wang, G.; Zhang, M.; Lin, Q. Short-term runoff prediction with GRU and LSTM networks without requiring time step optimization during sample generation. J. Hydrol. 2020, 589, 11. [Google Scholar] [CrossRef]
- Fan, J.; Wang, C.D.; Guan, G.H.; Cui, W. Study on the hydraulic reaction of unsteady flows in open channel. Adv. Water Sci. 2006, 17, 55–60. [Google Scholar]
- Li, K.; Shen, B.; Li, Z.; Hao, G. Open channel hydraulic response characteristics in irrigation area based on unsteady flow simulation analysis. Trans. Chin. Soc. Agric. Eng. 2015, 31, 107–114. [Google Scholar]
- Zhang, C.; Zheng, L.; Ni, C. Hydraulic Response of the Water Diversion System to the Synchronous Operation of All Gates. Yingyong Jichu Yu Gongcheng Kexue Xuebao/J. Basic Sci. Eng. 2015, 23, 102–109. [Google Scholar]
- Haihe River Water Conservancy Commission of the Ministry of Water Resources; Second Survey and Design Institute of Water Conservancy and Hydropower of Hebei Province. Regulations on Technical Management of Sluice Gates; Ministry of Water Resources of the People’s Republic of China: Beijing, China, 2024.
- GB/T50600-2020; Engineering Technology for Channel Seepage Control Lining Standard. China Planning Press: Beijing, China, 2020.
Disclaimer/Publisher’s Note: The statements, opinions and data contained in all publications are solely those of the individual author(s) and contributor(s) and not of MDPI and/or the editor(s). MDPI and/or the editor(s) disclaim responsibility for any injury to people or property resulting from any ideas, methods, instructions or products referred to in the content. |
© 2025 by the authors. Licensee MDPI, Basel, Switzerland. This article is an open access article distributed under the terms and conditions of the Creative Commons Attribution (CC BY) license (https://creativecommons.org/licenses/by/4.0/).