Abstract
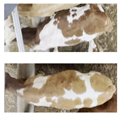
Deep learning-based individual recognition of beef cattle has improved the efficiency and effectiveness of individual recognition, providing technical support for modern large-scale farms. However, issues such as over-reliance on back patterns, similar patterns of adjacent cattle leading to low recognition accuracy, and difficulties in deploying models on edge devices exist in the process of group cattle recognition. In this study, we proposed a model based on improved YOLO v5. Specifically, a Simple, Parameter-Free (SimAM) attention module is connected with the residual network and Multidimensional Collaborative Attention mechanism (MCA) to obtain the MCA-SimAM-Resnet (MRS-ATT) module, enhancing the model’s feature extraction and expression capabilities. Then, the loss function is used to improve the localization accuracy of bounding boxes during target detection. Finally, structural pruning is applied to the model to achieve a lightweight version of the improved YOLO v5. Using 211 test images, the improved YOLO v5 model achieved an individual recognition precision (P) of 93.2%, recall (R) of 94.6%, mean Average Precision (mAP) of 94.5%, FLOPs of 7.84, 13.22 M parameters, and an average inference speed of 0.0746 s. The improved YOLO v5 model can accurately and quickly identify individuals within groups of cattle, with fewer parameters, making it easy to deploy on edge devices, thereby accelerating the development of intelligent cattle farming.
1. Introduction
The precise individual recognition of group beef cattle is a key to achieving large-scale and intelligent beef cattle farming [1,2], playing a vital role in the fine-grained management of beef cattle farms. It provides basic data for subsequent body weight analysis [3] and abnormal behavior recognition of beef cattle [4], serving as an important technical link in large-scale beef cattle farms. Traditional individual recognition methods for beef cattle mainly rely on manual observation techniques such as ear tags [5], branding, neck chains, and tattooing, which are time-consuming, labor-intensive, and prone to causing stress in beef cattle, thereby reducing animal welfare. Although radio frequency identification (RFID) technology can be applied to individual recognition of group beef cattle [6], its high cost, easy detachment, and susceptibility to interference hinder accurate identification [6]. Therefore, these traditional methods are unsuitable for large-scale beef cattle farms and difficult to achieve rapid and accurate recognition.
In recent years, computer vision and deep learning technologies have become increasingly mature. With the advantages of non-contact, fast recognition, and high real-time performance, they are gradually becoming an important means for individual livestock recognition [7]. Scholars have used physiological features such as nasal planum patterns, iris, and retina for livestock identification. For example, Santosh Kumar et al. [8] used multiple linear regression combined with facial and oral–nasal features to identify cattle, achieving an accuracy of 93.87%. Brendan Barry et al. [9] used image processing and principal component analysis to recognize oral–nasal patterns in cattle, with an accuracy of up to 98.85%. Guoming et al. [10] used the VGG16_BN model to identify the muzzle print images of 268 cattle, achieving an accuracy rate of 98.7%. Although identification methods based on such physiological features have high accuracy, they are difficult to collect in actual large-scale farming, making them inapplicable to large-scale cattle farms. Kaixuan et al. [11] proposed an improved Pointnet++ and ConvNeXt model for individual recognition of Holstein cows, achieving an accuracy of 96.72%. Dongjian et al. [12] proposed an improved YOLO v3 model for individual recognition of milking cows, with an accuracy of 95.91%. Hengqi et al. [13] proposed a cow recognition model based on deep feature fusion, achieving 98.36% accuracy on a test set containing 365 images of 93 cows. However, most of these computer vision-based livestock individual recognition methods focus on single livestock [14,15,16] and require livestock to pass through specific areas (e.g., channels or milking stations) sequentially, resulting in low collection efficiency and limited scenarios, which are unsuitable for group individual recognition in natural environments of large-scale farming.
In the research on livestock recognition in natural environments, Huaibo et al. [17] proposed an ECA-YOLO v5s network for heavily occluded beef cattle recognition, achieving an accuracy of 89.8% and an average inference speed of 0.0793 s, enabling multi-target beef cattle recognition under heavy occlusion. Dihua et al. [18] proposed a deep learning network FLYOLO v3 based on FilterLayer for key part recognition of cows in natural scenes, with a parameter count of 19.75 M. Hongming et al. [19] proposed an LSRCEM-YOLO-based multi-target beef cattle detection algorithm, which achieved an accuracy of 89.7% and an mAP of 92.3%. In summary, existing group beef cattle individual recognition algorithms suffer from low recognition accuracy, high parameter count, slow inference speed, and lack of lightweight characteristics, making them difficult to deploy on edge devices with limited computing power and unable to meet the needs of large-scale modern farms. Compared with algorithms such as Fast R-CNN [20] and SSD [21], the YOLO v5 algorithm can significantly improve inference speed while maintaining high accuracy and facilitate model design optimization [17]. Therefore, this study selects YOLO v5 as the baseline algorithm for improvement.
To enhance the accuracy and efficiency of group beef cattle individual recognition, improve positioning precision, reduce model parameters, achieve model lightweighting, and accelerate model inference speed, the main contributions of this study are as follows:
- (1)
- The MSR-ATT (MCA-SimAM-Resnet Attention Module) is introduced into the baseline YOLO v5 model to enhance feature extraction by capturing spatial and channel-wise information in feature maps simultaneously, thereby improving the model’s detection accuracy.
- (2)
- The loss function is improved to use an optimized loss function, which enhances the model’s positioning precision and adapts it better to real farming environments.
- (3)
- Structural pruning is applied to the model to reduce parameter count and memory usage, improve model inference speed, and facilitate deployment on edge devices with limited computing power.
2. Materials and Methods
2.1. Data Collection
The data used in this study were collected from Funiu Animal Husbandry Farm in Xinyang, Henan Province, which is located in a monsoon climate region. The collection subjects were 95 fattening Simmental beef cattle housed in two pens. The cattle shed is semi-open, located outdoors but equipped with a large-area shading shed on top, which can effectively reduce the impact of light levels on image quality under standard daylight conditions. The data were collected from 3 pm to 5 pm on 19 June 2024, during which the beef cattle were all at the edge of the feeding area with good light levels, facilitating data collection. The track was erected above the feeding area, and data were collected during feeding to obtain dorsal images of individual beef cattle. The farm feeds the beef cattle twice a day, from 5 am to 7 am and from 3 pm to 5 pm. The average age of the beef cattle is 180 ± 3 days, and the average body weight is 300 ± 20 kg. The collection equipment was a MOKOSE C100 visible light camera(Shenzhen, CN), fixed on a movable track above the cattle shed via a pan-tilt. The vertical distance from the camera to the ground was 2.9 m, and the distance to the feed area of the cattle shed was 0.75 m. The optical axis of the lens was kept parallel to the dorsal plane of the beef cattle to maximize the number of beef cattle in the field of view without distortion. The pan-tilt moved forward at a constant speed to ensure the stability of data collection. The schematic diagram of the back pattern image collection for group beef cattle is shown in Figure 1. Under natural conditions, videos of each cattle pen were shot for approximately 3 min, with a sampling rate of 30 fps/s and a resolution of 3840 × 2160 pixels, ensuring sufficient pixel density to avoid blurring of back pattern features due to insufficient resolution. OpenCV was used to frame the collected videos at an interval of 40 frames, i.e., extracting one frame every 1.33 s. A total of 4532 images were obtained after frame extraction of all videos. During the video data collection process, no treatment was performed on the back of beef cattle to ensure the authenticity and reliability of the acquired data, enabling the model to adapt to the complexity of real farming environments while reducing interference and stress on beef cattle.
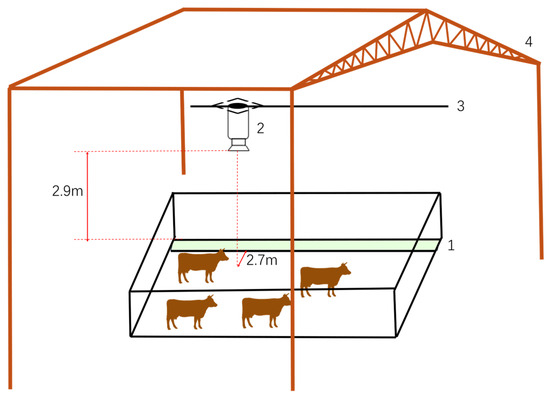
Figure 1.
Schematic diagram of the herb of beef cattle back pattern image collection: 1. feed area, 2. MOKOSE C100, 3. movable track, and 4. top shading shed.
2.2. Data Preprocessing
2.2.1. Data Filtering
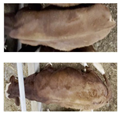
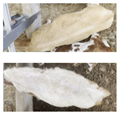
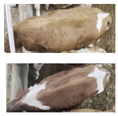
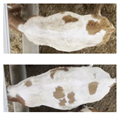
In the dataset obtained by frame extraction through OpenCV, some image data may be unusable, such as blurred images, images without beef cattle, or images containing only partial beef cattle. Therefore, the dataset was first manually screened by sampling frames at an interval of 2 frames and removing abnormal frames, resulting in a final dataset of 2397 images containing 95 beef cattle. All beef cattle were divided into 5 categories according to the color tone and pattern complexity of their back patterns, namely, dark solid color shading, light solid color shading, dark shading, light shading, and complex patterns. Among them, complex pattern beef cattle accounted for the highest proportion at 83.9%, followed by dark shading and light shading beef cattle at 82.9% and 79.0%, respectively, while dark solid color shading and light solid color shading beef cattle accounted for lower proportions at 15.1% and 2%, respectively. The specific composition and quantity of these 5 types of pattern beef cattle are shown in Table 1.

Table 1.
Beef cattle back pattern composition and its quantitative distribution.
2.2.2. Dataset
The LabelImg (LabelImg v1.8.1) software is used for visual image annotation to label the back boundaries of each beef cattle. After labeling with this software, corresponding XML label files are generated, which are then converted into TXT files suitable for training and testing with YOLO v5 and the improved YOLO v5 network through code. The dataset is divided into training and testing sets in a ratio of 8:2, with 2158 images for training and 238 images for testing. The selected data, as shown in Figure 2, are used to establish the YOLO-formatted dataset for precise individual recognition of beef cattle populations.
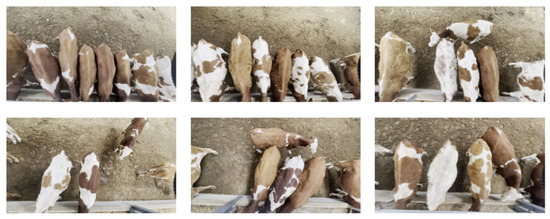
Figure 2.
Dataset of the back morphology of group beef cattle.
2.2.3. Image Resizing
To improve the training speed of the model, memory usage is reduced during training, the model’s generalization ability is enhanced, and inference speed and accuracy are accelerated. Before image input, OpenCV is used to resize the image data, adjusting the dimensions proportionally, fixing the width at 640 pixels, and calculating the height as height × (640/width). This results in resized image data that maintain the original aspect ratio, ultimately yielding an image size of 640 × 360 (width × height) for the dataset of cattle back shapes.
2.3. Improved YOLO v5 Network Structure
2.3.1. MCA Attention Mechanism
The MCA (Multidimensional Collaborative Attention) mechanism is a lightweight and efficient multi-dimensional collaborative attention mechanism [22], which can infer attention in both spatial and channel dimensions, enhance the feature extraction capability for the back morphology feature maps of group beef cattle, and further improve the detection accuracy. The specific implementation of the MCA attention mechanism mainly consists of three steps:
- (1)
- Branch structure captures feature dependencies
The MCA module is composed of three parallel branches. The top and middle branches are responsible for capturing feature dependency in the spatial dimension. The input feature map X of the back morphology of group beef cattle has a size of C × H × W (where C is the number of channels, H is the height, and W is the width). It is rotated X counterclockwise by 90° in the plane along the H-axis and W-axis, respectively, for the planar image. Through operations such as squeeze transformation and excitation transformation, attention weights XH′ and XW′ for the height and width dimensions are generated. These weights are then multiplied by XH and XW to obtain XH″ and XW″, which are rotated back to their original shapes to generate the height and width dimension-enhanced feature maps XH‴ and XW‴ of the back morphology of group beef cattle. The bottom branch is mainly used to capture interactions between channels in the feature map X. By performing an identity mapping on the input feature map X, the channel-dimensional feature map XC of the back morphology of group beef cattle is obtained. Through squeeze transformation and excitation transformation, the channel attention weight XC′, which is learned during this training process, is generated, which is then point-multiplied with the original channel-dimensional feature map XC to obtain the channel-dimension-enhanced feature map XC″.
- (2)
- Squeeze transformation
In the squeeze transformation, to better aggregate cross-dimensional feature responses in the back morphology feature maps of group beef cattle, both global average pooling and global standard deviation pooling operations are used to generate two different channel feature statistics. According to different stages of feature extraction for beef cattle back images, different weights are assigned to the features obtained from average pooling and standard deviation pooling, effectively combining these two types of features to enhance the expressive power of feature descriptors.
- (3)
- Excitation transformation
The excitation transformation aims to effectively capture local feature interactions between channels. By considering the interaction between each channel and its KC adjacent channels, 2D convolution operations are used to calculate channel feature weights. To adapt to feature learning at different stages, a gating mechanism is established to achieve efficient and effective capture of feature interactions, thereby better calculating the feature weights of the back morphology feature maps of group beef cattle in the H and W directions.
Finally, the feature maps XH‴, XW‴, and XC″ generated by the three branches are averaged and aggregated during the integration stage to obtain the final enhanced feature map X′ of the back morphology of group beef cattle. The network structure diagram is shown in Figure 3.
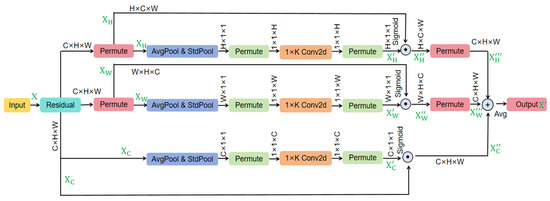
Figure 3.
MCA attention mechanism network architecture diagram.The full name of “avg” is average, the full name of “std” is standard deviation, the full name of “conv2d” is Convolution 2 dimensional.
2.3.2. SimAM Attention Module
SimAM attention module is a lightweight, parameter-free convolutional neural network attention mechanism that can infer attention at the pixel level [23], aiming to improve the recognition accuracy of adjacent cattle with similar back colors.
SimAM simulates the human visual system to directly estimate the 3-D weights of the group cattle back shape feature map. Due to the strong similarity of adjacent pixels and weak similarity of distant pixels in the group cattle back images, SimAM utilizes this characteristic to consider both spatial and channel dimensions, calculating pixel similarities to generate 3-D attention weights, assigning unique weights to neurons in different layers of the group cattle back shape feature map. The lower the neuron’s energy, the higher the importance level of attention.
The SimAM module assigns higher weights to neurons showing significant spatial inhibition by calculating the weights of neurons in different layers of the group cattle back shape feature map. The energy function of the neuron is defined as follows:
where and are the linear inverses of t and and are the target neuron and other neurons in a single channel of the input group cattle back shape feature map , i is the spatial dimension index, is the number of neurons in the channel, and is the transformed weight and bias.
The energy function assigned to each neuron by the SimAM attention module is as follows:
where E represents the minimum energy integrated over all channels and spatial dimensions of the neurons, and the Sigmoid monotonic function serves to suppress the value of E, preventing it from becoming too large. The structure diagram of SimAM is shown in Figure 4.
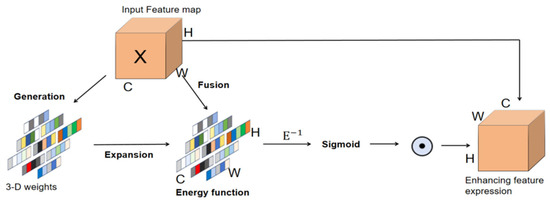
Figure 4.
SimAM attention module structure diagram.
2.3.3. MSR ATT Model
The MSR-ATT module separates and captures the feature dependencies of the height and width dimensions in the back morphology feature maps of group beef cattle through the MCA attention mechanism. It combines the SimAM attention module to calculate pixel-level spatial similarity and variance, generating 3D attention weights. Then, through residual connection, it fuses the original feature map with the enhanced feature map, enhancing spatial attention by reinforcing key spatial regions and suppressing irrelevant backgrounds. Additionally, the bottom branch of the MCA attention mechanism performs squeeze transformations via global average pooling and standard deviation pooling on the feature maps and captures inter-channel interactions through excitation transformations combining 2D convolution and gating mechanisms to generate channel attention weights. These weights are averaged and aggregated with the spatially enhanced feature maps, followed by fusion through residual connections to enhance channel attention. The specific steps are as follows:
Input the group beef cattle back morphology feature map X (dimensions B × C × H × W) into the MCA attention mechanism, where the top and middle networks of MCA process the width and height dimension features of feature map X, generating enhanced feature maps corresponding to these dimensions. The bottom network captures interactions between channels, generating channel attention weights, resulting in an enhanced feature map for the channel dimension. Enhanced feature maps from all three dimensions are fused and averaged to obtain the enhanced feature map X1.
Next, input X1 into the SimAM attention module, with X1 dimensions B × C × H × W, where B is the batch size of the enhanced group beef cattle back morphology feature map X1. Calculate the mean of X1 along height and width, maintaining the size of 1 for these dimensions, and perform broadcasting with X1 to get X2 with dimensions B × C × 1 × 1. Then, calculate the variance between X1 and X2; normalize each channel’s group beef cattle back morphology feature map, pass through a Sigmoid activation function, and multiply the resulting feature map with X1 to obtain the feature-fused group beef cattle back feature map X3.
Add X3 to the original group beef cattle back morphology feature map X via residual connection to obtain the final enhanced group beef cattle back morphology feature map X4. The network architecture diagram of the MSR-ATT module is shown in Figure 5.

Figure 5.
MSR-ATT module structure diagram.
2.3.4. Improve the Loss Function
Bounding box regression (BBR) is a crucial step in object localization and has been widely applied in object detection and instance segmentation. This paper employs a loss function based on minimum point distance [24], known as Loss Minimum Points Distance Intersection over Union (), for bounding box regression. We introduce Minimum Points Distance Intersection over Union (MPDIoU) as a new metric for comparing the similarity between predicted and ground truth bounding boxes during bounding box regression. A method for calculating MPDIoU between two axis-aligned matrices is proposed to enhance the training effect of bounding box regression, thereby improving convergence speed and regression accuracy. The comparison cases of different bounding box regressions are shown in Figure 6.
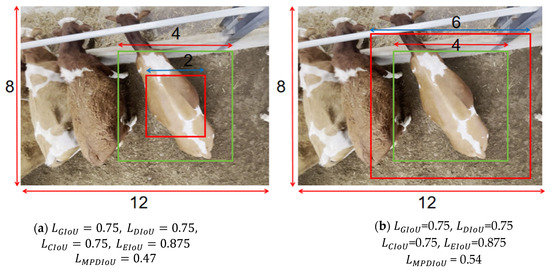
Figure 6.
Two cases with different bounding boxes’ regression results. The green boxes denote the ground truth bounding boxes, and the red boxes denote the predicted bounding boxes. The , , , between these two cases are exactly the same value, but their is different. The full name of “GIoU” is Generalized Intersection over Union. The full name of “EIoU” is Efficient Intersection over Union.
MPDIoU trains the model by minimizing the distances between the top-left and bottom-right corners of the predicted and ground truth bounding boxes. Given any two images A and B, where A, B ⊆ S, with widths and heights w and h, respectively, the calculation method is as follows:
- (1)
- For A and B, represents the coordinates of the top-left corner of A, and represents the coordinates of the bottom-right corner of A; represents the coordinates of the top-left corner of B, and represents the coordinates of the bottom-right corner of B.
- (2)
- Calculate
- (3)
- Calculate
- (4)
- Calculate
Based on the definition of , this paper defines the loss function as follows:
2.3.5. Improved YOLO v5 Network Framework
Through improvements in training strategies and model architecture, YOLO v5 enhances its generalization ability across different datasets and real-world applications while inheriting the speed and accuracy of the YOLO series [25,26]. Additionally, YOLO v5 employs more flexible option configurations and module designs, allowing researchers to customize models according to specific needs. This study integrates the MSR-ATT module, which combines the SimAM attention module and MCA attention mechanism through residual modules, into the last layer of YOLO v5’s neck network to improve the expression capability of group beef cattle back morphology features. The loss function is used in the head network for loss value calculation to accelerate model convergence and improve regression accuracy. An MSR-YOLO v5 network based on the MSR-ATT module is constructed to enhance the precision of individual identification in group beef cattle. The MSR-YOLO v5 network consists of the Input, Backbone, Neck, and Prediction sections. The network flow chart is shown in Figure 7.
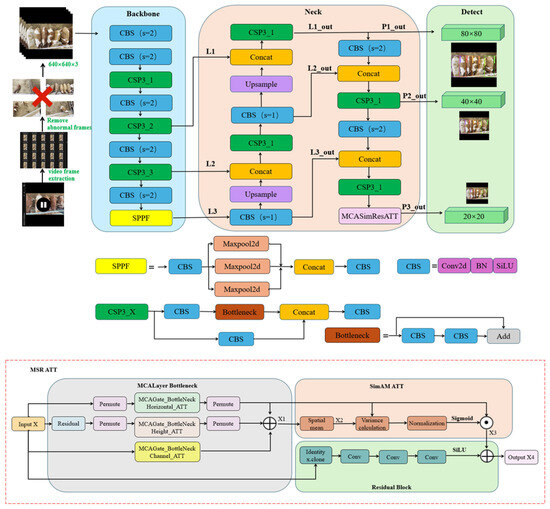
Figure 7.
Improved YOLO v5 model structure diagram.
The network training process is as follows:
- (1)
- Input: Group beef cattle back morphology videos are captured and frame-by-frame using OpenCV, resulting in image data of group beef cattle back morphology. Manual removal of duplicate frames, blurry frames, etc., yields filtered image data. OpenCV is then used to resize images to 640 × 360 resolution.
- (2)
- Backbone: Group beef cattle back morphology images with a resolution of 640 × 360 are padded with gray to obtain input images of 640 × 640 resolution. The backbone network uses CSP3_X, CBS, and SPPF modules to extract beef cattle back features from the images. Three effective feature layers are extracted: L1 (80 × 80 × 256), L2 (40 × 40 × 512), and L3 (20 × 20 × 1024).
- (3)
- Neck: The Neck network adopts the Feature Pyramid Network (PAFPN) architecture, enhancing the extraction of back morphology features of group beef cattle through CSP3_X, CBS, and MSR-ATT modules. The PAFPN structure utilizes a top-down path to transfer high-level semantic features (L3) to lower layers via upsampling operations, fusing them with corresponding scale feature layers L2 and L1. Meanwhile, through lateral connections, after adjusting the number of channels with 1 × 1 convolution, the feature layers L1, L2, and L3 output by the backbone network are added to the upsampled features to retain more scale details. The MSR-ATT modules are integrated into each level of the PAFPN, generating attention weights for each channel through their unique three-branch structure and fusing them into an enhanced back morphology feature map of group beef cattle to improve feature representation capability. The Neck network processes the beef cattle back morphology feature layers L1, L2, and L3, producing three enhanced feature layers: P1_out (80 × 80 × 256), P2_out (40 × 40 × 512), and P3_out (20 × 20 × 1024).
- (4)
- Prediction: The three enhanced features P1_out, P2_out, and P3_out from the Neck network are fed into the head network for accurate individual identification of group beef cattle. For each feature layer, convolutional layers in the YOLO head adjust the number of channels and store four spatial position information (predicted center point offset in x and y coordinates, predicted bounding box width and height), the confidence of the predicted bounding box, and the type of detected target. By modifying the loss function, a minimum point distance-based loss function is used to calculate the loss value between the prediction box and the ground truth box. For the coordinate regression branch, it adjusts the convolutional layer parameters via backpropagation to improve the localization accuracy of prediction boxes, compensating for the defects of traditional loss functions. This complements the feature enhancement model in the Neck network, jointly addressing the scenario requirements of dense targets and high similarity in the detection of closely clustered group beef cattle, thereby improving the accuracy of group beef cattle individual recognition.
2.3.6. Structured Pruning
Due to the increased size of the improved YOLO v5 model and excessive redundant parameters, storage costs significantly rise. To reduce overhead, this paper employs filter pruning to decrease the computational cost of the improved YOLO v5 model. Filter pruning is a naturally structured pruning method that does not introduce sparsity, eliminating the need for sparse libraries or specialized hardware [27]. Additionally, a one-time pruning and retraining strategy is adopted to save time on retraining across multiple layers.
The “ℓ1-norm” is used to select and prune unimportant filters. Pruning is performed in stages, with a single pruning rate set for all layers within each stage. During pruning, the activation of feature maps generated by each filter is first calculated. The specific steps include calculating the absolute sum of weights for each filter, sorting them, and removing the m filters with the smallest weight sums along with their corresponding feature maps. Simultaneously, the related kernels in the subsequent convolutional layer are also removed, and finally, a new core matrix is created, as shown in Figure 8.

Figure 8.
Pruning a filter leads to the removal of its corresponding feature map and the associated kernels in the subsequent layer.
To avoid introducing hierarchical parameters, the same pruning ratio is applied to all layers within the same stage, with a reduced pruning ratio for sensitive layers or skipping them. When pruning across multiple layers, consider two strategies: independent pruning (each layer independently selects filters to prune) and greedy pruning (calculating weights while excluding pruned feature maps’ kernels, considering previously removed filters). Although this method is not globally optimal, it maintains overall coherence and can preserve high network accuracy post-pruning, as shown in Figure 9.
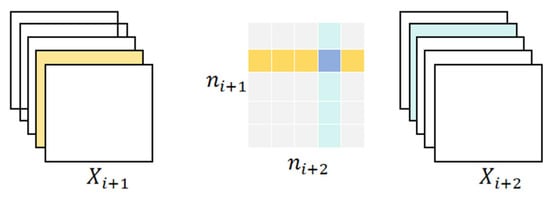
Figure 9.
Pruning filters between consecutive layers.
After pruning the filters, this paper adopts a one-time pruning and retraining strategy: pruning the filters of multiple layers at once, and then retraining until the original accuracy is restored.
3. Results
3.1. Test Platform
The experimental platform used for training the model is shown in Table 2. During training, the dataset selected was a self-built dataset for precise individual identification of beef cattle populations. The batch size was set to 32, the epoch was set to 100, and the initial learning rate was set to 0.001.

Table 2.
Experimental platform.
3.2. Improved YOLO v5 Precise Individual Identification Detection Results for Group Beef Cattle
To evaluate the effectiveness of the improved YOLO v5 model, precision (P), recall(R), and mean Average Precision (mAP) were used as evaluation criteria for detection performance, parameters, memory usage, floating-point operations (FLOPs), and average inference speed (Average Speed) were used as evaluation criteria for model complexity. Precision reflects the accuracy of the model’s prediction results, recall reflects the model’s ability to find all true targets, and mAP demonstrates the model’s detection performance across multiple categories; Params determine the size of the model file and the memory required for inference, serving as a standard for measuring algorithm spatial complexity; memory usage directly indicates the model’s complexity; FLOPs effectively measure algorithm temporal complexity; average inference speed refers to the average time required for model inference per image, providing a direct assessment of the model’s detection speed.
The evaluation indicators for detection performance are defined as follows:
TP is the number of beef cattle individuals correctly detected by the model; FN is the number of beef cattle individuals missed by the model; FP is the number of beef cattle individuals incorrectly detected by the model; N is the number of categories; AP is the area enclosed by the interpolated Precision–Recall curve and the X-axis.
In this study, six network models, including YOLO v11, YOLO v8, YOLO v7, YOLO v5, YOLO v5n, and the improved YOLO v5 proposed in this paper, were trained on the precise individual identification dataset of group beef cattle. The results are shown in Table 3. Within the same number of iterations, the YOLO v5 model exhibited higher recall and mAP compared to YOLO v11, YOLO v8, YOLO v7, and YOLO v5n. Specifically, the recall rates were 4.8%, 0.9%, 2.0%, and 2.5% higher, respectively, and the mAP values were 0.5%, 2.0%, 1.1%, and 1.4% higher, respectively. However, the precision was slightly lower than that of the YOLO v11 and YOLO v8 models, by 2.8% and 0.7%, respectively, while being 0.2% and 1.3% higher than that of the YOLO v7 and YOLO v5s models, respectively. In terms of model complexity, the YOLO v5 model had the smallest number of parameters among YOLO v11, YOLO v8, and YOLO v7, with reductions of 2.2 M, 5.0 M, and 4.4 M, respectively. The FLOPs of the YOLO v5 model were 4.75 G and 11.85 G lower than those of YOLO v11 and YOLO v8, but 3.55 and 12.25 higher than those of YOLO v7 and YOLO v5s, respectively. The average inference speed of the YOLO v5 model was 42.7%, 42.0%, and 13.3% lower than that of YOLO v11, YOLO v8, and YOLO v7, respectively, but 75.6% higher than that of YOLO v5n. Overall, the YOLO v5 model showed slightly lower precision but better performance in recall, mAP, parameter count, FLOPs, and average inference speed compared to YOLO v11 and YOLO v8. Compared to YOLO v7 and YOLO v5s, although the YOLO v5 model had larger parameter count and FLOPs and slower average inference speed, it performed better in precision, recall, and mAP. Considering these factors, this study chose to improve the YOLO v5 model, with a focus on optimizing its precision. The detection performance of the improved YOLO v5 model on the precise individual identification dataset of group beef cattle was improved by 6.2% in precision, 1.1% in recall, and 1.9% in mAP compared to the original YOLO v5 model.

Table 3.
Performance index of each model.
After improvements, the YOLO v5 model achieved enhancements in both detection accuracy and speed. Structural pruning significantly reduced the model’s parameters and memory usage, optimizing speed while enhancing detection performance, thus achieving model more lightweight, making it easier to deploy on resource-constrained devices. Training and validating the improved model on the cattle herd dataset, and comparing its detection performance with YOLO v11, YOLO v8, YOLO v7, original YOLO v5, and YOLO v5n for individual recognition of cattle herds, as shown in Figure 10, the red triangles indicate the beef cattle individuals missed in detection, and the red circles indicate the beef cattle individuals incorrectly detected. From Figure 10, it can be seen that the improved YOLO v5 model accurately identifies cattle individuals under conditions of high adhesion and similar coloration, as well as cattle at the edge of the field of view, outperforming the other four models. This indicates that the improved YOLO v5 model has good performance in precise individual identification of cattle herds.
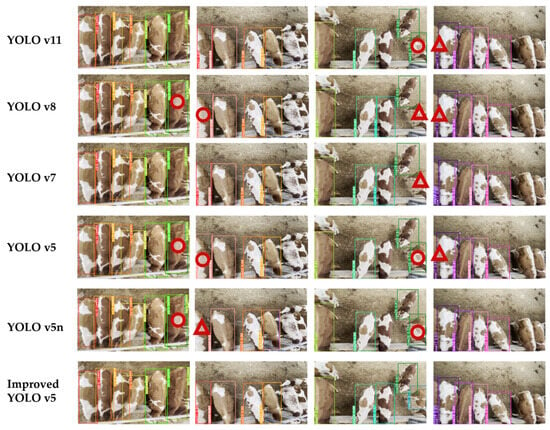
Figure 10.
Comparison of the effects of various models on the identification of individual beef cattle in groups.
3.3. Improved YOLO v5 Ablation Experiments and Analysis
To validate the effectiveness of the MSR-ATT module, this section compares the MCA attention mechanism and SimAM attention module with the YOLO v5 network, as shown in Table 4. Introducing only the MCA attention mechanism into the neck network of the YOLO v5 model increases precision to 91.5%, mAP to 96.4%, while recall rate and parameter count remain largely unchanged, with slight increases in memory usage and minor decreases in floating-point operations and average inference speed. Introducing only the SimAM attention module into the YOLO v5 model raises precision to 90.7%, recall rate to 93.9%, and mAP to 95.1%, with parameter count remaining constant, a slight increase in memory usage, and minor decreases in floating-point operations and average inference speed. Combining the SimAM attention module with the MCA attention mechanism through residual blocks results in the MSR-ATT module, which, when introduced into the YOLO v5 network, increases precision to 93.4%, recall rate to 93.7%, and mAP to 96.9%, with slight increases in parameter count and memory usage and minor decreases in floating-point operations and average inference speed.

Table 4.
Influence of the modules on the performance of the YOLO v5 algorithm.
The above tests demonstrate that introducing the SimAM attention module into the MCA attention mechanism via residual connections to form the MSR-ATT module and incorporating it into the YOLO v5 network enhances the accuracy of precise individual identification of cattle groups while maintaining the original model complexity.
After adding the MCA attention mechanism and SimAM attention module and improving the loss function, the model’s accuracy rises to 90.6%, mAP to 97.6%, with average inference speed decreasing to 0.1122 s, slight increases in parameter count and memory usage to 27.83 MB and 14.2 MB, respectively, and unchanged weight size, thus improving the accuracy and robustness of precise individual identification of cattle groups while maintaining the original model complexity. After structural pruning and retraining the model, accuracy increases to 93.2%, mAP to 97.6%, with significant reductions in parameter count, memory usage, and weight size to 13.22 MB, 13.8 MB, and 7.2 MB, respectively, and average inference speed decreases to 0.0746 s, with image resolution maintained at 640 throughout the process.
3.4. Analysis of Improvements in Loss Functions
The loss function improves positioning accuracy and robustness by combining the advantages of CIoU and MPDIoU, comprehensively considering bounding box overlap, center point distance, and aspect ratio, while enhancing the model’s convergence speed and reducing model loss. In this study, the training effects before and after the improvement were compared by demonstrating the convergence process of the validation set’s total loss during 100 training rounds. Figure 11 shows the curves of bounding box loss, object confidence loss, classification loss, and total loss before and after the improvement over 100 training rounds. The improved loss function achieved lower model losses in all aspects—bounding box loss, object confidence loss, and classification loss—thereby improving the model’s convergence speed. Specifically, the bounding box loss was reduced by 3.85 percentage points, object confidence loss by 0.25 percentage points, classification loss by 4.18 percentage points, and the total loss by 2.19 percentage points compared to the original. These improvements enhance the model’s convergence speed and regression accuracy, further strengthening its positioning precision.
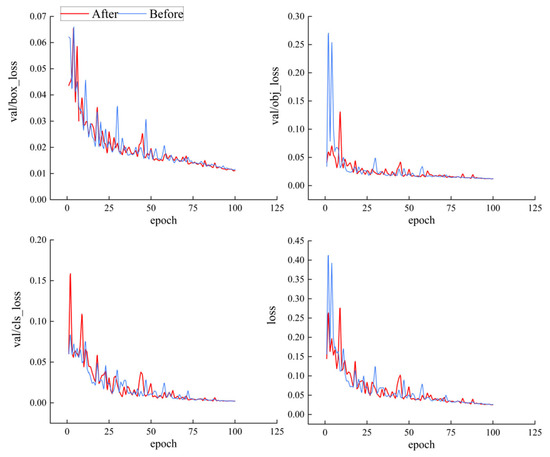
Figure 11.
Comparison of loss functions before and after improvement.
3.5. Pruning Effect of the Model
To verify the effect of structural pruning on lightweight, precise individual identification of group beef cattle, the models before and after pruning were compared across multiple indicators, with results shown in Table 5. Compared to the pre-pruning model, the post-pruning model experienced a 0.2 percentage point decrease in precision and a 1.3 percentage point decrease in mAP, but a 1.0 percentage point increase in recall. Additionally, FLOPs and Params were reduced by 53.19% and 52.50%, respectively, while the average detection speed increased by 34.16%.

Table 5.
Comparison of model performance before and after pruning.
The comparison of the number of channels before and after pruning is shown in Figure 12. The blue bar chart represents the number of channels in each convolutional layer before model pruning, while the red bar chart represents that after pruning. The improved YOLO v5 has a total of 68 convolutional layers, among which the first 31 convolutional layers constitute the model’s backbone network, the 32nd to 65th convolutional layers form the neck network (where the MSR-ATT attention modules are located in the 58th to 65th convolutional layers), and the 66th to 68th convolutional layers are the detection heads. We performed channel-wise pruning on 31 of these convolutional layers, including 20 in the backbone network and 11 in the neck network. The MSR-ATT modules and detection heads were not pruned, indicating that the improved YOLO v5 model has higher redundancy in the backbone network and the part of the neck network before the MSR-ATT modules. Pruning can effectively reduce model complexity without affecting model accuracy in these parts, while the MSR-ATT modules and detection heads have low redundancy, and pruning would significantly impact model accuracy; hence, no pruning was performed on these parts.
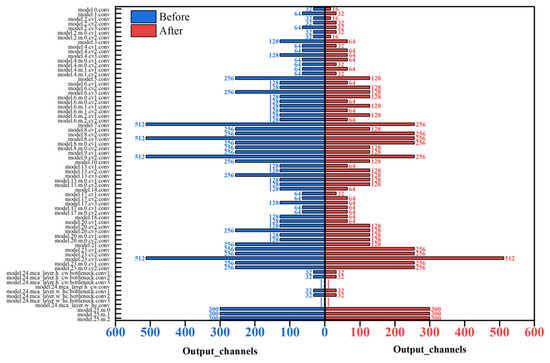
Figure 12.
Comparison chart of channel numbers before and after pruning.
The results indicate that although the precision of the pruned model decreased slightly, there were significant reductions in FLOPs and Params, and a substantial improvement in average detection speed. This makes the model well-suited for deployment on edge devices with limited computing power, facilitating model migration and application, and providing effective technical guidance for precise individual identification of group beef cattle in large-scale farms.
3.6. Improved YOLO v5 Results for Individual Identification of Beef Cattle with Different Coat Patterns
The back patterns of beef cattle are a primary factor affecting the performance of model recognition. Compared to complex patterns, some solid-colored beef cattle and those with fewer patterns pose difficulties for model recognition due to their uniform back color. To evaluate the effectiveness of the improved YOLO v5 in recognizing beef cattle with different back patterns in a group, as well as the degree of dependence of the improved model on the back patterns of beef cattle during recognition, this paper compares the recognition accuracy of different algorithms for beef cattle with different back patterns in the validation set, with the results shown in the Figure 13.
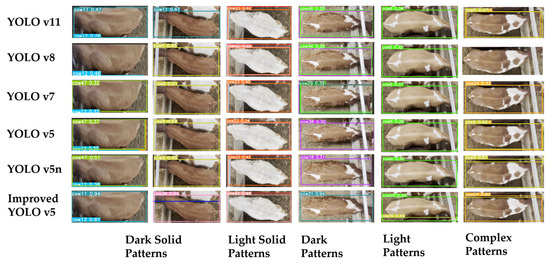
Figure 13.
Comparison of recognition effects of different models on beef cattle with various patterns.
As shown in Table 6, in all models, due to the indistinct back pattern characteristics of solid-colored Angus cattle, the recognition rates for both dark and light solid-colored Angus cattle are relatively low. Conversely, Angus cattle with complex patterns and dark or light solid backgrounds have higher recognition rates. The improved YOLO v5 model has recognition rates of 96.2%, 95.7%, 96.6%, 97.4%, and 99.6% for dark solid backgrounds, light solid backgrounds, dark patterns, light patterns, and complex patterns, respectively. This indicates that the improved YOLO v5 model can effectively extract Angus cattle features, reduce dependence on back patterns, and enhance recognition accuracy.

Table 6.
Performance indicators of different models in identifying beef cattle with different shading patterns.
4. Discussion
4.1. Advantages of the Improved YOLO v5
The improved YOLO v5 model proposed in this study, which integrates the MSR-ATT module, LPDIoU loss function, and structural pruning, offers a viable solution for the individual recognition of group beef cattle in large-scale farms. When compared with YOLO v11, YOLO v8, YOLO v7, YOLO v5, and YOLO v5n, the improved model demonstrates superior performance in accurately identifying individual beef cattle within groups. It not only enhances precision and mAP but also significantly reduces the average inference speed, fully validating its characteristics of high accuracy, high efficiency, and lightweight design. In the Neck network of the improved YOLO v5, the integration of the MSR-ATT module effectively captures spatial and channel-wise features from the back morphology of group beef cattle, notably enhancing the model’s ability to distinguish similar patterns between adjacent individuals. The detection head employs the LMPDIoU loss function, which is based on the minimum point distance, to optimize the positioning accuracy of bounding boxes and accelerate convergence. Structural pruning further reduces the model’s parameter count, memory footprint, and inference speed. On the test dataset, the improved YOLO v5 achieved a precision of 93.2%, a recall of 94.6%, an mAP of 97.6%, 13.22 M parameters, 7.84 G FLOPs, and an average inference speed of 0.0746 s. These metrics outperform the original YOLO v5 (87.7% precision, 95.8% mAP, 16.75 G FLOPs, 0.1133 s), confirming the effectiveness of the architectural improvements. Compared with YOLO v11, the improved model shows increases of 3.2% in precision, 3.8% in recall, and 2.4% in mAP, while reducing FLOPs by 63.5% and accelerating inference speed by 53.9%. Against YOLO v8, it improves precision by 5.4%, maintains comparable recall, elevates mAP by 3.9%, reduces FLOPs by 72.6%, and speeds up inference by 53.6%. When benchmarked against YOLO v7, the improved model exhibits 7.7% higher precision, 1.1% higher recall, 3.0% higher mAP, 40.6% fewer FLOPs, and 41.9% faster inference. Notably, although the improved YOLO v5 has 74.2% more FLOPs and a 15.7% slower inference speed than YOLO v5n, it achieves 7.5% higher precision, 1.5% higher recall, and 3.2% higher mAP. This trade-off suggests that YOLO v5n prioritizes speed at the expense of detection accuracy.
The improved YOLO v5 also demonstrates excellent performance in handling beef cattle with different pattern shadings. In the test set, the number of samples for beef cattle with dark solid color shading, light solid color shading, dark shading, light shading, and complex patterns is 17, 13, 164, 139, and 168, respectively. The improved model achieves precision rates of 96.2%, 95.7%, 96.6%, 97.4%, and 99.6% for recognizing these five pattern types, representing improvements of 13.4%, 17.3%, 2.4%, 6.6%, and 4.4% compared to the original YOLO v5 model. It can be observed that the improved model significantly outperforms the original in recognizing beef cattle with solid color patterns, indicating that it effectively reduces the model’s dependency on back patterns and can mine multi-dimensional features such as hair color distribution and body shape contours.
The improved YOLO v5 effectively captures the spatial and channel dimensions of back morphology feature maps of group beef cattle by fusing the MSR-ATT module, significantly enhancing the model’s ability to distinguish features of similar patterns between adjacent individuals. Ablation experiments show that after introducing the MSR-ATT module, the model precision increased from 86.5% to 93.4%, and the mAP increased from 94.8% to 96.9%, verifying its feature extraction advantages in complex scenarios. The adoption of the LMPDIoU loss function based on the minimum point distance significantly optimizes the bounding box regression effect by constraining the distance between the upper-left and lower-right corners of the prediction box and the ground truth box. Compared with the original loss function, the improved model’s bounding box loss increased by 3.85%, target confidence loss by 0.25%, classification loss by 4.18%, and total loss by 2.19%, with faster convergence and smaller positioning errors—especially in individual adhesion scenarios, where the miss detection rate and false detection rate significantly decreased. Through a pruning filter combined with a retraining strategy, the model’s parameter count was reduced from 27.83 M to 13.22 M (a 52.5% reduction), FLOPs from 16.75 G to 7.84 G (a 53.19% reduction), and average inference speed from 0.1133 s to 0.0746 s (a 34.16% improvement). The lightweight model maintains 93.2% precision and 94.6% recall, meeting the computing power constraints of edge devices and significantly enhancing the model’s practical deployment feasibility.
In summary, the improved YOLO v5 model achieves a balance between performance and efficiency in the task of individual recognition of group beef cattle, fully demonstrating the characteristics of high precision, high efficiency, and lightweight. From the perspective of practical application value, the improved YOLO v5 model, through the technical balance of high precision and lightweight, reduces hardware requirements, better adapts to edge devices with limited computing power, significantly enhances its adaptability in diversified scenarios and compatibility with edge devices, realizes real-time dynamic recognition of group beef cattle, provides a detection solution for complex breeding environments, and provides underlying data support for intelligent breeding with multi-technology integration. This provides technical support for the popularization and application of computer vision technology in the breeding industry and also provides valuable reference for follow-up research.
4.2. Future Work
Although the improved YOLO v5 model has performed well on the dataset in this study, it is only targeted at Simmental beef cattle and does not include research on other breeds of beef cattle or even cross-breed scenarios, and the dataset size is limited. Therefore, in the future, we will include different breeds of beef cattle, covering individuals with different coat colors and body types, to improve the cross-breed generalization ability of the model; integrate multi-modal data, such as infrared images or depth images, to further improve the stability of model recognition, especially under complex lighting or environmental conditions.
5. Conclusions
Precise individual identification of group beef cattle is crucial for achieving modern large-scale farming, especially when adjacent beef cattle are difficult to distinguish based solely on their back patterns. Traditional methods often struggle with these challenges, failing to accurately identify individual beef cattle when their back patterns are similar. To address these issues, this paper proposes an improved YOLO v5 model that includes an MSR-ATT module to enhance detection accuracy, employs the loss function to improve localization accuracy, and applies structured pruning to significantly reduce model parameters, making it easier to deploy on edge devices with limited computational power. The improved YOLO v5 presents an efficient, lightweight solution for identifying individual beef cattle within groups, accelerating the application of deep learning in modern large-scale farming. In the future, we aim to enrich the dataset composition to support cross-breed and cross-domain research, further promoting the practical application of individual identification of group beef cattle.
Author Contributions
Conceptualization, Z.L.; methodology, Z.L.; software, Y.L.; validation, Z.L., T.M. and Y.Z.; formal analysis, Z.L.; investigation, Y.L.; resources, G.L.; data curation, Z.L.; writing—original draft preparation, Z.L. and T.M.; writing—review and editing, Y.Z. and, X.K.; visualization, X.K.; supervision, X.K.; project administration, G.L.; funding acquisition, G.L. All authors have read and agreed to the published version of the manuscript.
Funding
This research was funded by the National Key Research and Development Program of China, grant number 2021YFD130050201.
Institutional Review Board Statement
Ethical review and approval were waived for this study due to the non-invasive and observational nature of the research methods used. Specifically, this study involved only the use of overhead imaging technology to recognize individual cattle from a distance without any physical contact or interference with their natural behaviors or environment. This approach does not impact the welfare or health of the animals, thereby making traditional ethical review and approval unnecessary.
Informed Consent Statement
Not applicable.
Data Availability Statement
The data presented in this study are available upon request from the corresponding author. The data are not publicly available due to the privacy policy of the author’s institution.
Acknowledgments
We thank all the funders.
Conflicts of Interest
The authors declare no conflicts of interest.
References
- Menezes, G.L.; Alves, A.A.C.; Negreiro, A.; Ferreira, R.E.P.; Higaki, S.; Casella, E.; Rosa, G.J.M.; Dorea, J.R.R. Color-independent cattle identification using keypoint detection and siamese neural networks in closed- and open-set scenarios. J. Dairy Sci. 2025, 108, 1234–1245. [Google Scholar] [CrossRef] [PubMed]
- Meng, Y.; Yoon, S.; Han, S.; Fuentes, A.; Park, J.; Jeong, Y.; Park, D.S. Improving known–unknown cattle’s face recognition for smart livestock farm management. Animals 2023, 13, 3588. [Google Scholar] [CrossRef] [PubMed]
- Zhang, H.; Zhang, Y.; Niu, K.; He, Z. Neural network-based method for contactless estimation of carcass weight from live beef images. Comput. Electron. Agric. 2025, 229, 109830. [Google Scholar] [CrossRef]
- Tong, L.; Fang, J.; Wang, X.; Zhao, Y. Research on cattle behavior recognition and multi-object tracking algorithm based on yolo-bot. Animals 2024, 14, 2993. [Google Scholar] [CrossRef]
- Awad, A.I. From classical methods to animal biometrics: A review on cattle identification and tracking. Comput. Electron. Agric. 2016, 123, 423–435. [Google Scholar] [CrossRef]
- Williams, L.R.; Fox, D.R.; Bishop-Hurley, G.J.; Swain, D.L. Use of radio frequency identification (rfid) technology to record grazing beef cattle water point use. Comput. Electron. Agric. 2019, 156, 193–202. [Google Scholar] [CrossRef]
- Li, J.; Yang, Y.; Liu, G.; Ning, Y.; Song, P. Open-set sheep face recognition in multi-view based on li-sheepfacenet. Agriculture 2024, 14, 1112. [Google Scholar] [CrossRef]
- Kumar, S.; Singh, S.K.; Abidi, A.I.; Datta, D.; Sangaiah, A.K. Group sparse representation approach for recognition of cattle on muzzle point images. Int. J. Parallel. Program 2018, 46, 812–837. [Google Scholar] [CrossRef]
- Barry, B. Using muzzle pattern recognition as a biometric approach for cattle identification. Trans ASABE 2007, 50, 1073–1080. [Google Scholar] [CrossRef]
- Li, G.; Erickson, G.E.; Xiong, Y. Individual beef cattle identification using muzzle images and deep learning techniques. Animals 2022, 12, 1453. [Google Scholar] [CrossRef]
- Zhao, K.; Wang, J.; Chen, Y.; Sun, J.; Zhang, R. Individual identification of holstein cows from top-view rgb and depth images based on improved pointnet++ and convnext. Agriculture 2025, 15, 710. [Google Scholar] [CrossRef]
- He, D.; Liu, J.; Xiong, H.; Lu, Z. Individual Identification of Dairy Cows Based on Improved YOLO v3. Trans. Chin. Soc. Agric. Mach. 2020, 51, 250–260. [Google Scholar] [CrossRef]
- Hu, H.; Dai, B.; Shen, W.; Wei, X.; Sun, J.; Li, R.; Zhang, Y. Cow identification based on fusion of deep parts features. Biosyst. Eng. 2020, 192, 245–256. [Google Scholar] [CrossRef]
- Achour, B.; Belkadi, M.; Filali, I.; Laghrouche, M.; Lahdir, M. Image analysis for individual identification and feeding behaviour monitoring of dairy cows based on convolutional neural networks (cnn). Biosyst. Eng. 2020, 198, 31–49. [Google Scholar] [CrossRef]
- Paudel, S.; Brown-Brandl, T.; Rohrer, G.; Sharma, S.R. Deep learning algorithms to identify individual finishing pigs using 3d data. Biosyst. Eng. 2025, 255, 104143. [Google Scholar] [CrossRef]
- Zhang, H.; Zheng, L.; Tan, L.; Gao, J.; Luo, Y. Yolox-s-tkecb: A holstein cow identification detection algorithm. Agriculture 2024, 14, 1982. [Google Scholar] [CrossRef]
- Song, H.; Li, R.; Wang, Y.; Jiao, Y.; Hua, Z. Recognition Method of Heavily Occluded Beef Cattle Targets Based on ECA-YOLO v5s. Trans. Chin. Soc. Agric. Mach. 2023, 54, 274–281. [Google Scholar] [CrossRef]
- Wu, D.; Yin, X.; Jiang, B.; Jiang, M.; Li, Z.; Song, H. Detection of the respiratory rate of standing cows by combining the deeplab v3+ semantic segmentation model with the phase-based video magnification algorithm. Biosyst. Eng. 2020, 192, 72–89. [Google Scholar] [CrossRef]
- Zhang, H.; Wang, R.; Dong, P.; Sun, H.; Li, S.; Wang, H. Beef Cattle Multi-target Tracking Based on DeepSORT Algorithm. Trans. Chin. Soc. Agric. Mach. 2021, 52, 248–256. [Google Scholar] [CrossRef]
- Ren, S.; He, K.; Girshick, R.; Sun, J. Faster r-cnn: Towards real-time object detection with region proposal networks. IEEE Trans. Pattern Anal. Mach. Intell. 2017, 39, 1137–1149. [Google Scholar] [CrossRef]
- Wei, L.; Dragomir, A.; Dumitru, E.; Christan, S.; Scott, R.; Cheng, Y. SSD: Single Shot MultiBox Detector. In Proceedings of the 14th European Conference on Computer Vision (ECCV 2016), Amsterdam, The Netherlands, 8–16 October 2016; pp. 21–37. [Google Scholar] [CrossRef]
- Yu, Y.; Zhang, Y.; Cheng, Z.; Song, Z.; Tang, C. Mca: Multidimensional collaborative attention in deep convolutional neural networks for image recognition. Eng. Appl. Artif. Intell. 2023, 126, 107079. [Google Scholar] [CrossRef]
- Yang, L.; Zhang, R.; Li, L. SimAM: A Simple, Parameter-Free Attention Module for Convolutional Neural Networks. In Proceedings of the 38th International Conference on Machine Learning (ICML 2021), Vienna, Austria, 18–24 July 2021. [Google Scholar] [CrossRef]
- Siliang, M.; Yong, X. MPDIoU: A Loss for Efficient and Accurate Bounding Box Regression. arXiv 2023, arXiv:2307.07662. [Google Scholar] [CrossRef]
- Simonyan, K.; Zisserman, A. Very deep convolutional networks for large-scale image recognition. arXiv 2014, arXiv:1409.1556. [Google Scholar] [CrossRef]
- He, K.; Zhang, X.; Ren, S.; Sun, J. Deep residual learning for image recognition. In Proceedings of the IEEE Conference on Computer Vision and Pattern Recognition, Las Vegas, NV, USA, 27–30 June 2016; pp. 770–778. [Google Scholar] [CrossRef]
- Hao, L.; Asim, K.; Igor, D.; Hanan, S.; Hans, P. Pruning Filters for Efficient ConvNets. In Proceedings of the IEEE International Conference on Learning Representations, Toulon, France, 24–26 April 2017. [Google Scholar] [CrossRef]
Disclaimer/Publisher’s Note: The statements, opinions and data contained in all publications are solely those of the individual author(s) and contributor(s) and not of MDPI and/or the editor(s). MDPI and/or the editor(s) disclaim responsibility for any injury to people or property resulting from any ideas, methods, instructions or products referred to in the content. |
© 2025 by the authors. Licensee MDPI, Basel, Switzerland. This article is an open access article distributed under the terms and conditions of the Creative Commons Attribution (CC BY) license (https://creativecommons.org/licenses/by/4.0/).
