1. Introduction
In the broader context of global climate change and the accelerating pace of urbanization [
1,
2], food security [
3] and water resource security [
4]—cornerstones of national security [
5,
6]—face significant challenges to their sustainable development. Globally and within China, the compounded pressures of population growth, economic development, and climate variability [
7,
8,
9] have intensified the conflict between agricultural development and the limited and uneven spatiotemporal distribution of water resources [
10,
11]. The traditional, extensive model of agricultural development, characterized by excessive water consumption [
12], not only precipitates ecological and environmental degradation but also contradicts the national strategic imperative of “high-quality development” [
13]. This strategic orientation demands not merely increased agricultural productivity but also emphasizes sustainable, efficient, and sustainable practices [
14]. Against this backdrop, achieving high-quality agricultural development under the constraints of limited water resources emerges as a critical and pressing challenge requiring urgent resolution.
To elucidate the pivotal interrelationship between agricultural development quality and water resource carrying capacity [
15], this study defines the “Agricultural Quality Index (QAI)” as a multidimensional construct encompassing economic efficiency, social benefits, ecological integrity, technological advancement, and resource utilization effectiveness [
16,
17], fundamentally distinct from mere quantitative growth. Conversely, the “Water Carrying Capacity Index (WCI)” denotes the maximum capacity of a regional water resource system to sustainably support agricultural development while preserving ecosystem health [
18,
19]. High-quality agricultural development is contingent upon the effective provision of water resources [
20,
21]; however, prevailing agricultural practices—such as excessive irrigation and the overuse of substandard fertilizers and pesticides—risk exceeding regional water resource limits, thereby engendering intrinsic contradictions that undermine agricultural sustainability [
22,
23]. Consequently, the core scientific inquiry of this study centers on precisely evaluating the levels of regional agricultural development quality and water carrying capacity and clarifying their interactive mechanisms. This article aims to outline strategies for optimizing regional agricultural development pathways under the constraints of water carrying capacity.
As a linchpin of national economic growth [
24], a cornerstone of the Western Development Strategy, and an ecological bulwark in the upper reaches of the Yangtze River, the Chengdu-Chongqing region occupies a position of paramount strategic importance in China’s national development framework [
25]. The region’s agricultural prominence is particularly marked, serving as a vital national grain production hub and a base for distinctive agricultural products [
26]. Nevertheless, the Chengdu-Chongqing region grapples with a series of complex water resource challenges [
27,
28]. Despite a relatively abundant total water resource volume, its spatiotemporal distribution is markedly uneven, compounded by issues of engineered water shortages and water quality degradation. In certain areas, the degree of water resource exploitation is already high; although transboundary water flows are substantial, local water resource utilization remains a point of acute dispute. Moreover, rapid urbanization and industrialization have exerted significant pressure on agricultural water use [
29]. Against the backdrop of China’s vigorous promotion of the Chengdu-Chongqing Economic Circle [
30], coupled with an emphasis on ecological prioritization and green development, investigating the synergistic relationship between agricultural development quality and water carrying capacity in this region holds profound practical significance and exemplary value.
Based on a comprehensive review of international research, this study identifies that existing literature on agricultural development quality assessment predominantly focuses on unidimensional analyses. For instance, Chinese scholars often adopt perspectives akin to the Yangtze River Economic Belt, emphasizing the interplay between agriculture and economic outcomes [
31] or environmental factors [
32]. In contrast, scholars from developed nations, such as those in the United States, tend to examine agricultural development through a singular environmental lens, focusing on ecological impacts [
33]. Similarly, German researchers frequently associate agricultural development changes with abrupt drought events, analyzing their implications in isolation [
34]. Although studies in China’s Shandong Province have attempted to construct composite indicator systems to evaluate agricultural quality [
35], in-depth assessments tailored to specific regions and incorporating water resource constraints remain limited. In the realm of water carrying capacity assessment, prevailing methodologies include composite evaluation approaches [
36], system dynamics modeling [
37], and analytic hierarchy processes [
38]. However, evaluations specific to agricultural water carrying capacity—particularly those addressing water quality, ecological water demands, and dynamic assessments under future scenarios—require further advancement. Regarding the interrelationship between agricultural development quality and water carrying capacity, some studies have examined the unidirectional influence of water resources on agriculture or conducted superficial correlation analyses [
39,
40]. Nevertheless, comprehensive investigations into the coupled coordination mechanisms and dynamic evolutionary patterns of these two complex systems remain underdeveloped. As for optimization strategies, existing approaches predominantly focus on isolated water resource management adjustments, such as advancements in water-saving technologies in Iran [
41] or water pricing reforms in Italy [
42]. However, there is a notable absence of systematic and differentiated optimization pathways grounded in the diagnosis of coupled coordination states.
In light of these considerations, research on the comprehensive assessment of the “agricultural development quality” and “water carrying capacity” systems within the specific geographic context of the Chengdu-Chongqing region, coupled with an in-depth exploration of their coordinated interrelationship and the formulation of targeted optimization strategies, remains in its nascent stages. Given the identified research gaps and contextual background, this study employs an integrated application of advanced methodologies, including standard deviational ellipse [
43] and spatial disparity coefficient analyses [
44], to systematically evaluate the spatiotemporal evolutionary characteristics of agricultural development quality in the Chengdu-Chongqing region [
45,
46,
47]. By leveraging the TOPSIS composite evaluation method, augmented by obstacle degree modeling [
48], this study precisely measures the levels and trends of water carrying capacity oriented toward agriculture [
49,
50]. Synthesizing these findings, the study elucidates the coupled coordination dynamics and spatiotemporal divergence patterns between QAI and WCI in the Chengdu-Chongqing region [
51]. Furthermore, grey prediction modeling [
52] is utilized to forecast future developmental trends, enabling the formulation of optimization strategies for achieving high-quality agricultural development and sustainable water resource utilization in the region. These strategies aim to provide robust theoretical support and practical guidance for regional sustainable development.
2. Materials and Methods
2.1. Data Sources
The primary data for this study were obtained from authoritative and systematic official statistical yearbooks and bulletins. Key sources for assessing the quality of agricultural development include the Sichuan Statistical Yearbook (2014–2023) and the Chongqing Statistical Yearbook (2014–2023). Data related to water carrying capacity were primarily drawn from the China Water Resources Bulletin, Sichuan Water Resources Bulletin, Chongqing Water Resources Bulletin, and the China City Statistical Yearbook. Although these sources are generally robust and reliable, the study acknowledges potential limitations arising from data publication delays, inconsistencies in statistical methodologies, constraints in data precision, and incomplete coverage of certain indicators. To mitigate these challenges, the study employed a combination of analytical strategies—including multivariate system analysis, grey forecasting models, and coefficient of variation analysis. These methodological approaches were designed to enhance data reliability and reinforce the overall rigor and validity of the research findings. In addition, the data processing software used in this paper includes SPSS (Version 31.0.0), ArcGIS (Version 10.8.2), Microsoft Office (Version 16.0.17932.20360), and Python (Version 3.13.4).
2.2. Evaluation of the Two-System Index and Determination of Indicator Weights
Agricultural development quality [
53] encapsulates the composite quality of rural construction, human living environments, infrastructure, and economic progress. To this end, this study constructs a comprehensive evaluation framework encompassing four subsystems—economic, demographic, spatial, and social—to holistically assess the quality of agricultural and rural development. The evaluation of water carrying capacity [
54,
55], informed by prior research, is predicated on dimensions including natural water resource endowments, water environmental protection, and water resource utilization. Accordingly, an indicator-based evaluation system was established, comprising three subsystems—socio-hydrological, resource-based, and ecological—as detailed in
Table 1. The selection of the Agricultural Quality Index (AQI) and Water Resource Carrying Capacity Index (WCI) indicators was guided by the multi-dimensional nature of sustainable development goals in the study area. AQI components, such as the level of agricultural mechanization and the gross output value of agriculture, reflect regional economic efficiency, while indicators like the level of rural social security and rural disposable income capture socio-economic benefits. Additionally, variables such as the effectively irrigated area and per capita road area serve to supplement the spatial dimension of agricultural development. WCI indicators, including annual precipitation and water resource utilization rate, directly correspond to the availability of physical resources and the pressure on those resources. Furthermore, indicators such as the agricultural pollutant treatment rate highlight the ecological aspect of water resource management. This selection aligns with policy documents such as the Strategic Plan for Coordinated Development of Agriculture and Water Resources in the Chengdu-Chongqing Region (2020–2025), effectively reflecting regional challenges in balancing urban expansion and water demand amidst rapid urbanization.
For instance, indicators such as A11 and A12 represent the first and second metrics under the first criterion layer, respectively. Here, the prefix “A” refers to the agricultural quality system, while “B” denotes the water resource system. This classification and labeling approach serve to systematically organize the indicator data and helps avoid confusion during subsequent formula-based calculations. Based on the above indicators, data standardization processing was mostly carried out using range standardization in this paper. To ensure the accuracy of entropy-based weighting, the indicators in this study were classified into positive (+) and negative (−) categories and normalized using the following formulas. This process effectively eliminates differences in units and magnitudes across indicators, enabling further calculations while also preventing potential over-weighting during the computation process:
Among them, based on previous experience, the calculation formulas for the agricultural quality index and water resources carrying capacity index of each city are as follows:
where AQI represents the Agricultural Quality Index, and WCI denotes the Water Resource Carrying Capacity Index;
signifies the weight of the criterion layer subsystem, and
represents the standardized value of each indicator datum. For the remaining comprehensive evaluation models in this study, the entropy weight method is employed to calculate indicator weights, ensuring the objectivity of the weighting process.
2.3. TOPSIS Comprehensive Evaluation Assisted by Obstacle Degree Model
2.3.1. TOPSIS Comprehensive Evaluation Model
The TOPSIS (Technique for Order of Preference by Similarity to Ideal Solution) model [
56], which evaluates systems based on positive and negative ideal solutions, ranks evaluation objects by calculating their distances and proximity to these ideal solutions, thereby determining their relative performance. The model incorporates all indicators listed under the Water Resource Carrying category in
Table 1. In addition, it adopts the entropy-based weights (
) previously calculated for each criterion layer within the water resource system. Based on the nature of each indicator—whether it is positively or negatively oriented—the data are first normalized and then substituted into the following formulas. Specifically, the positive and negative ideal solutions (
) are derived from the normalized indicator values. Using these values, the weighted Euclidean distances
and
are calculated. Finally, the relative closeness coefficient is computed using Equation (9), providing an integrated measure
of the water resource carrying capacity. Drawing on prior research [
57], this study categorizes the derived data into five levels based on threshold values of 0.2, 0.3, 0.5, and 0.7: namely, 0 <
≤ 0.2 (Level V: Extremely Poor), 0.2 <
≤ 0.3 (Level IV: Poor), 0.3 <
≤ 0.5 (Level III: Good), 0.5 <
≤ 0.7 (Level II: High Quality), and 0.7 <
< 1 (Level I: Extremely High). The computational steps are as follows:
2.3.2. Obstacle Degree Model
Barrier degree analysis of water resource carrying capacity represents an advanced approach to evaluation, enabling the diagnosis and quantification of limiting factors and their impact through the application of the barrier degree model [
58]. This method is critical for enhancing regional water resource carrying capacity. Specifically, a lower barrier degree value for a given indicator signifies a less pronounced constraint on WCI. The barrier degree calculation formula is:
represents the obstacle degree; represents the factor contribution degree; represents the index deviation degree; represents the weight of the index; represents the weight of the subsystem to which the index belongs; represents the normalized index value.
2.4. Analysis of Spatiotemporal Characteristics and Research on Action Mechanism
Given the intricate and complex interplay between water resource carrying capacity and agricultural development quality, as well as the complexity of their evolutionary characteristics and underlying mechanisms, this study conducts a comprehensive analysis of the spatiotemporal evolutionary characteristics, influencing factors, and interaction mechanisms of these two systems. The spatial relationship is modeled as follows.
2.4.1. Standard Deviational Ellipse Model
The standard deviational ellipse [
59] is a spatial statistical analysis method that primarily focuses on revealing the global characteristics of geographic element distributions. The core reason for selecting this model lies in its ability to effectively reveal the global features of spatial distribution, including distribution centroid, directional bias, and dispersion. This study centers on the spatiotemporal evolution of the Agricultural Quality Index (AQI) and Water Capacity Index (WCI) in the Chengdu-Chongqing region, with an emphasis on quantifying the directional shifts and diffusion trends of both indices. By calculating the lengths of the major and minor axes, orientation angles, and centroid coordinates, the standard deviational ellipse can intuitively present the “core-edge” structural changes in the spatial distribution of AQI and WCI. For example, an expansion of the ellipse’s area reflects an enlargement in the scope of influence, while the shift in orientation angles reveals preferential development directions. This approach provides critical support for identifying spatial heterogeneity in regionally coordinated development:
In the formula, represent the weighted second-order central moments of the studied variables in the x and y directions, respectively. These moments quantify the degree of dispersion of coordinate values from their weighted means. Here, denotes the weight assigned to the i city, while refer to the weighted mean coordinates, emphasizing the dominant influence of core cities on the spatial distribution center. The term , representing the weighted second-order mixed central moment, captures the co-dispersion characteristics in both the x and y directions and serves as a critical indicator for determining the directional tendency of spatial distribution.
Based on Equation (12), the azimuth angle of the major axis (
) can be derived. The numerator of this equation integrates the bidirectional dispersion differences and the coupling effect of the mixed moment, while the denominator magnifies the impact of the mixed moment to precisely identify the orientation of the ellipse’s major axis. Ultimately, variations in
reveal the evolving spatial distribution patterns of agricultural and water resource indicators in the Chengdu-Chongqing region.
In the formula, δx and δy represent the standard deviations along the X-axis and Y-axis, respectively, serving as numerical bases for a detailed interpretation of the ellipse’s characteristics.
2.4.2. Spatial Disparity Coefficient
This research adopts the Spatial Coefficient of Variation (sCoV) [
60] to quantify the degree of spatial heterogeneity in the distribution of AQI and WCI. This metric, calculated by the ratio of the intersection area to the union area of the ellipses, can precisely reflect the temporal variations in the spatial alignment of both systems. For instance, an increase in the sCoV value indicates an expanding difference, while a decrease suggests an improvement in coordination. Compared to the traditional coefficient of variation, the sCoV offers a significant advantage by integrating spatial topological relationships, which directly link to the effectiveness of regional policy implementation. Another key reason for choosing this model is its methodological complementarity with the standard deviational ellipse: the former depicts the spatial distribution’s morphological characteristics, while the latter quantifies the degree of system matching.
where P and I represent the ellipse areas characterizing water resource carrying capacity and urbanization quality, respectively;
and
denote the intersection and union areas of the two ellipses, respectively; A and R represent the similarity coefficient and spatial difference coefficient for water resource carrying capacity and urbanization, respectively, with values ranging from 0 to 1. An increase in the R-value indicates heightened spatial heterogeneity, while a decrease reflects the opposite trend.
2.5. Grey Prediction Model
Grey system theory [
61], which specializes in medium- and short-term forecasting and the analysis of uncertain information, has become an essential tool for trend prediction in various domains, including transportation, short-term stock market forecasting [
62], foreign exchange rates, and the energy sector [
63]. Among its models, the GM(1,1) model is particularly renowned for its adaptability and intuitive nature, making it widely used in grey prediction. Given that the data in this study exhibit “small sample” characteristics (with only ten years of data from 2013 to 2022) and “uncertainty” due to factors such as climate changes and policy adjustments, the GM(1,1) model is the optimal choice for trend forecasting. This model does not require strict adherence to the normal distribution assumption of the data. By accumulating the sequence to reduce randomness, it offers high forecasting accuracy for short-term predictions. Furthermore, the GM(1,1) model is well-suited to the nonlinear evolution of the agricultural-water resource system in the Chengdu-Chongqing region under the “dual carbon” targets. It can effectively simulate scenarios involving technological innovations (such as smart irrigation) and policy interventions (such as farmland protection), providing a scientific basis for risk assessment before 2026:
Their first-order accumulated generation equation is:
The grey differential equation of the traditional grey model GM(1,N) is:
where the background value is:
The whitened equation is:
For the more complex Formula (24), the matrix X is a design matrix related to the grey model GM(1,N), where each row corresponds to a specific time point k (). Taking the first row as an example, is calculated based on the background value formula (19). The subsequent entries () represent the first-order accumulated generating values of the variable () at time point 2. The subsequent rows follow this pattern, corresponding to the relevant values at different time points. As for the matrix Y, it is a column vector consisting of the values of the original sequence at time k (), meaning that the entries in matrix Y are the target values that the model aims to fit. Through , the simulated values and predicted values of the original sequence are calculated. If the time series changes significantly within the time interval , the time response function of the GM(1,1) model constructed based on them can be substituted into Equation (20) to obtain the analytical expression of the time response equation of the GM(1,N) model. This study evaluates the results of the GM(1,1) model by comparing them with actual values using the Mean Absolute Percentage Error (MAPE). If the MAPE value is below 5%, it indicates that the predictive model demonstrates a high level of accuracy.
3. Results
3.1. Water Resources Carrying Capacity Analysis
3.1.1. Analysis of Water Resources Carrying Capacity Using TOPSIS Evaluation
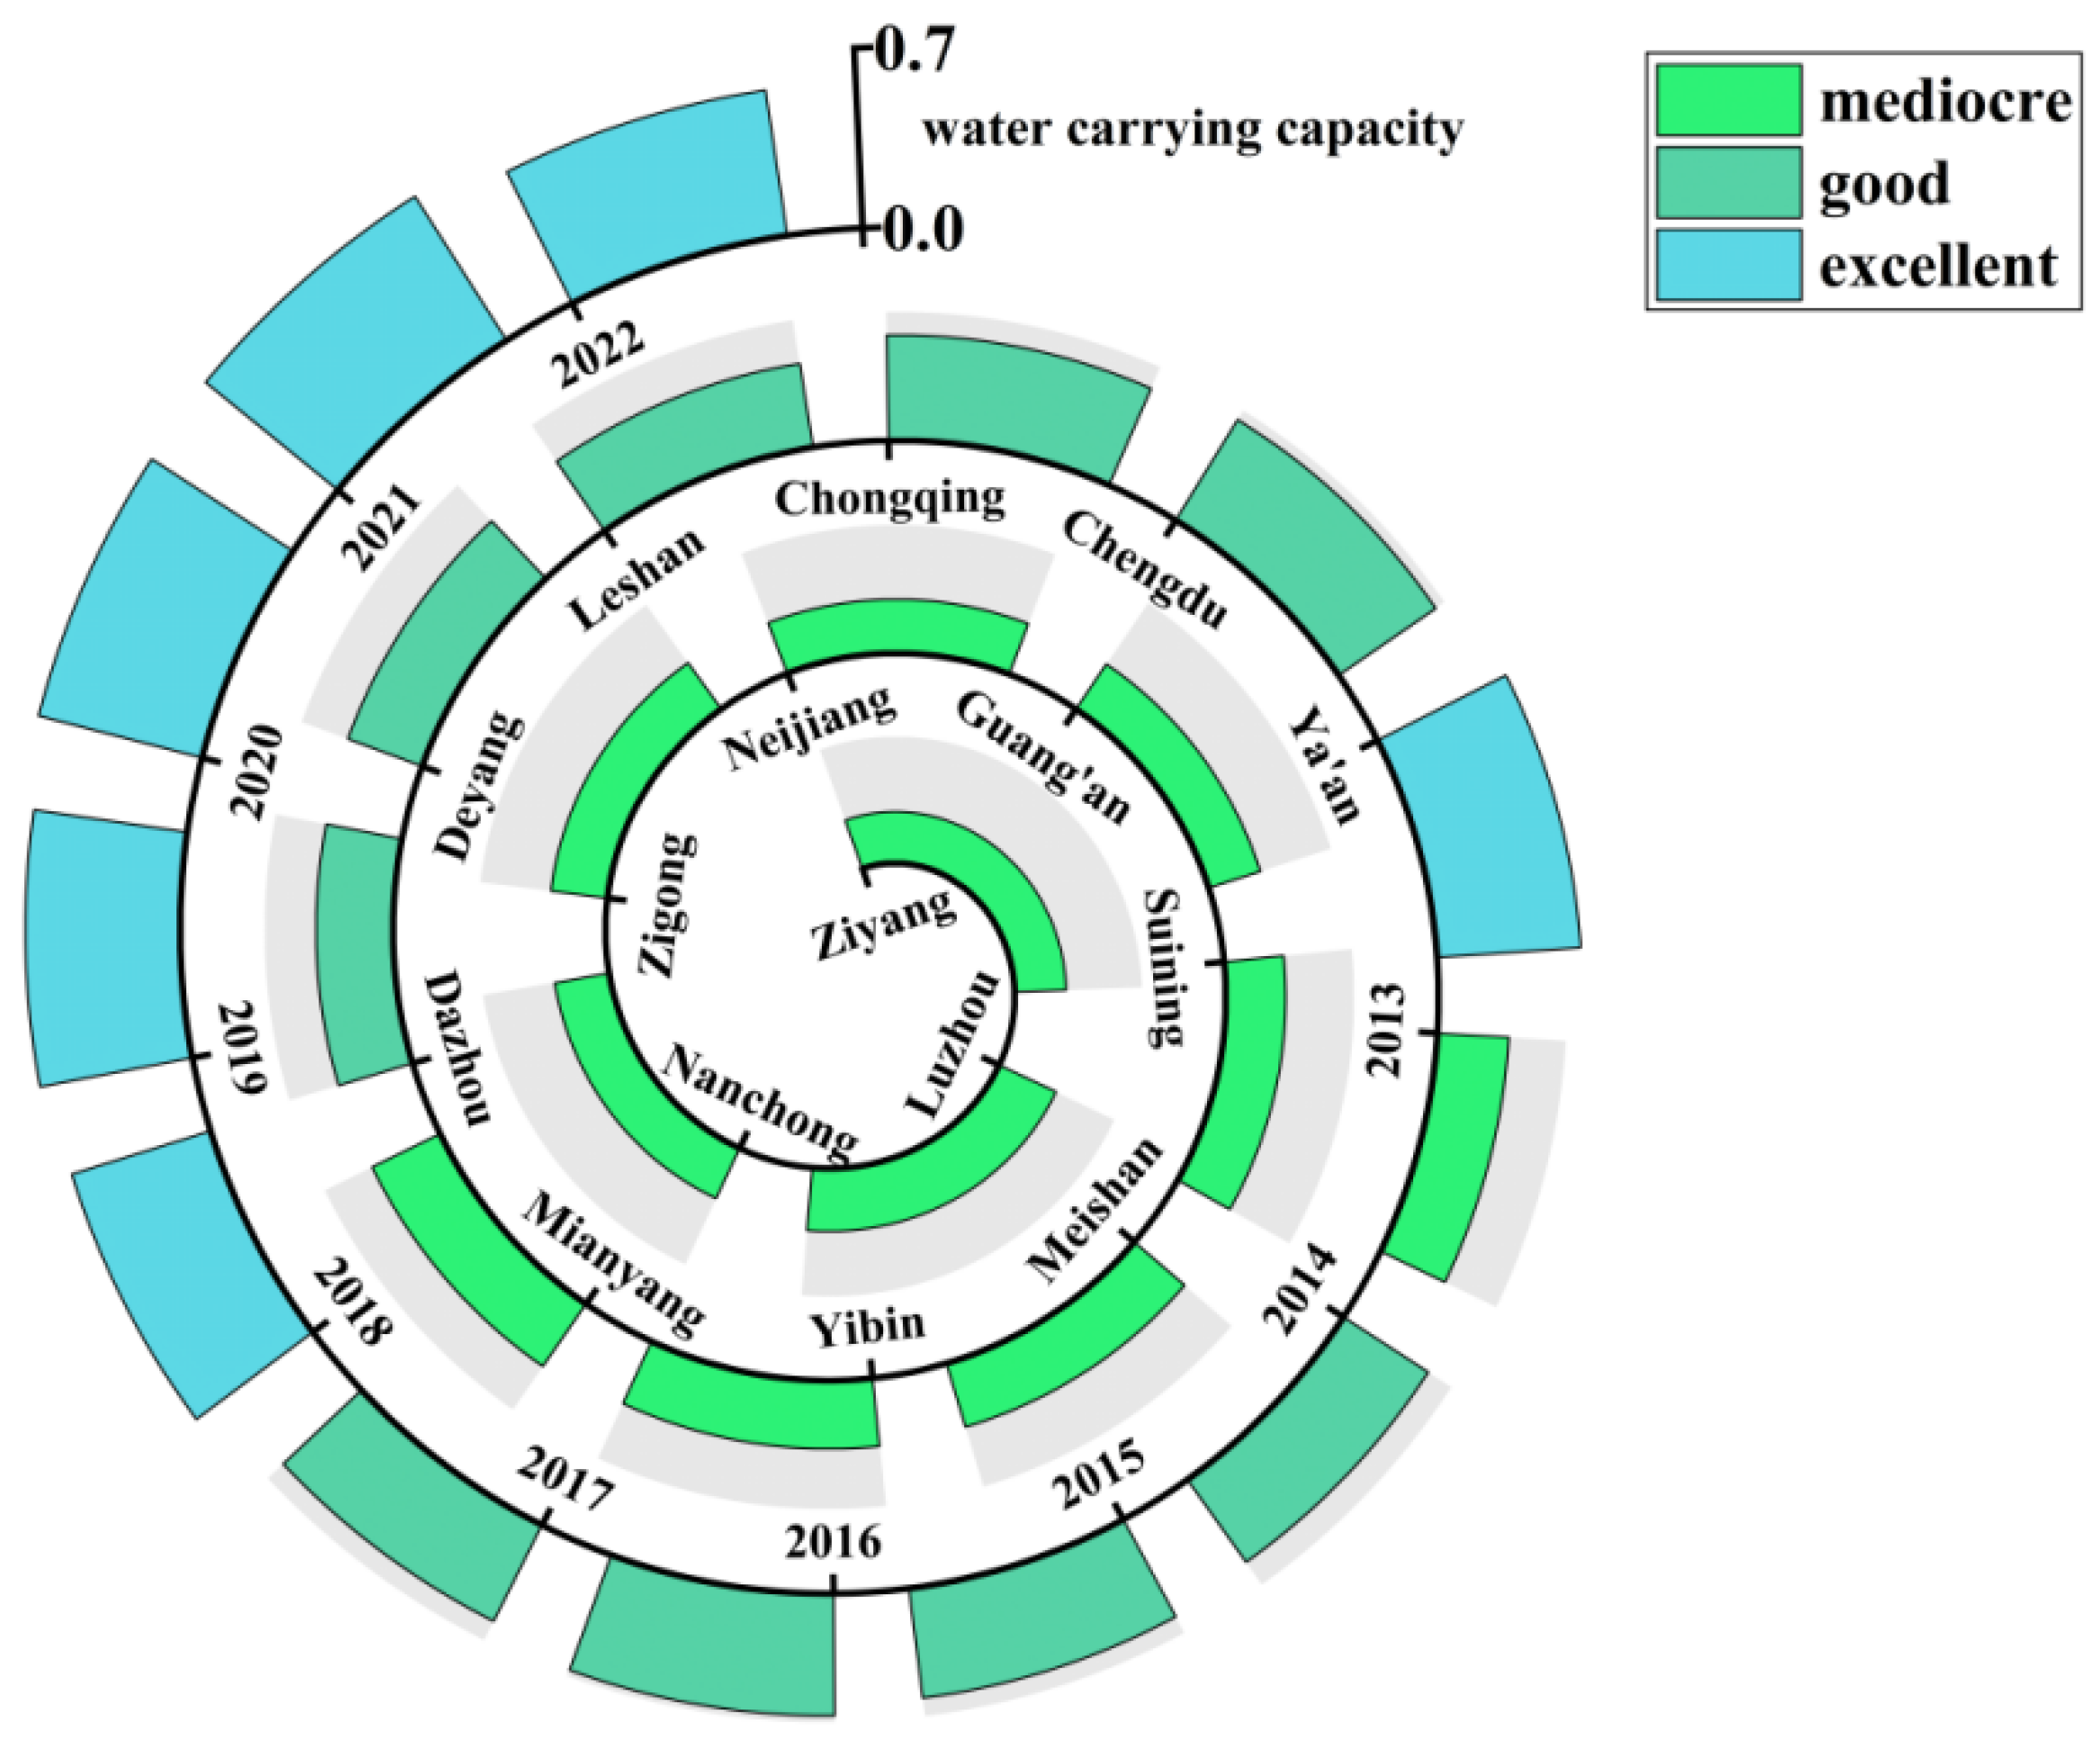
Employing the TOPSIS model for a comprehensive evaluation, this study quantitatively analyzed the water resource carrying capacity in the Chengdu-Chongqing region over the period from 2013 to 2022. In light of the pronounced regional disparities in both natural and anthropogenic conditions across the various cities, individual evaluations of water resource carrying capacity were undertaken for each of the 16 prefecture-level municipalities. Subsequently, the findings were synthesized and graphically represented in
Figure 1.
Analysis of
Figure 1 indicates that the Water Carrying Capacity Index (WCI) in the Chengdu-Chongqing region generally followed an upward trend from 2013 to 2022, increasing from 0.278 in 2013 to a peak of 0.663 in 2021. Despite this overall growth, notable declines occurred in specific years—particularly in 2017 and 2022—reflecting temporal stressors on regional water systems. Although the WCI peaked in 2021, it was followed by a marked decline in 2022, largely due to extreme climatic anomalies. That year, the region endured a three-month heatwave, with temperatures reaching 45 °C—surpassing the previous 30-year maximum of 43.5 °C. These conditions led to substantial reductions in precipitation, surface water availability, and water yield modulus.
Despite these setbacks, the WCI remained within a generally favorable range (0.4–0.65) for most of the decade. This reflects sustained improvements in water governance, including rising agricultural wastewater treatment rates and more efficient irrigation planning. Collectively, these measures have helped safeguard the region’s agricultural water environment and strengthen resilience against future resource pressures.
From the perspective of regional disparities across the 16 cities within the Chengdu-Chongqing region, it is striking that only Ya’an City attains an exemplary average water resource carrying capacity of 0.560, whereas over 60% of the municipalities—specifically the ten cities ranging from Ziyang to Mianyang as depicted in the figure—reside at a mediocre level. This pronounced divergence vividly elucidates the substantial variations in natural endowments and anthropogenic influences across these diverse locales. To illuminate this phenomenon, a comparative analysis is undertaken, focusing on the extreme cases of Ziyang City, registering a capacity of 0.203, and Ya’an City, at 0.560. The investigation commences with an exploration of natural geographical conditions, revealing that Ya’an City is distinguished by its intricate topography and significant altitudinal fluctuations, conditions that foster the accumulation and preservation of water resources, thereby endowing the region with abundant hydrological reserves, further enhanced by a temperate climate exhibiting minimal seasonal variability. In contrast, Ziyang City features a relatively planar terrain, resulting in a sparser distribution of water resources, and a scarcity compounded by greater climatic instability. Turning to anthropogenic factors, Ya’an City’s restrained pace of urbanization and modest industrialization mitigate the direct pressures on water resource management and allocation, whereas Ziyang City’s accelerated urban and industrial expansion, coupled with nascent water management frameworks and feeble pollution control capacities, exacerbate such burdens. Consequently, it is imperative for each municipality to meticulously assess its intrinsic natural resource conditions alongside the dynamics of human activities, proactively refining water resource management strategies to fully exploit latent hydrological potential, while optimizing agricultural irrigation techniques, abating regional water contamination, and ensuring the sustainable progression of local agriculture.
3.1.2. In-Depth Analysis of Obstacle Degree
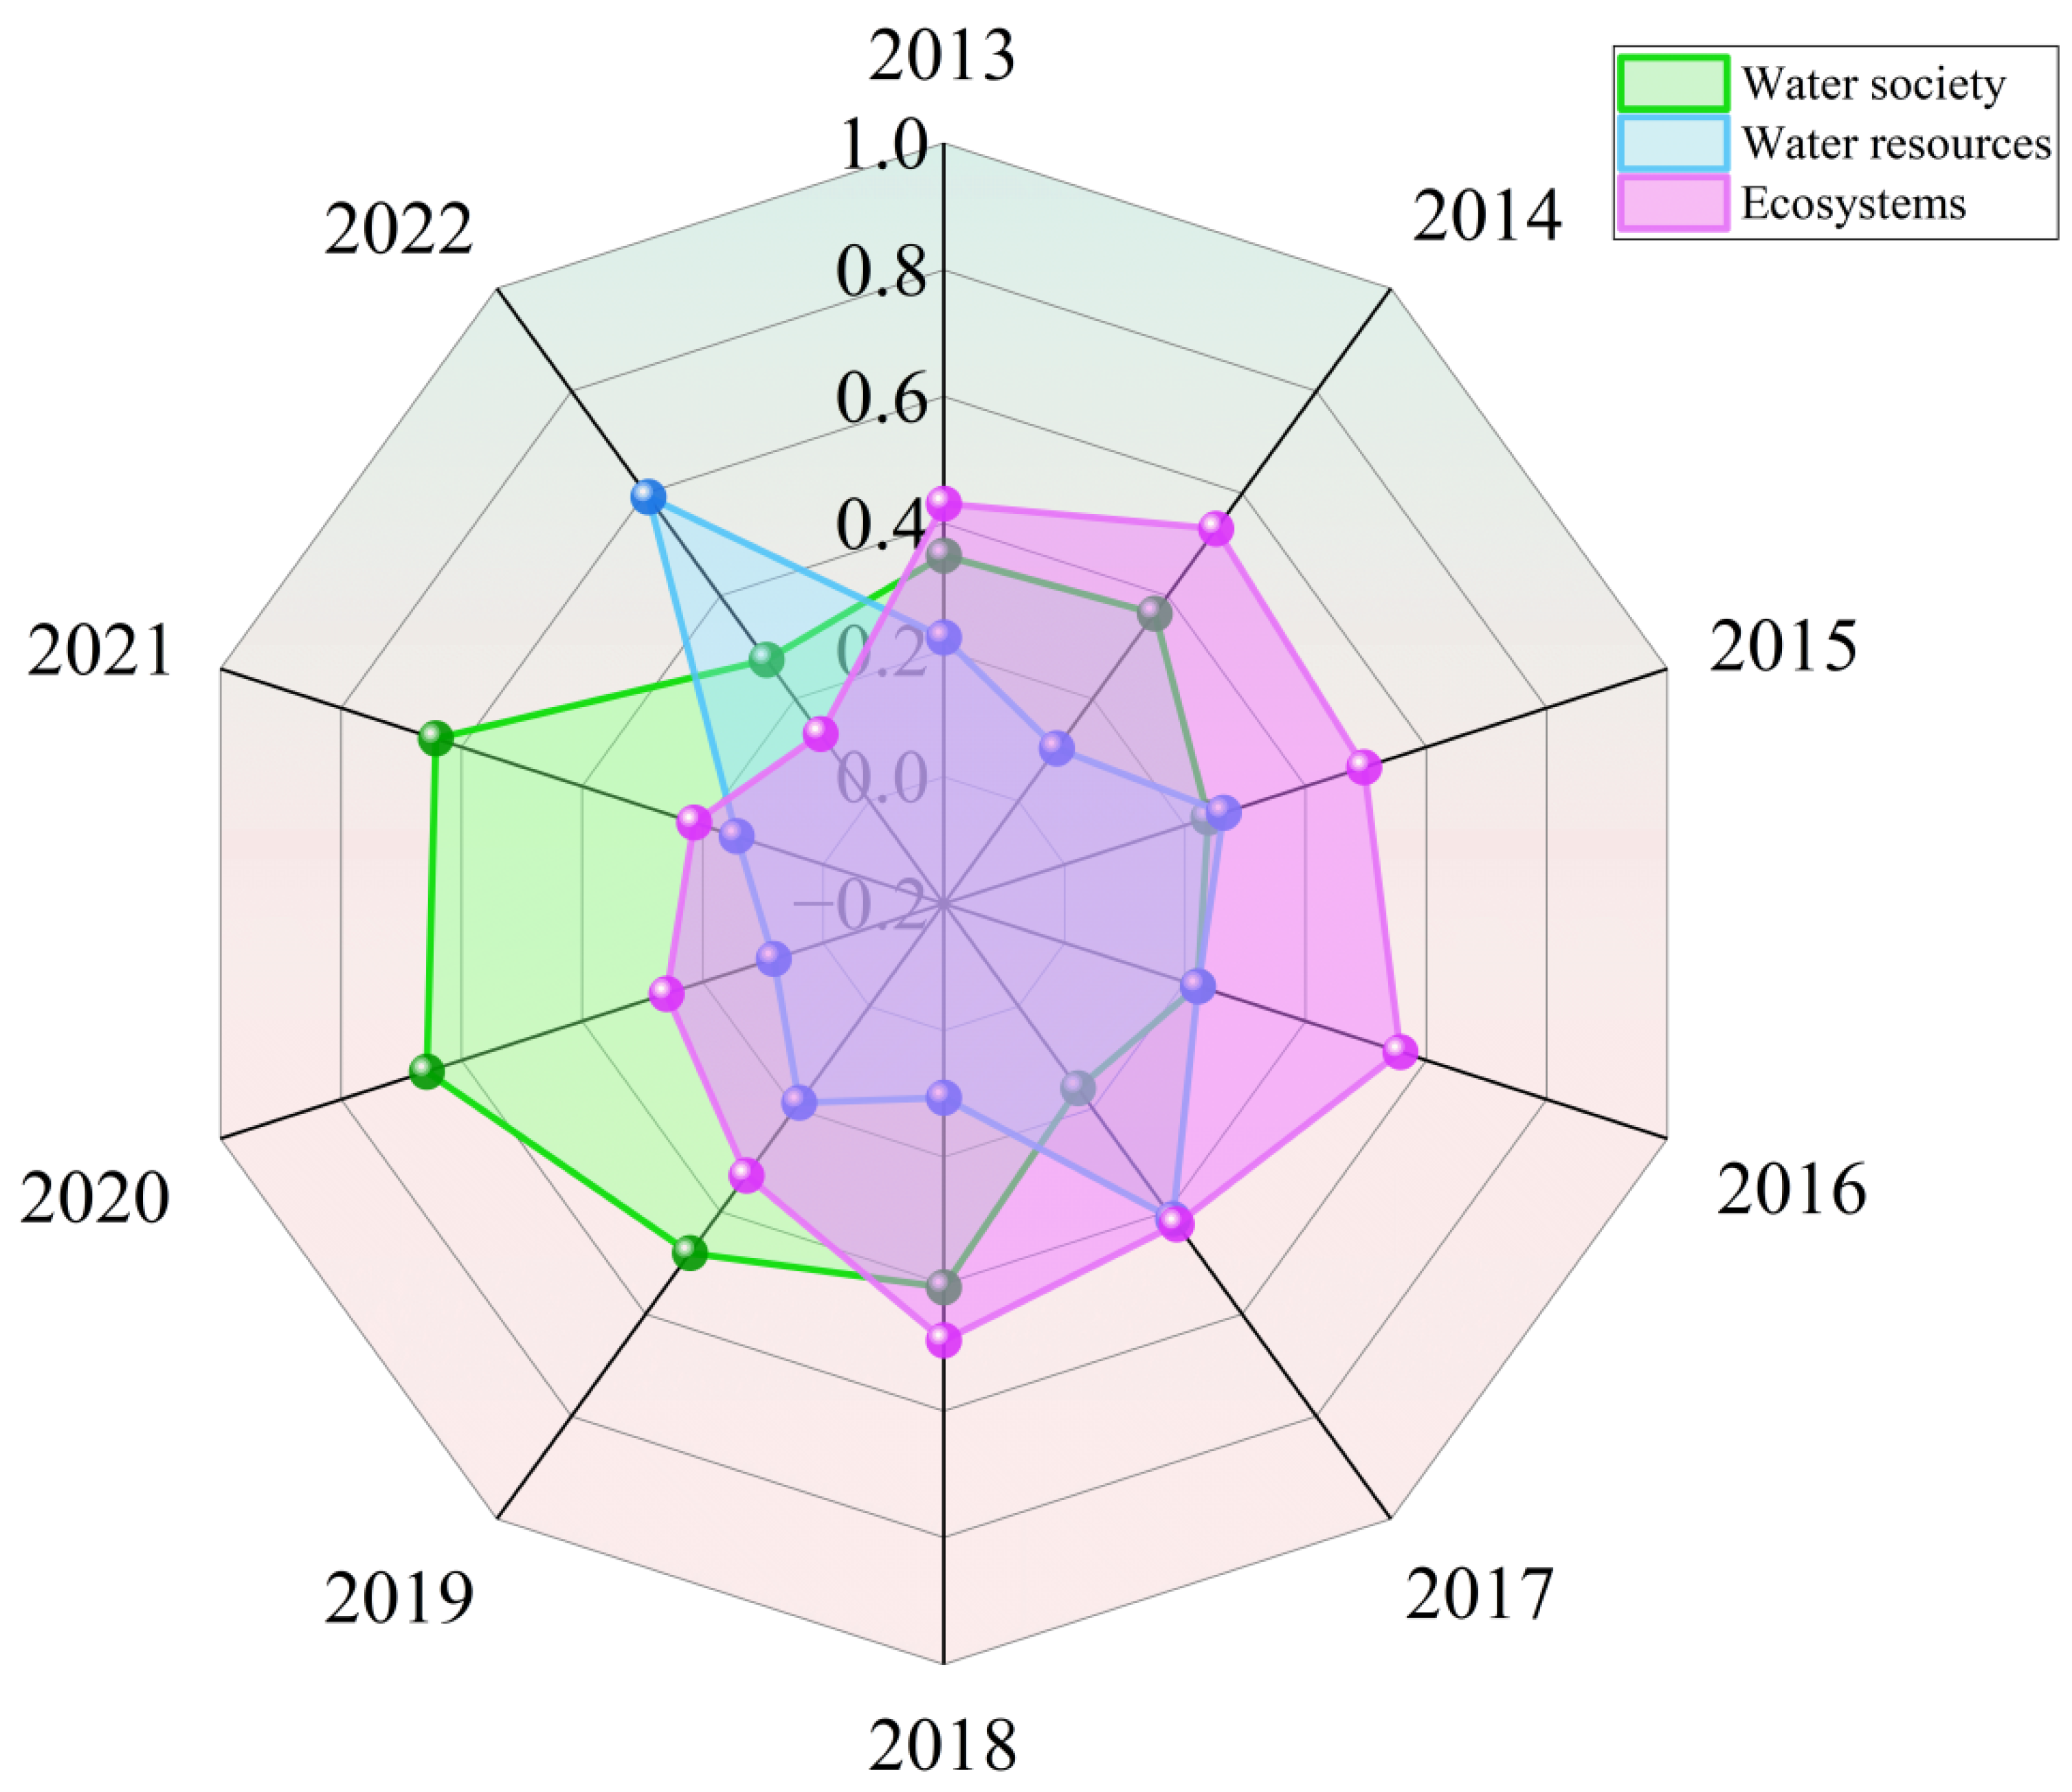
To thoroughly investigate the factors influencing the fluctuations in water resource carrying capacity amidst the agricultural development trajectory of the Chengdu-Chongqing region, this study employed the obstacle degree model to conduct a quantitative analysis of the obstacle factors within three pertinent subsystems. Furthermore, acknowledging the spatio-temporal heterogeneity inherent in the water resource carrying capacity across this region, the analysis was meticulously delineated according to distinct study years and urban locales, thereby generating
Figure 2 and
Figure 3 to illustrate these findings.
As illustrated in
Figure 2, the obstacle factor values of the three subsystems in the Chengdu-Chongqing region show a general trend of convergence over the study period. For most years, either the ecological environment system (purple) or the water society system (green) served as the primary obstacle to water resource carrying capacity. However, in 2022, the water resources system (blue) experienced a marked increase in its obstructive effect, becoming the dominant constraint.
To better understand these dynamics, the representative years 2014 and 2020 were selected to reflect broader trends. In 2014, corresponding to conditions from 2013 to 2018, the ecological environment system presented the highest obstacle degree, followed by the water society and water resources systems. This was a period of rapid urbanization, characterized by fast population growth, urban expansion, and industrialization, which collectively strained ecological systems. The resulting environmental degradation hindered coordinated water resource development and indirectly affected key indicators such as agricultural water use, posing significant challenges to the region’s pursuit of high-quality agricultural development.
In contrast, the year 2020—representing the 2019 to 2021 period—showed a reordering of obstacle degrees: the water society system became the leading constraint, surpassing the ecological environment system. This shift was largely due to the implementation of sustainable development policies, such as improved agricultural sewage treatment, reduced fertilizer use, and more efficient water allocation. These measures mitigated the ecological environment’s obstructive role. However, continuous population growth intensified pressure on water-related social infrastructure, making the water society system the most significant obstacle during this stage.
The year 2022 stood out due to the impact of extreme heatwaves, which sharply reduced the availability of water resources and led to supply shortages that disrupted infrastructure, particularly hydropower generation. These events caused the obstacle degree of the water resources system to spike to a decade-high of 0.625, indicating its emergence as the most pressing limitation under climate-induced stress.
In summary, from 2012 to 2022, the obstacle degree model identified shifting dominant barriers to water resource carrying capacity. Initially driven by ecological degradation, the primary obstacle transitioned to social infrastructure pressures, and most recently, to acute resource scarcity under extreme climate events. These findings highlight the evolving nature of water-related challenges and emphasize the importance of dynamic, targeted policy responses. The study provides valuable insights for enhancing regional resilience and sustainability in water management practices.
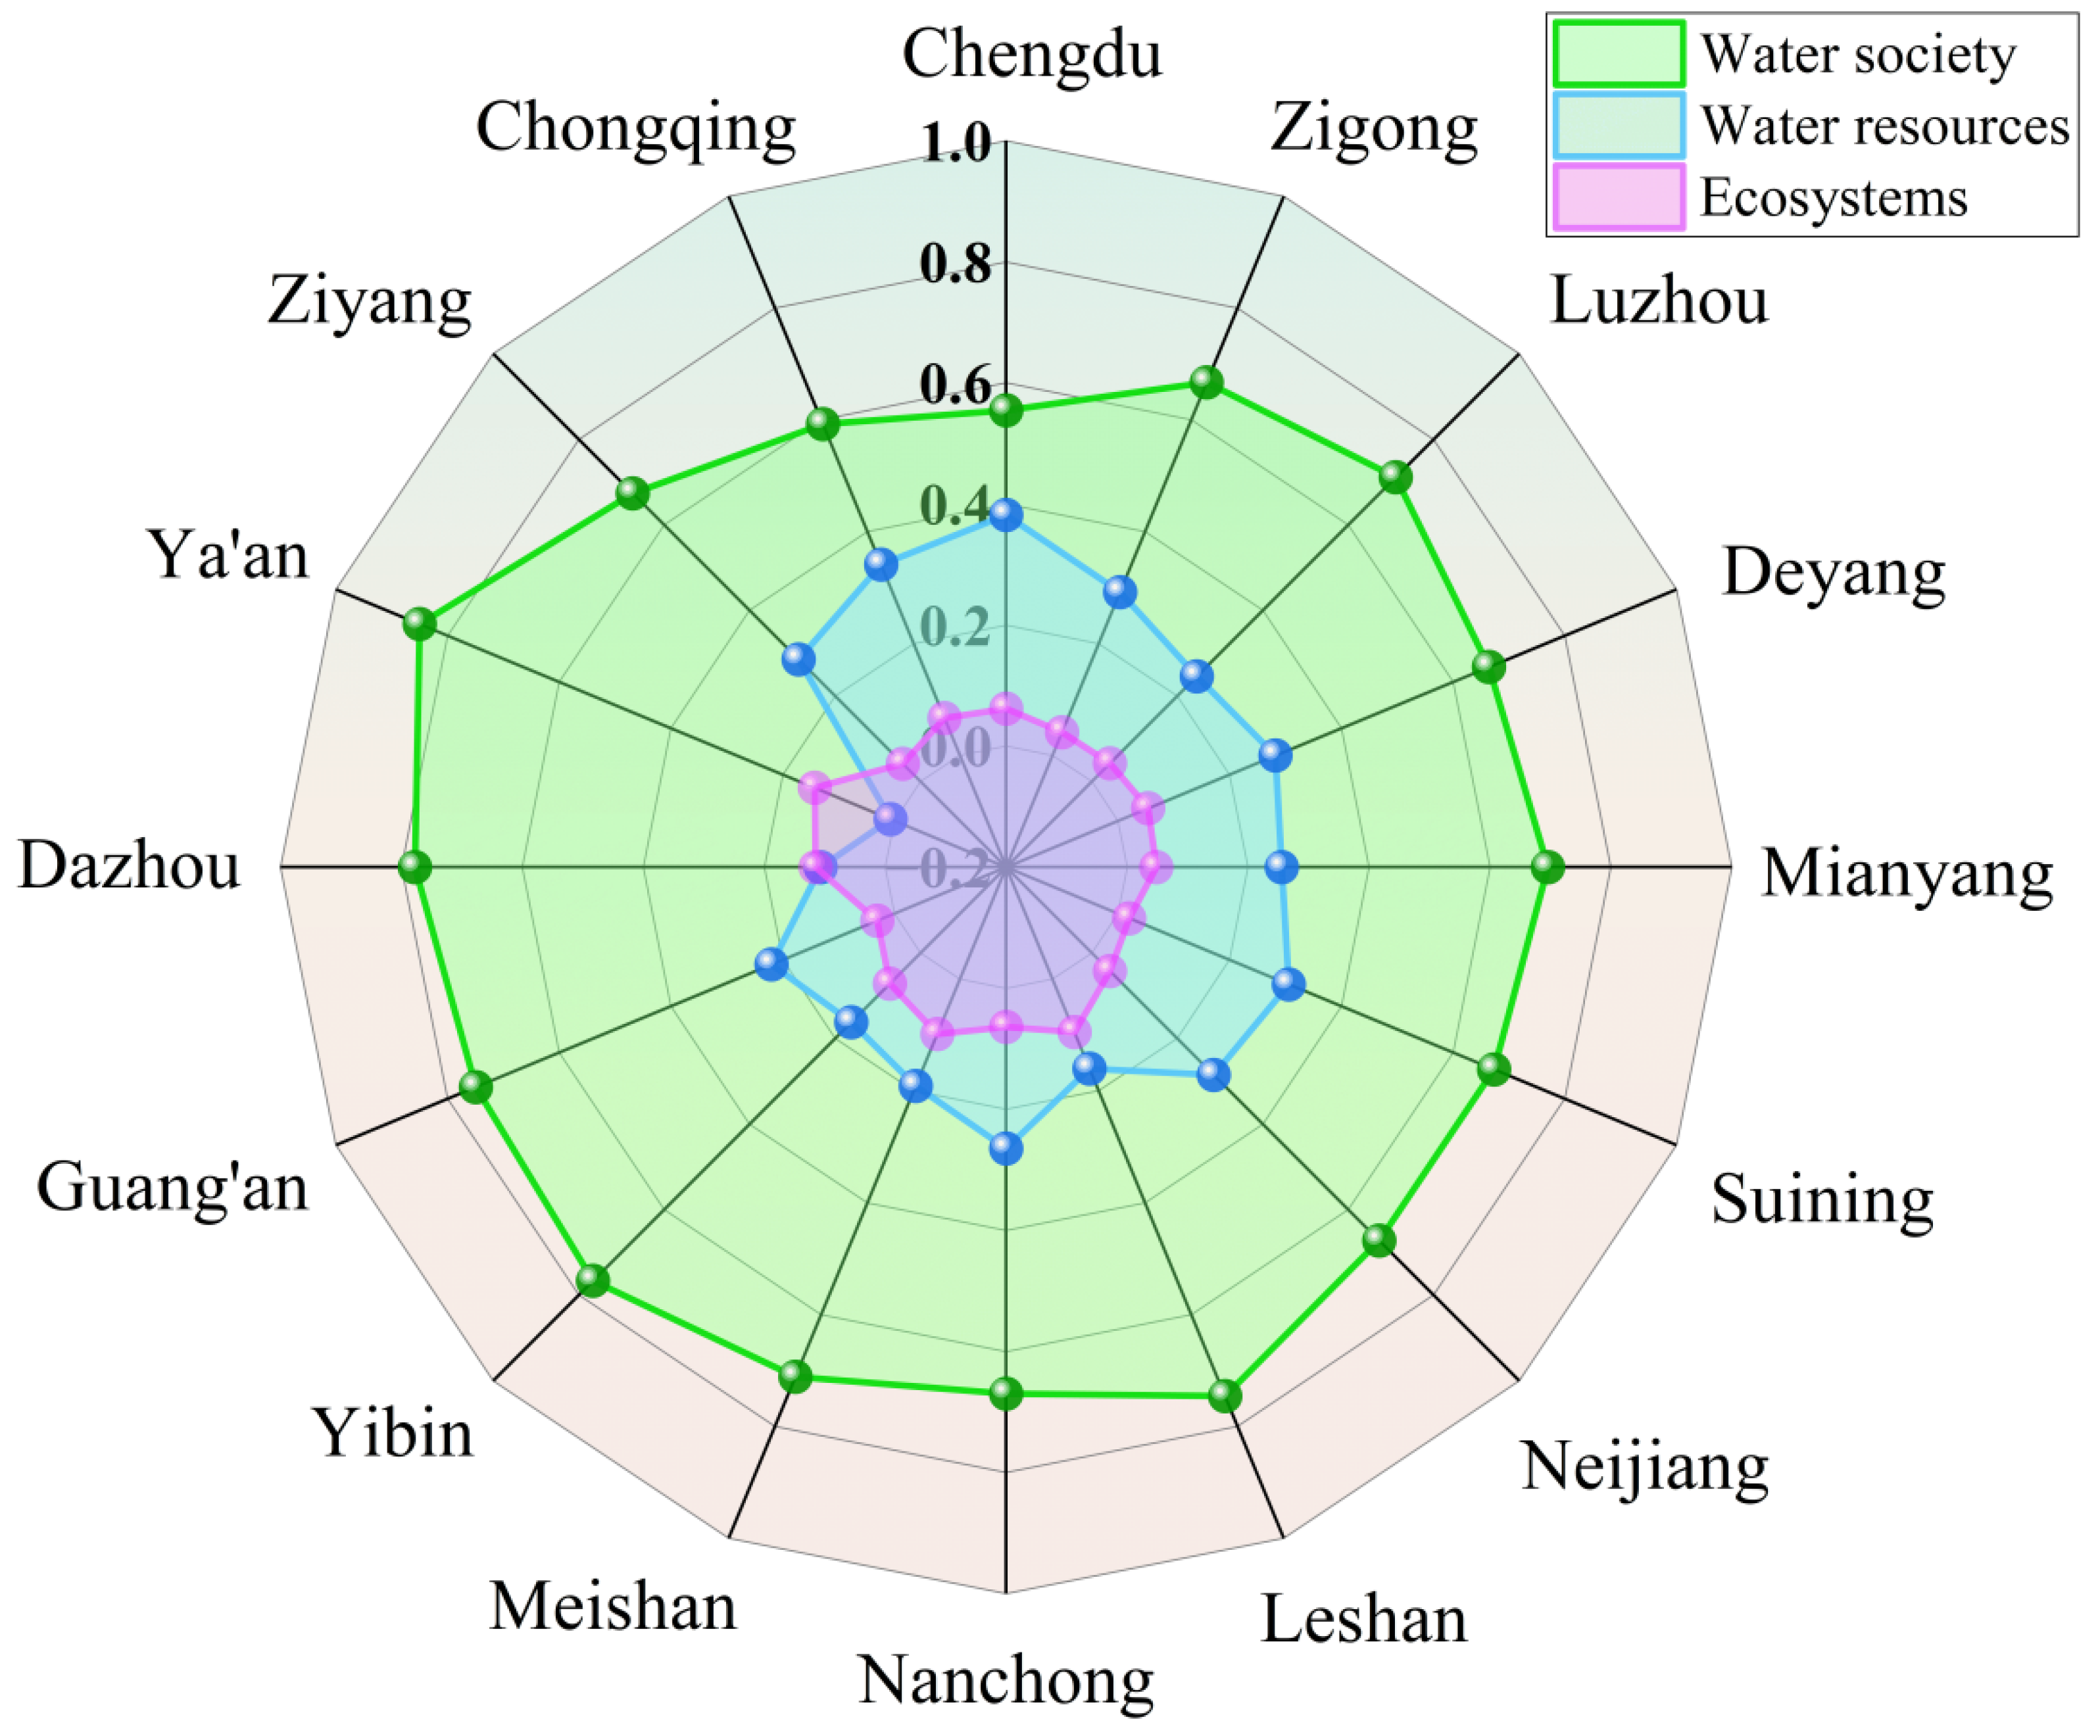
Figure 3 presents the hierarchical distribution of obstacle factors among the three water resource subsystems across 16 cities in the Chengdu-Chongqing region. The water society system (green) emerges as the most prominent obstacle in the regional average, with over 85% of cities exhibiting a consistent ranking: water society system (green) > water resources system (blue) > ecological environment system (purple).
To explore the commonalities underlying this pattern, representative core cities—Chengdu and Chongqing—are analyzed. The findings reveal that the water society system poses the greatest challenge. Accelerated urbanization, combined with industrial restructuring toward high-tech and service sectors, has driven significant migration from rural to urban areas. This shift has led to rapid population growth and mounting stress on water distribution systems, alongside a shortage of skilled professionals in water management. These dynamics have intensified pressures on water-related social infrastructure, making the water society system the most urgent barrier to address in regional development.
The water resources system, typically ranked second, faces limitations due to the expansive urban areas being vulnerable to climatic variability, which restricts water availability. However, through infrastructure development—such as hydraulic engineering—these constraints can be alleviated by enhancing water regulation and storage capacity.
To investigate regional disparities, Ya’an City is examined due to its distinct characteristics. In contrast to most cities, the ecological environment system in Ya’an presents a stronger obstacle than the water resources system. This can be attributed to its underdeveloped urban infrastructure and limited capacity for industrial wastewater treatment. However, Ya’an benefits from abundant water resources, which explains its lowest obstacle factor (0.008) in the water resources subsystem among all cities. For such cities, leveraging natural water advantages while improving governance and ecological remediation is essential to reduce the burden of the water society system and foster sustainable growth.
In summary, the analysis highlights that the water society system remains the foremost constraint to water resource-carrying capacity across the region. Achieving sustainable and high-quality development requires municipalities to comprehensively assess the interplay among the three subsystems. Policymakers should strengthen governance structures and optimize resource allocation, guided by localized strategies and natural endowments. Such efforts are crucial not only for enhancing water security but also for ensuring ecological resilience and supporting agricultural sustainability in the Chengdu-Chongqing region.
3.2. Comprehensive Evaluation Index of Dual Systems
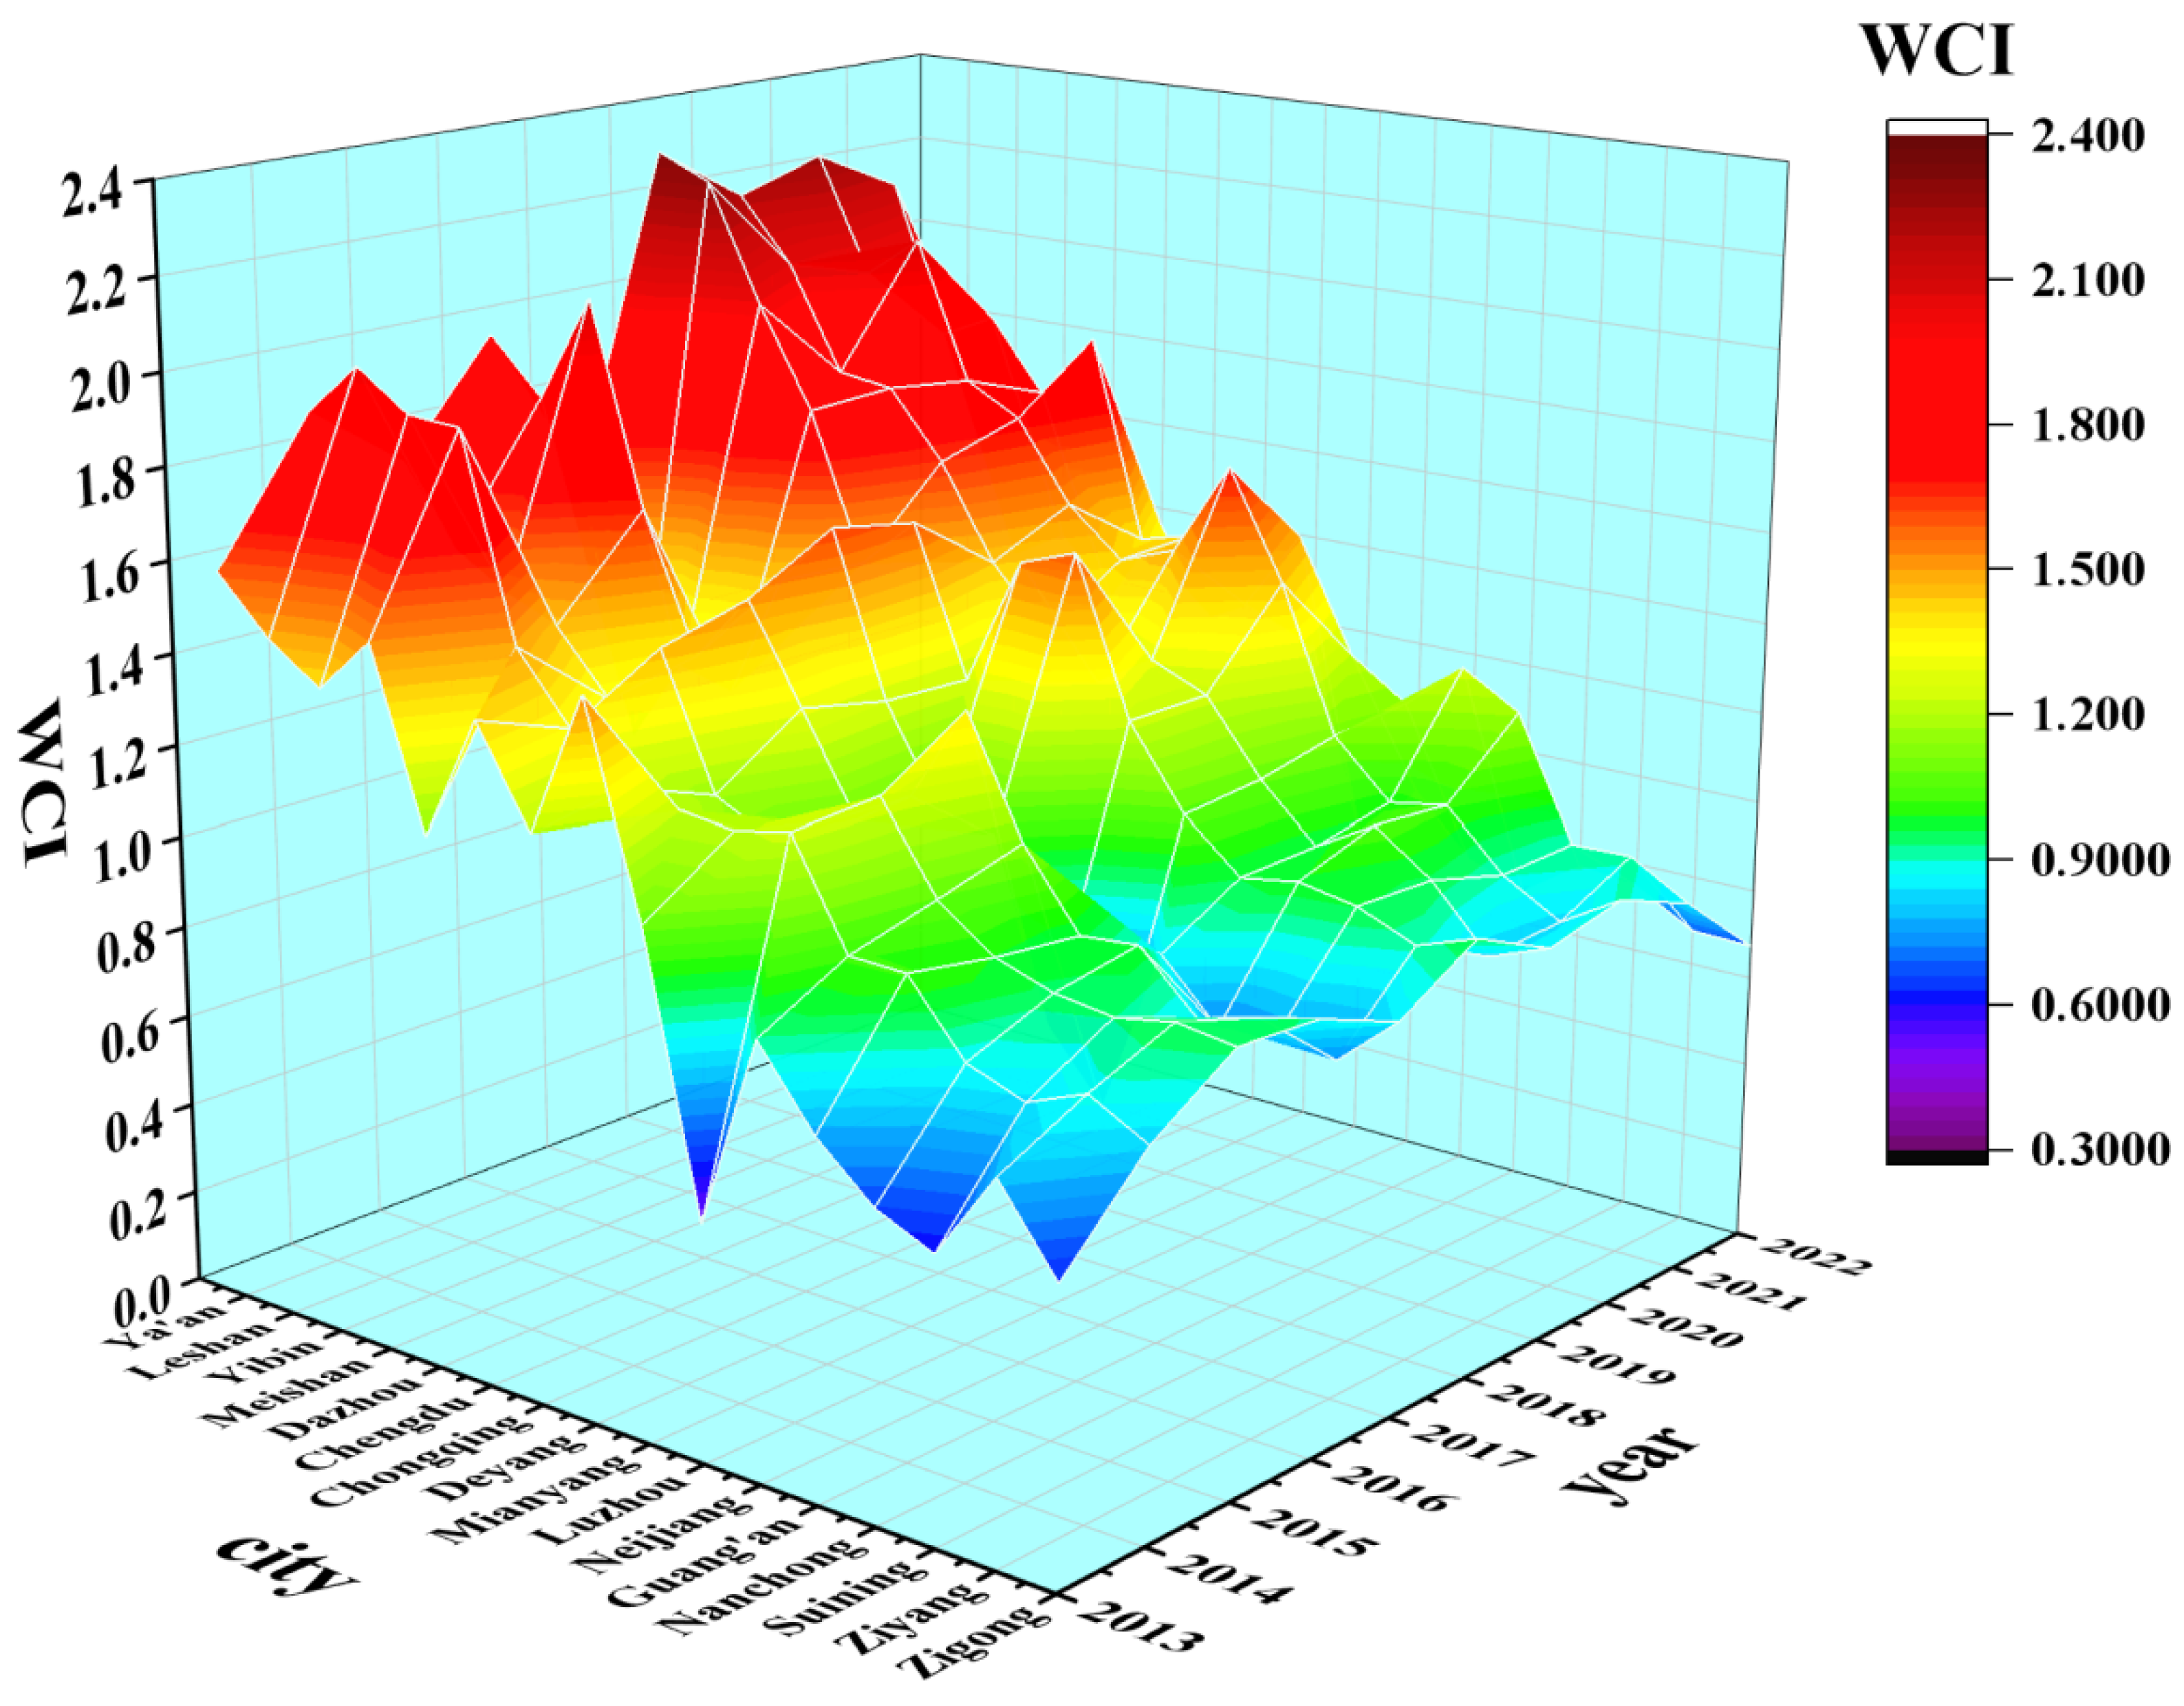
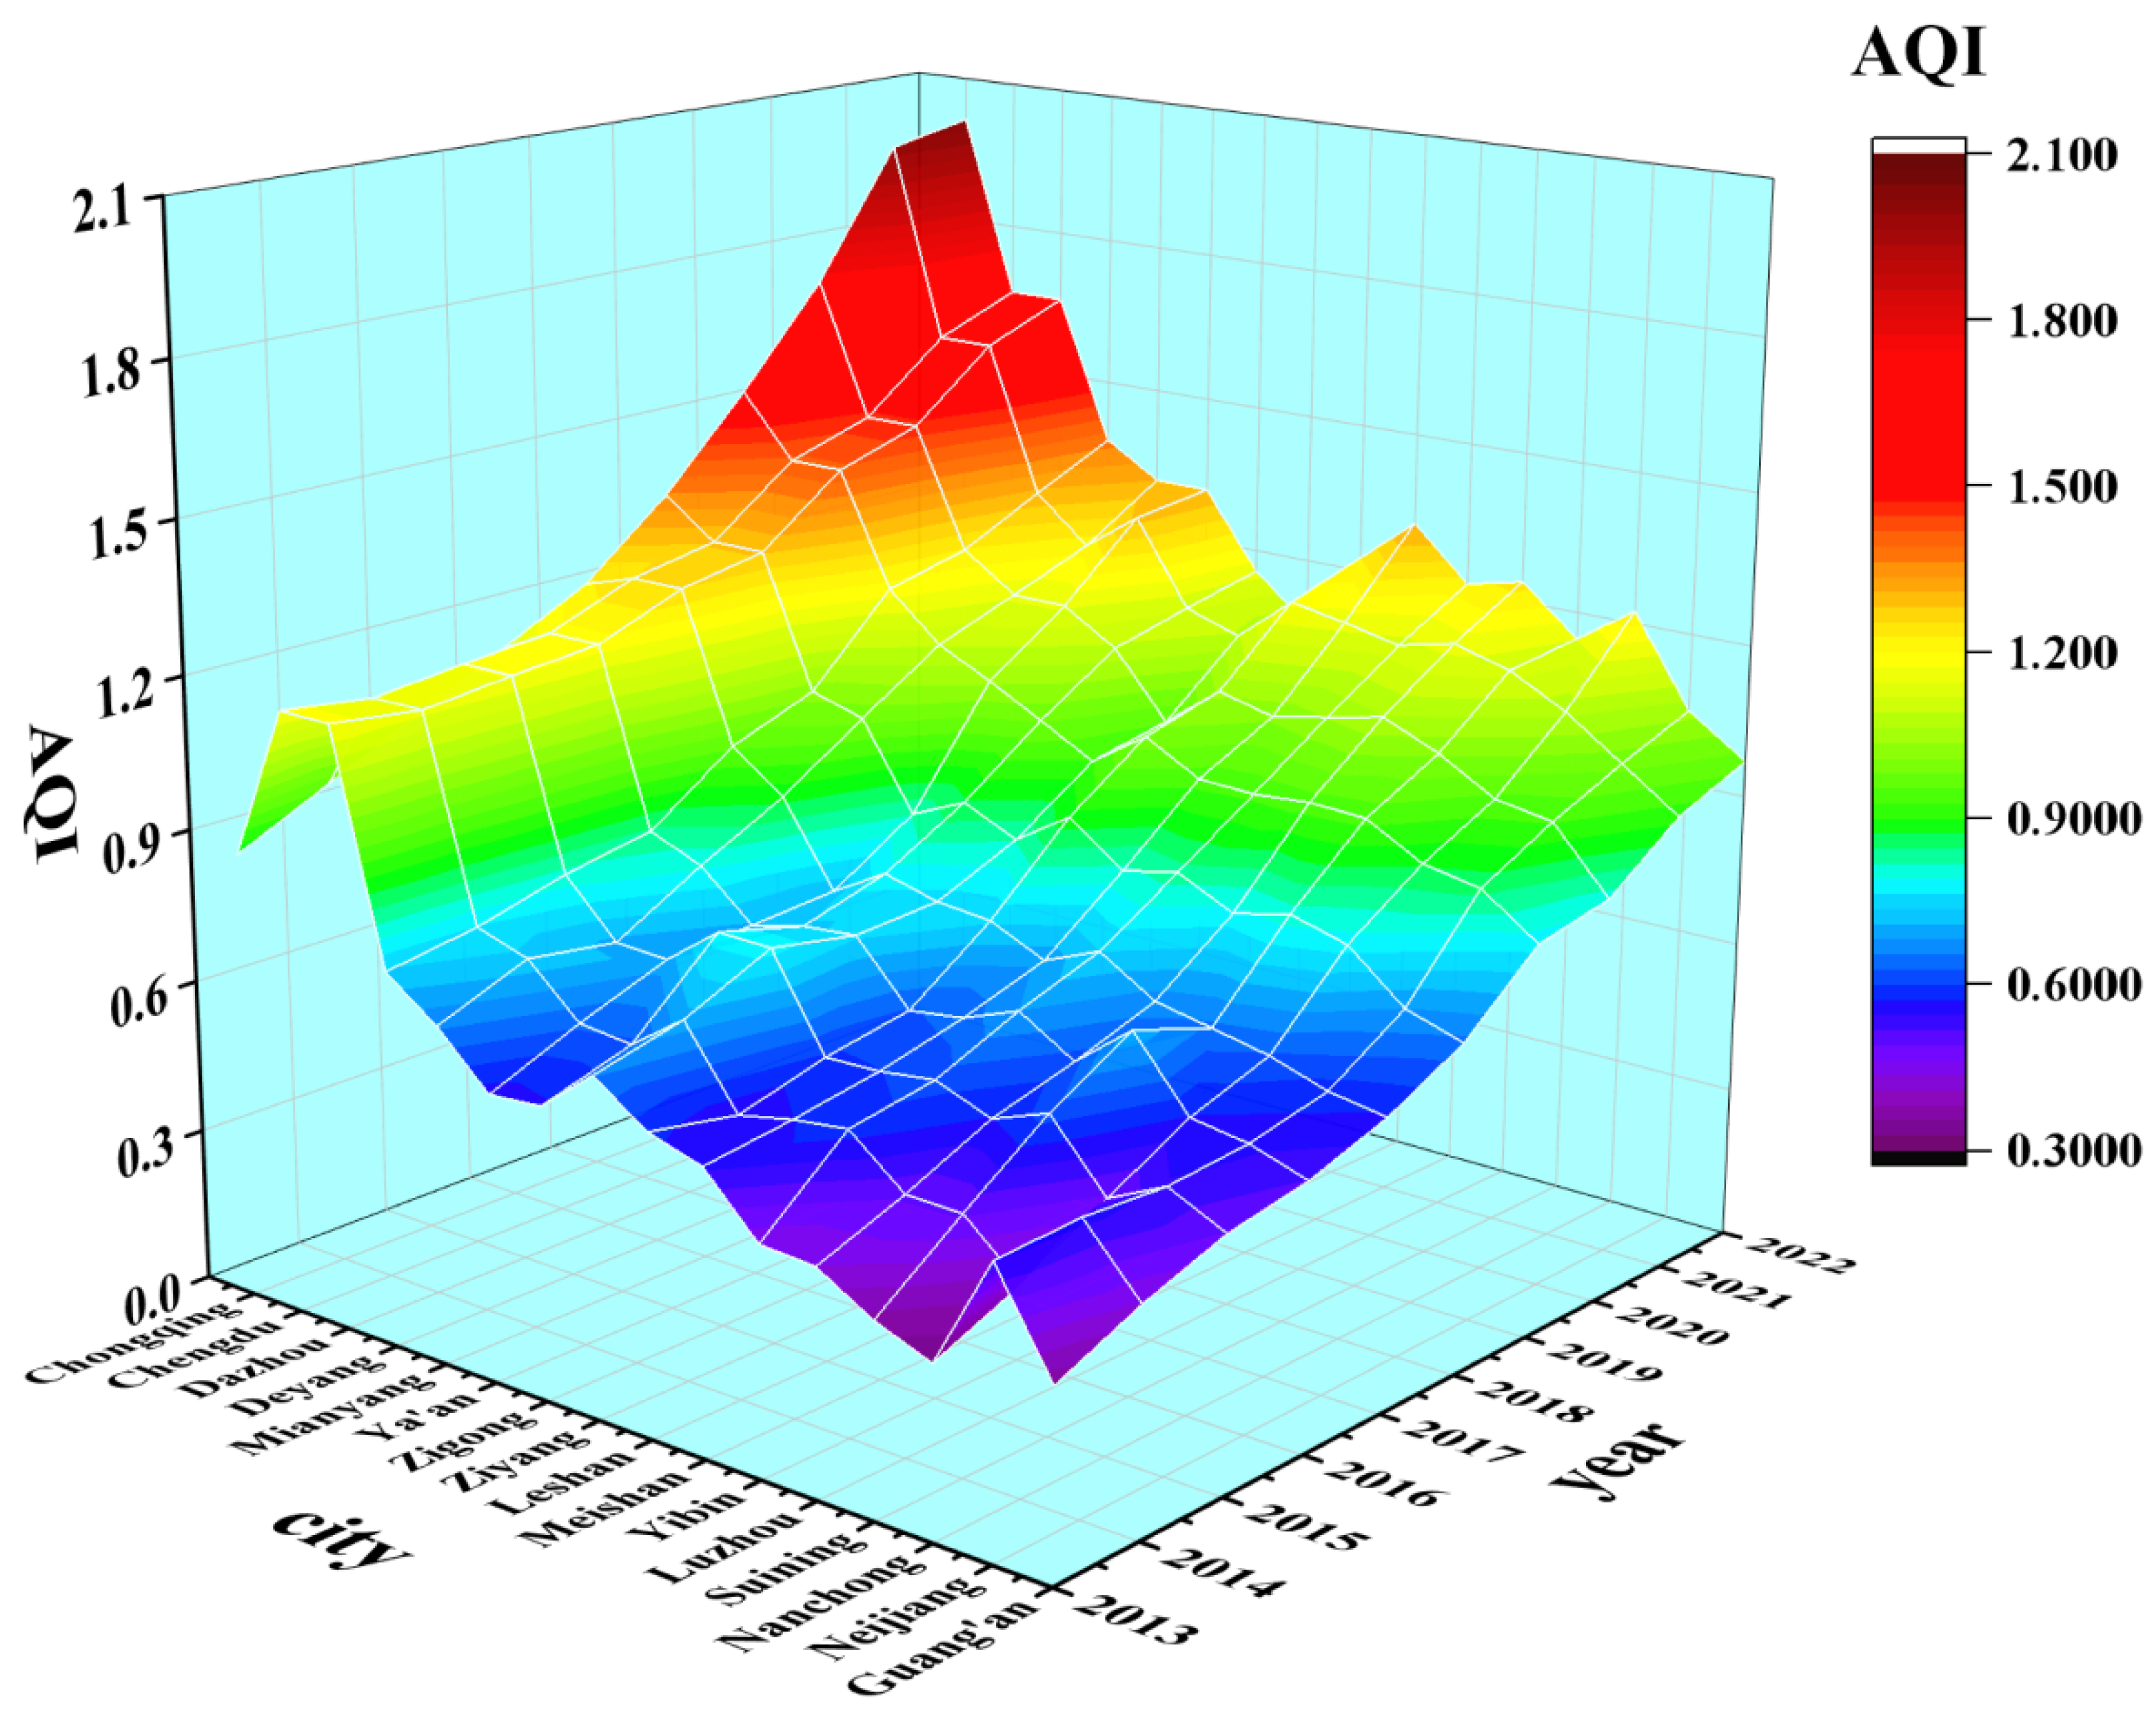
After conducting a comprehensive evaluation using the Evaluation Index Model, this study meticulously quantified the Agricultural Quality Index (AQI) and Water Resources Carrying Capacity Index (WCI) for the Chengdu-Chongqing region from 2013 to 2022, while also incorporating the spatiotemporal dynamics of regional agricultural development. The resulting indices are visually represented in
Figure 4 and
Figure 5, where the colors in the graphs differentiate the values. Indices closer to deep red indicate optimal values, while those nearer to purple represent the worst values. In the results of this study, the lowest index value is represented by a blue color, which is just above purple.
3.2.1. Analysis of Water Resources Carrying Capacity Index (WCI)
Upon detailed examination of
Figure 4, WCI within the Chengdu-Chongqing region demonstrates a generally upward trajectory over the past decade, albeit punctuated by intermittent regressions in specific years (e.g., 2015, 2017, 2019, 2021, and 2022). These fluctuations suggest not only the uneven effects of regional policy and climatic variability but also the differential resilience of municipal water systems. Spatial heterogeneity remains pronounced: cities such as Ya’an, Leshan, and Yibin consistently rank higher in WCI, likely due to favorable hydrological and topographical endowments. Conversely, Zigong and Ziyang persistently occupy the lower end of the spectrum, warranting closer scrutiny.
This study focuses on Zigong and Ziyang as emblematic cases of underperformance in WCI, despite their location within the relatively high-precipitation Sichuan Basin. Over the last decade, their WCI scores have largely remained within the 0.6–0.9 range, with only brief surges into higher brackets. This stagnation is attributable to a confluence of natural and anthropogenic constraints. Although precipitation levels are substantial, surface water accessibility remains limited due to complex terrain and inadequate water capture infrastructure. Furthermore, both cities face significant challenges in terms of pollution control and water resource governance. Their economies are heavily reliant on agriculture and traditional industries, which contribute substantial non-point source pollution and industrial effluents, undermining ecological water quality and the sustainable use of available resources. Rapid urbanization exacerbates these conditions, intensifying water demand without commensurate improvements in infrastructure or management. Population growth and industrial expansion have widened the gap between supply and demand, leading to cyclical stress on water systems. Compounding this is a notable outflow of skilled professionals toward major urban centers like Chengdu and Chongqing, resulting in a local governance capacity deficit. Deficient technical expertise and limited institutional innovation further constrain the cities’ ability to adopt adaptive, integrated water resource management approaches.
Ultimately, the persistent underperformance of Zigong and Ziyang in WCI reflects not merely a lack of natural endowments but a broader systemic challenge involving governance inefficiency, anthropogenic stressors, and the spatial legacy of development priorities. Addressing these imbalances necessitates a differentiated strategy—one that integrates topographical realities, enhances local management capacity, and aligns urban planning with sustainable water use imperatives.
To better interpret the fluctuations of the WCI in the Chengdu-Chongqing region over the past decade, this study analyzes three interrelated dimensions: policy change, management efficiency, and climatic variability.
First, local policy evolution has been a key driver of WCI variation. In 2015, in alignment with national modernization goals, the region accelerated industrial transformation, which significantly increased water demand. However, the implementation of water-related policies in many municipalities was hindered by rapid urbanization and administrative constraints, limiting their effectiveness. These challenges highlight the need for more agile and context-sensitive policy mechanisms.
Among these fluctuations, a significant increase in water stress was observed during 2020 and 2021. This surge in demand can be attributed to multiple interrelated factors. First, the region experienced intensified economic activity under the national “Chengdu-Chongqing Twin City Economic Circle” initiative, which led to a sharp rise in industrial water consumption. Concurrently, rapid urban expansion increased domestic water demand, placing additional pressure on already strained water infrastructure. Second, the COVID-19 pandemic inadvertently contributed to increased agricultural water stress. In response to supply chain disruptions, local governments expanded agricultural production to enhance regional food security. This resulted in the large-scale cultivation of water-intensive crops and greater reliance on irrigation, exacerbating seasonal water shortages.
Second, shortcomings in water resource management continue to hinder improvements in carrying capacity. During the extreme drought of 2022, many cities failed to respond with timely adjustments, exacerbating resource stress. Similarly, flood events in 2017 and 2019 revealed weaknesses in infrastructure and emergency coordination. A critical element within this dimension is water use efficiency, which remains suboptimal in both agriculture and industry. Outdated irrigation methods and low adoption of water-saving technologies have constrained agricultural productivity per unit of water. In industrial sectors, water recycling and reuse remain underdeveloped. Enhancing efficiency through precision irrigation, industrial water reuse systems, and digital monitoring tools is vital to reducing pressure on supply while improving adaptive capacity.
Third, WCI trends are closely linked to the total availability of water, which fluctuates with climatic extremes. Historical data show that in years of severe droughts or floods, WCI declines sharply, emphasizing the vulnerability of the region’s water systems to climate change and the need for integrated adaptive strategies.
In conclusion, the evolution of WCI in the Chengdu-Chongqing region reflects the interplay between governance, management, efficiency, and climate. Strengthening water use efficiency and adaptive governance will be key to enhancing the region’s water resilience and sustaining agricultural and economic development under growing environmental pressures.
3.2.2. Analysis of AQI
As shown in
Figure 5, the AQI in the Chengdu–Chongqing region has steadily increased over the past decade, contrasting with the more fluctuating trajectory of the WCI. This upward trend reflects significant agricultural development, although spatial disparities and moderate temporal fluctuations persist. As core cities within the Chengdu–Chongqing Economic Circle, Chengdu and Chongqing have maintained a dominant influence, with AQI surpassing 1.5 by 2019. By 2022, over 55% of municipalities had doubled their AQI since 2013, showcasing substantial regional improvement. Even cities historically lagging in agricultural performance, such as Guang’an and Neijiang, recorded notable AQI increases, reaching 1.2 by 2022.
Temporally, more than 85% of municipalities saw sustained AQI growth since 2013, with particularly strong gains between 2018 and 2020, where average increases exceeded 24%. Although some cities experienced minor declines before 2016, these were reversed, resulting in a stable, synergistic pattern of agricultural improvement. This progress is driven by policy, technological innovation, and institutional support. Initiatives like targeted subsidies, agricultural innovation incentives, and international best practices have strengthened the agrarian framework. Data show that these efforts stabilized agricultural output indices between 1.03 and 1.05, reflecting consistent productivity gains.
In agriculture-dominated cities, grain yields have risen alongside enhanced farmer motivation, supported by improved social security systems. Urbanization has driven higher rural living standards, with rising disposable incomes and a shift towards mechanized, large-scale operations. Infrastructure development, particularly in irrigation and logistics, has supported stable resource access and increased efficiency. Notably, groundwater usage in irrigation has played a significant role in mitigating water scarcity, complementing surface water resources to maintain agricultural stability. Additionally, digital and automated management tools have optimized resource allocation and planning precision. These factors collectively underscore the Chengdu-Chongqing region’s emergence as a major agricultural hub. With a population exceeding 100 million, the region holds significant potential for sustained agricultural excellence.
Indubitably, the nascent phases of agricultural advancement within the Chengdu-Chongqing region were beset by a multitude of challenges. To illustrate, in the year 2014, certain municipalities within the region grappled with developmental discord between Leshan and Dazhou, precipitated by antiquated agricultural implements and vacillations in arable land extent, culminating in a decrement of approximately 0.03 in AQI. Nonetheless, throughout the ensuing developmental trajectory, these impediments were efficaciously addressed and mitigated, thereby facilitating a progressive enhancement in the caliber of agricultural development. The findings of this investigation unequivocally elucidate that the Chengdu-Chongqing region, characterized by its substantial population and intricate topographical features as an inland economic nexus, has attained remarkable triumphs in regional agricultural advancement, principally attributable to the macro-regulatory frameworks of indigenous policies, judicious resource apportionment, and the pervasive dissemination of agricultural technologies. These experiential insights furnish a developmental paradigm of considerable referential import for other municipalities wherein agriculture constitutes a pivotal industrial sector, offering a model worthy of emulation to bolster their agrarian aspirations.
From the perspective of spatial heterogeneity, the cities within the Chengdu-Chongqing region exhibit pronounced variations in urban scale, population size, levels of modernization, policy implementation, and industrial focus. This phenomenon underscores significant research value for exploring the commonalities and disparities in agricultural development across the 16 cities in the region, offering a robust foundation for optimizing and reforming agricultural practices. In this study, Chongqing City and Chengdu City are selected as exemplary cases for in-depth analysis of agricultural development. The findings reveal that both cities share salient characteristics: they are endowed with superior natural resource bases and robust foundations for modernized agriculture. Notably, their substantial population scales and well-developed transportation networks effectively mitigate the inherent challenges faced by inland cities in agricultural trade, thereby fostering abundant opportunities for agricultural advancement within the Chengdu-Chongqing economic circle and catalyzing collective prosperity for both them and their neighboring cities. In particular, Chongqing, with its highly developed water transport infrastructure, emerges as a preeminent leader among the 16 cities, a conclusion substantiated by quantitative indicators such as per capita road area. As core hubs of economic development, these two cities exemplify their potential as trailblazers. They not only extensively translate cutting-edge technological innovations into agricultural applications but also pioneer the development of advanced agricultural machinery and establish comprehensive irrigation systems. Furthermore, the implementation of wide-ranging adjustable temperature-control technologies and other progressive measures has significantly propelled the flourishing of urban agriculture in these cities.
In response to the AQI observed in Guang’an City and Neijiang City, this study proposes targeted recommendations for improvement. Given that these cities lack the pronounced natural resource endowments found in regions such as Ya’an City and face considerable constraints in transportation infrastructure and modernized equipment, enhancements should focus on optimizing resource allocation and refining policy frameworks. Specifically, in light of Guang’an City’s limited water resource availability, the adoption of advanced water management technologies and high-efficiency irrigation systems is recommended to enhance water use efficiency. Conversely, to address the shortage of skilled agricultural talent in Neijiang City, policy adjustments are advised to incentivize younger generations to engage in agriculture. This could be achieved by improving welfare benefits and salary structures to create additional agricultural employment opportunities, thereby encouraging the return of young and able-bodied labor to rural areas. By drawing on the experiences of cities with exemplary agricultural development, these measures can accelerate agricultural progress in select regions, ultimately fostering sustainable and high-quality agricultural development across the Chengdu-Chongqing region and other inland cities.
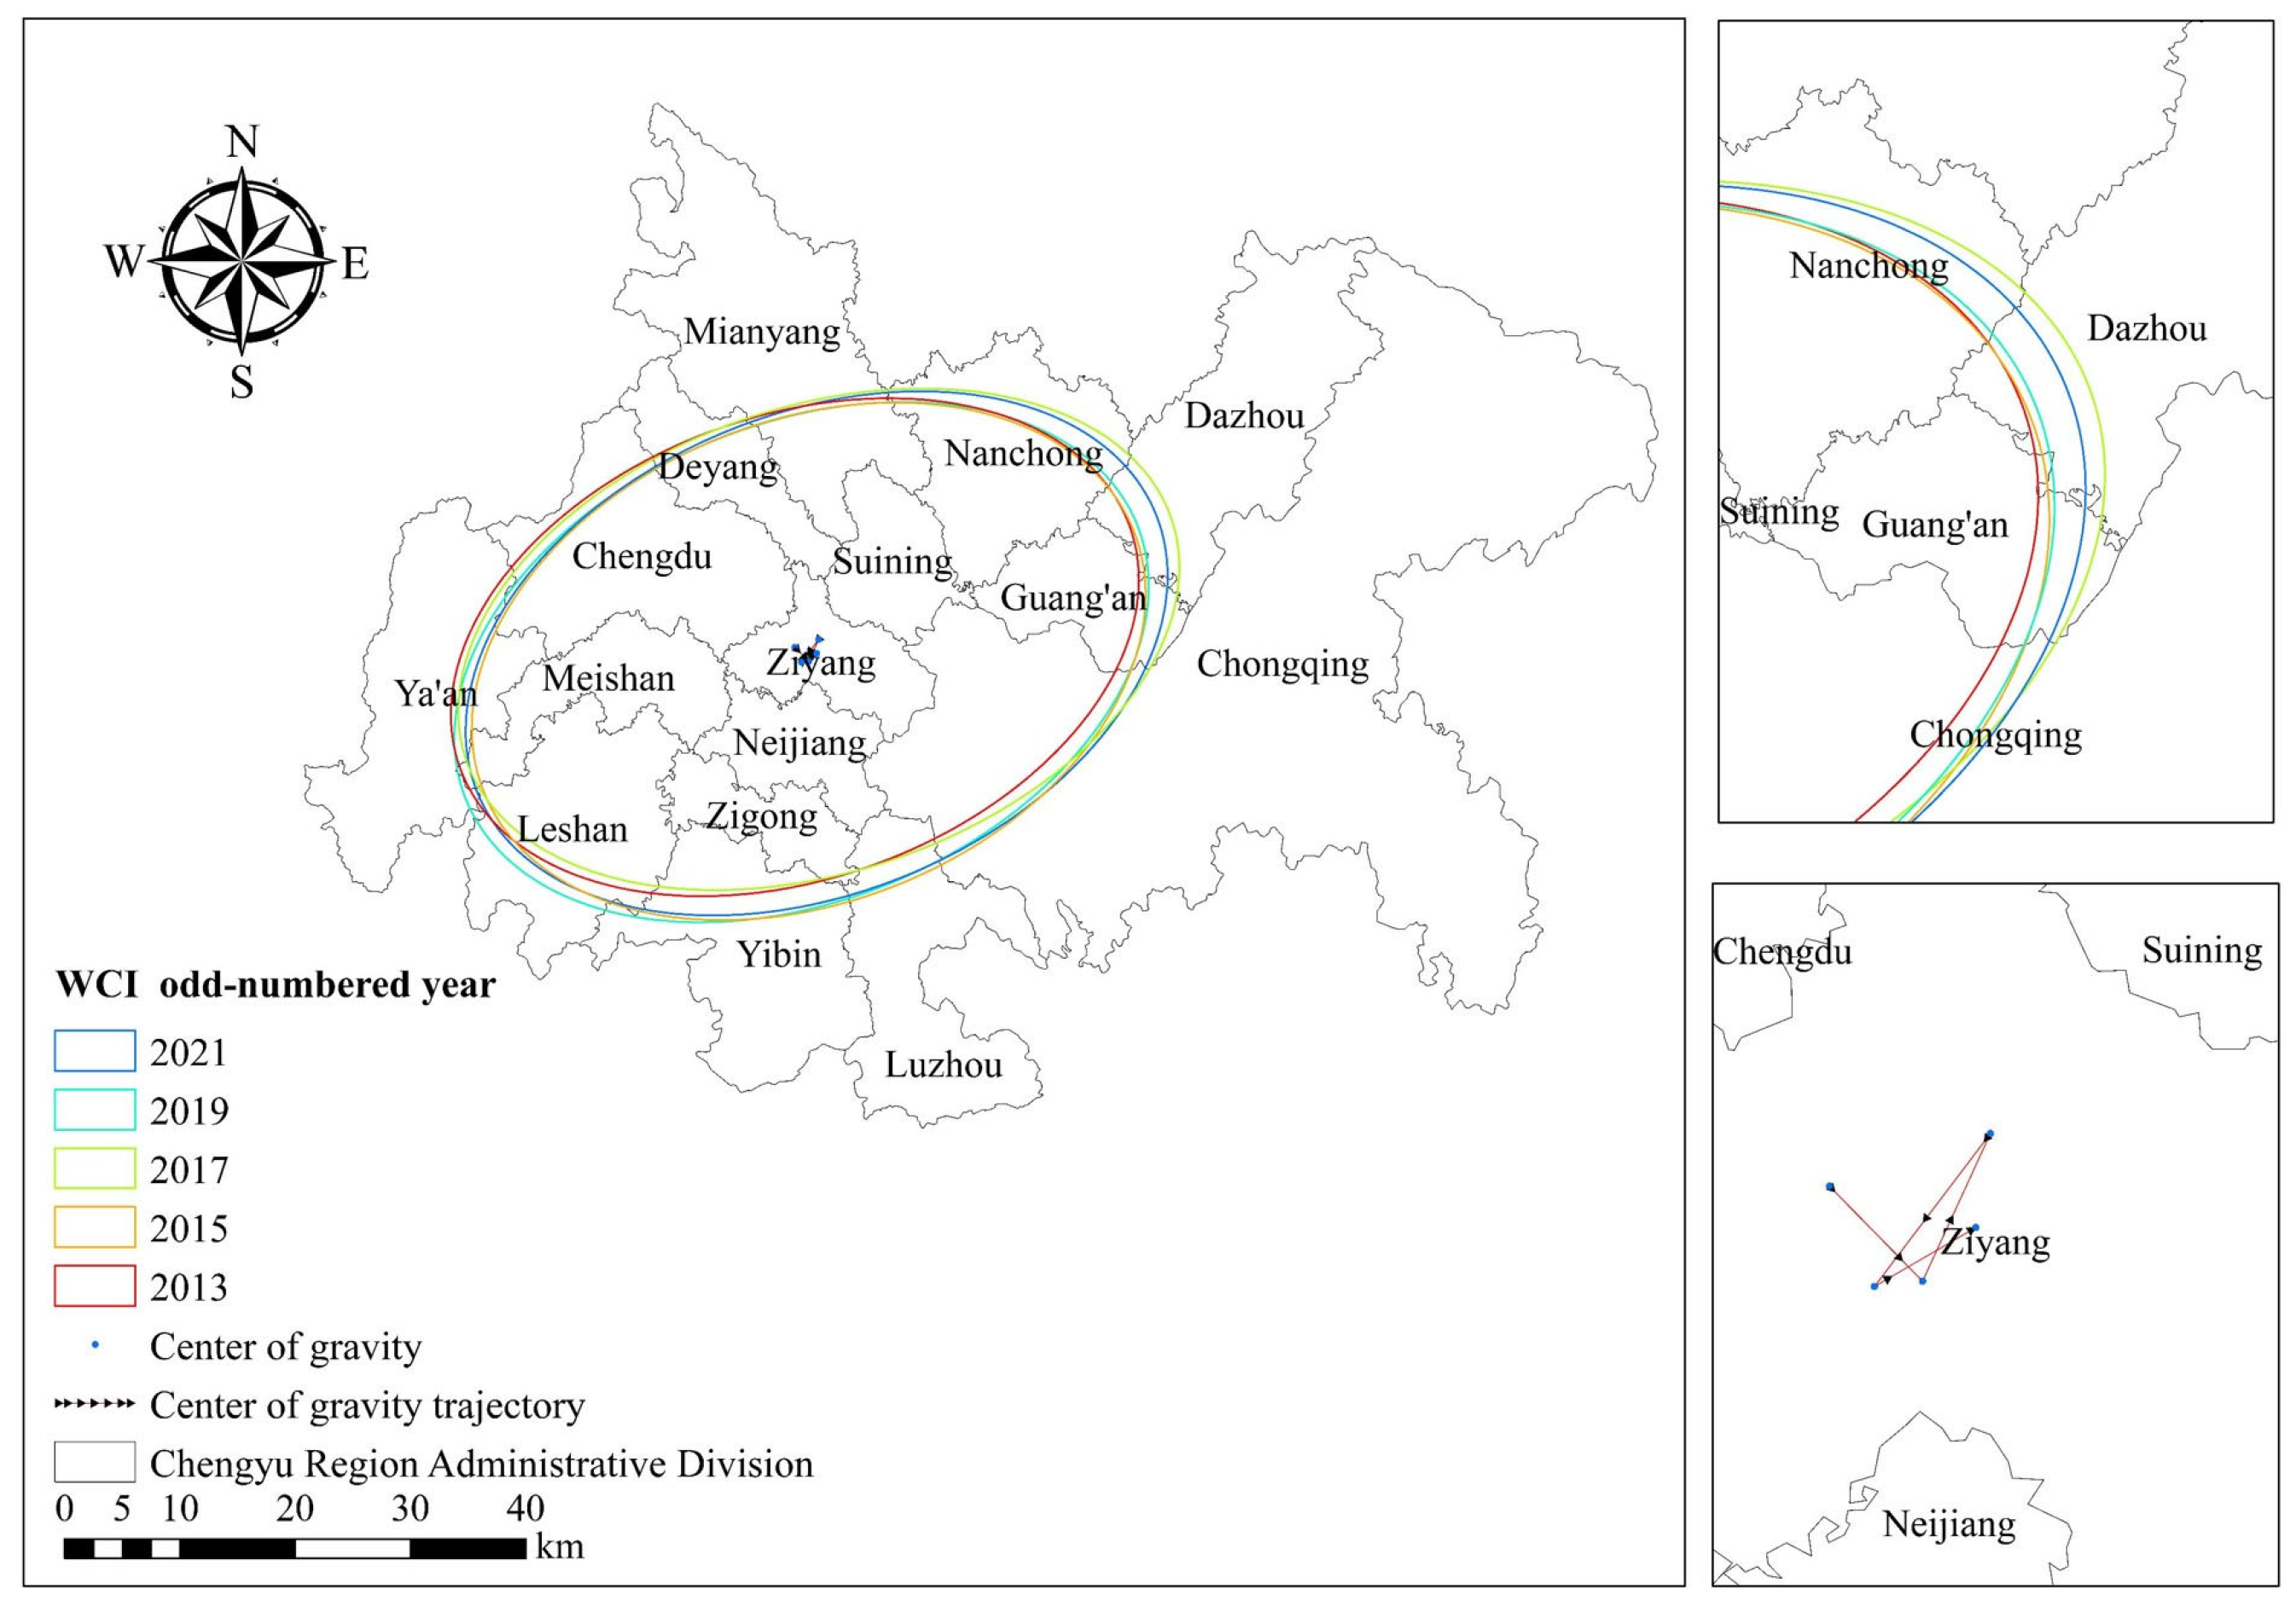
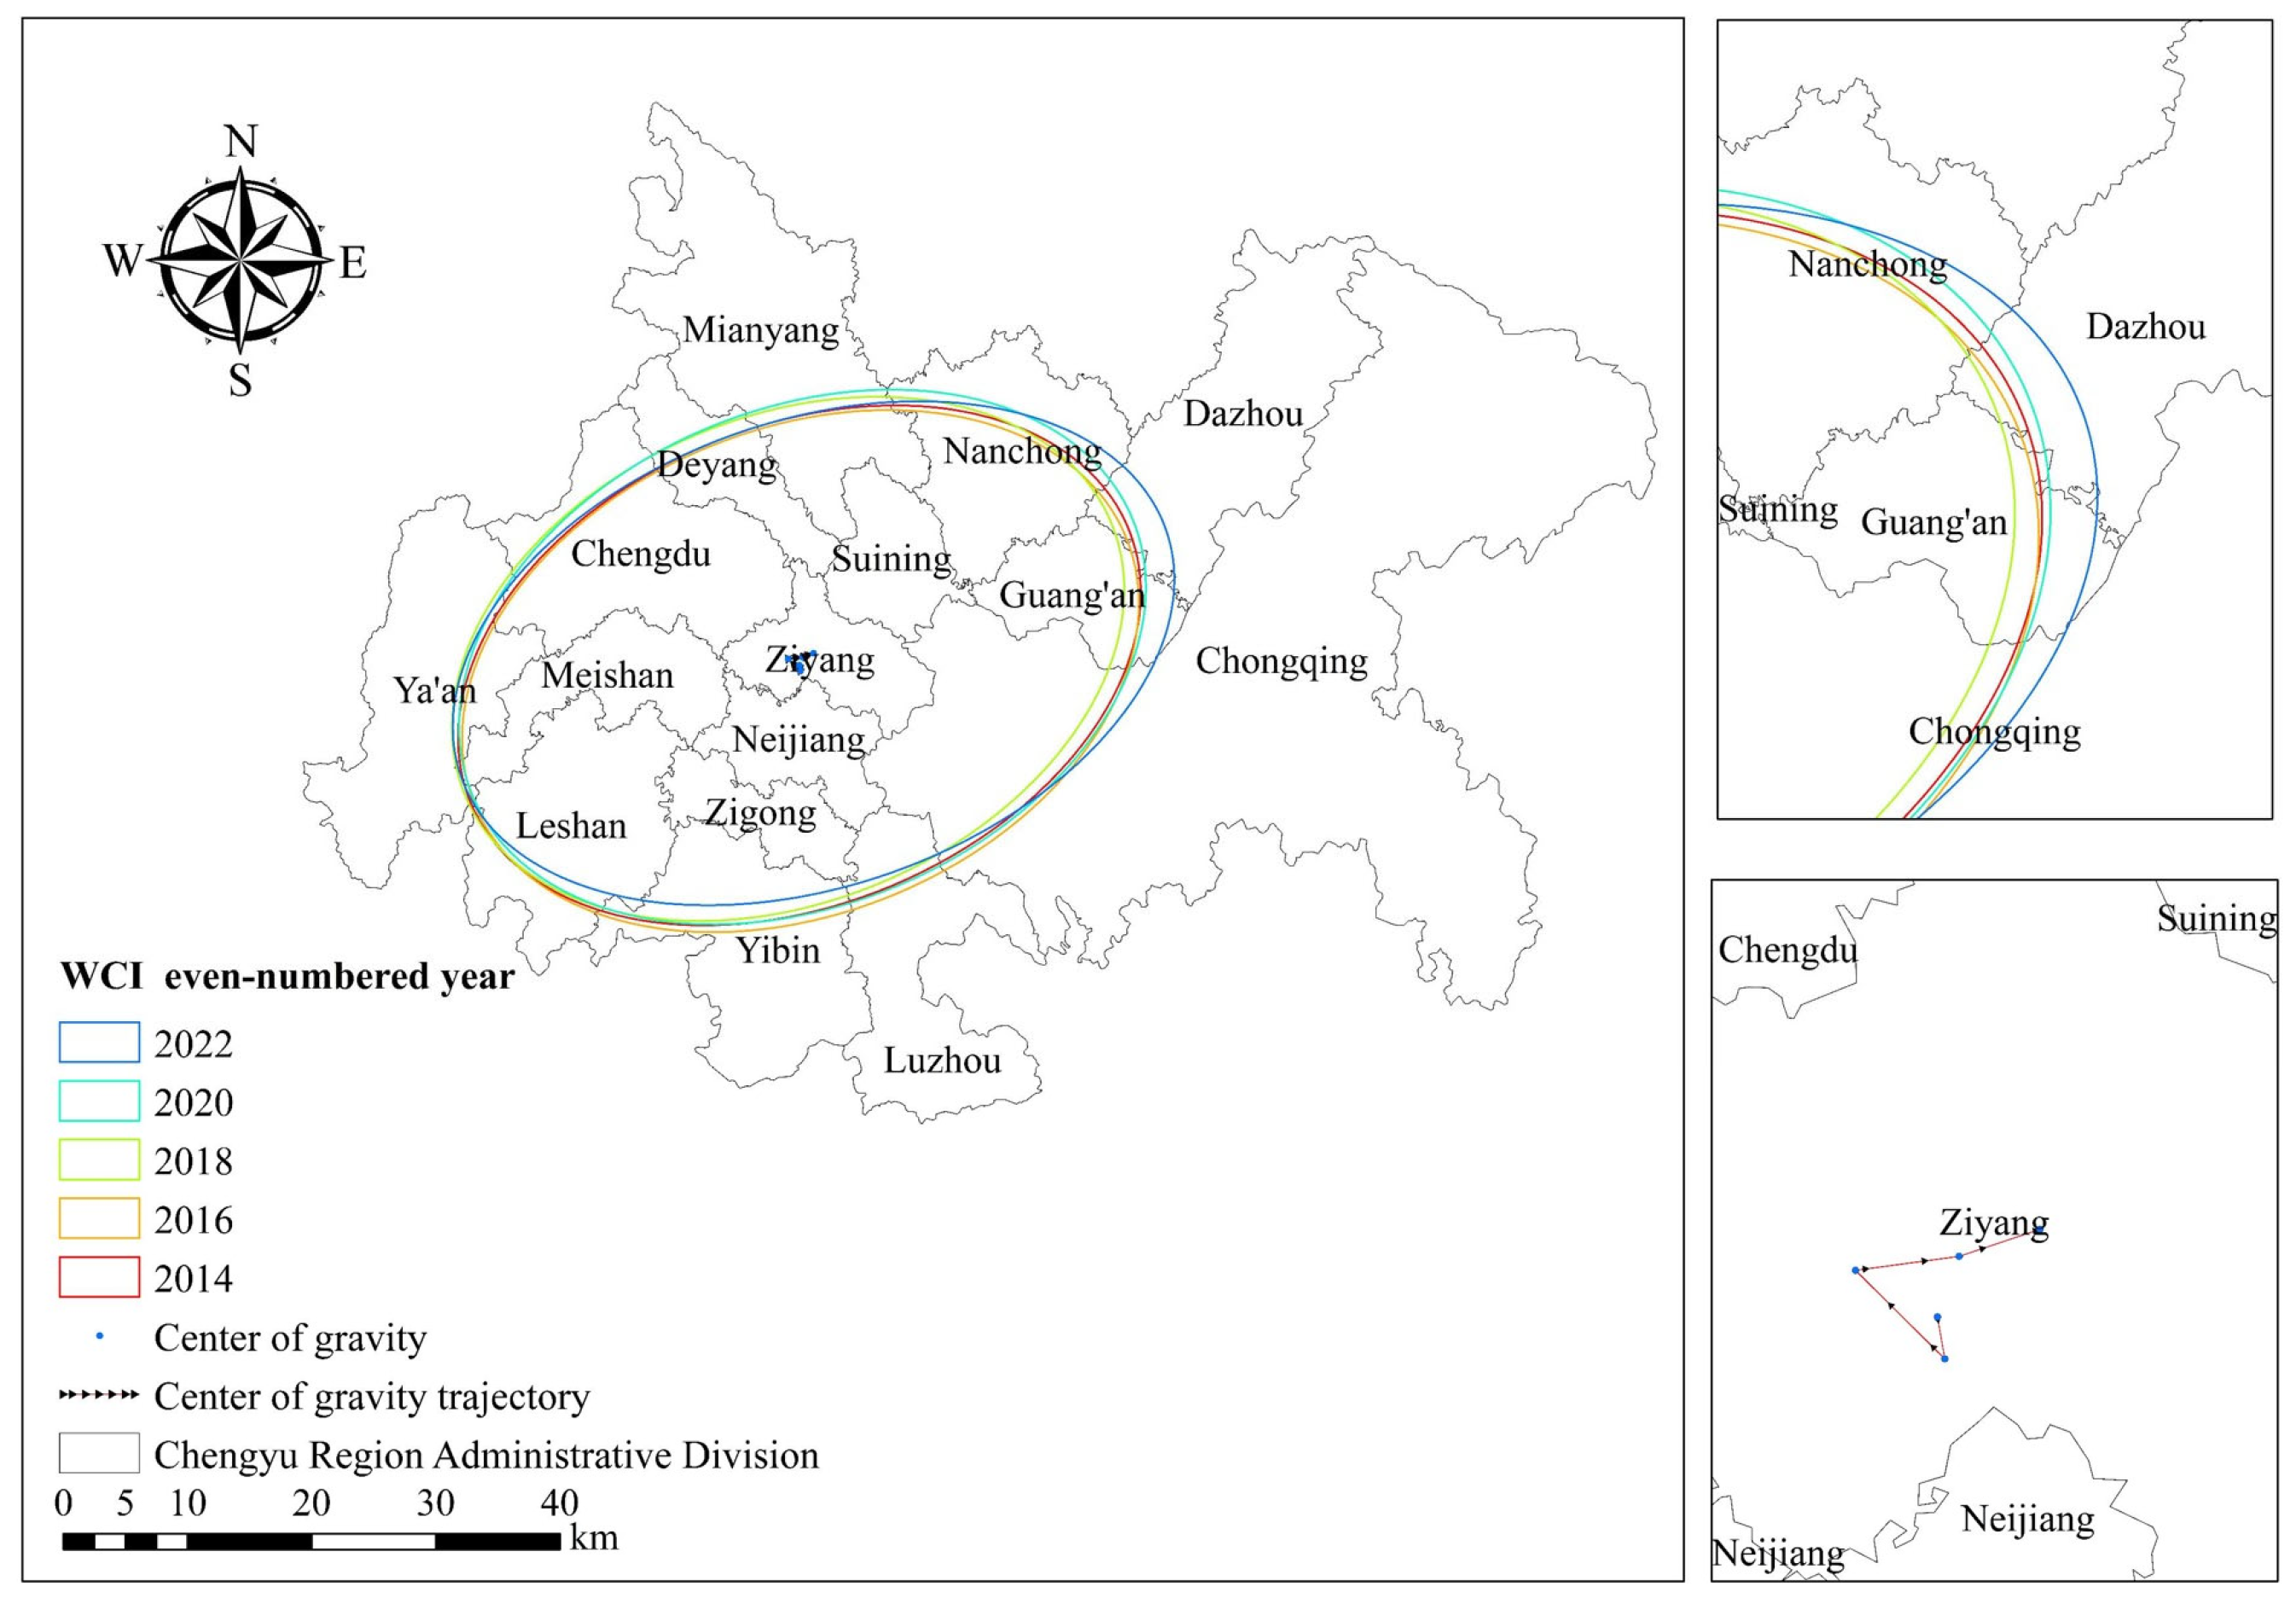
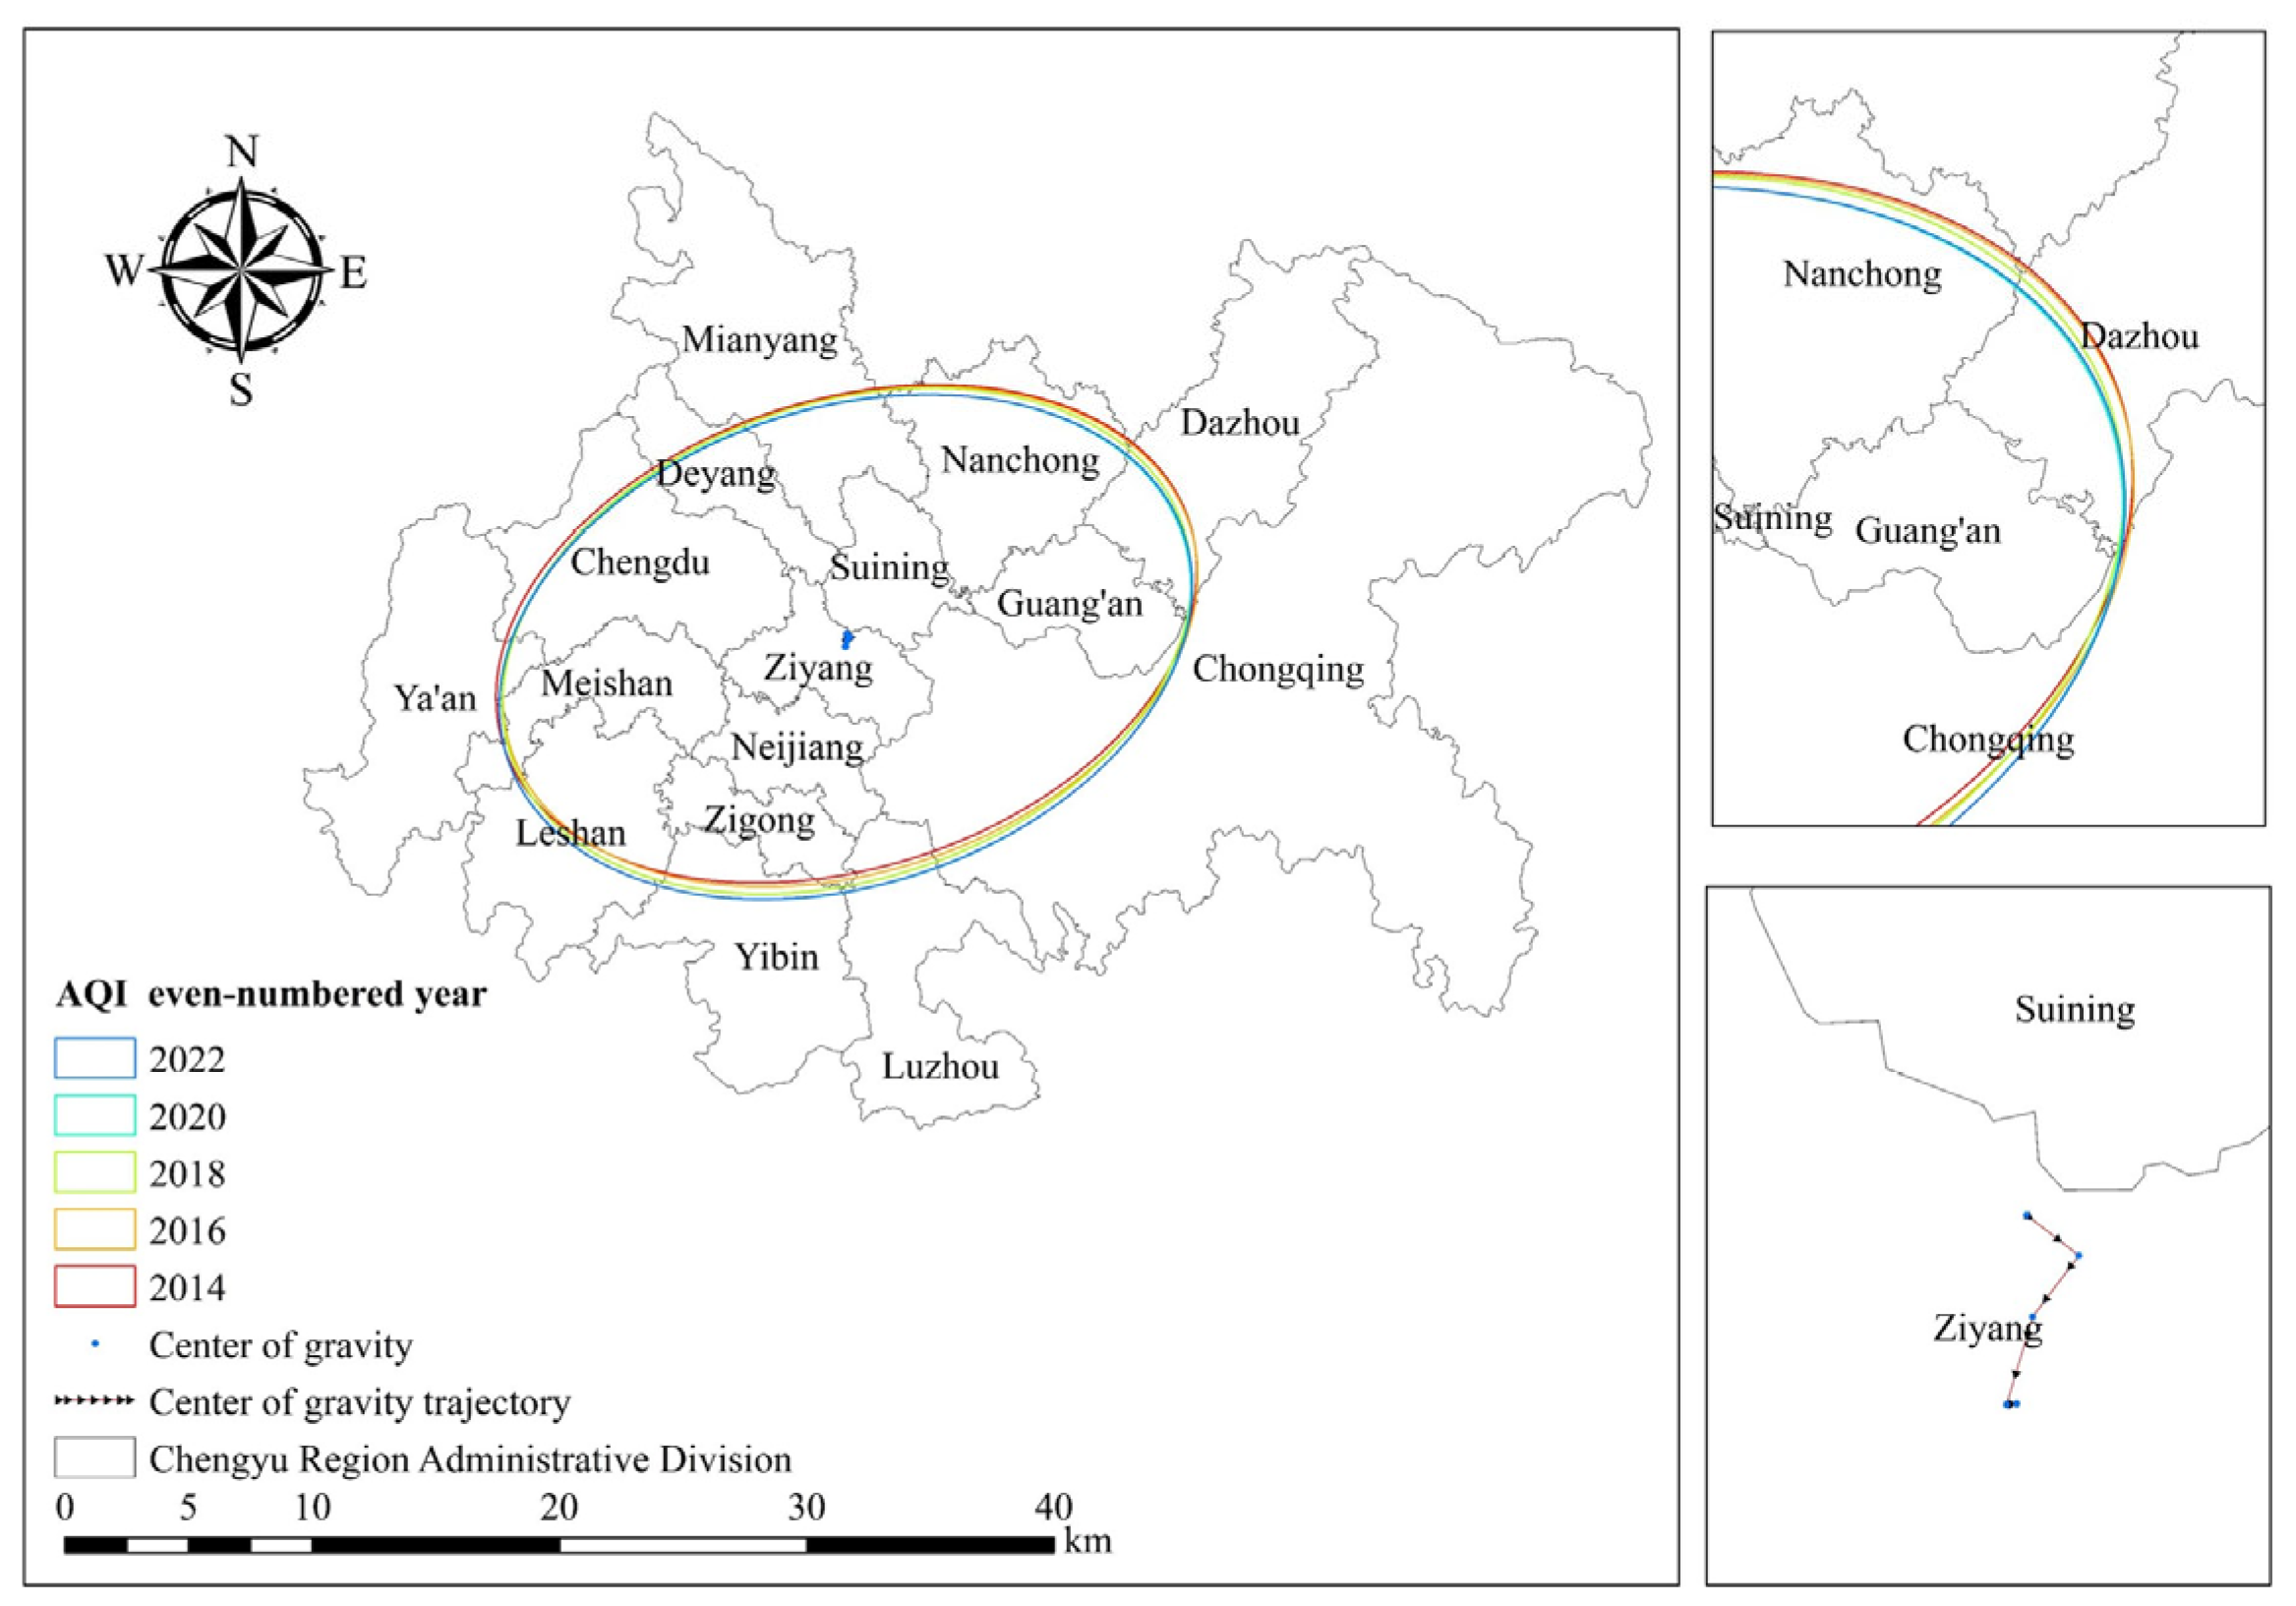
3.3. Spatial Trend Analysis of Water Resources Carrying Capacity and Agricultural Quality Index
To precisely elucidate the spatial evolutionary trends of agricultural development quality and water carrying capacity in the Chengdu-Chongqing region, this study integrates Geographic Information System (GIS) technology with the standard deviational ellipse model (SDE). This approach facilitated the creation of four elliptical distribution maps depicting QAI and WCI for odd and even years, alongside maps illustrating their centroid migration trajectories. The results are presented in
Table 2 and
Figure 6,
Figure 7,
Figure 8 and
Figure 9.
Based on the Standard Deviational Ellipse (SDE) analysis of the Water Carrying Capacity Index (WCI) from 2013 to 2022, the spatial distribution and directional trends of water resource development in the Chengdu-Chongqing region have shown both stability and gradual expansion. The centroids of the ellipses consistently remained in Ziyang City, highlighting a stable spatial nucleus and suggesting strong regional development coherence. Minor centroidal shifts across the years had a limited impact on the overall developmental structure.
The ellipse azimuth angle varied narrowly between 67.03° and 71.23°, indicating a consistent northeast-southwest directional trend. This directional stability implies that the region’s water resource development trajectory remains steady, with a slight northeastward movement. Notably, the elliptical area expanded from 87,902.18 km2 to 93,051.38 km2, signaling an increase in the spatial influence of the WCI, which reflects broader and more integrated regional development dynamics.
Further, the major axis length increased from 207.61 km to 217.90 km, and the minor axis fluctuated around 70.33–70.65 km, underscoring more evident spatial heterogeneity along the northeast-southwest axis. These morphological changes reflect an increasingly dispersed spatial pattern, corresponding to the region’s efforts to balance development and reduce spatial clustering. This dispersion aids in alleviating excessive concentration of water resource development and promotes more equitable urban growth. The diminishing spatial clustering of the WCI contributes positively to narrowing developmental gaps between urban centers and peripheral cities. Economically weaker cities such as Ya’an and Guang’an are progressively integrated through enhanced resource redistribution and infrastructural linkages. Central cities like Chengdu and Chongqing, while pursuing urban growth, remain committed to sustainable principles, enabling “the developed aiding the underdeveloped.” Through policy implementation, industrial upgrading, and employment generation, they redistribute growth opportunities across the region.
Additionally, shifts from traditional industries to green sectors have reduced dependence on local natural resources, easing water demand pressures amid ongoing urbanization. Water conservation initiatives have also enhanced public environmental consciousness, reinforcing adaptive regional resilience. Altogether, the spatial-temporal evolution captured through SDE modeling underscores a more balanced, inclusive, and sustainable development trajectory in the Chengdu-Chongqing economic circle.
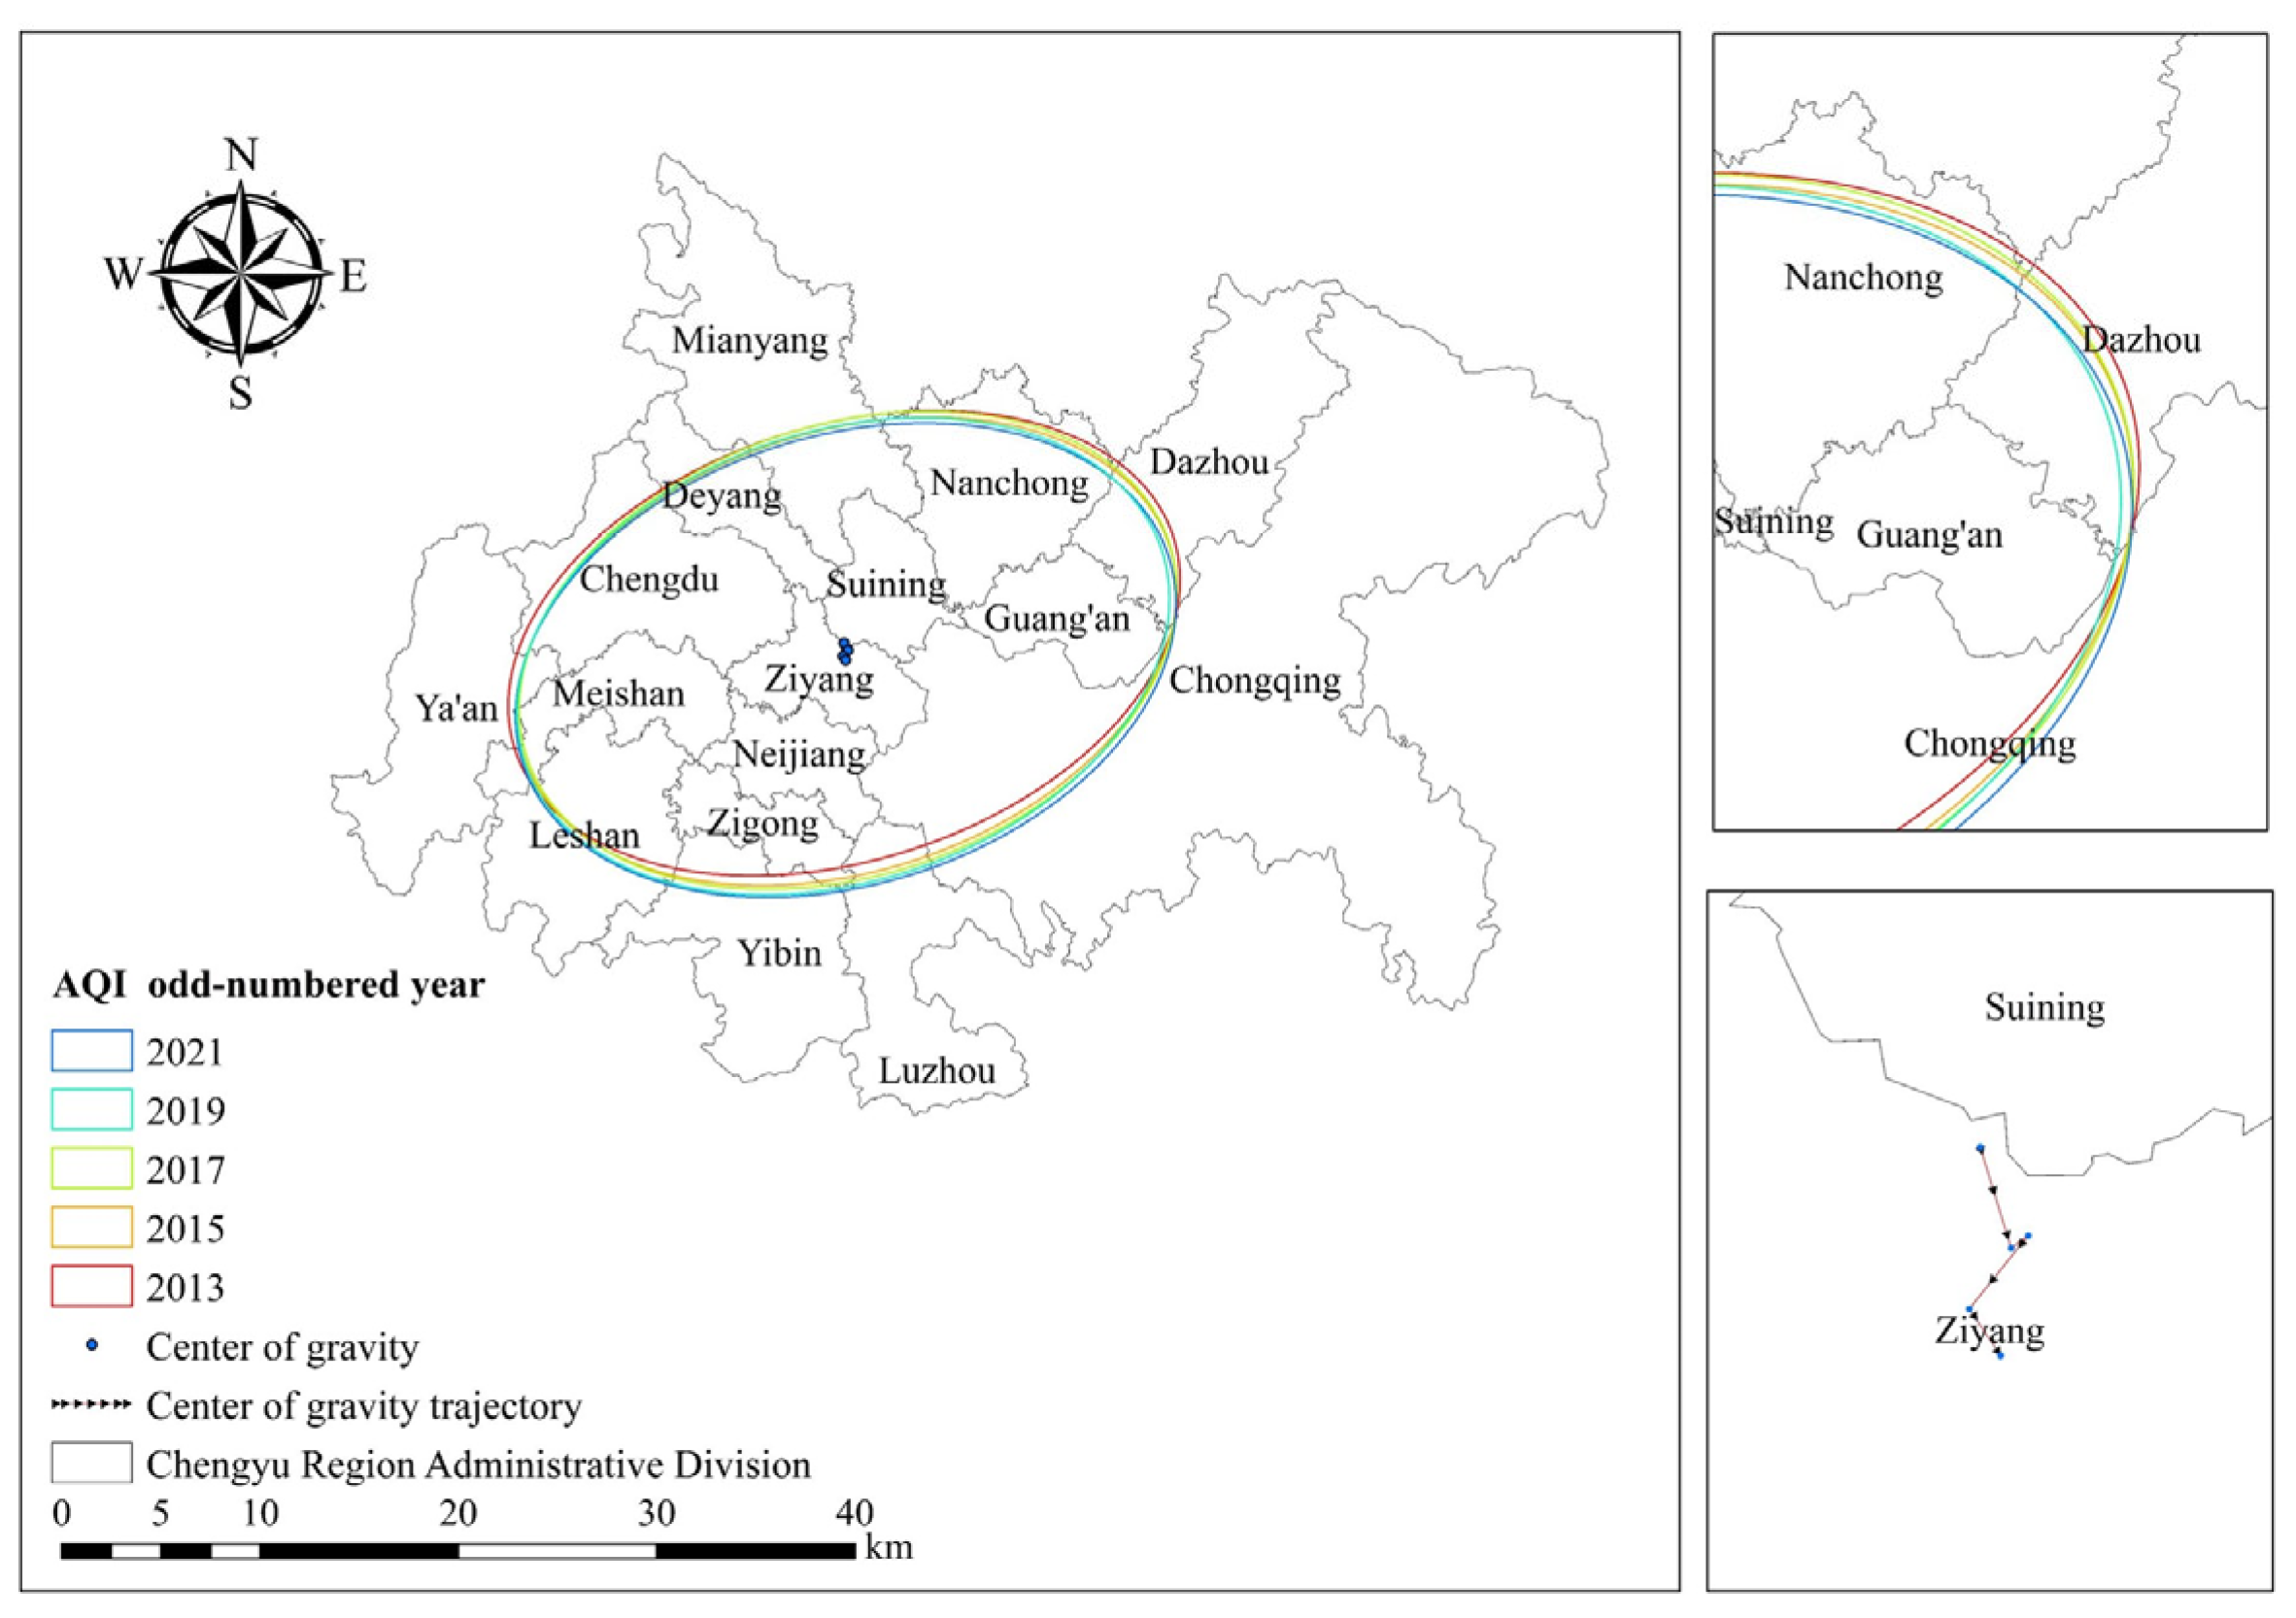
Based on data from
Table 2,
Figure 8 and
Figure 9, the SDE model reveals the spatial and temporal evolution of AQI in the Chengdu-Chongqing region from 2013 to 2022. Throughout this period, the AQI ellipse centroid consistently remained in northern Ziyang City, while exhibiting a gradual southward shift. This trend reflects the progressive enhancement of agricultural development quality in cities such as Zigong and Luzhou, signaling a southward redistribution of high-quality agricultural development. The azimuth angle of the AQI ellipse remained stable within a narrow range of 70.88° to 72.25°, indicating persistent directional orientation towards the northeast-southwest axis. This relative stability suggests that despite temporal changes, the region’s agricultural development pattern has remained coherent and predictable. The ellipse’s major axis length declined from 214.04 km in 2013 to 208.72 km in 2022, while the minor axis length increased from 134.68 km to 139.86 km. This shift denotes a contraction of AQI dispersion in the northeast-southwest direction, coupled with a slight expansion along the northwest-southeast axis, highlighting evolving regional differentiation. Additionally, the area of the ellipse expanded modestly from 90,556.09 km
2 to 91,702.63 km
2, indicating a gradual extension of the AQI’s spatial influence and improved balance in agricultural development, though disparities persist along the major axis.
These spatial dynamics underscore that while overall agricultural development quality has improved, inter-city imbalances remain a challenge. Specifically, cities with suboptimal industrial structures struggle to integrate high-quality agricultural products into broader markets, fostering competition that undermines regional coordination. Moreover, uneven enforcement of the “Grain for Green” policy across cities has reduced effective arable land, exacerbating development disparities. From a resource perspective, the Chengdu-Chongqing region retains approximately 7.27 million hectares of high-quality arable land—constituting 5.7% of the national total. Its large-scale contiguous farmland supports robust agricultural output, with a high multiple cropping index ensuring annual grain production consistently exceeds 80 million tons. This stable cultivation system, underpinned by favorable agroecological conditions, mitigates the impacts of seasonal or interannual variability.
Agricultural complementarity further reinforces the region’s development stability. Despite some competitive dynamics, similarities in climate and geography promote cooperation, exemplified by initiatives like the Upper Yangtze citrus belt and the Longchang pig farming base. These collaborations foster resource integration and sectoral synergies, reducing developmental disparities. Additionally, the region has established a comprehensive agricultural market framework that supports efficient resource circulation and product distribution.
In summary, the SDE analysis demonstrates that while the AQI’s spatial pattern has become more balanced and stable over time, targeted interventions are essential to address residual disparities and enhance coordinated agricultural development across the Chengdu-Chongqing region.
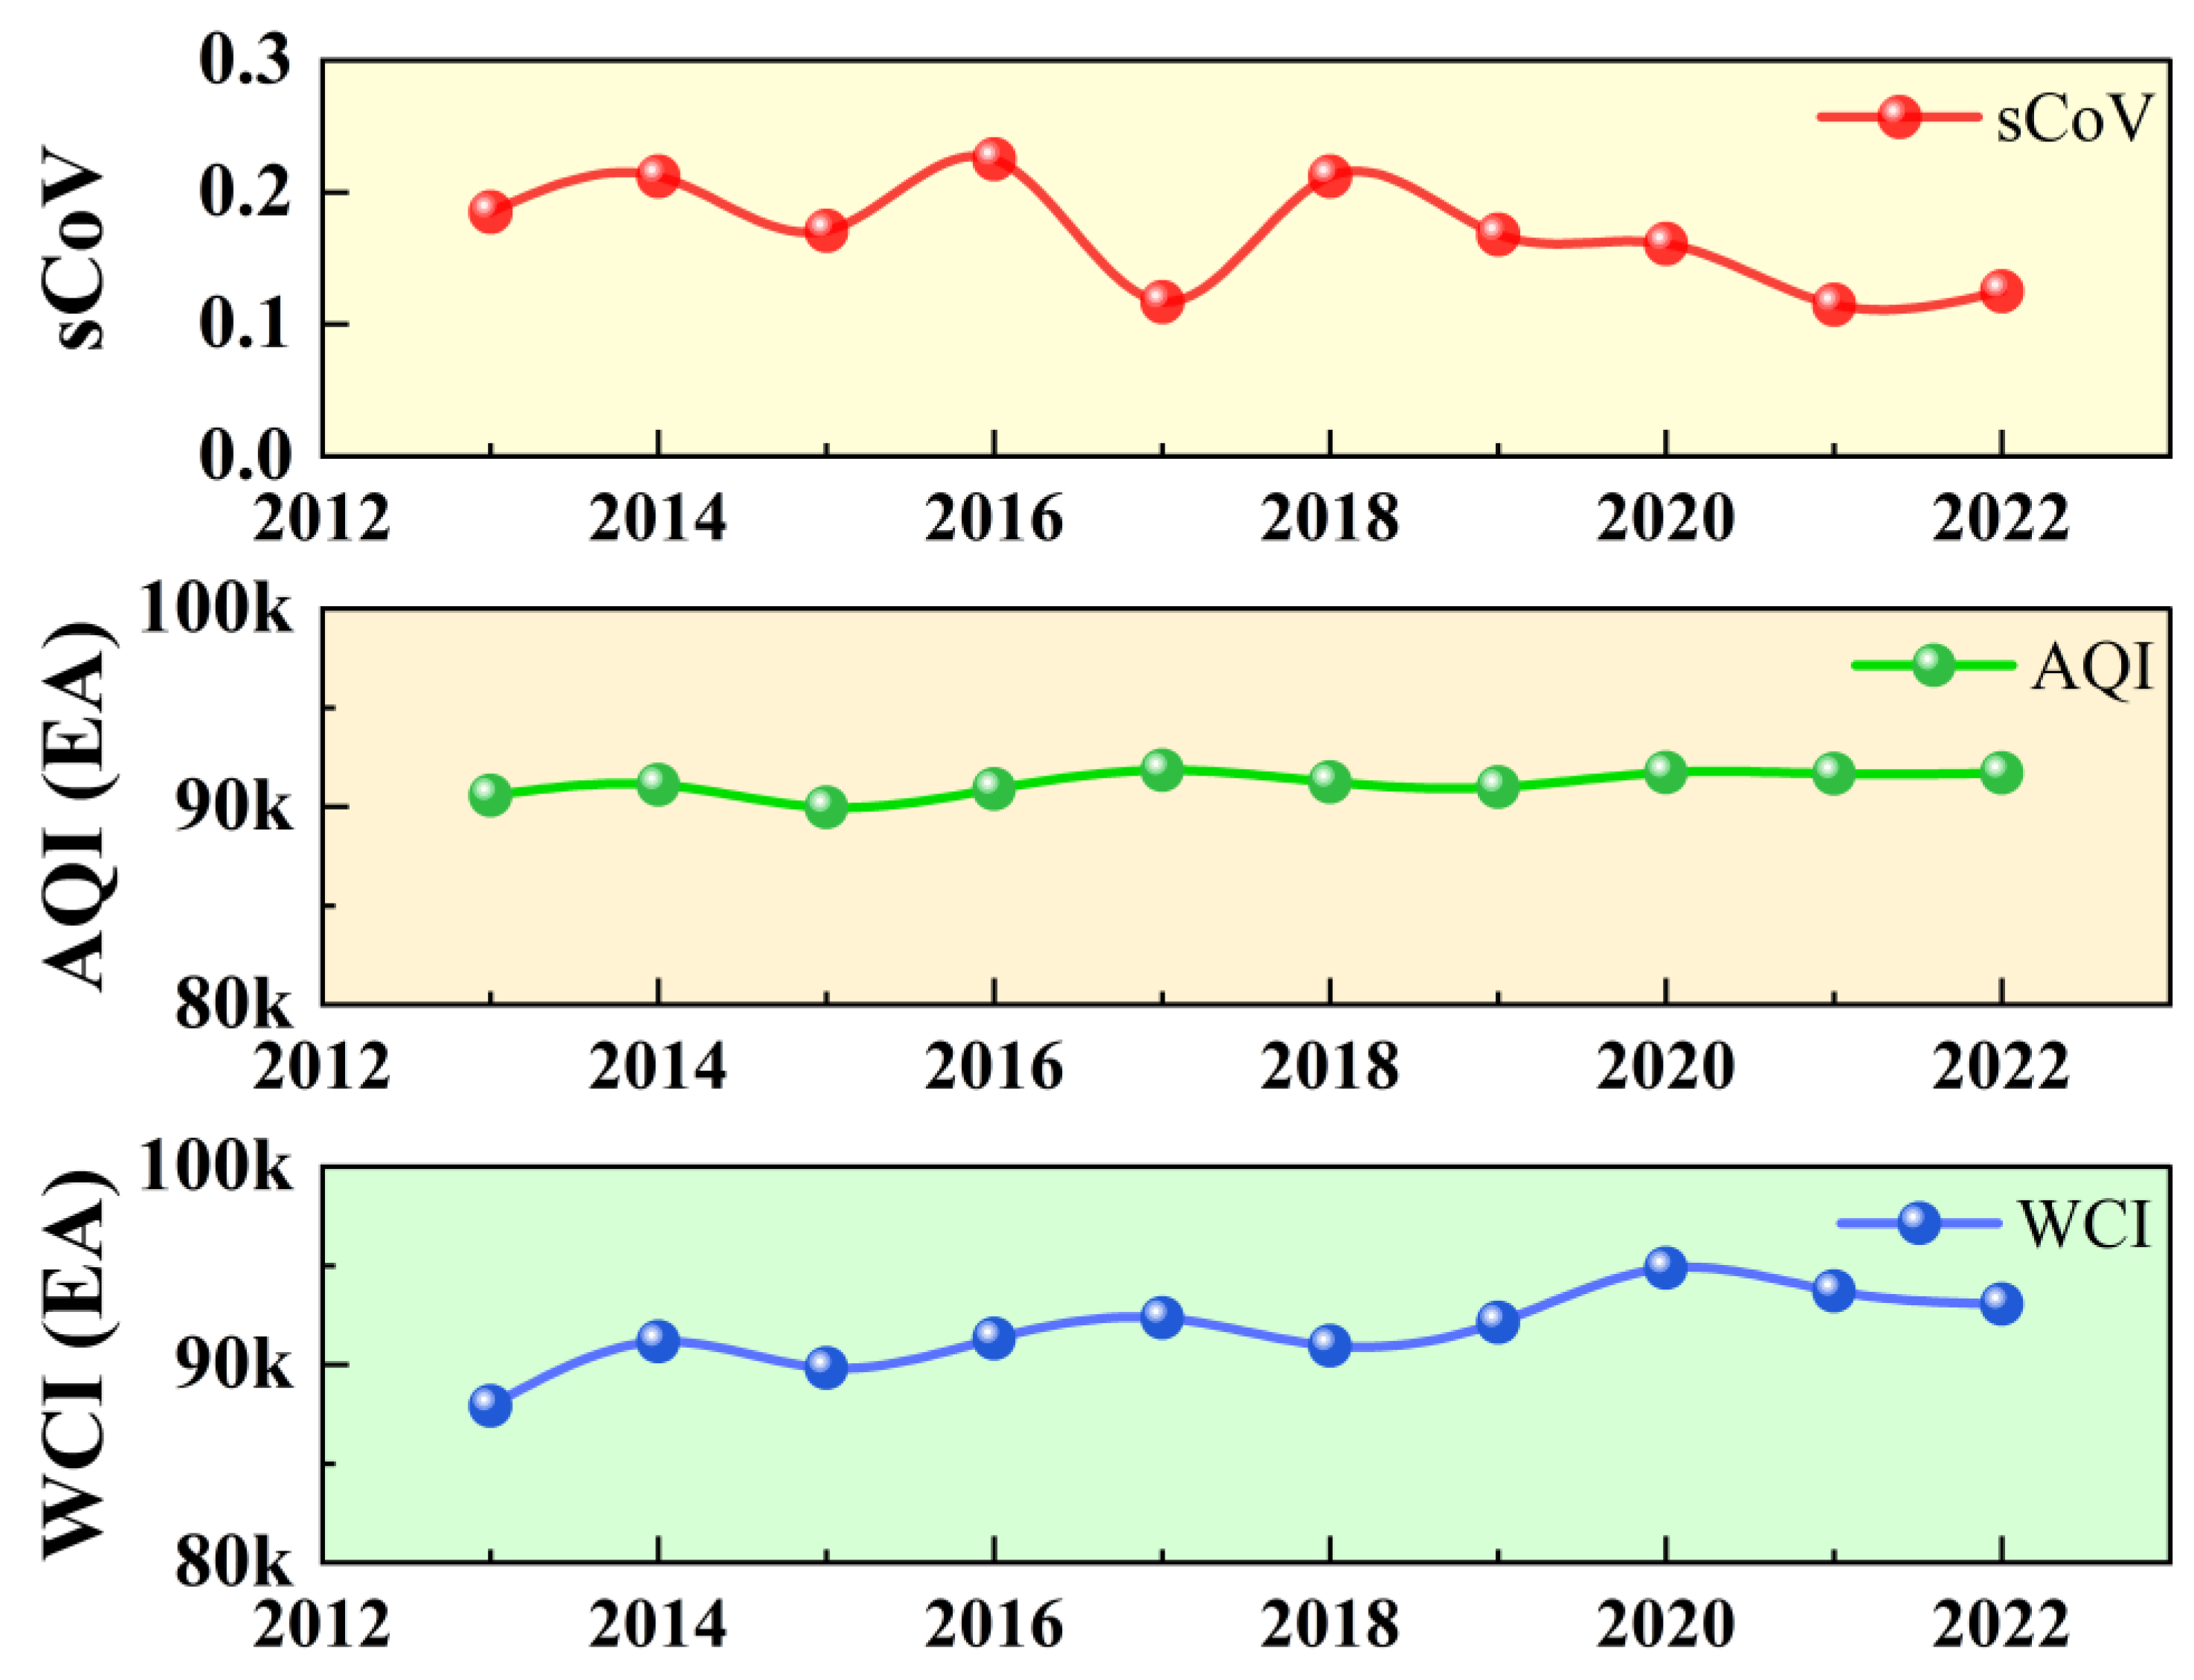
3.4. Analysis of Spatial Disparity Coefficients
To further explore the spatial differences between the quality of regional agricultural development and water resources carrying capacity, and accurately propose better governance solutions for their spatial coordinated development,
Figure 10 was drawn and deeply investigated based on the AQI ellipse and WCI ellipse in the Chengdu-Chongqing region from 2013 to 2022 and their spatial coefficient of variation (sCoV).
Between 2013 and 2022, the Chengdu-Chongqing region experienced a dynamic evolution in the spatial relationship between agricultural development quality and water resource carrying capacity. Spatial statistical analysis reveals that the spatial coefficient of variation (sCoV) initially increased during 2013–2016, indicating widening regional disparities. This trend reversed after 2016—excluding a temporary uptick in 2018—suggesting a gradual transition toward enhanced spatial-temporal coordination and integrated regional development. These developments reflect the growing adaptive capacity and institutional responsiveness in balancing agricultural growth with environmental constraints.
This temporal divergence can be attributed to early-stage structural imbalances, including uneven industrialization, suboptimal agricultural land planning, and inefficient water resource distribution. For instance, agricultural water consumption varied by up to 2.5 billion cubic meters across subregions, while output from the primary sector showed a disparity of approximately 15%. Such imbalances significantly contributed to the elevated sCoV during the early period. Notably, water resource constraints have had profound impacts on agricultural outcomes. In water-scarce areas such as Ziyang and Suining, high-irrigation crops like rice and cotton exhibited a pronounced sensitivity to water regulation policies. Under conditions of fluctuating water resource carrying capacity, both the planting area and yield of these crops declined by up to 13%.
These water limitations have also compelled some farmers to shift toward drought-resistant or high-efficiency cash crops. While such transitions may enhance long-term water use efficiency, they have caused short-term volatility in agricultural output, with regional agricultural GDP experiencing fluctuations of approximately 11.5%. These developments underscore the necessity of incorporating water resource-carrying capacity into agricultural development frameworks. Doing so not only optimizes resource allocation but also safeguards regional economic stability and food security.
Beginning in 2016, national and regional policy interventions played a critical role in reversing prior trends. Strategic efforts—such as the establishment of trans-regional water infrastructure, rationalized land use planning, and specialized agricultural demonstration zones—contributed to more efficient water distribution and enhanced industrial-agricultural integration. For example, the Chengdu–Chongqing integrated water resource management network and unified agricultural market mechanisms significantly mitigated spatial disparities and improved resource efficiency. The temporary spike in disparity observed in 2018 was largely due to the phasing out of outdated agricultural machinery and the restructuring of arable land—a transitional disruption that ultimately facilitated the modernization and automation of the regional agricultural system.
Spatial dispersion analyses further corroborate these findings. While the Agricultural Quality Index (AQI) remained relatively stable, with an elliptical standard deviation of around 90,000 km2, the Water Resource Carrying Capacity Index (WCI) exhibited a slight upward trend, signaling increasing spatial differentiation. These observations highlight the urgency for dynamic, location-specific governance strategies. Targeted reallocation of water toward high-demand agricultural zones, in tandem with adaptive land-use policies, will be essential for enhancing climate resilience and ensuring sustainable agricultural productivity in the Chengdu-Chongqing region.
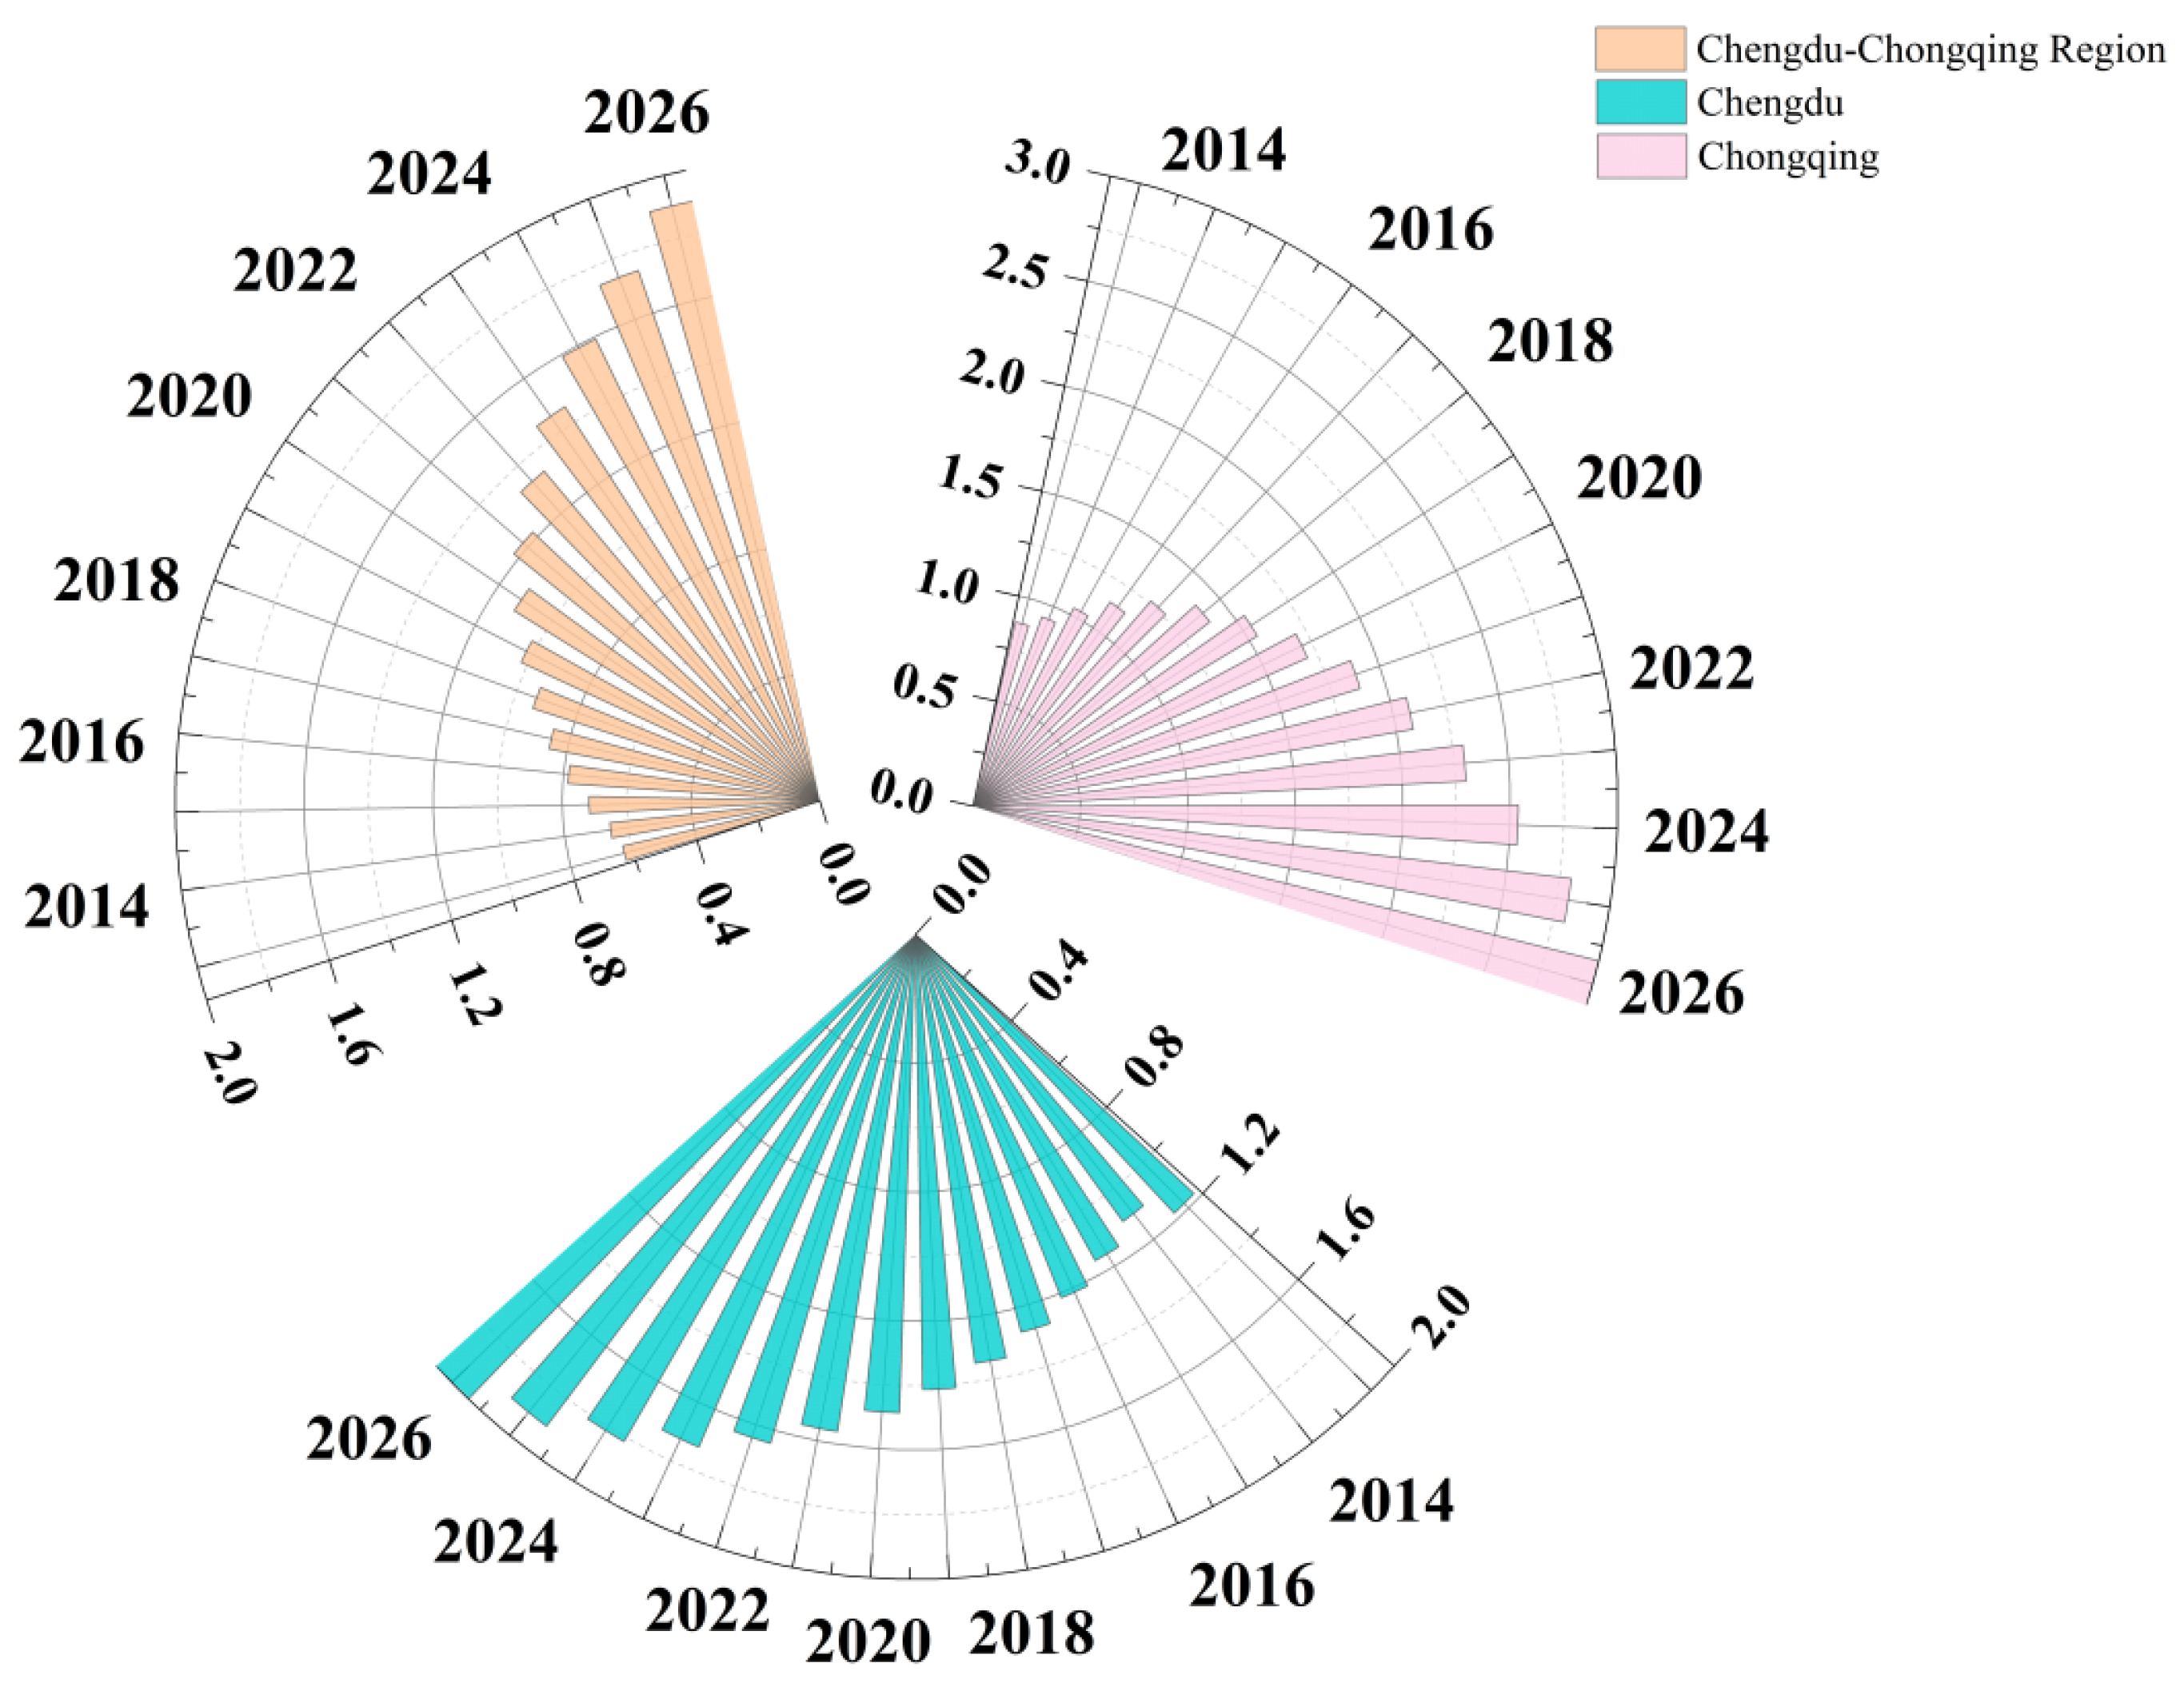
3.5. Grey Prediction Analysis
Building upon prior research, this study conducts a forward-looking analysis of agricultural development in the Chengdu-Chongqing region and its core cities, with the objective of delivering risk assessments and actionable policy recommendations for the short to medium term. To validate the analytical framework, the performance of the GM(1,1) model was evaluated, demonstrating strong reliability under existing data constraints. Specifically, the Mean Absolute Percentage Error (MAPE) for AQI sub-indicators remained below 3.9%, indicating the model’s robustness and suitability for forecasting applications in this context.
Forecasting results (
Figure 11) reveal a continued upward trajectory in the Quality of Agricultural Development Index (QAI) across the region, suggesting that regional integration strategies have been effective in optimizing agricultural resource distribution and enhancing overall development outcomes. By 2026, the QAI for the Chengdu-Chongqing region is expected to reach 2.0, with Chongqing potentially achieving a QAI of 3.0—highlighting its prominent role in driving regional agricultural progress.
This growth momentum is underpinned not only by targeted governance initiatives—such as Chengdu’s “Three Supports and One Assistance” policy and Chongqing’s land conservation programs—but also by broader structural transformations. These include accelerated agricultural mechanization, enhanced water resource management, and expanded infrastructure for resource recycling and utilization. Chongqing, in particular, benefits from its favorable subtropical monsoon climate, abundant water resources, and diverse terrain, which collectively foster high agricultural productivity. Its strategic alignment of agriculture with manufacturing and service sectors, coupled with sustained investment in technological innovation and human capital, further consolidates its leadership within the region.
Recent studies have explored the vulnerability of agricultural land under the dual pressures of climate variability and urban expansion. Specifically, land use dynamics simulations for the agricultural core region in western Iran reveal that agricultural practices are facing a dual threat: precipitation levels falling below the critical threshold of 250–300 mm and the encroachment of urban expansion on high-quality farmland [
64]. These findings are highly relevant to the Chengdu-Chongqing region, which shares similar challenges, including rapid urbanization, resource competition, and regional climate sensitivity. Given these common risks, this study extends the forward-looking approach to the Chinese context by integrating socio-ecological forecasts and urban stress indicators to predict future agricultural pressures. Therefore, the Chengdu-Chongqing urban agglomeration must prioritize adaptive strategies to alleviate these dual pressures—climate-induced water variability and land conversion—while promoting spatial planning mechanisms that protect productive agricultural zones. This perspective provides a valuable cross-regional viewpoint, ensuring the future of agricultural development in Southwest China under systemic shocks.
In the face of accelerating urbanization, it is imperative that Chengdu and Chongqing proactively assess how shifting climate patterns and expanding urban footprints might exacerbate pressure on water resources and diminish land suitability. Policymakers must enhance their capacity to evaluate and manage these emerging risks within the framework of ongoing regional development. This will require refinements in water resource governance, the establishment of adaptive and forward-looking land management systems, and a strategic balancing of growth ambitions with sustainability imperatives—capitalizing on the region’s unique “dual-core driving” advantage to ensure resilient and inclusive agricultural development.
4. Discussion
4.1. Model Development and Application Effects
This study investigates the spatiotemporal characteristics and interactive mechanisms between agricultural development quality and water resource carrying capacity (WCI) in the Chengdu-Chongqing region. Using a multidimensional evaluation framework and quantitative models, it explores the dynamic interactions and heterogeneous patterns of these factors, offering insights into the coordinated development of agriculture and water resources in inland economic circles.
From 2013 to 2022, WCI in the Chengdu-Chongqing region showed a fluctuating upward trend, influenced by natural resources, policy interventions, and climate change. Spatial disparities were evident: Ya’an, with abundant water resources and low industrial pressure, consistently maintained a WCI of 0.56. In contrast, Zigong and Ziyang faced constraints due to topographic limitations, supply-demand imbalances, and lagging management practices, resulting in lower WCI. Barrier degree analysis revealed that, between 2013 and 2016, the ecological environment was the primary limiting factor, worsened by urbanization pressures. After 2019, the water-society system became the dominant constraint, driven by population growth and resource allocation challenges. By 2022, extreme heat events exacerbated the barrier degree of the water resource system, highlighting the increasing threat of climate change. These findings underscore the urgent need for enhanced water resource management and coordinated strategies within the economic circle to improve resilience to climate variability.
The Agricultural Quality Index (AQI) in the region steadily increased, although significant spatial heterogeneity remained. Chongqing and Chengdu, with abundant hydrothermal resources, robust policy support, and industrial integration (e.g., mustard tuber and citrus industries), consistently led in AQI, exerting a positive influence on surrounding areas. In contrast, Guang’an and Neijiang lagged due to resource scarcity, inadequate infrastructure, and talent loss. The Chengdu-Chongqing Twin-City Economic Circle strategy, implemented in 2016, facilitated resource integration and technology sharing, reducing AQI disparities and enhancing the “core-periphery” model. However, localized fluctuations in 2018, caused by the phase-out of traditional agricultural machinery and land policy adjustments, highlighted the need for policy coherence during industrial transitions.
Analysis of the spatial coefficient of variation (sCoV) and standard deviation ellipse shows that, from 2013 to 2016, uneven resource allocation during early industrialization amplified disparities between WCI and AQI. From 2016 onwards, cross-regional water conservancy projects and industrial development, such as the Upper Yangtze Citrus Industrial Belt, helped reduce these disparities. A transient increase in sCoV in 2018 reflects the combined effects of climate factors and industrial adjustments. The spatial patterns of both systems exhibit a “westward concentration and extension from northeast to southwest,” aligning with the “dual-core driven” regional planning framework. However, WCI spatial dispersion exceeds AQI, emphasizing the need for better cross-regional coordination in water resource management.
In conclusion, achieving coordinated development between WCI and AQI in the Chengdu-Chongqing region requires tailored strategies to address stage-specific barriers. Optimizing resource allocation through core cities, Chengdu and Chongqing, and implementing cross-regional policies will mitigate climate change and industrial transition challenges. The experiences of this region provide valuable insights into the sustainable development of other inland economic circles.
4.2. Comparative Analysis
Existing studies on regional agricultural development and water resource management primarily focus on single-factor assessments or simplistic correlation analyses, often failing to dynamically track the coupling mechanisms of complex systems or address spatial heterogeneity. This study makes significant strides by constructing a comprehensive evaluation framework and conducting in-depth, multifaceted analyses, yielding notable advancements in several areas.
Unlike the prevalent focus of Chinese scholars on the interaction between economic benefits and environmental factors [
31,
32], which often isolates the study of agricultural development from broader system dynamics, this research examines the complex interplay between geographical disparities, human activities, policy dynamics, natural environmental conditions, and societal demands. By using a multidimensional set of models, this study systematically investigates how these factors influence agricultural quality in the Chengdu-Chongqing region, going beyond the limitations of traditional, single-dimensional analyses.
In contrast to international scholarship, which tends to focus on isolated environmental or resource issues, this study integrates a broader perspective. For instance, American research often explores ecological degradation from singular environmental dimensions [
33], such as climate change, without addressing its specific effects on agriculture. Similarly, German studies [
34] typically focus narrowly on the constraints of water scarcity resulting from droughts. In contrast, this research develops a holistic AQI framework that incorporates four dimensions—economic, demographic, spatial, and social—enabling a comprehensive analysis of water scarcity’s impact on agriculture and the effects of declining ecological conditions on sustainable development.
Current academic research on the spatial relationships between agricultural development and water resources often provides static descriptions, lacking exploration of the dynamic processes within the “core-periphery” structure. This study addresses this gap by using standard deviation ellipse centroid migration analysis, revealing that the spatial distribution patterns of AQI and WCI show a trend of “westward concentration and extension from northeast to southwest.” This aligns with the “dual-core driven” spatial strategy of the Chengdu-Chongqing Twin-City Economic Circle, offering empirical support for regional coordinated governance.
While existing optimization strategies focus on water-saving technologies [
41] or pricing reforms [
42], this study highlights the need for differentiated solutions based on systemic diagnostics. Through barrier degree analysis and spatial heterogeneity studies, three targeted strategies are proposed: First, to mitigate the impact of extreme climatic events, the development of intelligent irrigation networks and basin-wide coordinated water allocation mechanisms is recommended. These would draw on advanced water conservancy practices to optimize water distribution. Second, the establishment of cross-regional specialty industry clusters, such as agricultural product industrial belts and livestock breeding bases, leveraging the technological and industrial strengths of cities like Chongqing and Chengdu, can reduce disparities in underdeveloped areas. Third, to address the ecological system’s elevated barrier degrees, promoting drought-resistant crop varieties and ecological protection policies is essential to enhance agriculture’s resilience to climate change.
These strategies move beyond conventional water resource management approaches by creating a comprehensive framework that encompasses problem identification, mechanism analysis, and solution pathways. This holistic approach to regional agricultural and water resource governance fosters more sustainable development practices.
4.3. Research Limitations
Despite employing advanced quantitative techniques—such as the TOPSIS model, Standard Deviational Ellipse (SDE) analysis, spatial coefficient of variation (sCoV), and grey forecasting models—to study the interaction between the AQI and WCI in the Chengdu-Chongqing region, this study has several limitations.
First, the analysis primarily relies on statistical data from the past decade, with insufficient exploration of climate variables, and the scope of information could be expanded. Given the significant impact of climate change on WCI in this region, future research should refine the analysis by incorporating climate-related factors. This would enhance the accuracy of development risk forecasts and promote more coordinated agricultural planning.
Second, although the study thoroughly examined the spatiotemporal characteristics, the large population and vast geographical extent of the region make it challenging to conduct a detailed analysis of each influencing factor. Although comprehensive error analysis (with deviations below 4.5%) was performed to mitigate the impact of data precision, future studies could improve accuracy by integrating a broader set of indicators. Exploring disparities driven by policy, natural, and social factors would further enhance the study’s precision.
Finally, while a range of multivariate models were used, there may be more advanced or appropriate data models available. The research team will continue to refine its methodology to improve accuracy and comprehensiveness. Furthermore, due to delays in the compilation of statistical yearbooks (2014–2023), there exists a potential margin of error in projecting future trends in agricultural quality across the study regions. To address this limitation, the Grey Model GM(1,1) was employed to perform reasonable extrapolation based on the available data. Validation results of the GM(1,1) model indicate that the Mean Absolute Percentage Error (MAPE) for the Air Quality Index (AQI) across the three regions remained below 3.9%, demonstrating the model’s high reliability and predictive accuracy despite data constraints.
5. Conclusions
This study explores the spatiotemporal interaction between AQI and WCI in the Chengdu-Chongqing region from 2013 to 2022. It reveals a consistent increase in AQI, though significant spatial disparities persist. Chongqing and Chengdu, with strong industrial integration and policy support, have emerged as key development hubs. In contrast, other cities struggle due to water shortages, talent migration, and infrastructural challenges. WCI shows an upward trend, though extreme climatic events and urbanization exacerbate regional disparities, highlighting a mismatch between agricultural growth and water resource availability.
To address these challenges, the study proposes several strategies: (1) improving cross-regional water coordination, such as intelligent irrigation networks; (2) fostering specialized industry clusters by leveraging core cities’ economic strength; and (3) establishing climate-resilient agricultural systems, including drought-resistant crops and ecological protection policies. These solutions aim to resolve key bottlenecks, such as uneven resource distribution and environmental pressures, ensuring long-term agricultural and water sustainability.
The study also contributes by establishing a multidimensional framework that evaluates the dynamic relationship between AQI and WCI. Unlike conventional single-factor assessments, this approach provides a comprehensive basis for policymaking in agricultural modernization and rural revitalization. The framework is adaptable to other inland regions facing similar agricultural–water resource challenges. By integrating natural resource management, policy coordination, and technological empowerment, it offers actionable strategies for achieving sustainable development goals under the “dual carbon” initiative.
The findings are particularly valuable for policymakers and researchers working on sustainable water resource management and agricultural development. The study emphasizes the importance of adopting systems thinking and region-specific solutions to balance agricultural growth with water availability. Additionally, it highlights the critical role of coordinated governance in overcoming spatial and temporal disparities, offering a replicable governance model for other regions worldwide.
In summary, this study provides actionable strategies for the Chengdu-Chongqing region while contributing to global agricultural-water nexus research. Its innovative framework offers a scalable solution for achieving sustainable agricultural development and resource management in inland economic zones.


