Article

Effect of Cultivar and Methanol Solvent Concentration on the Extraction of Bioactive Compounds from Colored Potatoes Grown in Lithuania

by
Nijolė Vaitkevičienė
1,2,*,
Jolita Višinskytė
1,
Jūratė Staveckienė
2,
Dovilė Levickienė
1,2 and
Jurgita Kulaitienė
1,2
1
Institute of Agriculture and Food Sciences, Agriculture Academy, Vytautas Magnus University, Donelaicio Str. 58, LT-44248 Kaunas, Lithuania
2
Bioeconomy Research Institute, Agriculture Academy, Vytautas Magnus University, Donelaičio Str. 52, LT-44248 Kaunas, Lithuania
*
Author to whom correspondence should be addressed.
Agriculture 2025, 15(13), 1332; https://doi.org/10.3390/agriculture15131332
Submission received: 9 May 2025 / Revised: 9 June 2025 / Accepted: 17 June 2025 / Published: 20 June 2025

Abstract

:
Potatoes are a valuable source of diverse bioactive compounds, including phenolics. In recent years, red- and purple-fleshed cultivars have garnered increasing scientific interest due to their higher content of phenolic compounds. The aim of this study was to evaluate the impact of 60%, 80%, and 100% methanol concentrations on the extraction of bioactive phenolic compounds from three red- and purple-fleshed potato cultivars. The qualitative and quantitative composition of phenolic compounds, the total anthocyanin content, as well as antioxidant activity in the prepared potato extracts were investigated. The results showed that the contents of the tested compounds and antioxidant activity in potato tuber methanolic extracts varied depending on the cultivar and methanol concentration. The potato extract obtained by 60% and 80% methanol showed the significantly highest contents of total phenolics (TPs) and total phenolic acids (TPAs). ‘Violet Queen’ extracts with 60% and 80% methanol had the significantly highest contents of TP, TPA, and caffeic acid. The significantly highest contents of p-coumaric acid were observed in ‘Mulberry Beauty’ extracts using 60% and 80% methanol. The significantly highest contents of epicatechin and quercetin were found in ‘Violet Queen’ extracts with 80% methanol, while the highest contents of myricetin, m-coumaric, and o-coumaric acids as well as the highest antioxidant activity were recorded in ‘Violet Queen’ extracts with 60% methanol.

1. Introduction

Edible potato (Solanum tuberosum L.), an annual crop in the Solanaceae family, is grown in over 150 countries due to its high yield and valuable nutrient value (high-quality proteins, carbohydrates, vitamins, mineral elements, and biological active compounds) [1]. Potatoes with white and yellow flesh are the most commonly grown potatoes worldwide. However, potato cultivars with flesh colors ranging from light pink to dark purple, known as colored potatoes, have been receiving increased interest from consumers, industry, and researchers, due to their greater phytochemical content and more attractive color [2,3]. These potatoes are a source of different health-promoting compounds, like phenolic compounds [4,5]. As reported by Nayak et al. (2011) [6], the content of these compounds found in colored fleshed potatoes are a few times higher than traditional, light-fleshed ones.
Phenolic compounds are health-promoting phytochemicals with antioxidant activity, antibacterial, anti-inflammatory, antiviral, anticarcinogenic, and vasodilatory properties, as reported by many studies [7,8]. Therefore, these compounds have potential for use as functional food and dietary supplements for improving human health and preventing different diseases [9]. After oranges and apples, potatoes were regarded as the third most significant source of phenolic compounds [8,10]. The main polyphenolic components in potato tubers are phenolic acids (chlorogenic acid, ferulic acid, caffeic acid, p-coumaric acid, and protocatechuic acid) and flavonoids (rutin, myricetin, quercetin, and kaempferol) [11,12]. Anthocyanins are colored flavonoids composed of red, purple, or blue pigments found in potatoes with colored flesh [13]. The content of phenolic compounds such as phenolic acids, flavonoids, and anthocyanins, and consequently the antioxidant activity in plant’s raw materials, are influenced by various factors, such as the genotype properties, climate, and growing conditions. Additionally, the analytical and extraction methods, as well as the extraction solvent composition employed, can impact the content of these compounds [13,14,15].
To extract and optimally utilize phenolic compounds from plant-based raw materials, it is essential to apply extraction methods that are grounded in scientific principles and appropriate extraction conditions that ensure the effective recovery of these compounds. A properly selected and optimized extraction method enables more efficient recovery and utilization of valuable compounds [16]. During extraction, various organic solvents, such as methanol, ethanol, or their aqueous mixtures, can be used. These solvents are considered the most effective for extracting phenolic compounds [17]. Methanol solvents have been shown to be more effective in extracting higher contents of polyphenols and flavonoids compared to other solvents [18].
The use of methanol for the extraction of phenolic compounds in edible potato (Solanum tuberosum L.) with various tuber flesh colors is examined; however, only the impact of a single concentration of this solvent was investigated. However, the concentration of the solvent influences the quantitative and qualitative composition of phenolic compounds, antioxidant properties, and potential application of the extracts [13,19]. Therefore, it is critical to investigate the optimal concentrations of extraction solvent for a particular plant’s raw materials. For this reason, the objective of this investigation was to establish the effect of 60%, 80%, and 100% methanol concentrations on the extraction of phenolic compounds from the potatoes with red and purple tuber flesh.

2. Materials and Methods

2.1. Plant Material

The tubers with purple and red flesh of three cultivars of edible potato (Solanum tuberosum L.) were used in this study. The ‘Blue Star’ tubers had light purple tuber flesh, ‘Violet Queen’ had dark purple tuber flesh, and ‘Mulberry Beauty’ had red tuber flesh. The tubers were grown on a farm in 2023 in the Prienai district of Lithuania (latitude, 54°37′59.99″ N; longitude, 23°56′60.00″ E) applying standard agricultural practices. The tubers were planted in May and harvested in September upon reaching chemical maturity.

2.2. Sample Extracts Preparation

For each potato cultivar, fifteen unimpaired potato tubers were randomly selected. The unpeeled tubers were washed, cut into slices of 2 mm, frozen at −20 °C, and freeze-dried using the freeze-dryer Sublimator (ZIRBUS Technology GmbH, Bad Grund, Germany). Then, potato samples were ground into a powder and stored until further analyses. Potato tubers extracts were prepared using the solvent methanol. The selection of specific extraction parameters, such as solvent concentration, was guided by the methodology reported in the study by Burgos et al. (2013) [13], which employed a comparable extraction approach. The two-factor experiment was performed as follows: factor A—tubers of three potato cultivars (‘Blue Star’, ‘Violet Queen’, and ‘Mulberry Beauty’), and factor B—different concentrations of methanol (60%, 80%, and 100%). A total of 0.1 g of tuber powder of each cultivar was mixed with 5 mL of solvent methanol at different concentrations. The obtained extracts were extracted for 10 min in an ultrasonic laboratory bath (AU-65, Argo lab, Torino, Italy) and incubated at 4 °C for 72 h in a dark place. Then, the potato extracts were filtered using a 0.22 µm and 13 mm nylon syringe filter (BGB Analytik AG, Böckten, Switzerland) and analyzed.

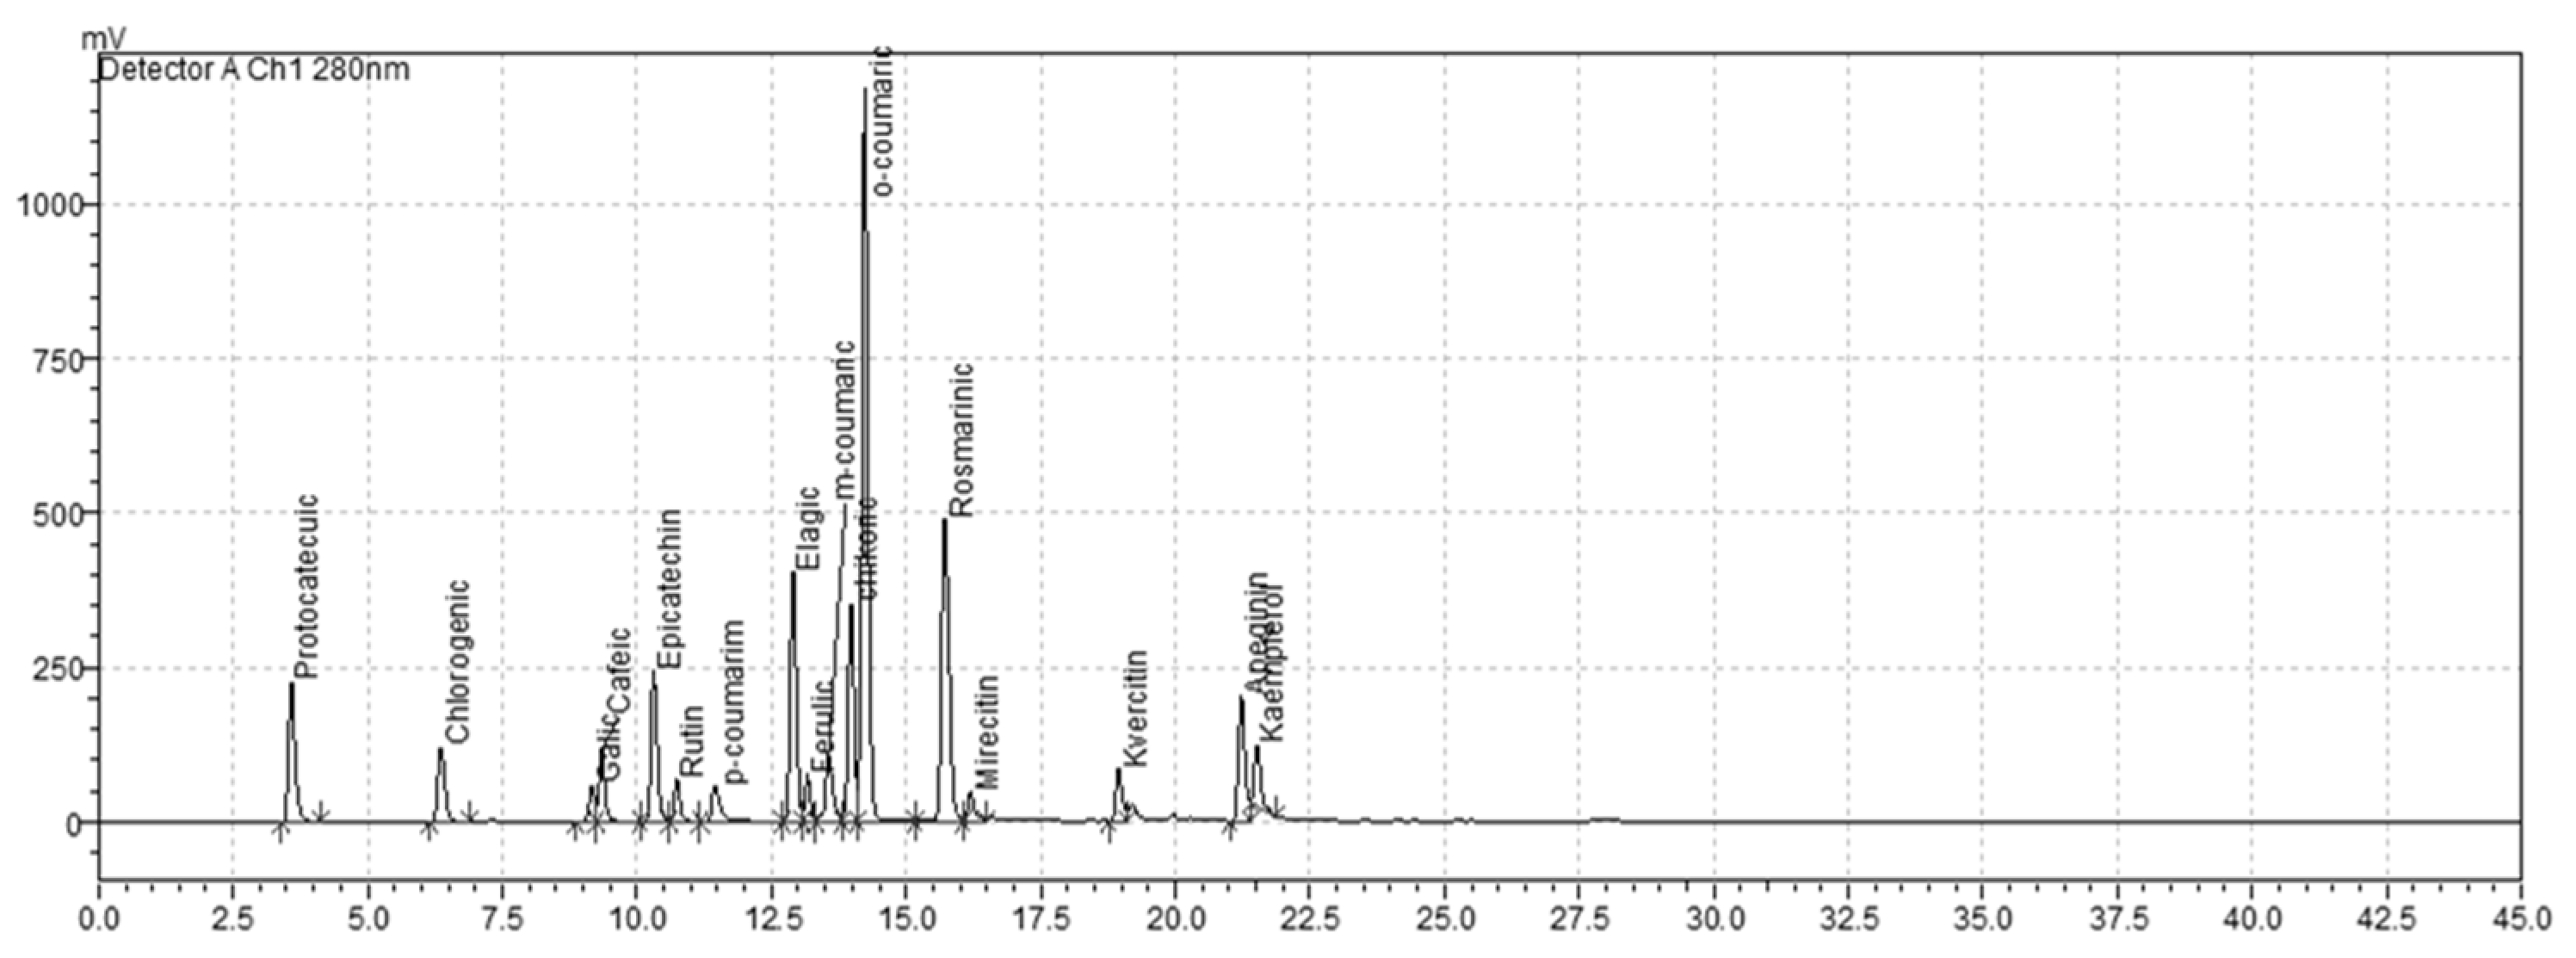
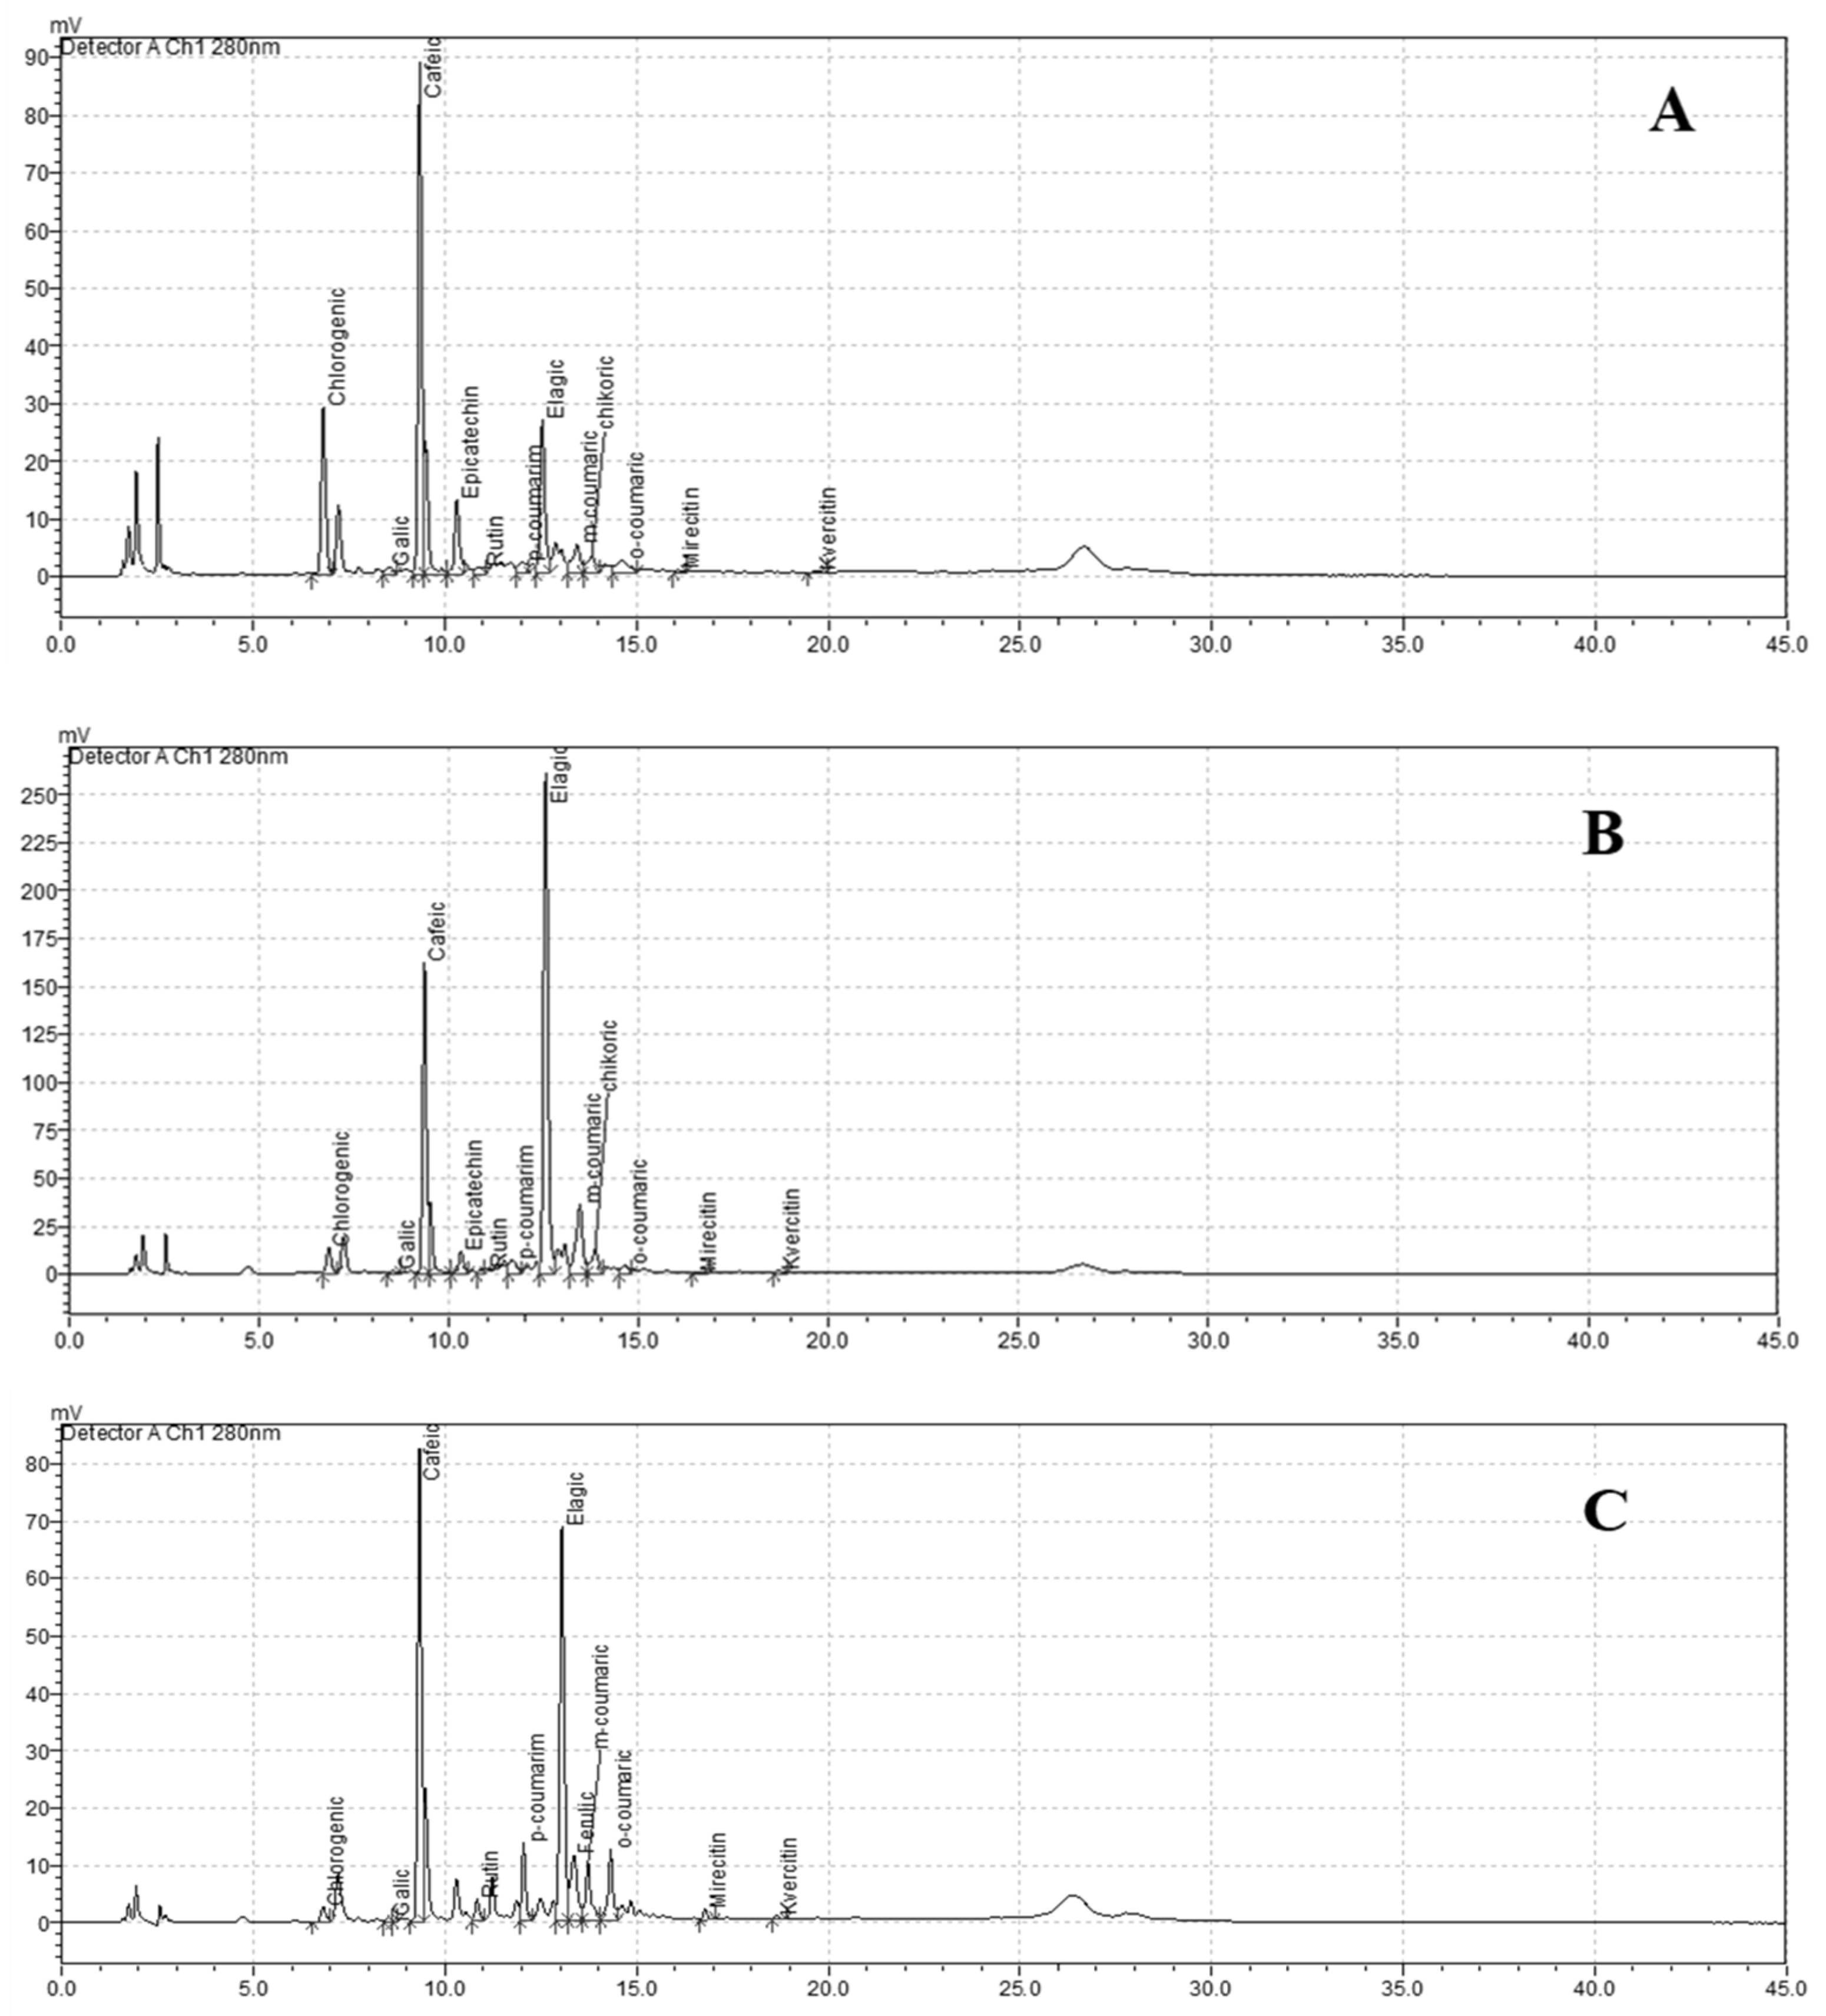
2.3. Polyphenol Identification

The quantitative and qualitative compositions of phenolic compounds were analyzed by high-performance liquid chromatography (HPLC) according to Kazimierczak et al. (2019) [20] With some corrections. For the extraction of phenolic compounds, 100 mg of lyophilized plant material was ground with 60, 80, and 100% methanol (Sigma-Aldrich, St. Louis, MO, USA) and transferred to a 15 mL polypropylene conical centrifuge tube (Labbox Labware S.L., Barcelona, Spain). In total, 1 mL of the potato extracts was transferred into HPLC vials. The analysis was conducted using the Shimadzu Nexera X2 (Kyoto, Japan) UFLC 10A system with a diode array (SPD-M30A) detector. A Triart C18 plus column (3 µm particle size, 100 × 3.0 mm) (YMC Europe GmbH, Dinslaken, Germany) was used to separate the samples. The mobile phase consisted of A (100% acetonitrile, (Sigma-Aldrich, St. Louis, MO, USA) and B (1% acetic acid, Supelco, Bellefonte, PA, USA). The following binary gradient: 0.00–22.99 min phase B 95%, 23.00–27.99 min phase B 50%, 28.00–28.99 min phase B 80%, 29.00–35.99 min phase B 80%, and 36.00–40.00 min phase B 95%) and flow rate of 1 mL min 1 external standards of polyphenols with purities of 95.00–99.99% were used. The contents of rutin (rutin trihydrate, Supelco), myricetin, chicoric acid, ferulic acid (trans-Ferulic acid), rosmarinic acid, quercetin, and protocatechuic acid (all purchased from Merck KGaA, Darmstadt, Germany), caffeic acid, p-coumaric acid (trans-p-Coumaric acid), o-coumaric acid (trans-2-Hydroxycinnamic acid), m-coumaric acid (trans-3-Hydroxycinnamic acid), epicatechin, chlorogenic acid, kaempferol, gallic acid (gallic acid monohydrate) (all purchased from Sigma-Aldric), and apigenin (LGC Standards Ltd., LGC, Teddington, UK) (Figure 1) were determined. The results are expressed from the homogenized plant material as mg 100 g−1 in the dry matter of the sample.
By adding all the different compounds determined using the previously mentioned approach, the total quantity of flavonoids and phenolic acids was calculated. The retention period of compounds might change by up to 0.5 min when determining the presence of polyphenol compounds in a sample. The compound’s concentration and sample preparation determine this.

2.4. Total Anthocyanins Analysis

The total anthocyanin content in the potato extracts was determined using the pH differential method, following the procedure described by Tonutare et al. (2014) [21] with minor modifications, and measured with a spectrophotometer (Labomed Inc., Los Angeles, CA, USA). A total of 1 mL of the filtered extract was combined with 9 mL of pH 1.0 buffer solution; the same steps were repeated by dilution with 9 mL of pH 4.5 buffer solution. The absorbance at 510 nm and 700 nm was measured after 30 min of incubation at room temperature using a spectrophotometer (Labomed Inc., Los Angeles, CA, USA). For the quantification of total anthocyanins, the molecular weights (449 g/mol) and molar extinction coefficients (26,900 M−1 cm−1) were applied. The results are expressed as mg 100 g−1 in the dry matter of the sample.

2.5. Antioxidant Activity Analysis

The antioxidant activity (%) was determined using the DPPH radical scavenging method, following the protocol described by L. Leaves (2014) [22]. In total, 0.1 mL of the prepared potato tuber extract was mixed with 5 mL of DPPH solution and kept in the dark for 30 min. The absorbance of the extract and the blank sample (methanol and DPPH solution) was measured using a spectrophotometer (Labomed Inc., Los Angeles, CA, USA) at a wavelength of 517 nm.

2.6. Statistical Analysis

All analyses were performed in triplicate and data was expressed as the mean ± standard deviation. The research data were statistically analyzed using a two-way analysis of variance (ANOVA) method. To assess the statistical significance of differences between the means, Fisher’s LSD (least significant difference) test (p < 0.05) was applied. Data analysis was conducted using the STATISTIKA software program (Statistica 10; StatSoft, Inc., Tulsa, OK, USA).

3. Results and Discussion

3.1. Total Phenolics, Total Phenolic Acids, Total Flavonols, and Total Anthocyanins

The amounts of total phenolic compounds (TPCs), total phenolic acids (TPAs), total flavonols (TFs), and total anthocyanins (TAs) are presented in Table 1. A two-way ANOVA revealed that only the differences between potato cultivars and the concentration of methanol had a significant impact on the contents of TPC and TPA in the potato extracts. The impact of methanol concentration varied across cultivars, but overall, the content of these compounds in the potato extracts were higher when extracted with 60% or 80% methanol. The significantly highest contents of TPC and TPA were found in ‘Violet Queen’ tuber extracts with 60% (551.14 mg 100 g−1 DM and 353.85 mg 100 g−1 DM, respectively) and 80% (575.61 mg 100 g−1 DM and 382.24 mg 100 g−1 DM, respectively) methanol. As the concentration of the methanol solvent increases, the contents of these compounds decrease. According to literature, the contents of total phenolic compounds and phenolic acids in colored-flesh potato tubers can range from 180 to 1100 mg 100 g−1 DM [23] and from 197.9 to 456.1 mg 100 g−1 DM [24], respectively, depending on cultivar, growing and climatic conditions, storage, as well as the extraction and analytical methods [6]. Based on previous studies, potato tubers with dark purple flesh accumulate a higher content of phenolic compounds compared to those with bright purple or red flesh [25,26]. The results of other studies mentioned are consistent with the results of our study. Burgos et al. (2013) [13] examined the impact of cultivar and methanol concentrations on the contents of total phenolics and total phenolic acids in both raw and cooked purple-fleshed potatoes (Solanum andigenum) from four native Andean cultivars (Bolona, Challina, Leona and Guincho). They also established that the impact of methanol concentration varied among the cultivars. However, higher contents of total phenolics were found in raw samples extracted with 80% or 90% methanol, while cooked samples had higher content of total phenolic acid when extracted with 60% methanol. Bouterfas et al. (2014) [27] found that the maximum content of total phenolics (293.34 mg GAE g−1 DW) in white horehound (Marrubium vulgare L.) leaves was obtained using 60% aqueous methanol, compared to 20%, 40%, and 80% methanol concentrations. A study by Xiang et al. (2024) [28] results indicate that 70% methanol exhibits the highest extraction efficiency for polyphenols from Camellia polyodonta flowers.
According to the ANOVA, the TF content in the potato extracts was influenced by both the potato cultivar and methanol concentration, as well as the interaction between these two factors (Table 1). This compound content was highest when the ‘Violet Queen’ samples were extracted using 60 and 80% methanol, ‘Mulberry Beauty’ samples—60 and 100% methanol, and ‘Blue Star’ samples—60% methanol. The statistical analysis revealed that the content of TA in potato extracts was significantly affected only by cultivar properties (Table 1). The ‘Violet Queen’ extracts have the highest content of these compounds and varied from 85.30 to 86.25 mg 100 g−1 DM. As noted by earlier authors, purple- and red-fleshed potato cultivars contain high contents of total anthocyanins, ranging from 13.13 to 168.83 mg per 100 g−1 DM [29]. In agreement with our results, Burgos et al. (2013) [13] also found no significant differences in the total anthocyanin content when different methanol solvent concentrations were used. According to these authors, any of the tested extracting solutions (methanol concentrations between 60% and 100%) could be used to extract total anthocyanins from Solanum andigenum samples.

3.2. Individual Phenolic Acids

According to the literature, the most common phenolic compounds in potatoes are phenolic acids [17]. The study examined the individual phenolic acid contents in potato tuber extracts (Table 2). Chromatographic profiles of polyphenolic compounds extracted from potato samples using different methanol concentrations are shown in Figure 2.
The phenolic acids studied were caffeic, gallic, ellagic, m-coumaric, p-coumaric, o-coumaric, and chlorogenic. Cebulak et al. (2023) [30] identified four phenolic acids such as chlorogenic acid, p-coumaric acid, gallic acid, and caffeic acid in potato with various tuber flesh.
The statistical analysis revealed that the content of caffeic acid in all the studied potato extracts was the significantly highest when extracted with 60% or 80% methanol. ‘Violet Queen’ tuber extracts with 60% and 80% methanol (122.56 mg 100 g−1 DM and 128.85 mg 100 g−1 DM, respectively) showed the significantly highest content of this phenolic acid. It was observed that the content of gallic acid was not significantly affected by cultivar and concentration of methanol. A two-way ANOVA revealed significant variations in contents of m-coumaric, p-coumaric, o-coumaric, and chlorogenic, depending on the concentration of methanol, cultivar, and their interaction. It was found that 60% methanol has a greater effectiveness for the extraction of m-coumaric acid when compared to 80% and pure methanol. The highest content of m-coumaric acid was in ‘Violet Queen’ tuber extracts, while the lowest content—in ‘Blue Star’ tuber extracts. The highest content of p-coumaric acid was contained in ‘Mulberry Beauty’ tuber extracts with 60% and 80% methanol (35.68 mg 100 g−1 DM and 36.06 mg 100 g−1 DM, respectively), while the lowest content of this acid was found in all tested ‘Blue Star’ tuber extracts. However, ‘Blue star’ tuber extracts with 60% methanol (40.45 mg 100 g−1 DM) showed the highest content of chlorogenic acid. The content of this acid in the potato extracts decreased as the methanol concentration increased from 60% to 100%. ‘Mulberry Beauty’ tuber extracts with 100% methanol (25.50 mg 100 g−1 DM) showed the lowest content of chlorogenic acid.
Our results demonstrated that the extraction efficiency of phenolic acids varies with methanol concentration and cultivar. Studies by other researchers also indicate that the optimal methanol concentration varies depending on the individual phenolic acid and the plant species. For instance, a study of Eugenia pyriformis found that phenolic acids like gallic and caffeic acids were effectively extracted using absolute methanol (100%), while chlorogenic acid was effectively extracted using 50% methanol [31]. Armonavičius et al. (2024) [32] extracted bioactive compounds from dried leaves of Chamaenerion angustifolium (L.) Holub using water and different concentrations of methanol (25%, 50%, and 75%). This study has shown that 75% aqueous methanol extraction yielded the highest content of chlorogenic acid (51.65 mg g−1) in leaf samples. These findings emphasize the significance of selecting the appropriate solvent concentration to optimize the extraction of individual phenolic acids.

3.3. Individual Flavonoids

Flavonoids are a major group of plant phenolic compounds that influence the flavor and color of fruits, berries, and vegetables [33]. In potatoes, catechin is one of the most abundant flavonoids along with flavonols such as quercetin, myricetin and rutin [17,34]. According to the literature, colored potato tubers are rich in flavonoids, which serve multiple functions and contribute antioxidant benefits to the human diet [35].
Chromatographic profiles of polyphenolic compounds extracted from potato samples using different methanol concentrations are shown in Figure 2. The results of the conducted study showed that the tuber extracts of the studied cultivars were found to contain flavonoids such as myricetin, epicatechin, quercetin, and rutin (Table 3). The greatest contents of myricetin and rutin of the tested potato extracts were obtained with 60% methanol. ‘Mulberry Beauty’ tuber extracts showed the highest content of rutin (27.83–29.25 mg 100 g−1 DM), while ‘Violet Queen’ contained the highest content of myricetin (24.63–31.12 mg 100 g−1 DM). The contents of epicatechin and quercetin in potato tuber extracts ranged from 24.69 to 28.09 mg 100 g−1 DM and from 24.90 to 28.15 mg 100 g−1 DM, respectively. The significantly highest content of these compounds was found in the extracts of the cv. ‘Violet Queen’ when 80% methanol solution was used for extraction. In contrast, the significantly lowest epicatechin content was detected in the extracts of the variety ‘Mulberry Beauty’ using an 80% methanol solution (24.69 mg 100 g−1 DM), while the significantly lowest quercetin content was found in the variety ‘Blue Star’ extracts prepared with both an 80% aqueous methanol solution and pure (100%) methanol (25.199 mg 100 g−1 and 24.9 mg 100 g−1, respectively).
This study showed that the contents of individual flavonoids varied significantly depending on the concentration of methanol solvents, as well as the color and cultivar of the potato. Haminiuk et al. (2014) [31] found that absolute methanol was the most effective extraction agent of flavonols such as myricetin and kaempferol from Eugenia pyriformis. According to Ghasemzadeh et al. (2014) [36], an ultrasonic power of 145.49 W at 55.9 °C with 80% methanol provided the optimal conditions for extracting catechin, myricetin, and quercetin from curry leaf (Murraya koenigii L.). Xiang et al. (2024) [28] identified 70% methanol as the most effective solvent for extracting flavonoids such as quercitrin, epicatechin, kaempferol-3-O-rutinoside, astragaline, and rutin from Camellia polyodonta flowers.

3.4. Antioxidant Activity

Potatoes with colored flesh are rich in antioxidants such as polyphenols, flavonoids, anthocyanins, carotenoids, and ascorbic acid, which may contribute to health promotion. These compounds exhibit strong antioxidant activity that can help combat oxidative stress in the body. For this reason, colored potatoes are considered a valuable natural source of antioxidants in the daily diet [3,5].
The results showed that the DPPH activity of potato extracts was significantly affected by both the cultivar and the methanol concentration used (Figure 3). DPPH activity values were highest when the potato samples were extracted using 60% methanol. The significantly highest value of this parameter was observed in the extract of the cv. ‘Violet Queen’ using 60% methanol concentration (62.65%). The lowest DPPH activity was recorded in all extracts of the cv. ‘Mulberry Beauty’, with values ranging from 25.21% to 33.43%, as well as in the cv. ‘Violet Queen’ extract prepared with 80% methanol, which showed 24.68% activity.
Burgos et al. (2013) [13] extracted raw and cooked potato (Solanum andigenum) samples using various concentrations of methanol (60%, 70%, 80%, 90%, and 100%) and found that AA, as determined by the DPPH method, was highest in raw samples extracted with 80% methanol, while in cooked samples, the highest AA was observed with 60% methanol.
The results of our study demonstrated that 60% aqueous methanol solution was the most efficient solvent for achieving the highest antioxidant activity in potato tuber extracts. According to the literature, the highest content of TPC was observed in the 50% ethanol and 70% methanol Camellia polyodonta flower extracts, suggesting that solvents with middle polarity (50–70%) are most effective for phenolic extraction. This efficiency is attributed to the optimal polarity of methanol–water mixtures, which facilitates the dissolution of both polar and moderately polar phenolic compounds [28]. The extraction efficiency is attributed to the appropriate polarity of the methanol–water mixture, which enables the dissolution of various bioactive compounds and facilitates their diffusion from the plant matrix, resulting in a higher concentration of active substances compared to pure methanol or water [17,37].

4. Conclusions

The content of total phenolic compounds, flavonols, anthocyanins, phenolic acids, and antioxidant activity in potato tuber methanolic extracts varied depending on the cultivars and methanol concentration. ‘Violet Queen’ tubers showed significantly higher contents of total phenolic compound and phenolic acids, using 60% and 80% methanol. The highest contents of epicatechin, quercetin, and myricetin were also observed in ‘Violet Queen’ extracts, with 80% methanol for epicatechin and quercetin, and 60% methanol for myricetin. In terms of phenolic acids, ‘Violet Queen’ extracts with 60% and 80% methanol had the highest chlorogenic acid content. The highest contents of p-coumaric acid were observed in ‘Mulberry Beauty’ extracts using 60% and 80% methanol. The highest antioxidant activity was recorded in ‘Violet Queen’ tuber extracts prepared with 60% methanol.
In conclusion, the results of this study indicate that the cv. ‘Violet Queen’ dark purple flesh tubers extracts are a rich source of phenolic compounds, highlighting their potential value for nutritional and functional applications. The 60% and 80% aqueous methanol solutions were the most effective for extracting the highest contents of phenolic compounds from potato tubers with red and purple flesh. This research is significant from both scientific and practical perspectives, as it may contribute to more efficient extraction of phenolic compounds from extracts of potato tubers with red or purple flesh. The obtained data can be applied in the analysis of chemical composition and bioactive compounds, as well as in the fields of pharmacy and agronomy—for example, in assessing the antioxidant potential of plant varieties, identifying biologically active compounds, or developing natural plant protection agents for agricultural use.

Author Contributions

Conceptualization, N.V. and J.V.; methodology, N.V.; software, J.V. and J.S.; formal analysis, J.S.; investigation, J.V.; writing—original draft preparation, N.V., J.K., D.L. and J.V.; writing—review and editing, J.K., D.L. and J.S.; visualization, N.V. and J.V. All authors have read and agreed to the published version of the manuscript.

Funding

This research received no external funding.

Institutional Review Board Statement

Not applicable.

Informed Consent Statement

Not applicable.

Data Availability Statement

The original contributions of this study are included in the article. For additional inquiries, please contact the corresponding author.

Conflicts of Interest

The authors declare no conflicts of interest.

References

  1. Wang, K.; Zhang, N.; Fu, X.; Zhang, H.; Liu, S.; Pu, X.; Wang, X.; Si, H. StTCP15 regulates potato tuber sprouting by modulating the dynamic balance between abscisic acid and gibberellic acid. Front. Plant Sci. 2022, 13, 1009552. [Google Scholar] [CrossRef] [PubMed]
  2. Silveira, A.C.; Orena, S.; Medel-Maraboli, M.; Escalona, V.H. Determination of some functional and sensory attributes and suitability of colored-and noncolored-flesh potatoes for different cooking methods. Food Sci. Technol. 2020, 40, 395–404. [Google Scholar] [CrossRef]
  3. Vaitkevičienė, N.; Jarienė, E.; Kulaitienė, J.; Levickienė, D. The physico-chemical and sensory characteristics of coloured-flesh potato chips: Influence of cultivar, slice thickness and frying temperature. Appl. Sci. 2022, 12, 1211. [Google Scholar] [CrossRef]
  4. Vaitkevičienė, N.; Kulaitienė, J.; Jarienė, E.; Levickienė, D.; Danilčenko, H.; Srednicka-Tober, D.; Rembiałkowska, E.; Hallmann, E. Characterization of bioactive compounds in Colored potato (Solanum tuberosum L.) cultivars grown with conventional, organic, and biodynamic methods. Sustainability 2020, 12, 2701. [Google Scholar] [CrossRef]
  5. Vaitkevičienė, N. A comparative study on proximate and mineral composition of coloured potato peel and flesh. J. Sci. Food Agric. 2019, 99, 6227–6233. [Google Scholar] [CrossRef]
  6. Nayak, B.; Berrios, J.J.; Powers, J.R.; Tang, J.; JI, Y. Colored potatoes (Solanum tuberosum L.) dried for antioxidant-rich value-added foods. J. Food Process. Preserv. 2011, 35, 571–580. [Google Scholar] [CrossRef]
  7. Ben Alaya, I.; Alves, G.; Lopes, J.; Silva, L.R. Use of encapsulated polyphenolic compounds in health promotion and disease prevention: Challenges and opportunities. Macromol 2024, 4, 805–842. [Google Scholar] [CrossRef]
  8. Mattila, P.; Hellström, J. Phenolic acids in potatoes, vegetables, and some of their products. J. Food Compos. Anal. 2007, 20, 152–160. [Google Scholar] [CrossRef]
  9. Sun, W.; Shahrajabian, M.H. Therapeutic potential of phenolic compounds in medicinal plants—Natural health products for human health. Molecules 2023, 28, 1845. [Google Scholar] [CrossRef]
  10. Chun, O.K.; Kim, D.O.; Smith, N.; Schroeder, D.; Han, J.T.; Lee, C.Y. Daily consumption of phenolics and total antioxidant capacity from fruit and vegetables in the American diet. J. Sci. Food Agric. 2005, 85, 1715–1724. [Google Scholar] [CrossRef]
  11. Makori, S.I.; Mu, T.-H.; Sun, H.-N. Profiling of polyphenols, flavonoids and anthocyanins in potato peel and flesh from four potato varieties. Potato Res. 2022, 65, 193–208. [Google Scholar] [CrossRef]
  12. Ru, W.; Pang, Y.; Gan, Y.; Liu, Q.; Bao, J. Phenolic Compounds and Antioxidant Activities of Potato Cultivars with White, Yellow, Red and Purple Flesh. Antioxidants 2019, 8, 419. [Google Scholar] [CrossRef] [PubMed]
  13. Burgos, G.; Amoros, W.; Muñoa, L.; Sosa, P.; Cayhualla, E.; Sanchez, C.; Díaz, C.; Bonierbale, M. Total phenolic, total anthocyanin and phenolic acid concentrations and antioxidant activity of purple-fleshed potatoes as affected by boiling. J. Food Compos. Anal. 2013, 30, 6–12. [Google Scholar] [CrossRef]
  14. Pellegrini, N.; Colombi, B.; Salvatore, S.; Brenna, O.V.; Galaverna, G.; Del Rio, D. Evaluation of antioxidant capacity of some fruit and vegetable foods: Efficiency of extraction of a sequence of solvents. J. Sci. Food Agric. 2007, 87, 103–111. [Google Scholar] [CrossRef]
  15. Michiels, J.A.; Kevers, C.; Pincemail, J.; Defraigne, J.O.; Dommes, J. Extractionconditions can greatly influence antioxidant capacity assays in plant foodmatrices. Food Chem. 2012, 130, 986–999. [Google Scholar] [CrossRef]
  16. Li, A.; Xiao, R.; He, S.; An, X.; He, Y.; Wang, C.; He, J. Research advances of purple sweet potato anthocyanins: Extraction, identification, stability, bioactivity, application, and biotransformation. Molecules 2019, 24, 3816. [Google Scholar] [CrossRef]
  17. Akyol, H.; Riciputi, Y.; Capanoglu, E.; Caboni, M.F.; Verardo, V. Phenolic compounds in the potato and its byproducts: An overview. Int. J. Mol. Sci. 2016, 17, 835. [Google Scholar] [CrossRef]
  18. Mahasuari, N.P.S.; Paramita, N.L.P.V.; Putra, A.A.G.R.Y. Effect of methanol concentration as a solvent on total phenolic and flavonoid content of beluntas leaf extract (Pulchea indica L.). J. Pharm. Sci. Appl. 2020, 2, 77. [Google Scholar] [CrossRef]
  19. Morales-Olán, G.; Rojas-López, M.; Díaz-Reyes, J.; Rosas-Cárdenas, F.F.; Luna-Suárez, S. Effect of ethanol and methanol on the total phenolic content and antioxidant capacity of chia seeds (Salvia hispanica L.). Sains Malays. 2020, 49, 1283–1292. [Google Scholar]
  20. Kazimierczak, R.; Średnicka-Tober, D.; Hallmann, E.; Kopczyńska, K.; Zarzyńska, K. the impact of organic vs. conventional agricultural practices on selected quality features of eight potato cultivars. Agronomy 2019, 9, 799. [Google Scholar] [CrossRef]
  21. Tonutare, T.; Moor, U.; Szajdak, L. Strawberry anthocyanin determination by pH differential spectroscopic method. How to get true results? Acta Sci. Pol. Hortorum Cultus 2014, 13, 35–47. [Google Scholar]
  22. Leaves, L.; Leaves, L. Antioxidant activity by DPPH radical scavenging method of Ageratum conyzoides. Am. J. Ethnomed. 2014, 1, 244–249. [Google Scholar]
  23. Navarre, D.A.S.; Pillai, S.; Shakya, R.; Holden, M.J. HPLC profiling of phenolics in diverse potato genotypes. Food Chem. 2011, 127, 34–41. [Google Scholar] [CrossRef]
  24. Jarienė, E.; Vaitkevičienė, N.; Danilčenko, H.; Tajner-Czopek, A.; Rytel, E.; Kucharska, A.; Jeznach, M. Effect of biodynamic preparations on the phenolic antioxidants in potatoes with coloured-flesh. Biol. Agric. Hortic. 2017, 33, 172–182. [Google Scholar] [CrossRef]
  25. Jansen, G.; Flamme, W. Coloured (Solanum tuberosim L.)—Anthocyanin content and tuber quality. Genet. Resour. Crop. Evol. 2006, 53, 1321–1331. [Google Scholar] [CrossRef]
  26. Reddivari, L.; Hale, A.; Miller, J. Genotype, location, and year influence antioxidant activity, carotenoid content, phenolic content, and composition in specialty potatoes. J. Agric. Food Chem. 2007, 55, 8073–8079. [Google Scholar] [CrossRef]
  27. Bouterfas, K.; Mehdadi, Z.; Benmansour, D.; Khaled, M.B.; Bouterfas, M.; Latreche, A. Optimization of extraction conditions of somephenolic compounds from white horehound (Marrubium vulgare L.) leaves. Int. J. Org. Chem. 2014, 4, 292–308. [Google Scholar] [CrossRef]
  28. Xiang, Z.; Liu, L.; Xu, Z.; Kong, Q.; Feng, S.; Chen, T.; Ding, C. Solvent effects on the phenolic compounds and antioxidant activity associated with Camellia polyodonta flower extracts. ACS Omega 2024, 9, 27192–27203. [Google Scholar] [CrossRef]
  29. D’Amelia, V.; Sarais, G.; Fais, G.; Dessì, D.; Giannini, V.; Garramone, R.; Melito, S. Biochemical characterization and effects of cooking methods on main phytochemicals of red and purple potato tubers, a natural functional food. Foods 2022, 11, 384. [Google Scholar] [CrossRef]
  30. Cebulak, T.; Krochmal-Marczak, B.; Stryjecka, M.; Krzysztofik, B.; Sawicka, B.; Danilcenko, H.; Jarienè, E. Phenolic Acid Content and Antioxidant Properties of Edible Potato (Solanum tuberosum L.) with Various Tuber Flesh Colours. Foods 2023, 12, 100. [Google Scholar] [CrossRef]
  31. Haminiuk, C.W.I.; Plata-Oviedo, M.S.V.; de Mattos, G.; Carpes, S.T.; Branco, I.G. Extraction and quantification of phenolic acids and flavonols from Eugenia pyriformis using different solvents. J. Food Sci. Technol. 2014, 51, 2862–2866. [Google Scholar] [CrossRef] [PubMed]
  32. Armonavičius, D.; Stankevičius, M.; Maruška, A. extraction of bioactive compounds and influence of storage conditions of raw material Chamaenerion angustifolium (L.) Holub using different strategies. Molecules 2024, 29, 5530. [Google Scholar] [CrossRef] [PubMed]
  33. Andre, C.; Ghislain, M.; Bertin, P.; Oufir, M.; del Rosario Herrera, M.; Hoffmann, L.; Hausman, J.; Larondelle, Y.; Evers, D. Andean potato cultivars (Solanum tuberosum L.) as a source of antioxidant and mineral micronutrients. J. Agric. Food Chem. 2007, 55, 366–378. [Google Scholar] [CrossRef] [PubMed]
  34. Deußer, H.; Guignard, C.; Hoffmann, L.; Evers, D. Polyphenol and glycoalkaloid contents in potato cultivars grown in Luxembourg. Food Chem. 2012, 135, 2814–2824. [Google Scholar] [CrossRef]
  35. Liu, Y.; Li, Y.; Liu, Z.; Wang, L.; Bi, Z.; Sun, C.; Zeng, Y. Integrated transcriptomic and metabolomic analysis revealed altitude-related regulatory mechanisms on flavonoid accumulation in potato tubers. Int. Food Res. 2023, 170, 112997. [Google Scholar] [CrossRef]
  36. Ghasemzadeh, A.; Jaafar, H.Z.; Karimi, E.; Rahmat, A. Optimization of ultrasound-assisted extraction of flavonoid compounds and their pharmaceutical activity from curry leaf (Murraya koenigii L.) using response surface methodology. BMC Complement. Altern. Med. 2014, 14, 318. [Google Scholar] [CrossRef]
  37. Jakopič, J.; Veberič, R.; Štampar, F. Extraction of phenolic compounds from green walnut fruits in different solvents. Acta Agric. Slov. 2009, 93, 11–15. [Google Scholar] [CrossRef]
Figure 1. Chromatographic profile of phenolic compound standards at 280 nm, indicating retention times used for identification and quantification.
Agriculture 15 01332 g001
Figure 2. Chromatographic profiles of polyphenolic compounds extracted from potato samples using different methanol concentrations: (A)—60%, (B)—80%, and (C)—100%. The differences in compound abundance and retention times reflect the influence of solvent strength on polyphenol extraction efficiency.
Agriculture 15 01332 g002
Figure 3. Effects of cultivar and concentrations of methanol on the potato extracts DPPH activity. Significant differences (p < 0.05) between means are indicated by different letters of the alphabet (a, b, c, and d); MK100—100% methanol concentration, MK80—80% methanol concentration, and MK60—60% methanol concentration.
Agriculture 15 01332 g003
Table 1. Effects of cultivar and concentrations of methanol on contents of TP, TPC, TF, and TA in the potato extracts.
CultivarConcentration of MethanolTPCsTPAsTFsTAs
mg 100 g−1 DM
‘Blue Star’ 60%399.35 ± 16.59 c268.21 ± 18.84 de104.43 ± 1.13 c26.71 ± 3.05 b
‘Violet Queen’551.14 ± 27.83 a353.85 ± 14.01 a111.03 ± 1.03 a86.25 ± 9.02 a
‘Mulberry Beauty’413.81 ± 26.12 c288.98 ± 17.31 cd108.92 ± 0.32 a15.91 ± 2.99 b
‘Blue Star’80%371.84 ± 19.13 cd246.41 ± 14.01 e98.28 ± 1.87 d27.15 ± 2.80 b
‘Violet Queen’575.61 ± 28.98 a382.24 ± 10.85 a108.06 ± 1.86 ab85.30 ± 8.92 a
‘Mulberry Beauty’404.29 ± 17.28 c283.01 ± 17.23 de105.30 ± 2.26 bc15.97 ± 2.99 b
‘Blue Star’100%331.31 ± 12.91 d206.24 ± 10.08 f98.03 ± 0.26 d27.03 ± 2.80 b
‘Violet Queen’511.91 ± 24.62 b321.78 ± 19.17 bc104.34 ± 1.49 c85.79 ± 8.86 a
‘Mulberry Beauty’375.08 ± 19.12 cd249.85 ± 11.25 e109.19 ± 3.27 a16.05 ± 2.31 b
p-value
Cultivar <0.00001<0.00001<0.00001<0.00001
Concentration of methanol0.00630.00050.00005n.s.
Interactions of cultivar × concentration of methanoln.s.n.s.0.00501n.s.
Note. Significant differences (p < 0.05) between means in a column are indicated by different letters of the alphabet (a, b, c, d, e and f); n.s.—no significant differences; TPCs—total phenolic compounds, TPAs—total phenolic acids, TFs—total flavonols, and TAs—total anthocyanins.
Table 2. Effects of cultivar and concentrations of methanol on contents of individual phenolic acids in the potato extracts.
CultivarConcentration of MethanolCaffeic
Acid
Gallic AcidEllagic Acidm-Coumaric Acidp-Coumaric Acido-Coumaric AcidChlorogenic Acid
mg 100 g−1 DM
‘Blue Star’60%97.83 ± 9.48 b26.37 ± 1.99 ab28.60 ± 0.45 e30.54 ± 0.27 g23.54 ± 1.14 e20.89 ± 0.21 c40.45 ± 0.39 a
‘Violet Queen’122.56 ± 13.94 a27.84 ± 1.28 ab56.09 ± 0.13 c63.13 ± 0.05 a30.80 ± 0.10 c22.21 ± 0.09 a31.21 ± 1.01 d
‘Mulberry Beauty’102.16 ± 10.88 b26.88 ± 1.52 ab39.19 ± 0.59 d36.04 ± 0.33 d35.68 ± 1.39 a21.89 ± 0.35 b27.15 ± 0.45 f
‘Blue Star’80%84.60 ± 8.65 b24.52 ± 1.27 b29.89 ± 0.50 e27.88 ± 0.29 h22.34 ± 0.59 e19.60 ± 0.14 d37.57 ± 0.13 b
‘Violet Queen’128.85 ± 10.74 a27.94 ± 1.37 ab80.00 ± 0.66 a58.76 ± 0.29 b32.45 ± 0.33 b21.36 ± 0.24 b32.88 ± 0.23 d
‘Mulberry Beauty’100.17 ± 9.05 b25.07 ± 0.84 b39.86 ± 1.53 d34.64 ± 0.35 e36.06 ± 0.48 a21.25 ± 0.27 b25.97 ± 0.18 g
‘Blue Star’100%56.29 ± 5.20 c23.96 ± 1.25 b29.20 ± 0.49 e27.24 ± 0.10 h21.17 ± 0.55 e19.74 ± 0.14 d28.63 ± 0.19 e
‘Violet Queen’74.81 ± 10.63 c35.81 ± 7.50 a77.20 ± 0.82 b56.68 ± 0.40 c28.29 ± 0.22 d20.65 ± 0.15 c28.35 ± 0.25 e
‘Mulberry Beauty’73.30 ± 9.38 c25.52 ± 0.73 b37.69 ± 0.39 d33.48 ± 0.60 f32.58 ± 0.68 b21.77 ± 0.23 b25.50 ± 0.55 h
p-value
Cultivar 0.0174n.s.<0.0001<0.0001<0.0001<0.0001<0.0001
Concentration of methanol0.0006n.s.<0.0001<0.0001<0.0001<0.0001<0.0001
Interactions of cultivar × concentration of methanoln.sn.s.<0.0001<0.0001<0.0001<0.0001<0.0001
Note. Significant differences (p < 0.05) between means in a column are indicated by different letters of the alphabet (a, b, c, d, e, f, g and h); n.s.—no significant differences.
Table 3. Effects of cultivar and concentrations of methanol on contents of individual flavonoids in the potato extracts.
CultivarConcentration of MethanolMyricetinQuercetinEpicatechinRutin
mg 100 g−1 DM
‘Blue Star’60%25.39 ± 0.68 de26.19 ± 0.29 d27.74 ± 0.31 b25.12 ± 0.36 d
‘Violet Queen’31.12 ± 0.62 a26.38 ± 0.31 d26.72 ± 0.38 c26.81 ± 0.19 c
‘Mulberry Beauty’27.30 ± 0.16 bc26.79 ± 0.38 cd25.58 ± 0.21 d29.25 ± 0.24 a
‘Blue Star’80%23.19 ± 0.90 f25.20 ± 0.56 e27.06 ± 0.29 b22.82 ± 0.27 e
‘Violet Queen’26.12 ± 0.93 cd28.15 ± 0.50 a28.09 ± 0.27 a25.70 ± 0.34 d
‘Mulberry Beauty’26.55 ± 0.96 cd26.23 ± 0.69 d24.70 ± 0.15 e27.83 ± 0.46 b
‘Blue Star’100%23.02 ± 0.19 f24.90 ± 0.39 e27.35 ± 0.24 b22.76 ± 0.25 e
‘Violet Queen’24.63 ± 0.22 e27.17 ± 0.37 bc27.70 ± 0.32 b24.84 ± 0.87 d
‘Mulberry Beauty’27.57 ± 1.09 b27.63 ± 0.83 ab26.06 ± 0.34 c27.93 ± 1.02 b
p-value
Cultivar <0.0001<0.0001<0.0001<0.0001
Concentration of methanol<0.0001n.s.0.0003<0.0001
Interactions of cultivar × concentration of methanol<0.00010.0001<0.0001n.s.
Note. Significant differences (p < 0.05) between means in a column are indicated by different letters of the alphabet (a, b, c, d, e, and f); n.s.—no significant differences.
Disclaimer/Publisher’s Note: The statements, opinions and data contained in all publications are solely those of the individual author(s) and contributor(s) and not of MDPI and/or the editor(s). MDPI and/or the editor(s) disclaim responsibility for any injury to people or property resulting from any ideas, methods, instructions or products referred to in the content.

