Article

Assessing Climate Risk in Viticulture: A Localized Index for the Semi-Arid and Mediterranean Regions of Chile

1
Faculty of Agricultural Sciences, University of Chile, Santa Rosa 11315, La Pintana, Santiago 8820808, Chile
2
Master Program in Territorial Management of Natural Resources, University of Chile, Santa Rosa 11315, La Pintana, Santiago 8820808, Chile
3
Fundación Bionostra Chile Research, Almirante Lynch 1179, San Miguel, Santiago 8920033, Chile
*
Author to whom correspondence should be addressed.
Agriculture 2025, 15(12), 1322; https://doi.org/10.3390/agriculture15121322
Submission received: 25 April 2025 / Revised: 3 June 2025 / Accepted: 17 June 2025 / Published: 19 June 2025
(This article belongs to the Section Ecosystem, Environment and Climate Change in Agriculture)

Abstract

Viticulture contributes significantly to Chile’s exports and GDP. However, the development and productivity of grapevines is threatened by climate change. Grapevines are grown in diverse regions; thus, adaptable tools for evaluating climate risk at the local level are required. In this study, a local climate risk index (LCRI) was developed to assess the vulnerability of Chilean viticulture (wine, table, and pisco grapes) in the current (2017–2024) and future (2046–2065) periods. Various components, including exposure, sensitivity, and adaptive and response capacities, were analyzed using different indicators based on municipal-level information. The results for the current period indicated that most municipalities were at medium risk, whereas future projections showed a marked increase in climate risk, principally due to changes in climate suitability. In the current period, the highest LCRI values were observed in semi-arid and mediterranean zones, particularly in the northern regions of Atacama and Coquimbo; in the future period, this situation intensified. In contrast, the lowest values in the current period occurred in the Maule region and further south, where the climate transitions from mediterranean to temperate conditions, and in the future period, valley and mountainous areas presented improvements in the index. Some municipalities showed improvement or stability with local adaptation efforts. The results highlight the urgent need for region-specific adaptation policies that prioritize water management, infrastructure, and increased capacities.

1. Introduction

Grapevines, whether for wine or table consumption, comprise one of the world’s largest crops, covering an estimated 7.2 million hectares in 2023 [1]. In Chile, wine grapes (71.68%), table grapes (23.00%), and pisco grapes (5.32%) cover 173,599 hectares [2], accounting for 13.32% of the country’s agricultural land [3]. Viticulture plays a crucial role in Chile’s agricultural and economic development, contributing 0.50% to the gross domestic product and 16.50% to agricultural exports [4], positioning Chile as the leading wine exporter in the Americas and the fourth largest worldwide [5]. Chile also supplies 4.00% of the global table grape market, ranking as the world’s sixth-largest producer and top exporter [6].
In Chile, viticulture is concentrated in semi-arid, mediterranean, and temperate zones, spanning from the Atacama to Biobío regions [7,8]. Due to anthropogenic climate change, more regions now meet the requirements for grapevine cultivation, and cultivation has been expanding southward [9].
Climatic factors are key to determining the distribution of grapevine varieties at the national level [10]. Different climate and environmental factors, such as rainfall and temperature, directly influence plant characteristics and cannot be controlled by the grape grower [11]. Variations in temperature and water negatively affect the development of grapevines, altering their sprouting, flowering, and ripening [12]. Of the climatic variables, air temperature is the most decisive factor in the growth cycle of the vine because it influences the development of the phenological stages [12]. Research has indicated that in Chile’s mediterranean zone, a 2.00 °C increase could alter the chemical composition of grapes [13], leading to reduced shoot growth, lower yields, and changes in alcohol and pH levels [14]. Climate change also increases irrigation demand and promotes the emergence and spread of new pests, diseases, and weeds [15]. Consequently, climate risk exacerbated by climate change profoundly impacts viticulture activity on a national and potentially global scale, affecting yields, the quality of grapevines and their products [14,16], and viable areas for production [17].
Under the RCP8.5 scenario, anthropogenic climate change is projected to cause a sustained average temperature increase of 1.90–3.00 °C in Chilean vine production areas between 2046 and 2060 and a reduction in winter rainfall of 40–100% [18]. Adapting viticulture to new climatic conditions and climate risk is a priority that will require tools to develop effective and locally targeted public policy [19,20].
Climate risk has the potential for unfavorable impacts on people, natural systems, and economic sectors due to the occurrence of adverse climatic conditions [21]. The magnitude of climate risk depends on the probability and intensity of hazards and the exposure of the affected population or systems, in addition to their intrinsic vulnerability, including their response and adaptation capacity [22].
The management of climate risk is crucial for the sustainable development of the agricultural sector and, in particular, the viticultural sector. Climate risk can be evaluated using indices to indirectly quantify indicators that account for the climatic and socioeconomic conditions of a territory [17,22]. In this context, risk indices—such as climate indices—help summarize territorial information across various components [23]. These components include exposure, which identifies areas potentially affected by climate change; sensitivity, which measures how much the system is influenced—positively or negatively—by climate variability; adaptive capacity, which evaluates the ability of a territory to manage and overcome adverse conditions in the short and medium terms; and response capacity, which refers to a system’s ability to resist and remain viable in the face of change, considering both perceptions and capacity for action. To date, climate risk assessments have been limited to conceptual approaches, with numerical estimates focusing primarily on the individual evaluation of subcomponents, such as vulnerability and resilience [22,24,25]. This fragmentation complicates decision-makers’ interpretation of results because different indices often do not align. Integrating these indicators into a unified methodology would facilitate their understanding and application.
Indices have been developed on a global scale. In Colombia, Bohórquez-Piña assessed the climate risk of densely populated urban and rural cities using indicators for hazard, exposure, sensitivity, and adaptive capacity [26]. In addition, authors from the German watch organization developed an annual climate risk index (CRI), which is used in several countries to assess the impact of extreme events based on hydrological, meteorological, and climatological events [27]. Mexican researchers developed a municipal risk index for agriculture using a socioecological framework based on economic and socioeconomic indicators associated with maize production at the national level [28].
In Chile, the Ministry of Environment developed a climate change risk assessment for different productive activities in 2020 that combined exposure, sensitivity, and threat components, generating a territorial application index [29]. Other studies, such as that of Montalba et al. [30], developed a sociological risk index for peasant and indigenous agricultural communities in La Araucanía that included indicators (variables) distributed between vulnerability, response capacity, and threat components. However, this calculation did not consider the adaptive capacity component. Furthermore, the scale used was smaller and limited to the farm level.
This study developed a local climate risk index (LCRI) for the viticulture sector based on local climate data and statistics to identify risks and guide the implementation of adaptation measures at the territorial level from the Atacama to Biobío regions of Chile.

2. Materials and Methods

2.1. Study Area

This study was conducted at the municipality level, which is the smallest state administration unit in Chile, with local information equivalent to that of a county in Chile. The study area encompassed the municipalities involved in viticulture—including wine, table grapes, and pisco—from the Atacama to Biobío regions (Figure 1). The included area accounts for 99.90% of the national grapevine area [31,32,33].
To the east of the study area, the Andes Mountains dominate, with altitudes ranging from 4500 to 2500 m above sea level, and to the west is the Pacific Ocean [34]. A semi-arid climate prevails between the Atacama and Valparaíso regions, whereas a mediterranean climate prevails between the Metropolitan and Biobío regions. In contrast, a temperate climate is predominant in the Andean region of Biobío [7] (Figure 1).

2.2. Components of the LCRI for the Viticulture Sector

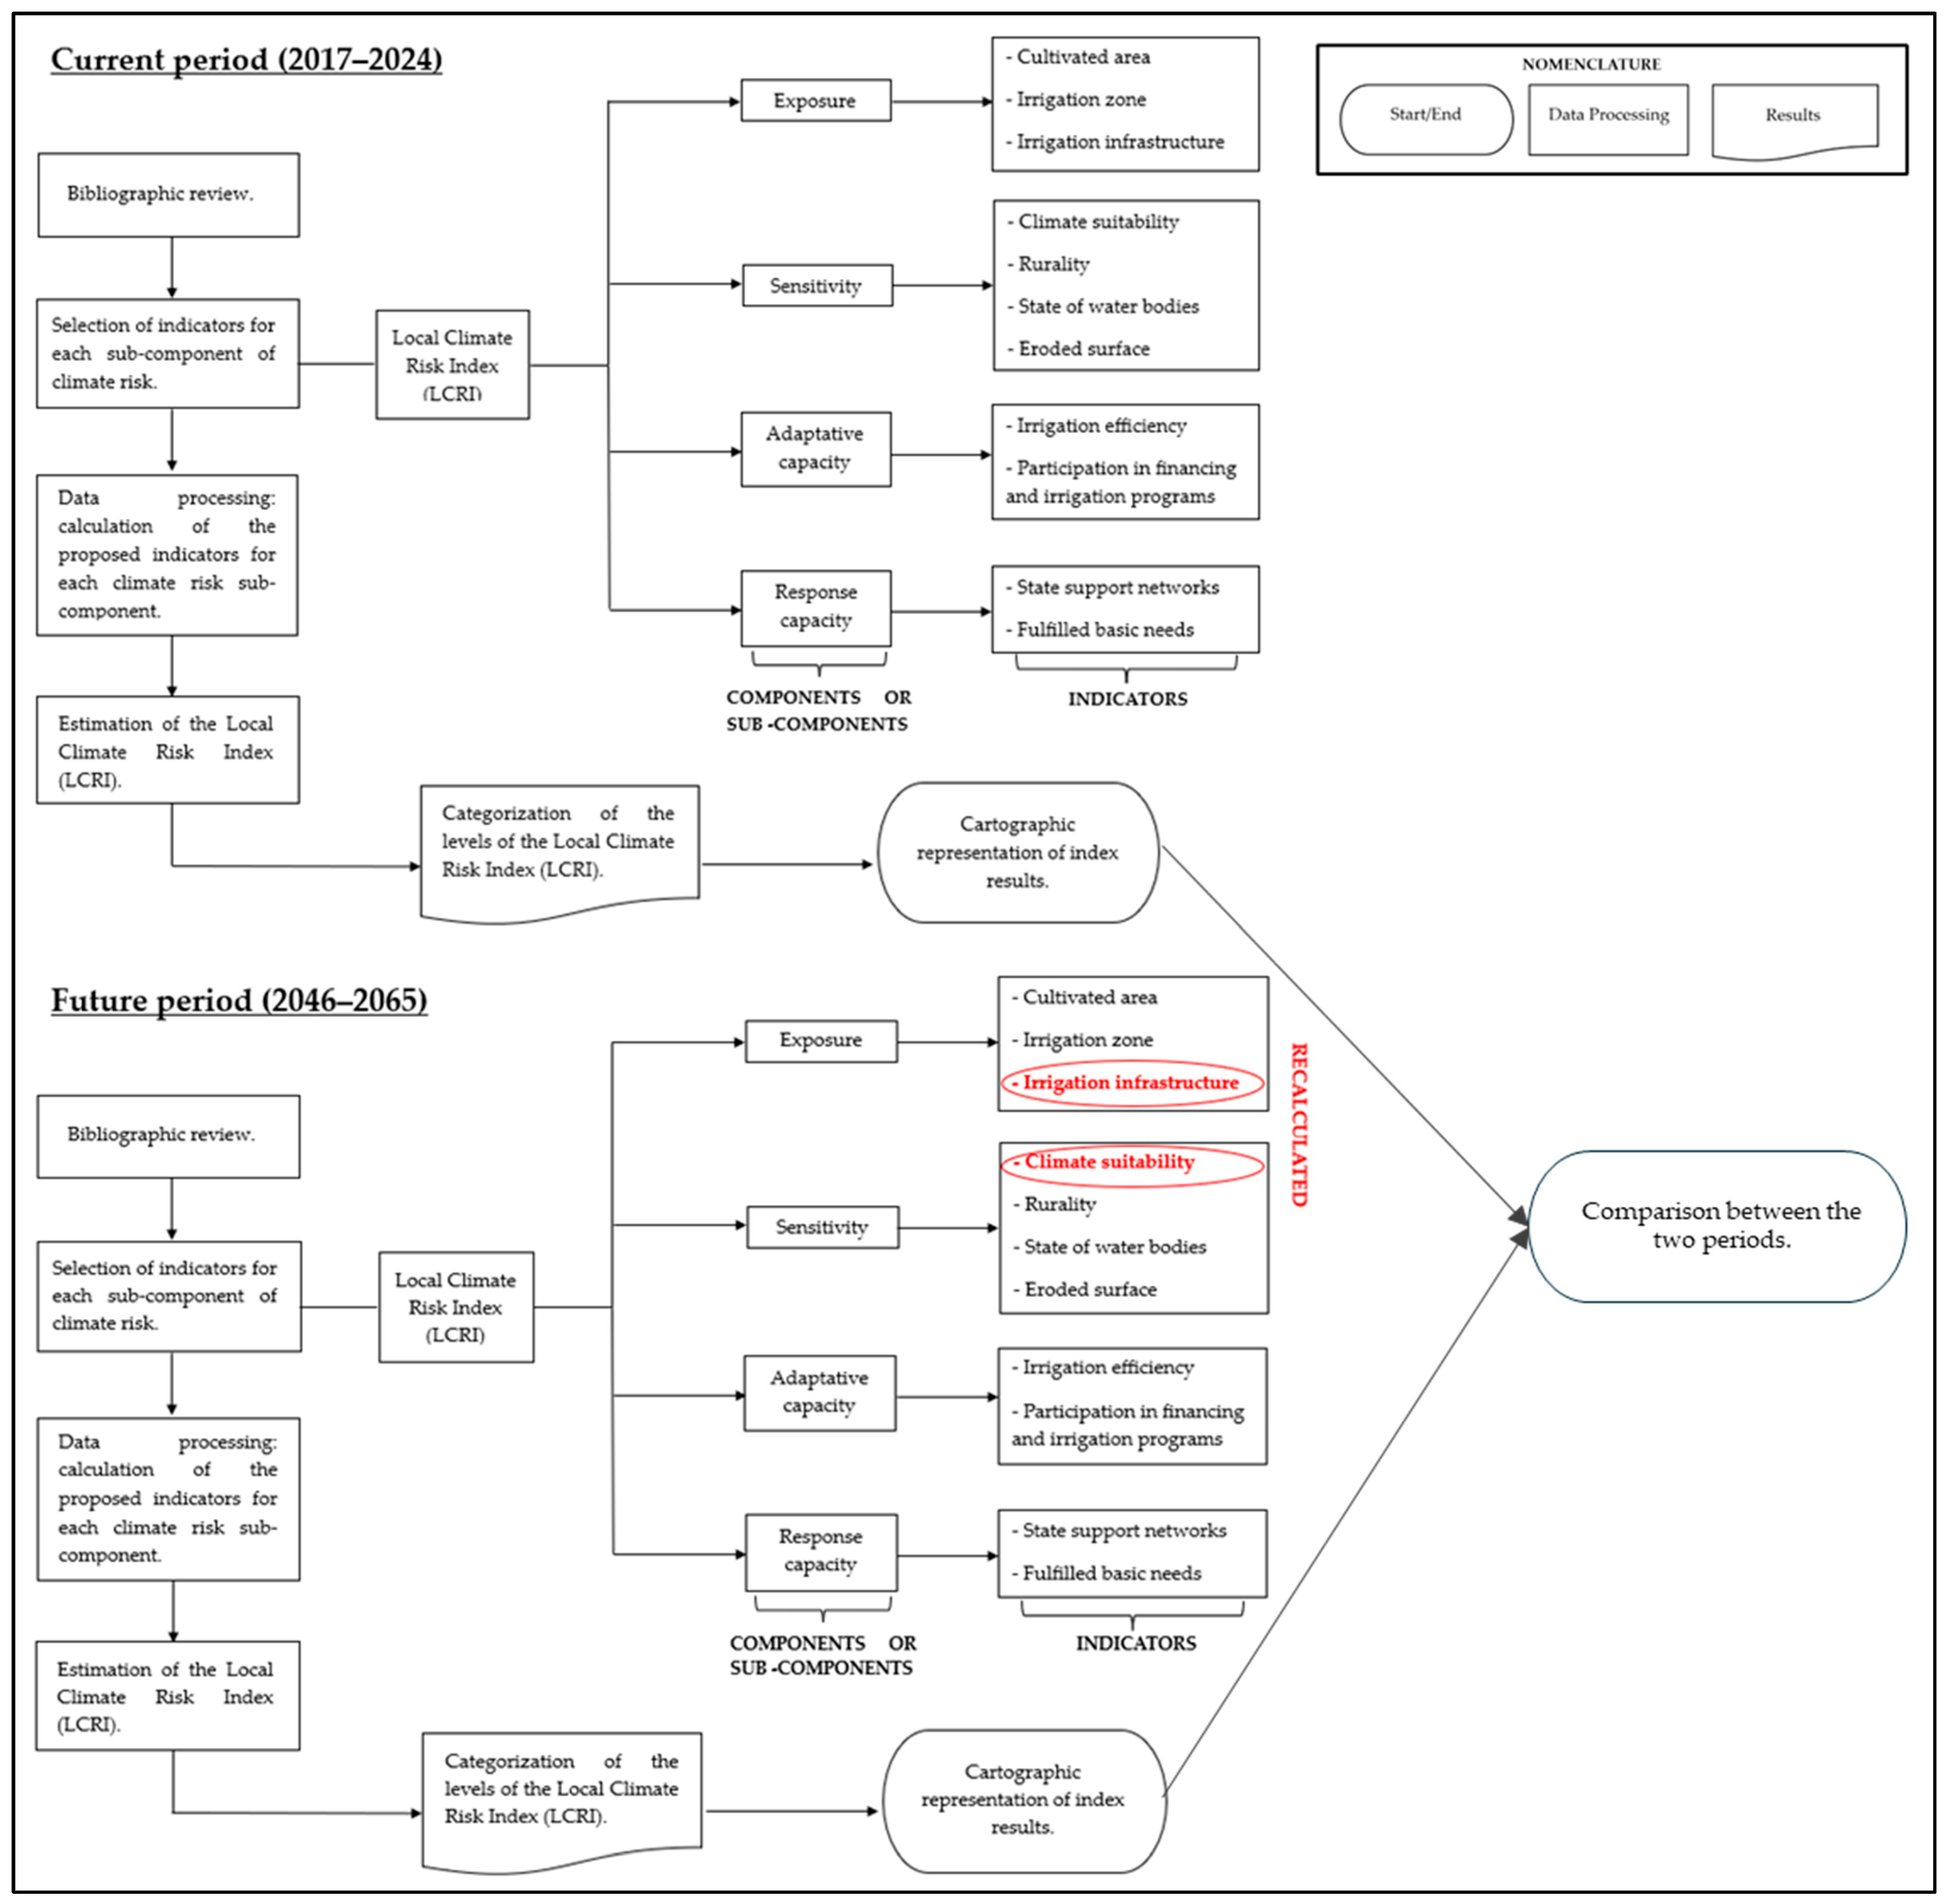
The LCRI was developed for the current (2017–2024) and future (2046–2065) periods. The method was applied to the viticulture sector across Chile’s Atacama and Biobío regions based on the available information for calculating the proposed indicators. The LCRI is multidimensional and incorporates exposure, sensitivity, adaptive capacity, and response capacity components [22,23,35]. To reconcile methodological disparities among the climate risk subcomponents, the LCRI was developed using the results of an exhaustive literature review. This review identified the critical components commonly used to estimate climate risk and selected the most relevant indicators for each subcomponent. The method also considered data availability, quality, and spatial resolution to ensure the index’s local applicability. This integrated framework supports direct spatial comparisons within the study area and helps decision-makers to identify priority zones for climate adaptation and intervention (Figure 2).
Each component includes a series of indicators, which are detailed below. Each component or subcomponent was calculated as a simple arithmetic mean of its indicators, avoiding subjective weights that could bias the results. This approach prevents any single indicator from disproportionately influencing the overall risk score and promotes transparency and reproducibility. The information used to inform each indicator was sourced from databases, reports/cadasters, newsletters, and other materials generated by state agencies specializing in various sectors. All data were collected at the municipality level and were updated for 2017–2024.

2.2.1. Exposure

The exposure component involves the evaluation of three indicators: cultivated area, irrigation zone, and irrigation infrastructure. For each indicator, values closer to 1.00 indicated higher exposure, and the simple average of these indicators was used to calculate the component’s value.
Cultivated Area
This indicator measures the ratio of the area cultivated with grapevines to the total fruit-growing area in the municipality. A large cultivated area increases exposure to climate change due to reduced fruit diversity and climatic conditions that may favor other crops (Table 1) [36,37].
Irrigation Zone
This indicator classifies grapevine-producing territories based on whether they are irrigated or rainfed. Territories with predominantly rainfed productive areas are more exposed to climate change than irrigated areas (Table 1) [38,39].
Irrigation Infrastructure
The presence of off-farm water storage facilities, such as reservoirs located in or upstream of a municipality, ensures water security and aids in drought management (Table 1) [40]. The location of irrigation infrastructure was obtained from the Chilean Geospatial Data Infrastructure (IDE-Chile) and combined with hydrographic network data to determine how the downstream municipalities benefit from the regulation and supply of irrigation water from the reservoirs. The current condition considers existing reservoirs, whereas the future condition considers the construction of new irrigation infrastructure based on information from the National Irrigation Commission, the General Directorate of Water, and/or the Directorate of Hydraulic Works.

2.2.2. Sensitivity

The sensitivity component considered the evaluation of four indicators: climatic suitability, rurality indicator, state of surface and groundwater bodies, and proportion of eroded surface. For each indicator, values closer to 1.00 indicated greater sensitivity, and the simple average of these indicators was used to obtain the component value.
Climatic Suitability
This indicator considers both thermal and water conditions as determining factors for crop suitability [41]. The estimation was performed using the maximum entropy model with Maximum Entropy (MaxEnt) model 3.3.4 (version 3.3.4, AMNH and AT&T-Research, New York, NY, USA), which predicts the potential geographic distribution of a species based on the presence data and environmental variables, primarily temperature and precipitation [42,43]. The thermal model includes four sub-variables: maximum temperature in January [44], frost-free periods [45], degree days [46], and annual chilling hours [47], which are the requirements for the grapevine to achieve its phenological development under optimal conditions. The water model considers water or irrigation requirements [48], crop evapotranspiration [49], and monthly reference evapotranspiration [50,51]. The climate data for the current period were based on variables representative of the study area over the last 30 years. In contrast, projections for the future period (2046–2065) were made using a climate change scenario (RCP8.5), as outlined in the work of Araya et al. [18]. The results were visualized using Quantum Geographic Information Systems (QGIS) software version 3.34.6 (version 3.34.6, OSGeo, Beaverton, OR, USA). The suitability map was classified into four restriction categories based on the obtained minimum and maximum values and divided into equal ranges. A land cover map layer from Chile [52] was also included to exclude restricted areas (Table 2).
Rurality
The ratio of the rural population to the total municipality population (urban + rural) was determined. The urban population is less vulnerable to climate change than the rural population [38,53].
State of Water Bodies
This indicator provides a municipality-level assessment of the status of surface water bodies (depleted areas) and aquifers (restricted or extraction-prohibited areas) across the Atacama and Biobío regions. IDE-Chile data, including declarations of surface water depletion, restricted areas, and aquifer prohibition zones, were used. The information was then intersected with the municipalities in the study area. The value assignment was discrete (0.00; 0.50; or 1.00) to evaluate the worst observed condition (Table 2). Water resources are vital for agricultural development, irrigation, environmental sustainability, and the economic well-being of farming municipalities, including those focused on viticulture [54].
Eroded Surface
The areas with some degree of soil erosion, considering the following categories: “Light Erosion”, “Moderate Erosion”, “Severe Erosion”, and “Very Severe Erosion”, all of which limit viticulture, were evaluated in relation to the total agricultural area of each municipality (Table 2). High soil erosion rates increase vulnerability to climate change [37,55].

2.2.3. Adaptative Capacity

The adaptive capacity component was evaluated based on two indicators: irrigation system efficiency and participation in the financing and irrigation programs of the Agricultural Development Institute (INDAP, acronym in Spanish). For each indicator, values closer to 1.00 indicated higher adaptive capacity, and the component value was obtained by calculating the simple average of these indicators.
Irrigation Efficiency
This indicator was quantified for the total grapevine area, weighted by an irrigation efficiency coefficient based on the type of system used, where most technical systems approached 1.00 (Table 3) [56]. Municipalities with a larger proportion of hectares irrigated using advanced irrigation technologies are considered less sensitive to climate risk, as these systems improve water use efficiency [57,58].
Participation in Financing and Irrigation Programs
INDAP implements territorial investment programs that support climate change adaptation through infrastructure and technologies that optimize resource use. At the municipality level, the proportion of grapevine growers who benefit from a support program was determined relative to the total number of farmers in the program [59]. Four support programs for farmers were considered that focused on adaptation to climate change and featured infrastructure and strategies to optimize the use of resources: the Development and Investment Program (PDI); the Local Development Program (PRODESAL); the Credit Program (“Short-term Credit Program for individuals or companies, incentives for the sustainability of agricultural soils”); and the Irrigation Program (“Associative Irrigation”, “Intra-farm Irrigation”, and “Minor Irrigation Works”). A simple average was used to obtain the final value for each program type and indicator (Table 3). A higher proportion of grapevine growers participating in financing and irrigation programs indicates greater adaptive capacity, contributing to reduced vulnerability and enhanced resilience to climate change [60,61].

2.2.4. Response Capacity

The response capacity component was evaluated based on two indicators: state support networks and fulfilled basic needs. For each indicator, values closer to 1.00 indicated greater responsiveness, and the component value was obtained by calculating the simple average of these indicators.
State Support Networks
Municipalities with state agencies dedicated to climate change adaptation in the agricultural sector were identified. The municipalities were classified according to the level of support available, with 1.00 indicating those that have an area agency or regional directorate, where there are professionals, technicians, and advisors that provide direct and immediate assistance, whereas 0.00 indicated those that do not have support or territorial coverage (Table 4). The presence of these institutions enhances the local capacity to respond to climate challenges through technical assistance, financial aid, and policy implementation [30,62].
Fulfilled Basic Needs
The ability of a municipality to meet its basic needs (socioeconomic variables) strengthens its capacity to respond to climate change, reducing overall vulnerability [24,63]. The following were assessed at the municipality level, between people and/or homes: literacy rates (LI), access to sanitation (SA), overcrowding (OV), housing quality (HQ), and completion of compulsory education (CE). The indicator was calculated using the simple average of the variables described above (Table 4).

2.3. Evaluation of the LCRI for the Viticulture Sector

The magnitude of the LCRI depends on the probability and intensity of hazards, the exposure of affected populations or systems, and their intrinsic vulnerability, including response and adaptation capacity [22]. Therefore, the LCRI was calculated by summing the adaptive capacity (AD) and response capacity (RE) components and subtracting the exposure (EX) and sensitivity (SE) components (Figure 2). The final LCRI values were then normalized to a scale ranging from 0.00 to 1.00 for interpretability (Table 5) using the following equation:
L C R I = E X + S E A D + R E + 2 4

3. Results

3.1. Exposure

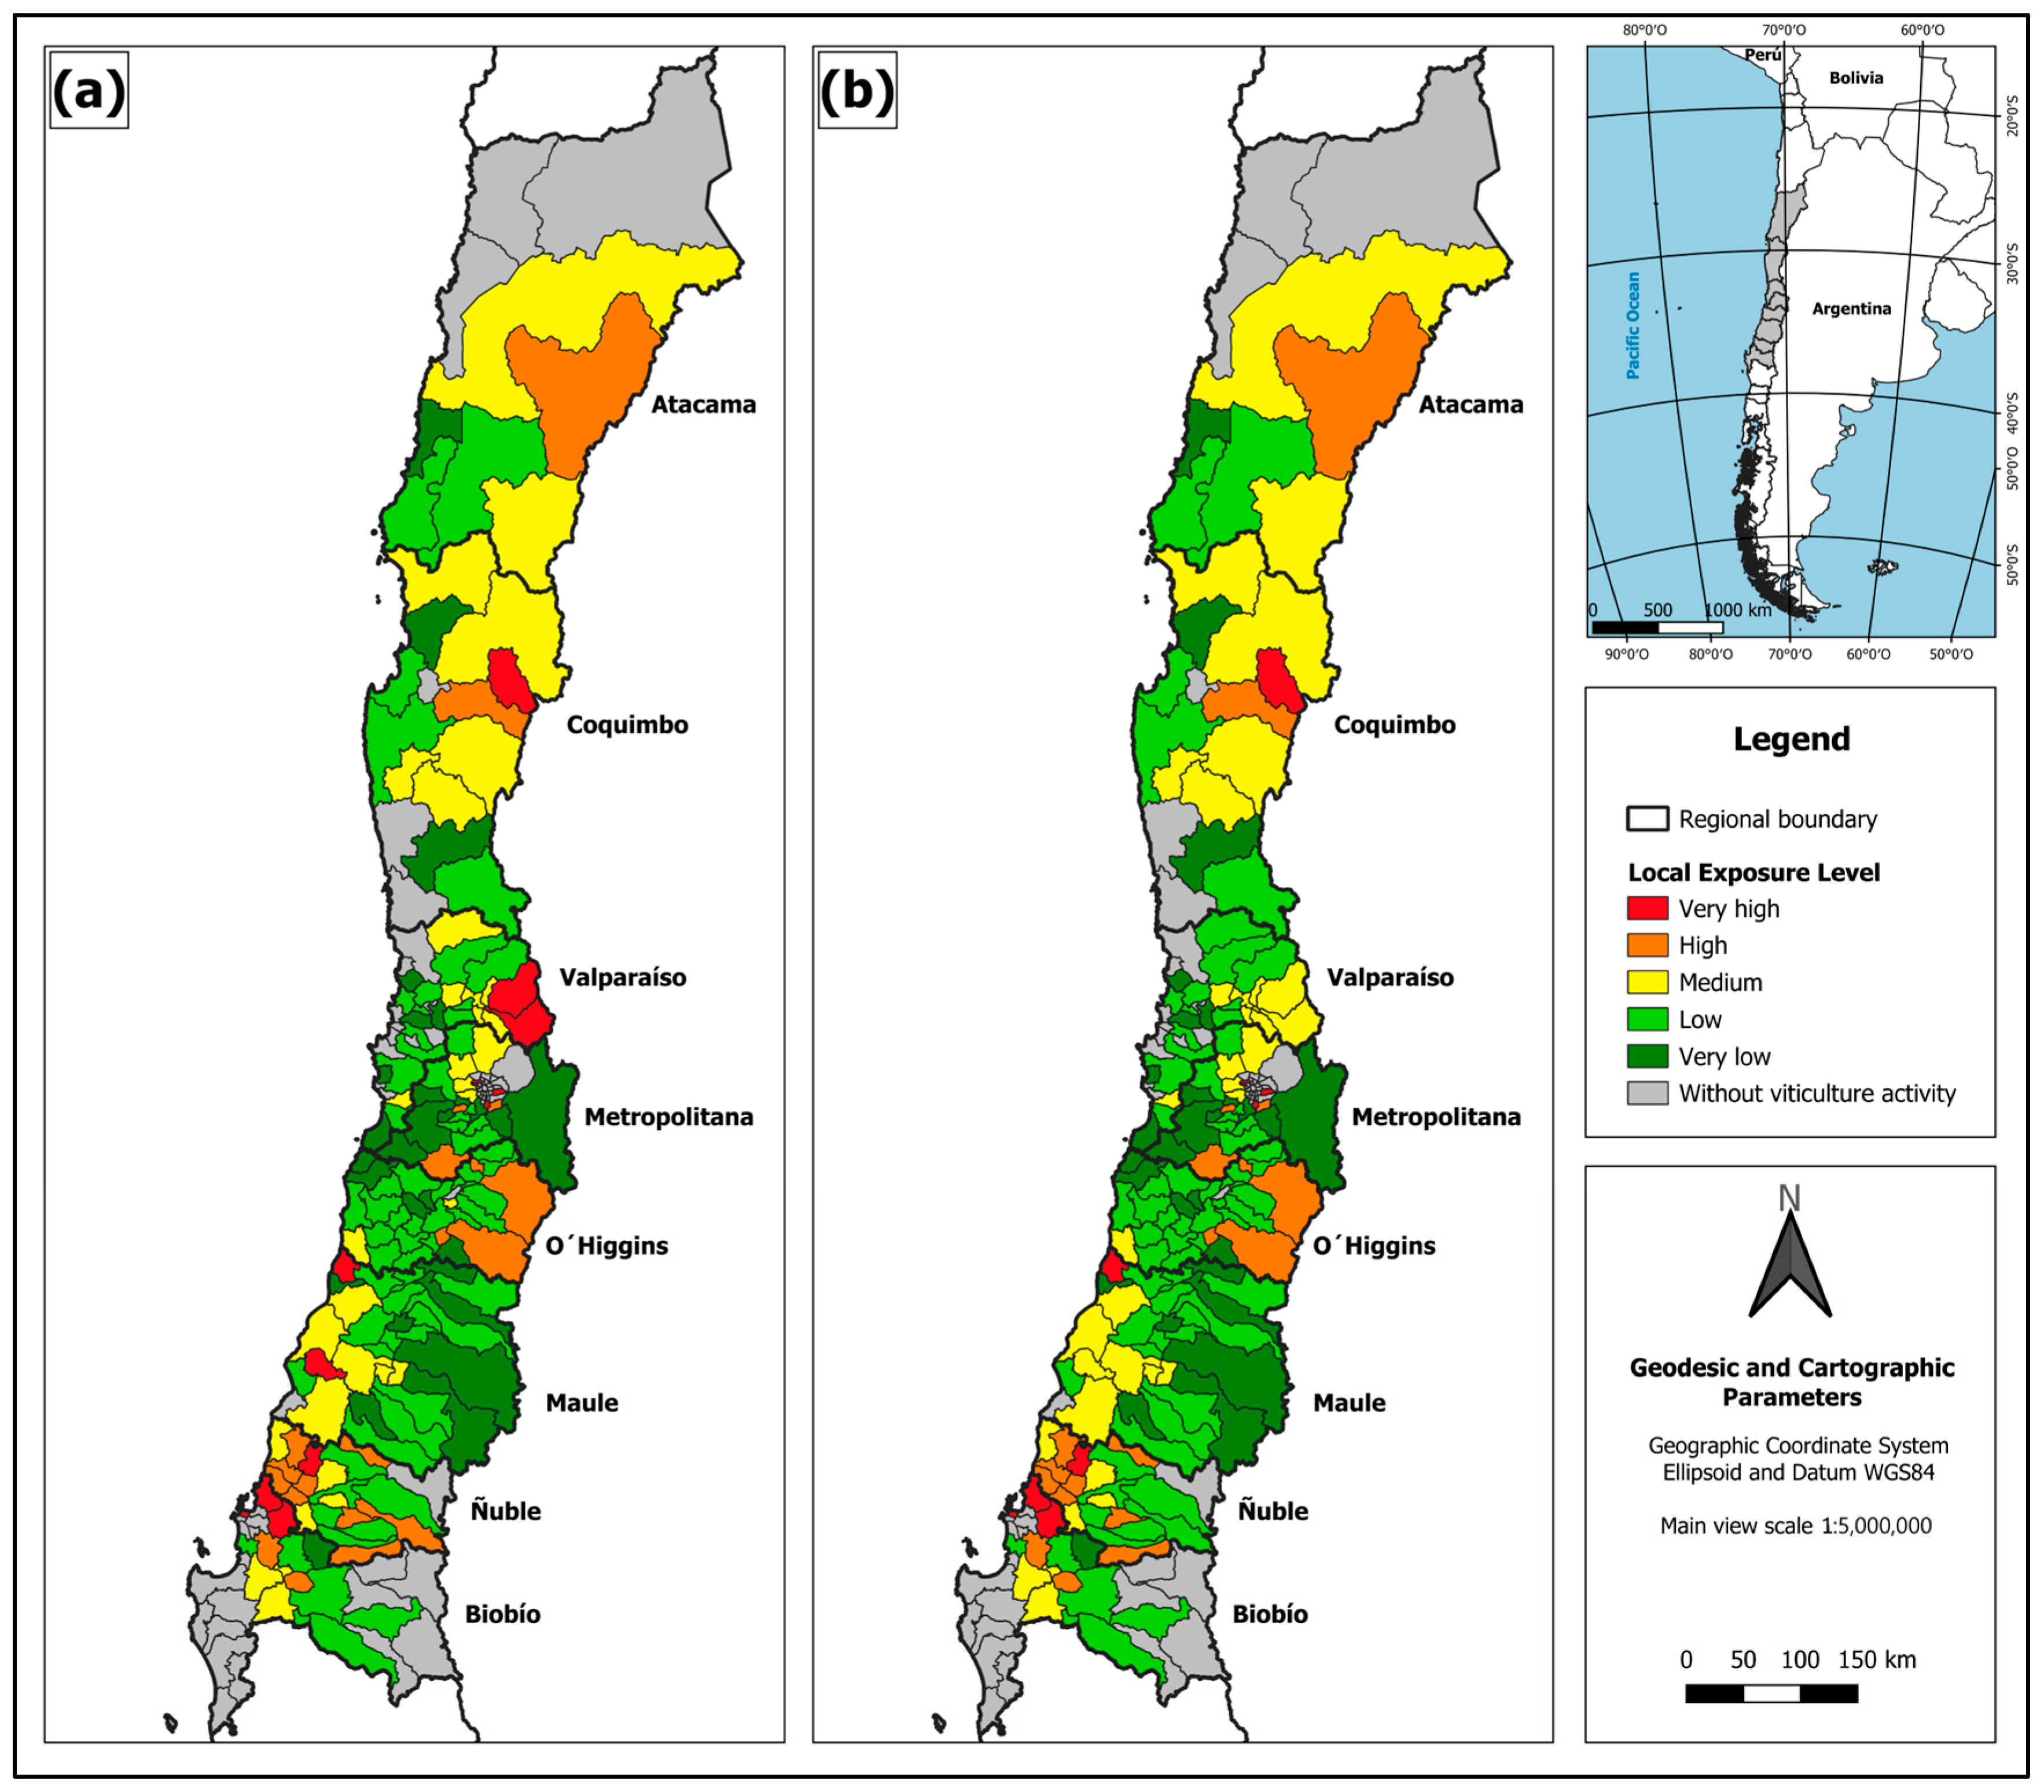
In the current period, the exposure component was 0.01–1.00 (Table S1). The municipalities involved in viticulture in mountainous areas with tundra climates, ranging from Atacama to O’Higgins, those with semi-arid climates, ranging from the Atacama to Valparaíso regions, and coastal municipalities with mediterranean climates, ranging from the Maule to Biobío regions, exhibited exposure levels classified as “high” (≥0.61) or “very high” (≥0.81). These municipalities represented 20.00% of all Chilean municipalities involved in viticulture. By contrast, the coastal municipalities with semi-arid climates (Atacama to Valparaíso) and valley municipalities with mediterranean (Metropolitana to Biobío) or temperate (Biobío) climates demonstrated exposure values categorized as “low” (≤0.40) or “very low” (≤0.20) (Figure 3a).
For the future period, the range of values was expected to remain the same as in the current period, ranging between 0.01 and 1.00, although in some cases a decrease was observed (Table S1). The most important changes were observed in municipalities located in the mountain range zone with tundra (Valparaíso) and mediterranean (Ñuble) climates (Figure 3b). These changes were related to the irrigation infrastructure indicator (Table S1), reflecting either the planned construction of reservoirs within their municipal boundaries or indirect access to reservoirs located in adjacent watersheds.

3.2. Sensitivity

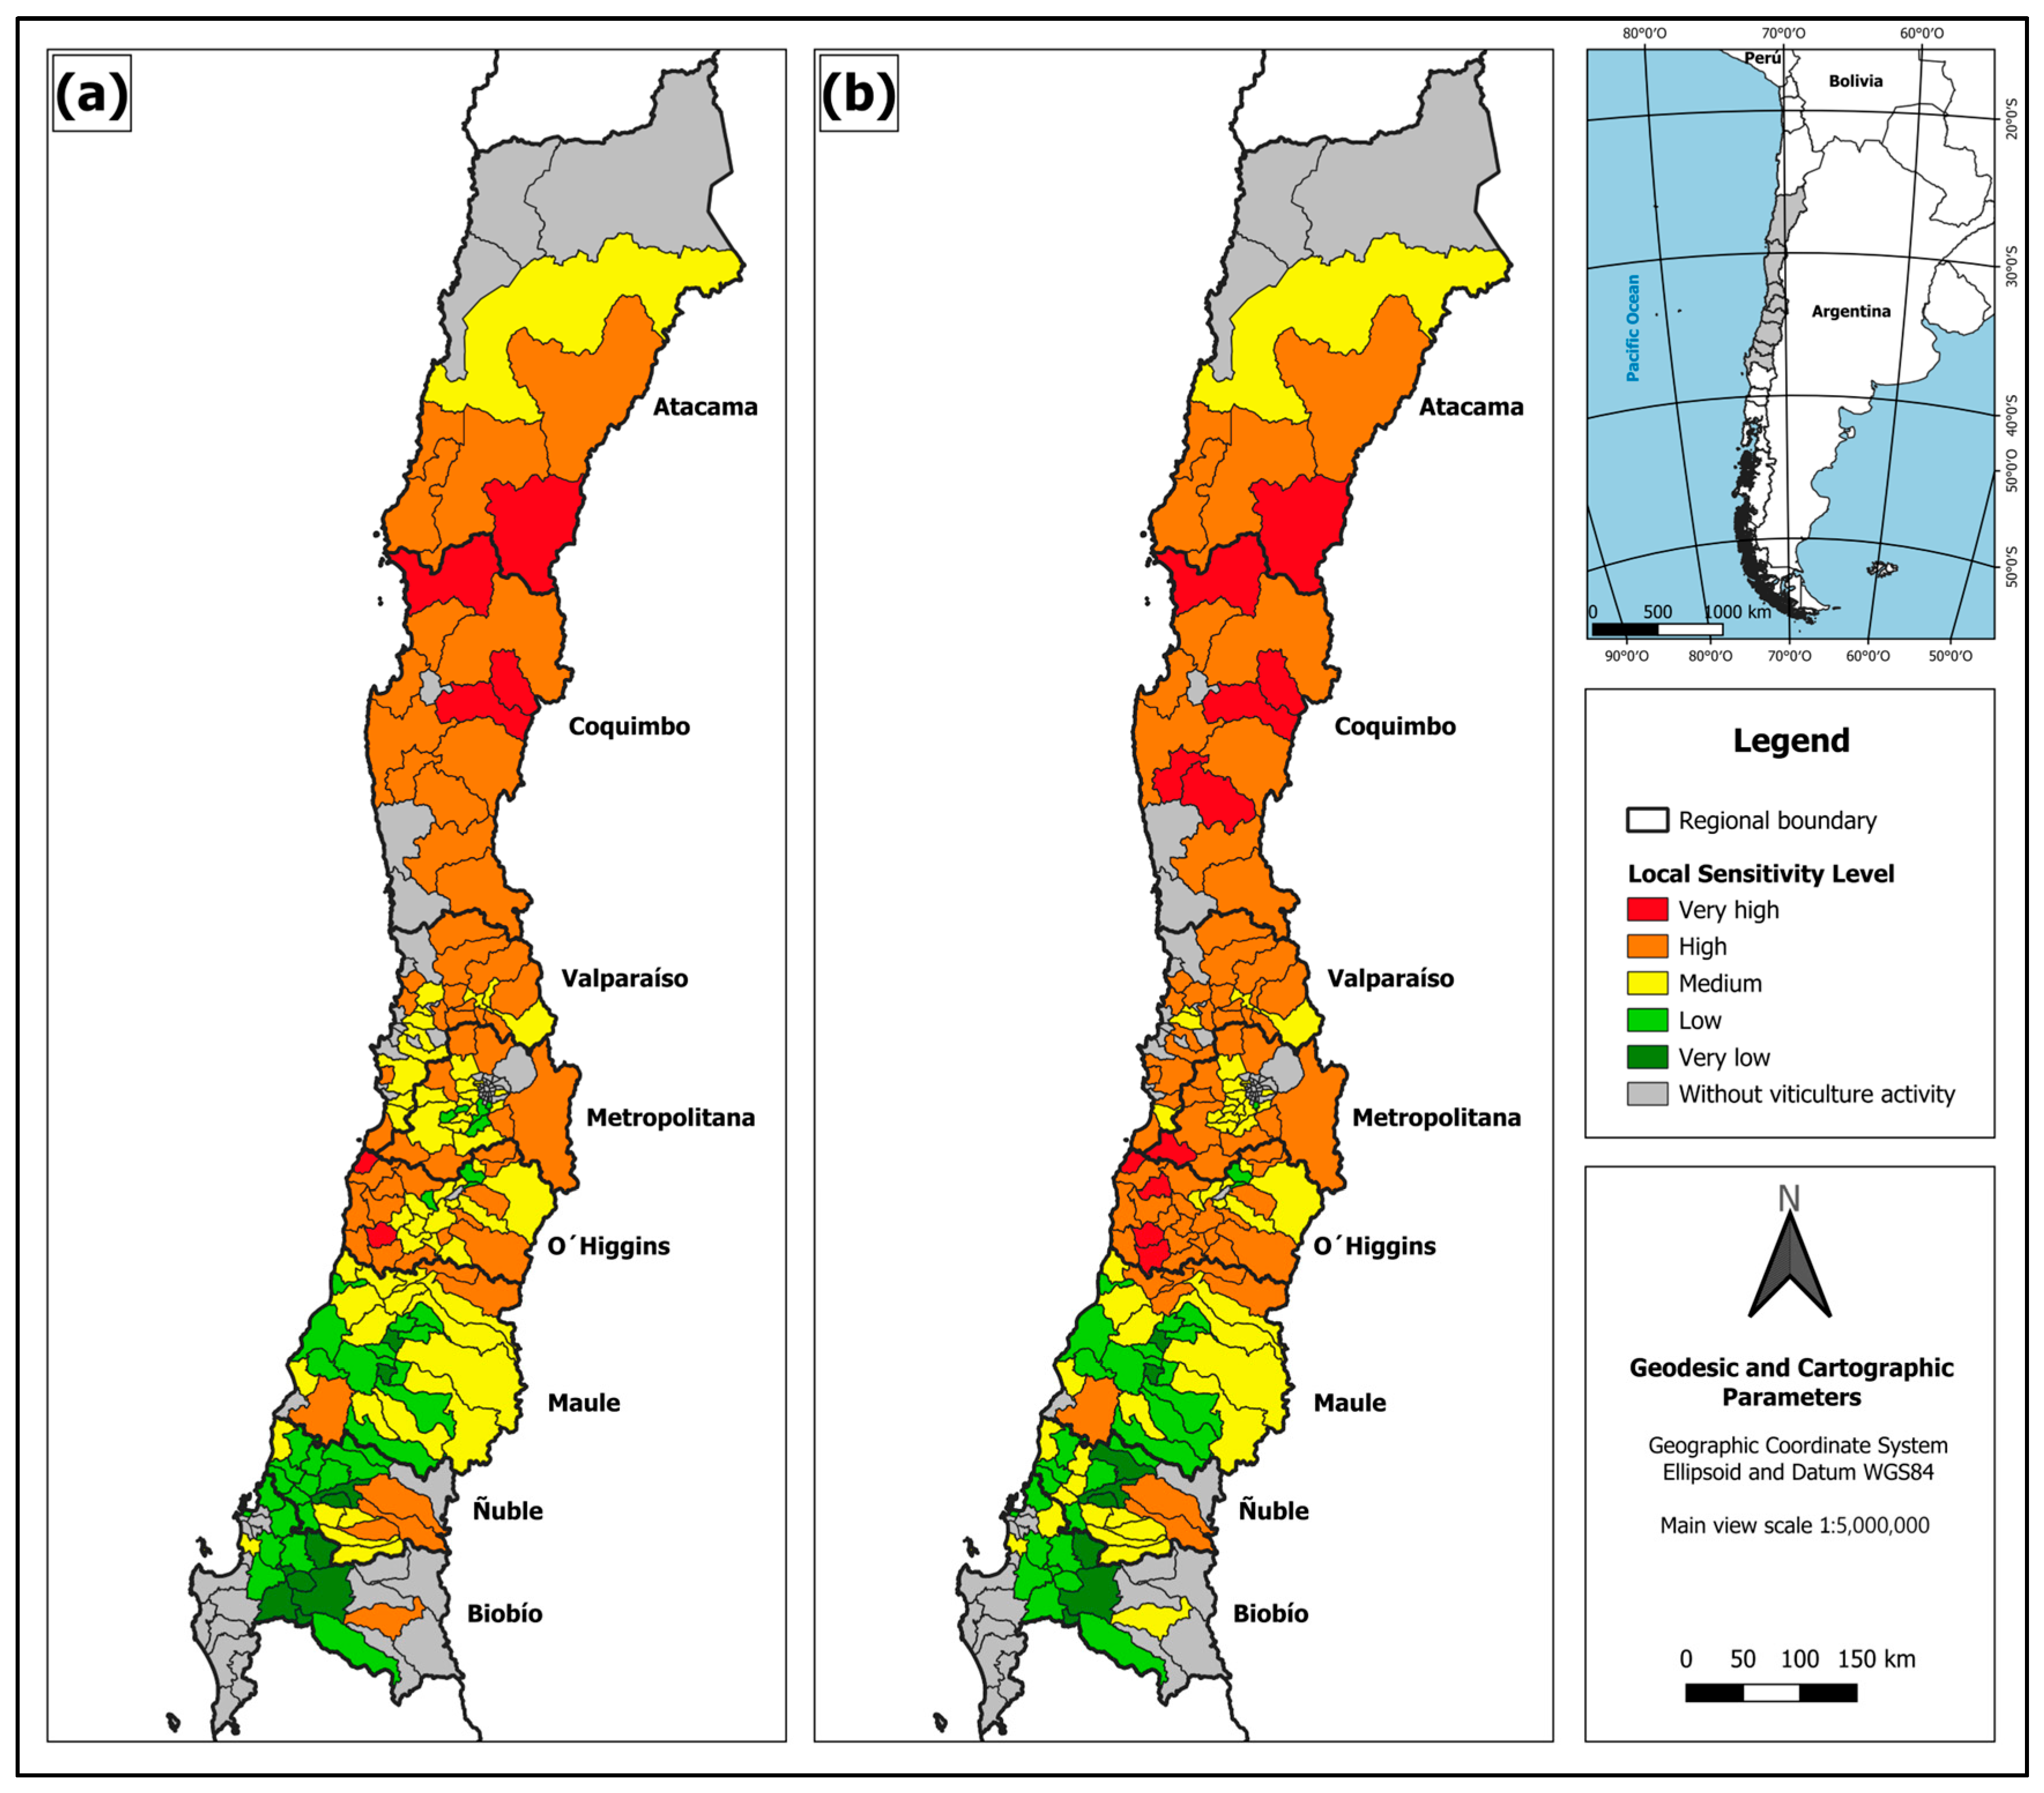
In the current period, the sensitivity component was 0.12–0.90 (Table S2). A total of 36.97% of the Chilean municipalities with viticulture activity exhibited sensitivity levels categorized as “high” (≥0.61) or “very high” (≥0.81). These municipalities were mainly concentrated in desert and semi-arid regions (Atacama to Valparaíso), mountainous regions with tundra climates (Atacama to O’Higgins), and mediterranean areas (Metropolitana to O’Higgins). By contrast, coastal municipalities with mediterranean climates, from Maule to Biobío, and temperate climate valleys (Biobío) exhibited sensitivity values classified as “low” (≤0.40) and “very low” (≤0.20), respectively (Figure 4a).
In the future period, the sensitivity component values were projected to range from 0.09 to 0.94 (Table S2). The most important changes were observed in mountainous areas with semi-arid climates (Atacama to Coquimbo) and coastal areas with semi-arid (Valparaíso) or mediterranean (O’Higgins) climates. In contrast, mountainous municipalities with mediterranean (Maule to Ñuble) or temperate (Biobío) climates showed improvements (Figure 4b). These changes were mainly due to variations in the climate suitability indicator projected under the climate change scenario RCP8.5 (Table S2).

3.3. Adaptive Capacity

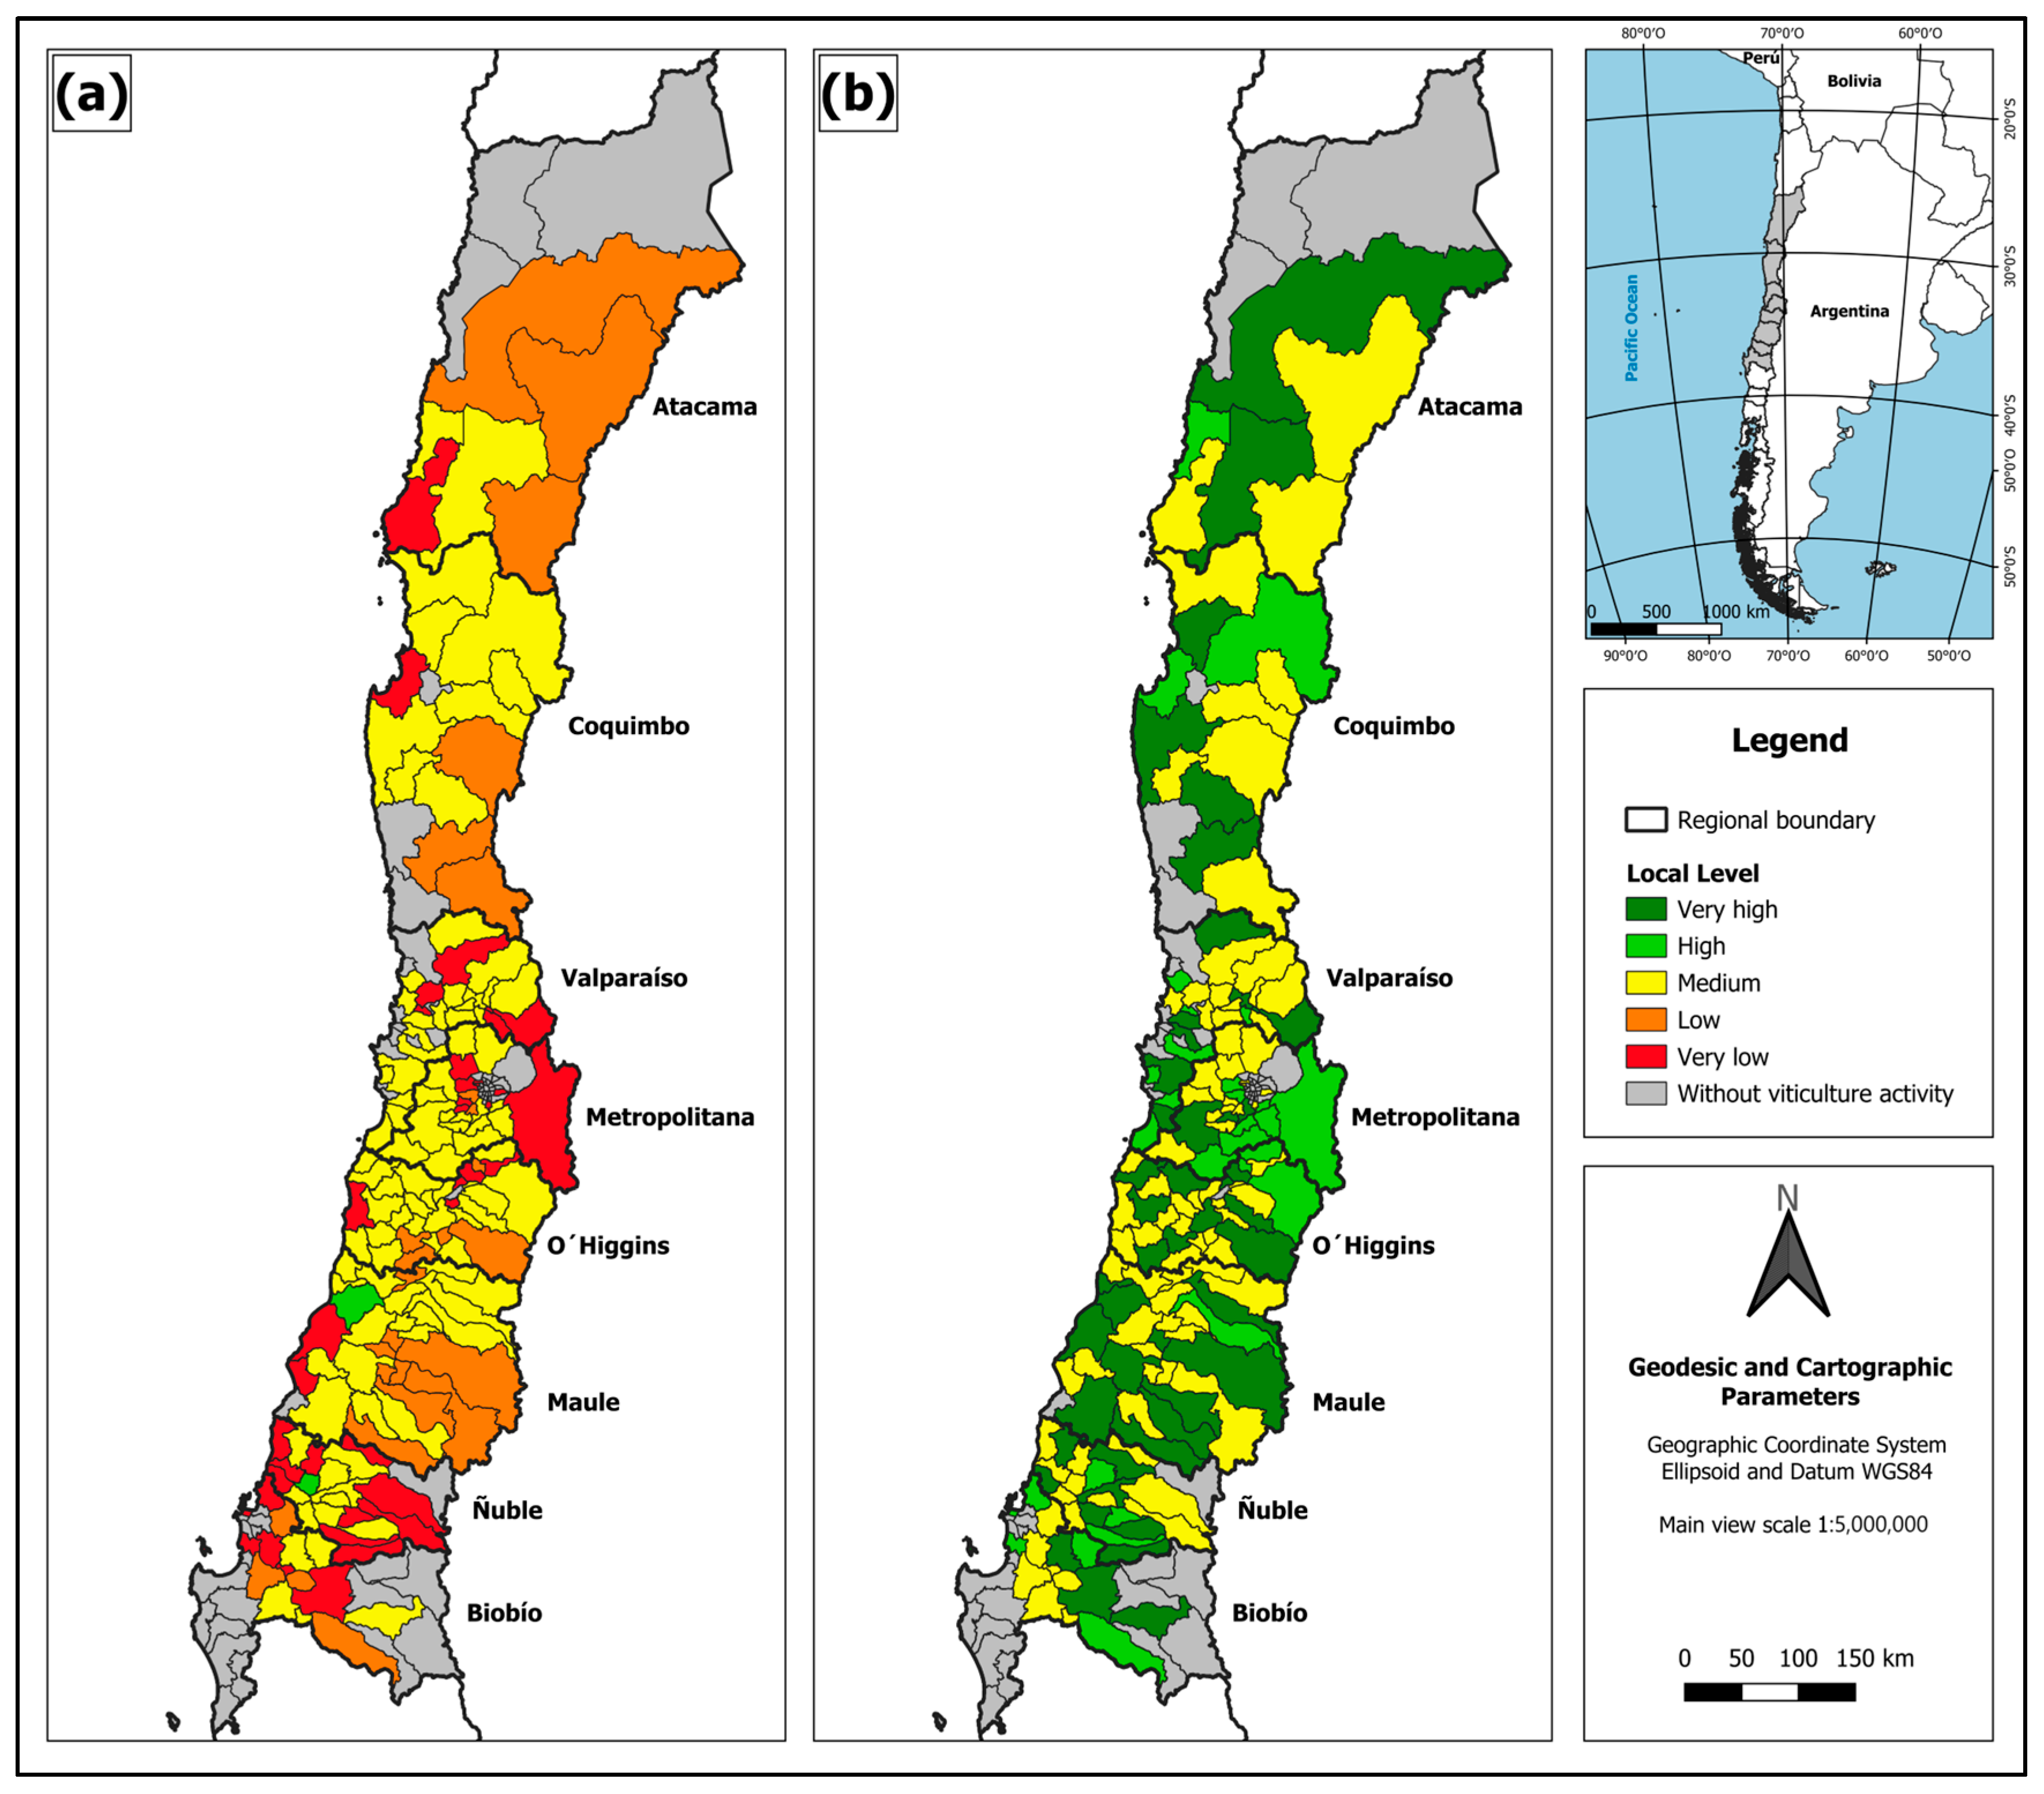
The adaptive capacity component exhibited values ranging from 0.00 to 0.62 (Table S3), and no evident spatial trend was identified. “High” levels (≥0.61) represented 1.21% of the total number of municipalities involved in viticulture. Most municipalities (59.39%) exhibited adaptive capacity levels classified as “medium” (0.41–0.60). These municipalities were predominantly located in coastal and valley areas with semi-arid (Atacama to Metropolitana) or mediterranean (O’Higgins to Biobío) climates. Meanwhile, municipalities with “low” (≤0.40) or “very low” (≤0.20) adaptive capacity levels were found in mountainous areas with tundra (Atacama to O’Higgins) or mediterranean (Maule to Ñuble) climates, as well as in coastal and valley areas with mediterranean climates (O’Higgins to Ñuble) and some valley areas with temperate climates (Biobío) (Figure 5a).

3.4. Response Capacity

The response capacity component had values ranging from 0.42 to 0.96 (Table S3). Most municipalities (53.33%) had response capacity levels categorized as “medium” (0.41–0.60). These municipalities were mainly located in mountainous areas with tundra and semi-arid climates (Atacama to Valparaíso) or tundra (Atacama to O’Higgins) climates, as well as in valley and coastal areas with mediterranean climates (Valparaíso to Biobío). Meanwhile, municipalities in the “very high” category (≥0.81) represented 28.48% of the municipalities involved in viticulture. They were mainly distributed across coastal zones with desert, semi-arid, or mediterranean climates and valley and mountainous areas with mediterranean (O’Higgins to Biobío) or temperate (Biobío) climates (Figure 5b).

3.5. LCRI for the Viticulture Sector

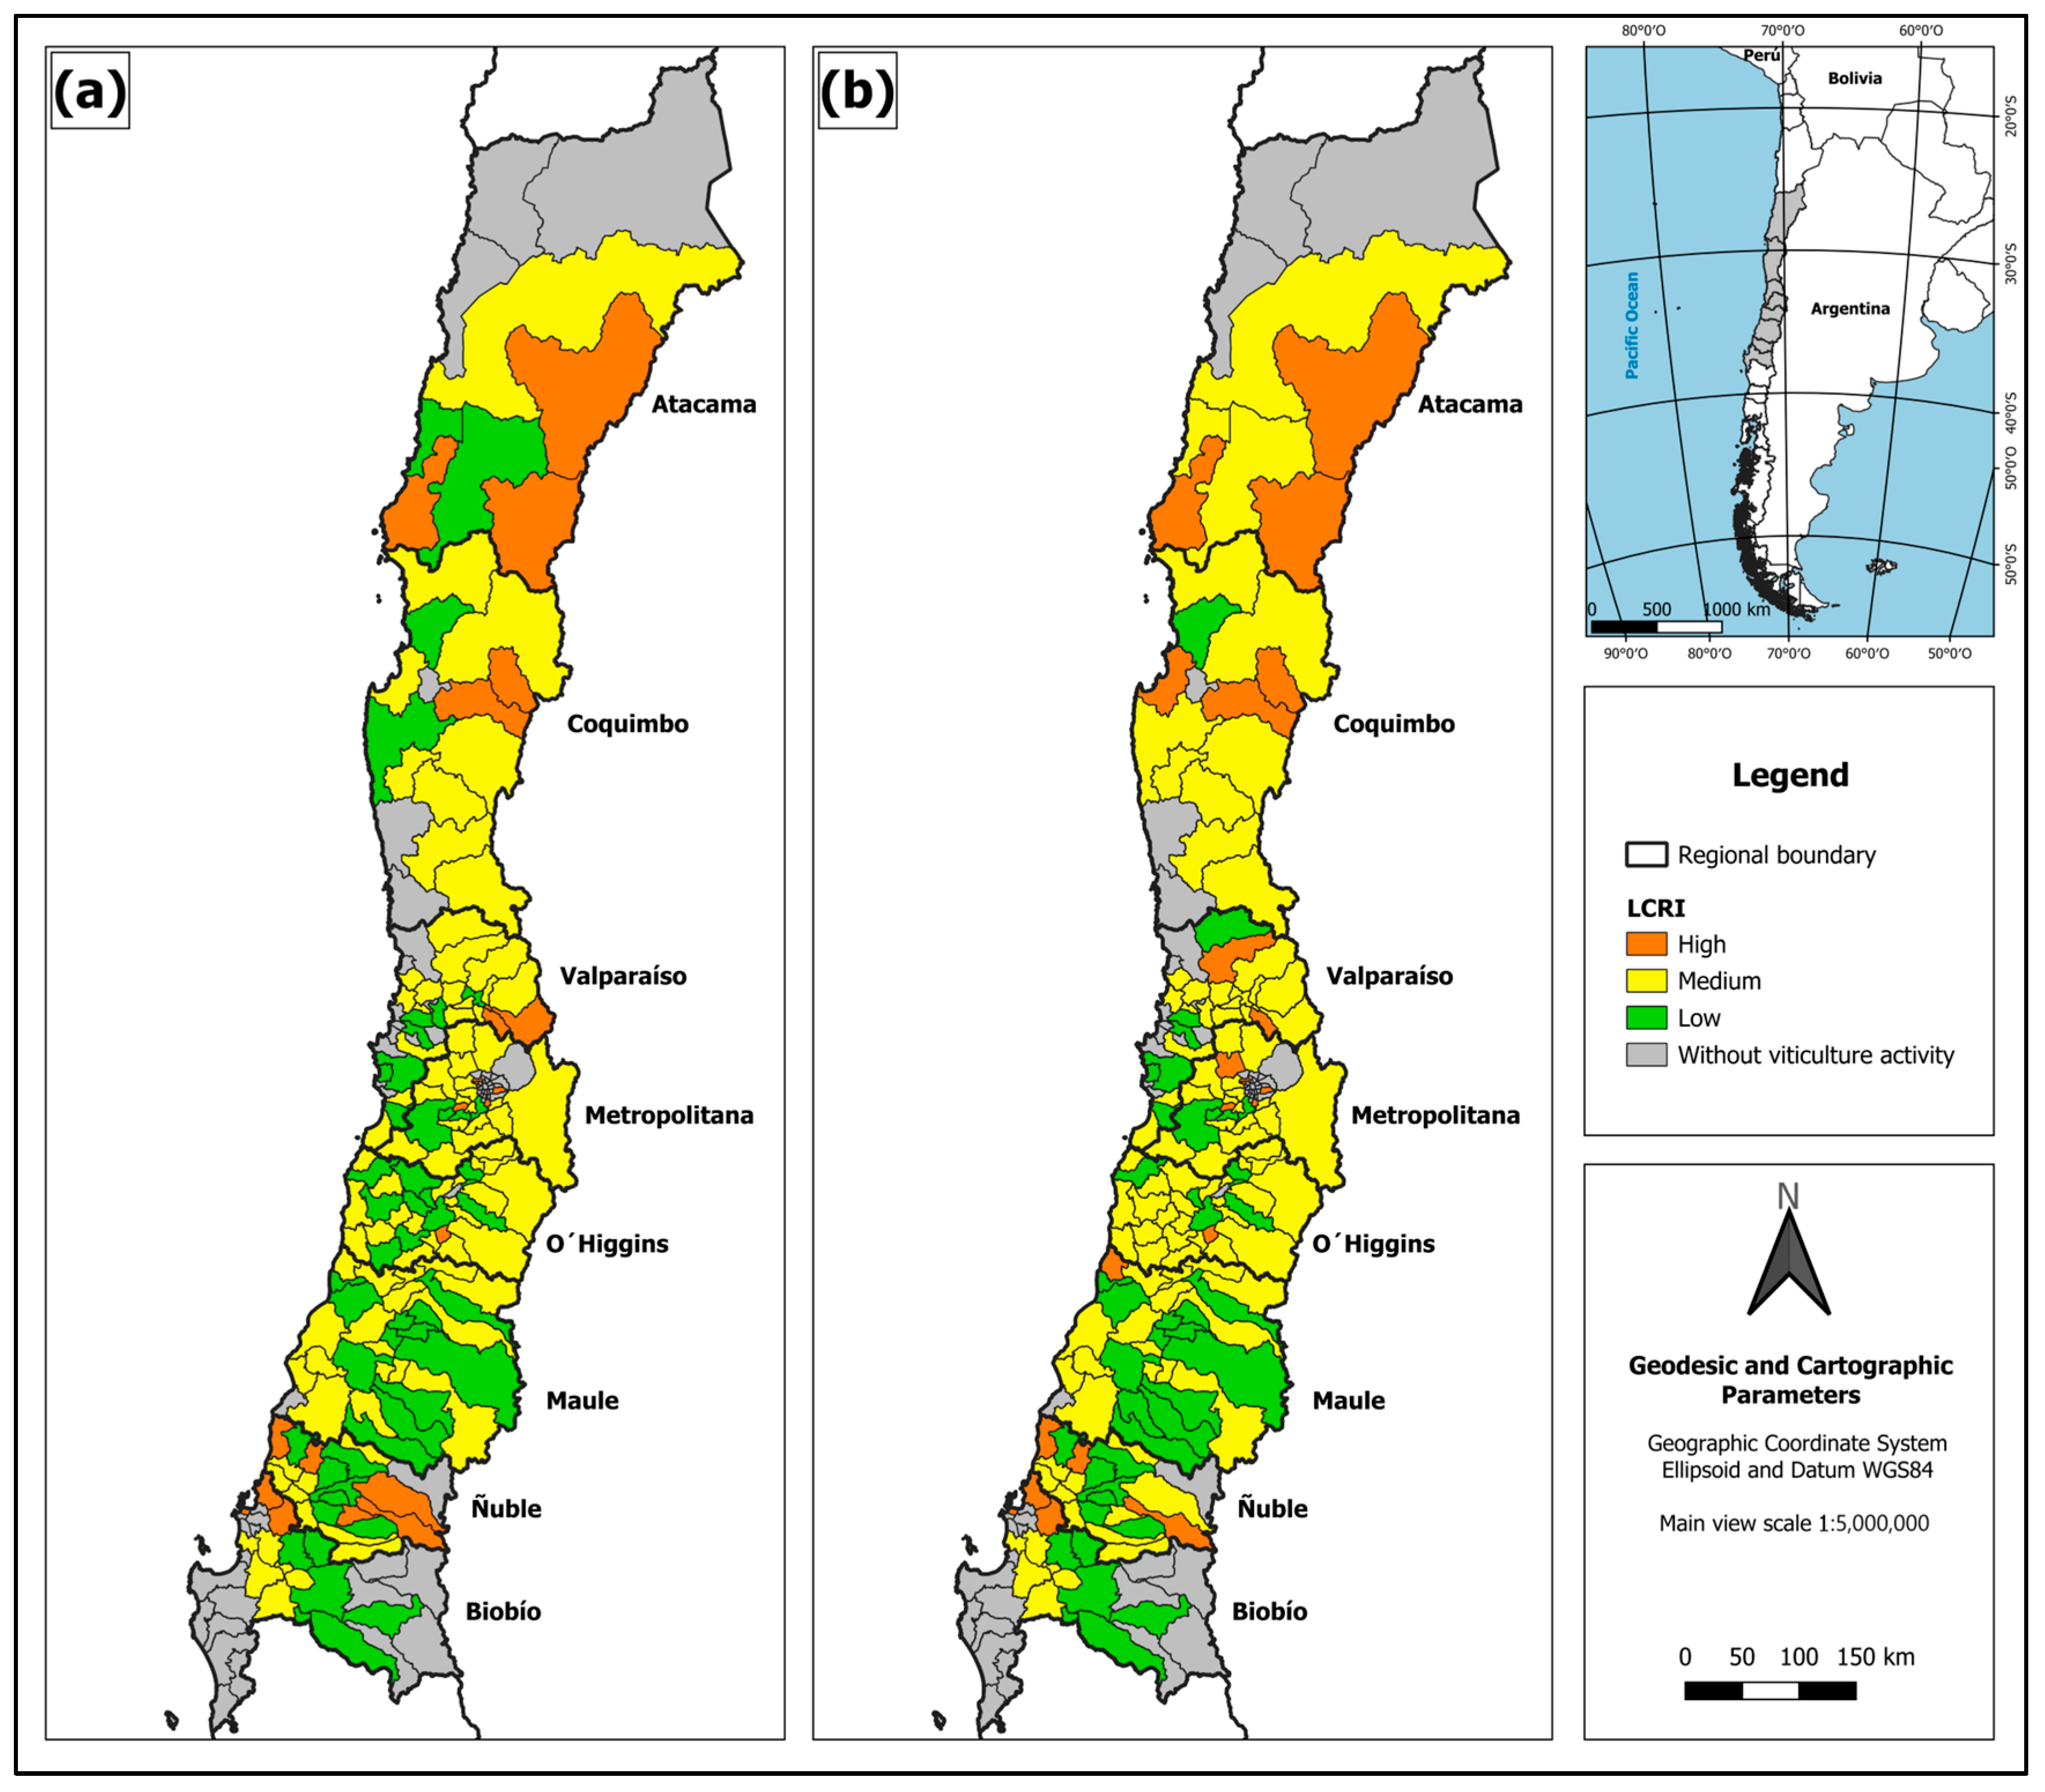
The LCRI for the viticulture sector in Chile during the current period ranged from 0.24 to 0.76 (Table S4). Most municipalities, regardless of climate type, were in the “medium” category (0.41–0.60), representing 56.36% of the total study area. These municipalities were mainly distributed across mountainous areas with semi-arid (Atacama to Valparaíso) or tundra (Atacama to O’Higgins) climates, as well as mountainous (Valparaíso to Metropolitana) and coastal (O’Higgins to Biobío) areas with mediterranean climates (Figure 6a). In the future period, climate change is expected to increase the risk, especially in regions with semi-arid and mediterranean climates (Atacama to Maule). By contrast, the municipalities in valley and mountainous areas with a mediterranean climate (Ñuble and Biobío) are expected to present improvements in the index owing to changes in the sensitivity component, particularly in the projected climate suitability indicator (Figure 6b).
In regional terms, the LCRI during the current period was higher in regions with semi-arid climates than in regions with mediterranean or temperate climates. This result was primarily due to the higher observed sensitivity, which was not mitigated by the adaptive and responsive capacities of municipalities in these regions. These components were homogeneous at the regional level (Table 6).

4. Discussion

The findings indicate pronounced spatial and temporal variability in the LCRI for viticulture, with clear distinctions among tundra, desert, semi-arid, mediterranean, and temperate climate areas. Mountainous municipalities in semi-arid regions predominantly exhibited higher climate risk index values than coastal and mountainous municipalities in mediterranean and temperate regions, which generally fall into lower risk categories (Figure 6a,b). These spatial patterns underscore the role of climatic–geographical conditions and the adaptive and response capacities of individual territories in shaping climate risk.

4.1. Exposure

Exposure was high in mountainous municipalities with tundra and semi-arid climates in the Coquimbo region and in valley municipalities with mediterranean climates in the Metropolitana region (Table 6 and Table S1, Figure 3a,b). In Coquimbo, the high exposure levels were largely driven by the cultivated area indicator, reflecting the predominance of viticulture over other crops. This lack of diversification increases the vulnerability of the production system [64]. In the Metropolitana region, the irrigation infrastructure indicator was a key determinant of exposure in several municipalities, as reservoirs play a critical role in ensuring water security, enhancing water use efficiency, and mitigating the impacts of drought within the socioeconomic system [65,66]. Mediterranean-climate regions, such as Ñuble and Biobío, also exhibited high exposure levels, primarily due to the irrigation zone indicator (Table 6 and Table S1, Figure 3a,b), which highlighted the prevalence of inefficient irrigation systems in viticulture practices. Irrigation technologies are essential for reducing yield losses [67], improving water use efficiency, and complementing other adaptation strategies, such as soil moisture conservation techniques and the development of grapevine varieties tolerant to dryland conditions [68].
In contrast, viticulture municipalities in mediterranean-climate regions, such as O’Higgins (coastal and valley areas) and Maule (valley and mountainous areas), exhibited low exposure levels, which are associated with low values for the cultivated area and irrigation infrastructure indicators (Table 6 and Table S1, Figure 3a,b). This result reflects the positive effects of fruit crop diversification [69] and the availability of water infrastructure, particularly reservoirs, which play a key role in reducing vulnerability by enhancing water security and buffering the impacts of climatic variability [70].
The difference between current and future exposure was primarily associated with changes in the irrigation infrastructure indicator (Table 6 and Table S1, Figure 3a,b). The planned construction of irrigation reservoirs and their distribution capacities were more influential than the other indicators because of their positive impact on water security at the territorial level [71]. These findings align with previous studies that emphasize the critical link between territorial planning, water resource management, and agricultural resilience to climate change [72,73].

4.2. Sensitivity

Municipalities located in mountainous areas with tundra and semi-arid climates—such as Atacama, Coquimbo, and Valparaíso regions—exhibited the highest levels of sensitivity (Table 6 and Table S2, Figure 4a,b). This pattern is attributable to the vulnerability of mountainous semi-arid zones to late frosts and extreme weather events (e.g., heavy rainfall and snowfall), which increase the risk of landslides and slope instability [74,75].
In the future period, an increase in sensitivity was projected for municipalities with semi-arid and mediterranean climates (Table 6 and Table S2, Figure 4a,b), primarily due to the climatic suitability indicator. This reflects a rising risk of heat and water stress in traditional viticulture areas [17], along with a projected shift in optimal production zones toward municipalities in mediterranean and temperate climates, driven by increased temperatures and the accumulation of growing degree days [13]. Such changes could affect multiple phenological stages of grapevines, causing imbalances in ripening, sugar concentration, pH, and oxidative sensitivity, thereby impacting both the crop and its products, particularly wine [76,77,78].
These findings are consistent with prior studies that identify climate sensitivity as a key factor influencing the long-term sustainability of viticulture under climate change scenarios [79].

4.3. Adaptative and Response Capacity

The adaptive capacity component exhibited lower values than the response capacity component, despite the latter showing greater spatial variability (Table 6 and Table S3, Figure 5a).
The irrigation system efficiency indicator was a decisive factor, and a positive correlation was observed between municipalities with large areas of efficient irrigation and high adaptive capacity (Table S3). This finding aligns with studies indicating that technologically advanced farming practices reduce vulnerability [38]. The adoption of drip irrigation not only enhances water use efficiency, but also reduces plant diseases by lowering humidity in the plants and the surrounding environment, thereby improving crop yield and quality [80,81,82]. In Chile, significant technological advancements have been linked to investments in water infrastructure and the importance of the wine sector [83]. However, no wine-producing municipalities reached the “very high” category of the adaptive capacity component (Figure 5a), reflecting the structural and socioeconomic factors that shape resilience to climate change. These factors may include limited access to irrigation financing programs, particularly for small producers who face considerable barriers [84].
In contrast, the response capacity component exhibited higher values than the adaptive capacity component (Table 6 and Table S3, Figure 5b). All viticulture municipalities analyzed reported a high percentage in the fulfilled basic needs indicator, consistent with previous research emphasizing the role of socioeconomic conditions in climate change adaptation capacity [85]. Nevertheless, the state support networks, such as those provided by INDAP, emerged as a key factor influencing the spatial variability of this component. Municipalities without access to such support recorded the lowest values for this component (Table S3).

4.4. LCRI for the Viticulture Sector

The results of the LCRI indicate a challenging outlook for the Chilean viticulture sector, with a projected increase in risk levels, mainly for semi-arid and mediterranean regions, primarily driven by the growing sensitivity of areas suitable for grapevine production (Table 6 and Table S4, Figure 6a). This trend aligns with global patterns showing increased vulnerability in traditional wine-producing areas, largely due to reduced water availability and rising extreme temperatures [86]. However, the decrease in climate risk values observed in certain municipalities within mediterranean and temperate climate zones in the southern part of the study area suggests a potential reconfiguration of the areas suitable for viticulture in the future (Table 6 and Table S4, Figure 6b). This may present new opportunities for the expansion of grapevine production in regions that were previously less exploited [13,87].
The findings of this study underscore the importance of region-specific adaptation policies, with an emphasis on strengthening water infrastructure and developing climate-resilient technologies [88]. Key factors, such as irrigated areas, the technological advancement of irrigation system efficiency, and the construction of water infrastructure, coupled with financing and training programs, will be critical for the viticulture sector’s adaptation to the impacts of climate change [66,80,81,84,89]. Transformative strategies should also be implemented to strengthen governance, optimize infrastructure, protect ecosystems, and enhance the resilience [90] of the viticulture sector’s resilience to climate change.
The use of a climate risk index enables decision-makers to identify trends, assess risks, and formulate mitigation and adaptation strategies based on local data while allowing ongoing monitoring over time [24,91]. However, this tool has some limitations, such as difficulty in accessing reliable data, as well as inconsistencies in some cases. In some cases, data of interest were segmented across various state agencies, institutions, or services, which led to slight variations in the cadasters and reports compiled by each agency. These discrepancies may have arisen from differences in data collection periods at the time the reports were generated, as well as the varying focus and objectives of each study. Additionally, some indicators, such as irrigation infrastructure and participation in financing and irrigation programs, lacked sufficient data at the municipal level. These indicators were obtained through public information requests to the respective institutions, which resulted in delays in data incorporation.

5. Conclusions

This study developed and applied an LCRI to assess the vulnerability of the Chilean viticulture sector to climate change. For the current period (2017–2024), 30.91% of municipalities were classified as having a “low” risk level, 56.36% as “medium”, and 12.73% as “high”. In contrast, for the future period (2046–2065), 63.03% of viticulture municipalities are expected to experience increased climate risk values, particularly in semi-arid and mediterranean regions, due to heightened climate exposure and sensitivity, due to the projected increase in temperatures and decrease in rainfall. In these municipalities, the irrigation zone and irrigation infrastructure indicators within the exposure component were decisive, whereas the climatic suitability indicator played a key role in the sensitivity component. However, 14.55% of municipalities showed an improvement in their climate risk index values, whereas 22.42% showed no change, suggesting that certain local adaptation strategies already implemented may partially mitigate the impacts of climate change. In these municipalities, factors such as water infrastructure (reservoirs) and access to support programs emerged as critical differentiators.
Sensitivity emerged as the most influential component in the climate risk index, primarily linked to the reduction in suitable areas for grapevine cultivation. Due to climate change, a shift in climate suitability is expected toward the southern part of the study area, where mediterranean and temperate climates currently predominate, thus creating new opportunities for the viticulture industry.
These findings highlight the urgent need to strengthen climate change adaptation policies, focusing on efficient water management, the construction of irrigation infrastructure, the implementation of efficient irrigation systems, the promotion of sustainable agricultural practices, and the development of local strategies to enhance adaptive and response capabilities in viticulture municipalities. In this context, the LCRI is presented as a valuable tool to assist decision-makers in assessing risks, planning mitigation and adaptation strategies, and monitoring their effectiveness over time.

Supplementary Materials

The following supporting information can be downloaded at: https://www.mdpi.com/article/10.3390/agriculture15121322/s1: Table S1. The exposure component of the current (2017–2024) and future (2046–2065) periods in the viticulture municipalities between the Atacama and Biobío regions in Chile; Table S2. The sensitivity component of the current (2017–2024) and future (2046–2065) periods in the viticulture municipalities between the Atacama and Biobío regions in Chile; Table S3. The adaptative and response capacity components of the viticulture municipalities between the Atacama and Biobío regions in Chile; Table S4. The local climate risk index (LCRI) for the current (2017–2024) and future (2046–2065) periods in the viticulture municipalities between the Atacama and Biobío regions in Chile.

Author Contributions

Conceptualization, K.C.-Z. and M.P.; formal analysis, K.C.-Z., D.C., J.S. and M.P.; investigation, K.C.-Z. and J.S.; methodology, K.C.-Z., D.C., J.S. and M.P.; resources, M.P.; supervision, M.P.; writing—original draft, K.C.-Z. and J.S.; writing—review and editing, M.P. All authors have read and agreed to the published version of the manuscript.

Funding

This work was funded by Agroenergía Ingeniería Genética S.A. (Santiago, Chile).

Institutional Review Board Statement

Not applicable.

Data Availability Statement

All data are available in the main text, Supplementary Materials, public databases, or referenced permanent online repositories.

Conflicts of Interest

The authors declare no conflicts of interest. The funders had no role in the design of the study; in the collection, analysis, or interpretation of data; in the writing of the manuscript; or in the decision to publish the results.

Abbreviations

The following abbreviations are used in this manuscript:
LCRILocal climate risk index
ADAdaptive capacity component
GDPGross domestic product
REResponse capacity component
EXExposure component
SESensitivity component

References

  1. Agraso-Otero, A.; Cancela, J.J.; Vilanova, M.; Ugarte Andreva, J.; Rebolledo-Leiva, R.; González-García, S. Assessing the environmental sustainability of organic wine grape production with qualified designation of origin in la Rioja, Spain. Agriculture 2025, 15, 536. [Google Scholar] [CrossRef]
  2. Oficina de Estudios y Políticas Agrarias (ODEPA). Superficie y Producción de Vides Para Vinificación, de Mesa y Pisqueras. Available online: https://hdl.handle.net/20.500.12650/73265 (accessed on 10 April 2025). (In Spanish).
  3. Oficina de Estudios y Políticas Agrarias (ODEPA). Panorama de la Agricultura Chilena; ODEPA: Santiago, Chile, 2019; pp. 1–36. (In Spanish) [Google Scholar]
  4. Wines of Chile. Aporte del Vino a la Economía y Desarrollo de Chile. 2023. Available online: https://www.winesofchile.org/winegrowing-regions/ (accessed on 10 April 2025). (In Spanish).
  5. Wines of Chile—ANIAE. Vendimia 2022: Informe Ejecutivo; Asociación Nacional de Ingenieros Agrónomos Enólogos de Chile (ANIAE): Santiago, Chile, 2022; pp. 1–23. (In Spanish) [Google Scholar]
  6. De la Fuente, M. Análisis de Exportaciones de Uva de Mesa Negra Iniagrape-one (Maylen); Instituto Nacional de Investigaciones Agropecuarias (INIA): Santiago, Chile, 2021; pp. 4–8. (In Spanish) [Google Scholar]
  7. Sarricolea, P.; Herrera-Ossandon, M.; Meseguer-Ruiz, Ó. Climatic regionalisation of continental Chile. J. Maps 2017, 13, 66–73. [Google Scholar] [CrossRef]
  8. Rojas, G. La Geografía del Vino Chileno; Vinífera: Santiago, Chile, 2019; pp. 64–112. (In Spanish) [Google Scholar]
  9. Arribillaga, D. Investigación y desarrollo en vides: Vitivinicultura en la zona más austral del mundo. In Investigación y Desarrollo en Vides; García, M., Barba, P., Sellés, G., Eds.; Instituto Nacional de Investigaciones Agropecuarias (INIA): Santiago, Chile, 2020; p. 56. (In Spanish) [Google Scholar]
  10. Reyes, M. Elementos del clima y su influencia en la producción vitivinícola: Referencias para el secano. In Condiciones Edafoclimáticas y Productos Enológicos en el Valle del Itata; Claret, M., Reyes, M., Ruiz, S., Eds.; Instituto de Investigaciones Agropecuarias (INIA): Chillán, Chile, 2020; pp. 189–200. (In Spanish) [Google Scholar]
  11. Ruiz-García, L.; Romero, P.; Tornel, M.; Menéndez, C.; Cabello, F.; Martínez-Cutillas, A. La viticultura frente al cambio climático: Adaptación y estrategias de mejora. In Influencia del Cambio Climático en la Mejora Genética de Plantas; Brunton, J., Tornero, O., Terrer, J., García, L., Sánchez, E., Eds.; Compobell SL: Murcia, Spain, 2018; pp. 165–196. (In Spanish) [Google Scholar]
  12. Zurita-Silva, A.; Díaz, I.; Verdugo, N.; Mejía, N. Desafíos de la viticultura en escenario de cambio climático. Rev. Campo Technol. 2020, 16, 38–41. (In Spanish) [Google Scholar]
  13. Salazar, C.; Reyes, M. Efectos del cambio climático en la vitivinicultura y alternativas para asegurar la sustentabilidad y calidad del viñedo en el Valle Central. In Preparando la Agricultura para el Cambio Climático; Instituto Nacional de Investigaciones Agropecuarias (INIA), Ed.; Ministerio de Agricultura, Gobierno de Chile: Santiago, Chile, 2020; pp. 39–41. (In Spanish) [Google Scholar]
  14. Reyes, M.; Salazar, M. Ciclo de Charlas sobre Viticultura y Cambio Climático 2020–2022: Ensayos en Incremento de Temperatura; Instituto Nacional de Investigaciones Agropecuarias (INIA): Santiago, Chile, 2021; pp. 1–8. (In Spanish) [Google Scholar]
  15. Acuña, I.; Navarro, P.; Madariaga, M. Plagas agrícolas y cambio climático: Desafíos y manejo. In Preparando la Agricultura para el Cambio Climático; Instituto Nacional de Investigaciones Agropecuarias (INIA), Ed.; Ministerio de Agricultura, Gobierno de Chile: Santiago, Chile, 2020; pp. 21–25. (In Spanish) [Google Scholar]
  16. Van Leeuwen, C.; Sgubin, G.; Bois, B.; Ollat, N.; Swingedouw, D.; Zito, S.; Gambetta, G.A. Climate change impacts and adaptations of wine production. Nat. Rev. Earth Environ. 2024, 5, 258–275. [Google Scholar] [CrossRef]
  17. Verdugo-Vásquez, N.; Orrego, R.; Gutiérrez-Gamboa, G.; Reyes, M.; Zurita Silva, A.; Balbontín, C.; Salazar-Parra, C. Climate trends and variability in the Chilean viticultural production zones during 1985–2015. OENO One 2023, 57, 345–362. [Google Scholar] [CrossRef]
  18. Araya-Osses, D.; Casanueva, A.; Román-Figueroa, C.; Uribe, J.M.; Paneque, M. Climate change projections of temperature and precipitation in Chile based on statistical downscaling. Clim. Dyn. 2020, 54, 4309–4330. [Google Scholar] [CrossRef]
  19. Resco, P. Viticultura y Cambio Climático en España: Vulnerabilidad en las Distintas Regiones y Estrategias de Adaptación Frente al Desarrollo de Nuevas Políticas. Ph.D. Thesis, Universidad Politécnica de Madrid, Madrid, Spain, 2015. [Google Scholar]
  20. Olcina Cantos, J.; Vera-Rebollo, J.F. Adaptación del sector turístico al cambio climático en España. La importancia de las acciones a escala local y en empresas turísticas. An. Geogr. Univ. Complut. 1970, 36, 321–349. (In Spanish) [Google Scholar] [CrossRef]
  21. Billi, M.; Garreaud, R. Cápsula Climática: ¿Qué es el Riesgo Climático? Centro de Ciencia del Clima y la Resiliencia (CR2), Universidad de Chile: Santiago, Chile. 2020. Available online: https://leycambioclimatico.cl/capsula-climatica-que-es-el-riesgo-climatico/ (accessed on 23 May 2025). (In Spanish).
  22. Centro de Ciencia del Clima y la Resiliencia (CR2). Marco de Evaluación de la Vulnerabilidad; Centro de Ciencia del Clima y la Resiliencia (CR)2: Santiago, Chile, 2018; pp. 5–26. (In Spanish) [Google Scholar]
  23. Intergovernmental Panel on Climate Change (IPCC). Climate Change 2014: Impacts, Adaptation, and Vulnerability. Part A: Global and Sectoral Aspects. Contribution of Working Group II to the Fifth Assessment Report of the Intergovernmental Panel on Climate Change; Cambridge University Press: Cambridge, UK; New York, NY, USA, 2014; pp. 3–13. [Google Scholar]
  24. Boer, R.; Rakhman, A.; Faqih, A.P.; Situmorang, A.P. Village Vulnerability and Climate Risk Index; UNDP-SPARC Project: East Nusa Tenggara; Kementerian Lingkungan Hidup and Kehutanan: Kajarta, Indonesia, 2015; pp. 1–17. [Google Scholar]
  25. Organización de las Naciones Unidas para la Alimentación y la Agricultura (FAO)—Programa de las Naciones Unidas para el Desarrollo (UNDP). Módulo 8.2: Índices de Vulnerabilidad; FAO-UNDP: Rome, Italy, 2021; pp. 2–17. (In Spanish) [Google Scholar]
  26. Bohórquez-Piña, P. Climate risk index: The measurement of climate change adaptation in Bogotá. A new methodology for largest urban agglomeration. Rev. Interdisc. Est. Cienc. Basic Ing. 2024, 11, 2. [Google Scholar] [CrossRef]
  27. Adil, L.; Eckstein, D.; Kuenzel, V.; Schaefer, L. Climate Risk Index 2025—Who Suffers Most from Extreme Weather Events? 2025. Available online: http://www.germanwatch.org/en/93013 (accessed on 22 May 2025).
  28. Haro, A.; Mendoza-Ponce, A.; Calderón-Bustamante, O.; Velasco, J. Evaluating risk and possible adaptations to climate change under a socio-ecological system approach. Front. Clim. 2021, 3, 674693. [Google Scholar] [CrossRef]
  29. Ministerio de Medio Ambiente (MMA). Atlas de Riesgos Climáticos: Marco Metodológico ARClim; Ministerio de Medio Ambiente, Gobierno de Chile: Santiago, Chile, 2020; p. 12. (In Spanish) [Google Scholar]
  30. Montalba, R.; Fonseca, F.; García, M.; Vieli, L.; Altieri, M. Determinación de los niveles de riesgo socioecológico ante sequías en sistemas agrícolas campesinos de la Araucanía chilena. Influencia de la diversidad cultural y la agrobiodiversidad. Pap. Rev. Sociol. 2015, 100, 607–624. (In Spanish) [Google Scholar] [CrossRef]
  31. Centro de Información de Recursos Naturales (CIREN). Catastro Frutícola 2022: Principales Resultados Región del Maule/Septiembre 2022; Oficina de Estudios y Políticas Agropecuarias (ODEPA), Ministerio de Agricultura, Gobierno de Chile: Santiago, Chile, 2022; pp. 10–35. (In Spanish) [Google Scholar]
  32. Servicio Agrícola Ganadero (SAG). Informe Catastro Vitícola Nacional 2022; Ministerio de Agricultura, Gobierno de Chile: Santiago, Chile, 2023. Available online: https://www.sag.gob.cl/content/catastro-viticola-nacional-2022 (accessed on 13 April 2025). (In Spanish)
  33. Yáñez, L. Ficha Nacional: Actualización Agosto 2024; Oficina de Estudios y Políticas Agrarias (ODEPA): Santiago, Chile, 2024; pp. 3–16. (In Spanish) [Google Scholar]
  34. Organización de las Naciones Unidas para la Alimentación y la Agricultura (FAO). Diagnóstico Nacional de Montaña: Fortalecimiento de la Gestión Participativa para el Desarrollo Sostenible de los Andes: Informe Chile; Food and Agriculture Organization: Santiago, Chile, 2012; pp. 11–13. (In Spanish) [Google Scholar]
  35. Montalba, R.; García, M.; Altieri, M.; Fonseca, F.; Vieli, L. Utilización de Índice Holístico de Riesgo (IHR) como medida de resiliencia socioecológica a condiciones de escasez de recursos hídricos: Aplicación en comunidades campesinas e indígenas de la Araucanía, Chile. Agroecología 2013, 8, 63–70. (In Spanish) [Google Scholar]
  36. Altieri, M.A.; Nicholls, C.I. The adaptation and mitigation potential of traditional agriculture in a changing climate. Clim. Change 2017, 140, 33–45. [Google Scholar] [CrossRef]
  37. Climate and Development Knowledge Network (CDKN). Análisis Interinstitucional y Multisectorial de Vulnerabilidad y Adaptación al Cambio Climático para el Sector Agrícola de la Cuenca del Río Cauca: Impactando Políticas de Adaptación; CDKN: Cartagena, Colombia, 2013; pp. 1–3. (In Spanish) [Google Scholar]
  38. Santibáñez, F.; Santibáñez, P.; Solis, L. Análisis de Vulnerabilidad del Sector Silvoagropecuario, Recursos Hídricos y Edáficos de Chile Frente a Escenarios de Cambio Climático; AGRIMED, Facultad de Ciencias Agronómicas, Universidad de Chile: Santiago, Chile, 2008; pp. 9–30. (In Spanish) [Google Scholar]
  39. García-Hidalgo, Y. Índice de vulnerabilidad del recurso hídrico con fines de riego en la cuenca hidrográfica del Río Naranjo, Cuba. Rev. Geogr. Am. Cent. 2017, 1, 315–330. (In Spanish) [Google Scholar] [CrossRef]
  40. Ehsani, N.; Vörösmarty, C.J.; Fekete, B.M.; Stakhiv, E.Z. Reservoir operations under climate change: Storage capacity options to mitigate risk. J. Hydrol. 2017, 555, 435–446. [Google Scholar] [CrossRef]
  41. Demissew, W.L.; Zeleke, T.T.; Ture, K.; Mengistu, D.K.; Fufa, M.A. Agroclimatic indicator analysis under climate change conditions to predict the climatic suitability for wheat production in the Upper Blue Nile Basin, Ethiopia. Agriculture 2025, 15, 525. [Google Scholar] [CrossRef]
  42. Phillips, S.J.; Anderson, R.P.; Schapire, R.E. Maximum entropy modeling of species geographic distributions. Ecol. Modell. 2006, 190, 231–259. [Google Scholar] [CrossRef]
  43. Zhou, Z.; Liu, X.; Liu, R.; Liu, J.; Liu, W.; Yang, Q.; Luo, X.; Wang, R.; Xing, L.; Zhao, H.; et al. Sugarcane distribution simulation and climate change impact analysis in China. Agriculture 2025, 15, 491. [Google Scholar] [CrossRef]
  44. Ferrer, M.; Pedocchi, R.; Michelazzo, M.; González-Neves, G.; Carbonneau, A. Delimitación y descripción de regiones vitícolas del Uruguay en base al método de clasificación climática multicriterio utilizando índices bioclimáticos adaptados a las condiciones del cultivo. Agrociencia 2007, 11, 47–56. (In Spanish) [Google Scholar] [CrossRef]
  45. Uribe, J.; Cabrera, R.; De la Fuente, A.; Paneque, M. Atlas Bioclimático de Chile; Universidad de Chile: Santiago, Chile, 2012; pp. 10–26. (In Spanish) [Google Scholar]
  46. Reyes, M.; Arribillaga, D. Capítulo 8. Grados días y fenología en vides. In Descripción y Usos de la Red de Agrometeorología; Chacón, G., Ed.; Instituto Nacional de Investigaciones Agropecuarias (INIA): Santiago, Chile, 2019; pp. 72–79. (In Spanish) [Google Scholar]
  47. Gómez, J.; Morales, L. Algunas Consideraciones Sobre el Concepto de Horas-Frío y Sus Métodos de Cálculo: Alternativa en su Estudio; Colegio de Geografía: Mexico City, Mexico, 2020; pp. 1–4. (In Spanish) [Google Scholar]
  48. Brouwer, C.; Heibloem, M. Irrigation water management: Irrigation water needs. In Training Manual; Food and Agriculture Organization of the United Nations (FAO): Rome, Italy, 1986; pp. 65–70. [Google Scholar]
  49. Martínez-Cob, A.; Tejero-Juste, M. A wind-based qualitative calibration of the Hargreaves ET0 estimation equation in semiarid regions. Agric. Water Manag. 2004, 64, 251–264. [Google Scholar] [CrossRef]
  50. Hargreaves, G.H.; Samani, Z.A. Estimating potential evapotranspiration. J. Irrig. Drain. Div. 1982, 108, 225–230. [Google Scholar] [CrossRef]
  51. Allen, R.; Pereira, L.; Raes, D.; Smith, M. Crop Evapotranspiration: Guidelines for Computing Crop Water Requirements; Food and Agriculture Organization of the United Nations (FAO): Rome, Italy, 1998; Volume 56. [Google Scholar]
  52. Hernández, J.; Galleguillos, M.; Estades, C. Mapa de Cobertura de Suelos de Chile 2014: Descripción del Producto; Laboratorio de Geomática y Ecología de Paisaje (GEP), Facultad de Ciencias Forestales y de la Conservación de la Naturaleza, Universidad de Chile: Santiago, Chile, 2016; pp. 1–4. (In Spanish) [Google Scholar]
  53. Organización de las Naciones Unidas para la Alimentación y la Agricultura (FAO). El Clima Injusto: Medir el Impacto del Cambio Climático en la Población Rural Pobre, las Mujeres y los Jóvenes; Food and Agriculture Organization: Rome, Italy, 2024. (In Spanish) [Google Scholar] [CrossRef]
  54. Grupo Banco Mundial. Riego Resiliente Frente al Clima; World Bank Group (Grupo Banco Mundial): Washington, DC, USA, 2022; Available online: https://www.bancomundial.org/es/topic/climate-resilient-irrigation (accessed on 10 April 2025). (In Spanish)
  55. Eekhout, J.P.C.; de Vente, J. Global impact of climate change on soil erosion and potential for adaptation through soil conservation. Earth Sci. Rev. 2022, 226, 103921. [Google Scholar] [CrossRef]
  56. Aro, E. Determinación de la Vulnerabilidad del Sector Frutícola al Cambio Climático en las Comunas de la Región de Coquimbo. Bachelor’s Thesis, Universidad de Chile, Santiago, Chile, 2020. (In Spanish). [Google Scholar]
  57. Antúnez, A.; Mora, D.; Felmer, S.; de O’Higgins, R. Eficiencia por sistemas de riego por goteo en el secano. INIA Tierra Adentro 2010, 88, 40–43. (In Spanish) [Google Scholar]
  58. Otero, A.; García, C. Capítulo 10. Eficiencia en el uso del agua: Estrategias de manejo del agua de riego. In Aportes Científicos y Tecnológicos del INIA del Uruguay a las Trayectorias Agroecológicas; Instituto Nacional de Investigación Agropecuaria (INIA), Ed.; INIA: Montevideo, Uruguay, 2024; pp. 197–211. (In Spanish) [Google Scholar]
  59. Córdoba-Vargas, C.; León-Sicard, T. Resiliencia de Sistemas Agrícolas Ecológicos y convencionales frente a la variabilidad climática en Anolaima (Cundinamarca Colombia). Agroecología 2013, 8, 21–32. (In Spanish) [Google Scholar]
  60. Graveline, N.; Grémont, M. The role of perceptions, goals and characteristics of wine growers on irrigation adoption in the context of climate change. Agric. Water Manag. 2021, 250, 106837. [Google Scholar] [CrossRef]
  61. Naulleau, A.; Gary, C.; Prévot, L.; Hossard, L. Evaluating strategies for adaptation to climate change in grapevine production–A systematic review. Front. Plant. Sci. 2020, 11, 607859. [Google Scholar] [CrossRef]
  62. Peredo Parada, S.; Vela Campoy, M.; Jiménez Gómez, A. Determinación de los niveles de resiliencia/vulnerabilidad en iniciativas de agroecología urbana en el suroeste andaluz. Idesia 2016, 34, 5–13. (In Spanish) [Google Scholar] [CrossRef]
  63. Feres, J.C.; Mencero, X. (Eds.) Enfoques para la Medición de Pobreza: Breve Revisión de la Literatura; Serie 4: Estudios Estadísticos y Prospectivos; Comisión Económica Para América Latina y El Caribe (CEPAL); Organización de Naciones Unidas (ONU): Santiago, Chile, 2001; pp. 9–18. (In Spanish) [Google Scholar]
  64. Del Callejo, I.; Ampuero, R. Capítulo 4. Sistemas productivos y medios de sustento: Vulnerabilidad y estrategias de respuesta frente a la sequía. In Agua y Medios de Vida: Vulnerabilidad de los Sistemas Hídricos y Sistemas Productivos en el Chaco Cruceño; Centro AGUA-UMSS; Acción Contra el Hambre: Cochabamba, Bolivia, 2013; p. 132. (In Spanish) [Google Scholar]
  65. Adler, F. Los embalses y los recursos hídricos superficiales. Rev. Cienc. Exactas Ing. 2006, 27, 1–12. (In Spanish) [Google Scholar]
  66. Espinoza, M. Embalses Como Infraestructura de Resistencia a la Sequía y Configuradores de Paisaje: Estrategias para su Integración y Resiliencia en el Paisaje del Agua: El caso de Embalse Puclaro. Master’s Thesis, Pontificia Universidad Católica de Chile, Santiago, Chile, 2022. (In Spanish). [Google Scholar]
  67. Wassmann, R.; Villanueva, J.; Khounthavong, M.; Okumu, B.O.; Vo, T.B.T.; Sander, B.O. Adaptation, mitigation and food security: Multi-criteria ranking system for climate-smart agriculture technologies illustrated for rainfed rice in Laos. Glob. Food Secur. 2019, 23, 33–40. [Google Scholar] [CrossRef]
  68. Organización Internacional del Vino (OIV). Protocolo de la OIV para el Uso Sostenible del Agua en la Viticultura; OIV: Paris, France, 2018; Available online: https://www.oiv.int/es/node/3132/download/pdf (accessed on 13 April 2025). (In Spanish)
  69. Tamburini, G.; Bommarco, R.; Wanger, T.C.; Kremen, C.; van der Heijden, M.G.A.; Liebman, M.; Hallin, S. Agricultural diversification promotes multiple ecosystem services without compromising yield. Sci. Adv. 2020, 6, eaba1715. [Google Scholar] [CrossRef]
  70. Pastén-Valdés, P. Planificación y Resiliencia en Zonas de Riesgo. Estudio de Caso Comuna de Constitución Urbana, VII Región del Maule, post 27F. Master’s Thesis, Universidad de Chile, Santiago, Chile, 2016. (In Spanish). [Google Scholar]
  71. Álvarez-Garretón, C.; Boisier, J.P.; Blanco, G.; Billi, M.; Nicolas-Artero, C.; Maillet, A.; Aldunce, P.; Urrutia-Jalabert, R.; Zambrano-Bigiarini, M.; Guevara, G.; et al. Seguridad Hídrica en Chile: Caracterización y Perspectivas de Futuro; Centro de Ciência del Clima y la Resiliencia: Santiago, Chile, 2023; Volume CR2, pp. 12–13. (In Spanish) [Google Scholar]
  72. Easton-Vargas, G.; Pérez, S.; Aldunce, P. (Eds.) Aluviones y Resiliencia en Atacama. Construyendo Saberes Sobre Riesgos y Desastres; Social-Ediciones; Facultad de Ciencias Sociales, Universidad de Chile: Santiago, Chile, 2018; pp. 16–17. (In Spanish) [Google Scholar] [CrossRef]
  73. Stehr, A.; Álvarez, C.; Álvarez, P.; Arumí, J.L.; Baeza, C.; Barra, R.; Berroeta, C.A.; Castillo, Y.; Chiang, G.; Cotoras, D.; et al. Recursos Hídricos en Chile: Impactos y Adaptación al Cambio Climático; Informe de la Mesa Agua; Comité Científico COP25, Ministerio de Ciencia, Tecnología, Conocimiento e Innovación, Gobierno de Chile: Santiago, Chile, 2019; pp. 36–38. (In Spanish) [Google Scholar]
  74. Reyes, M.; Salazar, C. Heladas en vides. In Heladas. Factores Atmosféricos, Tendencias y Efectos en Frutales y Vides; Bravo, R., Muñoz, M., Quintana, J., Eds.; Instituto Nacional de Investigaciones Agropecuarias (INIA): Santiago, Chile, 2020; pp. 55–70. (In Spanish) [Google Scholar]
  75. Moreiras, S.M.; Sepúlveda, S.A.; Correas-González, M.; Lauro, C.; Vergara, I.; Jeanneret, P.; Junquera-Torrado, S.; Cuevas, J.G.; Maldonado, A.; Antinao, J.L.; et al. Debris Flows Occurrence in the Semiarid Central Andes Under Climate Change Scenario. Geosciences 2021, 11, 43. [Google Scholar] [CrossRef]
  76. Jorqueta-Fontena, E.; Orrego-Verdugo, R. Impacto del calentamiento global en la fenología de una variedad de vid cultivada en el sur de Chile. Agrociencia 2010, 44, 427–435. (In Spanish) [Google Scholar]
  77. Giraldo, C. Escenarios de la Vitivinicultura Chilena Generados por los Cambios en la Aptitud Productiva, Como Consecuencia del Cambio Climático para Mediados del Siglo XXI. Master’s Thesis, Universidad de Chile, Santiago, Chile, 2017. [Google Scholar]
  78. Faralli, M.; Mallucci, S.; Bignardi, A.; Varner, M.; Bertamini, M. Four decades in the vineyard: The impact of climate change on grapevine phenology and wine quality in northern Italy. OENO One 2024, 58, 8083. [Google Scholar] [CrossRef]
  79. Williamson, J.A.; Petrone, R.M.; Valentini, R.; Macrae, M.L.; Reynolds, A. Assessing the influence of climate controls on grapevine biophysical responses: A review of Ontario viticulture in a changing climate. Can. J. Plant Sci. 2024, 104, 394–409. [Google Scholar] [CrossRef]
  80. Selles, G.; Ferreyra, R.; Contreras, G. Manejo de Riego por Goteo en Uva de Mesa (Vitis vinifera L.) cv. Thompson Seedless Cultivada en Suelos de Textura Fina; Comisión Nacional de Riego (CNR): Santiago, Chile, 2002; pp. 180–189. (In Spanish) [Google Scholar]
  81. Shock, C.; Welch, T. El Riego por Goteo: Una Introducción. Técnicas para la Agricultura Sostenible; EM 8782-S; Oregon State University: Corvallis, OR, USA, 2013; pp. 1–7. (In Spanish) [Google Scholar]
  82. Xu, W.; Zhong, Z.; Proverbs, D.; Xiong, S.; Zhang, Y. Enhancing the resilience of the management of water resources in the agricultural supply chain. Water 2021, 13, 1619. [Google Scholar] [CrossRef]
  83. Fundación para la Innovación Agraria (FIA). Resultados y lecciones. In Programa de Eficiencia Hídrica para la Pequeña Agricultura de la Región de Valparaíso, Serie Experiencias de Innovación para el Emprendimiento Agrario, Nº 159; FIA: Santiago, Chile, 2022; pp. 21–69. (In Spanish) [Google Scholar]
  84. Orteaga, J.; Foster, W.; Valdés, A. Capítulo 5. La Agriculltura Familiar en Chile: Cambios recientes y políticas para su contribución al desarrollo nacional. In Estudio: Desafíos de la Agricultura y Desarrollo Rural en Chile; Valdés, A., Foster, W., Ortega, J., Pérez, R., Vargas, G., Eds.; Oficina de Estudios y Políticas Agrarias (ODEPA), Ministerio de Agricultura, Gobierno de Chile: Santiago, Chile, 2022; pp. 82–87. (In Spanish) [Google Scholar]
  85. Welz, J.; Krellenberg, K. Vulnerabilidad frente al cambio climático en la Región Metropolitana de Santiago de Chile: Posiciones teóricas versus evidencias empíricas. Eure 2016, 42, 251–272. (In Spanish) [Google Scholar] [CrossRef]
  86. Zito, S.; Pergaud, J.; Richard, Y.; Castel, T.; Le Roux, R.; García de Cortázar-Atauri, I.; Quenol, H.; Bois, B. Projected impacts of climate change on viticulture over French wine regions using downscaled CMIP6 multi-model data. OENO One 2023, 57, 419–434. [Google Scholar] [CrossRef]
  87. Castillo, N.; Cavazos, T.; Pavía, E.G. Impact of climate change in Mexican winegrape regions. Int. J. Climatol. 2023, 43, 6621–6642. [Google Scholar] [CrossRef]
  88. Prada, J.; Dinis, L.T.; Soriato, E.; Vandelle, E.; Soletkin, O.; Uysal, Ş.; Dihazi, A.; Santos, C.; Santos, J.A. Climate change impact on Mediterranean viticultural regions and site-specific climate risk-reduction strategies. Mitig. Adapt. Strateg. Glob. Change 2024, 29, 52. [Google Scholar] [CrossRef]
  89. Engler, A. Capítulo 5. Capital social y adopción de tecnologías de Riego. In Tecnologías de Riego en la Producción de Vid Vinifera en Chile: Aspectos Técnicos, Económicos y Sociales; Engler, A., Bopp, C., Jara-Rojas, R., Eds.; Universidad de Talca: Talca, Chile, 2017; pp. 48–51. (In Spanish) [Google Scholar]
  90. Rojas, M.; Aldunce, P.; Farías, L.; González, H.; Marquet, P.A.; Muñoz, J.C.; Palma-Behnke, R.; Stehr, A.; Vicuña, S. (Eds.) Evidencia Científica y Cambio Climático en Chile: Resumen para Tomadores de Decisiones; Comité Científico COP 25, Ministerio de Ciencia, Tecnología; Gobierno de Chile: Santiago, Chile, 2019; pp. 11–14. (In Spanish) [Google Scholar]
  91. Aldunce, P.; Vicuña, S. Adaptación al Cambio Climático en Chile: Brechas y Recomendaciones. Informe de las Mesas Adaptación y Agua; Comité Científico COP25, Ministerio de Ciencia, Tecnología, Conocimiento e Innovación, Gobierno de Chile: Santiago, Chile, 2019; pp. 14–16. (In Spanish) [Google Scholar]
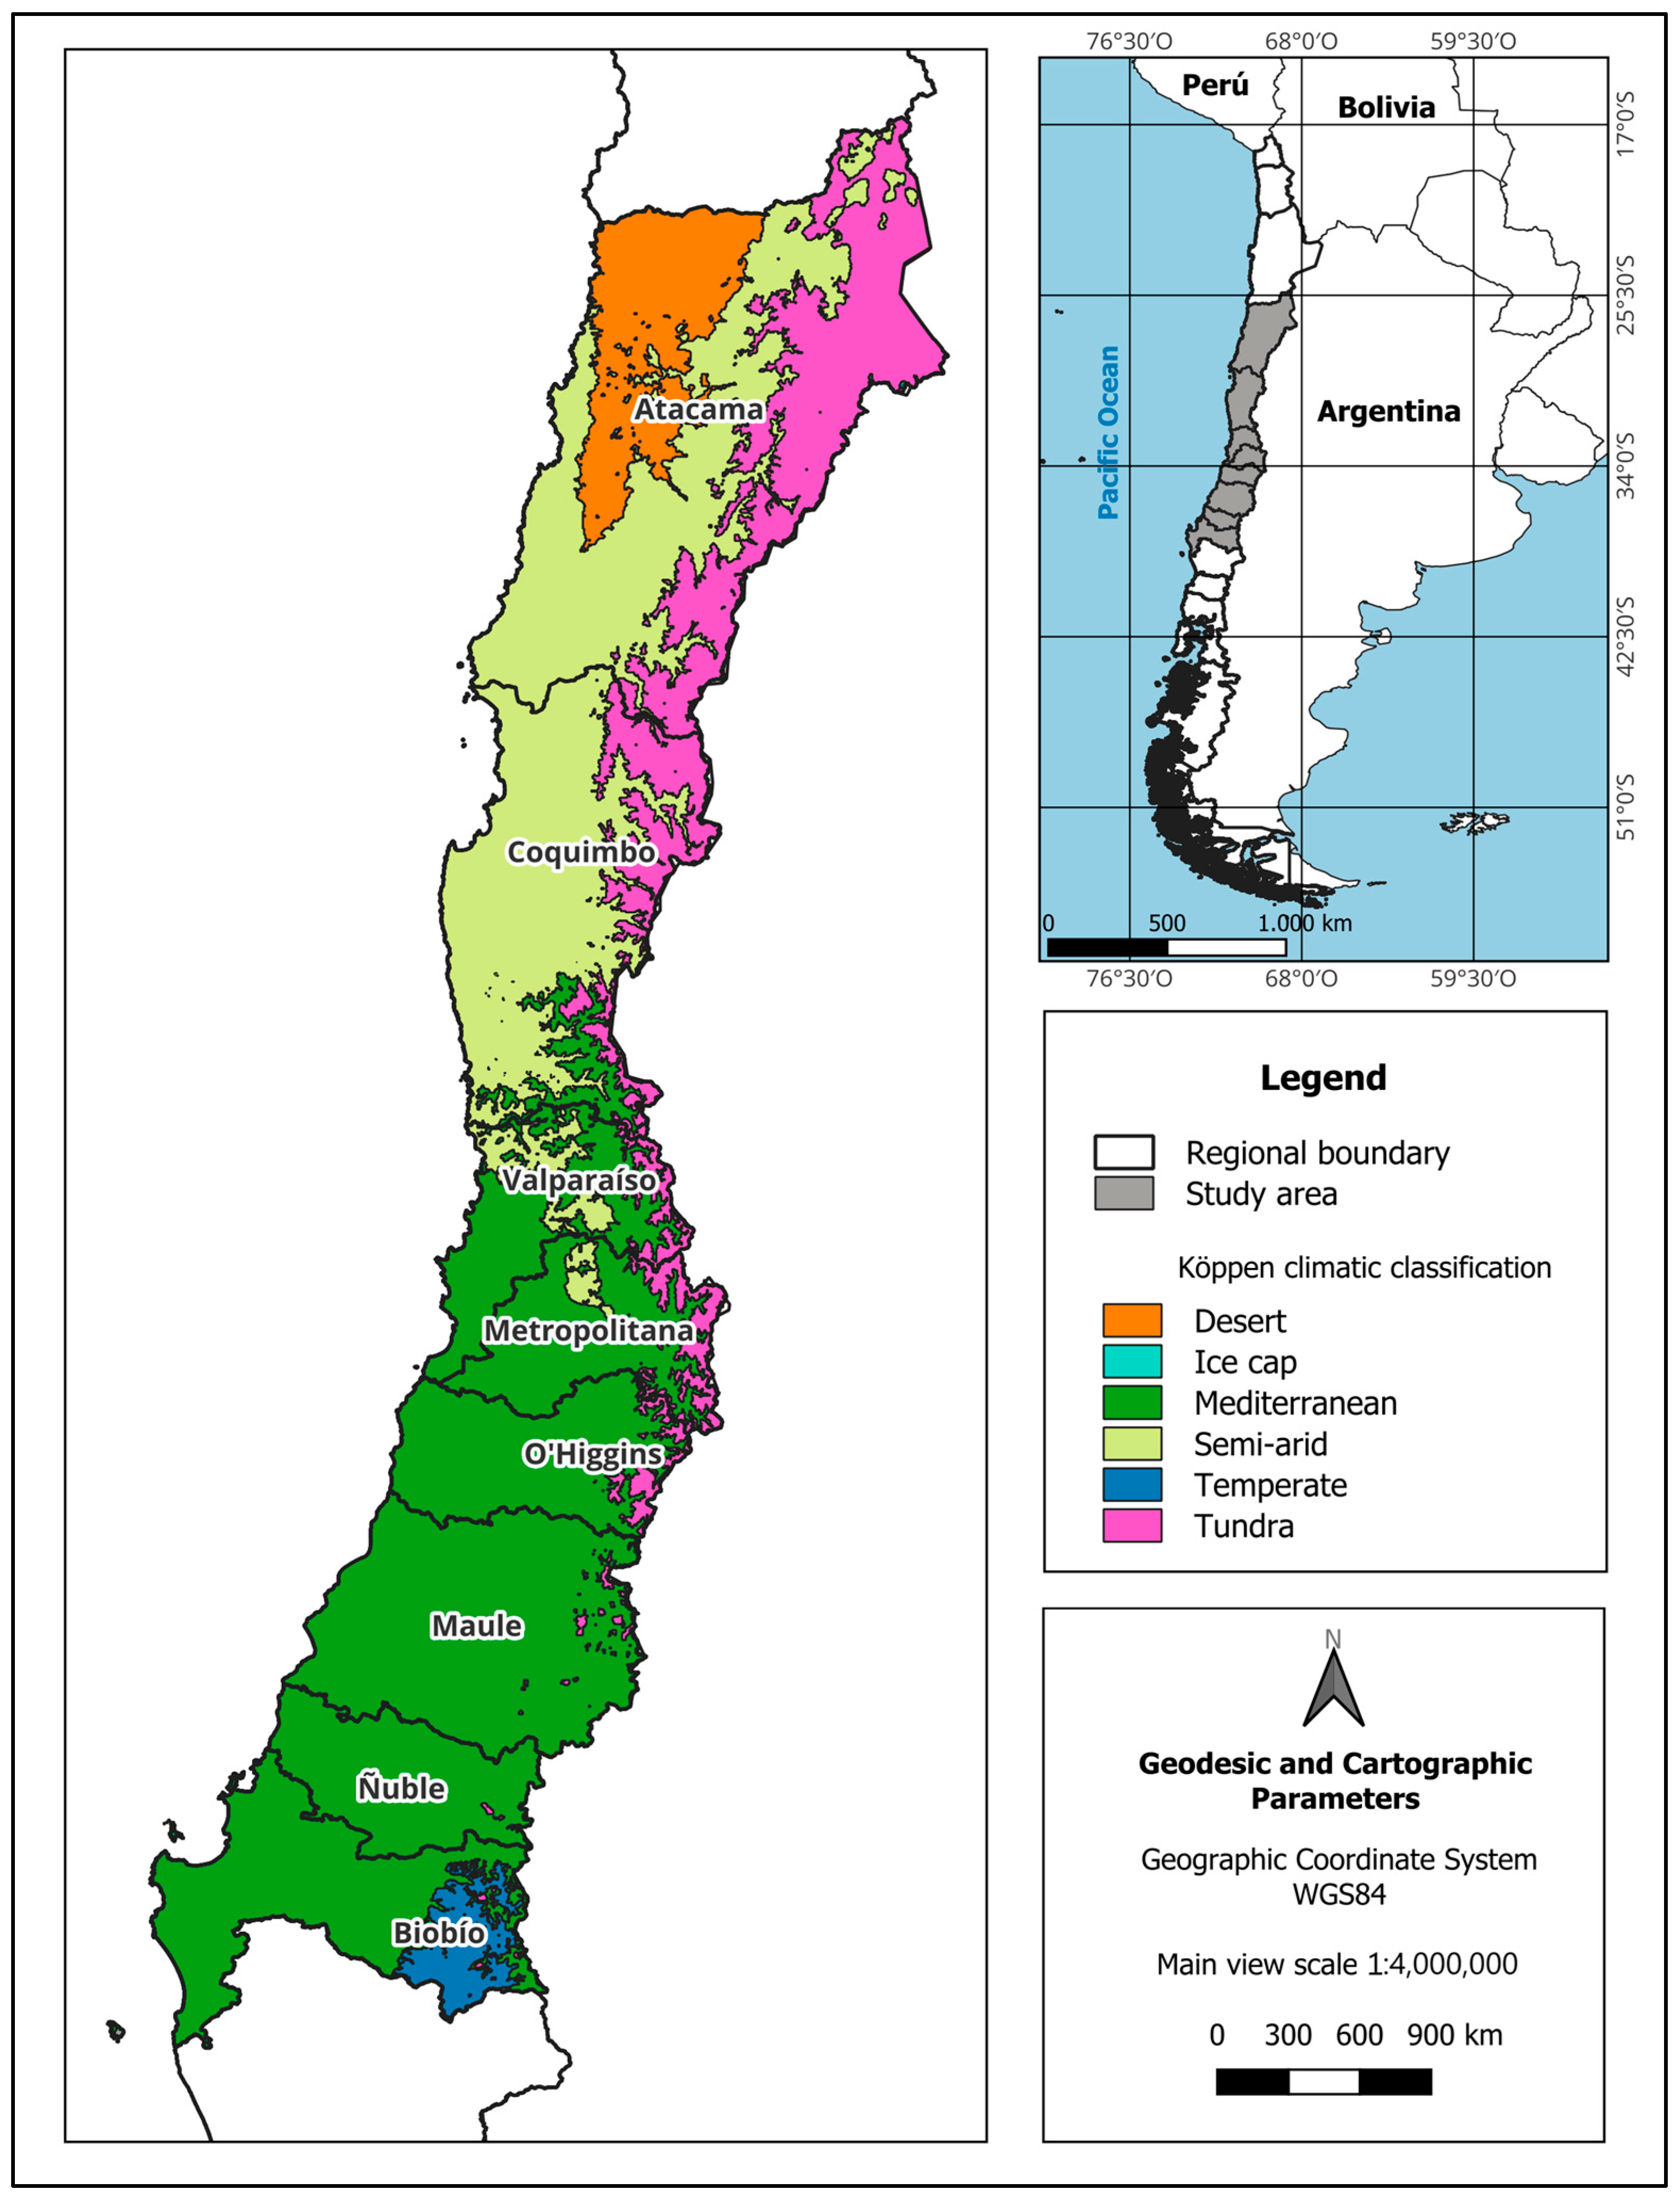
Figure 1. The study area, including 99.90% of Chile’s viticulture. The study area includes the Atacama and Biobío regions and is characterized by the dominant climate of the country.
Agriculture 15 01322 g001
Figure 2. A procedural diagram of the methods used to obtain the LCRI for the viticulture sector in the current (2017–2024) and future (2046–2065) periods.
Agriculture 15 01322 g002
Figure 3. The exposure components of viticulture in the current (a) and future (b) periods between the Atacama and Biobío regions in Chile.
Agriculture 15 01322 g003
Figure 4. The sensitivity components of viticulture in the current (a) and future (b) periods between the Atacama and Biobío regions of Chile.
Agriculture 15 01322 g004
Figure 5. The adaptative capacity (a) and response capacity (b) components of viticulture between the Atacama and Biobío regions of Chile.
Agriculture 15 01322 g005
Figure 6. The LCRI for viticulture in the current (a) and future (b) periods between the Atacama and Biobío regions of Chile.
Agriculture 15 01322 g006
Table 1. The calculation method and scale of values for exposure component indicators.
IndicatorCalculation Expression and Scale of Values
Cultivated area C A = G t a T f m
CA: cultivated area; Gta: total grapevine area; Tfm: total fruit-growing area of the municipality.
Irrigation zone I R = 1 I G T G
IR: irrigation zone; IG: irrigated grapevine area; TG: total grapevine area (irrigated + rainfed).
Irrigation infrastructureScale (dichotomic):
1.00 = No irrigation infrastructure.
0.00 = Irrigation infrastructure.
Table 2. The calculation method and scale of values for sensitivity component indicators.
IndicatorSub IndicatorCalculation Expression and Scale of Values
Climatic suitabilityThermal model C S = R A A A
CS: climatic suitability; RA: restricted area; AA: total agricultural area.
Scale (discrete):
1.00 = Restricted
0.75 = High restriction
0.50 = Moderate restriction
0.25 = Mild restriction
0.00 = No restriction
Water model
Rurality- R U = R P T P
RU: rurality; RP: rural population; TP: total population (urban + rural).
State of water bodies-Scale (discrete):
1.00 = Depleted superficial body
1.00 = Prohibition of extraction from an aquifer
0.50 = Restriction of extraction from an aquifer
0.00 = Without prohibition or restriction.
Eroded surface- E S = S A T A
SE: eroded surface; SA: soil area presenting some degree of erosion; TA: total agricultural area.
Table 3. The calculation methods and scales of values for adaptive capacity component indicators.
IndicatorCalculation Expression and Scale of Values
Irrigation efficiency I R = Ʃ ( K r T n ) T g
IR: irrigation efficiency; Kr: irrigation efficiency coefficient; Tn: total area by type of irrigation; Tg: total irrigated grapevine area.
Values of irrigation efficiency coefficient (Kr):
0.00 = Flood Irrigation
0.20 = Furrow Irrigation
0.40 = Other Traditional Irrigation Methods
0.60 = Sprinkler Irrigation
0.80 = Microjet or Microsprinkler Irrigation
1.00 = Drip or Tape Irrigation
Participation in financing and irrigation programs P F R = F G T F
PFR: participation in INDAP financing and irrigation programs; FG: farmers dedicated to the cultivation of grapevines participating in the program; AT: total farmers by program.
Table 4. The calculation methods and scales of values for response capacity component indicators.
IndicatorCalculation Expression and Scale of Values
State support networksScale (discrete):
1.00 = Presence of INDAP agencies
0.66 = Presence of INDAP offices
0.33 = Without INDAP agency/office presence, but with territorial coverage
0.00 = Absence of state support
Fulfilled basic needs F N = ( L I + S A + H Q + O V + C E ) 5
FN: Fulfilled basic needs
LI: Literacy
SA: Sanitation
OV: Overcrowding
HQ: Housing quality
CE: Level of compulsory education
Table 5. The categories of LCRI for the viticulture sector due to climate change in Chile.
Local Climate Risk LevelValues
Very low0.00–0.20
Low0.21–0.40
Medium0.41–0.60
High0.61–0.80
Very high0.81–1.00
Table 6. The regional averages of exposure, sensitivity, adaptive capacity, response capacity, and LCRI for the viticulture sector in Chile in the current (2017–2024) and future (2046–2065) periods.
Current Period (2017–2024)
Dominant ClimateRegionExposureSensitivityAdaptative
Capacity
Response CapacityLCRI
Semi-aridAtacama0.400.690.340.700.51
Coquimbo0.450.760.430.710.52
Valparaíso0.360.620.410.680.47
MediterraneanMetropolitana0.420.500.300.610.50
O’Higgins0.350.590.400.700.46
Maule0.340.420.400.710.41
Ñuble0.540.400.280.720.48
TemperateBiobío0.510.290.240.680.47
Future period (2046–2065)
Dominant climateRegionExposureSensitivityAdaptative
capacity
Response capacityLCRI
Semi-aridAtacama0.400.730.340.700.52
Coquimbo0.450.810.430.710.53
Valparaíso0.320.660.410.680.47
MediterraneanMetropolitana0.420.570.300.610.52
O’Higgins0.340.650.400.700.47
Maule0.330.440.400.710.42
Ñuble0.520.400.280.720.48
TemperateBiobío0.510.300.240.680.47
Disclaimer/Publisher’s Note: The statements, opinions and data contained in all publications are solely those of the individual author(s) and contributor(s) and not of MDPI and/or the editor(s). MDPI and/or the editor(s) disclaim responsibility for any injury to people or property resulting from any ideas, methods, instructions or products referred to in the content.