Article

DAENet: A Deep Attention-Enhanced Network for Cropland Extraction in Complex Terrain from High-Resolution Satellite Imagery

1
School of Remote Sensing and Information Engineering, Wuhan University, Wuhan 430079, China
2
China Coal Zhejiang Surveying and Mapping Geo-Information Co., Ltd., Hangzhou 311000, China
3
Zhejiang Zhixing Surveying and Mapping Geographic Information Co., Ltd., Hangzhou 311199, China
4
Key Laboratory of Jiang Huai Arable Land Resources Protection and Eco-Restoration, No. 302 Fanhua Avenue, Hefei 230088, China
5
State Key Laboratory of Information Engineering in Surveying, Mapping and Remote Sensing, Wuhan University, Wuhan 430079, China
6
Observation and Research Station of Land Consolidation in Hilly Region of Southeast China, Ministry of Natural Resources, Fuzhou 350024, China
*
Author to whom correspondence should be addressed.
Agriculture 2025, 15(12), 1318; https://doi.org/10.3390/agriculture15121318
Submission received: 21 May 2025 / Revised: 11 June 2025 / Accepted: 16 June 2025 / Published: 19 June 2025
(This article belongs to the Section Digital Agriculture)

Abstract

Prompt and precise cropland mapping is indispensable for safeguarding food security, enhancing land resource utilization, and advancing sustainable agricultural practices. Conventional approaches faced difficulties in complex terrain marked by fragmented plots, pronounced elevation differences, and non-uniform field borders. To address these challenges, we propose DAENet, a novel deep learning framework designed for accurate cropland extraction from high-resolution GaoFen-1 (GF-1) satellite imagery. DAENet employs a novel Geometric-Optimized and Boundary-Restrained (GOBR) Block, which combines channel attention, multi-scale spatial attention, and boundary supervision mechanisms to effectively mitigate challenges arising from disjointed cropland parcels, topography-cast shadows, and indistinct edges. We conducted comparative experiments using 8 mainstream semantic segmentation models. The results demonstrate that DAENet achieves superior performance, with an Intersection over Union (IoU) of 0.9636, representing a 4% improvement over the best-performing baseline, and an F1-score of 0.9811, marking a 2% increase. Ablation analysis further validated the indispensable contribution of GOBR modules in improving segmentation precision. Using our approach, we successfully extracted 25,556.98 hectares of cropland within the study area, encompassing a total of 67,850 individual blocks. Additionally, the proposed method exhibits robust generalization across varying spatial resolutions, underscoring its effectiveness as a high-accuracy solution for agricultural monitoring and sustainable land management in complex terrain.

1. Introduction

Prompt and precise monitoring of cropland is essential for ensuring food security, optimizing land resource distribution, and promoting sustainable agricultural development [1,2,3]. In regions characterized by complex terrain, including undulating slopes, mountainous zones, and elevated plateaus, cropland frequently exhibits high degrees of parcel fragmentation, irregular spatial distribution, and significant altitudinal variation [4,5,6]. These features pose substantial challenges to effective agrarian administration and territorial development strategies [7,8,9]. Furthermore, the existence of abrupt inclines, altitudinal fluctuations, and occlusion phenomena in these areas additionally hinders precise cropland delineation and cartographic representation [10,11,12]. Given these circumstances, high-resolution satellite remote sensing has emerged as a vital tool for the observation and precise mapping of cropland in complex terrain [13,14,15].
Conventional approaches for cropland delineation have primarily relied on spectral indicators derived from optical satellite data, coupled with machine learning-based classification techniques [16,17,18,19]. For instance, spectral-based machine learning algorithms have been extensively employed for delineating specific cropland categories, such as sugarcane and rice, often achieving high accuracy [20,21,22]. Nevertheless, in regions with complex terrain, these conventional methods encounter substantial limitations. Factors such as fragmented cropland, terrain-induced shadows, and spectral mixing reduce the effectiveness of spectral-based techniques in accurately capturing cropland characteristics. Moreover, machine learning approaches that rely on handcrafted feature extraction and statistical classification algorithms frequently demonstrate inadequate adaptability in regions with marked geomorphological diversity. The attention mechanism is widely used in the identification and extraction of land objects, such as the feature extraction of enhanced field and plot boundaries in farmland extraction. Spatial attention focuses on the spatial position and texture and semantic differences by strengthening the contrast characteristics of spatial context and texture to enhance the correlation between pixels. Channel attention allocates spectral bands through adaptive weights to enhance the characteristic expression of typical objects to improve the ability to identify details [23,24,25,26].
In response to these limitations of traditional methods, deep learning has gained increasing traction in recent cropland delineation from earth observation data [27,28,29]. In particular, convolutional neural networks (CNNs) have demonstrated superior feature representation capabilities compared to conventional machine learning approaches [30,31,32]. Deep learning models leverage hierarchical feature representations to more effectively capture the spatial, spectral, and textural characteristics of cropland, thereby improving classification and segmentation accuracy [33,34,35]. Researchers have utilized enhanced and refined deep neural architectures to delineate specific crop types, such as rice, maize, and soybean, using Sentinel-2 and Landsat-8 satellite data [36,37,38]. However, in areas with fragmented cropland and complex terrain, standard deep learning models often struggle to account for irregular parcel geometry, leading to classification errors. These challenges are further exacerbated by the use of moderate-to-coarse resolution satellite data, which hampers the accurate identification of fine cropland features. As a result, very-high-resolution imagery, combined with more sophisticated and terrain-aware deep learning approaches, is essential for achieving reliable cropland delineation in such environments.
In response to the critical need for high-accuracy cropland delineation in complex terrain, this study proposes an attention-enhanced deep learning framework, designated as DAENet, utilizing fused Gaofen-1 (GF-1) satellite data with a spatial resolution of 2 meters, which can capture microscopic features such as cropland and fine plots. The proposed architecture establishes an attention-driven segmentation network specifically engineered to improve cropland feature characterization and enhance model adaptability in complex terrain. More precisely, this research pursues the following principal aims: (1) Proposing a reference dataset for farmland with complex terrain using GF-1 satellite observation data and cadastral records of agricultural plots in typical terrain complexes; (2) Developing the DAENet architecture to extract fine-grained agricultural features from GF-1 satellite imagery, effectively suppressing spectral mixing effects; (3) Proposing geometric optimization and boundary constraint blocks (GOBR blocks) to address the challenges posed by terrain shadows, altitude gradients, complex terrain configurations, and irregular farmland boundaries.
The developed DAENet framework seeks to deliver an enhanced and optimized cropland delineation approach for complex terrain, enabling improved agricultural surveillance, territorial resource administration, and ecosystem preservation initiatives. Our research outcomes not only advance technical progress in satellite-based cropland mapping but also furnish empirical foundations for decision-makers and agrarian administrators to facilitate sustainable land utilization strategies.

2. Materials and Methods
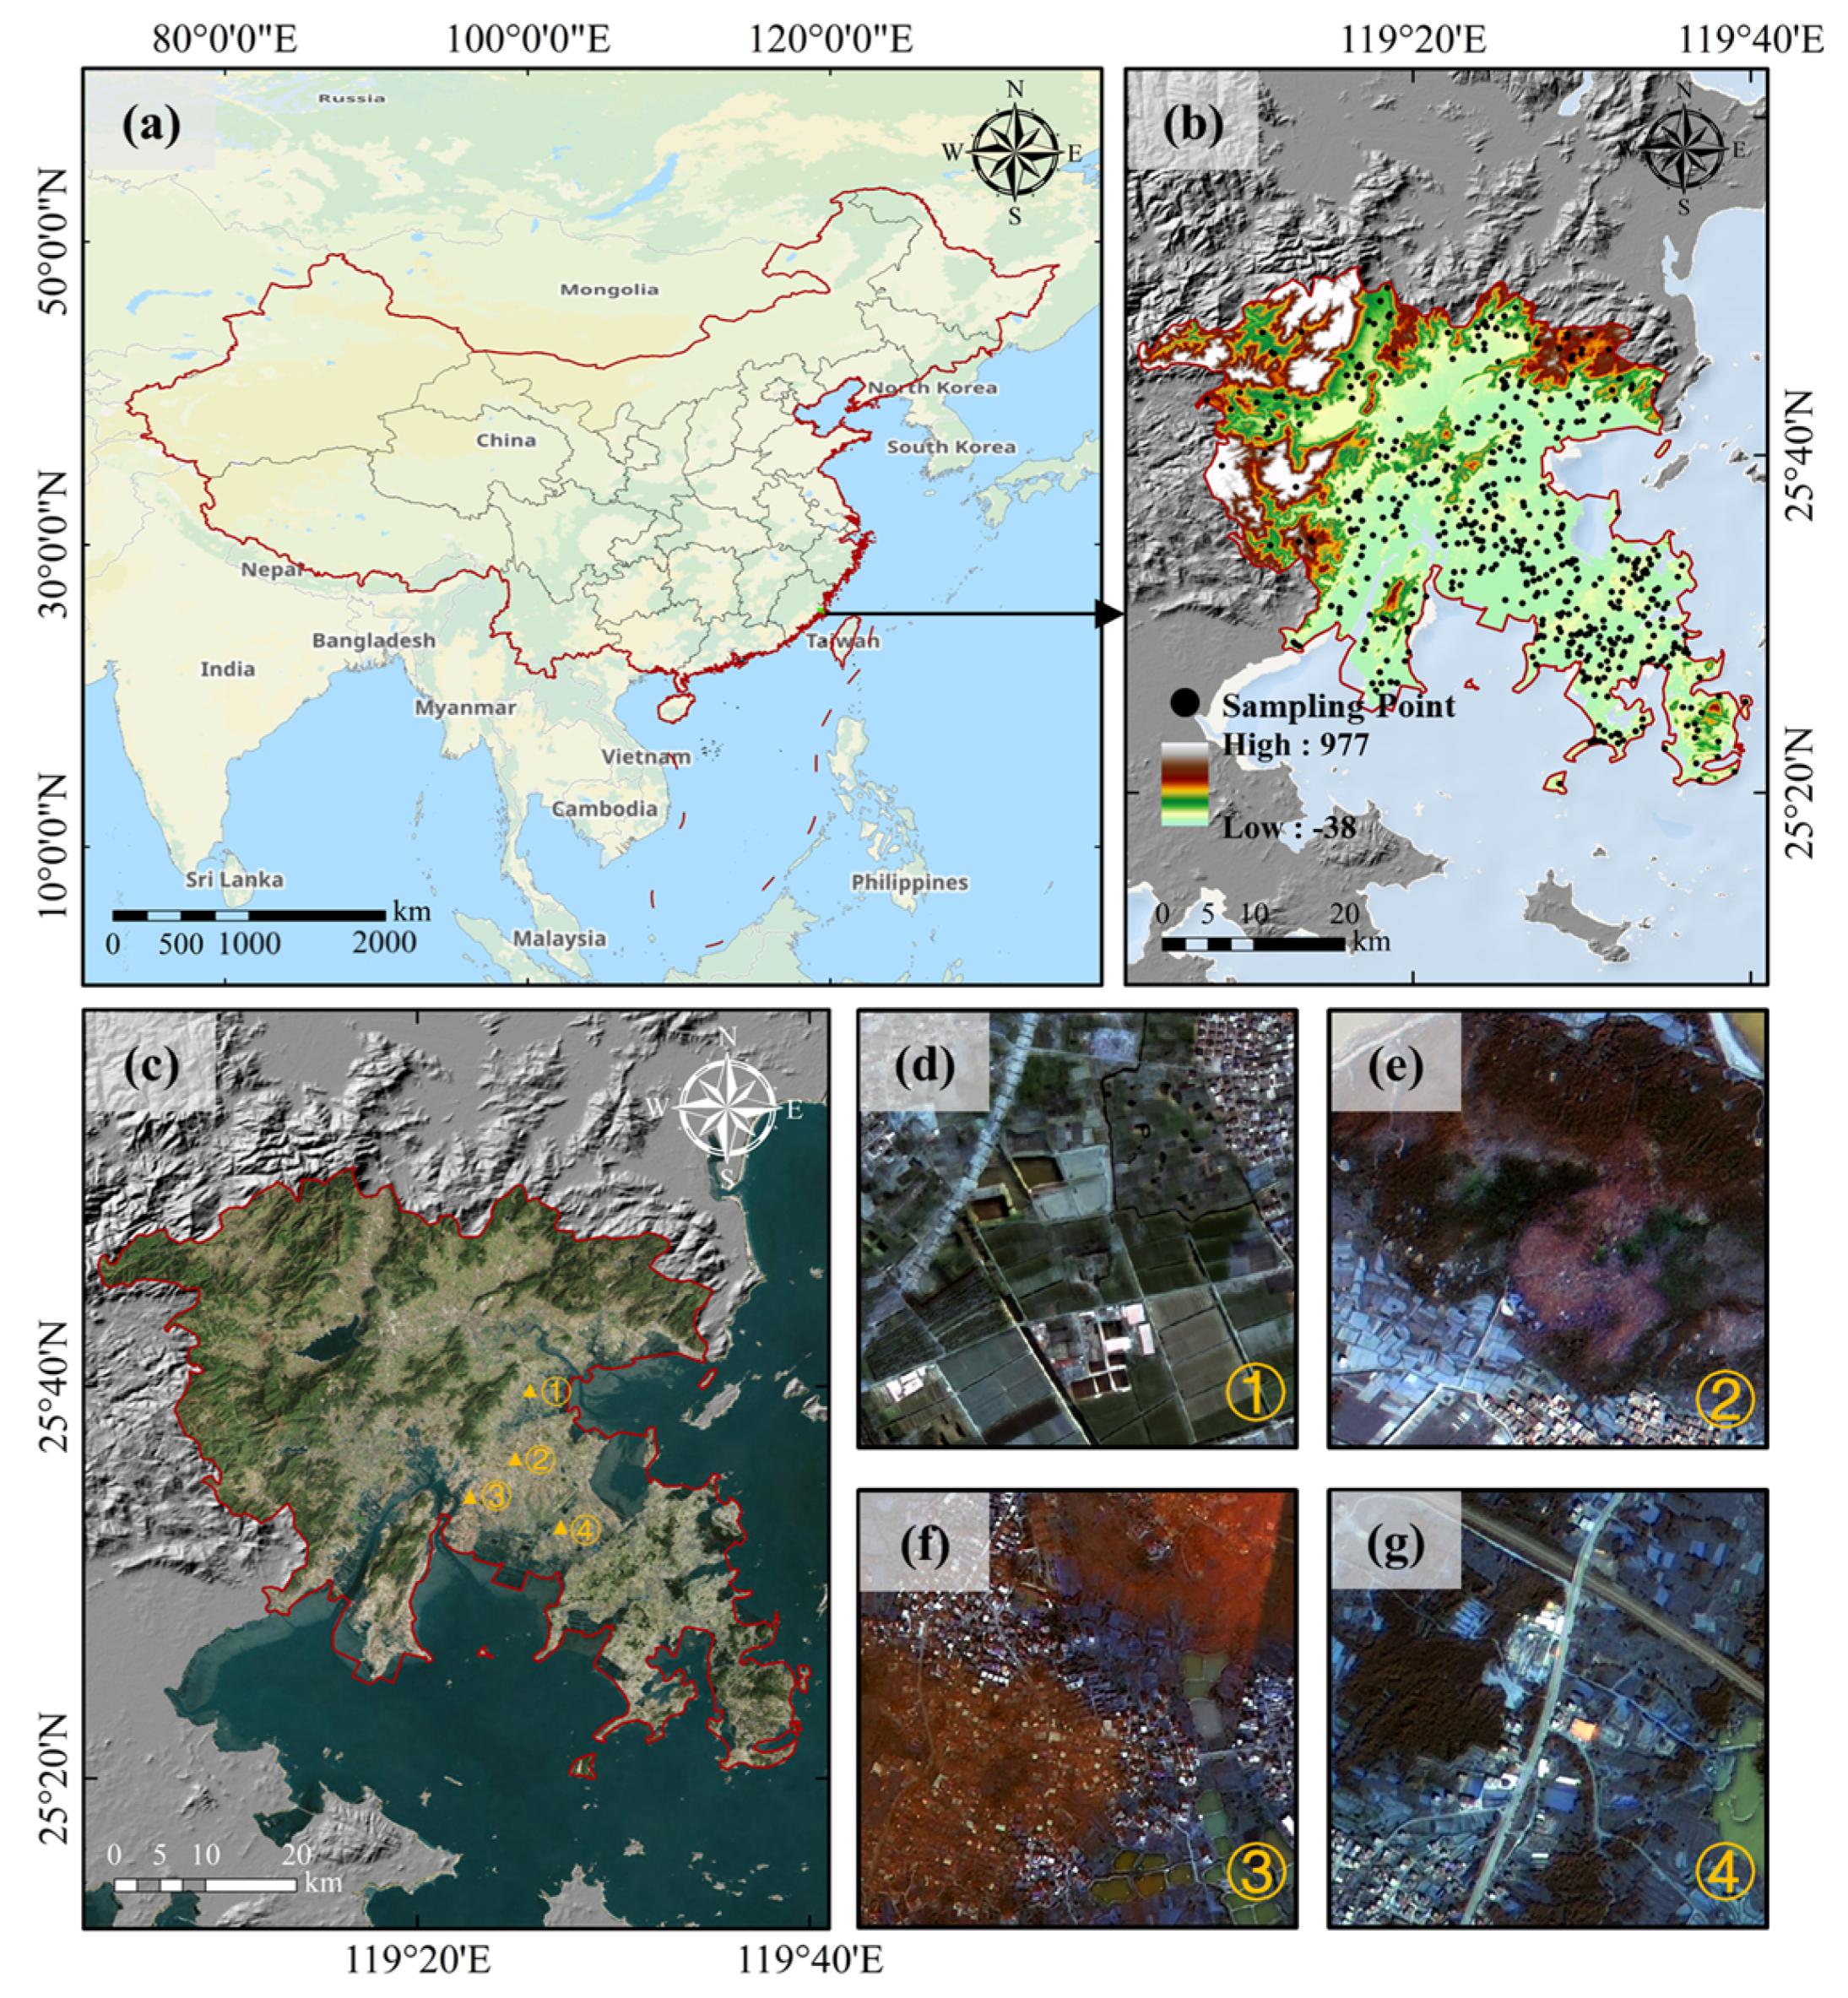
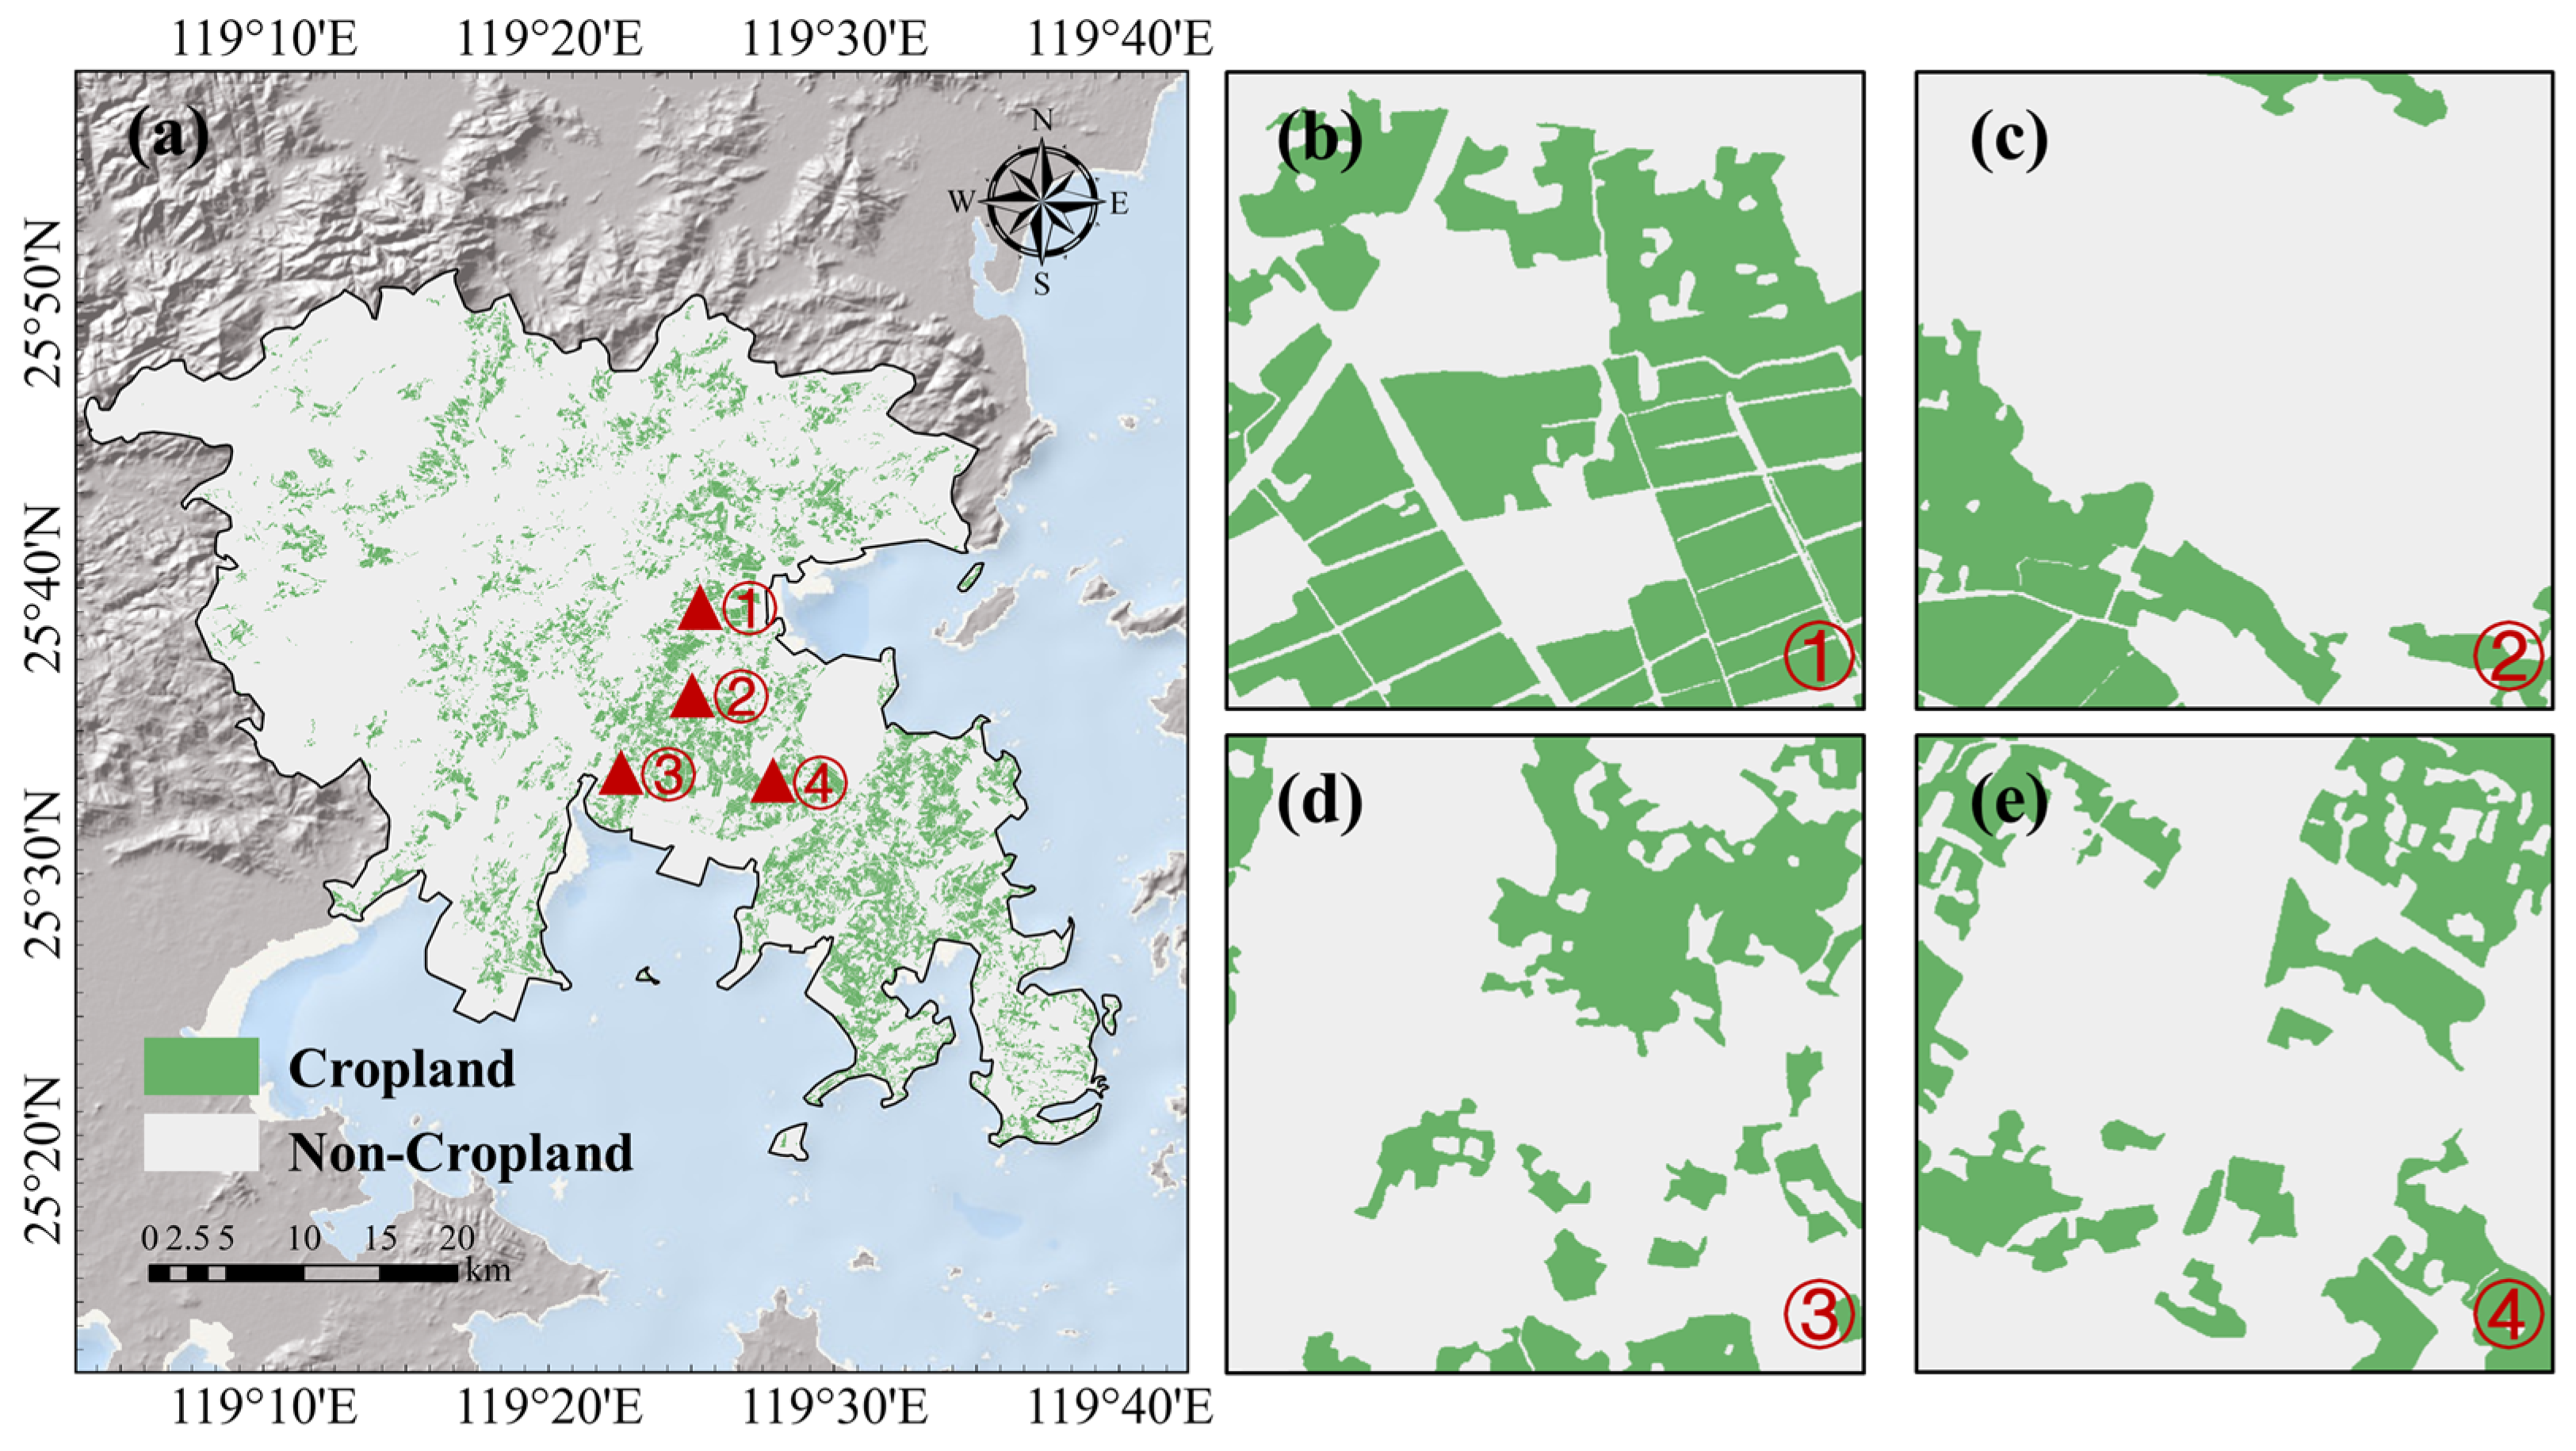
2.1. Study Area

Fuqing City was selected as the primary study area due to its representativeness as a typical region for cropland delineation in complex terrain. Located between 25°18′ N–25°52′ N and 119°03′ E–119°42′ E, it lies along the southeastern coastal area of Fujian Province, China (Figure 1). The region experiences a subtropical monsoon climate zone and features cropland comprising roughly 20–30% of the total territory. Its landscape exhibits significant spatial heterogeneity, with elevation decreasing from rugged low mountains and hills in the northwest to alluvial plains and coastal lowlands in the southeast. These diverse topographic and land cover characteristics make Fuqing an ideal testbed for developing and validating high-accuracy remote sensing methodologies tailored to complex terrain and fragmented agricultural patterns.

2.2. Data

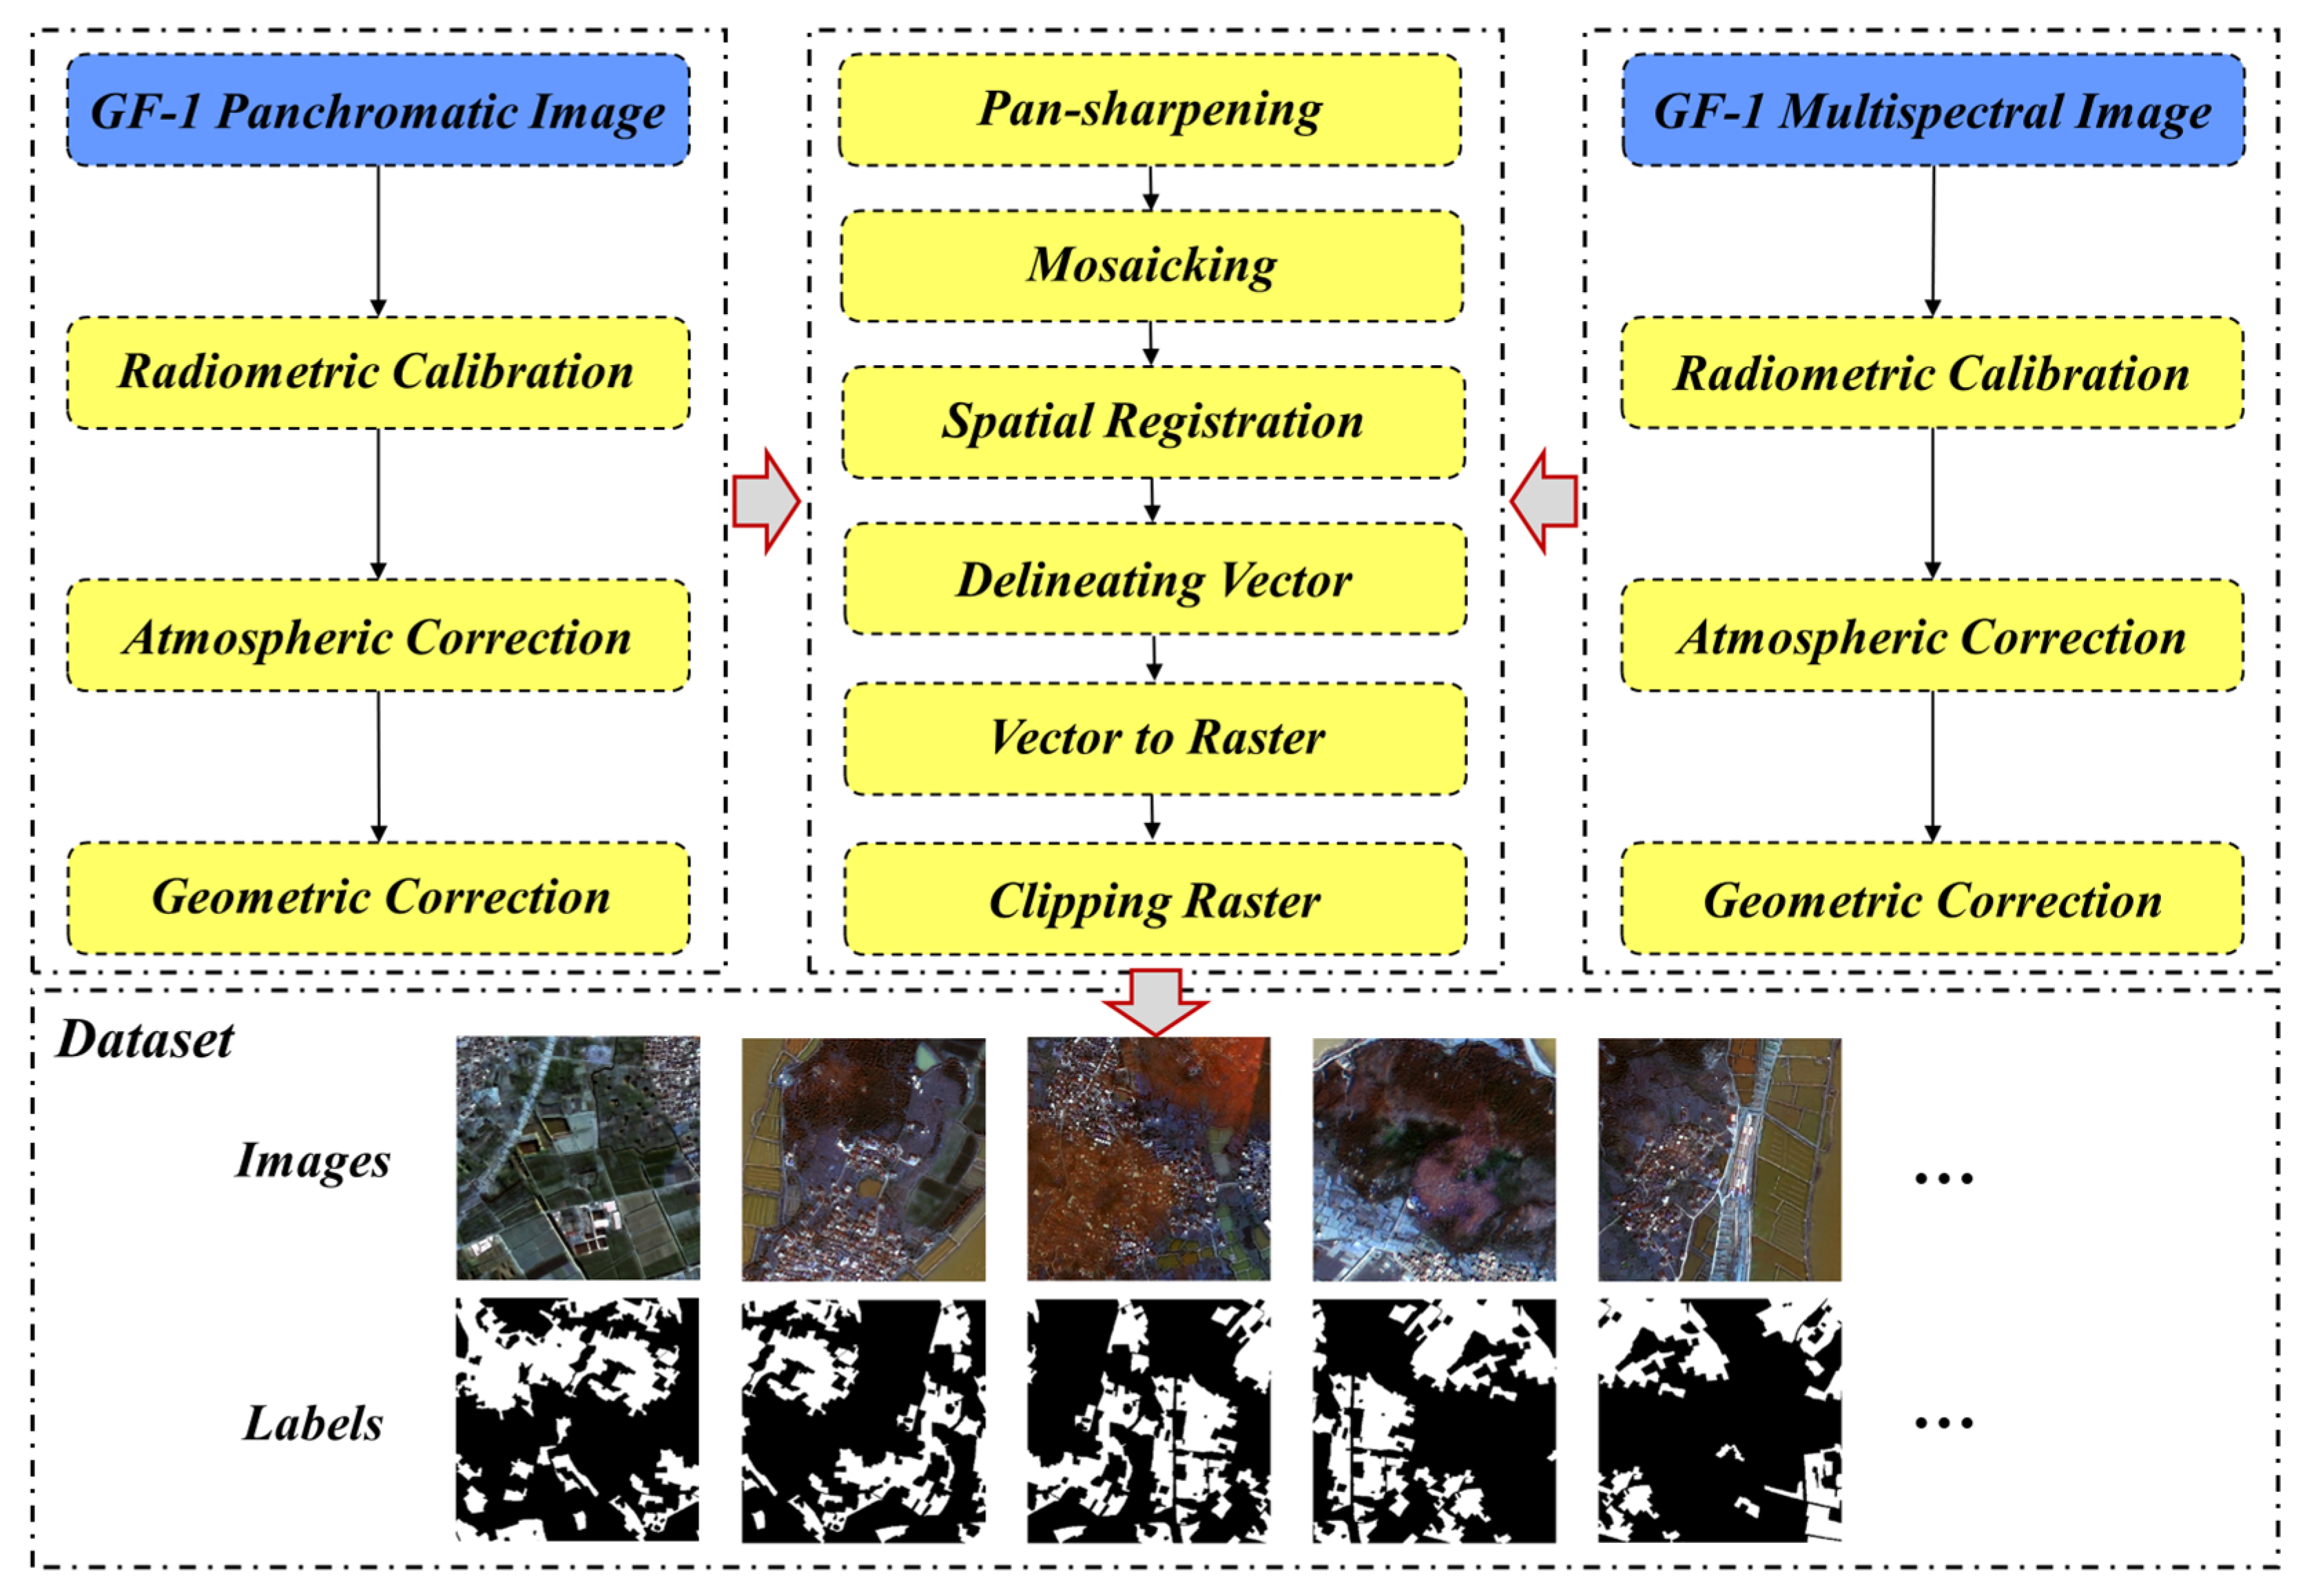
2.2.1. Remote Sensing Images Pre-Processing and Dataset Constructing

This research utilized Level 1A GF-1 satellite data encompassing the investigation region to ensure the high spatial resolution and spectral fidelity essential for reliable cropland delineation in complex terrain. In the present analysis, panchromatic imagery with 2-meter resolution and multispectral data with 8-meter resolution were employed to improve spatial and spectral precision, thus furnishing a robust data foundation for precise cropland feature extraction. In addition, MSI Sentinel and Landsat OLI images were co-registered to support model generalization experiments, enabling an evaluation of the framework’s transferability across broader geographic contexts.
To ensure the dependability and uniformity of the remote sensing data, the GF-1 imagery underwent pre-processing, which comprised the following steps (Figure 2): (1) Radiometric correction: We used the “Radiometric Calibration” method to convert the raw digital values of remote sensing images into physically meaningful radiance or reflectance to eliminate differences in sensor response. (2) Atmospheric correction: In this step, we used the “FLAASH” method to utilize atmospheric radiative transfer models or measured parameters to remove the influence of atmospheric gases and aerosols on remote sensing signals and restore the true surface reflectance of land features. (3) Geometric correction: In this step, we used the “Polynomial” model to correct images to accurate geographic locations through geographic reference information or control points to eliminate spatial distortions caused by terrain, sensor motion, and other factors. (4) PanNet: To further augment the spatial resolution of the multispectral imagery, the high-resolution panchromatic data were fused with the lower resolution yet spectrally diverse multispectral images. (5) Mosaicking: This step seamlessly combined multiple image tiles into a unified and continuous dataset spanning the entire study region. (6) Spatial registration: This procedure guaranteed proper alignment between the GF-1 imagery, cadastral maps, and field survey records, rectifying residual geometric discrepancies and standardizing the spatial reference system. These measures collectively reinforced the precision of cropland feature extraction. In this study, we performed radiation calibration, atmospheric correction, and geometric correction on both GF-1 full-color images with a resolution of 2 meters and multispectral images with a resolution of 8 meters. Following these pre-processing steps, the images were fused using a pan-sharpening technique, resulting in multispectral imagery with an enhanced spatial resolution of 2 meters. The fused images were subsequently mosaicked and spatially aligned to generate a seamless composite image covering the entire study area. Based on this composite image, arable land boundaries were manually delineated through visual interpretation, producing vector-based sample data. These vector samples were then converted into raster format. Finally, both the imagery and corresponding cropland sample grids were cropped to the Fuqing City boundary, forming the final arable land dataset used for model training and evaluation.
The labeled images were cropped to a size of 512 × 512, which resulted in a total of 18,480 samples containing 25,470 pieces of cropland. A comprehensive cropland reference dataset was finally established (Figure 3). The training focuses on the samples from different terrain units. The training set is allocated to mountains and plains in 6:4.

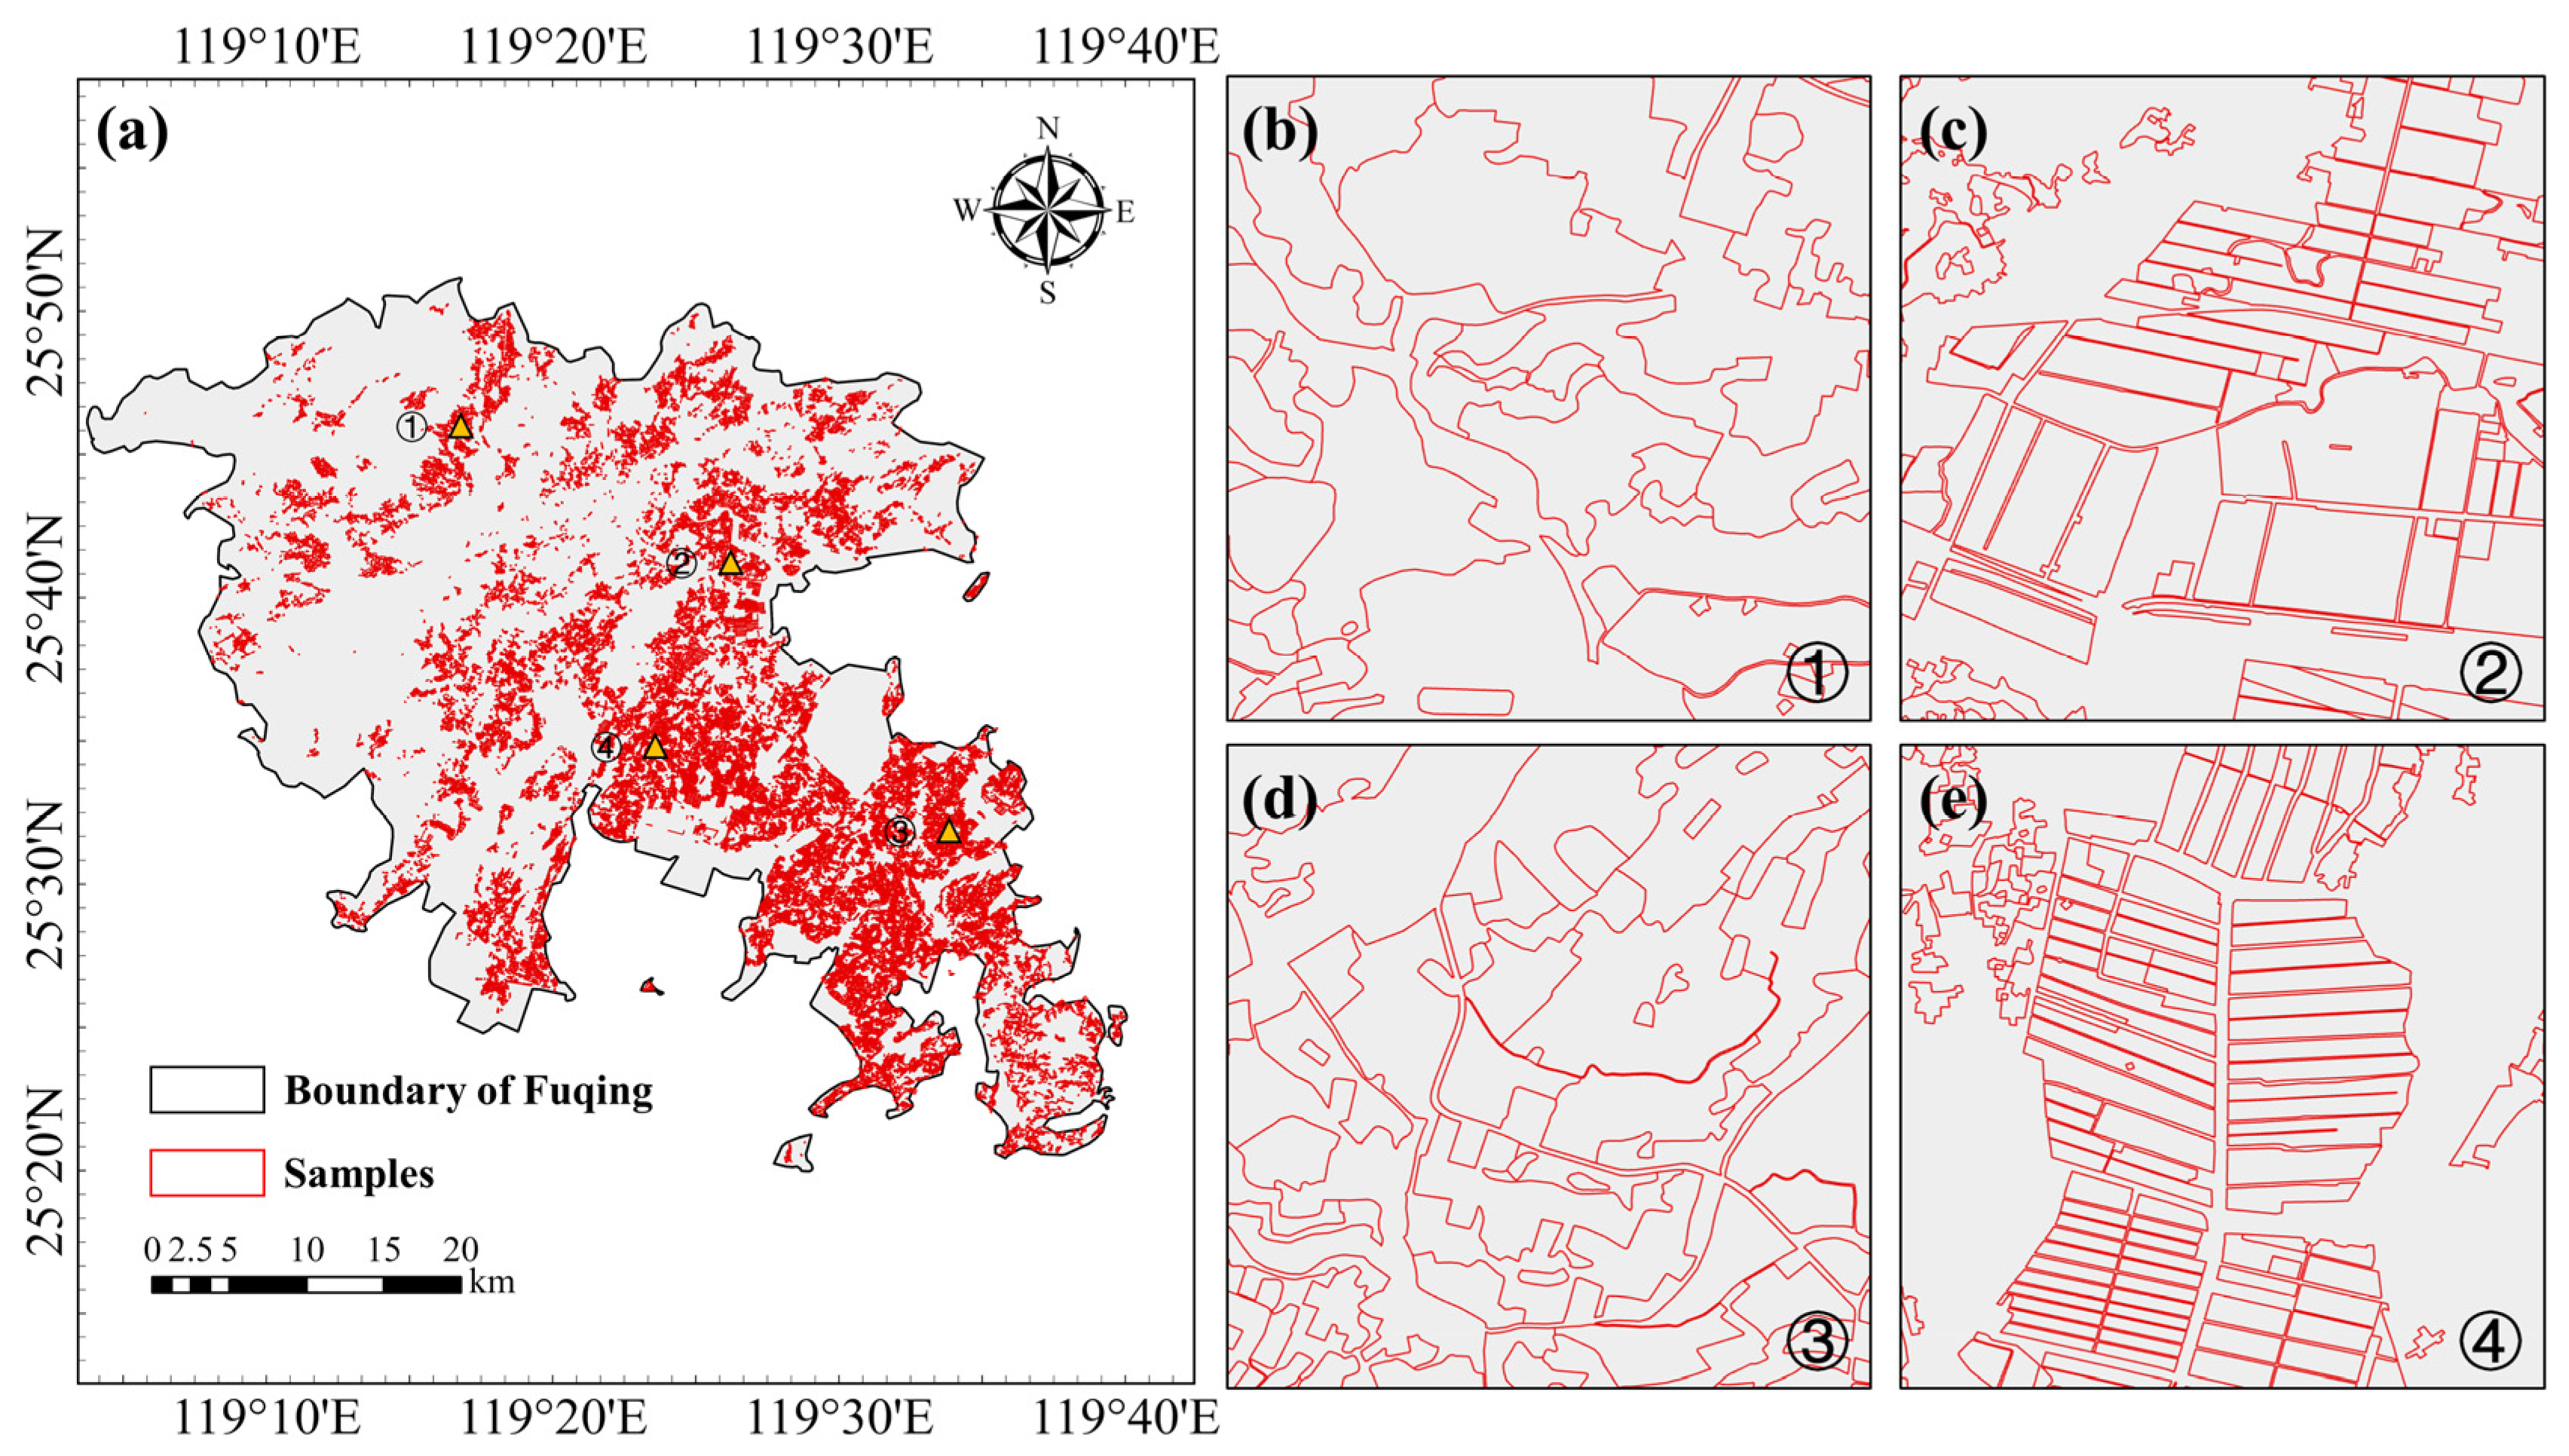
2.2.2. Ground Verification Data

Considering the inherent uncertainties associated with manual interpretation, we implemented ground-truthing at 500 systematically distributed sampling sites in Fuqing City in May 2024 (Figure 1b). During these field surveys, GPS instruments and high-resolution satellite data were employed for precise geolocation and verification, with manual annotation of cropland parcel characteristics and exact positions. The selection of sampling points deliberately incorporated variations in terrain morphology, distinct elevation gradients, and levels of cropland fragmentation to guarantee the representativeness of the collected data. Due to Fuqing City’s markedly heterogeneous terrain, the field campaign encompassed diverse geomorphological units with low-altitude mountains, undulating hills, fluvial valleys, and flat plains. The specific verification process is as follows: (1) GNSS receivers and total stations measured the corner points of sampled cropland patches. (2) The mapping results were subjected to internal adjustment processing to obtain the accurate geographical location of each corner point of the cropland patches. (3) Then, the boundaries of the sampled cropland patches were delineated. (4) Finally, the ground validation accuracy is obtained by converting vectors to grids and calculating F1 and IoU with the extracted results.

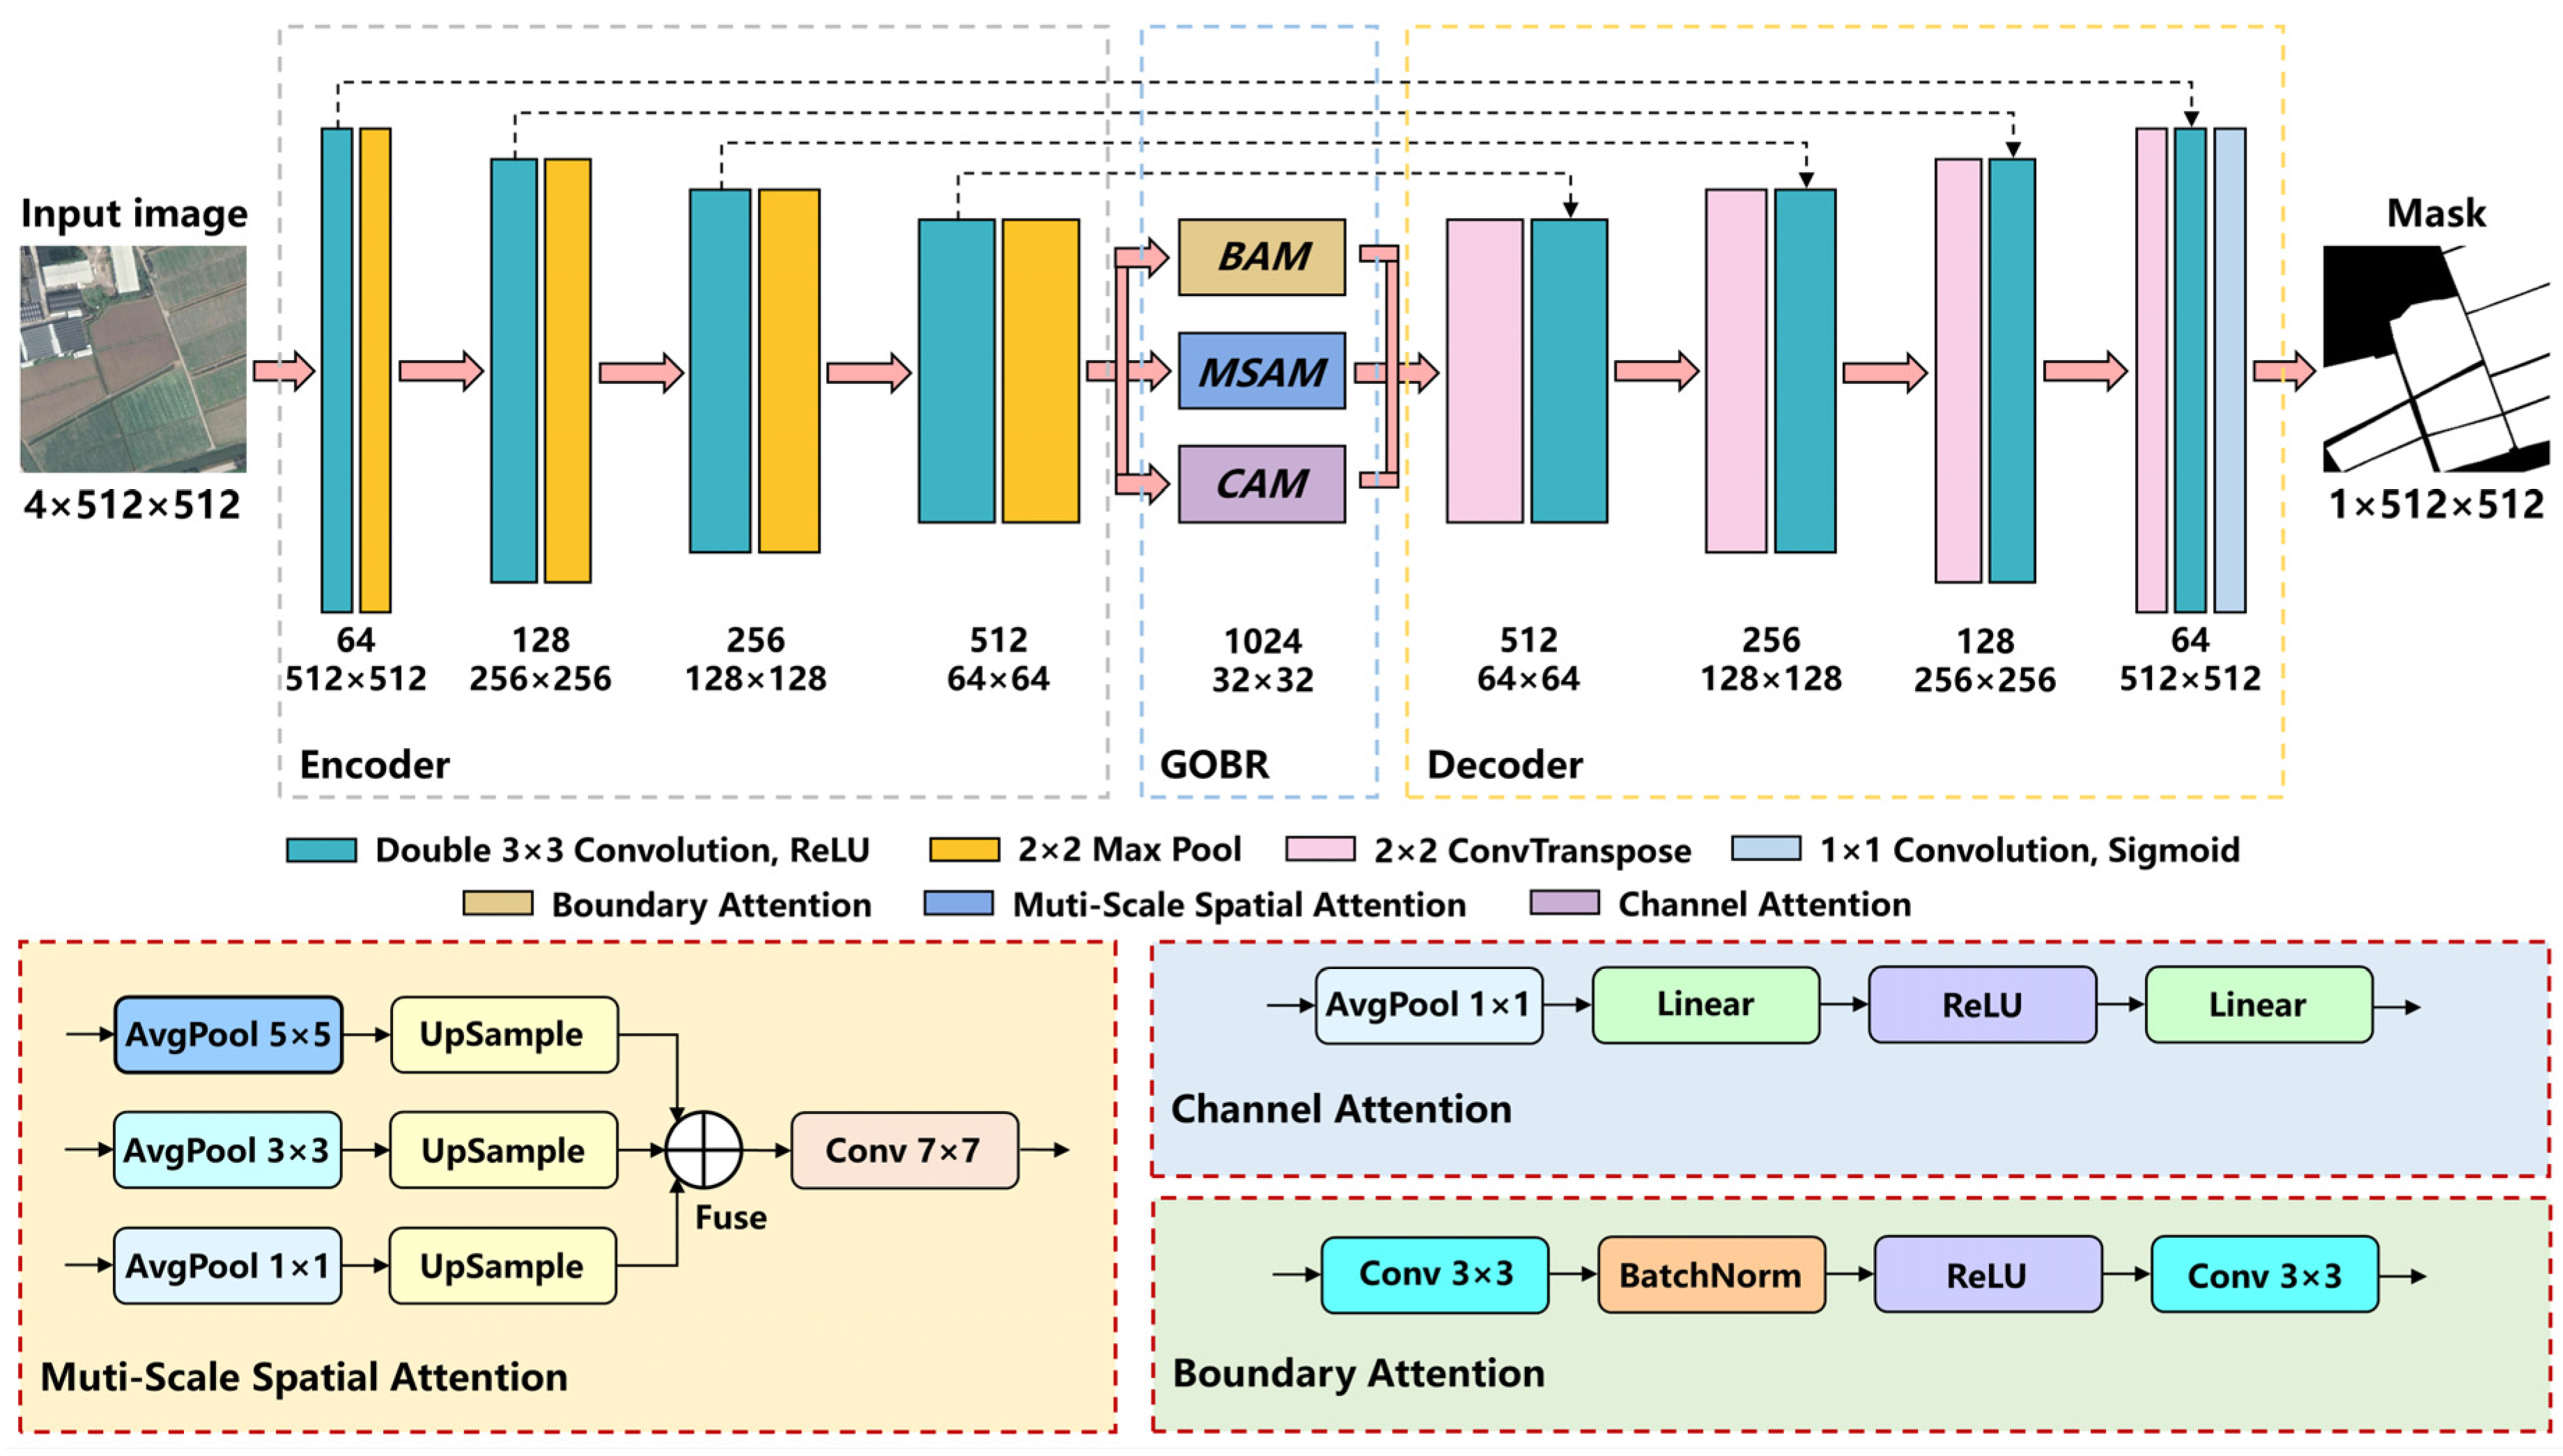
2.3. DAENet Architecture

To tackle the multifaceted complexities associated with cropland delineation in complex terrain, we propose a specialized semantic segmentation framework designated as DAENet (Figure 4). Delineating cropland parcels in mountainous and undulating regions involves distinct obstacles, such as fragmented plot distributions, irregular geometries, heterogeneous textures, and indistinct boundaries due to natural topographic variations. The architecture is intentionally designed to address these difficulties through hierarchical feature extraction, fine-scale feature enhancement, and an application-oriented attention module.
DAENet adopts a bilaterally symmetrical encoder-decoder architecture featuring four-stage downsampling and upsampling operations, along with a GOBR-augmented bottleneck layer. The network ingests a four-band multispectral image tensor X 0     R B × 4 × H × W , comprising the visible spectrum (RGB) and near-infrared (NIR) spectral channels, where B denotes batch size, H and W represent spatial dimensions. The feature extraction pathway in DAENet incrementally captures both spatial and contextual features through cascaded convolutional modules. The initial processing block (enc1) acquires fundamental visual primitives, including edge transitions, boundary delineations, and textural patterns—essential for discriminating cropland perimeters in environments with pronounced background clutter. Subsequent hierarchical blocks (enc2 through enc4) extract progressively higher-order semantic representations, encompassing vegetation canopy architecture, altitudinal gradients, and macroscale geomorphic configurations, which prove particularly vital for identifying discontinuous or geometrically complex field formations. The number of channels in each phase of the encoder is set to 64, 128, 256, and 512 in sequence; every phase implements dual 3 × 3 convolutional transformations with rectified linear unit activations, succeeded by spatial downscaling through max-pooling with stride 2, thereby facilitating feature integration across expanded contextual windows.
At the bottleneck layer, in which the number of channels is fixed at 64, the intermediate feature map X d 1   R B × 64 × H × W is processed by a dedicated attention mechanism termed the GOBR Block (Geometric-Optimized and Boundary-Restrained). The GOBR Block module consists of three parallel attention branches, among which the Boundary Attention branch extracts boundary features through two concatenated 3 × 3 convolutional layers, with BatchNorm and ReLU activations inserted in between to enhance nonlinear expression and gradient stability. The Multi Scale Spatial Attention branch uses three different scales of average pooling (5 × 5, 3 × 3, 1 × 1) to simulate different receptive fields, reflecting the response characteristics of cultivated patches at different spatial scales. The pooling results of each scale are upsampled to restore the original size and fused. Finally, a 7 × 7 convolution is used to uniformly generate spatial attention maps, which are used to capture cross-scale spatial contextual information. The Channel Atten-tion branch compresses spatial information through 1 × 1 global average pooling, introduces two linear transformations (fully connected layers), and activates the connections with ReLU. This component plays a critical role in recalibrating spatial, channel-wise, and boundary-sensitive activations prior to final classification. It guarantees that the network prioritizes field geometries, non-uniform parcels, and elaborate edges frequently observed in mountainous cropland, particularly within complex terrain.
The decoder pathway in DAENet mirrors the encoder in an inverse architectural configuration. Each upsampling module begins with a transposed convolution (kernel dimensions 2 × 2, stride 2), which doubles the spatial resolution of the feature maps. The upsampled feature maps are then merged with their corresponding encoder counterparts through skip connections, preserving high-frequency spatial information that may have been diminished during the encoding phase. Following each concatenation, the decoding modules apply 2 successive 3 × 3 convolutional layers with ReLU nonlinearities. This step enables the integration of both fine-grained spatial features and broader contextual representations. It is crucial for accurate reconstruction of cropland boundaries, especially in regions with complex topographic distortions. Additionally, they facilitate the reconnection of initially separated cropland segments that were previously discontinuous.
Following the last decoder module (dec1), the feature representations undergo processing through a 1 × 1 convolutional layer, which compresses the channel dimensionality to a single output. A sigmoid nonlinearity subsequently generates the ultimate binary segmentation output Y ^     R B × 1 × H × W , representing the estimated cropland coverage at each spatial location.

2.4. Geometric-Optimized and Boundary-Restrained Block

The GOBR Block (Geometric-Optimized and Boundary-Restrained) is a highly effective module that is designed to enhance segmentation accuracy for irregular, fragmented, and weakly delineated cropland parcels in complex terrain. The GOBR module is strategically inserted into the bottleneck part between the encoder and the decoder. As the final refinement unit, it optimizes the feature representation with the richest semantics before prediction. By leveraging geometry-aware and boundary-sensitive attention mechanisms, the GOBR Block selectively amplifies features critical for distinguishing subtle edge transitions and non-uniform field shapes. Its placement in the network architecture ensures that high-level spatial and structural cues are preserved and emphasized, ultimately improving the delineation quality of complex agricultural patterns.
Consider the input feature tensor X     R B × C × H × W with channel dimension C = 64 as the input to the GOBR module. The refined output feature map X is obtained through the following transformation:
X = X · M c · M s · M b
where M c     R B × C × 1 × 1 denotes the channel-wise attention weights generated by the CAM, while M s     R B × 64 × H × W and M b     R B × 64 × H × W represent the multi-scale spatial attention coefficients and boundary-focused attention features derived from the MSAM and BAM components, respectively.

2.4.1. Channel Attention Module

In order to determine the most relevant feature channel in the process of farmland identification, we posed Channel Attention Module (CAM), which ensures the best choice of feature channel in this adaptive feature recalibration process. The Channel Attention Module (CAM) initiates its processing by applying global pooling operations to each feature channel, thereby generating a channel-wise descriptor vector z     R C . Each element of this vector is derived through the following computation:
z c = 1 H × W i = 1 H j = 1 W X c , i , j
The channel descriptor undergoes transformation through a sequence of two fully connected layers, incorporating a ReLU nonlinearity followed by sigmoid normalization, ultimately yielding the channel attention coefficients:
s = σ W 2 · δ W 1 · z
where W 1     R C / r × C and W 2     R C × C / r represent learnable weight matrices, with δ ( · ) denoting the ReLU activation and σ ( · ) signifying the sigmoid nonlinearity. The computed attention vector s     R C undergoes dimensional transformation and element-wise replication to generate the channel attention map M c     R B × C × 1 × 1 , which performs channel-wise multiplication with the input features X . This adaptive feature recalibration process guarantees that feature channels most relevant for cropland recognition receive enhanced representation.

2.4.2. Multi-Scale Spatial Attention Module

The MSAM detects and prioritizes topographically significant areas associated with non-uniform or variably sized cropland parcels. This module executes adaptive average pooling operations across three distinct resolution levels. For every scale parameter k     1 , 3 , 5 , the subsequent transformation is implemented:
P k = Upsample AvgPool k × k X
The upscaled feature maps are aggregated through mean fusion to generate a consolidated spatial representation:
P = 1 3 P 1   + P 3 + P 5
A convolutional operation employing an expansive receptive field is implemented to generate the spatial attention coefficients:
M s = σ Conv 7 × 7 P
The resultant attention map M s     R B × 64 × H × W accentuates spatially significant regions crucial for cropland delineation, particularly within discontinuous and non-uniform agricultural parcel configurations.

2.4.3. Boundary Attention Module

In view of the complex terrain in the study area, cultivated land is often accompanied by higher fragmentation and more discrete distribution. We designed the BAM module to solve this problem. BAM does not fail to improve the network’s proficiency in detecting what cannot be considered anything but meticulous edge delineations. The module employs no fewer than two successive 3 × 3 convolutional layers, neither of which omits batch normalization or ReLU activation. These processing stages are formally characterized as
F = δ BN Conv 3 × 3 X
M b = σ Conv 3 × 3 F
The resultant feature map M b     R B × 64 × H × W encapsulates boundary probability, contributing to enhanced delineation precision across intricate marginal transitions. The synergistic combination of CAM, MSAM, and BAM within the GOBR framework guarantees comprehensive multi-scale enhancement of the feature representations, facilitating reliable cropland delineation in complex terrain with demanding topographical constraints.

2.4.4. Loss Function

In this study, we adopted BCELoss as the loss function of our models. It is used to measure the difference between the probability of model prediction and the real model. The basic expression of the loss function is
  l x ,   y = L =   l 1 ,   ,   l N T ,   l n = ω n y n · log x n + 1     y n · log 1     x n
where x n is the output of the model that does not go through the sigmoid function, y n is the target label, ω n is the sample weight, N is the batch size.

2.5. Accuracy Assessment

To evaluate the cropland delineation performance, four key metrics were employed: precision, recall, F1-score, and Intersection over Union (IoU). The quantitative validation results were derived from the reference samples produced through the methodology described in Section 2.3, with their computations formally expressed by Equations (10) through (13).
Precision = TP TP + FP
Recall = TP TP + FN
F 1 - score = 2   ×   Precision   ×   recall Precision + Recall
IoU = B p B g B p B g
where TP (True Positives) corresponds to the count of accurately identified cropland pixels, while FP (False Positives) indicates the quantity of non-cropland pixels erroneously assigned to the cropland category. FN (False Negatives) reflects the number of cropland pixels mistakenly classified as non-cropland, with B p signifying the estimated cropland coverage and B g representing the ground-truth cropland extent.

2.6. Experimental Settings

The computational investigations were performed on an advanced computing system featuring dual Intel Xeon Gold 6248R processors (3.00 GHz), paired NVIDIA GeForce RTX 4090 graphics processing units, and 48 GB of system memory, operating under Ubuntu 20.04.4. The computational framework was constructed utilizing Python 3.11.11 and PyTorch 2.5.1, incorporating CUDA version 12.5 for hardware acceleration. Visual Studio Code 1.98.2 served as the principal development environment. The experimental data were partitioned randomly into training, validation, and testing subsets following an 8:1:1 distribution ratio. The neural network underwent training for a complete cycle of 100 epochs.
The initial learning rate for training is set to 0.001. The minimum learning rate is 1 × 10⁻⁴, and the maximum learning rate is 0.001. The attenuation coefficient gamma is set to 0.98. The epoch and batch sizes are set to 100 and 16, and the Adam optimizer is used to optimize the network parameters. In addition, in the constructed loss function, when the parameter alpha is set to 0.86 and power is set to 0.5, the effect of overcoming the feature learning bias caused by the foreground-background imbalance is the best.

2.7. The Use of AI Tools

ChatGPT 4.5 and Grammarly 1.5.33.0 were used to assist manuscript writing. We declare that the use of these technologies contributes to transparency and trust among authors, readers, reviewers, editors, and contributors and helps to comply with the terms of use of relevant tools or technologies. These techniques are only used to improve the readability and language of the work, rather than replacing the key creative tasks. These technologies are carried out under manual supervision and control, and all the work has been carefully reviewed and edited.

3. Results

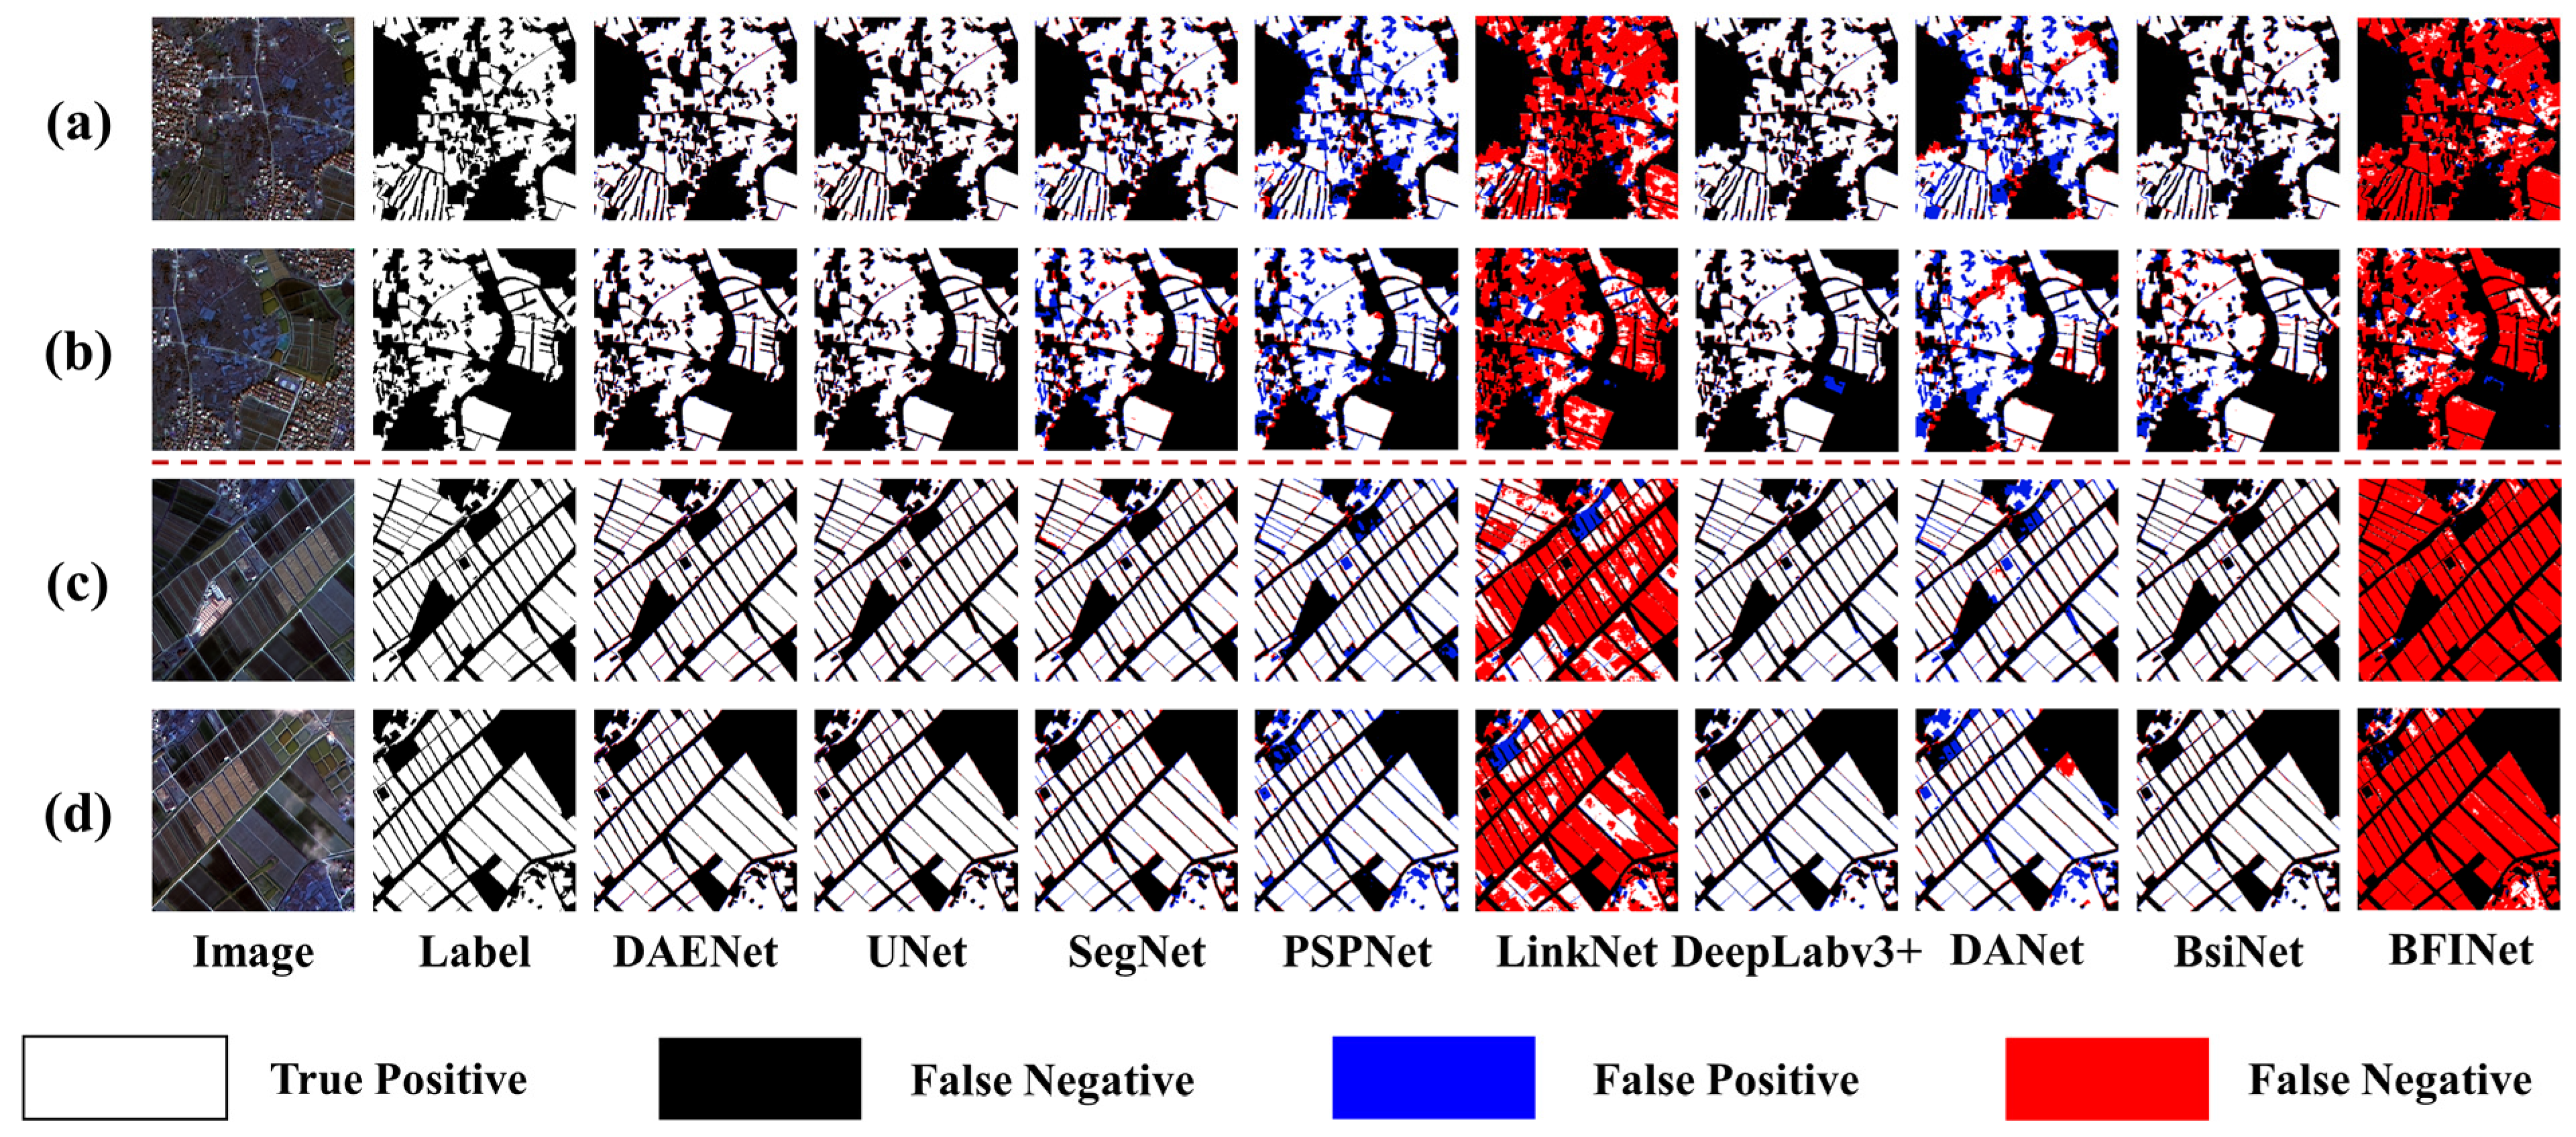
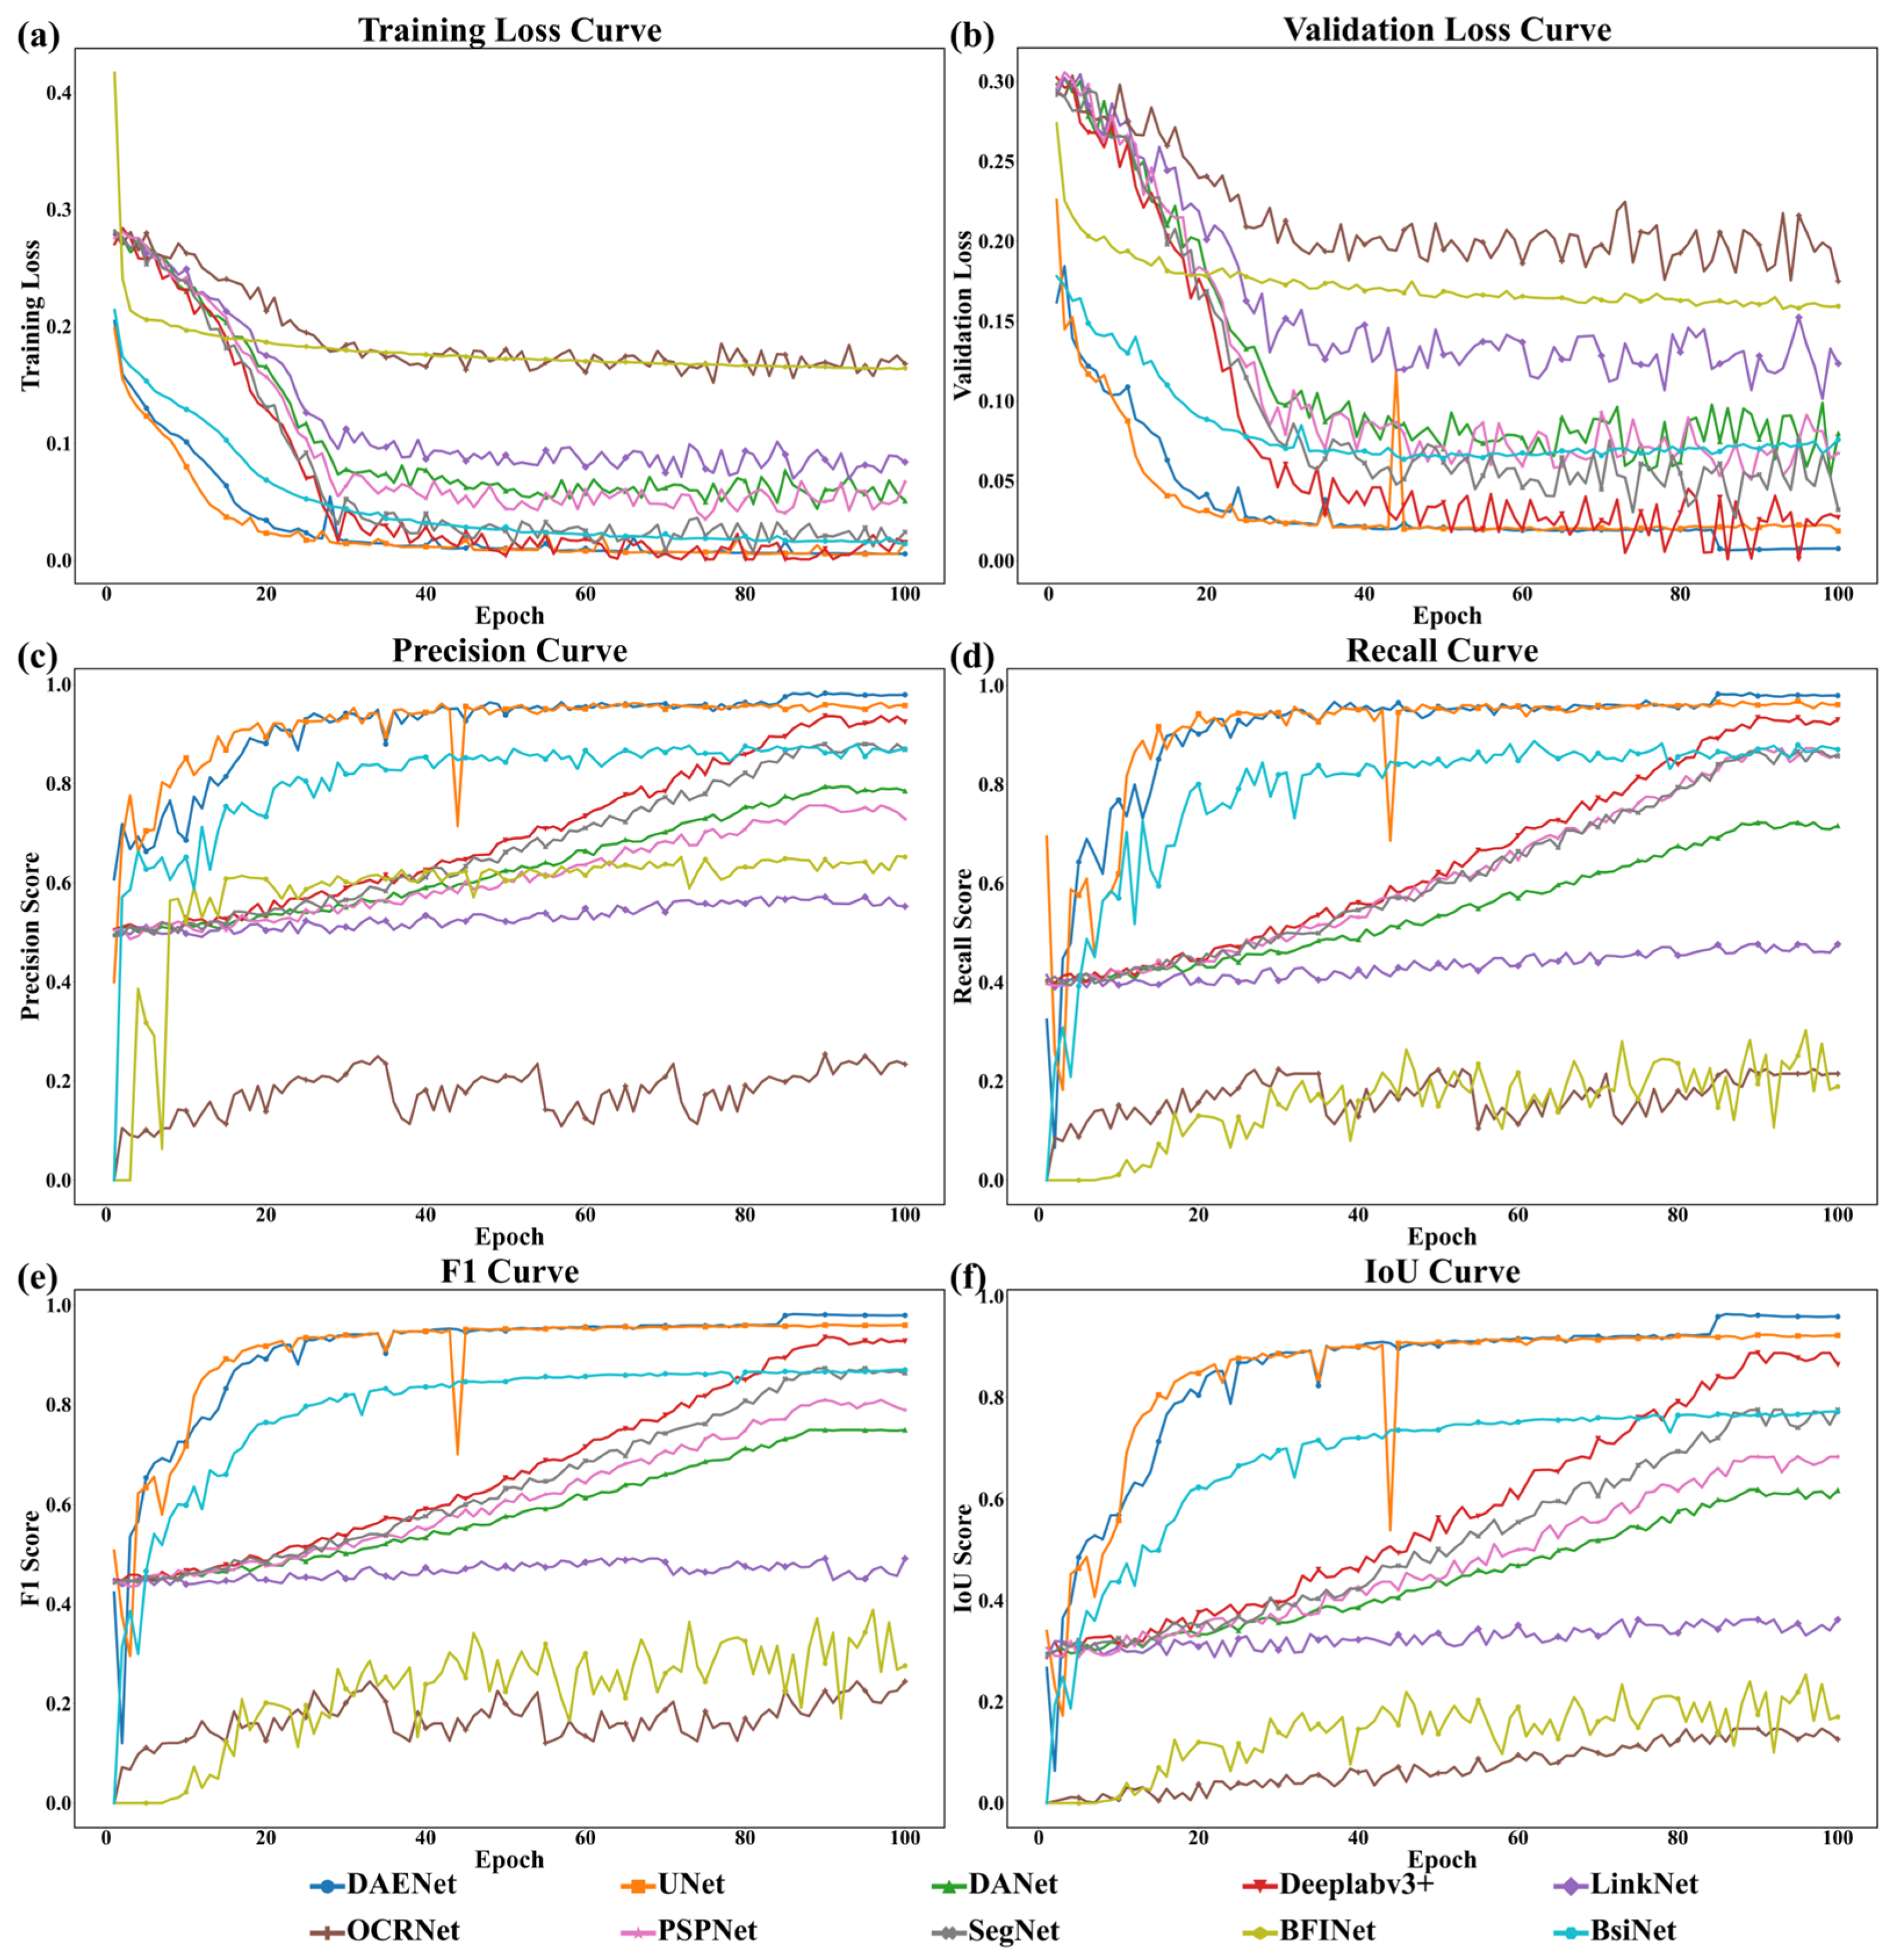
3.1. Comparison with Other Networks
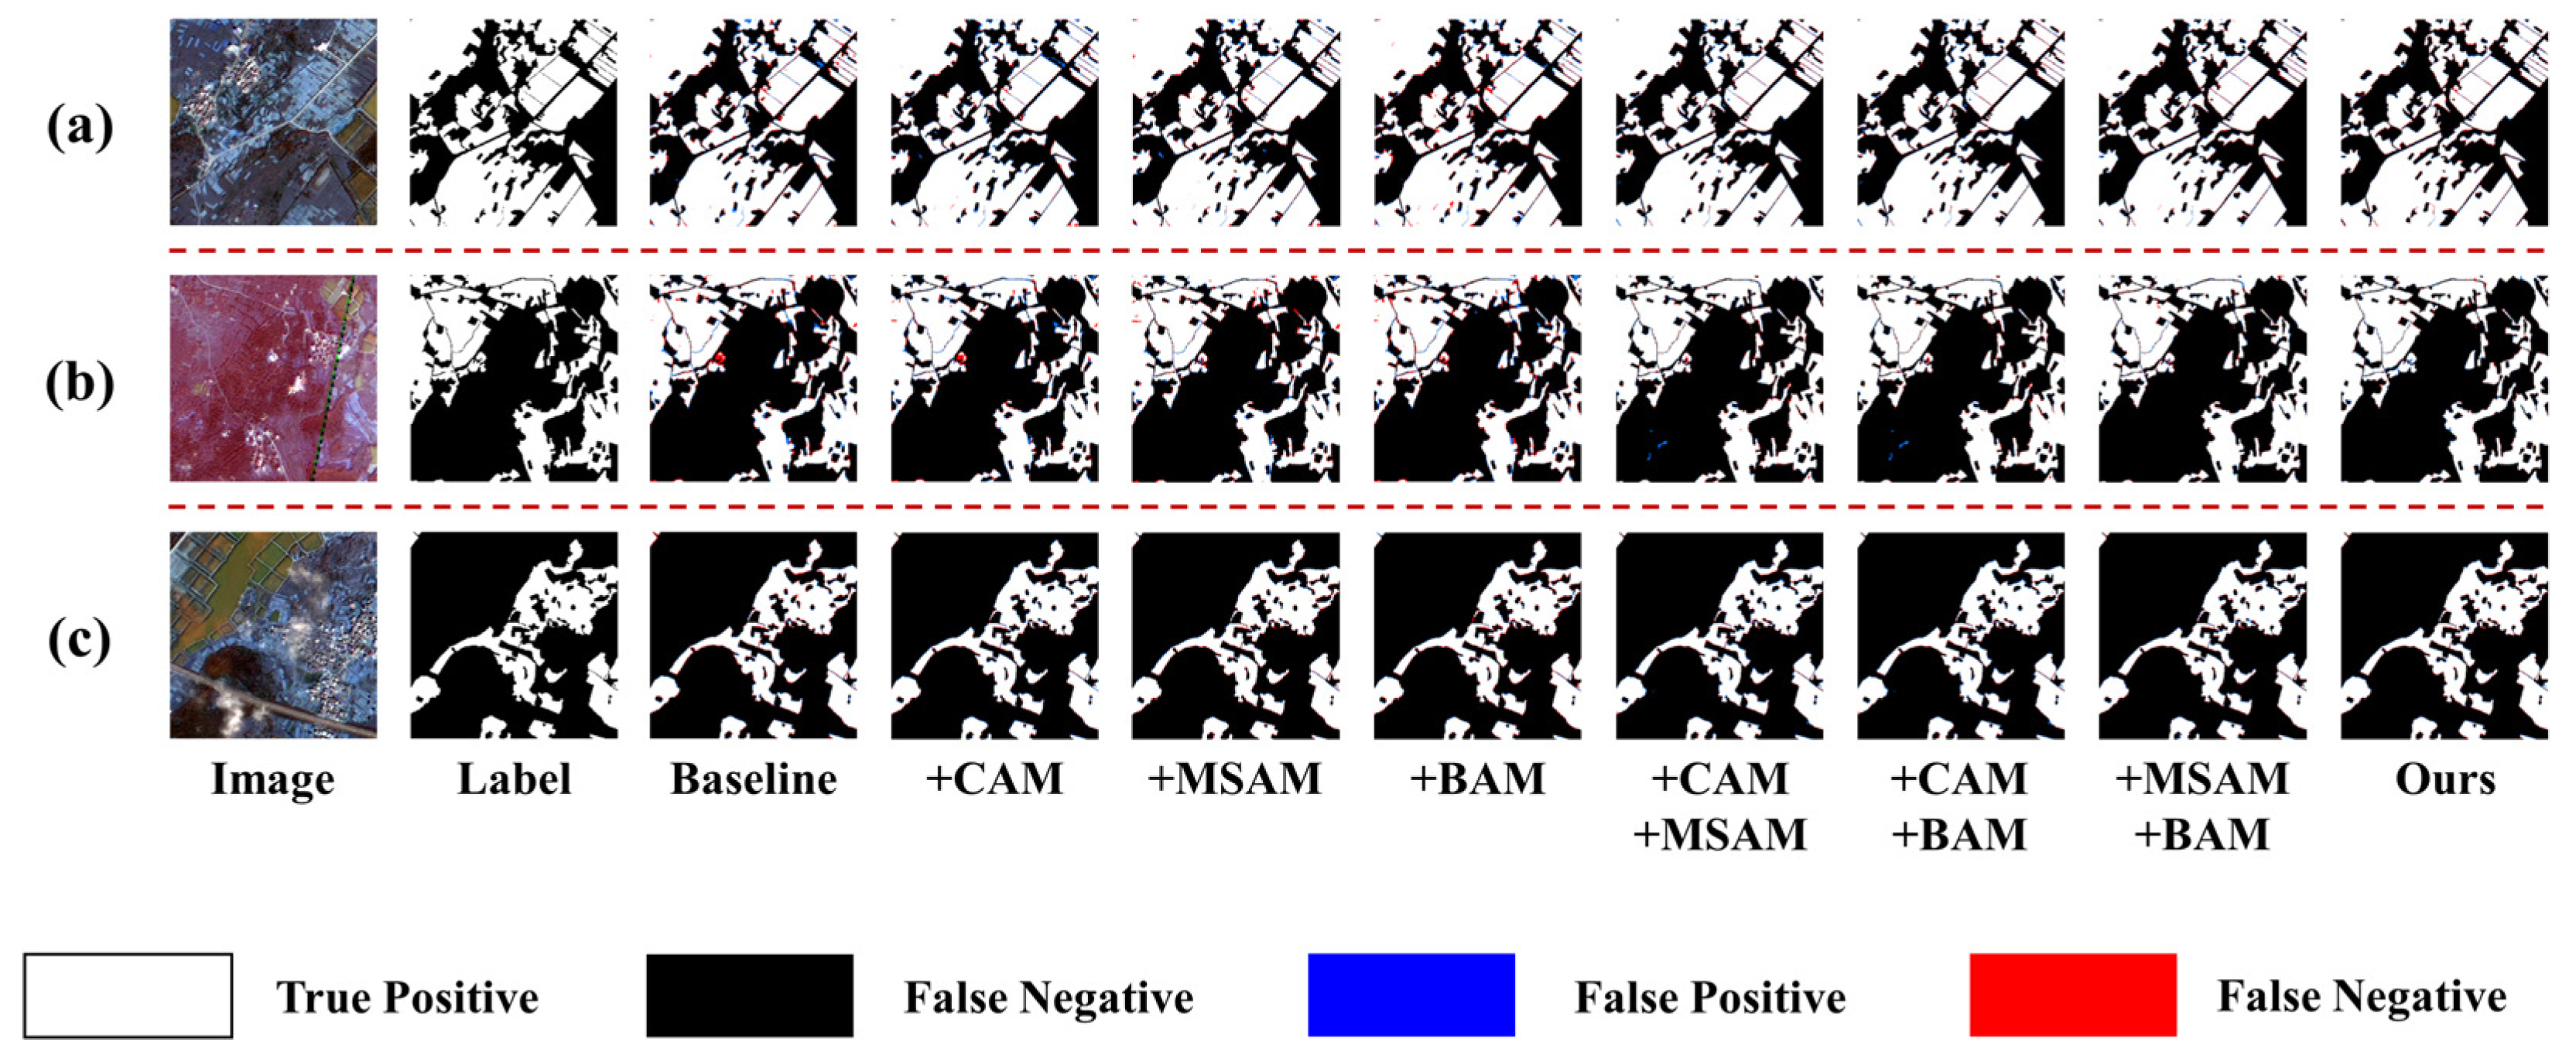
The quantitative evaluation results, summarized in Table 1, demonstrate the superior performance of our proposed approach compared to state-of-the-art semantic segmentation models. Among the baseline models, DeepLabv3Plus achieved competitive outcomes, with a Precision of 0.9362, Recall of 0.9352, F1-score of 0.9354, and an IoU of 0.8879. UNet also exhibited strong segmentation capabilities, attaining an F1-score of 0.9604 and an IoU of 0.9239. Despite the strong performance of these models, our proposed DAENet framework consistently outperformed all baselines across all evaluation metrics. Specifically, it achieved a Precision of 0.9826, Recall of 0.9797, F1-score of 0.9811, and an IoU of 0.9636. This substantial improvement underscores the robustness and accuracy of our methodology in delineating cropland boundaries, particularly within heterogeneous and topographically complex regions.
Moreover, architectures such as HRNet and LinkNet exhibited notably lower performance, with IoU of 0.4879 and 0.3626, respectively. These results indicate that standard segmentation networks encounter difficulties in processing the intricate boundary configurations of fragmented cropland. Likewise, OCRNet exhibited unsatisfactory recall and precision, resulting in an F1-score as low as 0.2261, further emphasizing its limited effectiveness in this particular application. This underperformance further underscores the limitations of general-purpose semantic segmentation models when applied to the nuanced task of cropland delineation in complex terrain.
It is worth emphasizing that our approach not only achieves superior accuracy but also demonstrates significantly improved detail recognition in fragmented cropland plots compared to UNet (Figure 5). This enhancement is primarily attributed to the model’s ability to preserve fine-scale spatial features, enabling precise delineation of complex and irregular field boundaries in complex terrain. These qualitative results further validate the effectiveness of our framework for high-resolution information extraction, particularly in environments characterized by heterogeneous terrain and highly fragmented land use patterns.

3.2. Ablation Study

To evaluate the individual and combined contributions of the proposed CAM, MSAM, and BAM, we conducted a comprehensive set of ablation experiments. The segmentation performance across different module configurations is reported in Table 2, using Precision, Recall, F1-score, and IoU as evaluation metrics. Compared with the baseline model with 92.34% IoU, the integration of any single attention module will continue to gain performance gains in all indicators. Among these, BAM delivers the most substantial standalone improvement, increasing IoU by +1.76%, which highlights its effectiveness in refining ambiguous or fragmented cropland boundaries. MSAM and CAM also provide meaningful enhancements, with IOU gains of +1.58% and +1.27%, respectively. It shows their respective advantages in capturing multi-scale spatial correlation and enhancing differentiated channel representation. These findings confirm the complementary roles of the attention modules in improving cropland delineation accuracy in complex terrain.
When 2 modules are jointly employed, the segmentation performance improves further, highlighting the complementary synergy among the components. Notably, the combination of CAM and BAM results in an IoU of 95.32%, surpassing other dual-module combinations. Remarkably, the MSAM + BAM configuration also delivers competitive results (95.40% IoU), implying that the integration of spatial and boundary-aware mechanisms substantially bolsters the model’s capacity to process irregular topologies and intricate boundaries.
The whole GOBR framework integrates CAM, MSAM, and BAM, and the segmentation accuracy is the highest, with IoU of 96.46% and F1-score of 98.20% (Figure 6). These results confirm that the integrated attention strategy produces a synergistic effect, substantially improving the model’s precision and robustness in delineating cropland across topographically diverse and morphologically fragmented landscapes.

3.3. Mapping of Cropland in Study Area

To further evaluate the practical utility of the proposed approach, our model was deployed to delineate cropland in Fuqing City (Figure 7). The resulting cropland distribution map was systematically validated using 500 ground-truth sampling points. Quantitative evaluation revealed that the method attained a mean F1-score of 0.8811 and a mean IoU of 0.7876 across all sampling locations. The delineation process identified a total of 25,556.98 ha of cropland distributed over 67,850 discrete plots in the study area. To assess model stability, we conducted five independent training runs using identical hyperparameters. The extraction accuracy in terms of area was 10.17 ± 0.02/10 ha, underscoring the method’s consistency and robustness under varied training conditions. These results substantiate the model’s consistent reliability in detecting cropland under heterogeneous topographic and land cover conditions.

4. Discussion

4.1. Performance Superiority of DAENet in Complex Terrain

To comprehensively evaluate the capability of the proposed DAENet framework, we conducted comparative analyses against a suite of state-of-the-art semantic segmentation architectures, encompassing UNet, DeepLabv3+, DANet, LinkNet, OCRNet, PSPNet, SegNet, BFINet, and BsiNet. As depicted in Figure 8, DAENet demonstrates consistent and substantial advantages across multiple performance metrics. Regarding training dynamics, DAENet displays a markedly accelerated convergence behavior, with both training loss (Figure 8a) and validation loss (Figure 8b) diminishing swiftly and reaching stability during the initial 30 epochs, substantially outpacing alternative approaches. This accelerated convergence indicates reduced training time and lower computational resource demands, which is particularly beneficial for large-scale cropland mapping tasks where operational efficiency and scalability are critical.
In terms of predictive accuracy, DAENet consistently outperforms all reference models across principal assessment criteria. As evidenced in Figure 8c–f, DAENet attains peak measurements in Precision, Recall, F1-score, and Intersection over Union (IoU) throughout the learning phase. Notably, the model exhibits high stability, with minimal performance fluctuations across epochs. In contrast, reference architectures such as UNet and DANet show slower convergence trajectories and greater metric volatility, reflecting less consistent learning dynamics. This sustained accuracy and stability underscore DAENet’s robust generalization capability, particularly under the demanding conditions presented by fragmented field geometries and heterogeneous terrain. The results affirm the framework’s reliability for high-precision cropland delineation, even in complex and discontinuous agricultural landscapes.
DAENet demonstrates outstanding capabilities not only in terms of training efficiency and segmentation accuracy but also in its consistency and adaptability across diverse landscape conditions. These distinguishing attributes make DAENet a practically deployable solution for accurate cropland delineation, especially within agriculturally fragmented and topographically complex regions. Its performance reinforces its suitability for real-world applications requiring reliable, high-resolution land use mapping in challenging environments.

4.2. Comparison of Model Parameters

To further compare the performance of the models, we compared the number of parameters (Params), the number of floating point operations (FLOPs), and the number of multiply-accumulate operations (MACs) of the constructed model with the other eight models. Where Params is the number of total parameters learned in the model, which are usually the weights and biases in the network model. FLOPs is the amount of computation in the model, which is usually used as a measure of the computational complexity of the model. MACs is an important measure of the complexity of the model and the efficiency of inference. The statistics of the 3 parameters of each model are shown in Table 3.
Through the analysis of the computational indicators of different models, it can be found that DAENet, as the network proposed in this paper, has a parameter volume (31.03 M) and calculation volume (0.2186 T FLOPs) at the middle level. Through the coordinated optimization mechanism of channel attention, spatial attention, and boundary attention, the model has achieved a significant improvement in segmentation performance under the premise of maintaining a reasonable parameter scale. Its 96.36% IoU and 98.11% F1 indicators are better than the comparative model. It is especially worth noting that compared with UNet (30.86 M) with similar parameters, DAENet only increases the parameter by 0.5%, which significantly improves the consistency of dividing the boundary through boundary attention, showing excellent parameter utilization efficiency. From the perspective of model architecture, DAENet’s computing overhead mainly comes from the collaborative modeling of global context information and local geometric constraints in its three-branch design. The experimental results show that compared with SegNet (16.50 M), the model achieved a 24.21 percentage point increase in IoU with an 88% increase in parameters, verifying the effectiveness of additional computing resource input.

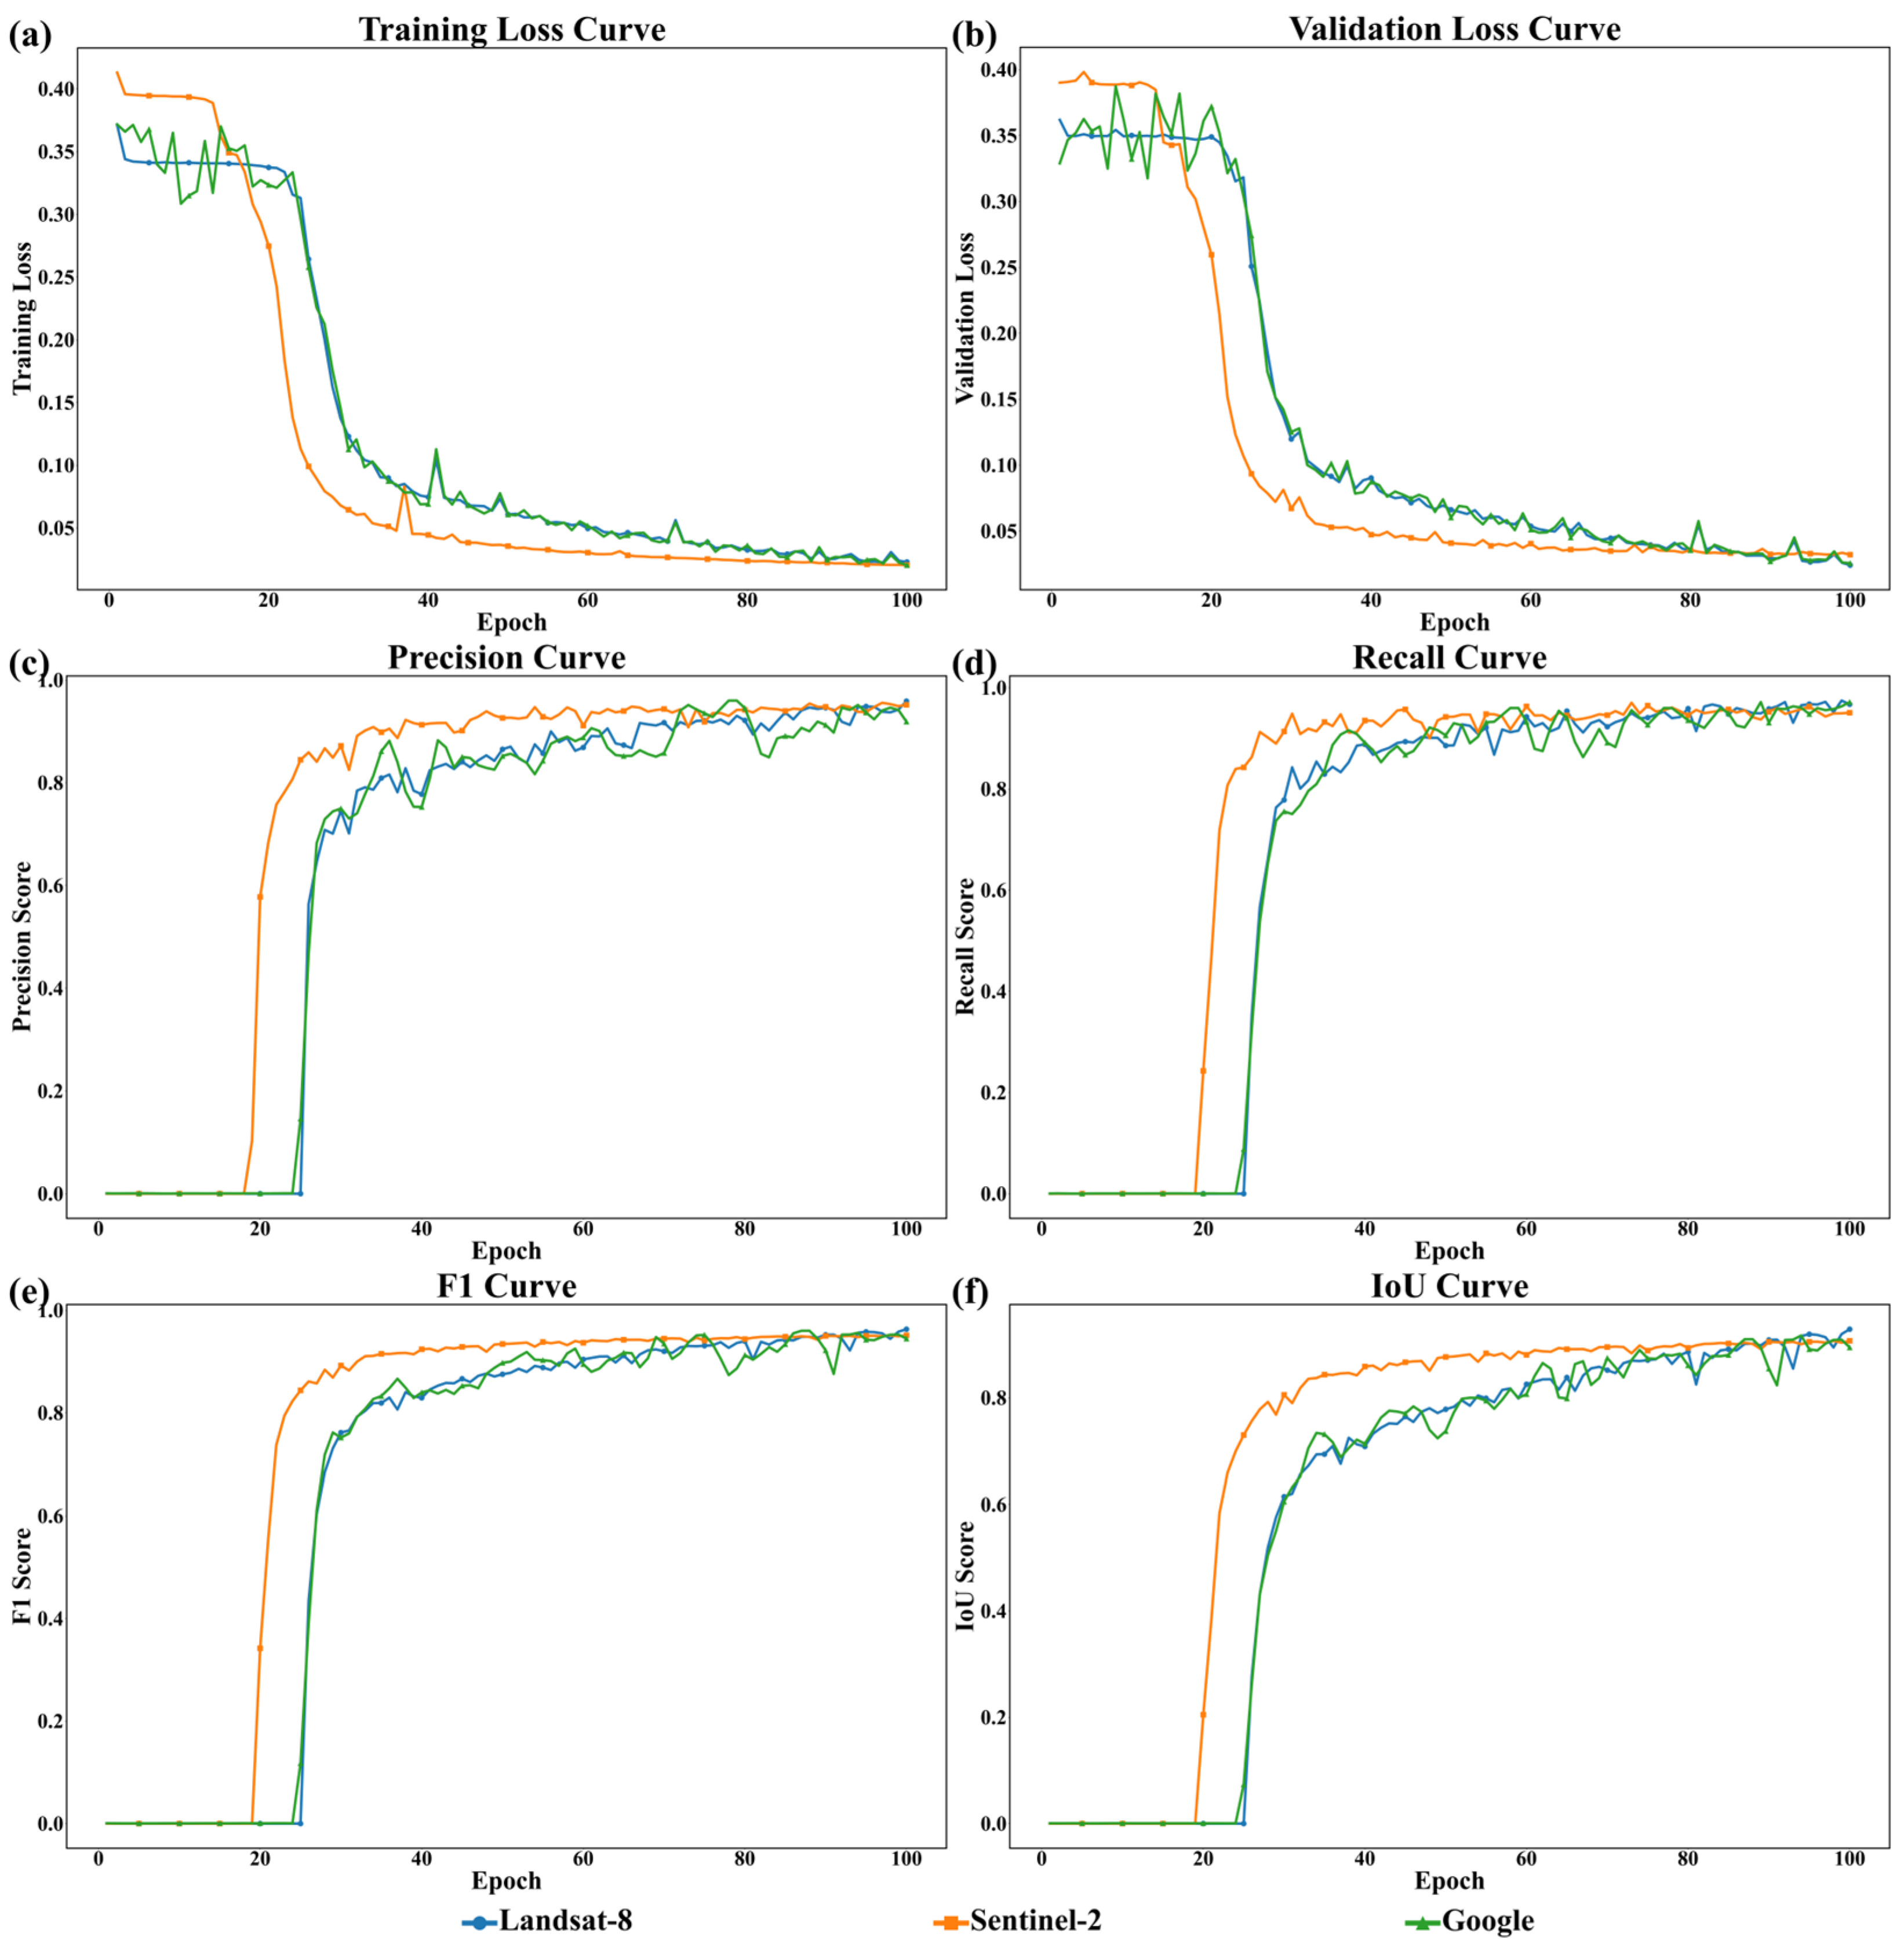
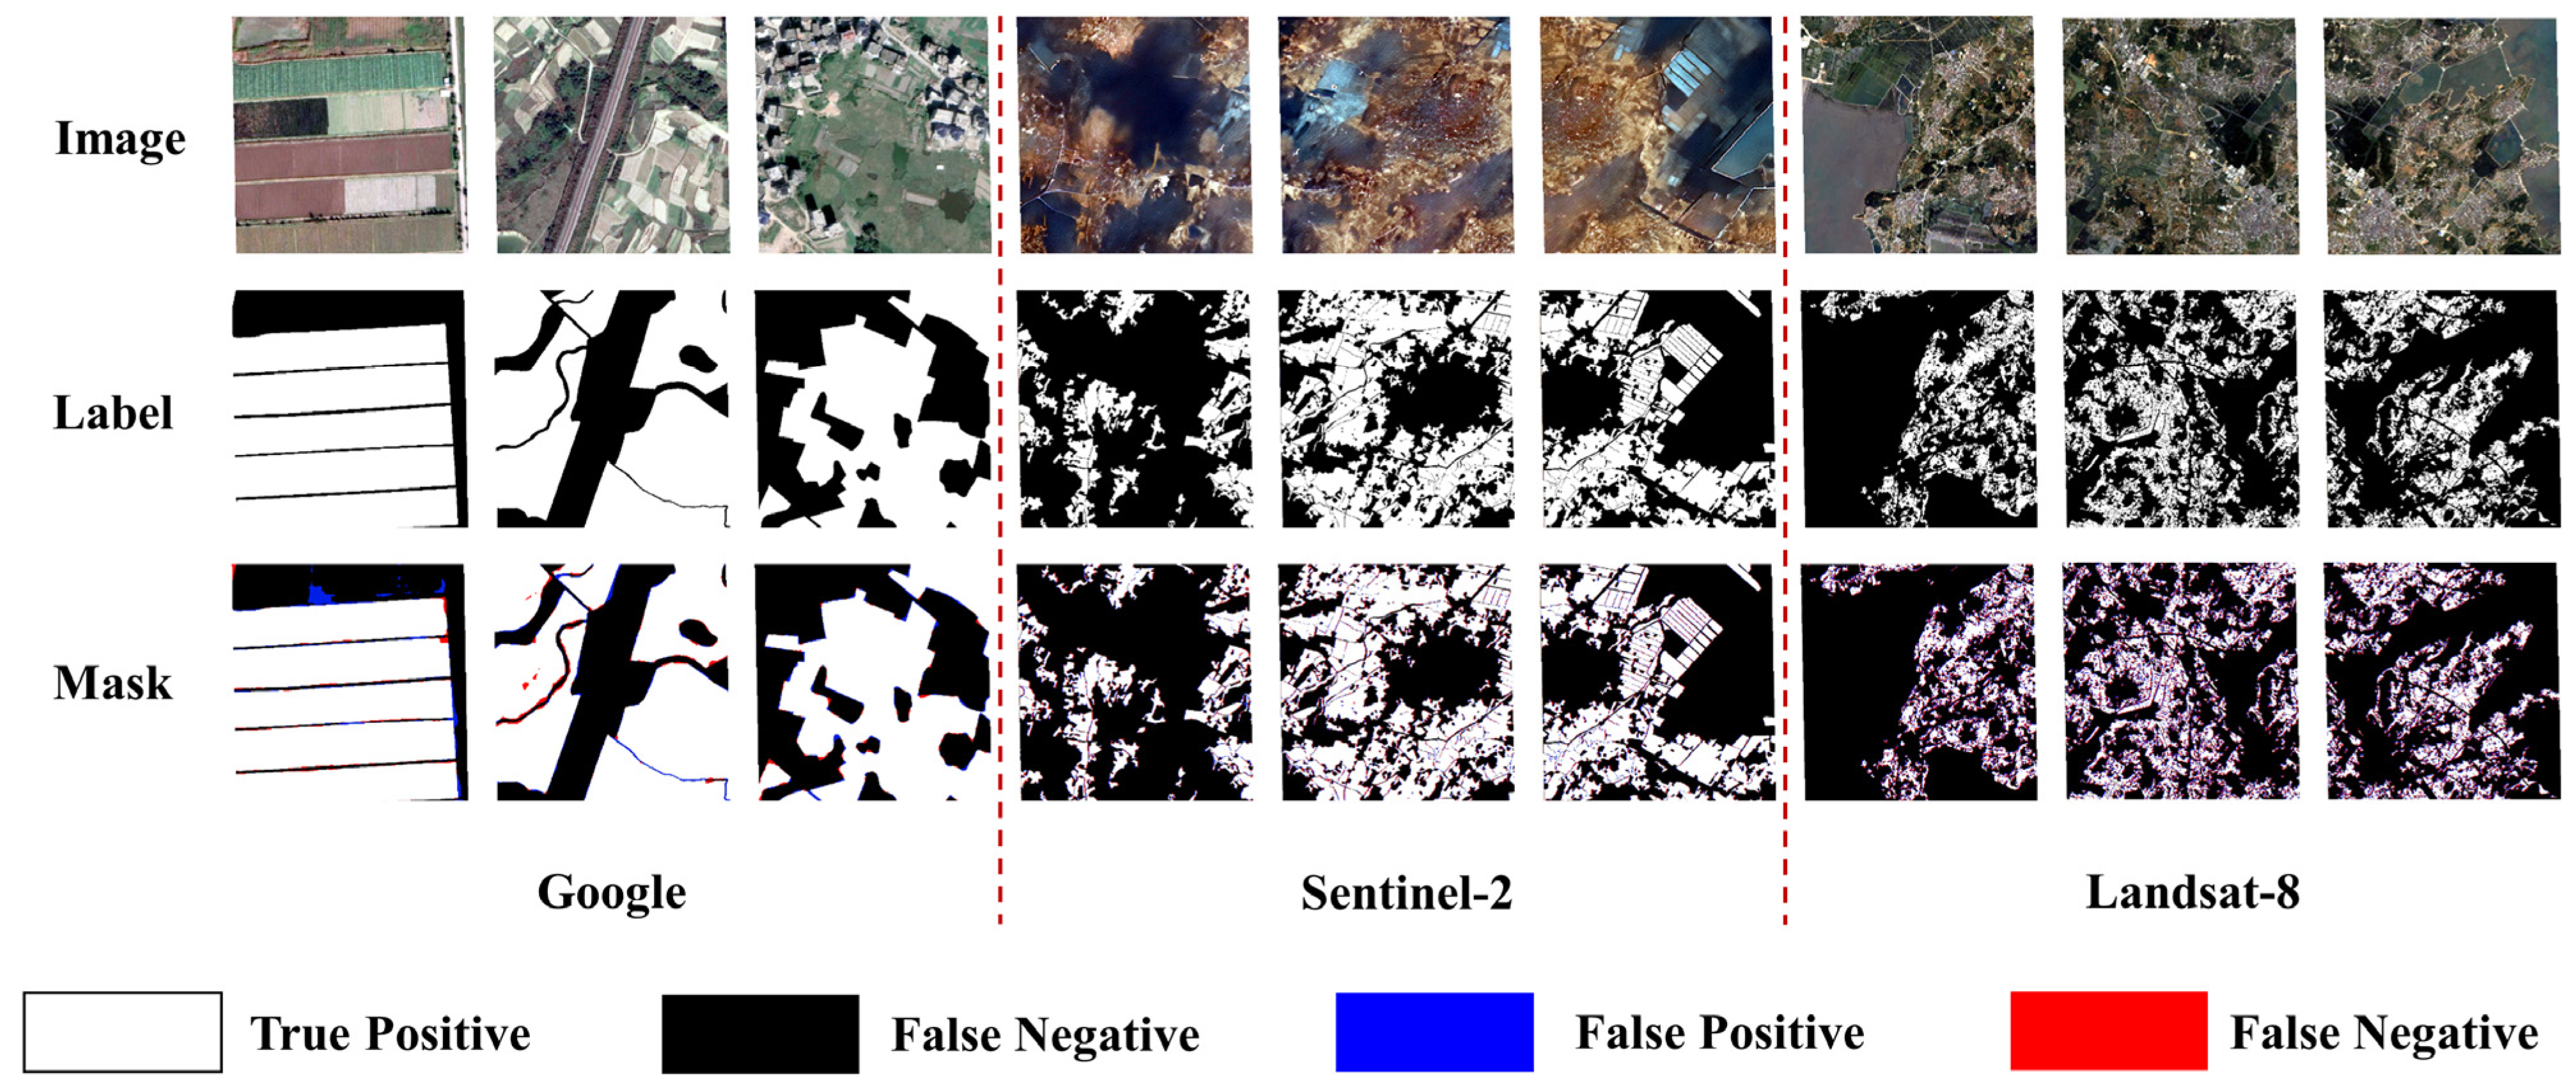
4.3. Generalization Performance on Multi-Resolution Satellite Data

To comprehensively assess the resilience and transferability of the proposed DAENet framework, we conducted a series of comparative experiments using three satellite imagery datasets with varying spatial resolutions: Landsat-8 (15 m), Sentinel-2 (10 m), and Google high-resolution imagery (0.6 m). All competing architectures were trained under identical hyperparameter settings for 100 epochs, ensuring a fair and controlled evaluation environment. The performance of each model was systematically evaluated using multiple quantitative metrics, including Precision, Recall, F1-score, and Intersection over Union (IoU). The detailed results of these evaluations are summarized in Table 4.
As illustrated in Figure 9, DAENet demonstrated consistent and accelerated convergence patterns across all three datasets, with both training and validation losses (Figure 9a,b) exhibiting steep reductions and achieving stabilization approximately by the 30th epoch. This uniform learning trajectory suggests the framework possesses not merely training efficiency but also high adaptability to differences in spatial resolution and sensor properties.
Regarding segmentation precision, DAENet uniformly achieved superior performance across all evaluation criteria and data sources. Notably, the IoU metrics surpassed 0.90 for each dataset—registering 0.9289 for Landsat-8; 0.9070 for Sentinel-2; and 0.9171 for Google imagery. These results demonstrated the framework’s capacity to precisely demarcate cropland boundaries despite differences in spatial resolution. Moreover, both precision and recall remained consistently high, exceeding 0.95 in all cases. It verifies the model’s reliability in correctly identifying true positives while minimizing erroneous classifications. The F1-scores persistently exceeded 0.95, indicating an optimal equilibrium between detection accuracy and coverage.
The qualitative assessments presented in Figure 10 provide additional confirmation of the results. Despite significant variations in spatial resolution, DAENet consistently generated superior segmentation outputs that closely corresponded with ground reference data (depicted in blue). The model effectively delineated fine-grained agricultural plots in high-resolution Google imagery as well as coarser cropland structures in the Landsat-8 and Sentinel-2 datasets. Particularly in regions characterized by discontinuous distribution and complex topography, DAENet preserved the geometric integrity of cropland boundaries. These results underscore the model’s robust multi-scale feature extraction capability and its adaptability to heterogeneous terrain and resolution variability.
These findings provide compelling evidence of DAENet’s transferability across multi-resolution datasets. The framework’s stable performance substantiates its suitability for heterogeneous remote sensing platforms and operational cropland delineation tasks across diverse spatial contexts. This validates its effectiveness for operational cropland delineation across diverse geographic and sensor contexts. Collectively, these characteristics render DAENet not only accurate and resilient but also scalable and practical for a wide range of real-world implementation scenarios in remote sensing-based agricultural monitoring.

4.4. Potential Improvements

Future research efforts may focus on enhancing the proposed architecture through three key avenues: Data diversification [39,40,41], algorithmic advancements [42,43,44], and extended verification [45,46,47]. Integrating temporal sequences and multi-sensor observations—such as Sentinel-1 SAR and hyperspectral imagery—holds promise for providing complementary spectral and textural features [48,49,50,51]. Such integration could substantially improve model robustness against common challenges, including atmospheric disturbances [52,53,54], phenological variability throughout the vegetation cycle [55,56,57,58], and terrain-induced distortions [4,59,60]. Furthermore, the synergistic fusion of optical and radar modalities may enhance the detection of critical agronomic attributes, such as crop structural patterns and soil-moisture dynamics [61,62,63].
From a methodological standpoint, integrating self-supervised [64,65,66] or semi-supervised learning paradigms [67,68,69] presents a viable path toward reducing reliance on labor-intensive annotated datasets. This would notably facilitate deployment in regions where labeled data are scarce. Furthermore, the inclusion of topographic variables, such as gradient, orientation, and altitude. These factors could be incorporated as supplementary inputs to more effectively represent landscape intricacy. Investigating sophisticated architectures, such as Transformer models [70,71,72,73] and graph-based neural networks [74,75,76], may additionally improve the framework’s capacity to capture long-range spatial dependencies and accommodate geospatial heterogeneity.
To ensure robustness and transferability, extensive validation across diverse agroecosystems is imperative. Evaluation under varying climatic conditions, agricultural practices [77,78,79], and crop phenological stages would contribute to a more generalizable model. Finally, the development of a publicly accessible benchmark dataset tailored to agricultural regions with complex terrain would provide a standardized platform for performance comparison and accelerate progress in precision agriculture and remote sensing-based cropland monitoring.
To extend the deep learning network proposed in this study to other regions and types of cropland, it is necessary to achieve generalization through three stages. (1) Data level: Collect localized data of the target area (such as coastal terrain images and characteristic crop samples), and combine domain adaptation techniques (transfer learning, unsupervised alignment) to address regional differences. (2) At the model level, modular architecture (replaceable classification heads) and attention mechanism are adopted to enhance feature generalization ability, and agricultural prior knowledge (phenological calendar and vegetation index) is embedded to constrain prediction logic. (3) Iterative level: Through multi-region hybrid training and online incremental learning continuous optimization, a unified framework that adapts to multiple terrains and crops is ultimately constructed.

5. Conclusions

This study presents DAENet, an attention-optimized deep learning architecture specifically tailored for high-precision cropland delineation in complex terrain. By integrating high-resolution GF-1 satellite data with the novel GOBR, the proposed framework effectively identifies fragmented, irregular, and topographically constrained cropland parcels with high accuracy. Extensive empirical evaluations underscore its superiority over state-of-the-art segmentation models, achieving an F1-score of 0.9811 and an IoU of 0.9636. Component-level analyses further confirm the complementary strengths of the CAM, MSAM, and BAM modules, which collectively enhance spectral sensitivity, multi-scale feature extraction, and boundary refinement.
Moreover, DAENet exhibits outstanding cross-sensor generalizability, maintaining IoU values above 0.90 across datasets of varying spatial resolutions, including Landsat-8, Sentinel-2, and Google high-resolution imagery. Its reliable performance in Fuqing City, a region marked by complex terrain and intensive agricultural use. It demonstrates the practical applicability for real-world land monitoring and precision farming. DAENet provides a solution for farmland extraction based on satellite. This work contributes significantly to sustainable land resource management and sets a strong foundation for future research in high-accuracy agricultural mapping.

Author Contributions

Conceptualization, Q.Z. and Y.W.; methodology, Y.W.; software, T.Z.; validation, M.Y. and S.H.; formal analysis, Q.Z.; investigation, M.Y.; resources, Q.Z.; data curation, Y.W.; writing—original draft preparation, Y.W.; writing—review and editing, Q.Z.; visualization, Y.W.; funding acquisition, Q.Z. All authors have read and agreed to the published version of the manuscript.

Funding

This research was funded by the National Key Research and Development Program Project of China, grant number 2023YFE0110400; Natural Resource Technology Innovation Projects of Fujian Province, grant number KY-030000-04-2024-033; and The Open Fund of the Key Laboratory of JiangHuai Arable Land Resources Protection and Eco-restoration, grant number ARPE-2024-KF01.

Data Availability Statement

The raw data supporting the conclusions of this article will be made available by the authors on request.

Acknowledgments

We would like to extend sincere gratitude to the academic editor and reviewers for their constructive comments, which greatly helped us to improve the quality of this manuscript.

Conflicts of Interest

Author Mingchao Yang was employed by the company China Coal Zhejiang Surveying and Mapping Geo-Information Co., Ltd. Author Tianxiang Zhang was employed by the company Zhejiang Zhixing Surveying and Mapping Geographic Information Co., Ltd. The remaining authors declare that the research was conducted in the absence of any commercial or financial relationships that could be construed as a potential conflict of interest. The founding sponsors had no role in the design of the study, in the collection, analyses, or interpretation of the data, in the writing of the manuscript, or in the decision to publish the results.

References

  1. Amin, E.; Verrelst, J.; Rivera-Caicedo, J.P.; Pipia, L.; Ruiz-Verdu, A.; Moreno, J. Prototyping Sentinel-2 green LAI and brown LAI products for cropland monitoring. Remote Sens. Environ. 2021, 255, 112168. [Google Scholar] [CrossRef] [PubMed]
  2. Du, R.; Xiang, Y.; Chen, J.; Lu, X.; Zhang, F.; Zhang, Z.; Yang, B.; Tang, Z.; Wang, X.; Qian, L. The daily soil water content monitoring of cropland in irrigation area using Sentinel-2/3 spatio-temporal fusion and machine learning. Int. J. Appl. Earth Obs. Geoinf. 2024, 132, 104081. [Google Scholar] [CrossRef]
  3. Shen, Q.; Deng, H.; Wen, X.; Chen, Z.; Xu, H. Statistical Texture Learning Method for Monitoring Abandoned Suburban Cropland Based on High-Resolution Remote Sensing and Deep Learning. IEEE J. Sel. Top. Appl. Earth Obs. Remote Sens. 2023, 16, 3060–3069. [Google Scholar] [CrossRef]
  4. Cheng, Z.; Chen, J.M.; Guo, Z.; Miao, G.; Zeng, H.; Wang, R.; Huang, Z.; Wang, Y. Improving UAV-Based LAI Estimation for Forests Over Complex Terrain by Reducing Topographic Effects on Multispectral Reflectance. IEEE Trans. Geosci. Remote Sens. 2024, 62, 4400119. [Google Scholar] [CrossRef]
  5. Yang, Q.; Tang, F.; Tian, Z.; Xue, J.; Zhu, C.; Su, Y.; Li, P. Intelligent processing of UAV remote sensing data for building high-precision DEMs in complex terrain: A case study of Loess Plateau in China. Int. J. Appl. Earth Obs. Geoinf. 2024, 134, 104187. [Google Scholar] [CrossRef]
  6. Zhou, Z.; Wu, J.; Wang, C.; Wang, J.; Cheng, F. A Synchronous Acquisition Method for Dominant Tree Species and Forest Age in Complex Mountainous Terrain Through Growth Characteristics Matching. IEEE Trans. Geosci. Remote Sens. 2025, 63, 4403518. [Google Scholar] [CrossRef]
  7. Benami, E.; Jin, Z.; Carter, M.R.; Ghosh, A.; Hijmans, R.J.; Hobbs, A.; Kenduiywo, B.; Lobell, D.B. Uniting remote sensing, crop modelling and economics for agricultural risk management. Nat. Rev. Earth Environ. 2024, 5, 907. [Google Scholar] [CrossRef]
  8. Khattak, W.A.; Sun, J.; Zaman, F.; Jalal, A.; Shafiq, M.; Manan, S.; Hameed, R.; Khan, I.; Khan, I.U.; Khan, K.A.; et al. The role of agricultural land management in modulating water-carbon interplay within dryland ecological systems. Agric. Ecosyst. Environ. 2025, 378, 109315. [Google Scholar] [CrossRef]
  9. Navarro, A.; Silva, I.; Catalao, J.; Falcao, J. An operational Sentinel-2 based monitoring system for the management and control of direct aids to the farmers in the context of the Common Agricultural Policy (CAP): A case study in mainland Portugal. Int. J. Appl. Earth Obs. Geoinf. 2021, 103, 102469. [Google Scholar] [CrossRef]
  10. Meijninger, W.; Elbersen, B.; van Eupen, M.; Mantel, S.; Ciria, P.; Parenti, A.; Sanz Gallego, M.; Perez Ortiz, P.; Acciai, M.; Monti, A. Identification of early abandonment in cropland through radar-based coherence data and application of a Random-Forest model. Glob. Change Biol. Bioenergy 2022, 14, 735–755. [Google Scholar] [CrossRef]
  11. Rahman, M.S.; Di, L.; Yu, E.; Zhang, C.; Mohiuddin, H. In-Season Major Crop-Type Identification for US Cropland from Landsat Images Using Crop-Rotation Pattern and Progressive Data Classification. Agriculture 2019, 9, 17. [Google Scholar] [CrossRef]
  12. Xu, F.; Yao, X.; Zhang, K.; Yang, H.; Feng, Q.; Li, Y.; Yan, S.; Gao, B.; Li, S.; Yang, J.; et al. Deep learning in cropland field identification: A review. Comput. Electron. Agric. 2024, 222, 109042. [Google Scholar] [CrossRef]
  13. Jaafar, H.H.; Sujud, L.H. High-resolution satellite imagery reveals a recent accelerating rate of increase in land evapotranspiration. Remote Sens. Environ. 2024, 315, 114489. [Google Scholar] [CrossRef]
  14. Li, M.; Lu, C.; Lin, M.; Xiu, X.; Long, J.; Wang, X. Extracting vectorized agricultural parcels from high-resolution satellite images using a Point-Line-Region interactive multitask model. Comput. Electron. Agric. 2025, 231, 109953. [Google Scholar] [CrossRef]
  15. Zhu, X.; Wang, T.; Skidmore, A.K.; Lee, S.J.; Duporge, I. Mitigating terrain shadows in very high-resolution satellite imagery for accurate evergreen conifer detection using bi-temporal image fusion. Int. J. Appl. Earth Obs. Geoinf. 2024, 134, 104244. [Google Scholar] [CrossRef]
  16. Jin, M.; Liu, X.; Wu, L.; Liu, M. Distinguishing Heavy-Metal Stress Levels in Rice Using Synthetic Spectral Index Responses to Physiological Function Variations. IEEE J. Sel. Top. Appl. Earth Obs. Remote Sens. 2017, 10, 75–86. [Google Scholar] [CrossRef]
  17. Tian, L.; Wang, Z.; Xue, B.; Li, D.; Zheng, H.; Yao, X.; Zhu, Y.; Cao, W.; Cheng, T. A disease-specific spectral index tracks Magnaporthe oryzae infection in paddy rice from ground to space. Remote Sens. Environ. 2023, 285, 113384. [Google Scholar] [CrossRef]
  18. Yuan, W.; Meng, Y.; Li, Y.; Ji, Z.; Kong, Q.; Gao, R.; Su, Z. Research on rice leaf area index estimation based on fusion of texture and spectral information. Comput. Electron. Agric. 2023, 211, 108016. [Google Scholar] [CrossRef]
  19. Akinyemi, F.; Speranza, C. Land transformation across agroecological zones reveals expanding cropland and settlement at the expense of tree-cover and wetland areas in Nigeria. Geo-Spat. Inf. Sci. 2024, 6, 1–21. [Google Scholar] [CrossRef]
  20. Wang, J.; Xiao, X.; Liu, L.; Wu, X.; Qin, Y.; Steiner, J.L.; Dong, J. Mapping sugarcane plantation dynamics in Guangxi, China, by time series Sentinel-1, Sentinel-2 and Landsat images. Remote Sens. Environ. 2020, 247, 111951. [Google Scholar] [CrossRef]
  21. Yang, J.; Hu, Q.; Li, W.; Song, Q.; Cai, Z.; Zhang, X.; Wei, H.; Wu, W. An automated sample generation method by integrating phenology domain optical-SAR features in rice cropping pattern mapping. Remote Sens. Environ. 2024, 314, 114387. [Google Scholar] [CrossRef]
  22. Zhao, Z.; Dong, J.; Zhang, G.; Yang, J.; Liu, R.; Wu, B.; Xiao, X. Improved phenology-based rice mapping algorithm by integrating optical and radar data. Remote Sens. Environ. 2024, 315, 114460. [Google Scholar] [CrossRef]
  23. Li, H.; Lin, H.; Luo, J.; Wang, T.; Chen, H.; Xu, Q.; Zhang, X. Fine-Grained Abandoned Cropland Mapping in Southern China Using Pixel Attention Contrastive Learning. IEEE J. Sel. Top. Appl. Earth Obs. Remote Sens. 2024, 17, 2283–2295. [Google Scholar] [CrossRef]
  24. Zhao, H.; Long, J.; Zhang, M.; Wu, B.; Xu, C.; Tian, F.; Ma, Z. Irregular Agricultural Field Delineation Using a Dual-Branch Architecture From High-Resolution Remote Sensing Images. IEEE Geosci. Remote Sens. Lett. 2024, 21, 3448628. [Google Scholar] [CrossRef]
  25. Long, J.; Li, M.; Wang, X.; Stein, A. Delineation of agricultural fields using multi-task BsiNet from high-resolution satellite images. Int. J. Appl. Earth Obs. Geoinf. 2022, 112, 102871. [Google Scholar] [CrossRef]
  26. Zhong, H.; Wu, C. T-UNet: Triplet UNet for change detection in high-resolution remote sensing images. Geo-Spat. Inf. Sci. 2024, 4, 1–18. [Google Scholar] [CrossRef]
  27. Liu, X.; He, W.; Liu, W.; Yin, G.; Zhang, H. Mapping annual center-pivot irrigated cropland in Brazil during the 1985–2021 period with cloud platforms and deep learning. ISPRS J. Photogramm. Remote Sens. 2023, 205, 227–245. [Google Scholar] [CrossRef]
  28. Mpakairi, K.S.; Dube, T.; Sibanda, M.; Mutanga, O. Fine-scale characterization of irrigated and rainfed croplands at national scale using multi-source data, random forest, and deep learning algorithms. ISPRS J. Photogramm. Remote Sens. 2023, 204, 117–130. [Google Scholar] [CrossRef]
  29. Yue, J.; Tian, Q.; Liu, Y.; Fu, Y.; Tian, J.; Zhou, C.; Feng, H.; Yang, G. Mapping cropland rice residue cover using a radiative transfer model and deep learning. Comput. Electron. Agric. 2023, 215, 108421. [Google Scholar] [CrossRef]
  30. Lazin, R.; Shen, X.; Anagnostou, E. Estimation of flood-damaged cropland area using a convolutional neural network. Environ. Res. Lett. 2021, 16, 054011. [Google Scholar] [CrossRef]
  31. Zhang, D.; Pan, Y.; Zhang, J.; Hu, T.; Zhao, J.; Li, N.; Chen, Q. A generalized approach based on convolutional neural networks for large area cropland mapping at very high resolution. Remote Sens. Environ. 2020, 247, 111912. [Google Scholar] [CrossRef]
  32. Zhao, S.; Liu, X.; Ding, C.; Liu, S.; Wu, C.; Wu, L. Mapping Rice Paddies in Complex Landscapes with Convolutional Neural Networks and Phenological Metrics. GIScience Remote Sens. 2020, 57, 37–48. [Google Scholar] [CrossRef]
  33. Long, J.; Zhang, Z.; Zhang, Q.; Zhao, X.; Igathinathane, C.; Xing, J.; Saha, C.K.; Sheng, W.; Li, H.; Zhang, M. Comprehensive wheat lodging detection under different UAV heights using machine/deep learning models☆. Comput. Electron. Agric. 2025, 231, 109972. [Google Scholar] [CrossRef]
  34. Sharifi, A.; Safari, M.M. Enhancing the Spatial Resolution of Sentinel-2 Images Through Super-Resolution Using Transformer-Based Deep-Learning Models. IEEE J. Sel. Top. Appl. Earth Obs. Remote Sens. 2025, 18, 4805–4820. [Google Scholar] [CrossRef]
  35. Yao, Y.; Gao, R.; Wu, H.; Dong, A.; Hu, Z.; Ma, Y.; Guan, Q.; Luo, P. Explainable Mapping of the Irregular Land Use Parcel With a Data Fusion Deep-Learning Model. IEEE Trans. Geosci. Remote Sens. 2025, 63, 5612015. [Google Scholar] [CrossRef]
  36. Mohammadi, S.; Belgiu, M.; Stein, A. A source-free unsupervised domain adaptation method for cross-regional and cross-time crop mapping from satellite image time series. Remote Sens. Environ. 2024, 314, 114385. [Google Scholar] [CrossRef]
  37. Wu, Y.; Peng, Z.; Hu, Y.; Wang, R.; Xu, T. A dual-branch network for crop-type mapping of scattered small agricultural fields in time series remote sensing images. Remote Sens. Environ. 2025, 316, 114497. [Google Scholar] [CrossRef]
  38. Zhao, H.; Wu, B.; Zhang, M.; Long, J.; Tian, F.; Xie, Y.; Zeng, H.; Zheng, Z.; Ma, Z.; Wang, M.; et al. A large-scale VHR parcel dataset and a novel hierarchical semantic boundary-guided network for agricultural parcel delineation. ISPRS J. Photogramm. Remote Sens. 2025, 221, 1–19. [Google Scholar] [CrossRef]
  39. Guo, D.; Li, Z.; Gao, X.; Gao, M.; Yu, C.; Zhang, C.; Shi, W. RealFusion: A reliable deep learning-based spatiotemporal fusion framework for generating seamless fine-resolution imagery. Remote Sens. Environ. 2025, 321, 114689. [Google Scholar] [CrossRef]
  40. Jiao, L.; Luo, P.; Huang, R.; Xu, Y.; Ye, Z.; Liu, S.; Liu, S.; Tong, X. Modeling hydrous mineral distribution on Mars with extremely sparse data: A multi-scale spatial association modeling framework. ISPRS J. Photogramm. Remote Sens. 2025, 222, 16–32. [Google Scholar] [CrossRef]
  41. Li, J.; Wei, Y.; Lin, L.; Yuan, Q.; Shen, H. Two-stage downscaling and correction cascade learning framework for generating long-time series seamless soil moisture. Remote Sens. Environ. 2025, 321, 114884. [Google Scholar] [CrossRef]
  42. Lu, H.; Li, B.; Yang, G.; Fan, G.; Wang, H.; Pang, Y.; Wang, Z.; Lian, Y.; Xu, H.; Huang, H. Towards a point cloud understanding framework for forest scene semantic segmentation across forest types and sensor platforms. Remote Sens. Environ. 2025, 318, 114591. [Google Scholar] [CrossRef]
  43. Zhang, B.; Wang, Z.; Liang, B.; Dong, L.; Feng, Z.; He, M.; Feng, Z. A lightweight spatiotemporal classification framework for tree species with entropy-based change resistance filter using satellite imagery. Int. J. Appl. Earth Obs. Geoinf. 2025, 138, 104449. [Google Scholar] [CrossRef]
  44. Zhou, T.; Zhang, G.; Wang, J.; Zhu, Z.; Woolway, R.I.; Han, X.; Xu, F.; Peng, J. A novel framework for accurate, automated and dynamic global lake mapping based on optical imagery. ISPRS J. Photogramm. Remote Sens. 2025, 221, 280–298. [Google Scholar] [CrossRef]
  45. Li, N.; Feng, Y.; Diao, W.; Sun, X.; Cheng, L.; Fu, K. DeepGolf: A fine-grained perception framework for golf course distribution in the real world based on multi-source remote sensing data. Int. J. Appl. Earth Obs. Geoinf. 2025, 136, 104394. [Google Scholar] [CrossRef]
  46. Meng, X.; Bao, Y.; Zhang, X.; Luo, C.; Liu, H. A long-term global Mollisols SOC content prediction framework: Integrating prior knowledge, geographical partitioning, and deep learning models with spatio-temporal validation. Remote Sens. Environ. 2025, 318, 114592. [Google Scholar] [CrossRef]
  47. Tian, S.; Sha, A.; Luo, Y.; Ke, Y.; Spencer, R.; Hu, X.; Ning, M.; Zhao, Y.; Deng, R.; Gao, Y.; et al. A novel framework for river organic carbon retrieval through satellite data and machine learning. ISPRS J. Photogramm. Remote Sens. 2025, 221, 109–123. [Google Scholar] [CrossRef]
  48. Vizzari, M.; Lesti, G.; Acharki, S. Crop classification in Google Earth Engine: Leveraging Sentinel-1, Sentinel-2, European CAP data, and object-based machine-learning approaches. Geo-Spat. Inf. Sci. 2024, 4, 1–16. [Google Scholar] [CrossRef]
  49. Dong, F.; Yin, Q.; Hong, W. An Improved Man-Made Structure Detection Method for Multi-aspect Polarimetric SAR Data. IEEE J. Sel. Top. Appl. Earth Obs. Remote Sens. 2025, 18, 5717–5732. [Google Scholar] [CrossRef]
  50. Lang, P.; Fu, X.; Dong, J.; Yang, H.; Yin, J.; Yang, J.; Martorella, M. Recent Advances in Deep-Learning-Based SAR Image Target Detection and Recognition. IEEE J. Sel. Top. Appl. Earth Obs. Remote Sens. 2025, 18, 6884–6915. [Google Scholar] [CrossRef]
  51. Zhang, H.; Ma, G.; Wang, D.; Zhang, Y. M3ICNet: A cross-modal resolution preserving building damage detection method with optical and SAR remote sensing imagery and two heterogeneous image disaster datasets. ISPRS J. Photogramm. Remote Sens. 2025, 221, 224–250. [Google Scholar] [CrossRef]
  52. Hazaymeh, K.; Al-Jarrah, M. Assessing the impact of land cover on air quality parameters in Jordan: A spatiotemporal study using remote sensing and cloud computing (2019–2022). Int. J. Appl. Earth Obs. Geoinf. 2024, 135, 104293. [Google Scholar] [CrossRef]
  53. He, S.; Le, C. Retrieving the Concentration of Particulate Inorganic Carbon for Cloud-Covered Coccolithophore Bloom Waters Based on a Machine-Learning Approach. IEEE Trans. Geosci. Remote Sens. 2024, 62, 4205010. [Google Scholar] [CrossRef]
  54. Liu, J.; Zhang, Y.; Feng, Q.; Yin, G.; Zhang, D.; Li, Y.; Gong, J.; Li, Y.; Li, J. Understanding urban expansion and shrinkage via green plastic cover mapping based on GEE cloud platform: A case study of Shandong, China. Int. J. Appl. Earth Obs. Geoinf. 2024, 128, 103749. [Google Scholar] [CrossRef]
  55. Cong, N.; Du, Z.; Zheng, Z.; Zhao, G.; Sun, D.; Zu, J.; Zhang, Y. Altitude explains insignificant autumn phenological changes across regions with large topography relief in the Tibetan Plateau. Sci. Total Environ. 2024, 921, 171088. [Google Scholar] [CrossRef]
  56. Gu, Z.; Chen, J.; Chen, Y.; Qiu, Y.; Zhu, X.; Chen, X. Agri-Fuse: A novel spatiotemporal fusion method designed for agricultural scenarios with diverse phenological changes. Remote Sens. Environ. 2023, 299, 113874. [Google Scholar] [CrossRef]
  57. Sun, C.; Li, J.; Liu, Y.; Zhao, S.; Zheng, J.; Zhang, S. Tracking annual changes in the distribution and composition of saltmarsh vegetation on the Jiangsu coast of China using Landsat time series-based phenological parameters. Remote Sens. Environ. 2023, 284, 113370. [Google Scholar] [CrossRef]
  58. Wang, H.; Ye, Z.; Yao, Y.; Chang, W.; Liu, J.; Zhao, Y.; Li, S.; Liu, Z.; Zhang, X. Improving cross-regional model transfer performance in crop classification by crop time series correction. Geo-Spat. Inf. Sci. 2024, 11, 1–16. [Google Scholar] [CrossRef]
  59. Moudry, V.; Gdulova, K.; Gabor, L.; Sarovcova, E.; Bartak, V.; Leroy, F.; Spatenkova, O.; Rocchini, D.; Prosek, J. Effects of environmental conditions on ICESat-2 terrain and canopy heights retrievals in Central European mountains. Remote Sens. Environ. 2022, 279, 113112. [Google Scholar] [CrossRef]
  60. Wan, W.; Zhao, L.; Zhang, J.; Liang, H.; Guo, Z.; Liu, B.; Ji, R. Toward Terrain Effects on GNSS Interferometric Reflectometry Snow Depth Retrievals: Geometries, Modeling, and Applications. IEEE Trans. Geosci. Remote Sens. 2022, 60, 4415514. [Google Scholar] [CrossRef]
  61. Chen, X.; Huang, Y.; Yu, X.; Mao, Y.; Zhang, Z.; Chen, Z.; Hong, W. A RFI Mitigation Approach for Spaceborne SAR Using Homologous Interference Knowledge at Coastal Regions. IEEE J. Sel. Top. Appl. Earth Obs. Remote Sens. 2025, 18, 5990–6006. [Google Scholar] [CrossRef]
  62. Liu, C.; Deng, Y.; Zhang, Z.; Fan, H.; Zhang, H.; Qi, X.; Wang, W. TNN-STME: A Matrix Decomposition Method for SAR Ship Real-Time Detection Using 2-D Asymmetric Resolution Mode. IEEE J. Sel. Top. Appl. Earth Obs. Remote Sens. 2025, 18, 7221–7235. [Google Scholar] [CrossRef]
  63. Song, H.; Wang, B.; Qian, X.; Gu, Y.; Jin, G.; Yang, R. Enhancing Water Extraction for Dual-Polarization SAR Images Based on Adaptive Feature Fusion and Hybrid MLP Network. IEEE J. Sel. Top. Appl. Earth Obs. Remote Sens. 2025, 18, 6953–6967. [Google Scholar] [CrossRef]
  64. Liu, J.; Luo, H.; Zhang, W.; Liu, F.; Xiao, L. Multiscale Self-Supervised Constraints and Change-Masks-Guided Network for Weakly Supervised Change Detection. IEEE Trans. Geosci. Remote Sens. 2025, 63, 4701415. [Google Scholar] [CrossRef]
  65. Lu, K.; Zhang, R.; Huang, X.; Xie, Y.; Ning, X.; Zhang, H.; Yuan, M.; Zhang, P.; Wang, T.; Liao, T. Pattern Integration and Enhancement Vision Transformer for Self-Supervised Learning in Remote Sensing. IEEE Trans. Geosci. Remote Sens. 2025, 63, 5613913. [Google Scholar] [CrossRef]
  66. Yang, R.; Zhong, Y.; Su, Y. Self-Supervised Joint Representation Learning for Urban Land-Use Classification With Multisource Geographic Data. IEEE Trans. Geosci. Remote Sens. 2025, 63, 5608021. [Google Scholar] [CrossRef]
  67. Dai, A.; Yang, J.; Zhang, Y.; Zhang, T.; Tang, K.; Xiao, X.; Zhang, S. A difference enhancement and class-aware rebalancing semi-supervised network for cropland semantic change detection. Int. J. Appl. Earth Obs. Geoinf. 2025, 137, 104415. [Google Scholar] [CrossRef]
  68. Duan, W.; Ji, L.; Huang, J.; Chen, S.; Peng, S.; Zhu, S.; Ye, M. Semi-Supervised Multiview Prototype Learning With Motion Reconstruction for Moving Infrared Small Target Detection. IEEE Trans. Geosci. Remote Sens. 2025, 63, 5001215. [Google Scholar] [CrossRef]
  69. Shi, Y.; Zhang, B.; Xu, J.; Wang, Y.; Jin, Z. Joint Supervised and Semi-Supervised Seismic Velocity Model Building Based on VGU Network. IEEE Trans. Geosci. Remote Sens. 2025, 63, 5905514. [Google Scholar] [CrossRef]
  70. Li, D.; Neira-Molina, H.; Huang, M.; Syam, M.S.; Yu, Z.; Zhang, J.; Bhatti, U.A.; Asif, M.; Sarhan, N.; Awwad, E.M. CSTFNet: A CNN and Dual Swin-Transformer Fusion Network for Remote Sensing Hyperspectral Data Fusion and Classification of Coastal Areas. IEEE J. Sel. Top. Appl. Earth Obs. Remote Sens. 2025, 18, 5853–5865. [Google Scholar] [CrossRef]
  71. Li, Z.; Zhang, Z.; Li, M.; Zhang, L.; Peng, X.; He, R.; Shi, L. Dual Fine-Grained network with frequency Transformer for change detection on remote sensing images. Int. J. Appl. Earth Obs. Geoinf. 2025, 136, 104393. [Google Scholar] [CrossRef]
  72. Xu, A.; Xue, Z.; Li, Z.; Cheng, S.; Su, H.; Xia, J. UM2Former: U-Shaped Multimixed Transformer Network for Large-Scale Hyperspectral Image Semantic Segmentation. IEEE Trans. Geosci. Remote Sens. 2025, 63, 5506221. [Google Scholar] [CrossRef]
  73. Wang, D.; Chen, X.; Guo, N.; Yi, H.; Li, Y. STCD: Efficient Siamese transformers-based change detection method for remote sensing images. Geo-Spat. Inf. Sci. 2024, 27, 1192–1211. [Google Scholar] [CrossRef]
  74. Li, Z.; Ma, Y.; Mei, X.; Ma, J. Two-view correspondence learning using graph neural network with reciprocal neighbor attention. ISPRS J. Photogramm. Remote Sens. 2023, 202, 114–124. [Google Scholar] [CrossRef]
  75. Lin, C.-H.; Lin, T.-H.; Chanussot, J. Quantum Information-Empowered Graph Neural Network for Hyperspectral Change Detection. IEEE Trans. Geosci. Remote Sens. 2024, 62, 5537615. [Google Scholar] [CrossRef]
  76. Zhao, E.; Qu, N.; Wang, Y.; Gao, C.; Duan, S.-B.; Zeng, J.; Zhang, Q. Thermal Infrared Hyperspectral Band Selection via Graph Neural Network for Land Surface Temperature Retrieval. IEEE Trans. Geosci. Remote Sens. 2024, 62, 5003414. [Google Scholar] [CrossRef]
  77. Hashemi, F.S.; Zoej, M.J.V.; Youssefi, F.; Li, H.; Shafian, S.; Farnaghi, M.; Pirasteh, S. Integrating RS data with fuzzy decision systems for innovative crop water needs assessment. Int. J. Appl. Earth Obs. Geoinf. 2025, 136, 104338. [Google Scholar] [CrossRef]
  78. Rui, Z.; Zhang, Z.; Zhang, M.; Azizi, A.; Igathinathane, C.; Cen, H.; Vougioukas, S.; Li, H.; Zhang, J.; Jiang, Y.; et al. High-throughput proximal ground crop phenotyping systems—A comprehensive review. Comput. Electron. Agric. 2024, 224, 109108. [Google Scholar] [CrossRef]
  79. Sisheber, B.; Marshall, M.; Mengistu, D.; Nelson, A. Assimilation of Earth Observation Data for Crop Yield Estimation in Smallholder Agricultural Systems. IEEE J. Sel. Top. Appl. Earth Obs. Remote Sens. 2024, 17, 557–572. [Google Scholar] [CrossRef]
Figure 1. Geographical locations of study area, triangles represent the location of cropland examples, and numbers 1–4 represent the numbering of cropland examples. (a) China’s border map; (b) DEM and distribution map of ground real sampling points in Fuqing; (c) Location distribution of orthophoto and cropland examples in Fuqing; (dg) Examples of cropland.
Agriculture 15 01318 g001
Figure 2. The flow chart of dataset construction.
Agriculture 15 01318 g002
Figure 3. Spatial distribution of samples, triangles represent the location of the cropland sample examples, and numbers 1–4 represent the numbering of the cropland sample examples. (a) Overall spatial distribution map of cropland samples in Fuqing; (be) Sample diagrams of cropland.
Agriculture 15 01318 g003
Figure 4. The architecture of DAENet.
Agriculture 15 01318 g004
Figure 5. Comparison with other networks. (ad) The extraction results of cropland by different network models in different regions.
Agriculture 15 01318 g005
Figure 6. Comparison diagram of ablation experiment results. (ac) The results of ablation experiments on cropland in different regions.
Agriculture 15 01318 g006
Figure 7. (a) Map of cropland results for the study area, triangles represent the location of the details of mapping, and numbers 1–4 represent the number of the details of mapping. (be) The details of mapping.
Agriculture 15 01318 g007
Figure 8. The metric curves based on different networks. (a) The training loss curve; (b) The validation loss curve; (c) The precision curve; (d) The recall curve; (e) The F1 curve; (f) The IoU curve.
Agriculture 15 01318 g008
Figure 9. The metric curves based on different data. (a) The training loss curve; (b) The validation loss curve; (c) The precision curve; (d) The recall curve; (e) The F1 curve; (f) The IoU curve.
Agriculture 15 01318 g009
Figure 10. The segmentation of cropland on different data.
Agriculture 15 01318 g010
Table 1. Comparisons of DAENet with other networks.
NetworkPrecisionRecallF1-ScoreIoU
DANet0.79430.72310.74920.6186
DeepLabv3Plus0.93620.93520.93540.8879
LinkNet0.57130.47720.49170.3626
OCRNet0.25450.21540.22610.1469
PSPNet0.75590.87340.80940.6828
SegNet0.87970.86720.87310.7758
UNet0.96050.96030.96040.9239
BFINet0.62390.28340.37150.2404
BsiNet0.86720.87420.87000.7720
Ours0.98260.97970.98110.9636
Table 2. The metric results of ablation study.
VariantPrecisionRecallF1-ScoreIoU
Baseline0.95630.95830.95710.9234
+CAM0.96500.95670.96520.9361
+MSAM0.96680.96750.96710.9392
+BAM0.96870.96910.96880.9410
+CAM + MSAM0.97230.97400.97310.9503
+CAM + BAM0.97400.97520.97470.9532
+MSAM + BAM0.97310.97580.97520.9540
Ours0.98260.97970.98110.9636
Table 3. Comparison of the number of model parameters.
NetworkParams (M)FLOPs (T)MACs (G)Avg Time/Epoch (S)
DANet32.360.2204110.22919.36
DeepLabv3Plus57.680.2410120.49583.25
LinkNet7.361.9299964.971484.71
OCRNet25.060.021810.90622.48
PSPNet4.400.029414.68349.89
SegNet16.500.095247.61535.16
UNet30.860.2075108.79573.03
BFINet5.330.058429.21383.21
BsiNet7.850.193396.65427.95
Ours31.030.2186109.30575.72
Table 4. The metric results based on different data.
DataPrecisionRecallF1-ScoreIoU
Landsat-80.95890.96740.96310.9289
Sentinel-20.95170.95070.95120.9070
Google0.95140.96070.95600.9171
GaoFen-10.98260.97970.98110.9636
Disclaimer/Publisher’s Note: The statements, opinions and data contained in all publications are solely those of the individual author(s) and contributor(s) and not of MDPI and/or the editor(s). MDPI and/or the editor(s) disclaim responsibility for any injury to people or property resulting from any ideas, methods, instructions or products referred to in the content.

