Article

YOLOv8-LSW: A Lightweight Bitter Melon Leaf Disease Detection Model

1
College of Horticulture, Fujian Agriculture and Forestry University, Fuzhou 350002, China
2
Institute of Vegetables, Hunan Academy of Agricultural Sciences, Changsha 410125, China
3
Fujian Agricultural Machinery Extension Station, Fuzhou 350001, China
4
Fujian Plantation Technology Extension Station, Fuzhou 350001, China
*
Author to whom correspondence should be addressed.
These authors contributed equally to the work.
Agriculture 2025, 15(12), 1281; https://doi.org/10.3390/agriculture15121281 (registering DOI)
Submission received: 9 May 2025 / Revised: 9 June 2025 / Accepted: 11 June 2025 / Published: 13 June 2025
(This article belongs to the Section Digital Agriculture)

Abstract

:
Bitter melon, an important medicinal and edible economic crop, is often threatened by diseases such as downy mildew, powdery mildew, viral diseases, anthracnose, and blight during its growth. Efficient and accurate disease detection is of significant importance for achieving sustainable disease management in bitter melon cultivation. To address the issues of weak generalization ability and high computational demands in existing deep learning models in complex field environments, this study proposes an improved lightweight YOLOv8-LSW model. The model incorporates the inverted bottleneck structure of LeYOLO-small to design the backbone network, utilizing depthwise separable convolutions and cross-stage feature reuse modules to achieve lightweight design, reducing the number of parameters while enhancing multi-scale feature extraction capabilities. It also integrates the ShuffleAttention mechanism, strengthening the feature response in lesion areas through channel shuffling and spatial attention dual pathways. Finally, WIoUv3 replaces the original loss function, optimizing lesion boundary regression based on a dynamic focusing mechanism. The results show that YOLOv8-LSW achieves a precision of 95.3%, recall of 94.3%, mAP50 of 98.1%, mAP50-95h of 95.6%, and F1-score of 94.80%, which represent improvements of 2.2%, 2.7%, 1.2%, 2.2%, and 2.46%, respectively, compared to the original YOLOv8n. The effectiveness of the improvements was verified through heatmap analysis and ablation experiments. The number of parameters and GFLOPS were reduced by 20.58% and 20.29%, respectively, with an FPS of 341.58. Comparison tests with various mainstream deep learning models also demonstrated that YOLO-LSW performs well in the bitter melon disease detection task. This research provides a technical solution with both lightweight design and strong generalization ability for real-time detection of bitter melon diseases in complex environments, which holds significant application value in promoting precision disease control in smart agriculture.

1. Introduction

Bitter melon (Momordica charantia L.), belonging to the Cucurbitaceae family and the Momordica genus, is an annual climbing herb also known as bitter melon, leprosy grape, jade lychee, and gentleman’s vegetable. It is mainly distributed in tropical, subtropical, and temperate regions. Bitter melon, as an important part of the global specialty agricultural product supply chain, is part of a competitive industry system in China, with production bases centered in provinces such as Guangdong, Guangxi, Hubei, and Fujian. Not only does it meet the demand of traditional Asian markets but its standardized cultivation techniques are exported through “Belt and Road” agricultural cooperation projects to Southeast Asia, Africa, and other regions. Bitter melon, with its rich saponins, peptides, and high concentrations of vitamin C [1], has medicinal properties such as blood sugar reduction [2] and anti-tumor effects [3]. It is not only an important ingredient in the food industry but also holds significant value in the pharmaceutical, health food, and cosmetics raw material development fields, playing a key role in the agricultural and health systems of countries and regions such as China and India.
Diseases such as downy mildew and powdery mildew frequently affect the leaves of bitter melon, seriously threatening its yield and quality. Managing bitter melon leaf diseases has become one of the main solutions to address the yield and quality issues. Traditional disease detection mainly relies on farmers’ experience and expert field diagnosis, which suffer from long detection cycles, high per-unit-area economic costs, and significant subjective judgment deviations, making it difficult to meet the real-time, precision [4], and standardization requirements for disease identification in modern agriculture. Therefore, researching efficient and accurate disease detection algorithms is of significant importance for achieving sustainable disease management.
In the 1980s, scholars introduced digital image processing and computer vision technologies into the field of plant disease diagnosis, marking the beginning of systematic exploration [5]. Early studies attempted to construct classification models by combining image segmentation with feature engineering. For example, Barbedo [6] proposed a leaf spot segmentation method based on an HSV (Hue, Saturation, Value) color space and a gray-level co-occurrence matrix. Mohanty et al. [7] used an SVM (support vector machine) classifier combined with morphological features to recognize powdery mildew. However, these methods face significant challenges in complex field scenarios, as interference factors such as natural lighting changes, leaf occlusion, and soil background lead to insufficient feature robustness. For example, Sharif et al. [8] verified that the recognition error of traditional color features can be as high as 35% under strong light or shadow conditions. Although these technologies significantly improve efficiency and objectivity compared to traditional manual detection, their feature extraction processes are complex, and the recognition accuracy is generally below 75%, far from meeting the practical application requirements of agriculture. With the continuous development of technology, Hinton et al. [9] introduced the concept of deep learning, which has accelerated the rapid development of the field. Currently, deep learning has been successfully applied in various fields and has become a research hotspot in the agricultural sector. Gong et al. [10] employed single models such as ResNet101 and ResNeXt50 for transfer learning, achieving a highest test set accuracy of 86.83%, which improved to 87.19% after model fusion. Wang et al. [11] achieved a classification accuracy of 95.62% for tomato disease on the Plant Village dataset using the transfer learning-based AlexNet model, which improved by 5.6% compared to training from scratch. Liu Yijun et al. [12] proposed an improved Faster R-CNN algorithm for potato sprouting and surface damage detection, significantly improving the average detection accuracy. Wang et al. [13] improved ResNet18 by designing multi-scale residual modules, achieving a 93.05% recognition rate for vegetable leaf diseases in field environments. Li et al. [14] proposed a real-time pest and disease detection model, first using a lightweight convolutional neural network (CNN) to classify healthy and diseased leaves, then using an object detection model to detect the disease areas on the leaves, ultimately achieving 88% classification accuracy and 42% detection accuracy. The YOLO series models are widely used in the agricultural field due to their real-time detection capabilities and high accuracy. Liu et al. [15] improved the YOLOv3 network using methods based on image pyramid multi-scale feature fusion, target bounding box dimension clustering, and multi-scale training, achieving a detection accuracy of 92.39% on a self-built multi-class tomato pest and disease dataset. Li et al. [16] built an extensible and efficient recognition model, ConvViT, to identify kiwi diseases in complex environments. Zeng et al. [17] reconstructed the YOLOv5 backbone network using MobileNetV3 and applied channel pruning, achieving a 78% reduction in model parameters, thereby providing a lightweight model suitable for field deployment. Zhou et al. [18] proposed the YOLO-ACE model, which incorporates a Context Augmentation Module (CAM) and Selective Kernel Attention (SKAttention) to improve the detection accuracy of small-sized weed targets. Zhang Yong et al. [19] combined PP-YOLO and Mixup to enhance agricultural pest and disease detection, improving the mAP for small and medium-sized targets by 4.3%, though accuracy dropped significantly under complex occlusion. Hu et al. [20] optimized YOLOv5s+ distillation for maize leaf disease detection, improving mAP by 3.8%. It is lightweight, but misses detection of densely packed small lesions. Wei et al. [21] improved YOLOv3, achieving an average accuracy of 93.2% for vegetable recognition, but the accuracy dropped sharply to 82.5% under dense occlusion. Among them, YOLOv8 strikes a good balance between detection accuracy and real-time performance, becoming the foundation for many researchers to improve and expand upon, resulting in several variants to adapt to different application scenarios. As shown in Table 1, He et al. [22] proposed the KTD-YOLOv8 model, improving strawberry disease detection mAP by 2.8%, with a 38.5% reduction in computational load. Yuan et al. [23] improved YOLOv8 using DCN, achieving a 95.3% accuracy for potato disease detection, but with a 36.8% decrease in inference speed. Yang et al. [24] improved YOLOv8 to YOLOv8-SS, increasing wheat disease detection accuracy from 79.3% to 89.41%, with recall increasing by 7.42%. Jiang et al. [25] proposed the YOLOv8-GO model, which improved the precision and recall rates for corn leaf disease detection by 3% and 0.8%, respectively. It can be seen that improvements in different variants have demonstrated higher precision and recall rates in the detection of various crop diseases compared to the baseline model, significantly enhancing the model’s detection performance. Although many scholars have studied plant disease detection models, most models are only suitable for classifying images with simple backgrounds and cannot effectively simulate complex field conditions, limiting their practical application in production.
Therefore, to improve the accuracy of bitter melon leaf disease recognition in complex field environments, this study proposes an improved YOLOv8-LSW model. The performance of YOLOv8-LSW has significantly improved compared to the original YOLOv8n model, achieving model lightweighting. The main contributions of this study are as follows:
(1)
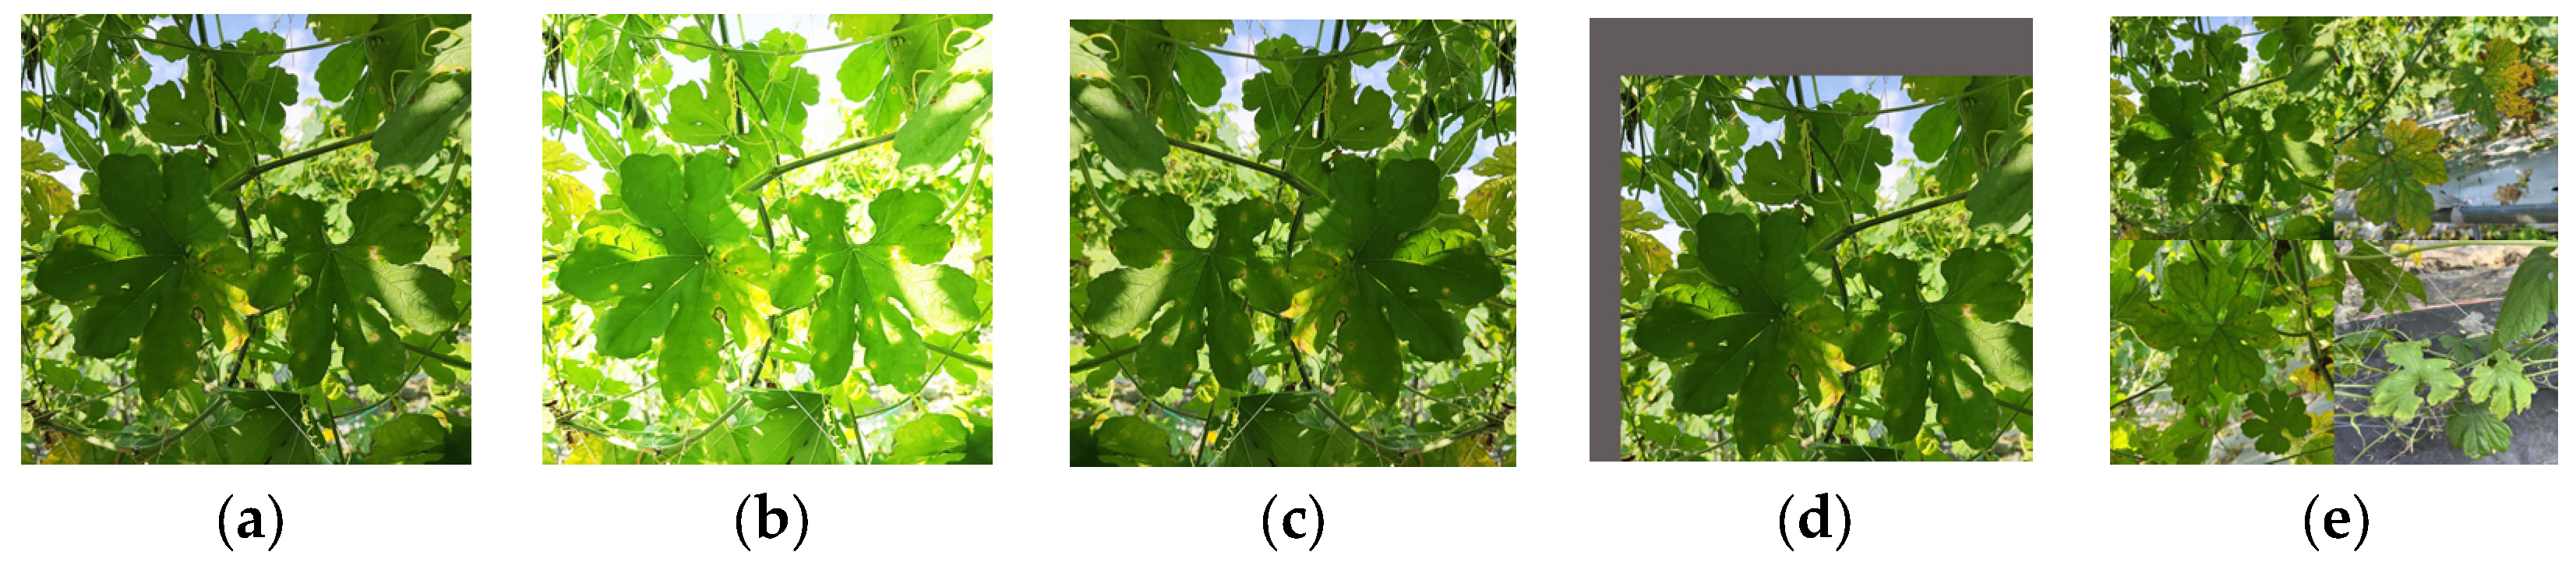
A bitter melon leaf disease dataset was constructed, which includes varying light intensities and leaf densities, reflecting real production environments.
(2)
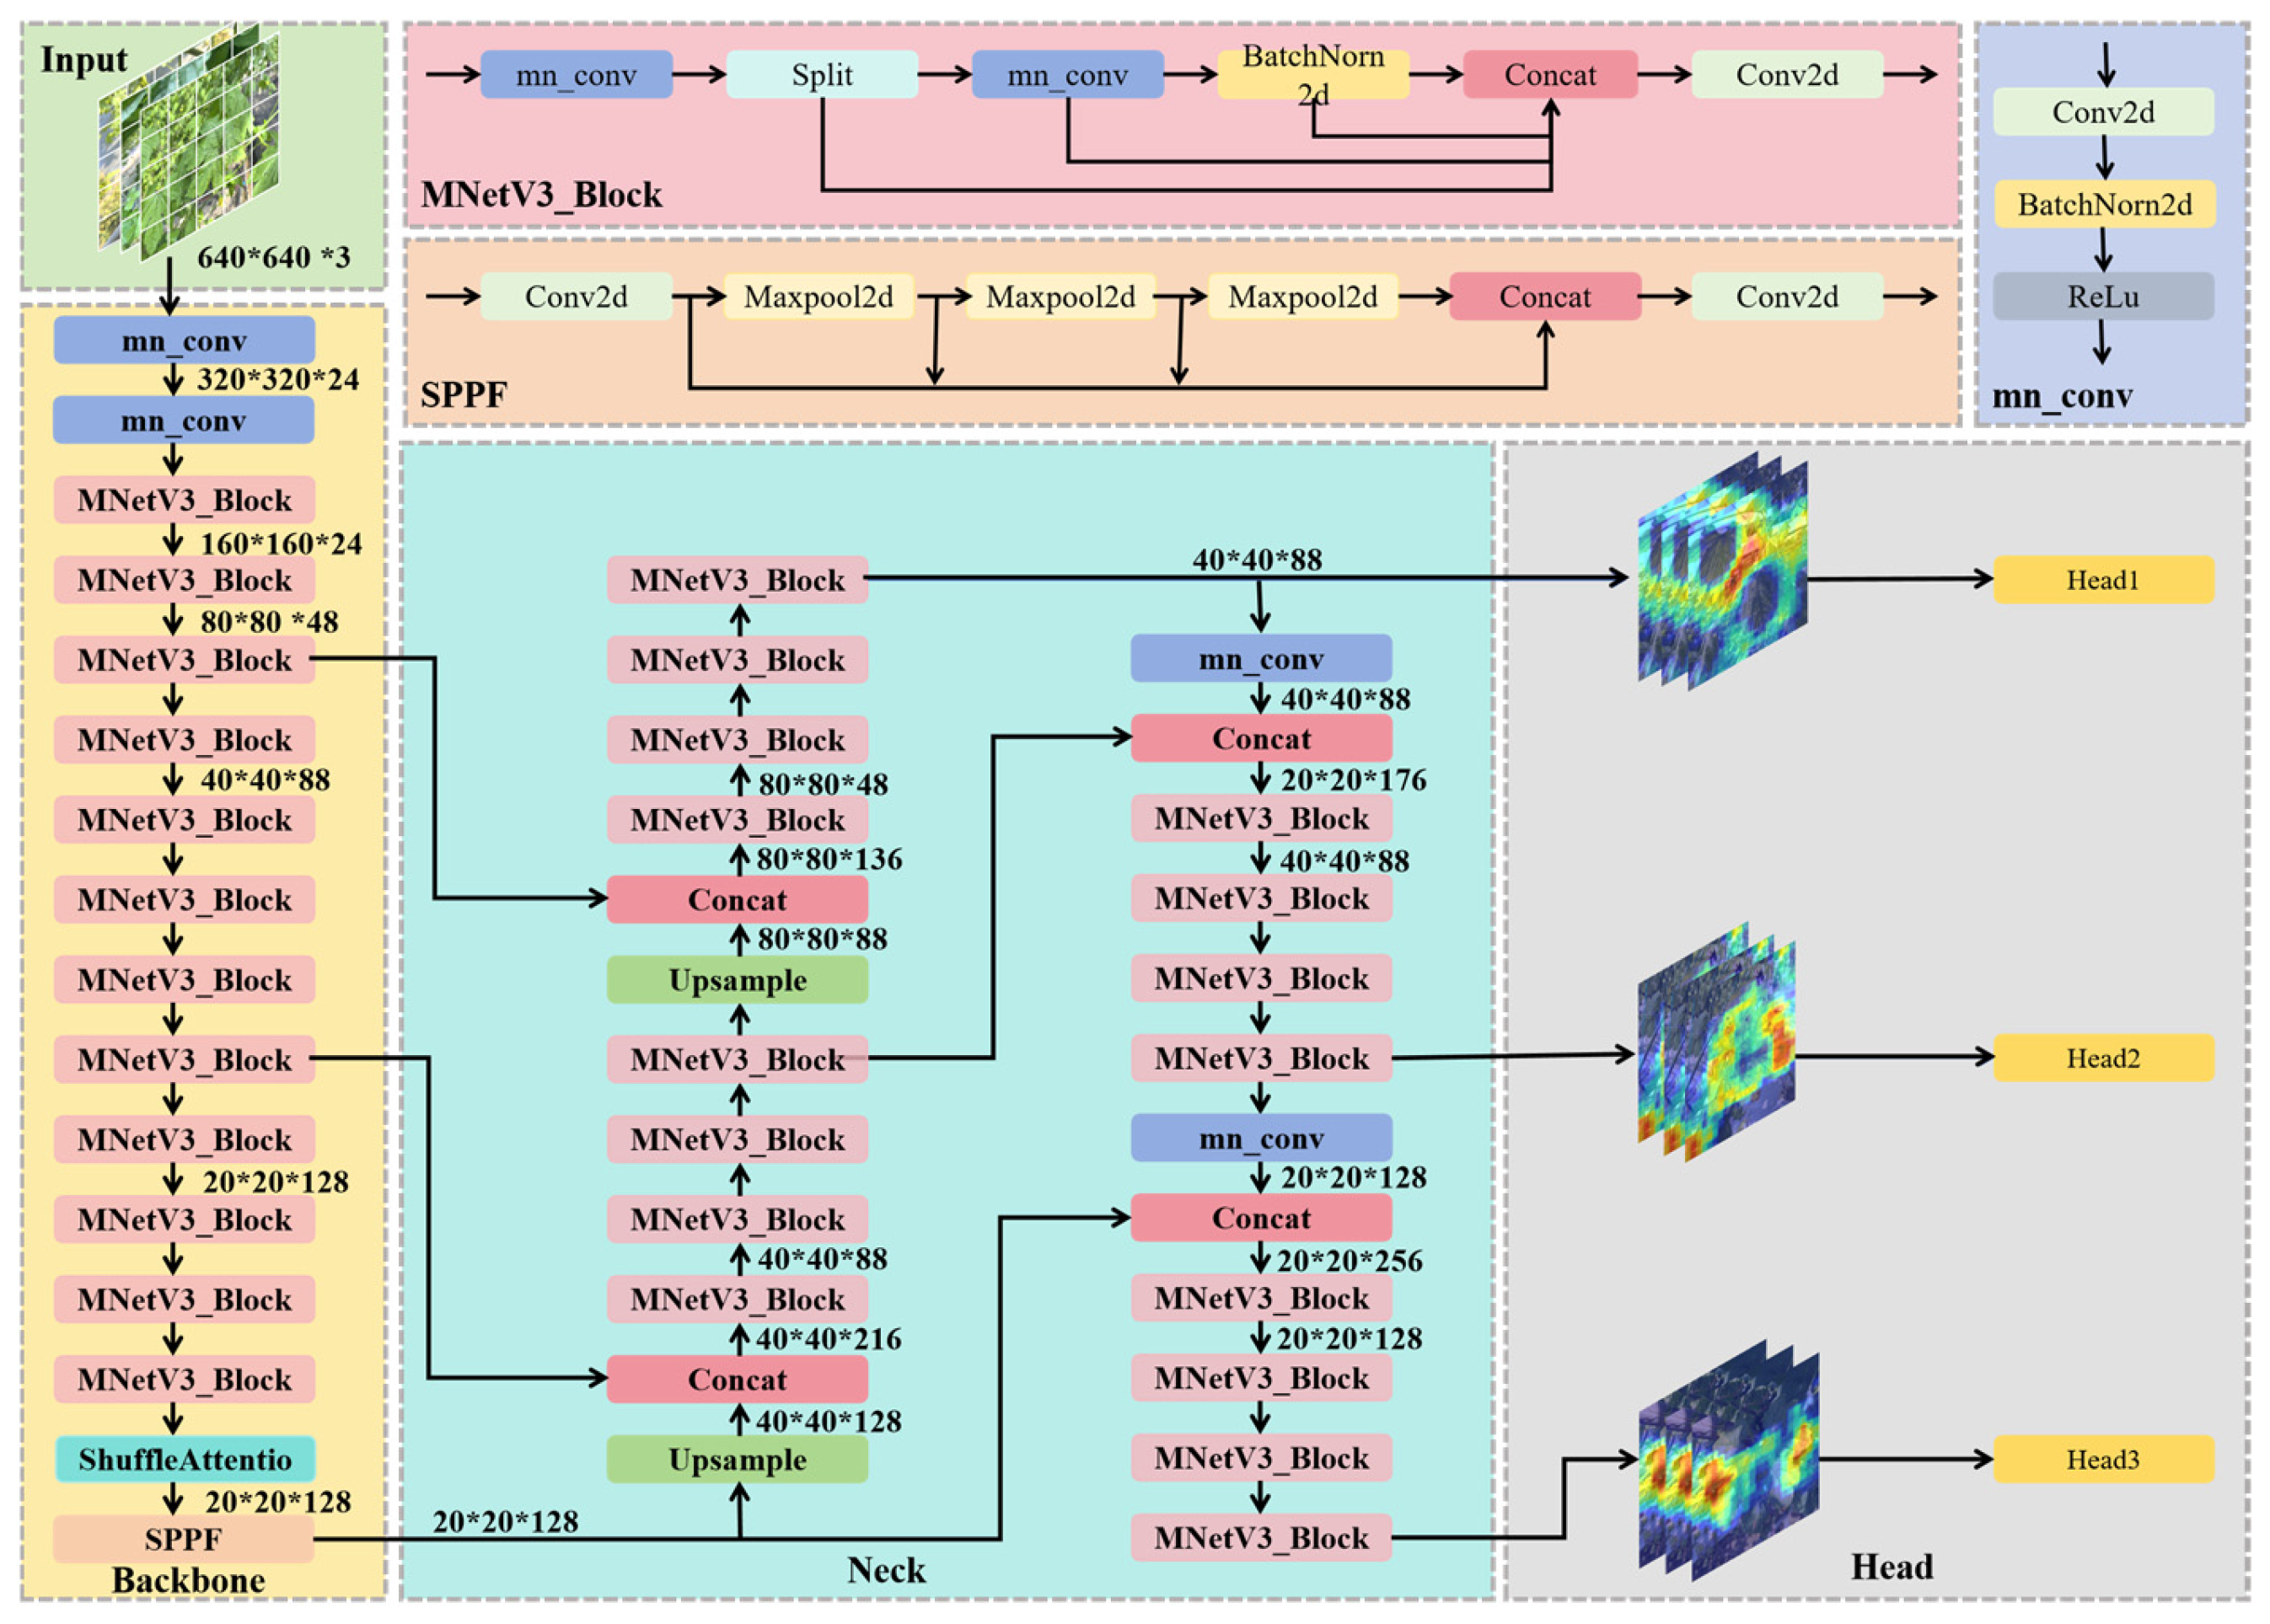
Based on the CSP (Cross-Stage Partial) concept, the backbone network was improved to the LeYOLO-small structure, and lightweight design was achieved by introducing depthwise separable convolutions and cross-stage feature reuse modules. While the number of parameters and model size were reduced, the performance of the model was significantly enhanced.
(3)
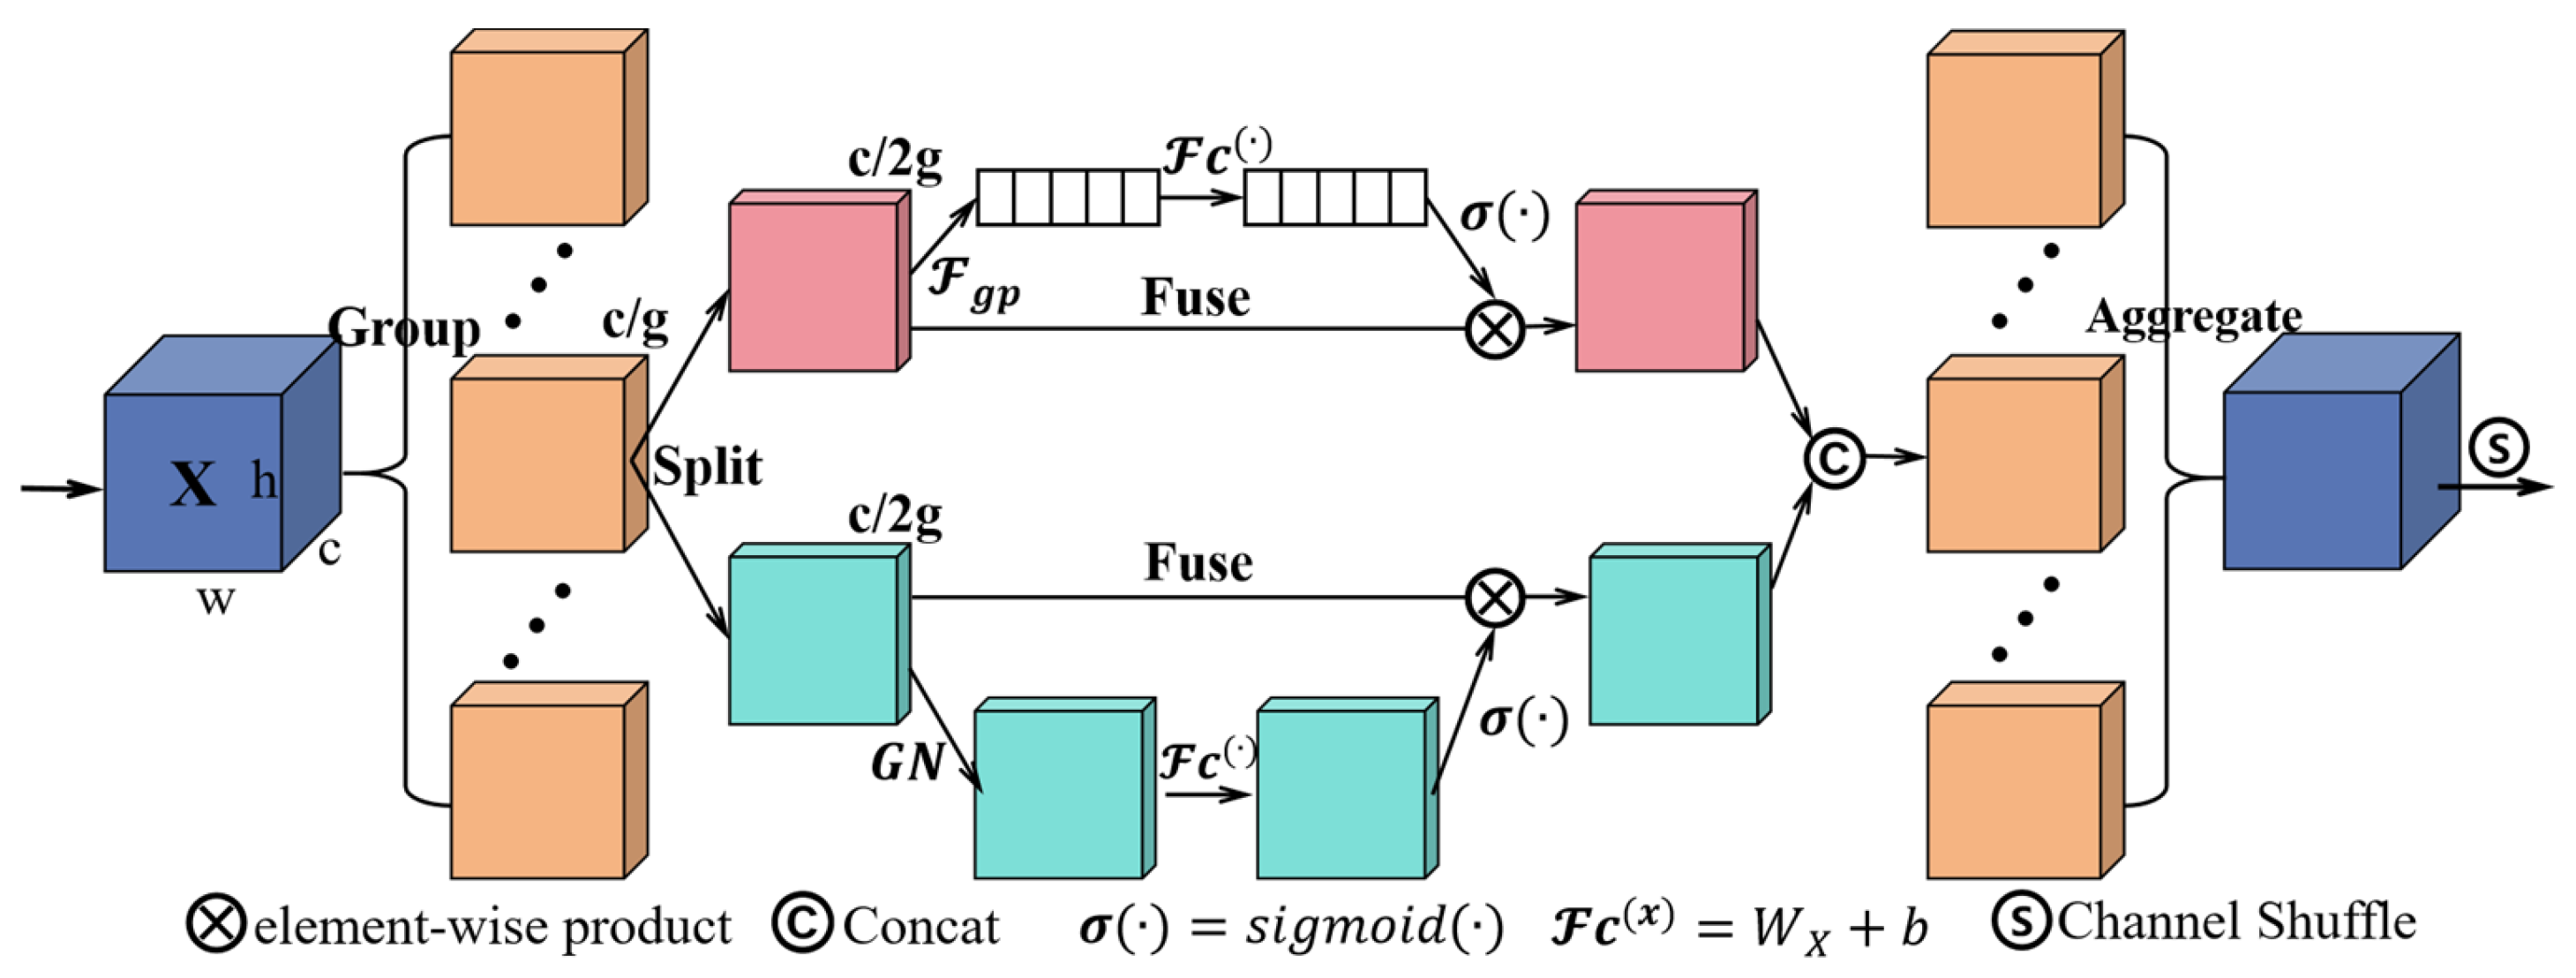
The ShuffleAttention module was embedded before the feature pyramid network, combining the advantages of channel attention and spatial attention to better extract important features from images, suppress unimportant background information, and reduce computational overhead.
(4)
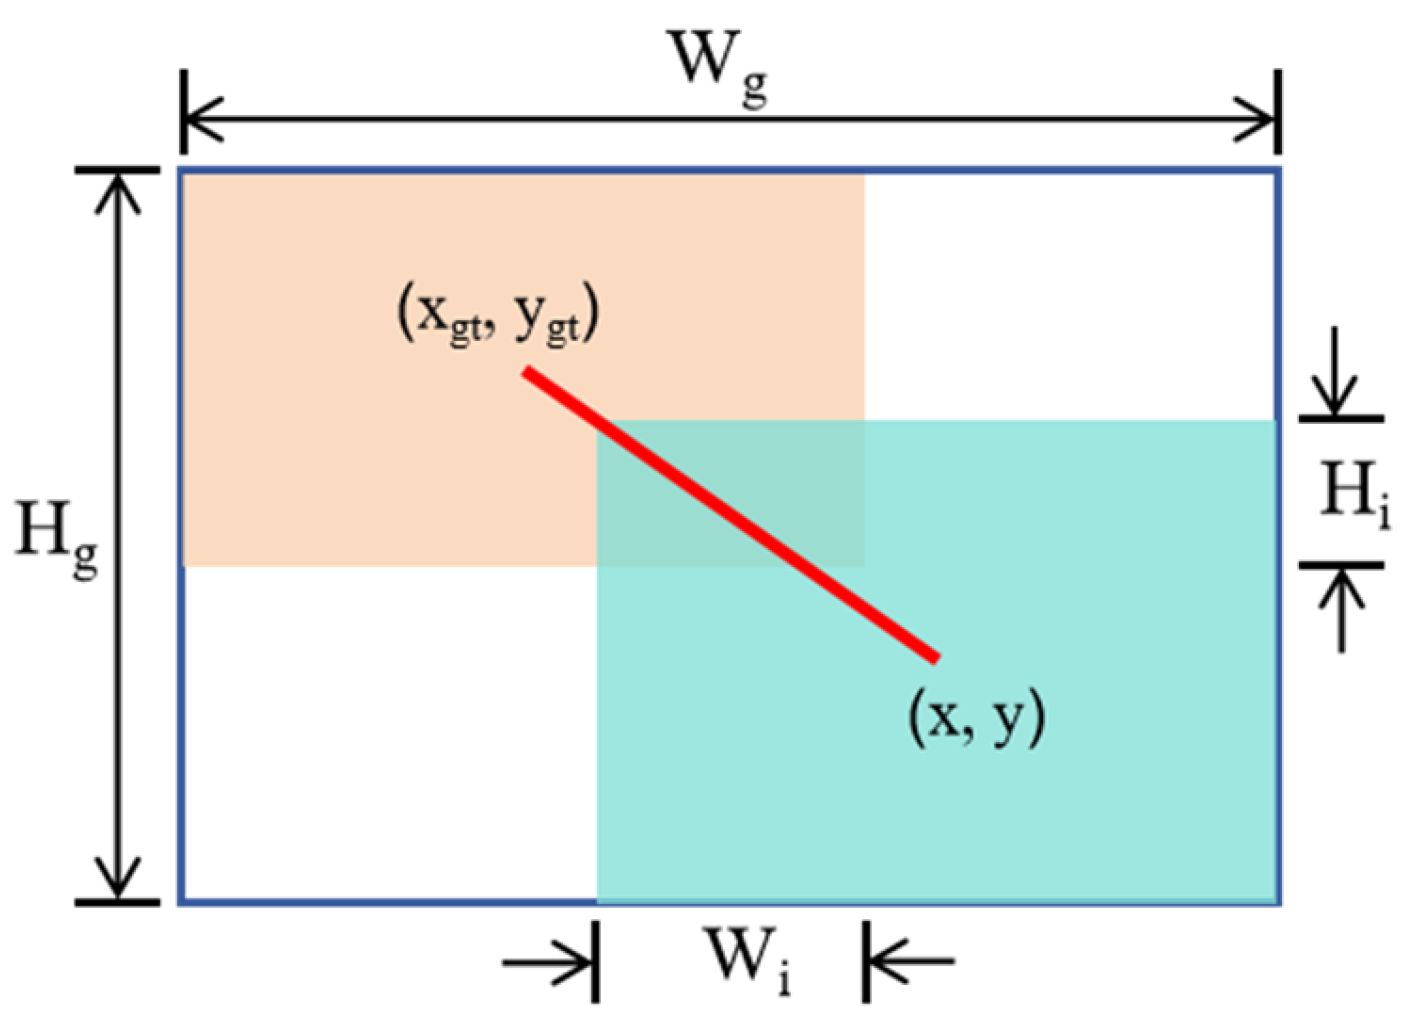
The WIoUv3 loss function with a dynamic non-monotonic focusing mechanism (FM) was used, dynamically adjusting gradient gain by evaluating the outlier degree of anchor boxes, thus mitigating the negative impact of low-quality anchor boxes on the training process. While ensuring high-quality anchor box regression, the model’s convergence speed and localization accuracy were improved.

2. Materials and Methods

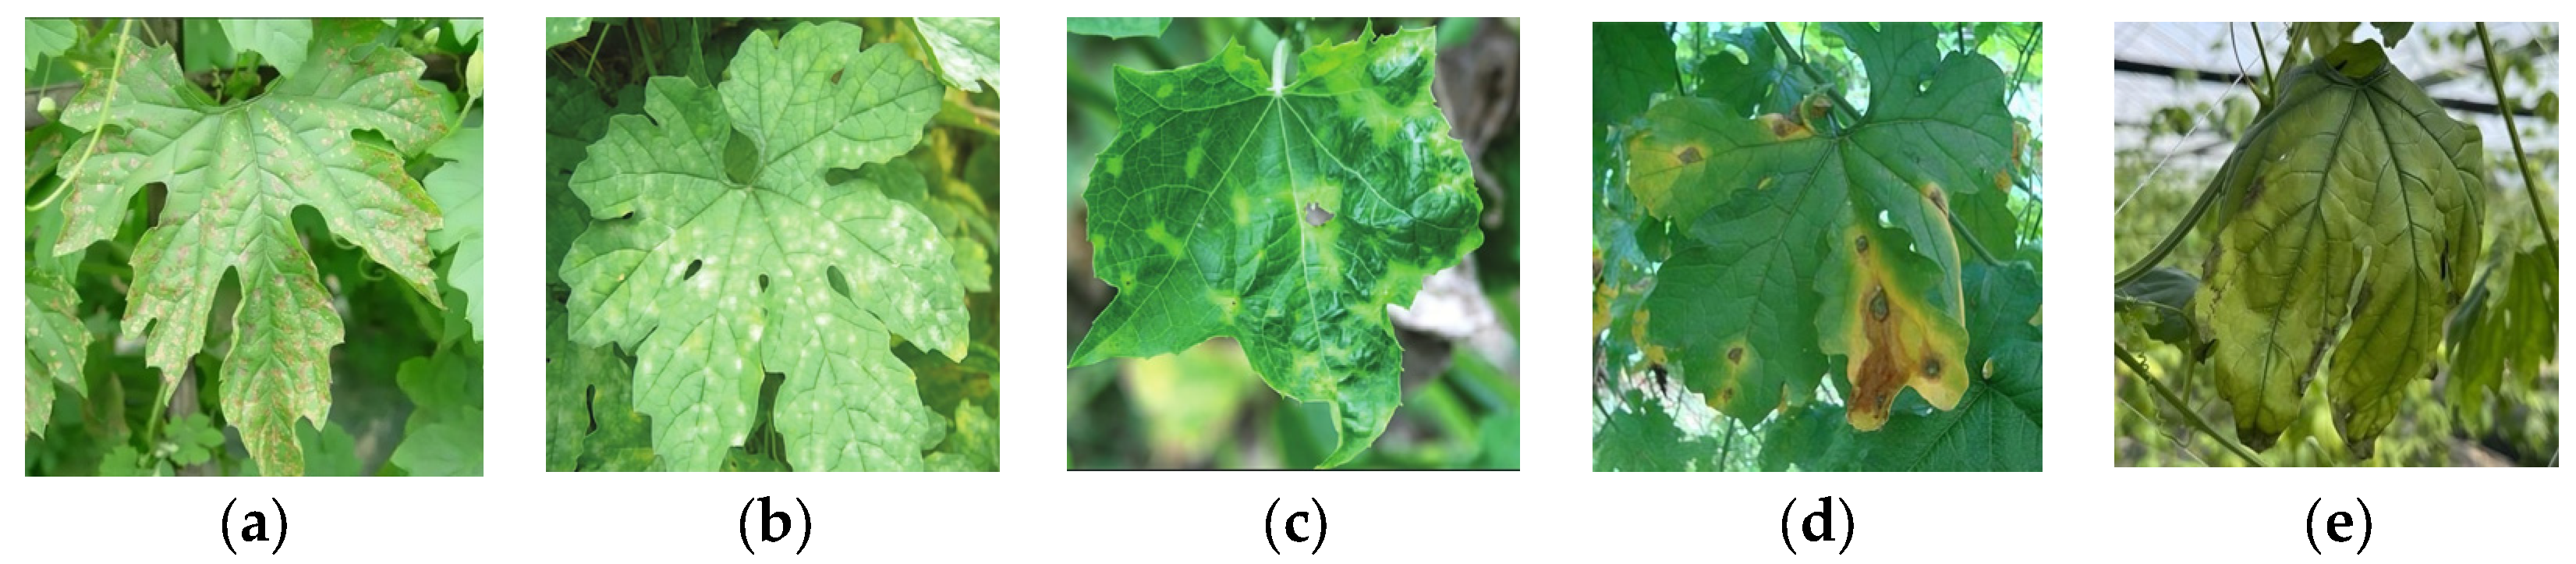
2.1. Data Collection and Dataset Construction

2.1.1. Data Collection

The samples for this study were collected from the vegetable base at the Fujian Seed Industry Innovation Center New Varieties Display and Evaluation Base (Langqi) and the Fuzhou Tianmei Seedling Technology Co., Ltd (Fuzhou City, China). Minhou Breeding Farm (Figure 1). Multiple directional images of field-grown bitter melon leaves were captured using two devices, the HUAWEI Mate60pro+ and iPhone16, under natural light (from 9:00 to 12:00 and 14:00 to 17:00). During the shooting process, uniform device settings were applied to minimize the impact of device differences on imaging quality. Additionally, to simulate the different viewpoints of field inspection robots, random shooting methods were used without restrictions on shooting angles and lighting conditions.
Based on the differences in the types of bitter melon leaf diseases and their characteristic symptoms, as well as preliminary research on the cultivation base, this study collected images of five types of bitter melon leaf diseases: downy mildew (Figure 2a), powdery mildew (Figure 2b), viral disease (Figure 2c), anthracnose (Figure 2d), and late blight (Figure 2e). Among them, downy mildew lesions appear as water-soaked light green or yellowish small spots, with a purple-gray mold layer on the underside of the leaf, and in severe cases, the entire leaf becomes yellow-brown and withered; powdery mildew is characterized by initial white mold spots gradually expanding into powdery patches covering the whole leaf; Viral infection typically manifests as mosaic symptoms with yellow-green mottling or annular chlorotic spots on the leaves, making it the most prevalent disease observed in the survey; anthracnose lesions are grayish-white with concentric ring patterns, and the edges have dark brown halos; late blight lesions typically start at the leaf tips and edges, presenting dark green water-soaked areas that turn brown and necrotic. A total of 2000 original images of bitter melon leaves were collected in this experiment, with a resolution of 2992 × 2992 pixels.

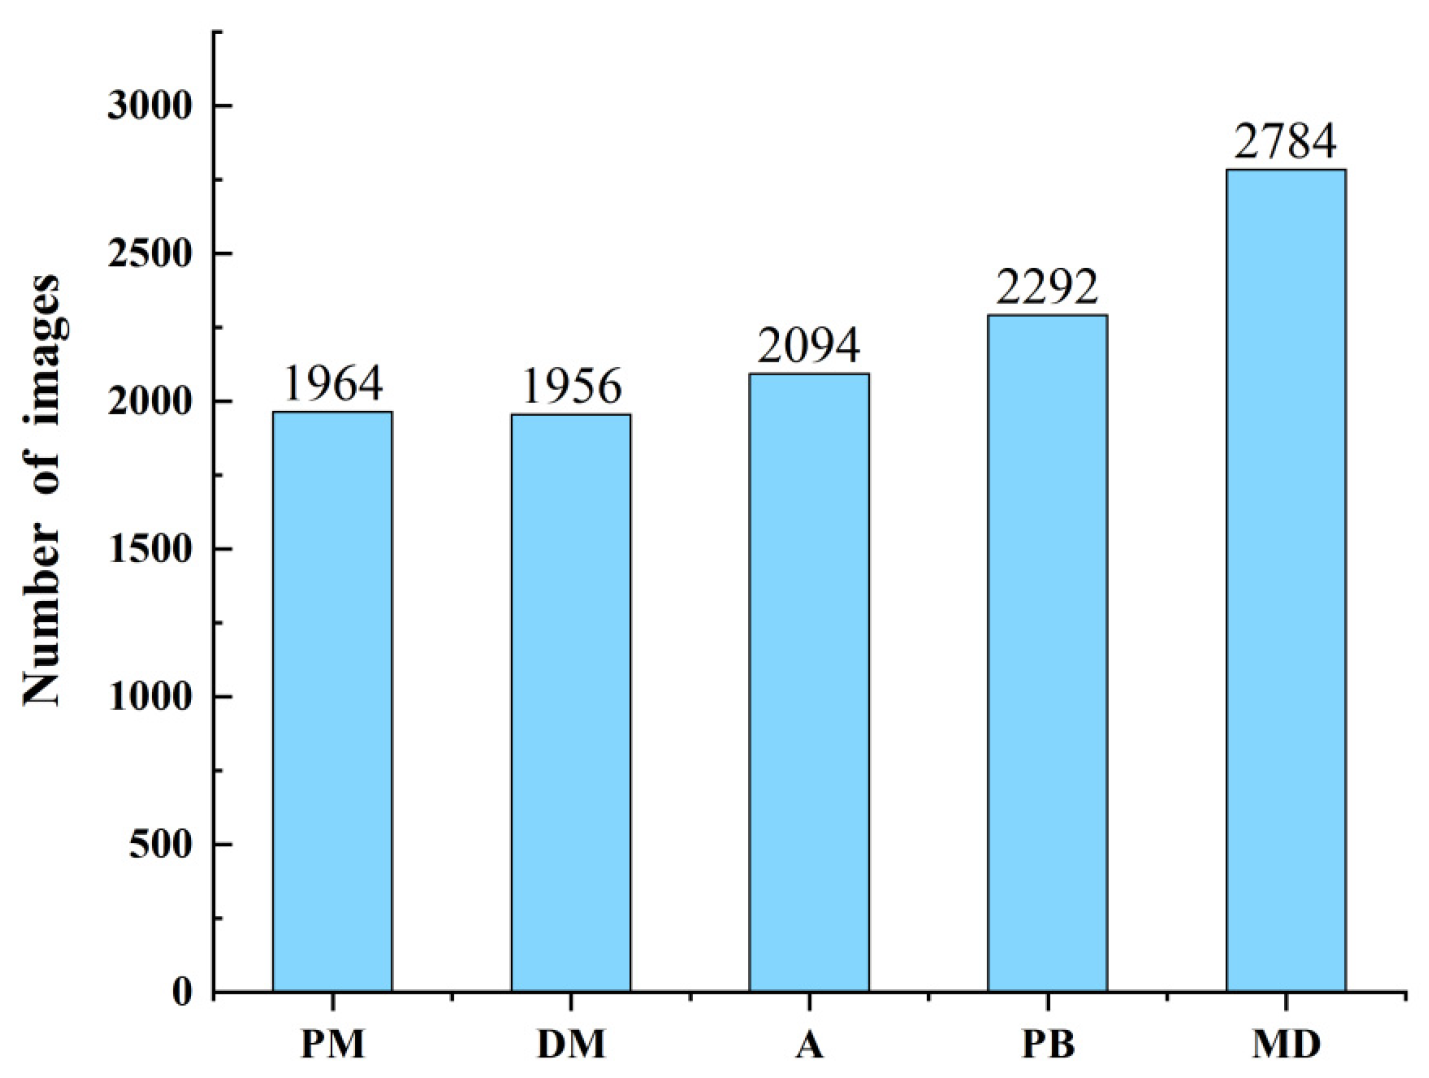
2.1.2. Dataset Construction

To increase data diversity, reduce overfitting, and improve robustness, various data augmentation techniques such as mirroring, brightness adjustment, Gaussian blur, contrast adjustment, random translation, and image stitching were applied to expand the sample size [26,27,28,29,30]. The augmentation effects are shown in Figure 3.
The augmented image dataset was labeled using the LabelImg (v1.8.1) image annotation tool, strictly following the single-object single-box principle to ensure that the lesion areas were fully contained within the annotation box. A total of 11,090 target samples were obtained, and the number of samples for each disease is shown in Figure 4. The labeled images were randomly shuffled and divided into training, validation, and test sets in a 7:2:1 ratio. The training set was used for iterative model training, the validation set was used for detection and parameter adjustment during training, and the test set was used to evaluate the model’s generalization ability and performance on new data.

2.2. YOLOv8-LSW Mode

To improve the accuracy and robustness of bitter melon leaf disease recognition, this study proposes an improved YOLOv8 network structure called YOLOv8-LSW. YOLOv8 was chosen due to its balanced performance in terms of detection speed, accuracy, and computational efficiency. First, based on the concept of CSP (Cross-Stage Partial), the backbone network was improved to the LeYOLO-small structure. This was achieved by introducing depthwise separable convolutions and cross-stage feature reuse modules to realize a lightweight design, while retaining the characteristics of the CSP module to optimize gradient flow. This approach reduces the number of parameters while enhancing multi-scale feature extraction capabilities. The ShuffleAttention attention mechanism [31] was embedded before the Spatial Pyramid Pooling (SPPF) layer, strengthening the lesion region feature responses through channel shuffling and spatial attention dual pathways. The loss function calculation adopts a task-aligned allocation strategy, using WIOUV3 to replace the original CIoU loss function and optimizing lesion boundary regression based on a dynamic focusing mechanism. The overall structure is shown in Figure 5.

2.2.1. LeYOLO-Small Backbone Structure

LeYOLO is an object detection model proposed by Hollard et al. to achieve low power consumption and high efficiency. On this basis, LeYOLO-small is a smaller version of the LeYOLO model family, with reduced computation and parameter sizes. It is inspired by the theoretical insights of classical residual bottleneck blocks [32] and inverted residual bottleneck blocks [33], using a backbone network based on an inverted bottleneck structure. By optimizing the number of channels, especially at larger spatial feature map sizes, the computational demands can be effectively reduced. If the expansion ratio of the module is 1, or due to concatenation effects, the input channel number Cin is equal to the expansion layer’s channel number Cmid, then the first pointwise convolution is not needed. The module always retains the residual connection, even if the first pointwise convolution is omitted, as long as the input Cin and output Cout tensors are equal. Figure 6 describes the differences between the classical bottleneck (Figure 6a), inverted bottleneck (Figure 6b), and LeYOLO (Figure 6c).
Convolution between two values is denoted by ⊗. For F i n R 1,1 , C i n , C m i d , F o u t R 1,1 , C m i d , C o u t , F m i d R k , k , 1 , C m i d , C i n is the input channel number, C m i d is the inverted bottleneck expansion channel number, and Cout is the output channel number in the convolution:
y = F o u t F i n x         if   C i n C m i d                                                   F o u t F i n x         if   C i n = C m i d and F i n = True   F o u t x                               if   C i n = C m i d and F i n = False
The improved bottleneck structure optimizes the expanded channel number, with the module transitioning from low-dimensional to high-dimensional and back to low-dimensional [34], and consistently implements SiLU [35] throughout the model. Additionally, whether to use the first layer’s pointwise convolution depends on whether the input channel number is equal to the expanded channel number. This design not only improves the network’s computational efficiency but also retains sufficient feature representation capabilities. The introduction of LeYOLO-small in bitter melon leaf disease detection optimizes the computational process and reduces redundant operations in feature extraction [34]. Moreover, depthwise separable convolutions and residual connections effectively extract different disease features from bitter melon leaves, while maintaining high detection accuracy and reducing computational resource requirements.

2.2.2. ShuffleAttention Attention Mechanism

Attention mechanisms play a crucial role in computer vision and are primarily divided into channel attention and spatial attention. Channel attention focuses on the dependencies between channels, while spatial attention focuses on pixel-level relationships. Although combining both can improve performance, it often increases the computational burden. The attention mechanism enables neural networks to focus on the most important features within the input data while ignoring less relevant information such as the background, thereby enhancing the model’s sensitivity to critical information [36]. To make the model focus more on important regions in bitter melon leaf disease detection and balance model accuracy with computational power requirements, this study introduces the Shuffle Attention (SA) module proposed by Zhang Qinglong et al. [31], aiming to combine the advantages of channel attention and spatial attention to better extract important features from images, suppress irrelevant background information, and reduce computational costs [37]. The structure of the SA attention mechanism is shown in Figure 7.
Specifically, the SA module uses a “channel splitting” method to decompose the feature map X into G groups, and then splits each group of subfeatures X K into two branches, defined to be X K 1 , X K 2 R C / G × H × W . Among them, the channel attention branch and spatial attention branch are processed in parallel. For the channel attention branch, global average pooling (GAP) is used to obtain channel-level statistical information, generate channel statistics S R C / 2 G × 1 × 1 , and then use a fully connected layer and sigmoid function to scale and shift the channel features, outputting the final channel attention X k 1 . The formula is as follows:
S = F GAP X k 1 = 1 H × W i = 1 H j = 1 W X k 1 i , j
X k 1 = σ F c s · X k 1 = σ W 1 s + b 1 · X k 1
In the formula, σ denotes the sigmoid activation function, Fc(s) represents a linear transformation of s, and W 1 R C / 2 G × 1 × 1 and b 1 R C / 2 G × 1 × 1 are the parameters for the linear transformation.
For the spatial attention branch, group normalization (GN) is used to obtain spatial-level statistical information, and similarly, a fully connected layer and sigmoid function are used to enhance spatial features, focusing on meaningful spatial regions. The formula is as follows:
X k 2 = σ W 2 · G N X k 2 + b 2 · X k 2
Next, the Shuffle Unit is used to integrate channel attention and spatial attention into a single block within each group, restoring the number of channels to match the input. Finally, all sub-features are aggregated, and a “channel shuffle” operator is used to enable information exchange among different sub-features.

2.2.3. WIoUv3 Loss Function

In object detection tasks, the bounding box regression loss function is critical to the model’s performance. YOLOv8 uses CIoU loss as the bounding box regression loss, but CIoU tends to overlook the aspect ratio of bounding boxes, resulting in inadequate localization accuracy for small objects. This is particularly problematic for targets with significant width–height differences, which can lead to large regression errors [38]. Therefore, this study introduces the Wise-IoUv3 (WIoUv3) loss function proposed by Zanjia Tong et al. [39] as an improvement over CIoU. WIoUv3 introduces a dynamic non-monotonic focusing mechanism (FM), which evaluates the outlier degree of anchor boxes to dynamically adjust gradient gains, thereby mitigating the negative impact of low-quality anchor boxes during training. This mechanism allows WIoUv3 to handle small objects more effectively, reduce issues related to sample quality imbalance, and improve model convergence speed and localization accuracy while maintaining accurate regression for high-quality anchors.
WIoUv3 calculates the outlier degree of anchor boxes based on their overlap with ground truth boxes and adjusts the gradient gain dynamically based on this metric. Specifically, for high-quality anchor boxes (i.e., those with high overlap with the ground truth), WIoUv3 assigns smaller gradient gains to prevent them from dominating the model’s learning during training. In contrast, for low-quality anchors—especially those with low overlap—WIoUv3 reduces their gradient gains accordingly to minimize their adverse effect on regression error. With this refined gradient allocation strategy, WIoUv3 effectively reduces the interference of low-quality samples in the training process while maintaining moderate attention to medium-quality anchors [40], thereby enhancing the model’s localization and generalization performance for small and challenging targets. For the anchor box B → ={x,y,w,h} and ground truth box Bgt → ={xgt,ygt,wgt,hgt}, the values correspond to the center coordinates and sizes of the respective bounding boxes. The spatial relationship between anchor and ground truth boxes is illustrated in Figure 8.
The specific formula for WIoUv3 is as follows:
L I o U = 1 I o U = 1 W i H i wh + w g t h g t W i H i
R W I o U = exp x x g t 2 + y y g t 2 W g 2 + H g 2 *
r = β δ · α β δ
β = L I o U L I o U ¯ [ 0 , + )
In the formula, R W I o U denotes a dynamic weighting factor that adjusts the influence of different predicted boxes in the WIoU loss, optimizes the model’s error penalty allocation, and enhances overall detection accuracy [41]. Wg and Hg represent the width and height of the smallest enclosing region formed by the anchor and ground truth boxes. The symbol * indicates that Wg and Hg are detached from the computational graph to prevent R W I o U gradients that hinder convergence. Wi and Hi represent the width and height of the intersection area between the anchor box and the ground truth box. r is the gain coefficient of the non-monotonic focusing mechanism, which affects the sensitivity of gradient gain to changes in the actual IoU value. δ and α are hyperparameters that control r and β, influencing the gradient gain allocation strategy for predicted boxes of different qualities.

2.3. Evaluation Metrics

This study uses accuracy, precision, recall, F1-score, mean Average Precision at IoU 0.5 (mAP50), and mAP50-95 as model evaluation metrics. Model accuracy is the ratio of all correctly predicted samples to the total number of samples. Precision is the proportion of correct predictions among all predictions made by the model. Recall is the proportion of correctly predicted positive samples among all actual positives, measuring the extent of missed detections. The F1-score is the harmonic mean of precision and recall, reflecting the model’s balance between positive and negative sample predictions. Additionally, mAP50 is the mean Average Precision at an IoU threshold of 0.5, which reflects the model’s ability in object localization and recognition, while mAP50-95 is the mean Average Precision averaged over IoU thresholds from 0.5 to 0.95, representing the model’s generalization performance under varying matching criteria. The specific formulas are as follows:
Precision = TP TP + FN × 100 %
Recall = TP TP + FN × 100 %
F 1 = 2 × Precision × Recall Precision + Recall × 100 %
AP = 1 k P × R K × 1
mAP = 1 k AP K × 1
where TP (true positives) represents the number of actual positive samples predicted as positive; FP (false positives) represents the number of actual negative samples predicted as positive; and FN (false negatives) represents the number of actual positive samples predicted as negative. TN (true negatives) represents the number of actual negative samples predicted as negative. AP represents the area under the precision–recall curve. mAP stands for mean Average Precision.

3. Results

3.1. Experimental Environment

All training and testing in this study were conducted on the same server, with the hardware and software configurations shown in Table 2.
In this experiment, the input image resolution was set to 640 × 640. The initial learning rate was set to 0.001, and a momentum decay strategy was applied with a momentum value of 0.937. Additionally, the weight decay factor was set to 0.0005. The batch size for each training session was 32, the random seed was set to 0, and the number of epochs was 300. To ensure the stability of the results, the experiment was repeated three times. The training results were consistent each time, indicating that the performance of the YOLOv8-LSW model was stable.

3.2. Model Training Results

To evaluate the performance of the CSW-YOLO model, 891 images from the test set were used for evaluation. Since the s/m/l versions of YOLOv8 have large numbers of parameters and high computational costs, making them unsuitable for edge deployment scenarios, this study selects only YOLOv8n for comparison. As shown in Figure 9, the improved YOLOv8-LSW model outperforms the original YOLOv8n model across multiple metrics, achieving a precision of 95.3%, recall of 94.3%, mAP50 of 98.1%, mAP50-95 of 95.6%, and F1-score of 94.80%. Compared to the original YOLOv8n, these metrics were improved by 2.2%, 2.7%, 1.2%, 2.2%, and 2.46%, respectively. Moreover, YOLOv8-LSW not only improved all evaluation metrics but also demonstrated outstanding lightweight performance, reducing the number of parameters and GFLOPs by 20.58% and 20.29%, respectively, and decreasing the model size by 1.77 MB. These results indicate that the improved YOLOv8-LSW model maintains high performance while being more suitable for deployment in resource-constrained environments.
As shown in the confusion matrix, the YOLO-LSW model achieved higher accuracy across all categories, with the most significant improvements observed in downy mildew (DM) and anthracnose (A) (Figure 10), with increases of 4% and 3%, respectively. Overall, the model showed significant improvements in recognition performance across all disease categories. The improved model performed particularly well in reducing misclassification, especially for the background category, indicating more precise differentiation between background and disease classes.
The Precision–Recall (PR) curve illustrates how precision varies with recall, reflecting the trade-off between identifying as many positive samples as possible and minimizing false positives. It is an important graphical indicator for evaluating model performance. The closer the curve is to the top right corner, the better the model performance. As shown in Figure 11, compared to the original YOLOv8n model, the PR curve of the YOLO-LSW model shifts significantly toward the top right, indicating a better balance between precision and recall. This indicates that YOLO-LSW improves recall while maintaining high prediction accuracy, effectively reducing false positives.
To visually examine changes in feature extraction ability resulting from the proposed improvements, this study used Grad-CAM to generate heatmaps, which reflect the class activation maps of the detection model [42]. In the heatmaps, the redder a region is, the more it contributes to the detection result [43].
For the original YOLOv8n model, as shown in Figure 12b, many hotspot regions still appear outside the target area. This indicates that the network pays attention to irrelevant features, which negatively impacts the model’s detection performance [44]. After the network was improved, the non-target hotspot regions were significantly reduced or even eliminated, and the heatmaps became more focused on the target areas (Figure 12c). This suggests that the improved YOLO-LSW model has a more focused attention mechanism during feature extraction and effectively reduces attention to irrelevant information.

3.3. Ablation Study

To further validate the impact of each improvement on model performance, the YOLO-LSW enhancements were compared step-by-step with the baseline algorithm. The specific experimental results are shown in Table 3, where “ID” indicates the experiment sequence, and “–” denotes that the original structure remains unchanged.
The results indicate that each improvement contributed to enhanced model performance. First, introducing the WIoUv3 loss function increased precision to 93.90%, recall to 93.40%, mAP50 to 97.30%, mAP50-95 to 93.70%, and the F1-score to 93.65%. This demonstrates that WIoUv3 improved bounding box regression, enhanced object detection coverage, reduced missed detections, and provided better stability across various precision thresholds. Next, the introduction of the Shuffle Attention mechanism further improved model performance. While the gains in precision and recall were less than those from WIoUv3, improvements in mAP50 and mAP50-95 were more significant. The mAP50 reached 97.50%, and mAP50-95 reached 94.20%. The attention mechanism enhanced the model’s focus on important features, improving discrimination of target areas. This indicates that while Shuffle Attention may slightly compromise target coverage, it offers advantages in refined feature learning. Incorporating LeYOLO-small into the backbone network led to significant improvements across the board: precision reached 94.10%, recall 93.80%, mAP50 97.80%, and mAP50-95 95.60%, and the F1-score increased to 93.95%. This indicates that the addition of LeYOLO-small significantly enhanced the model’s ability to capture key features, demonstrating strong robustness. From subsequent combinations, it is evident that combining Shuffle Attention with WIoUv3 resulted in the most noticeable recall improvement, indicating their joint effectiveness in reducing missed detections and enhancing detection performance. Then, the combination of LeYOLO-small and Shuffle Attention further improved precision and recall in bitter melon disease detection, with mAP50-95 showing consistent improvement across various thresholds. Finally, the combination of LeYOLO-small, Shuffle Attention, and the WIoUv3 loss function delivered the best performance, with a precision of 95.30%, recall of 94.30%, mAP50 of 98.10%, mAP50-95 of 95.60%, and an F1-score of 94.80%. This combination yielded optimal performance across all metrics, particularly excelling in precision and mAP50, indicating that it ensures both accurate target detection and high recall, significantly reducing the false detection rate. Overall, the proposed improvements in this study enhance the model’s performance in bitter melon leaf disease detection, particularly in key metrics such as precision, recall, and F1-score, indicating that these optimizations effectively improve model reliability and adaptability, making it more suitable for real-world deployment.

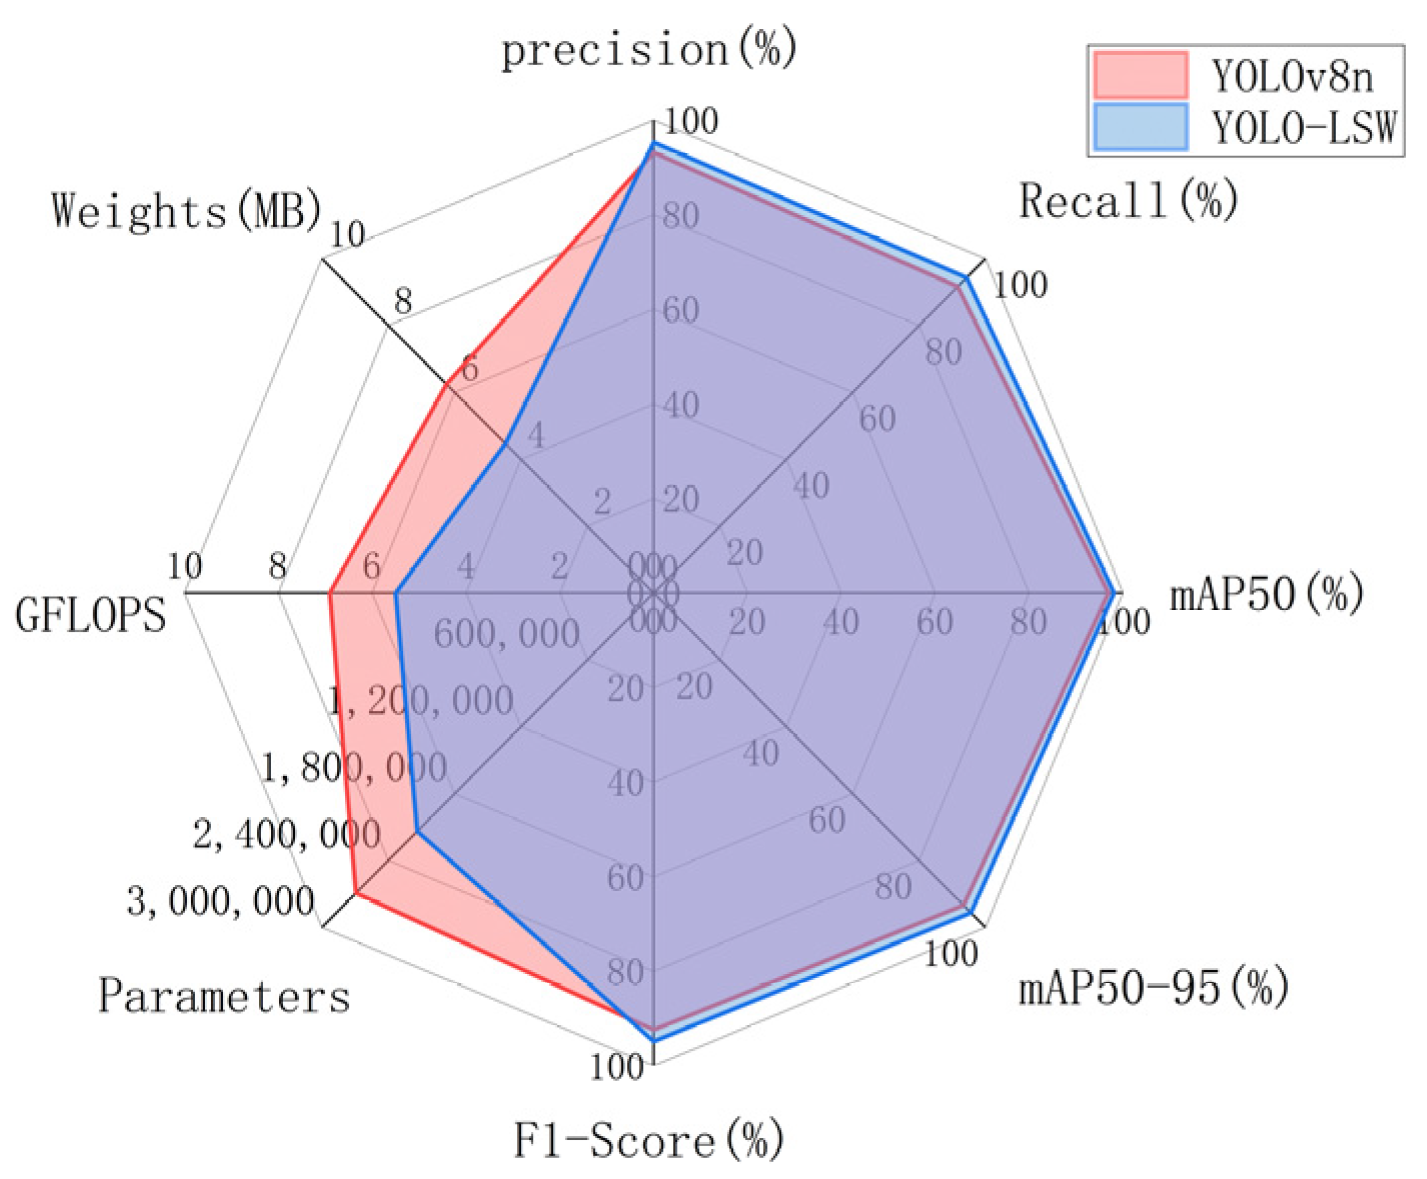
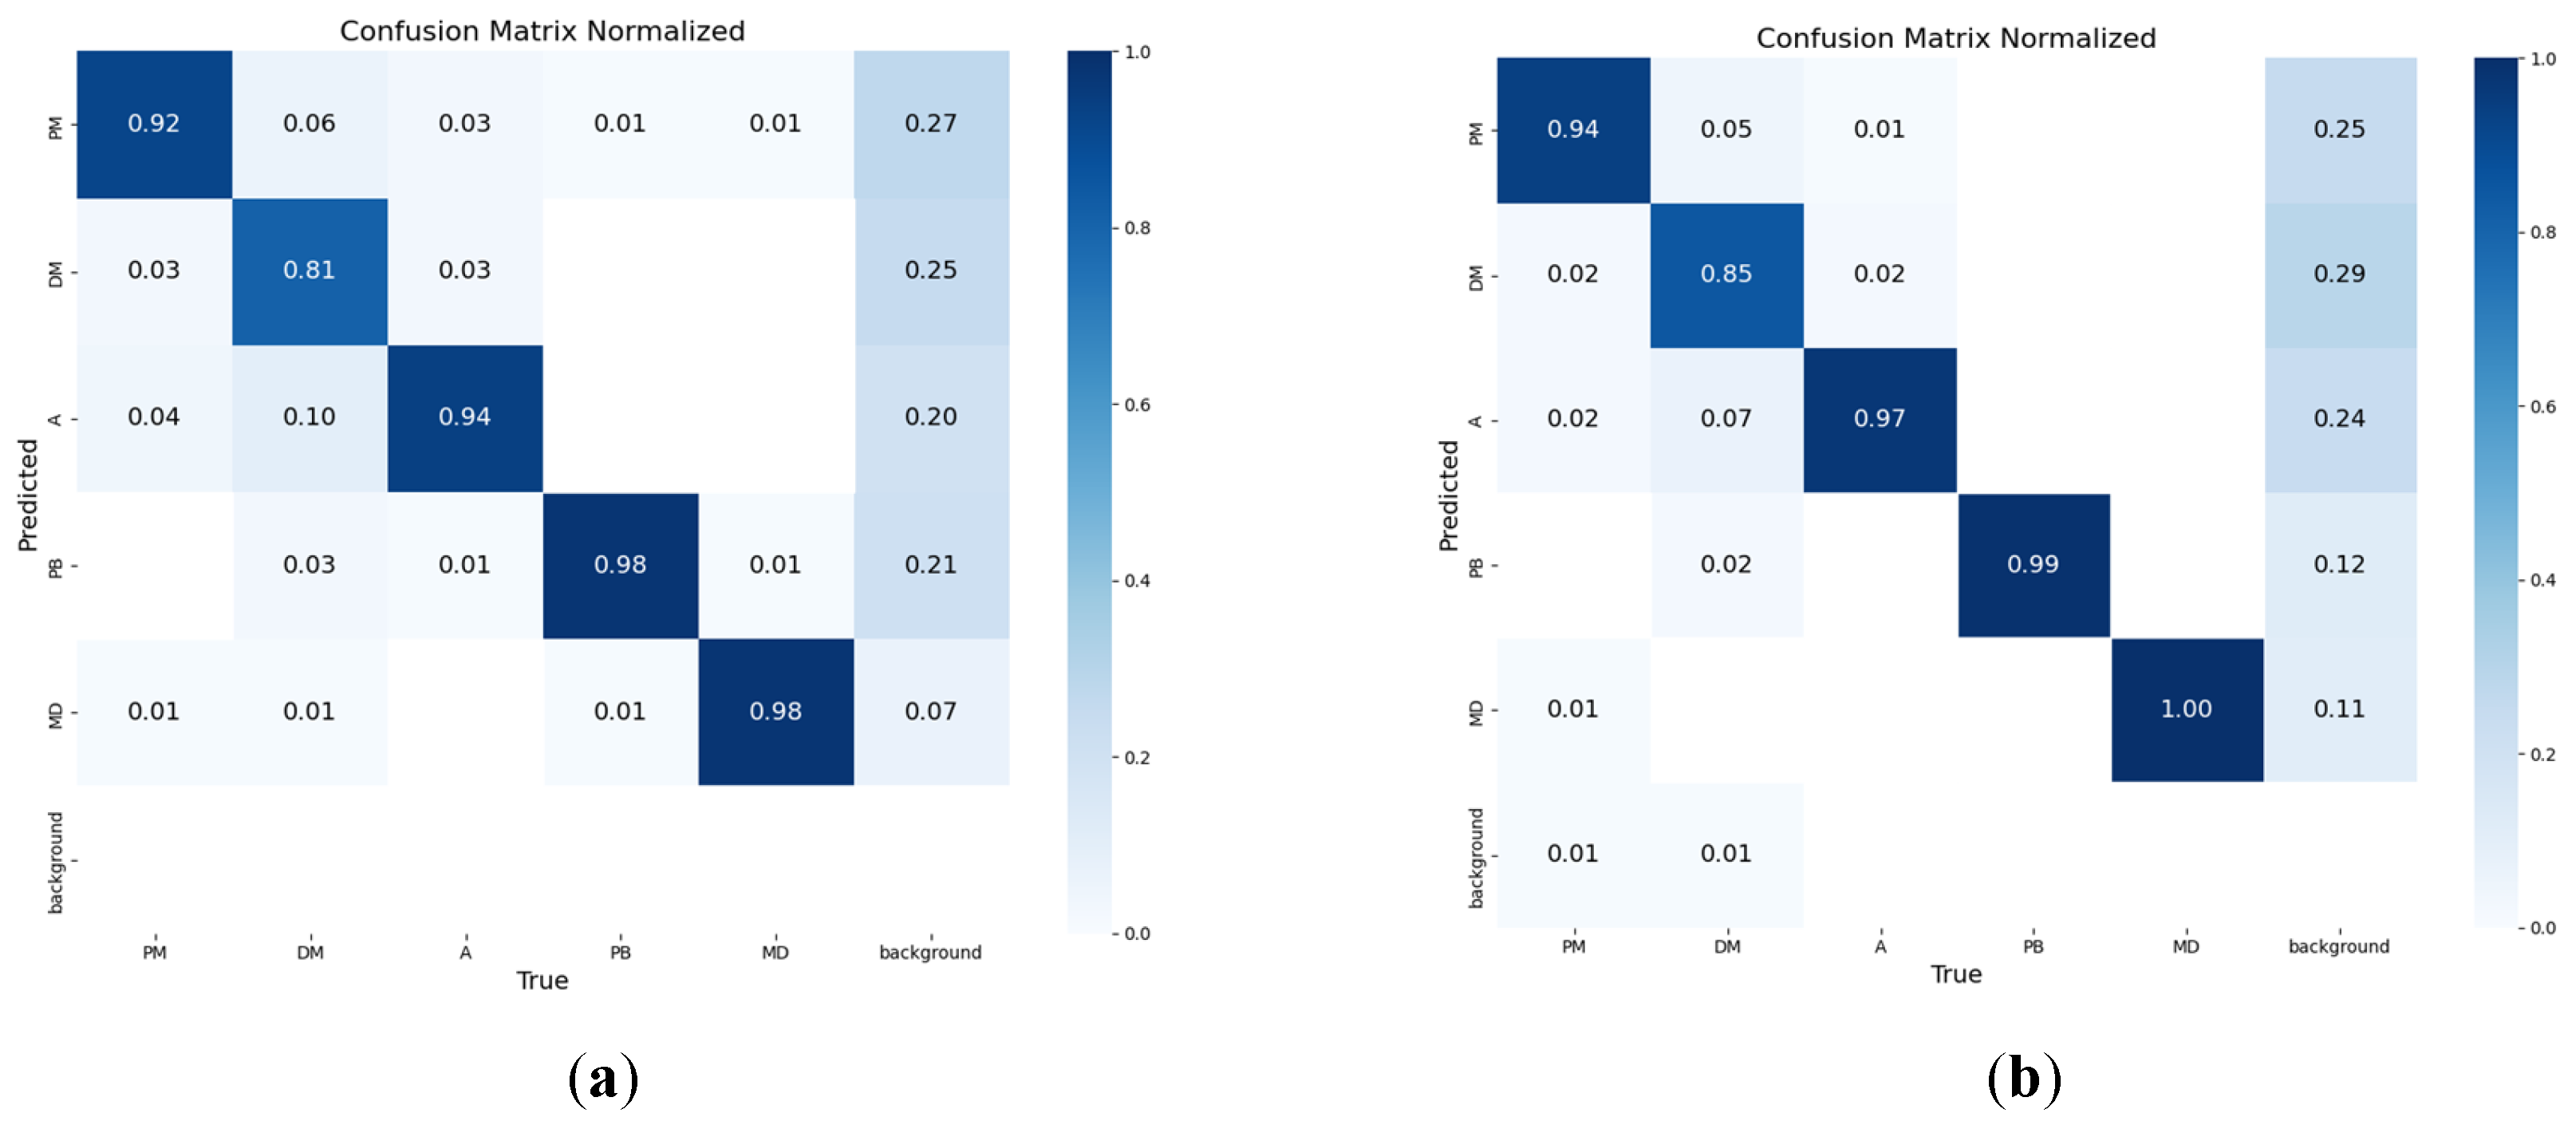
3.4. Comparative Experiments

To validate the overall performance of the lightweight bitter melon leaf disease detection model based on YOLOv8-LSW, this study selected YOLOv5s, YOLOv3-tiny, YOLOv8n, and YOLOv10 as comparison models, and conducted horizontal comparisons under the same dataset, training strategy, and testing environment. As shown in Table 4, in the comparative experiments for bitter melon leaf disease detection, the YOLO-LSW model proposed in this study demonstrated superior performance across all evaluation metrics. In terms of precision, the YOLO-LSW model achieved 95.30%, outperforming all other models, indicating high accuracy in identifying diseased leaves with a relatively low false positive rate. In terms of recall, YOLO-LSW also surpassed the other models, demonstrating strong performance in achieving high coverage and low miss rates in disease detection. Two mean Average Precisions (mAP50 and mAP50-95) are key indicators for assessing model performance under various detection difficulties. The YOLO-LSW model achieved 98.10% for mAP50 and 95.60% for mAP50-95, demonstrating high accuracy and stability in bitter melon leaf disease detection. In contrast, YOLOv3-tiny only achieved 82.30% for mAP50-95, showing the weakest performance among the compared models. The F1-score, as the harmonic mean of precision and recall, reached 94.80% for the YOLO-LSW model, outperforming all other models. This indicates that the model achieves the best balance between precision and recall, making it suitable for practical applications requiring both high accuracy and recall. Further analysis of model complexity and efficiency shows that the YOLO-LSW model has the lowest parameter count (2,137,199) and GFLOPs (5.5) among the compared models. This shows that YOLO-LSW achieves high performance while maintaining a lightweight design, making it more suitable for efficient operation in real-world deployment. It is also better suited for high-precision disease detection on resource-constrained devices. It provides strong technical support for the early diagnosis and precise control of bitter melon leaf diseases, offering significant application value and promotion potential.
All models were used to perform inference on the test set images, with some detection results shown in Figure 13. Analysis of the detection results revealed that the YOLO-LSW model accurately identified various bitter melon leaf diseases, performing particularly well in small object detection. This indirectly indicates that the improved network structure is more capable of capturing fine-grained features. Meanwhile, the model’s miss rate and false detection rate were both significantly lower than those of other models. This demonstrates that YOLO-LSW maintains high detection accuracy while effectively reducing false positives and missed detections. It is more suitable for use in real-world agricultural settings and can reduce the need for manual result verification. In contrast, the other models exhibited various shortcomings in detection performance. YOLOv5 and YOLOv10 had relatively higher miss rates, which could result in some diseased leaves going undetected, affecting the early diagnosis and control of disease. YOLOv3-tiny exhibited a high number of duplicate detections, which not only reduced detection efficiency but also increased the complexity of subsequent data processing. Additionally, YOLOv6s and YOLOv10 performed poorly when detecting incomplete leaves, leading to a higher likelihood of missed detections.
In summary, the YOLO-LSW model demonstrates advantages not only in high accuracy and low false detection rate, but also in superior performance for detecting small targets and incomplete leaves in comparative experiments. This makes it more practical for disease monitoring in complex farmland environments, enabling fast and accurate identification of diseased leaves, supporting early diagnosis and precise control, and improving monitoring efficiency. Moreover, the lightweight design of the YOLO-LSW model allows it to run efficiently on resource-constrained devices, offering significant application value and scalability. In the future, with continuous technological advancements and broader application scenarios, the YOLO-LSW model is expected to exhibit its unique advantages in more domains, offering new ideas and methods for related research and applications.

4. Discussions

Real-time detection of leaf diseases is a key aspect of precision control in smart agriculture, with the main challenge being the balance between detection accuracy, computational efficiency, and robustness in complex environments. Traditional disease identification methods rely on manual expertise, and so are inefficient and highly subjective. Efficient and accurate real-time detection of bitter melon leaf diseases directly affects the sustainability and economic benefits of its cultivation, helping farmers identify diseases in time and take control measures, significantly reducing crop losses and the risk of pesticide overuse. This not only stabilizes farmers’ income but also promotes green agricultural practices and provides consumers with safer produce.
Although deep learning has significantly improved the automation of disease identification, most detection is still performed under controlled laboratory conditions, neglecting the challenges of complex field environments. To adapt the model to real-world production settings, efficient detection of bitter melon leaf diseases must be achieved under complex field scenarios. This study proposes an improved YOLOv8-based model, YOLO-LSW, which showed significant improvements in key metrics. Compared with the original YOLOv8, the accuracy, recall, mAP50, and F1-score increased by 2.2%, 2.7%, 2.2%, and 2.4%, respectively. As shown in the heatmaps and comparative experiments, the model better captures key features in the image and reduces background interference in classification. This is crucial for accurately identifying various bitter melon disease symptoms in complex agricultural environments. Moreover, the proposed YOLOv8-LSW model adopts a lightweight design, significantly reducing the number of parameters and GFLOPs. This facilitates deployment in low-power field environments and provides technical support for early disease warning. For example, integrating this technology into UAV systems [45] can enable precise pesticide application in diseased areas, enhancing adaptability and robustness. This offers a promising technical approach for precision pesticide application in bitter melon leaf disease management. It is important to note that, in practical deployment, potential detection errors caused by issues such as motion blur leading to the loss of target texture information should also be considered [46]. Therefore, attention must be given to camera stabilization and shutter speed to ensure image clarity and, consequently, the accuracy of detection [47].
Currently, the model primarily targets downy mildew, powdery mildew, anthracnose, blight, and viral diseases in bitter melon leaves, and its performance for other diseases remains to be fully validated. In future work, we will further test and optimize the model in the following areas: Collect more image data, including additional disease types and images from diverse real-world environments and extreme weather conditions, to enable the model to learn a broader range of features. Furthermore, we aim to explore a general disease detection framework applicable across different plant species for identifying diseases in other crops. Although YOLO-LSW is lightweight and its detection speed exceeds the real-time requirement of 30 FPS, there is still room for further optimization. Looking ahead, the model will be further optimized to develop a lightweight version with even higher detection accuracy. In addition, we will train and test the YOLO-LSW model on other crops to evaluate its generalizability.
In conclusion, future research will delve deeper into the characteristics of crop diseases and related detection technologies, to continuously improve the model’s accuracy, robustness, and practicality, thereby promoting sustainable agricultural production and providing reliable technical support and reference methods for the development of smart agriculture.

5. Conclusions

This study proposes a lightweight YOLOv8-LSW model to address challenges in bitter melon leaf disease detection under complex field conditions, including poor generalization, insufficient real-time performance, and environmental interference, achieving high-accuracy and high-efficiency real-time detection. By replacing the backbone with the LeYOLO-small module and introducing the ShuffleAttention mechanism, the model integrates depthwise separable convolutions and heterogeneous connection strategies to enable dual-dimensional (channel-spatial) feature interaction. While reducing parameter count by 20.6%, the model effectively enhances its ability to extract features from various types of lesions. Compared with the original YOLOv8n model, YOLO-LSW improved the precision, recall, mAP50, mAP, and F1-score by 2.2%, 2.7%, 1.2%, 2.2%, and 2.46%, respectively. The model’s lightweight and high-accuracy characteristics provide a reliable solution for real-time field disease detection. Future research will focus on broadening the range of detectable diseases, extending model applicability, and further reducing hardware resource consumption to promote the large-scale application of this technology in agriculture. Additionally, this study offers new ideas and methods for related research and practical applications.

Author Contributions

Conceptualization, S.L., H.X., Y.D., Y.C., Y.W. and X.Z.; Data curation, S.L., H.X. and J.C.; Formal analysis, S.L., H.X., X.Z., J.Z., Z.L. and H.L.; Funding acquisition, F.Z. (Fenglin Zhong); Investigation, S.L., H.X., Y.D., Y.C., Y.W., X.Z. and M.R.; Methodology, S.L., H.X., Y.D., Y.C., Y.W., X.Z., J.Z. and F.Z. (Fenglin Zhong); Project administration, S.L., H.X., X.Z., Z.L., M.R., J.C., F.Z. (Fengxiang Zhang), and F.Z. (Fenglin Zhong); Resources, S.L. and J.Z.; Software, S.L., H.X., Y.D., Y.C., Y.W. and H.L.; Supervision, F.Z. (Fengxiang Zhang) and F.Z. (Fenglin Zhong); Validation, S.L., H.X., Y.D., Y.C., Z.L., M.R., J.C. and H.L.; Visualization, H.X. and Y.D.; Writing—original draft, S.L., H.X., Y.D., Y.W., J.Z. and M.R.; Writing—review & editing, S.L., H.X., Y.C., Z.L., J.C., F.Z. (Fengxiang Zhang), and F.Z. (Fenglin Zhong). All authors have read and agreed to the published version of the manuscript.

Funding

This research was funded by the following grants: Facility Solanaceous Vegetable Breeding and Industrialization Development Sub-topics (2023Fjnk04009); Seed Industry Innovation and Industrialization Project in Fujian Province (zycxny2021009); Fujian Modern Agricultural Vegetable Industry System Construction Project (2019-897).

Institutional Review Board Statement

Not applicable.

Data Availability Statement

Since the project presented in this research has not yet concluded, the experimental data will not be disclosed for the time being. If readers require any additional information such as key layer details of the model (e.g., “80 × 80 × C”), they may contact the corresponding author via email.

Acknowledgments

We sincerely thank our fellow students who provided support and assistance during the experiments. We thank all the good teachers and beneficial friends who have cared for us, supported us, and helped us out. Lastly, we heartily thank all the experts who took time out of their busy schedules to review this paper and offer their valuable suggestions.

Conflicts of Interest

The authors declare no conflict of interest.

References

  1. Ge, H.; Liu, S.; Zheng, H.; Chang, P.; Huang, W.; Lin, S.; Zheng, J.; Li, H.; Huang, Z.; Jia, Q.; et al. Identification and Expression Analysis of Lipoxygenase Gene in Bitter Gourd (Momordica charantia). Genes 2024, 15, 1557. [Google Scholar] [CrossRef] [PubMed]
  2. Tan, M.J.; Ye, J.M.; Turner, N.; Hohnen-Behrens, C.; Ke, C.Q.; Tang, C.P.; Chen, T.; Weiss, H.C.; Gesing, E.R.; Rowland, A. Antidiabetic activities of triterpenoids isolated from bitter melon associated with activation of the AMPK pathway. Chem. Biol. 2008, 15, 263–273. [Google Scholar] [CrossRef] [PubMed]
  3. Akihisa, T.; Higo, N.; Tokuda, H.; Ukiya, M.; Akazawa, H.; Tochigi, Y.; Kimura, Y.; Suzuki, T.; Nishino, H. Cucurbitane-type triterpenoids from the fruits of Momordica charantia and their cancer chemopreventive effects. J. Nat. Prod. 2007, 70, 1233–1239. [Google Scholar] [CrossRef] [PubMed]
  4. Zhang, S.; Zhang, C. Corn disease identification method based on local discriminant mapping algorithm. J. Agric. Eng. 2014, 30, 167–172. [Google Scholar] [CrossRef]
  5. Morbekar, A.; Parihar, A.; Jadhav, R. Crop disease detection using YOLO. In Proceedings of the 2020 International Conference for Emerging Technology (INCET), Belgaum, India, 5–7 June 2020; IEEE: Piscataway, NJ, USA; pp. 1–5. [Google Scholar] [CrossRef]
  6. Barbedo, J.G.A. Digital image processing techniques for detecting, quantifying and classifying plant diseases. SpringerPlus 2013, 2, 660. [Google Scholar] [CrossRef]
  7. Mohanty, S.P.; Hughes, D.P.; Salathé, M. Using deep learning for image-based plant disease detection. Front. Plant Sci. 2016, 7, 1418. [Google Scholar] [CrossRef]
  8. Sharif, M.A.; Raza, M.; Yasmin, M.; Satapathy, S.; Chandra, S. An integrated design of particle swarm optimization (PSO) with fusion of features for detection of brain tumor. Pattern Recognit. Lett. 2020, 129, 150–157. [Google Scholar] [CrossRef]
  9. Hinton, G.E.; Osindero, S.; Teh, Y.W. A fast learning algorithm for deep belief nets. Neural Comput. 2006, 18, 1527–1554. [Google Scholar] [CrossRef]
  10. Gong, A.; Jing, X.M. Image Recognition of Crop Diseases Based on Multi-convolution Neural Network Model Ensemble. Comput. Technol. Dev. 2020, 30, 134–139. [Google Scholar] [CrossRef]
  11. Wang, Y.L.; Zhang, H.L.; Liu, Q.F.; Zhang, Y.S. Image classification of tomato leaf diseases based on transfer learning. J. China Agric. Univ. 2019, 24, 124–130. [Google Scholar] [CrossRef]
  12. Liu, Y.J.; He, Y.K.; Wu, X.M.; Wang, W.J.; Zhang, L.N.; Lyu, H.Z. Potato Sprouting and Surface Damage Detection Method Based on Improved Faster R-CNN. Trans. Chin. Soc. Agric. Mach. 2024, 55, 371–378. [Google Scholar] [CrossRef]
  13. Wang, C.S.; Zhou, J.; Wu, H.R.; Teng, G.F.; Zhao, C.J.; Li, J.X. Identification of vegetable leaf diseases based on improved Multi-scale ResNet. Trans. Chin. Soc. Agric. Eng. 2020, 36, 209–217. [Google Scholar] [CrossRef]
  14. Li, L.L.; Zhang, S.J.; Wang, B. Plant disease detection and classification by deep learning: A review. IEEE Access 2021, 9, 56683–56698. [Google Scholar] [CrossRef]
  15. Liu, J.; Wang, X.W. Tomato diseases and pests detection based on improved YOLO v3 convolutional neural network. Front. Plant Sci. 2020, 11, 898. [Google Scholar] [CrossRef]
  16. Li, X.; Chen, X.; Yang, J.; Li, Y. Transformer helps identify kiwifruit diseases in complex natural environments. Comput. Electron. Agric. 2022, 200, 107258. [Google Scholar] [CrossRef]
  17. Zeng, T.H.; Li, S.Y.; Song, Q.M.; Zhong, F.L.; Wei, X. Lightweight Tomato Real-Time Detection Method Based on Improved YOLO and Mobile Deployment. Comput. Electron. Agric. 2023, 205, 107625. [Google Scholar] [CrossRef]
  18. Zhou, Q.; Li, H.C.; Cai, Z.L.; Zhong, Y.W.; Zhong, F.L.; Lin, X.Y.; Wang, L.J. YOLO-ACE: Enhancing YOLO with Augmented Contextual Efficiency for Precision Cotton Weed Detection. Sensors 2025, 25, 1635. [Google Scholar] [CrossRef]
  19. Zhang, Y.; Zhai, J.; Wang, L.; Song, B.; Chen, L. Recognition algorithm of agricultural diseases and insect pests based on PP-YOLO. Trans. Chin. Soc. Agric. Eng. 2024, 40, 80–87. [Google Scholar] [CrossRef]
  20. Hu, Y.; Liu, G.; Chen, Z.; Liu, J.; Guo, J. Lightweight one-stage maize leaf disease detection model with knowledge distillation. Agriculture 2023, 13, 1664. [Google Scholar] [CrossRef]
  21. Wei, H.B.; Zhang, D.J.; Du, G.M.; Xiao, W.F. Vegetable recognition algorithm based on improved YOLO v3. J. Zhengzhou Univ. (Eng. Sci.) 2020, 41, 7–12+31. [Google Scholar] [CrossRef]
  22. He, Y.; Peng, Y.; Wei, C.; Liu, H. Automatic disease detection from strawberry leaf based on improved YOLOv8. Plants 2024, 13, 2556. [Google Scholar] [CrossRef] [PubMed]
  23. Yuan, Y.; Fu, X.L.; Li, H.H. Potato Disease Recognition and Classification Based on Improved YOLOv8. J. Inn. Mong. Agric. Univ. (Nat. Sci. Ed.) 2024, 45, 56–65. [Google Scholar] [CrossRef]
  24. Yang, F.; Yao, X.T. Lightweighted Wheat Leaf Diseases and Pests Detection Model Based on Improved YOLOv8. Smart Agric. 2024, 6, 147–157. [Google Scholar] [CrossRef]
  25. Jiang, T.; Du, X.; Zhang, N.; Sun, X.; Li, X.; Tian, S.; Liang, Q. YOLOv8-GO: A Lightweight Model for Prompt Detection of Foliar Maize Diseases. Appl. Sci. 2024, 14, 10004. [Google Scholar] [CrossRef]
  26. Xu, H.; Fu, L.; Li, J.; Lin, X.; Chen, L.; Zhong, F.; Hou, M. A method for analyzing the phenotypes of nonheading Chinese cabbage leaves based on deep learning and OpenCV phenotype extraction. Agronomy 2024, 14, 699. [Google Scholar] [CrossRef]
  27. Li, B.; Fan, J. Rice pest classification based on YOLOv5. Jiangsu Agric. Sci. 2024, 52, 175–182. [Google Scholar] [CrossRef]
  28. Zhang, L.; Bayin, T.; Zeng, Q. Early disease detection method for grapevine leaves based on StyleGAN2-ADA and improved YOLOv7. Trans. Chin. Soc. Agric. Mach. 2024, 55, 241–252. [Google Scholar] [CrossRef]
  29. Han, X.; Xu, Y.; Feng, R.; Liu, T.; Bai, J.; Lan, Y. Early identification of crop diseases based on infrared thermography and improved YOLOv5. Trans. Chin. Soc. Agric. Mach. 2023, 54, 300–307+375. Available online: https://link.cnki.net/urlid/11.1964.S.20231016.1159.011 (accessed on 10 June 2025).
  30. Sekharamantry, P.K.; Melgani, F.; Malacarne, J. Deep learning-based apple detection with attention module and improved loss function in YOLO. Remote Sens. 2023, 15, 1516. [Google Scholar] [CrossRef]
  31. Zhang, Q.L.; Yang, Y.B. SA-NET: Shuffle attention for deep convolutional neural networks. In Proceedings of the 2021 IEEE International Conference on Acoustics, Speech and Signal Processing (ICASSP), Toronto, ON, Canada, 6–11 June 2021; IEEE: Piscataway, NJ, USA; pp. 2235–2239. [Google Scholar] [CrossRef]
  32. He, K.M.; Zhang, X.Y.; Ren, S.Q.; Sun, J. Deep residual learning for image recognition. In Proceedings of the IEEE Conference on Computer Vision and Pattern Recognition, Las Vegas, NV, USA, 27–30 June 2016; IEEE: Piscataway, NJ, USA; pp. 770–778. [Google Scholar] [CrossRef]
  33. Sandler, M.; Howard, A.; Zhu, M.L.; Zhmoginov, A.; Chen, L.C. Mobilenetv2: Inverted residuals and linear bottlenecks. In Proceedings of the IEEE Conference on Computer Vision and Pattern Recognition 2018, Salt Lake City, UT, USA, 18–23 June 2018; IEEE: Piscataway, NJ, USA; pp. 4510–4520. [Google Scholar] [CrossRef]
  34. Yang, R.J.; Zhang, H.; Ye, J. Improved lightweight military aircraft detection algorithm for remote sensing images with YOLOv8n. Electron. Meas. Technol. 2025, 48, 154–165. [Google Scholar] [CrossRef]
  35. Elfwing, S.; Uchibe, E.; Doya, K. Sigmoid-weighted linear units for neural network function approximation in reinforcement learning. Neural Netw. 2018, 107, 3–11. [Google Scholar] [CrossRef] [PubMed]
  36. Xu, H.; Zhang, X.; Shen, W.; Lin, Z.; Liu, S.; Jia, Q.; Li, H.; Zheng, J.; Zhong, F. Improved CSW-YOLO model for bitter melon phenotype detection. Plants 2024, 13, 3329. [Google Scholar] [CrossRef] [PubMed]
  37. Liu, K.; Lin, S.L.; Shi, X.Y.; Wang, T. Few-shot wildlife detection based on multi-scale context extraction. Chin. J. Liq. Cryst. Disp. 2025, 40, 516–526. [Google Scholar] [CrossRef]
  38. Chen, Y.; Xu, H.; Chang, P.; Huang, Y.; Zhong, F.; Jia, Q.; Chen, L.; Zhong, H.; Liu, S. CES-YOLOv8: Strawberry maturity detection based on the improved YOLOv8. Agronomy 2024, 4, 1353. [Google Scholar] [CrossRef]
  39. Tong, Z.; Chen, Y.; Xu, Z.; Yu, R. Wise-IoU: Bounding box regression loss with dynamic focusing mechanism. arXiv 2023, arXiv:2301.10051. [Google Scholar] [CrossRef]
  40. Wang, S.; Yao, L.; Xu, L.; Zhang, Y. An improved YOLOv7-Tiny method for the segmentation of images of vegetable fields. Agriculture 2024, 14, 856. [Google Scholar] [CrossRef]
  41. Zhao, Y.; Wang, J.K.; Lin, Z.Y.; Li, Q. Steel surface defect detection algorithm based on improved YOLOv8n. Electron. Meas. Technol. 2024, 47, 191–198. [Google Scholar] [CrossRef]
  42. Kumar, S.; Abdelhamid, A.A.; Zaki, T. Visualizing the unseen: Exploring GRAD-CAM for interpreting convolutional image classifiers. Full Length Artic. 2023, 4, 34–42. [Google Scholar] [CrossRef]
  43. Hussain, T.; Shouno, H. Explainable deep learning approach for multi-class brain magnetic resonance imaging tumor classification and localization using gradient-weighted class activation mapping. Information 2023, 14, 642. [Google Scholar] [CrossRef]
  44. Zuo, Z.; Gao, S.; Peng, H.; Liu, Y. Lightweight detection of broccoli heads in complex field environments based on LBDC-YOLO. Agronomy 2024, 14, 2359. [Google Scholar] [CrossRef]
  45. Deng, W.; Chen, L.P.; Zhang, R.R.; Tang, Q.; Xu, G.; Li, L.L.; Xu, M. Review on Key Technologies for UAV Precision Agro-chemical Application. Agric. Eng. 2020, 10, 1–10. [Google Scholar] [CrossRef]
  46. Sayed, M.; Brostow, G. Improved handling of motion blur in online object detection. In Proceedings of the IEEE/CVF conference on computer vision and pattern recognition, Nashville, TN, USA, 20–25 June 2021; IEEE: Piscataway, NJ, USA; pp. 1706–1716. [Google Scholar] [CrossRef]
  47. Ashar, A.A.K.; Abrar, A.; Liu, J.A. Survey on Object Detection and Recognition for Blurred and Low-Quality Images: Handling, Deblurring, and Reconstruction. In Proceedings of the 2024 8th International Conference on Information System and Data Mining, Los Angeles, CA, USA, 24–26 June 2024; IEEE: Piscataway, NJ, USA; pp. 95–100. [Google Scholar] [CrossRef]
Figure 1. Geographic location of the bitter melon cultivation base. Note: The map is sourced from the Tian Di Tu website, address: www.tianditu.gov.cn (accessed on 10 June 2025).
Agriculture 15 01281 g001
Figure 2. Representative images of various plant diseases: (a) downy mildew, (b) powdery mildew, (c) viral disease, (d) anthracnose, (e) late blight.
Agriculture 15 01281 g002
Figure 3. Data augmentation effects: (a) original image, (b) brightness adjustment, (c) mirror Flip, (d) random translation, (e) random combination.
Agriculture 15 01281 g003
Figure 4. Number of samples for each disease. Note: PM stands for powdery mildew; DM stands for downy mildew; A stands for anthracnose; PB stands for late blight; MD stands for viral disease.
Agriculture 15 01281 g004
Figure 5. YOLOv8-LSW network structure.
Agriculture 15 01281 g005
Figure 6. Base building blocks of LeYOLO: (a) classical bottleneck; (b) inverted bottleneck; (c) improved bottleneck structure (LeYOLO).
Agriculture 15 01281 g006
Figure 7. Architecture of Shuffle Attention. Note: C, W, and H represent the channel number, width, and height of the feature map X, respectively.
Agriculture 15 01281 g007
Figure 8. Schematic diagram of anchor box and ground truth box.
Agriculture 15 01281 g008
Figure 9. Performance comparison before and after model improvement.
Agriculture 15 01281 g009
Figure 10. Confusion matrix of inference results before and after improvement. (a) Results of the model before improvement, (b) Results of the model after improvement.
Agriculture 15 01281 g010
Figure 11. Precision–recall curves before and after model improvement. (a) PR curve of the YOLO-LSW model, (b) PR curve of the YOLOv8n model.
Agriculture 15 01281 g011
Figure 12. Heatmaps before and after model improvement. (a) Original image, (b) Before improvement, (c) After improvement.
Agriculture 15 01281 g012
Figure 13. Detection results from selected comparative experiments. (a) Original image, (b) Detection result by YOLO-LSW, (c) Detection result by YOLOv8n, (d) Detection result by YOLOv6, (e) Detection result by YOLOv10, (f) Detection result by YOLOv5s.
Agriculture 15 01281 g013
Table 1. Precision and recall rates before and after improvements for different YOLOv8 variants.
Model NamesDatasetsP (Baseline)P (Improved)R (Baseline)R (Improved)
KTD-YOLOv8Strawberry Leaf Disease89.10%90.00%77.60%81.30%
YOLOv8-DCNPotato Disease88.78%96.50%87.32%94.36%
YOLOv8-SSWheat Leaf Disease79.30%89.41%87.32%94.36%
YOLOv8-GOCorn Leaf Disease87.00%90.00%76.60%77.40%
Note: “Baseline” refers to the baseline model, which is YOLOv8, while “Improved” refers to the improved model, which is the modified YOLOv8 variant.
Table 2. Model training environment.
ParameterConfiguration
CPUIntel(R) Xeon(R) Platinum 8481C
Random access memory (RAM)80GB
GPURTX 4090D
Display memory24 GB
Training environmentCUDA 11.3
Operating systemubuntu20.04 (64-bit)
Development environment (computer)PyTorch 1.11.0 Python 3.8.18
Table 3. Ablation study results.
IDBackboneAttentionLossPrecisionRecallmAP50mAP50-95F1-Score
1 93.10%91.60%96.90%93.40%92.34%
2 WIOUV393.90%93.40%97.30%93.70%93.65%
3 ShuffleAttention 93.30%92.80%97.50%94.20%93.05%
4LeYOLO-small 94.10%93.80%97.80%95.60%93.95%
5 ShuffleAttentionWIOUV393.80%93.90%97.40%93.60%93.85%
6LeYOLO-smallShuffleAttention 95.00%93.90%97.80%95.60%94.45%
7LeYOLO-small WIOUV394.10%93.90%97.80%95.60%94.00%
8LeYOLO-smallShuffleAttentionWIOUV395.30%94.30%98.10%95.60%94.80%
Table 4. Results of comparative experiments.
ModelsPrecisionRecallmAP50mAP50-95F1-ScoreParametersGFLOPS
YOLOv8n93.10%91.60%96.90%93.40%92.34%2,691,1836.9
YOLOv3-tiny87.10%91.60%94.20%82.30%89.29%9,521,59414.3
YOLOv592.40%92.80%96.70%91.90%92.60%2,182,6395.8
YOLOv5s94.90%93.70%97.50%94.40%94.30%7,815,55118.7
YOLOv6s94.20%92.80%97.10%95.70%93.49%15,977,11942.8
YOLOv691.20%92.20%96.10%93.50%91.70%41,55,51911.5
YOLOv10n93.20%93.50%96.90%94.00%93.35%2,696,3668.2
YOLO-LSW95.30%94.30%98.10%95.60%94.80%2,137,1995.5
Disclaimer/Publisher’s Note: The statements, opinions and data contained in all publications are solely those of the individual author(s) and contributor(s) and not of MDPI and/or the editor(s). MDPI and/or the editor(s) disclaim responsibility for any injury to people or property resulting from any ideas, methods, instructions or products referred to in the content.

