Article

Evaluating Sustainability of Water–Energy–Food–Ecosystems Nexus in Water-Scarce Regions via Coupled Simulation Model

1
Academy of Eco-Civilization Development for Jing-Jin-Ji Megalopolis, Tianjin Normal University, Tianjin 300387, China
2
State Key Laboratory of Simulation and Regulation of Water Cycle in River Basin, China Institute of Water Resources and Hydropower Research (IWHR), Beijing 100038, China
3
State Key Laboratory of Hydroscience and Engineering, Tsinghua University, Beijing 100084, China
4
General Institute of Water Conservancy Resources and Hydropower Planning and Design, Ministry of Water Resources, Beijing 100120, China
*
Author to whom correspondence should be addressed.
Agriculture 2025, 15(12), 1271; https://doi.org/10.3390/agriculture15121271
Submission received: 9 May 2025 / Revised: 7 June 2025 / Accepted: 10 June 2025 / Published: 12 June 2025
(This article belongs to the Section Ecosystem, Environment and Climate Change in Agriculture)

Abstract

Complex feedback mechanisms and interdependencies exist among the water–energy–food–ecosystems (WEFE) nexus. In water-scarce regions, fluctuations in the supply or demand of any single subsystem can destabilize the others, with water shortages intensifying conflicts among food production, energy consumption, and ecological sustainability. Balancing the synergies and trade-offs within the WEFE system is therefore essential for achieving sustainable development. This study adopts the natural–social water cycle as the core process and develops a coupled simulation model of the WEFE (CSM-WEFE) system, integrating food production, ecological water replenishment, and energy consumption associated with water supply and use. Based on three performance indices—reliability, coupling coordination degree, and equilibrium—a coordinated sustainable development index (CSD) is constructed to quantify the performance of WEFE system under different scenarios. An integrated evaluation framework combining the CSM-WEFE and the CSD index is then proposed to assess the sustainability of WEFE systems. The framework is applied to the Beijing–Tianjin–Hebei (BTH) region, a representative water-scarce area in China. Results reveal that the current balance between water supply and socio-economic demand in the BTH region relies heavily on excessive groundwater extraction and the appropriation of ecological water resources. Pursuing food security goals further exacerbates groundwater overexploitation and ecological degradation, thereby undermining system coordination. In contrast, limiting groundwater use improves ecological conditions but increases regional water scarcity and reduces food self-sufficiency. Even with the full operation of the South-to-North Water Diversion Project (Middle Route), the region still experiences a 16.4% water shortage. By integrating the CSM-WEFE model with the CSD evaluation approach, the proposed framework not only provides a robust tool for assessing WEFE system sustainability but also offers practical guidance for alleviating water shortages, enhancing food security, and improving ecological health in water-scarce regions.

1. Introduction

Water, food, energy, and ecology constitute the fundamental basis for enhancing human well-being and promoting regional sustainable development [1]. However, with intensifying global climate change, rapid population growth, and accelerated urbanization, these interconnected systems face unprecedented challenges from escalating demand and constrained supply. Global food production and energy generation are projected to increase by approximately 60% from 2015 to 2050, while water demand is expected to rise by 20% during the same period [2]. This surge in resource requirements is expected to exacerbate ecological degradation and environmental stress. Meanwhile, by 2050, nearly half of the global urban population is projected to face water scarcity [3]. As a critical resource supporting economic development, food and energy production, and ecological health, severe water shortages will further exacerbate conflicts and trade-offs among regional socioeconomic, food, energy, and ecology systems. Such challenges will further undermine the achievement of United Nations Sustainable Development Goals (SDGs), including SDG 2 (Zero Hunger), SDG 6 (Clean Water and Sanitation), SDG 7 (Affordable and Clean Energy), and SDG 15 (Life on Land) (https://sdgs.un.org/2030agenda, accessed on 3 May 2025). In water-scarce regions, the imbalance caused by the conflicting water supply and demand within the water–energy–food–ecology (WEFE) system further constrains sustainable development. Therefore, an integrated sustainability evaluation framework is required to systematically model and regulate WEFE system, enhance synergies under dynamic feedback interactions, and balance trade-offs among competing water-use sectors.
The 2011 Bonn conference defined the interconnections among water, energy, and food as the “nexus” and proposed strategies to enhance efficiency, reduce trade-offs, and strengthen synergies. Since then, research on the water–energy–food nexus and similar multi-system linkages has garnered widespread attention from scholars worldwide [4,5]. In the U.S. Great Plains, agricultural production in Nebraska has long been affected by drought. Zhang et al. [6] developed an optimization approach for the water–food–energy nexus based on a crop model, incorporating crop irrigation water use and energy consumption for groundwater pumping. Similarly, California’s Central Valley, one of the U.S.’s key agricultural regions, relies heavily on groundwater irrigation. This dependence has led to persistently high groundwater consumption, resulting in continuous groundwater level declines, reduced river flows, and a range of water–energy–food–ecology challenges [7,8]. For transboundary rivers, achieving sustainable development while balancing competing objectives such as water supply security, hydropower development, river ecology, and food production across different countries presents a significant challenge [9,10,11]. For instance, in the Lancang-Mekong River Basin in Asia, Yu et al. [12] found that full cooperation could increase downstream countries’ hydropower generation by 4% and rice production by 10%, but at the cost of China’s (upstream) hydropower interests. In China, the spatial and temporal mismatches among water resources, energy bases, and major food-producing regions have driven extensive research on the water–food–energy–ecology system. In the Yellow River Basin, the intense competition for water resources between energy development and food production has already posed significant threats to regional ecological health, energy and food security, and socioeconomic water demands, thereby constraining high-quality development [13,14,15]. In the arid Shiyang River Basin, the expansion of oasis agriculture has exacerbated conflicts between agricultural and ecological water use, necessitating integrated management of the water–food–ecology system to enhance synergies within the nexus [16,17]. Despite its abundant water resources, the Yangtze River Basin faces water quality-related water scarcity, as well as challenges from non-point source pollution caused by agricultural activities and ecological disruptions from hydropower generation. Focusing on the interplay among water–food–energy–ecology system in the Yangtze River Basin is crucial for fostering effective synergies and supporting economic growth and sustainable development [18,19,20]. Besides, extensive research on the water–food–energy–ecology system has been conducted in Africa [21,22], Europe [23], the Mediterranean region [24], Kazakhstan [25], Iran [26], Brazil [27], and other regions or countries. Due to variations in study areas and research focuses, different studies emphasize distinct aspects of the system. However, a significant concentration of research has been conducted in water-scarce regions, highlighting the intense competition for water resources among food, energy, and ecological needs. This competition has, in turn, reinforced the complexity and interdependence of the water–energy–food–ecosystems. Consequently, adopting nexus-based coordinated management has emerged as a key strategy for ensuring sustainable development in water-scarce regions.
To quantitatively analyze the feedback mechanisms and interconnections within the nexus system, scholars worldwide have employed various methodologies. Based on research perspectives and evaluation approaches, these studies can be categorized into two main types. The first category adopts a macro-level perspective, utilizing statistical data to assess the development level, diagnose risks, and identify interactions within the system. Common methods include indicator analysis, life cycle assessment (LCA) [28,29], input-output analysis [30,31], and water footprint assessment [32,33]. Indicator analysis involves constructing an index system that reflects the characteristics and interdependencies of the WEFE system based on regional attributes. Various analytical techniques, such as coupling coordination degree [34,35,36], competition-synergy evolution models [37,38], copula functions [14,39], and Bayesian networks [40,41], are then employed to conduct multidimensional quantitative evaluations of the WEFE system in terms of security, sustainability, resilience, and reliability. The second category focuses on mechanistic modeling approaches that simulate natural water cycles, water resource regulation, and food production processes, enabling a quantitative understanding of subsystem interactions and dynamic feedback mechanisms. Common methods include coupling existing models, developing system dynamics models, or directly constructing integrated models. Frequently used models include the water evaluation and planning (WEAP) model [42], the soil and water assessment tool (SWAT) [43], and the MODFLOW model [44]. For example, Liu et al. [45] coupled WEAP and MODFLOW to analyze the interconnected variations in agricultural yield, groundwater levels, and energy consumption under drought conditions in a typical agricultural basin. System dynamics models can capture feedback loops and time delays within the WEFE system, as demonstrated by Wang et al. [46], who developed a system dynamics model incorporating the interrelations among water, energy, food, environment, society, and the economy. To achieve a more comprehensive and scientifically robust evaluation of the nexus system, many scholars have developed integrated simulation models. For instance, the Climate, Land, Energy, and Water Systems framework [47] integrates multiple existing modeling tools. Yue and Guo [33] proposed an optimization model for the water–energy–food–environment nexus to support agricultural sustainability. Other notable integrated models include Q-nexus [48], MuSIASEM [49], and NexSym [50], which provide systematic approaches for WEFE system assessment and optimization.
Overall, while macro-level evaluation methods are widely applied in assessing the effectiveness of WEFE systems, they primarily focus on measuring coordinated development levels and risk assessment. However, these approaches are often influenced by subjective factors in indicator selection, and the assignment of weight coefficients can significantly impact the results. Additionally, the lack of standardized evaluation criteria makes it difficult to directly compare different regional scenarios. In contrast, mechanistic methods based on physically based models can effectively simulate and assess the interactions and impacts within the WEFE system. However, these models often involve complex parameterization, making data acquisition, calibration, and validation challenging. Moreover, the WEFE system is inherently dynamic, and significant challenges remain in quantitatively analyzing the interactions and feedback mechanisms among its subsystems.
To address the aforementioned challenges, this study develops an integrated sustainability evaluation framework for the WEFE system by coupling a physically based simulation model (CSM-WEFE) with a coordinated sustainable development assessment approach. A comparison of typical nexus models and the improvements introduced by the CSM-WEFE is presented in Table 1. The model is applied to the Beijing–Tianjin–Hebei (BTH) region, one of the most economically developed yet water-scarce areas in China. Over the past few decades, rapid population growth and industrial expansion have significantly increased regional demands for water, food, and energy, while also raising ecological conservation requirements. Severe water shortages have become a major constraint on the sustainable development of food production and ecology health, leading to multiple issues such as increased energy consumption in the social water cycle [51], excessive groundwater extraction and river depletion [52,53], and a decline in food self-sufficiency [54]. This study systematically considers the complex feedback mechanisms among water, food, energy and ecology in the BTH region to develop balanced scenario strategies that harmonize water supply for economic and social needs, irrigation for food production, energy consumption for social water cycle, and ecological water replenishment. This not only advances the scientific understanding of sustainable development in the WEFE nexus but also provides practical solutions for mitigating imbalances in water-scarce regions.
The main objectives of this study are to (1) develop a coupled simulation model of WEFE by integrating key processes such as natural and social water cycling, food production, ecological water replenishment, and energy consumption in the social water cycle; (2) develop a coordinated sustainable evaluation approach based on the outputs from the coupled simulation model of WEFE by defining three key indices: reliability, equilibrium, and coupling coordination degree; (3) assess the current state of the WEFE nexus in the BTH region and explore the impacts of different food security and ecological restoration scenarios on its sustainability.

2. Methodology

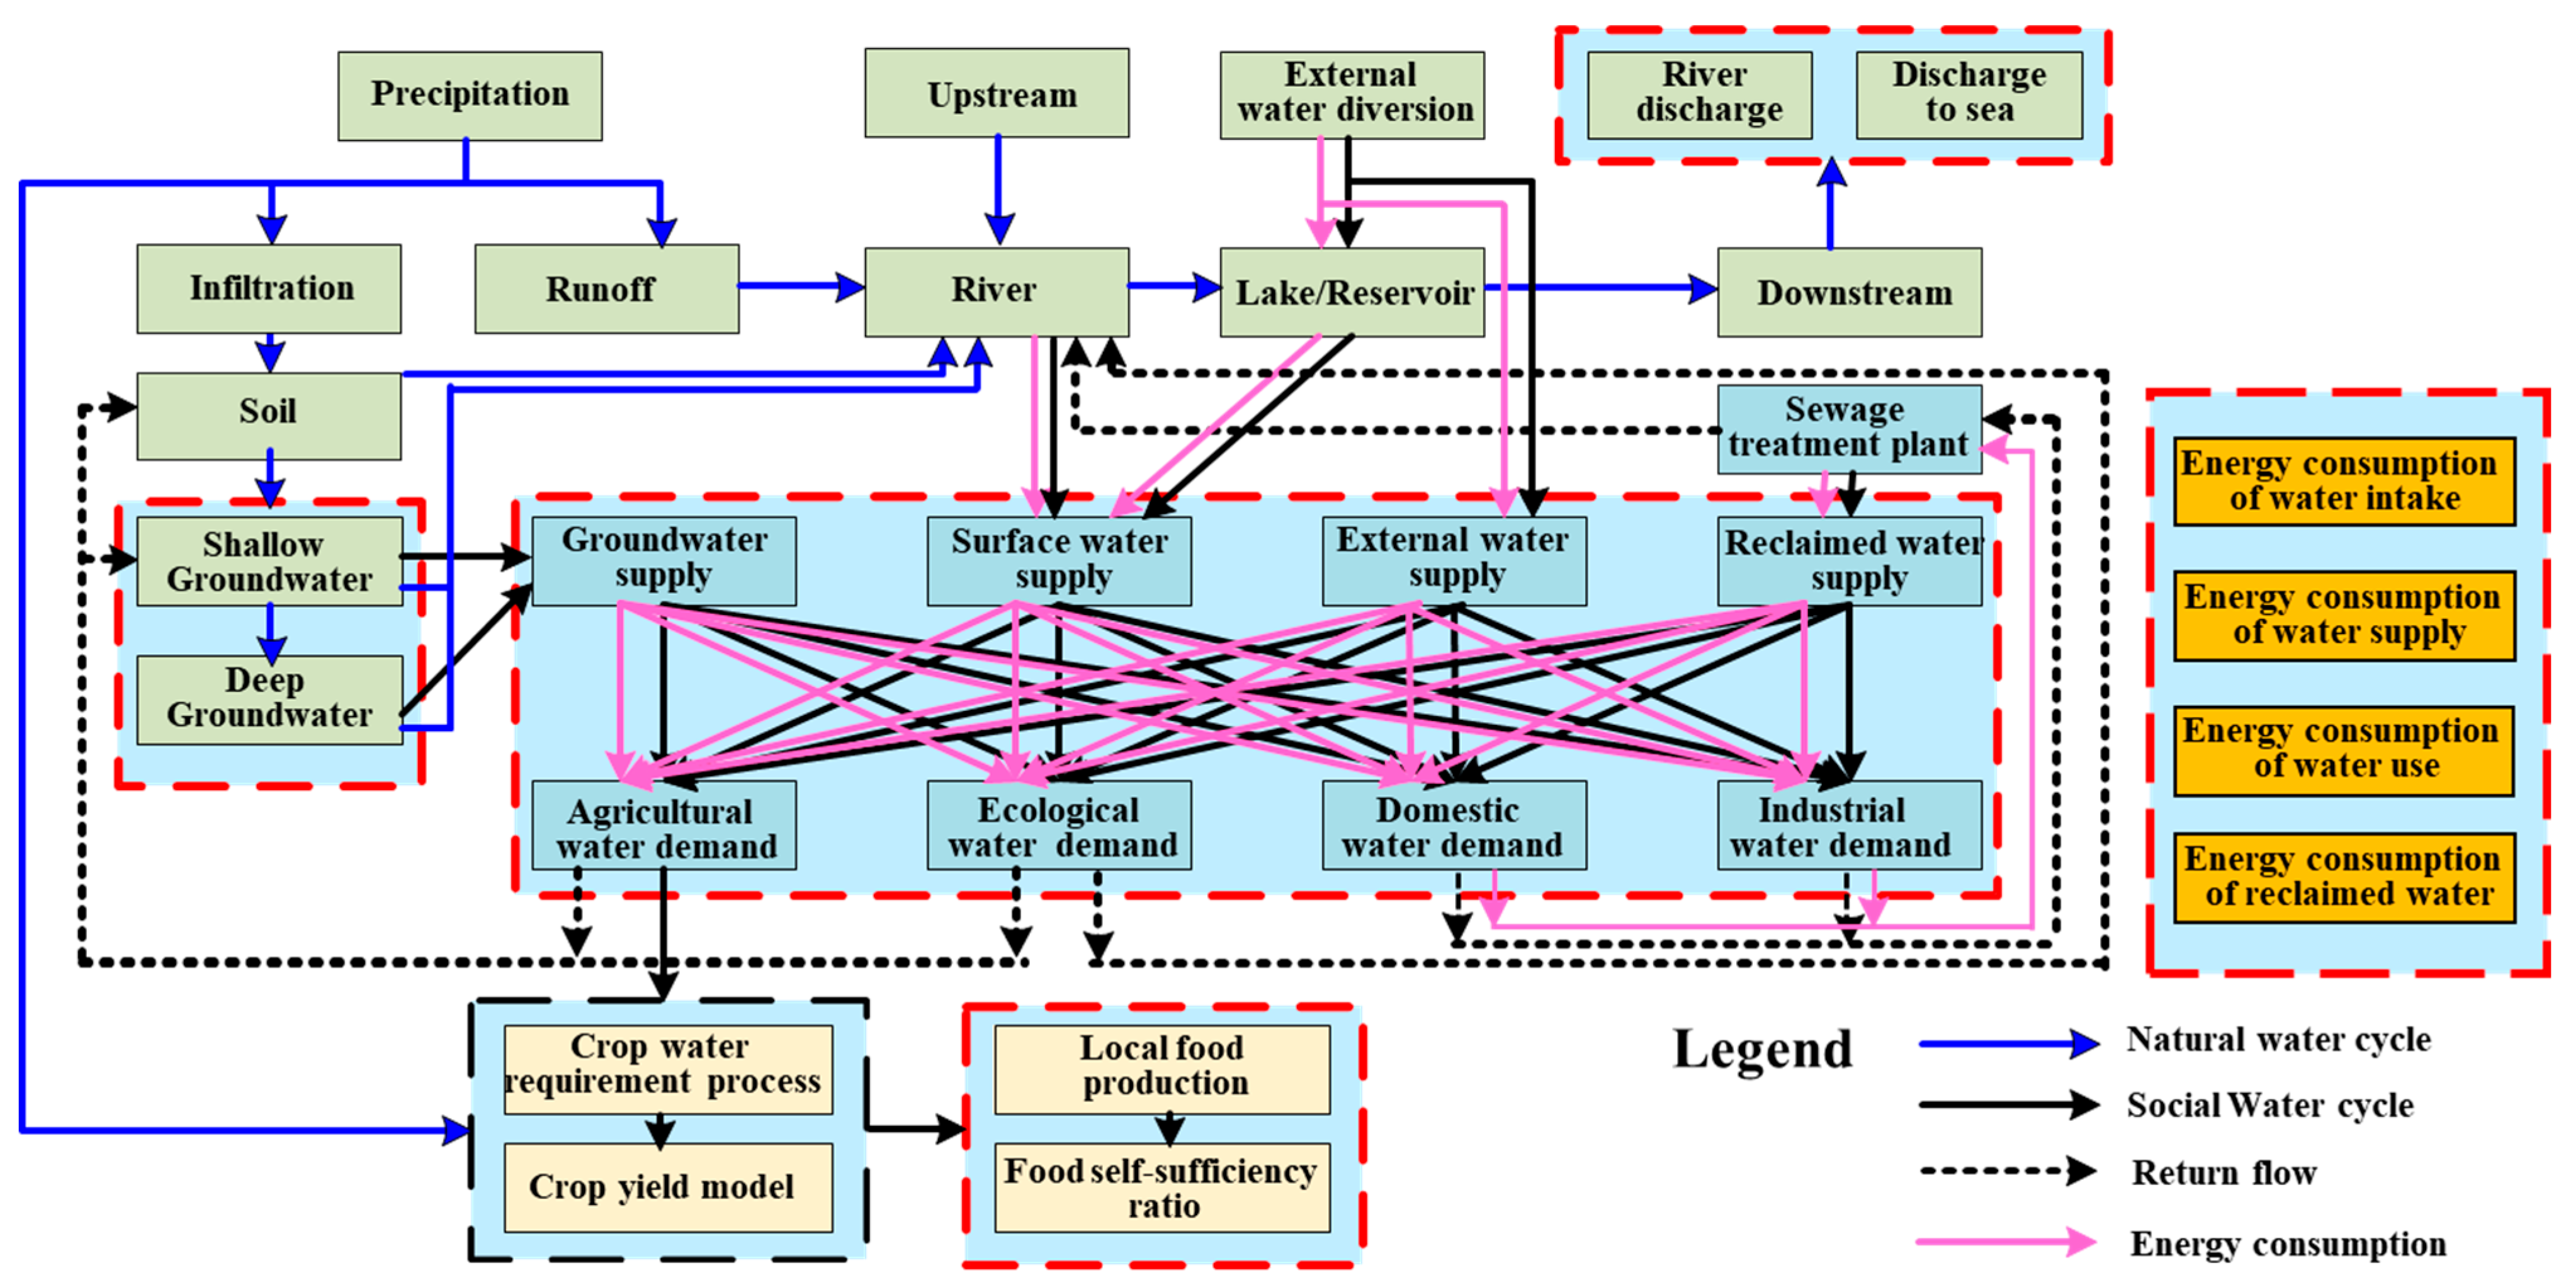
2.1. CSM-WEFE Architecture

The key process of the WEFE system lies in the interaction between the natural and social water cycles. Water resource allocation (social water cycle) is essential for ensuring food security, supporting energy production, and maintaining a healthy natural water cycle through ecological water replenishment. The social water cycle extracts water from the natural water cycle and, after water allocation, returns drainage water to rivers, forming a dynamic feedback loop. Agricultural water shortage directly impacts food production, while the processes of water intake, distribution, utilization, and drainage in the social water cycle not only consume significant energy but also influence surface water and groundwater availability, as well as the discharge into the sea. These interconnections dynamically reflect the state of food self-sufficiency and ecological health within the coupled system.
To accurately and comprehensively simulate the complex interactions within the WEFE system, this study develops a coupled simulation model of water–energy–food–ecosystems (CSM-WEFE), which consists of four major modules: (1) a natural water cycle module, which simulates rainfall–runoff generation, quantifies unit water yield for each time step, and calculates inflows from reservoirs, lakes, and other hydraulic structures. It also determines upstream river inflows, water withdrawals and discharges within the river network, and inter-basin water transfers. A (2) social water cycle module, which allocates water resources from multiple sources to multiple users based on water availability and sectoral demand. Domestic and industrial wastewater is fully collected and treated, with a portion being upgraded and reused as reclaimed water, while the remainder is discharged into rivers. A (3) food production module, which determines actual food yield and food self-sufficiency based on agricultural water supply, irrigation efficiency, and irrigated area. Lastly, an (4) energy consumption module, which calculates the energy consumption associated with the entire social water cycle, including water intake, supply, utilization, drainage, and wastewater treatment, according to the allocation of different water sources to various users. The structural framework of CSM-WEFE is illustrated in Figure 1.

2.2. Major Modules of CSM-WEFE

2.2.1. Natural Water Cycle

The natural water cycle process encompasses surface runoff generation, interflow, groundwater runoff, evapotranspiration, and river confluence processes. This study employs the built-in runoff generation and river confluence modules of the GWAS (v2.2.0) (general water allocation and simulation for management system) model (available from http://82.157.9.189:8078, accessed on 3 May 2025) [55,56,57]. Through this simulation, the model provides real-time water availability data for the social water cycle module, while also outputting key ecological parameters such as river cross-section ecological flow and freshwater discharge into the sea.

2.2.2. Social Water Cycle

(1)
Water resource allocation
Water resource allocation is carried out based on the water distribution ratio, ensuring that different water sources supply different water users. The specific calculation formula is as follows:
W_spl i , j , u , t = m i n ( β i , j · W_dmd j , u , t , W_scap i , u , t , W_resours i , u , t )
where i represents the i-th water source; j represents the j-th water user; u represents the u-th unit; t represents the t-th time step; β i , j is the water distribution ratio (ranging from 0 to 1), indicating the maximum proportion of demand that the i-th water source can fulfill for the j-th user; W _ d m d j , u , t is the water demand of the j-th user in the u-th unit at time t, m3; W _ s c a p i , u , t is the supply capacity of the i-th water source in the u-th unit at time t, m3; W _ r e s o u r s i , u , t is the available water volume from the i-th water source in the u-th unit at time t, m3; and W _ s p l i , j , u , t is the actual water supply from the i-th water source to the j-th user in the u-th unit at time t, m3.
(2)
Reclaimed water simulation
Domestic and industrial wastewater is collected and treated through urban wastewater treatment systems, enabling centralized processing and subsequent reuse as reclaimed water. The wastewater generation and reclaimed water availability are calculated as follows:
W S = ( W _ s p l d o m W E d o m ) × K d r q × K d r d + ( W _ s p l i n d u W E i n d u ) × K i r q × K i r d
W R = m i n ( W S × K r , F r e w )
where W S is the total wastewater volume, m3; W _ s p l d o m and W _ s p l i n d u are the domestic and industrial water supply volumes, respectively, m3; W E d o m and W E i n d u are the domestic and industrial water consumption volumes, respectively, m3; K d r q and K i r q are the domestic and industrial wastewater collection coefficients, respectively; K d r d and K i r d are the domestic and industrial wastewater treatment coefficients, respectively; W R is the available reclaimed water volume, m3; K r is the reclaimed water treatment efficiency; and F r e w is the reclaimed water treatment capacity, m3.

2.2.3. Food Production Simulation

In this study, the crop water production function model [58,59] is employed to simulate regional food yield under varying irrigation and rainfall conditions. The calculation formula is as follows:
Y m a x Y a c t Y m a x = K y ( E T m a x E T a c t E T m a x )
where Y m a x is the maximum crop yield, t/ha; Y a c t is the actual crop yield, t/ha; K y is the crop yield response factor to water shortage; E T m a x is the potential evapotranspiration of the crop, mm; and E T a c t is the actual evapotranspiration of the crop, mm.
The calculation formulas of the relevant parameters are as follows:
E T m a x = K c · E T 0
E T a c t = P e f f + M A c · θ
P e f f = max 0 , f · 1.253 P 0.824 2.935 · 10 0.001 E T m a x ,   P 12.5   mm P ,   P < 12.5   mm
where K c is the crop coefficient; E T 0 is the reference crop evapotranspiration, mm, calculated using the FAO recommended Penman–Monteith equation; P e f f is the effective precipitation, mm; M is the crop irrigation water withdrawal, m3; A c is the irrigated area, 10 1 ha; θ is the irrigation efficiency coefficient; P is the precipitation, mm; and f is the correction factor, with a reference value of 1.012.

2.2.4. Energy Consumption for the Social Water Cycle

The energy consumption for the social water cycle refers to the total energy required to drive water resources through various processes, including water intake, water supply, water use, and reclaimed water treatment.
(1)
Energy consumption for water intake
During the water intake process, the energy consumption associated with surface water diversion and storage is relatively low. Therefore, this study primarily focuses on the energy consumption for surface and groundwater pumping, such consumption calculated as follows:
E C _ S W I ( E C _ G E ) = m × g × h 3.6 × 10 6 × ε × ( 1 μ )
where E C _ S W I E C _ G E is the energy consumption for surface water intake or groundwater extraction, kWh; m is the mass of water lifted, kg; g is the gravitational acceleration, m/s2; h is the pumping height, m; ε is the pumping station efficiency, generally taken as 0.75; and μ is the head loss during the pumping process.
(2)
Energy consumption for water supply
Energy consumption for the water supply process includes both water production (filtration, disinfection, etc.) and water distribution through pumping stations. Only domestic and industrial water supply are considered, and are calculated as follows:
E C _ W P = W _ s u p p l y d o m × e p r o d + W _ s u p p l y i n d u × e p r o d
E C _ W D = W _ s u p p l y d o m × e d e l i + W _ s u p p l y i n d u × e d e l i
where E C _ W P and E C _ W D are the energy consumption for water production and distribution, respectively, kWh; W _ s u p p l y d o m and W _ s u p p l y i n d u are the domestic and industrial water supply volumes, respectively, m3; e p r o d and e d e l i are the unit energy consumption for water production and distribution, respectively, kWh/m3.
(3)
Energy consumption for water use
Energy consumption for domestic water use can be categorized as follows: a. heating energy consumption, associated with boiling water, cooking, and bathing; b. mechanical energy consumption, required for operating water-reliant appliances such as dishwashers and washing machines. Energy consumption for industrial water use is mainly reflected in heating energy consumption, including the provision of thermal energy for production through hot water or steam, as well as the conversion of steam into mechanical energy.
The energy consumption for domestic water use is calculated as follows:
E C _ D W U = E d o m , h + E d o m , m
E d o m , h = V × ρ × C × T t T i μ + E 3.6 × 10 6 E d o m , m = p × m
where E C _ D W U is the energy consumption for domestic water use, kWh; E d o m , h and E d o m , m are the energy consumption for domestic water heating and mechanical water use, respectively, kWh; V is the daily heated water volume, m3; ρ is the water density, kg/m3; C is the specific heat capacity of water, kJ/(kg·°C); T t and T i are the heated water temperature and ambient temperature, respectively, °C; μ is the heating efficiency; E is the energy loss, kJ; p is the rated power of the washing machine, kWh/kg; and m is the rated washing capacity, kg.
The energy consumption for industrial water use is calculated as follows:
E C _ I W U = C × V × ( T h T i ) 3.6 × 10 6 × γ
where E C _ I W U is the energy consumption for industrial water use, kWh; T h is the target temperature of industrial water, °C; and γ is the industrial water heating efficiency.
(4)
Energy consumption for reclaimed water treatment
The processes of wastewater collection, transport, and quality enhancement require energy consumption. Given the significant differences in wastewater treatment technologies, the energy consumption for reclaimed water treatment is generalized based on unit energy consumption, as follows:
E C _ R W T = W S × e w s + W R × e w r
where E C _ R W T are the energy consumption for reclaimed water treatment, kWh; and e w s and e w r are the unit energy consumption for wastewater and reclaimed water treatment, respectively, kWh/m3.

2.3. WEFE Subsystem Evaluation Indicators

To quantitatively evaluate the water resource subsystem, the water shortage rate is used as an evaluation indicator, which reflects the level of water supply security. It is calculated as follows:
P w _ u n m e t = n = 1 N i = 1 I j = 1 J W _ s u p p l y i , j , n n = 1 N i = 1 I W _ d e m a n d i , n
where P w _ u n m e t represents the water shortage rate; W _ s u p p l y i , j , n is the water supply volume for region n, water user i, and water source j, m3; W _ d e m a n d i , n is the water demand volume for region n and water users i, m3; N is the number of units; I is the number of water users; and J is the number of water sources.
For the food subsystem, the food self-sufficiency rate is used as an evaluation indicator to quantify the extent to which local food production meets regional food demand:
P f o o d = G f o o d D f o o d × 100 %
where P f o o d is the food self-sufficiency rate, %; G f o o d is the total regional food production, ton; and D f o o d is the total regional food demand, tons.
For the energy subsystem, the energy consumption for social water cycle is used as an evaluation indicator to quantify the extent of energy use in various water-related processes. The total energy consumption is calculated as follows:
T E C = n = 1 N ( E C _ S W I + E C _ G E + E C _ W P + E C _ W D + E C _ I W U + E C _ D W U + E C _ R W T )
where T E C represents the total energy consumption of the social water cycle, kWh.
For the ecology subsystem, two key indicators are used: groundwater overextraction, which reflects the degree of groundwater depletion, and water discharge to the sea, which reflects the ecological health of rivers and lakes. These indicators are directly output from the CSM-WEFE.

2.4. Coordinated Sustainable Development Evaluation Method

2.4.1. Reliability Index

The reliability index (REL) represents the overall WEFE system’s security level, with higher values indicating greater system reliability. The index reaches its maximum value of 1 when all four sub-indices ( R 1 , R 2 , R 3 , R 4 ) are equal 1, indicating that the WEFE system fully meets the self-sufficiency requirements. The reliability index is calculated as follows:
R E L = R 1 × R 2 × R 3 × R 4 4
R 1 = m i n 1 , W r W u s e ;   R 2 = m i n 1 , F p r o F s a f e ;   R 3 = m i n 1 , E p E u s e ;   R 4 = m i n ( 1 , H s u p p l y H n e e d )
where W u s e is the total water use, m3; W r is the local available water supply, m3; F p r o is the local food production, tons; F s a f e is the regional food demand, tons; E u s e is the energy consumption for the social water cycle, kWh; E p is the multi-year average energy consumption for the social water cycle, kWh; H s u p p l y is the ecological water supply, m3; and H n e e d is the ecological water demand, m3.

2.4.2. Equilibrium Index

The equilibrium index (EQU) quantifies the fairness of development within the WEFE system. Water shortages can restrict the growth of economic, agricultural, ecological, and energy subsystems. Therefore, the water shortage rate across different units is used as the fundamental parameter; then, the Gini coefficient is employed to assess the disparity in the water shortage rate among various units, calculated as follows:
E Q U = 1 G G = i = 1 N j = 1 N x i x j 2 N 2 · P w _ u n m e t ¯
where EQU represents the equilibrium index; G is the Gini coefficient of water shortage rate; x i and x j denote the water shortage rate of units i and j, respectively; and P w _ u n m e t ¯ represents the mean water shortage rate across all units.
The EQU is derived using the formula 1 – G and it ranges from 0 to 1, with values closer to 1 indicating smaller disparities in water shortage rates and thus higher spatial equity; values closer to 0, on the other hand, reflect greater disparities and lower equity in water distribution.

2.4.3. Coupling Coordination Degree Index

The coupling coordination degree index (CCD) measures the extent of coordinated development within the WEFE system. Based on the output results from the CSM-WEFE, key indicators for the four subsystems are identified. Representative indicators are determined according to the characteristics of each subsystem, as detailed in Table A1. Then, the max–min normalization method and the comprehensive weighting method are used to determine the order degree of each subsystem. Finally, based on the coupling degree and the comprehensive evaluation results of the WEFE system, the CCD can be determined, providing insights into the synergy between water, food, energy, and ecology sustainability.
The coordination degree (CD) quantifies the level of coupling and coordination among the WEFE systems. The terms F 1 , F 2 , F 3 , and F 4 (calculation method references [13,37]) represent the systematic order degree of the water, food, energy, and ecology subsystems, respectively. The CD is calculated as follows:
C D = 4 F 1 × F 2 × F 3 × F 4 4 F 1 + F 2 + F 3 + F 4
The comprehensive evaluation (CE) provides an overall assessment of the order degree of the four subsystems using an arithmetic mean, calculated as follows:
C E = F 1 + F 2 + F 3 + F 4 4
The coupling coordination degree (CCD) considers both the intersystem coupling and the overall coordination status of the WEFE system. It is determined using the following formula:
C C D = C D × C E

2.4.4. Coordinated Sustainable Development Index

To assess the overall sustainability of the WEFE system, a coordinated sustainable development index (CSD) is developed based on three key performance indices: reliability (REL), equilibrium (EQU), and coupling coordination degree (CCD). Since all three indices are positively oriented, they are aggregated using the geometric mean as follows:
C S D = E Q U · C C D · R E L 3
The CSD serves as a metric to evaluate the system’s capacity for coordinated development under different scenarios. A higher CSD value indicates greater system reliability, improved equilibrium, and enhanced coordination, reflecting a stronger ability to achieve sustainable development within the WEFE system.

3. Study Area and Data Sources
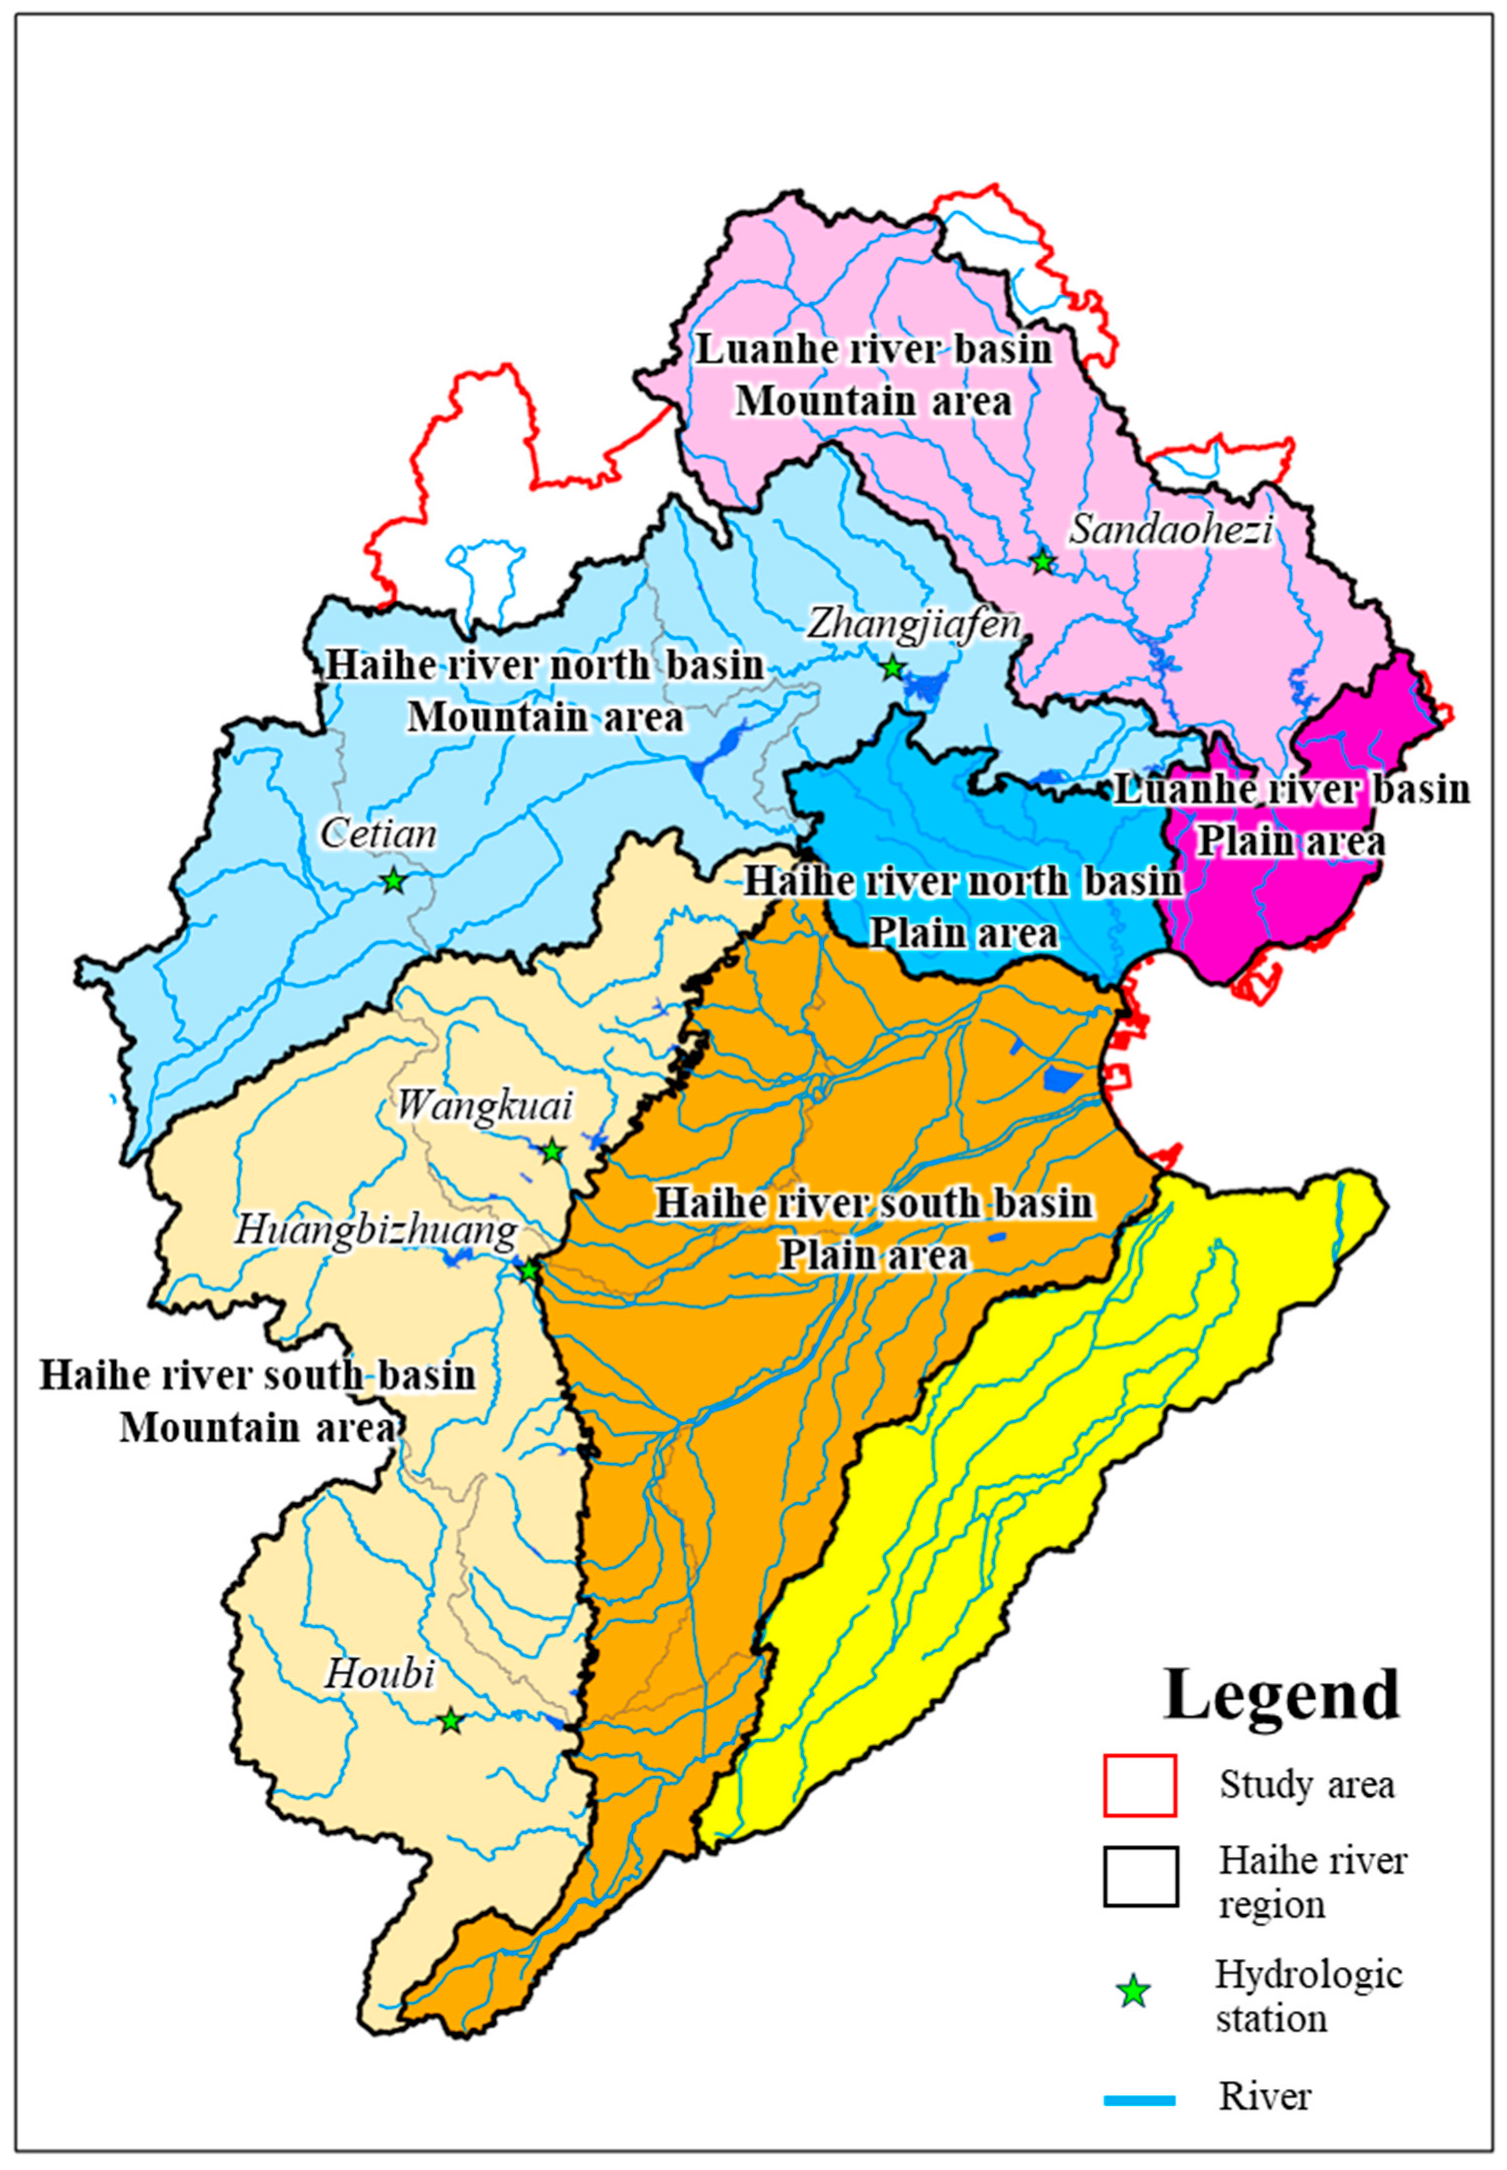
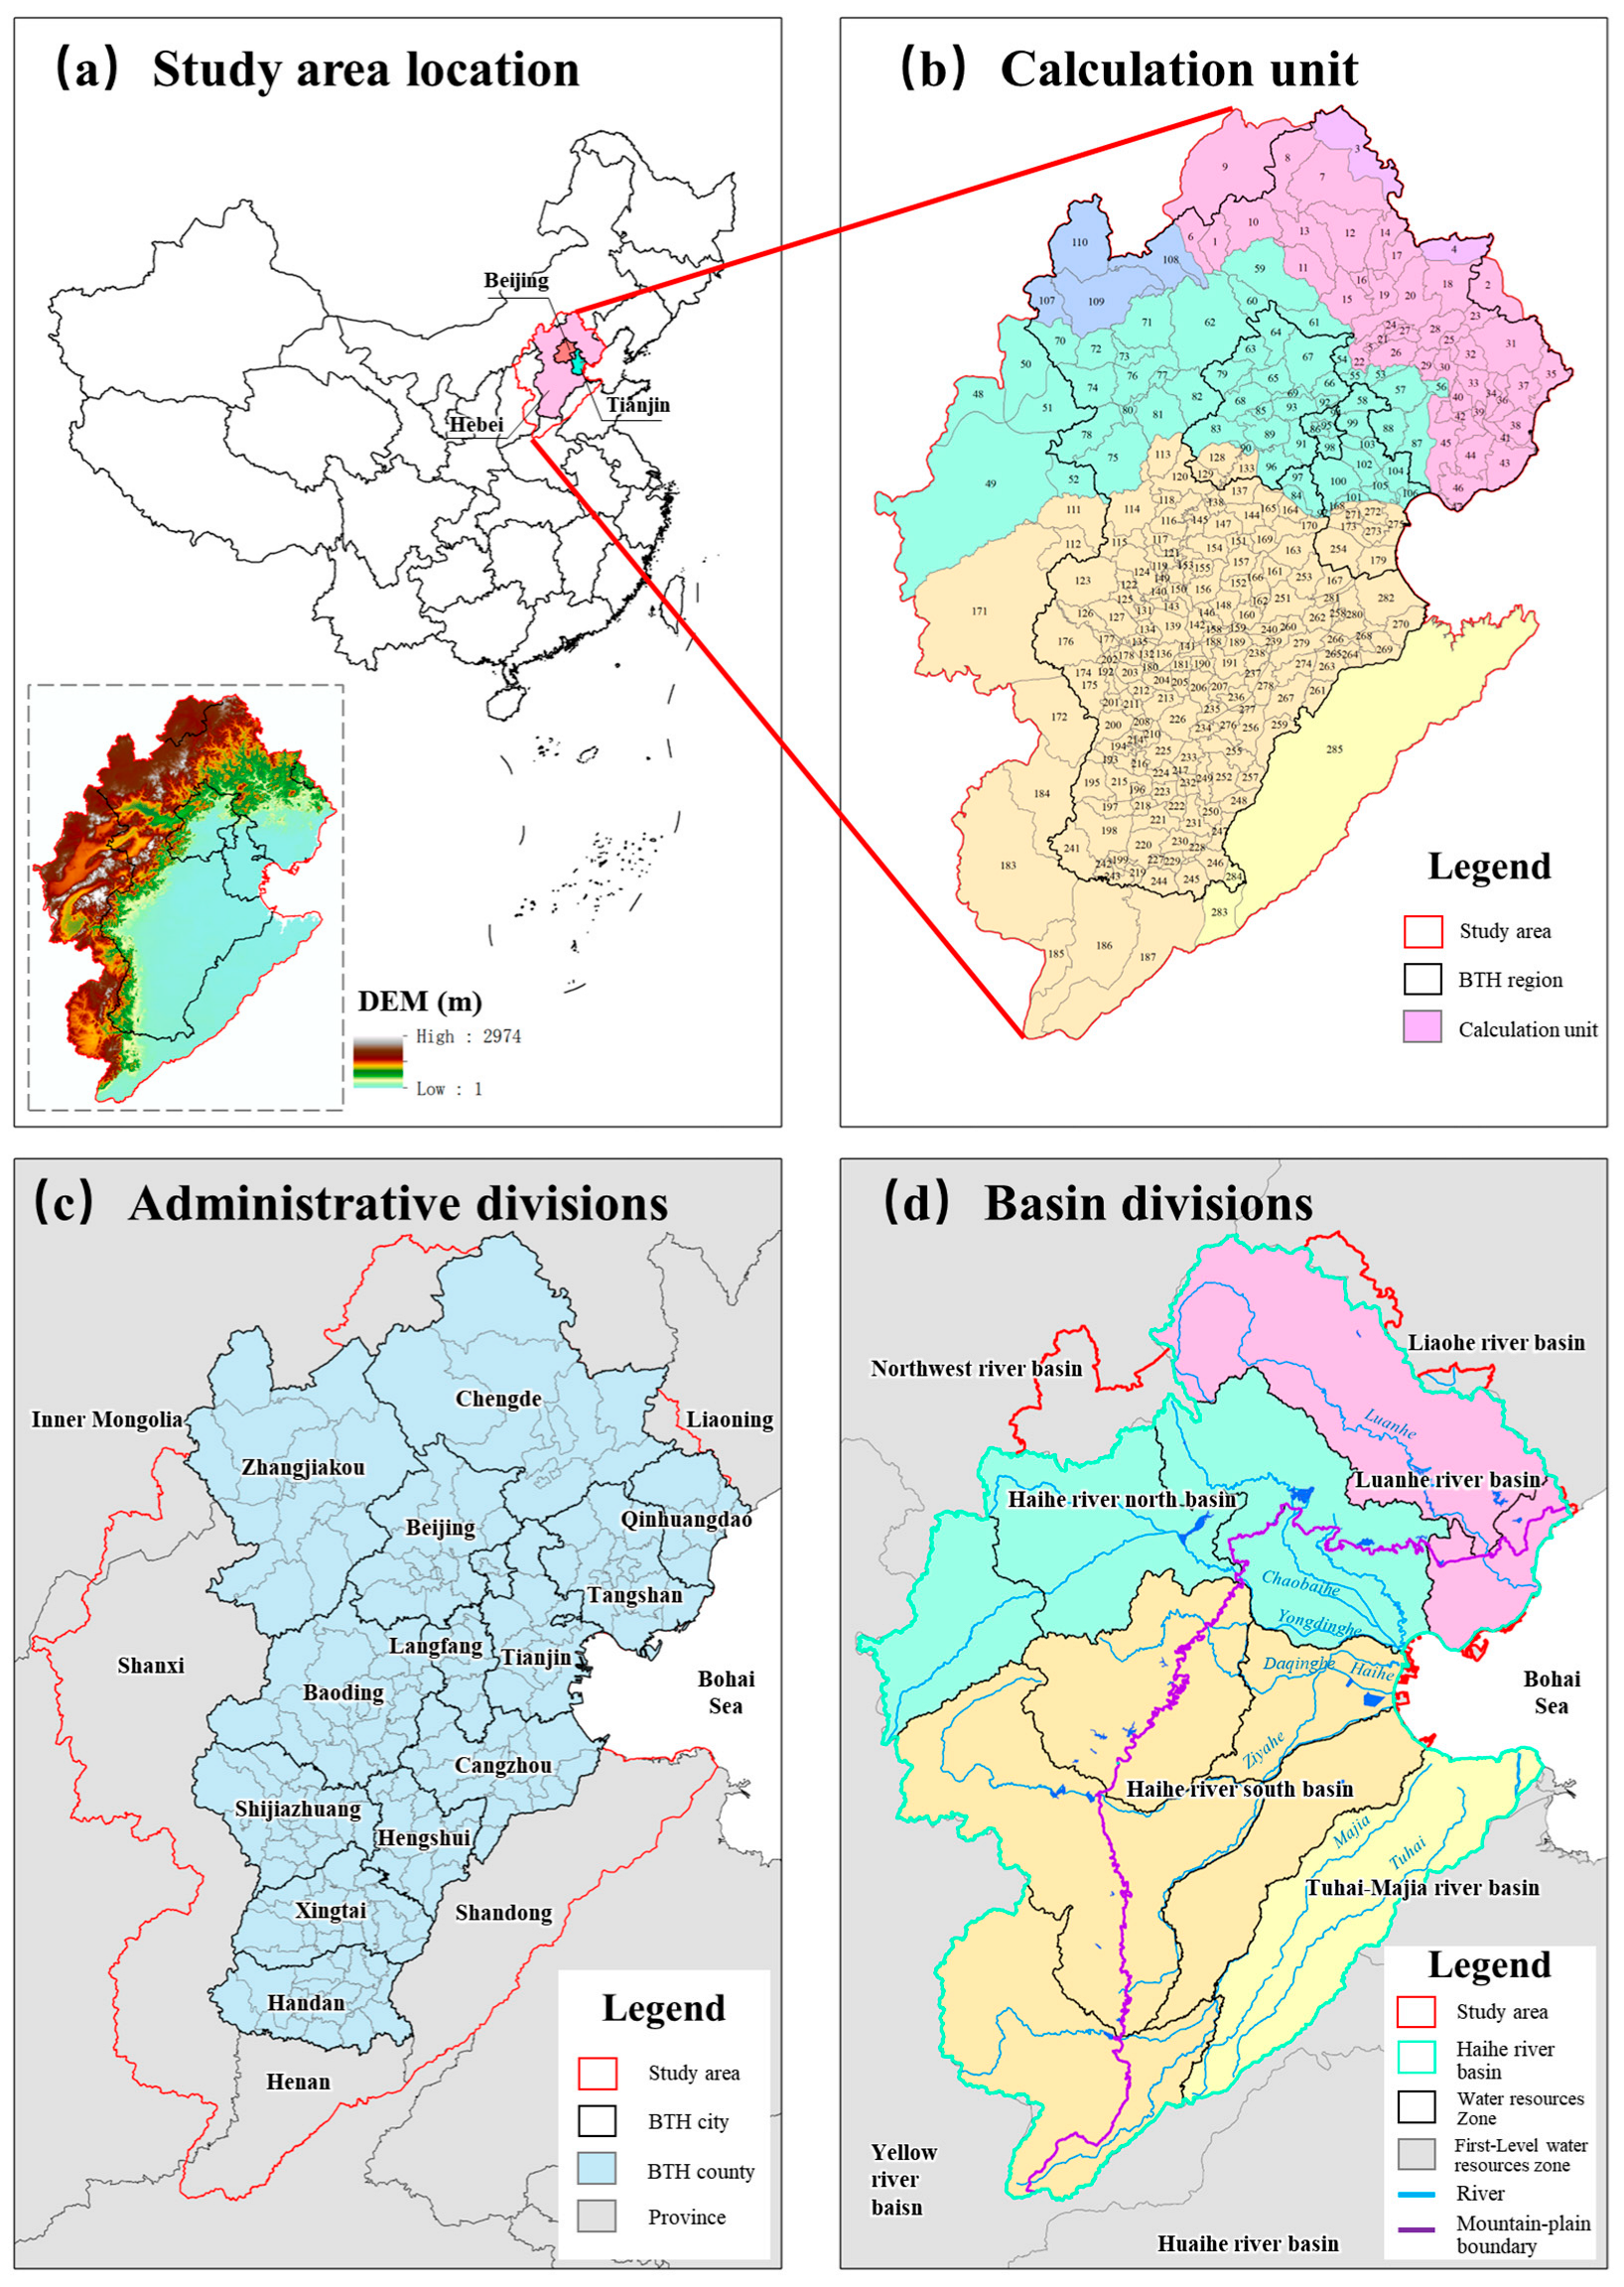
3.1. Study Area

The Beijing–Tianjin–Hebei (BTH) region, encompassing Beijing, Tianjin, and Hebei, represents the largest and most economically dynamic area in northern China (Figure 2a). However, it also faces severe water resource challenges, with intense competition among domestic, agricultural, industrial, and ecological water demands. In 2023, despite accounting for only 1.2% of China’s total water resources, the BTH region supported 7.8% of the national population, 8.3% of GDP, and 5.1% of total food production. Correspondingly, the region’s long-term average water self-sufficiency rate was merely 77%, while food self-sufficiency and energy self-sufficiency rate were 85% and 53%, respectively. The surface water utilization rate reached 75%, whereas groundwater utilization rate exceeded 132%, indicating severe overextraction. Collectively, the WEFE system in the BTH region faces major challenges, including high water resource stress, insufficient food security, severe ecological degradation, and inadequate energy supply reliability.
The Haihe River Basin covers over 90% of the BTH region, making it essential to consider both natural hydrological cycles and human activities when defining the study area. The study scope is thus determined by the administrative boundaries of the BTH region and the hydrological boundaries of the Haihe River Basin. The study area includes 172 county-level administrative units within the 13 cities of BTH, along with five neighboring provinces, forming a total of 177 basic administrative units (Figure 2c). The Haihe River Basin (one of China’s first-level water resource zone) can be divided into four sub-basins, including the Luanhe River Basin (LR), the Haihe River North Basin (HRN), the Haihe River South Basin (HRS), and the Tuhai–Majia River Basin (TM). The LR, HRN, and HRS cover most of the BTH region. Additionally, considering other water resource zones within the region, the study area is further divided into 18 water resource zones (Figure 2d). By overlaying the 18 water resource zones with the 177 administrative units, a total of 285 calculation units are established (Figure 2b). Each calculation unit serves as the fundamental unit for analyzing the water supply–demand balance, food production, social water cycle energy consumption, and ecological water requirements. Furthermore, the hydrological connectivity between these units ensures the simulation of dynamic upstream–downstream interactions, allowing for a more comprehensive assessment of water allocation, drainage, and consumption patterns across the region.

3.2. Data Sources

The fundamental data required for CSM-WEFE construction include spatial data, meteorological and hydrological data, agricultural data, social water cycle energy consumption data, and socio-economic data. (1) Spatial data such as DEM data and land-use data were obtained from Geospatial Data Cloud (https://www.gscloud.cn, accessed on 3 May 2025) and the Resource and Environmental Data Center, Chinese Academy of Sciences (https://www.resdc.cn, accessed on 3 May 2025), respectively. (2) Meteorological and hydrological data, including precipitation, temperature, wind speed, and relative humidity, were obtained from meteorological observation stations (China Meteorological Data Network, https://data.cma.cn, accessed on 3 May 2025). Daily meteorological data from 49 representative stations within the study area spanning 2000–2020 were selected. Additionally, water resource availability and supply data were obtained from Beijing, Tianjin, Hebei, and the Haihe river basin’s water resource bulletins (2000–2020). (3) Agricultural data, including food production data, were obtained from the Beijing, Tianjin, and Hebei’s statistical yearbooks (2000–2020) and the China’s rural statistical yearbooks (2000–2020). (4) Social water cycle energy consumption data were obtained from the urban water supply statistical yearbooks. (5) Socio-economic data were obtained from the Beijing, Tianjin, and Hebei’s statistical yearbooks (2000–2020).

3.3. Scenario Setting

The period from 2007 to 2020 was selected as the study period to represent the current conditions of the BTH region. A baseline scenario (S0) was established to evaluate the coupled simulation results of the BTH WEFE system and assess its coordinated sustainable development.
Given the intense competition between agricultural water demand and ecological restoration efforts in the region, the scenarios were designed from two perspectives: food security and ecological restoration. For food security, three scenarios were considered: SF1 (high irrigation area scenario), which converts all arable land into irrigated farmland; SF2 (current irrigation area scenario), which maintains the existing irrigation area while implementing moderate agricultural water-saving measures; and SF3 (low irrigation area scenario), which reduces the irrigation area by 30% compared to the current level. For ecological restoration, three scenarios were considered: SE1 (no overextraction of groundwater scenario), which limits shallow groundwater extraction to the model-simulated renewable groundwater availability while ceasing deep groundwater exploitation; SE2 (external water diversion scenario), which extends SE1 by assuming the full operation of the South-to-North Water Diversion Project-Middle Route (SNWDP-MR); and SE3 (healthy river discharge scenario), which extends SE2 by incorporating constraints on minimum ecological discharge into the sea. The detailed scenario settings are summarized in Table 2.

4. Results

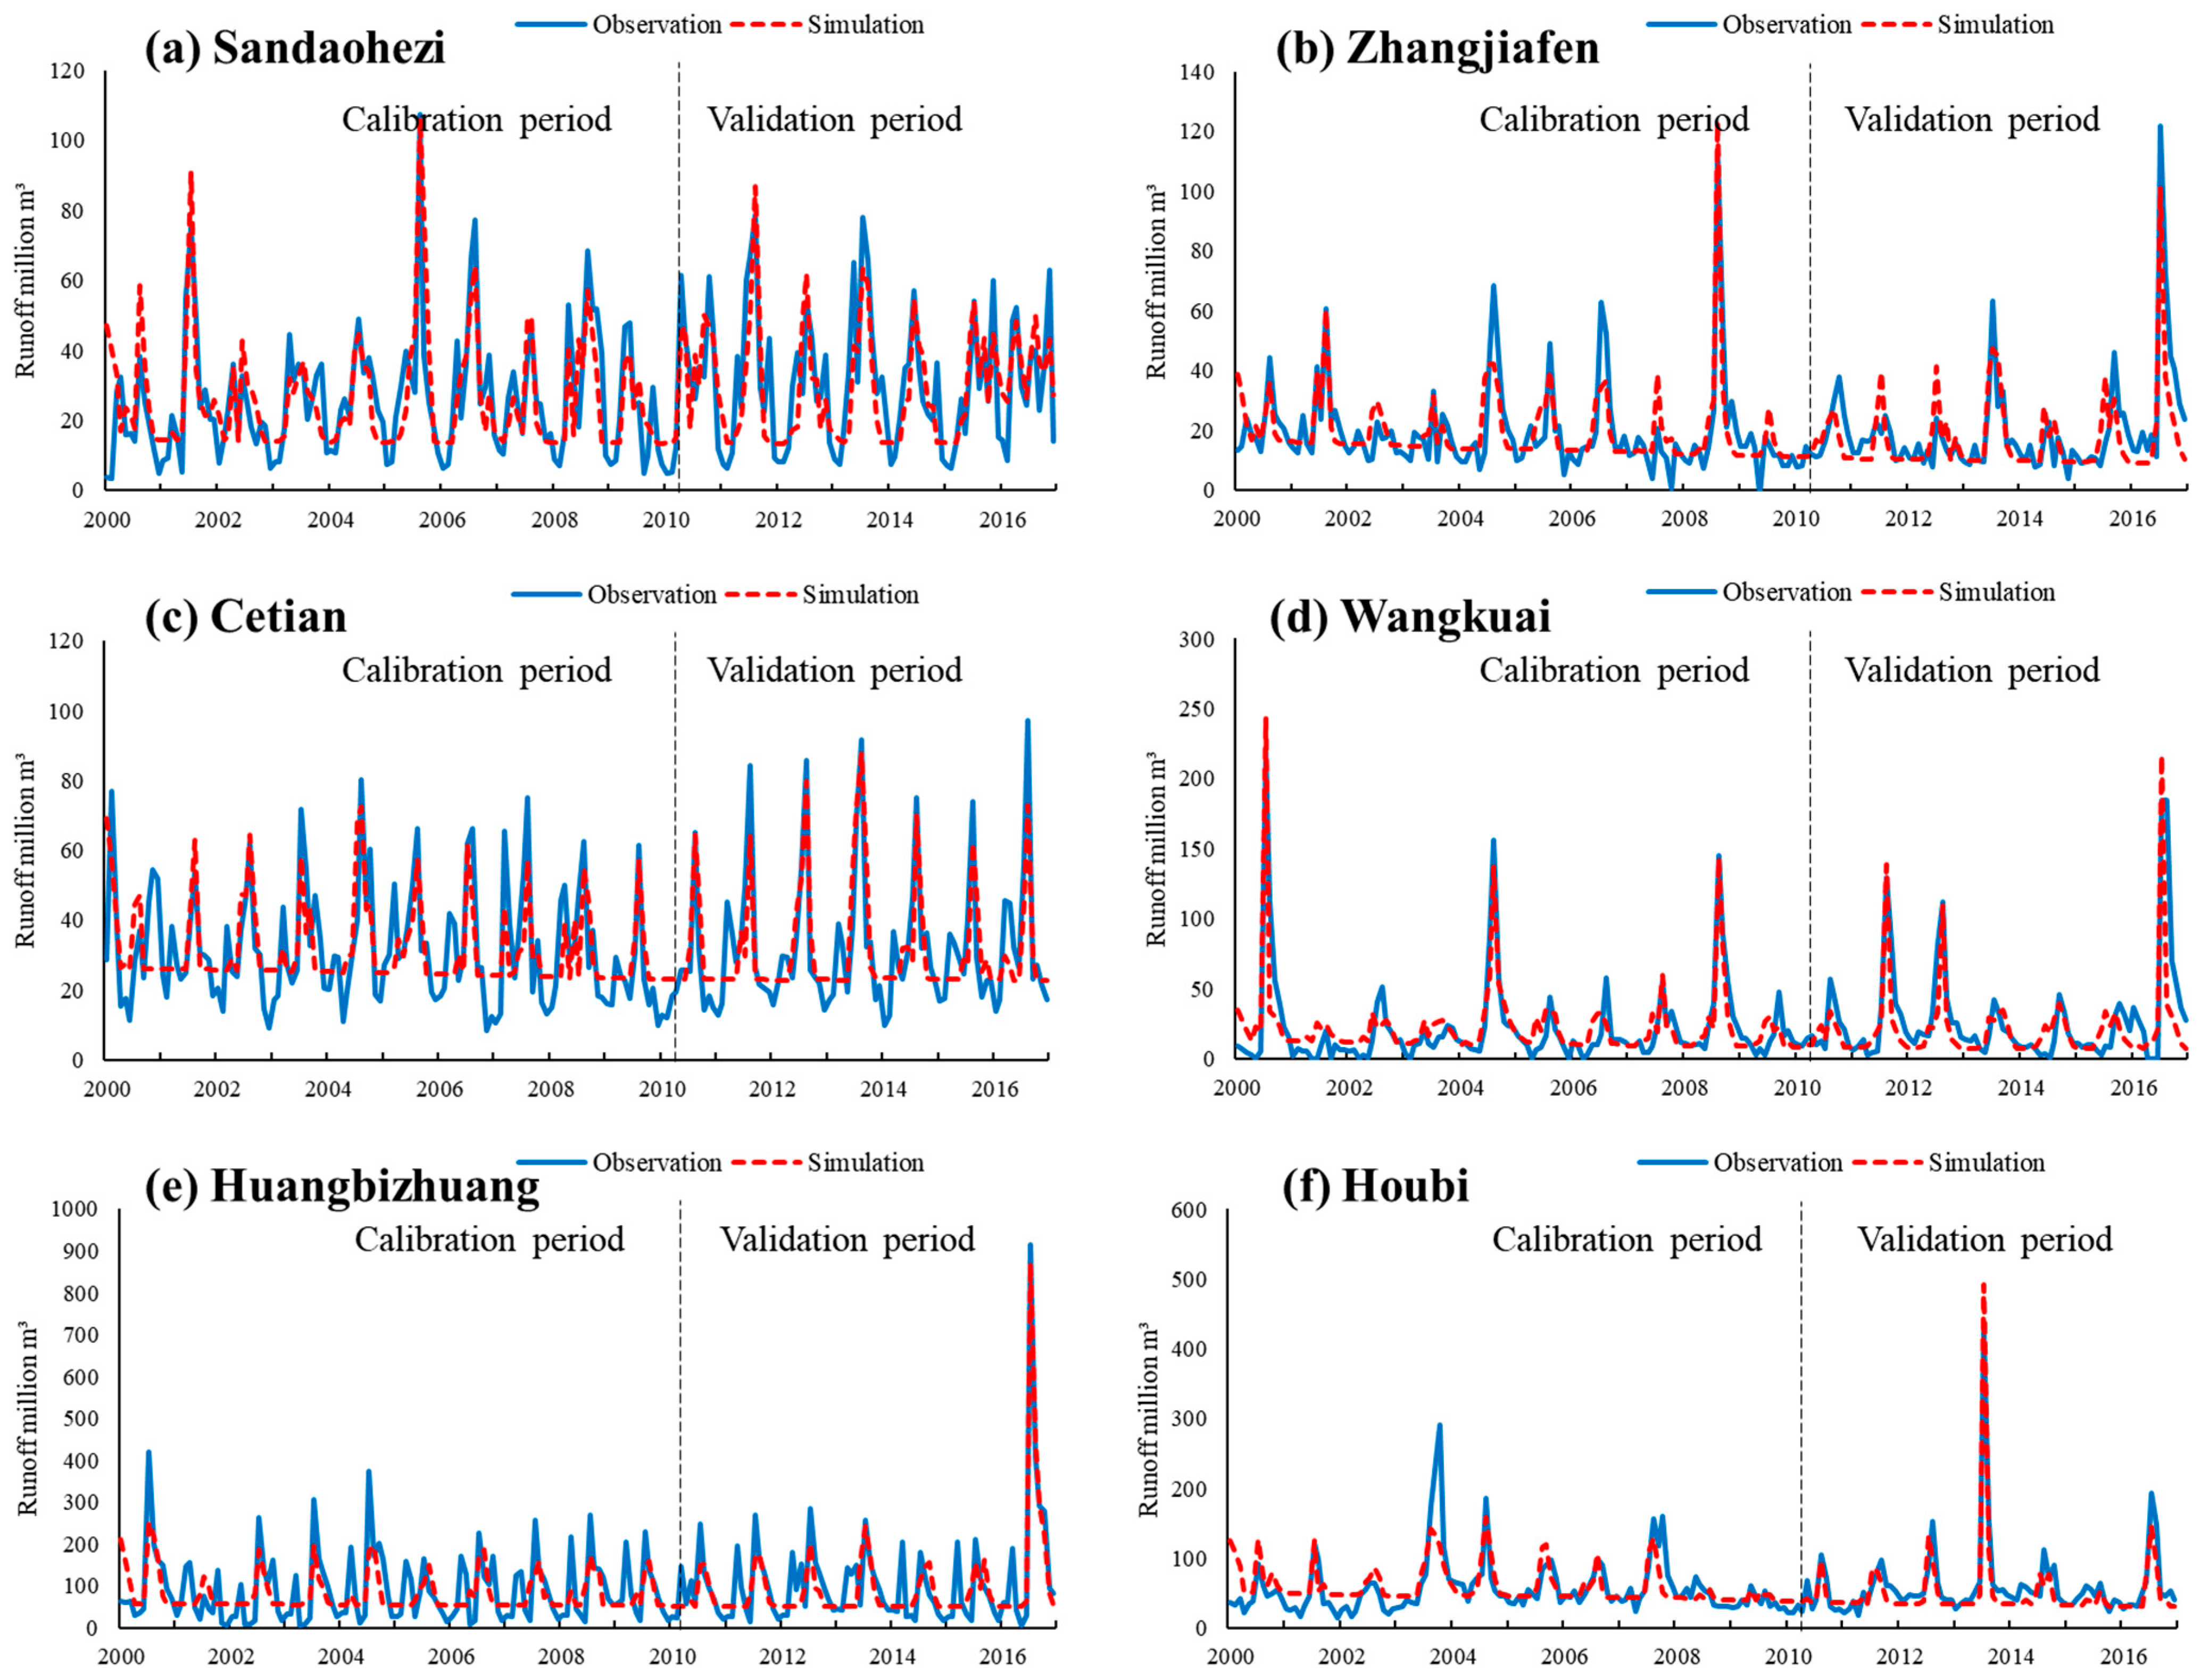
4.1. Evaluation of CSM-WEFE Simulation Performance

Model validation is a critical step in assessing the accuracy of CSM-WEFE. The model’s performance was evaluated against observed data by comparing key hydrological and socio-environmental variables, including runoff, water resources, water allocation, river discharge to the sea, and food production. To quantitatively assess the simulation accuracy, four statistical metrics were employed: relative error ( R e ), coefficient of determination ( R 2 ), Nash–Sutcliffe efficiency ( N S E ), and root mean square error ( R M S E ). The computational methods for these metrics are detailed in Table A2. The six hydrological stations and six water resource zones used for validation are shown in Figure A1.
The six hydrological stations cover the Luanhe River Basin, the Haihe River North Basin, and the Haihe River South Basin. During both the calibration and validation periods, the R 2 values ranged from 0.619 to 0.899, the N S E values ranged from 0.608 to 0.766, and the R e remained within ±15%, indicating that the model can reliably simulate the runoff process (refer to Table 3 and Figure 3).
Most simulated surface water and groundwater resource values across the six water resource zones exhibited R 2 values exceeding 0.65, suggesting that the model effectively captures regional variations in water resources (refer to Table 4 and Figure 4).
Based on the calibrated hydrological parameters of the CSM-WEFE model, the coefficient of variation (CV) was employed as the primary statistical indicator to evaluate parameter uncertainty. A series of box plots (see Appendix A Figure A2) were produced to illustrate the distribution characteristics of key parameters. The results show that most parameters exhibit moderate variability, with CV values ranging from 0.1 to 0.3, indicating a relatively stable model performance under typical parameter perturbations. However, several parameters demonstrate relatively high dispersion, such as canopy interception capacity (CV = 0.93), interflow runoff coefficient (CV = 0.74), and shallow subsurface runoff coefficient (CV = 1.06), suggesting that these parameters may have a significant influence on model outputs and should be treated with particular attention in future sensitivity analyses.
Regarding observed and simulated water supply, the simulation results closely align with observed values, with R e controlled within ±5%. With the exception of Cangzhou, the R 2 values for other cities exceed 0.9, demonstrating high accuracy in water allocation simulation (Refer to Table 5, Figure 5).
The total simulated river discharge to the sea closely matches observed values, confirming that the model successfully replicates runoff dynamics under human activities (refer to Figure 6).
For food production, the R e is 1.9%, and the R M S E is 2.1. The R e for each city remains within ±2%, indicating that the model provides an accurate representation of food yield variations across the study area (refer to Figure 7).

4.2. Baseline Scenario Simulation and Evaluation

4.2.1. Coupled Simulation Results of the Current WEFE System

The evolution of the WEFE system in the BTH region from 2007 to 2020 was simulated using CSM-WEFE. The results of S0 are presented in Figure 8 and Figure 9. Figure 8a illustrates the temporal variations in water shortage rate across the BTH region. The average long-term water shortage rate for the entire WEFE system is 1.7%. Among the three provinces, Beijing exhibits the highest level of water supply security, experiencing negligible water scarcity. Tianjin has an average annual water shortage rate below 2%. However, a temporary increase in scarcity was observed between 2010 and 2015, followed by a sharp decline after 2015, coinciding with the operation of the South-to-North Water Diversion Project-Middle Route (SNWDP-MR). This suggests that the diverted water has significantly enhanced Tianjin’s water security. Hebei maintains an average annual water shortage rate of approximately 2%, with a rising trend over the years. This increase is closely linked to groundwater extraction reduction policies implemented in recent years. As groundwater supply decreases, water shortage rate increases accordingly. Figure 9a presents the spatial distribution of water shortage, highlighting that the most water-scarce areas are concentrated in the North China Plain, including Tianjin, Cangzhou, Baoding, Langfang, and Hengshui. Notably, these areas are also the primary recipients of SNWDP-MR water supply. A comparison with Figure 9b reveals a significant overlap between water-scarce areas and major agricultural production areas, indicating that irrigation water demand is a key driver of regional water shortages.
Figure 8b depicts the food self-sufficiency rate in the BTH region from 2007 to 2020. The long-term average self-sufficiency rate for Beijing, Tianjin, and Hebei is 5.8%, 33.6%, and over 100%, respectively. This implies that Hebei not only ensures its own food security but also contributes to the food supply of Beijing and Tianjin. From an interannual perspective, total food production in the BTH region remains stable. However, due to continuous population growth and increasing food demand, the overall food self-sufficiency rate exhibits a significant downward trend, falling below 80%. This decline highlights a critical policy challenge for the future, as the BTH region must determine whether to maintain its current level of food self-sufficiency or adopt alternative strategies to ensure food security.
The annual shallow groundwater overextraction in the BTH, calculated using CSM-WEFE, is presented in Figure 8c. Due to the high concentration of agricultural activities in the Haihe River South Basin, groundwater overextraction in this area is significant, accounting for approximately 60% of the total overextraction in the BTH region. From an interannual perspective, the implementation of groundwater extraction reduction policies has led to a significant decline in overextraction, decreasing from 6.57 billion m3 in 2007 to 2.52 billion m3 in 2020. The spatial distribution of groundwater overextraction (Figure 9c) indicates that the most severely affected areas are concentrated in the transition zones between mountainous and plain areas. In contrast, cities such as Tianjin, Cangzhou, and Hengshui exhibit minimal shallow groundwater overextraction, as groundwater extraction in these areas primarily relies on deep aquifers, thereby reducing the overextraction pressure on shallow groundwater. Regarding river discharge to the sea, Figure 8d shows that the three major river basins exhibit a similar total discharge volume, with HRS > HRN > LR. The interannual variations in discharge demonstrate significant fluctuations, primarily influenced by climatic factors, such as precipitation variability, without a clear long-term increasing or decreasing trend.
Energy consumption for the social water cycle from 2007 to 2020 is illustrated in Figure 8e. The results indicate a fluctuating yet increasing trend, reaching 125.92 billion kWh in 2020. Domestic and industrial water use accounts for over 90% of the total energy consumption. Energy consumption for domestic water use exhibits an increasing trend, whereas industrial water use energy consumption declines. Among the various water-related processes, surface water intake has the lowest energy consumption, contributing only about 1% of the total; groundwater extraction energy consumption shows a gradual decline over time; reclaimed water treatment energy consumption exhibits a significant increase. The spatial distribution of per-unit water energy consumption (Figure 9d) reveals that urban centers, such as Beijing and Tianjin, exhibit substantially higher energy consumption with respect to the social water cycle compared to other regions. This pattern aligns with the concentration of domestic and industrial water use in urban areas. Notably, Beijing’s per-unit water energy consumption ranks among the highest in the BTH region.

4.2.2. Evaluation of the Current Coordinated Sustainable Development

The evaluation results of the current coordinated sustainable development of the BTH WEFE system are shown in Figure 10. From the reliability index (REL) (Figure 10a), the interannual variation of the BTH region remains relatively stable, with values ranging between 0.75 and 0.9. In 2020, the reliability reached 0.912, indicating that the overall WEFE system was in a stable and reliable state. Among the three provinces, Hebei exhibits higher reliability due to its higher food production and relatively better water resource endowment compared to Beijing and Tianjin, with its reliability often reaching the maximum level of 100%. In terms of coupling coordination degree index (CCD) (Figure 10b), the trends of the three provinces and the overall BTH region are consistent and can be divided into two phases. From 2007 to 2014, the CCD remained relatively stable, mostly below 0.5, except for 2008. However, with the operation of water supply from the SNWDP-MR in 2015, CCD increased rapidly from 2015 to 2020, rising from 0.437 to 0.690. This indicates that the SNWDP-MR has significantly enhanced water security in the BTH region while improving system coupling coordination. Regarding the equilibrium index (EQU) (Figure 10c), both Hebei and the overall BTH region show a slight declining trend, suggesting an increasing spatial mismatch in water scarcity. In contrast, Beijing and Tianjin exhibit more pronounced fluctuations in EQU due to the relatively small number of units (both having only 11 units). By calculating the geometric mean of REL, CCD, and EQU, the coordinated sustainable development index (CSD) (Figure 10d) is obtained. The overall CSD of the BTH region shows a slight upward trend with fluctuations, increasing from 0.510 in 2007 to 0.583 in 2020, with a multi-year average of 0.523. This indicates that the BTH WEFE system remains in a state of sustainable development.

4.3. Food Security Scenarios Simulation and Evaluation

4.3.1. Coupled Simulation Results of the WEFE System Under Food Security Scenarios

Figure 11a illustrates the variations in water shortage rate under different food security scenarios. The results indicate an overall increasing trend in water shortages over time. The water shortage rate under SF1 is the highest, reaching 3.9%, while SF3 has the lowest rate at 0.6%. Under SF1, the expansion of irrigated areas leads to a significant increase in agricultural water demand, causing the overall water shortage rate in the BTH region to triple compared to S0. Under SF2, a slight reduction in agricultural water use results in a moderate decrease in water shortages. Under SF3, a substantial reduction in irrigated areas and agricultural water use significantly lowers the water shortage rate, with the maximum annual shortage rate remaining below 1%. The changes in food self-sufficiency under different food security scenarios are shown in Figure 11b. The multi-year average food self-sufficiency rate for SF1, SF2, and SF3 is 103.6%, 69.6%, and 54.3%, respectively. Under SF1, the BTH region can essentially meet its food self-sufficiency requirements. Under SF2, the food self-sufficiency rate declines slightly compared to S0, with the Hebei Province no longer able to meet its own food demand. Under SF3, the BTH region can only meet approximately half of its food supply needs, doubling its reliance on external food imports compared to S0, thus significantly increasing its dependence on external food sources.
Figure 11c presents the variations in shallow groundwater overextraction under different scenarios. Although groundwater overextraction shows a significant downward trend across all scenarios, the total overextraction volume follows the order of SF1 > SF2 > SF3, with multi-year average values of 7.16 billion m3, 4.29 billion m3, and 3.26 billion m3, respectively. To meet the increased agricultural water demand required for food production, SF1 results in an additional 2.30 billion m3 of groundwater overextraction compared to S0. Conversely, under SF3, due to the reduction in agricultural water demand, groundwater extraction is reduced by approximately 1.58 billion m3 compared to S0. Figure 11d shows the variations in river discharge to the sea under different scenarios. On a multi-year average basis, SF1 has the lowest river discharge at 2.97 billion m3 due to excessive surface water consumption to meet agricultural water demands. SF2 has a river discharge of 3.57 billion m3, which is largely consistent with S0. SF3 has the highest river discharge at 3.90 billion m3. Figure 11e illustrates the variations in energy consumption for the social water cycle under different scenarios. Although interannual fluctuations are observed, the differences between scenarios are relatively small, with the overall range between 116.4 billion and 132.3 billion kWh. However, it is evident that SF1 has the highest energy consumption due to the surge in agricultural water use, which leads to an increase in groundwater extraction, whereas SF3 has the lowest energy consumption due to reduced agricultural water demand.

4.3.2. Evaluation of Coordinated Sustainable Development Under Food Security Scenarios

The coordinated sustainable development of the WEFE system in the BTH region under different food security scenarios is presented in Figure 12a–d. In terms of REL (Figure 12a), all scenarios maintain a relatively high level, with values consistently above 0.7. On a multi-year average basis, SF1 exhibits the highest REL at 0.852, followed by SF2 at 0.842, and SF3 at 0.809. Regarding CCD (Figure 12b), all scenarios demonstrate an upward trend over time, although interannual fluctuations differ among them. On a multi-year average basis, SF1 has the lowest CCD level at 0.453, slightly below that of S0, due to the increased pressure on water resources despite the enhanced food supply. SF2 shows a moderate level of CCD at 0.464, while SF3 achieves the highest CCD at 0.468, indicating improved balance and synergy among system components. In terms of EQU (Figure 12c), a general declining trend is observed across all scenarios. SF1 shows the lowest EQU value at 0.349, which is also below that of S0. SF2 records a moderate value at 0.388, while SF3 achieves the highest EQU at 0.410. This reflects the more spatially balanced distribution of water shortages under SF3, owing to significant reductions in irrigated area and agricultural water use which led to both lower water scarcity and more uniform spatial distribution. Considering the multi-year average of the CSD (Figure 12d), SF3 ranks as the highest at 0.530, followed by SF2 at 0.527 and SF1 at 0.510. These results suggest that SF3 represents the most favorable scenario in terms of overall sustainable development. Under current conditions in the BTH WEFE system, where water scarcity poses a critical constraint, a moderate reduction in food production, resulting in decreased agricultural water consumption, can enhance the system’s long-term sustainable development.

4.4. Ecological Restoration Scenario Simulation and Evaluation

4.4.1. Coupled Simulation Results of the WEFE System Under Ecological Restoration Scenarios

Figure 13a presents the water shortage rate under different ecological restoration scenarios. Overall, the shortage rate in all scenarios is significantly higher than that of S0; yet they exhibit a marked downward trend over time. This trend is primarily influenced by the enforcement of groundwater overextraction restrictions and the increased availability of transferred water. In SE1, the multi-year average water shortage rate reaches 21.7%. This reflects the critical reliance on groundwater as a major water source in the BTH region: once overextraction is prohibited, substantial water supply shortage emerges across both economic and social sectors. With the effective operation of the SNWDP-MR, water shortage is considerably alleviated. Under SE2, the water shortage rate drops to 16.4%. However, under SE3, where strict constraints are imposed on river discharge to the sea, water shortage becomes more severe, increasing to 21.1%. Figure 13b shows the variation in food self-sufficiency rates under different ecological restoration scenarios. As groundwater overextraction is restricted, agricultural water availability is reduced, leading to a significant decline in food self-sufficiency. Under SE1, the multi-year average self-sufficiency rate falls to 57.0%, dropping by approximately 26% compared to S0, highlighting the substantial trade-off between ecological restoration and food security. Under SE2, with the support of the SNWDP-MR, the multi-year average self-sufficiency rate improves up to 61.3%, surpassing the 60% mark. In contrast, SE3 records a multi-year average of 57.6%, remaining below the 60% mark.
Figure 13c illustrates the changes in social water cycle energy consumption across the ecological restoration scenarios. Compared to S0, all scenarios demonstrate reduced energy consumption. Under SE1, the multi-year average energy consumption is 120.4 billion kWh; under SE2, it slightly increases to 122.6 billion kWh; and, under scenario SE3, it reaches 120.6 billion kWh. This reduction in energy consumption across all scenarios is attributed to the decreased energy demand for groundwater extraction, resulting from the implementation of groundwater overexploitation control measures. As illustrated in Figure 13d, variations in river discharge to the sea also differ significantly across scenarios. Under SE1, groundwater overextraction restrictions necessitate increased surface water intake, while reduced return flows from agricultural, domestic, and industrial activities collectively lead to a 21.4% reduction in river discharge compared to S0. The multi-year average discharge under SE1 is 2.68 billion m3. With the operation of the SNWDP-MR, SE2 recovery of discharge volumes reaches 3.09 billion m3, while SE3 achieves the highest discharge of 4.35 billion m3.

4.4.2. Evaluation of Coordinated Sustainable Development Under Ecological Restoration Scenarios

The evaluation results of the coordinated sustainable development of the WEFE system under different ecological restoration scenarios are presented in Figure 14a–d. In terms of REL (Figure 14a), all scenarios exhibit multi-year values above 0.72. SE2 demonstrates the highest REL at 0.873, followed by SE3 at 0.858, while SE1 has a reliability of 0.839. Regarding CCD (Figure 14b), all scenarios show significantly higher coordination levels than S0, with a consistent upward trend. SE2 exhibits the highest CCD at 0.472, followed by SE1 at 0.470 and SE3 at 0.467. With respect to the EQU (Figure 14c), SE2 initially decreases and then increases, while the other scenarios show a declining trend. SE3 has the highest EQU at 0.394, followed by SE2 at 0.378, whereas SE1 has the lowest EQU at 0.362. In terms of the multi-year average CSD (Figure 14d), SE3 achieves the highest CSD at 0.538, closely followed by SE2 at 0.536, while SE1 has the lowest CSD at 0.518, which is even lower than that of S0. These results indicate that SE3 represents the highest possible sustainable development among all ecological restoration scenarios. This suggests that severe ecological degradation has become a critical constraint on the WEFE system in the BTH region. Furthermore, with sufficient external water diversion, achieving a groundwater balance and maintaining a healthy discharge to the sea can significantly enhance the region’s sustainability.

5. Discussion

5.1. Correlation Analysis of Different Evaluation Indices

The coordinated sustainable development index is calculated based on three key indices: REL, CCD, and EQU. To examine the variation characteristics among these evaluation indices, a correlation analysis was conducted for different index pairs under the food security and ecological restoration scenarios, as illustrated in Figure 15. As shown in Figure 15a, CCD exhibits a positive correlation with REL, increasing as REL improves. Moreover, within the same range of REL variation, the rate of increase in CCD is higher under the food security scenario than under the ecological restoration scenario. Figure 15b reveals contrasting trends in the relationship between REL and EQU across the two scenarios. Under the food security scenario, EQU decreases as REL increases, whereas under the ecological restoration scenario, EQU increases with higher REL values. This indicates that while ecological restoration enhances REL, it simultaneously mitigates the spatial mismatch of water shortages. In contrast, the improvement in REL under the food security scenario exacerbates the spatial imbalance of water shortages, a phenomenon which can be attributed to the uneven spatial distribution of irrigated agricultural areas. As illustrated in Figure 15c, under both scenarios, EQU decreases as CCD increases, suggesting that improvements in CCD are accompanied by a worsening spatial imbalance of water shortages. The value of decline in EQU is more pronounced under the food security scenario compared to the ecological restoration scenario.
Given that EQU reflects the spatial consistency of the water shortage rate, the relationship between the total water shortage rate and EQU in the BTH region was further analyzed, as shown in Figure 15d. The results indicate a clear distinction between the food security and ecological restoration scenarios. Under the food security scenario, the water shortage rate is concentrated between 0% and 5%, and as it increases, EQU declines rapidly, indicating that a worsening water shortage is accompanied by an increasingly uneven spatial distribution. In contrast, the ecological restoration scenario exhibits the opposite trend. Since ecological restoration requires substantial water resources, the water shortage rate is relatively high, ranging from 10% to 30%. However, as the water shortage rate increases, EQU also rises, suggesting that while overall water scarcity intensifies, the spatial distribution of shortages becomes more uniform. This can be attributed to the broader spatial extent of ecological restoration efforts across the BTH region, where more units experience water shortages, leading to an overall increase in scarcity but a reduction in spatial disparity.

5.2. Trade-Off Between Food Security and Ecological Restoration of the WEFE System

The BTH region faces severe water scarcity. Over the past decades, to sustain rapid economic and social development, groundwater has been excessively extracted, and surface water has been overutilized to meet supply demands. Meanwhile, agricultural water use has continuously declined, and some farmland has been left fallow, leading to significant ecological degradation of rivers and lakes as well as a decline in the region’s food self-sufficiency rate.
Under the food security scenarios, it is evident that increasing the food security target would further exacerbate groundwater overextraction and river ecosystem degradation, whereas reducing the food security target would enhance the synergy within the WEFE system. If the BTH region were to achieve 100% food self-sufficiency, it would require an additional annual extraction of 2.30 billion m3 of shallow groundwater, accompanied by a reduction of approximately 0.5 billion m3 in river discharge to the sea, resulting in a decline of the CSD to 0.510. Conversely, if food self-sufficiency were to be lowered to 54.3%, the region would achieve an annual reduction of 1.58 billion m3 in shallow groundwater extraction and an increase of 0.5 billion m3 in discharge to the sea, improving the CSD to 0.530.
Under the ecological restoration scenarios, if groundwater overextraction were to be completely restricted, the regional water shortage rate would surge to 21.7%, while food self-sufficiency would drop to 57.0%, and the river discharge to the sea would be limited to 2.68 billion m3. These findings indicate that the current balance between water supply and demand in the BTH region, as well as the satisfaction of agricultural water needs, is maintained at the expense of groundwater overextraction and the depletion of ecological water from rivers and lakes. Even with the full operation of the SNWDP-MR, the region would still experience a 16.4% water shortage rate, with a corresponding food self-sufficiency of 61.3%, a discharge to the sea of 3.09 billion m3, and a CSD of 0.536. As ecological protection requirements increase, water shortage will continue to expand; however, the corresponding CSD would increase to 0.538.
A comparative analysis of the optimal scenarios for food security (SF3) and ecological restoration (SE3) is illustrated in Figure 16. To facilitate comparison, the key indicators for scenarios S0, SF3, and SE3 were normalized. The results show that S0 only outperforms SF3 and SE3 in terms of food self-sufficiency. Under the SF3 scenario, the water shortage rate and EQU are significantly higher than those under the SE3 scenario, while the river discharge to the sea is approximately 60% of that under SE3. In contrast, SE3 demonstrates a superior performance in terms of river discharge, groundwater overextraction, energy consumption, and REL, with minimal differences in CCD compared to SF3. This indicates that both the ecology and energy systems are well secured, and that there are no significant weaknesses in terms of REL, CCD, or EQU. From the perspective of the CSD, SE3 (0.538) outperforms SF3 (0.530). Therefore, overall, a moderate reduction in the food self-sufficiency rate would contribute to the sustainable development of the entire WEFE system in the BTH region. Moreover, improvements in ecological restoration, as opposed to further increasing food production, would be more beneficial for the long-term sustainability of the WEFE system.

5.3. Limitations and Model Applicability

While the CSM-WEFE model developed in this study achieves a high degree of coupling among the natural water cycle, socio-economic water use, agricultural production, and energy consumption modules, and successfully reveals critical trade-offs across subsystems under various scenarios, certain limitations remain in terms of model structure and data assumptions.
Specifically, the model currently simulates agricultural, industrial, and domestic water demand using relatively fixed demand coefficients. Although this approach enhances model simplicity and computational efficiency, it may underestimate the adaptive behavior of stakeholders in response to changing water availability. For instance, agricultural systems may adjust cropping patterns during drought periods (e.g., shifting from rice to wheat), industrial sectors may implement water recycling or conservation technologies, and households may alter consumption habits in response to pricing signals or water restrictions. Previous studies have also demonstrated that large-scale users, such as nuclear power plants, dynamically adjust their water withdrawals based on seasonal hydrological conditions, thereby affecting river temperature and flow characteristics [60].
Moreover, the co-evolution of the WEFE system is not governed solely by resource availability and physical processes, but it is also deeply influenced by socio-economic drivers such as population growth, technological innovation, policy intervention, and evolving societal preferences. The current model framework does not explicitly incorporate these drivers or their regulatory impacts on water-use behavior, thereby limiting its capability to evaluate long-term adaptive strategies and path-dependent planning scenarios.
To address these limitations and enhance the model’s applicability and strategic foresight, future research should focus on two key directions: (1) incorporating behaviorally responsive modules for various user groups to simulate autonomous adaptation pathways under different water-stress conditions, and (2) developing an integrated “resource–behavior–institution” feedback framework to support the formulation of more robust and flexible policy interventions. These enhancements will significantly improve the model’s capacity to simulate real-world WEFE dynamics and inform sustainable development planning.

6. Conclusions

6.1. Summary of Key Findings

This study addresses the complex dynamic feedback and interlinkages within the WEFE system by integrating physically based simulation models with a coordinated sustainable development evaluation approach. An integrated sustainability evaluation framework for the WEFE system was developed and applied to the typical water-scarce area of the BTH region. The main conclusions are as follows:
(1)
This study develops a coupled simulation model of water–energy–food–ecosystems (CSM-WEFE) which consists of a natural water cycle module, a social water cycle module, a food production module, and an energy consumption module. This model allows for the dynamic simulation and feedback of key elements across WEFE subsystems. The model was validated with high accuracy using runoff, water resources, water allocation, river discharge into the sea, and food production outputs.
(2)
Based on the outputs of the CSM-WEFE, three performance indices, i.e., REL, CCD, and EQU, were designed, and a coordinated sustainability development index (CSD) was further developed to distinguish the differences in WEFE system development across scenarios, addressing the inconsistency in evaluation standards in traditional indicator-based methods. The multi-year average CSD of the BTH region under the current condition was found to be 0.523, indicating that the overall WEFE system remains in a sustainable development state.
(3)
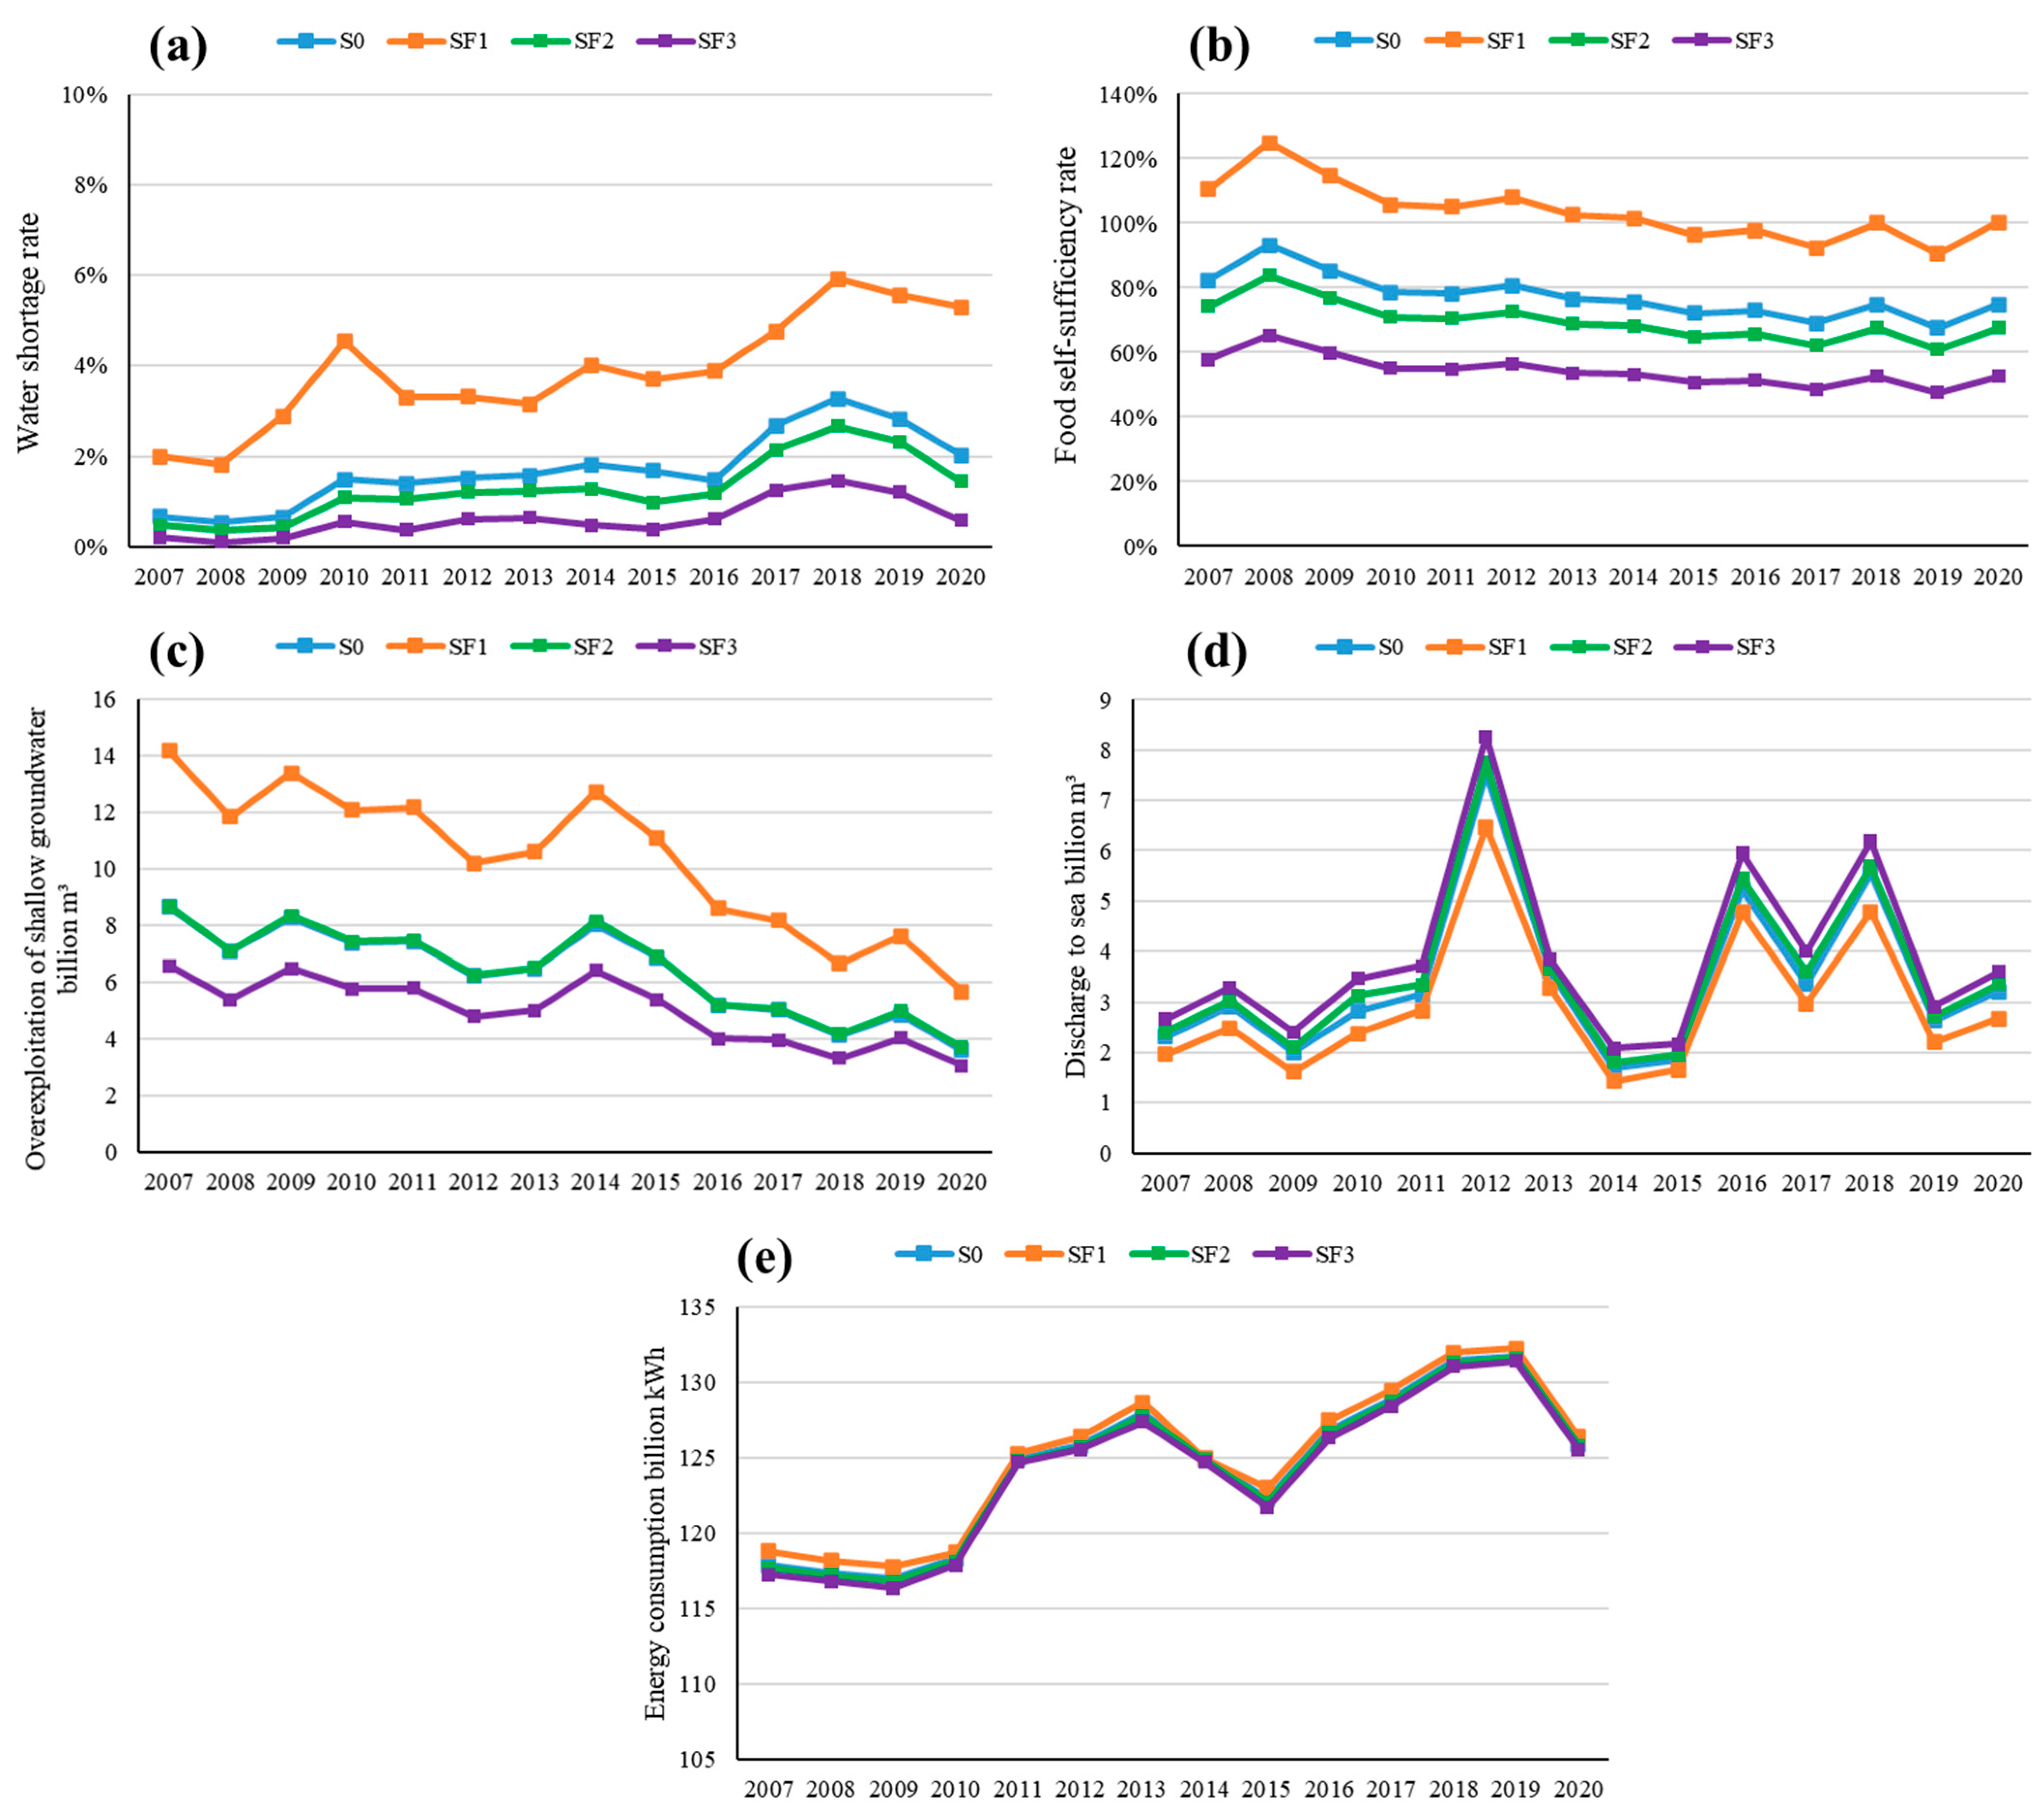
The results reveal that enhancing food security targets tends to intensify groundwater overextraction and ecological degradation, thereby weakening WEFE system coordination. Conversely, restricting groundwater overextraction can improve ecological conditions but significantly increases water scarcity and reduces food self-sufficiency. Under the current water-use pattern, agricultural water demand is met primarily through overextraction of groundwater and encroachment on ecological water requirements. Even with the full operation of SNWDP-MR, the region still faces a 16.4% water shortage. Coordinated development under different scenarios is constrained by the trade-off between food security and ecological restoration, with the CSD ranging between 0.510 and 0.538 across scenarios.

6.2. Policy Implications

(1)
Promote zonal food self-sufficiency targets and coordinate agricultural land retirement for water reallocation.
The simulation results demonstrate that maintaining a high food self-sufficiency rate (e.g., SF1 scenario) under severe water scarcity significantly intensifies groundwater extraction and ecological water consumption, reducing the system’s CSD index to 0.510, substantially lower than that under the ecological restoration scenario. In response, it is recommended that differentiated food security targets be adopted across the BTH region based on local groundwater overexploitation levels, water resource carrying capacity, and ecological vulnerability. In areas experiencing severe groundwater depletion, policies should prioritize the orderly withdrawal of water-intensive farmland and promote land retirement for ecological water recovery. Similarly, agricultural expansion should be restricted in ecologically degraded zones to prevent further hydrological stress on rivers and lakes. A “water-defined agriculture” strategy would help align resource availability with the agricultural layout, alleviate coupling tensions in the WEFE system, and improve regional coordination and sustainability as reflected by elevated CSD values.
(2)
Enhance the water-saving potential of irrigation districts to promote efficient agricultural development.
The SF2 scenario illustrates that maintaining current irrigation areas while applying moderate water-saving measures can raise the CSD index from 0.523 to 0.527, substantially easing water stress without compromising food supply. However, current agricultural water-saving investments are mainly skewed toward infrastructure rather than efficiency. Therefore, it is advised that fiscal expenditures be prioritized for irrigation districts, with a focus on promoting advanced irrigation technologies such as sprinkler, micro, and pipe irrigation systems. Concurrently, agricultural water-use metering systems and tiered pricing mechanisms should be implemented, alongside an integrated performance-based management framework that links water savings, price regulation, and incentive rewards to promote conservation.
(3)
Optimize the allocation mechanism of the SNWDP to enable coordinated ecological replenishment, agricultural reallocation, and urban reuse.
Model simulations indicate that, even with the SNWDP-middle route operating at full capacity, the region still experiences a 16.4% water deficit. However, under the SE2 scenario, the CSD index increases to 0.536, with clear improvements in system coordination and ecological health. Thus, we recommend reforming the SNWDP allocation mechanism by shifting from rigid quota-based distribution to a flexible dispatching strategy, comprising “rigid ecological guarantees + agricultural water reallocation + priority urban reuse”. Ecological flows should be treated as non-negotiable targets, while agricultural water use should be regulated via quotas and replaced by high-efficiency irrigation technologies. Meanwhile, reclaimed water utilization in industrial sectors should be expanded. Even without increasing total water availability, optimizing allocation pathways can enhance internal system coordination and steadily improve the CSD, thereby strengthening regional sustainability.
(4)
Establish coordinated surface–groundwater management to enhance ecological restoration feasibility.
Simulation results underscore that excessive agricultural reliance on groundwater is a major barrier to ecological recovery. Under the SE3 scenario, coordinated dispatching to boost ecological river flow and curtail groundwater overextraction raises the CSD index to 0.538, the highest among all tested scenarios. Therefore, we recommend the establishment of an integrated surface–groundwater regulation regime. This includes defining seasonal ecological replenishment windows (e.g., late spring and early autumn) based on real-time monitoring platforms, aligned with groundwater withdrawal control plans. Furthermore, innovative incentive mechanisms, such as “overdraft reduction subsidies + performance-linked ecological rewards”, should be explored to enhance stakeholder participation. Through institutionalized dual-source regulation, ecological hydrological functions can be restored, and system coordination and sustainability, as quantified by CSD, can be maximized.

Author Contributions

Conceptualization, H.C.; formal analysis, R.L.; methodology, Y.Z.; resources, Y.C.; supervision, Y.Z. and W.L.; validation, G.H. and Q.W.; visualization, H.R. and J.Y.; writing—original draft, H.C.; writing—review and editing, H.C. and Y.Z. All authors have read and agreed to the published version of the manuscript.

Funding

This research was funded by the National Natural Science Foundation of China (grant Nos. 52409041, 52379021), the Natural Science Foundation of Tianjin (grant No. 24JCQNJC01320), the Open Research Fund of State Key Laboratory of Simulation and Regulation of Water Cycle in River Basin (IWHR) (grant No. IWHR-SKL-KF202412), and the Open Research Fund Program of the State Key Laboratory of Hydroscience and Engineering (grant No. sklhse-KF-2025-B-02).

Institutional Review Board Statement

Not applicable.

Data Availability Statement

Data will be made available on request.

Acknowledgments

We are grateful to the anonymous reviewers and editors for their suggestions.

Conflicts of Interest

The authors declare no conflicts of interest.

Abbreviations

The following abbreviations are used in this manuscript:
WEFEWater–Energy–Food–Ecosystems
CSM-WEFECoupled Simulation Model of the WEFE
BTHBeijing–Tianjin–Hebei
BJBeijing
TJTianjin
HBHebei
LRLuanhe River Basin
HRNHaihe River North Basin
HRSHaihe River South Basin
SNWDPSouth-to-North Water Diversion Project
GWASGeneral Water Allocation and Simulation for Management System
E C _ S W I Energy Consumption for Surface Water Intake
E C _ G E Energy Consumption for Groundwater Extraction
E C _ W P Energy Consumption for Water Production
E C _ W D Energy Consumption for Water Distribution
E C _ D W U Energy Consumption for Domestic Water Use
E C _ I W U Energy Consumption for Industrial Water Use
E C _ R W T Energy Consumption for Reclaimed Water Treatment
T E C Total Energy Consumption of the Social Water Cycle
P w _ u n m e t Water Shortage Rate
P f o o d Food Self-Sufficiency Rate
RELReliability index
EQUEquilibrium index
CCDCoupling Coordination Degree index
CDCoordination Degree
CEComprehensive Evaluation
CSDCoordinated Sustainable Development index
R e Relative Error
R 2 Coefficient of Determination
N S E Nash–Sutcliffe Efficiency
R M S E Root Mean Square Error

Appendix A

Table A1. Evaluation Indicators for the WEFE subsystems.
SubsystemIndicatorAttributeSubsystemIndicatorAttribute
WaterWater shortage rateNegativeFoodAgricultural water useNegative
EquilibriumPositiveFood self-sufficiency ratePositive
Domestic and industrial water usePositiveFood productionPositive
EnergyEC for water intake and supplyNegativeEcologyGroundwater overextractionNegative
EC for water useNegativeEcology water usePositive
EC for reclaimed water treatmentNegativeReclaimed water usagePositive
Table A2. Model simulation performance evaluation method.
Evaluation MethodFormula
Relative error R e = i = 1 n ( Q s i m , i Q o b s , i ) i = 1 n Q o b s , i × 100 %
Correlation coefficient R 2 = ( i = 1 n ( Q s i m , i Q s i m ¯ ) ( Q o b s , i Q o b s ¯ ) ) 2 i = 1 n ( Q s i m , i Q s i m ¯ ) 2 i = 1 n ( Q o b s , i Q o b s ¯ ) 2
Nash–Sutcliffe efficiency coefficient N S E = 1 i = 1 n ( Q o b s , i Q s i m , i ) 2 i = 1 n ( Q o b s , i Q o b s ¯ ) 2
Root mean square error R M S E = 1 n i = 1 n ( Q o b s , i Q s i m , i ) 2
Where Q s i m , i is the i-th simulated value; Q o b s , i is the i-th observed value; Q s i m ¯ is the mean of the n simulated values; and Q o b s ¯ is the mean of the n observed values.
A smaller relative error ( R e ) and root mean square error ( R M S E ) indicate higher simulation accuracy. A correlation coefficient ( R 2 ) closer to 1 implies a stronger correlation between simulated and observed values. A Nash–Sutcliffe efficiency coefficient (NSE) approaching 1 suggests better overall model performance.
Figure A1. Distribution of hydrologic stations and water resources zones.
Agriculture 15 01271 g0a1
Figure A2. Boxplots of variability distribution for key hydrological parameters in the CSM-WEFE model.
Agriculture 15 01271 g0a2

References

  1. Qin, J.X.; Duan, W.L.; Chen, Y.N.; Dukhovny, V.A.; Sorokin, D.; Li, Y.P.; Wang, X.X. Comprehensive evaluation and sustainable development of water-energy-food-ecology systems in Central Asia. Renew. Sust. Energ. Rev. 2022, 157, 112061. [Google Scholar] [CrossRef]
  2. Van Vuuren, D.P.; Bijl, D.L.; Bogaart, P.; Stehfest, E.; Biemans, H.; Dekker, S.C.; Doelman, J.C.; Gernaat, D.; Harmsen, M. Integrated scenarios to support analysis of the food-energy-water nexus. Nat. Sustain. 2019, 2, 1132–1141. [Google Scholar] [CrossRef]
  3. He, C.Y.; Liu, Z.F.; Wu, J.G.; Pan, X.H.; Fang, Z.H.; Li, J.W.; Bryan, B.A. Future global urban water scarcity and potential solutions. Nat. Commun. 2021, 12, 4667. [Google Scholar] [CrossRef]
  4. Newell, J.P.; Goldstein, B.; Foster, A. A 40-year review of food-energy-water nexus literature and its application to the urban scale. Environ. Res. Lett. 2019, 14, 073003. [Google Scholar] [CrossRef]
  5. Endo, A.; Tsurita, I.; Burnett, K.; Orencio, P.M. A review of the current state of research on the water, energy, and food nexus. J. Hydrol.-Reg. Stud. 2017, 11, 20–30. [Google Scholar] [CrossRef]
  6. Zhang, J.; Campana, P.E.; Yao, T.; Zhang, Y.; Lundblad, A.; Melton, F.; Yan, J. The water-food-energy nexus optimization approach to combat agricultural drought: A case study in the United States. Appl. Energy 2018, 227, 449–464. [Google Scholar] [CrossRef]
  7. Liu, P.W.; Famiglietti, J.S.; Purdy, A.J.; Adams, K.H.; McEvoy, A.L.; Reager, J.T.; Bindlish, R.; Wiese, D.N.; David, C.H.; Rodell, M. Groundwater depletion in California’s Central Valley accelerates during megadrought. Nat. Commun. 2022, 13, 7825. [Google Scholar] [CrossRef]
  8. Bostic, D.; Mendez-Barrientos, L.; Pauloo, R.; Dobbin, K.; Macclements, V. Thousands of domestic and public supply wells face failure despite groundwater sustainability reform in California’s Central Valley. Sci. Rep. 2023, 13, 14797. [Google Scholar] [CrossRef]
  9. Amjath-Babu, T.S.; Sharma, B.; Brouwer, R.; Rasul, G.; Wahid, S.M.; Neupane, N.; Bhattarai, U.; Sieber, S. Integrated modelling of the impacts of hydropower projects on the water-food-energy nexus in a transboundary Himalayan river basin. Appl. Energy 2019, 239, 494–503. [Google Scholar] [CrossRef]
  10. Wang, J.Q.; Wei, J.Y.; Shan, W.B.; Zhao, J.S. Modeling the water-energy-food-environment nexus and transboundary cooperation opportunity in the Brahmaputra River Basin. J. Hydrol.-Reg. Stud. 2023, 49, 101497. [Google Scholar] [CrossRef]
  11. Basheer, M.; Wheeler, K.G.; Ribbe, L.; Majdalawi, M.; Abdo, G.; Zagona, E.A. Quantifying and evaluating the impacts of cooperation in transboundary river basins on the Water-Energy-Food nexus: The Blue Nile Basin. Sci. Total Environ. 2018, 630, 1309–1323. [Google Scholar] [CrossRef]
  12. Yu, Y.; Bo, Y.; Castelletti, A.; Dumas, P.; Gao, J.; Cai, X.; Liu, J.; Kahil, T.; Wada, Y.; Hu, S. Transboundary cooperation in infrastructure operation generates economic and environmental co-benefits in the Lancang-Mekong River Basin. Nature Water 2024, 2, 589–601. [Google Scholar] [CrossRef]
  13. Wang, S.S.; Yang, J.Y.; Wang, A.L.; Liu, T.F.; Du, S.B.; Liang, S.T. Coordinated analysis and evaluation of water-energy-food coupling: A case study of the Yellow River basin in Shandong Province, China. Ecol. Indic. 2023, 148, 110138. [Google Scholar] [CrossRef]
  14. Li, W.; Jiang, S.; Zhao, Y.; Li, H.H.; Zhu, Y.N.; He, G.H.; Xu, Y.R.; Shang, Y.Z. A copula-based security risk evaluation and probability calculation for water-energy-food nexus. Sci. Total Environ. 2023, 856, 159236. [Google Scholar] [CrossRef] [PubMed]
  15. Yin, D.Y.; Yu, H.C.; Shi, Y.Y.; Zhao, M.Y.; Zhang, J.; Li, X.S. Matching supply and demand for ecosystem services in the Yellow River Basin, China: A perspective of the water-energy-food nexus. J. Clean. Prod. 2023, 384, 135469. [Google Scholar] [CrossRef]
  16. Zhu, X.Y.; Su, X.L.; Singh, V.P.; Wu, H.J.; Niu, J.P.; Wu, L.Z.; Chu, J.D. Improving synergy of the water-agriculture-ecology system in arid areas using a novel co-optimization model. Agric. Water Manag. 2025, 312, 109408. [Google Scholar] [CrossRef]
  17. Chen, J.X.; Wu, H.; Zhang, C.L.; Guo, P.; Huo, Z.L. An inexact bi-level multi-objective modeling approach for managing agricultural water-food-carbon-land-ecology-nutrition nexus in an arid area. J. Hydrol. 2023, 621, 129556. [Google Scholar] [CrossRef]
  18. Ding, T.H.; Chen, J.F. Evaluation and obstacle factors of coordination development of regional water-energy-food-ecology system under green development: A case study of Yangtze River Economic Belt, China. Stoch. Environ. Res. Risk Assess. 2022, 36, 2477–2493. [Google Scholar] [CrossRef]
  19. Liu, L.M.; Wang, C.B.; Chen, J.F. Simulation of regional green development policies under the nexus of water-energy-food-ecology: A case study of the Yangtze River economic Belt. Ecol. Indic. 2025, 173, 113364. [Google Scholar] [CrossRef]
  20. Lv, Y.X.; Li, Y.; Zhang, Z.X.; Luo, S.M.; Feng, X.; Chen, X.D. Spatio-temporal evolution pattern and obstacle factors of water-energy-food nexus coupling coordination in the Yangtze river economic belt. J. Clean. Prod. 2024, 444, 141229. [Google Scholar] [CrossRef]
  21. Conway, D.; van Garderen, E.A.; Deryng, D.; Dorling, S.; Krueger, T.; Landman, W.; Lankford, B.; Lebek, K.; Osborn, T.; Ringler, C.; et al. Climate and southern Africa’s water-energy-food nexus. Nat. Clim. Change 2015, 5, 837–846. [Google Scholar] [CrossRef]
  22. Botai, J.O.; Botai, C.M.; Ncongwane, K.P.; Mpandeli, S.; Nhamo, L.; Masinde, M.; Adeola, A.M.; Mengistu, M.G.; Tazvinga, H.; Murambadoro, M.D.; et al. A Review of the Water-Energy-Food Nexus Research in Africa. Sustainability 2021, 13, 1762. [Google Scholar] [CrossRef]
  23. Kalvani, S.R.; Celico, F. The Water-Energy-Food Nexus in European Countries: A Review and Future Perspectives. Sustainability 2023, 15, 4960. [Google Scholar] [CrossRef]
  24. Saladini, F.; Betti, G.; Ferragina, E.; Bouraoui, F.; Cupertino, S.; Canitano, G.; Gigliotti, M.; Autino, A.; Pulselli, F.M.; Riccaboni, A.; et al. Linking the water-energy-food nexus and sustainable development indicators for the Mediterranean region. Ecol. Indic. 2018, 91, 689–697. [Google Scholar] [CrossRef]
  25. Karatayev, M.; Rivotti, P.; Mourão, Z.S.; Konadu, D.D.; Shah, N.; Clarke, M. The water-energy-food nexus in Kazakhstan: Challenges and opportunities. Energy Procedia 2017, 125, 63–70. [Google Scholar] [CrossRef]
  26. Sadeghi, S.H.; Moghadam, E.S.; Delavar, M.; Zarghami, M. Application of water-energy-food nexus approach for designating optimal agricultural management pattern at a watershed scale. Agric. Water Manag. 2020, 233, 106071. [Google Scholar] [CrossRef]
  27. Dalla Fontana, M.; de Araújo Moreira, F.; Di Giulio, G.M.; Malheiros, T.F. The water-energy-food nexus research in the Brazilian context: What are we missing? Environ. Sci. Policy 2020, 112, 172–180. [Google Scholar] [CrossRef]
  28. Del Borghi, A.; Tacchino, V.; Moreschi, L.; Matarazzo, A.; Gallo, M.; Vazquez, D.A. Environmental assessment of vegetable crops towards the water-energy-food nexus: A combination of precision agriculture and life cycle assessment. Ecol. Indic. 2022, 140, 109015. [Google Scholar] [CrossRef]
  29. Armengot, L.; Beltrán, M.J.; Schneider, M.; Simón, X.; Pérez-Neira, D. Food-energy-water nexus of different cacao production systems from a LCA approach. J. Clean. Prod. 2021, 304, 126941. [Google Scholar] [CrossRef]
  30. Tabatabaie, S.M.H.; Murthy, G.S. Development of an input-output model for food-energy-water nexus in the pacific northwest, USA. Resour. Conserv. Recycl. 2021, 168, 105267. [Google Scholar] [CrossRef]
  31. Deng, H.-M.; Wang, C.; Cai, W.-J.; Liu, Y.; Zhang, L.-X. Managing the water-energy-food nexus in China by adjusting critical final demands and supply chains: An input-output analysis. Sci. Total Environ. 2020, 720, 137635. [Google Scholar] [CrossRef] [PubMed]
  32. Lu, S.; Zhang, X.; Peng, H.; Skitmore, M.; Bai, X.; Zheng, Z. The energy-food-water nexus: Water footprint of Henan-Hubei-Hunan in China. Renew. Sustain. Energy Rev. 2021, 135, 110417. [Google Scholar] [CrossRef]
  33. Yue, Q.; Guo, P. Managing agricultural water-energy-food-environment nexus considering water footprint and carbon footprint under uncertainty. Agric. Water Manag. 2021, 252, 106899. [Google Scholar] [CrossRef]
  34. Wang, Y.R.; Song, J.X.; Zhang, X.X.; Sun, H.T.; Bai, H.F. Coupling coordination evaluation of water-energy-food and poverty in the Yellow River Basin, China. J. Hydrol. 2022, 614, 128461. [Google Scholar] [CrossRef]
  35. Zhang, L.; Kong, L.J.; Ji, X.Y.; Ren, Y.H.; Lin, C.; Lu, Z.H. Developing a quantitative framework for watershed sustainable development: The ecology-water energy food (E-WEF) approach. Ecol. Indic. 2025, 172, 113291. [Google Scholar] [CrossRef]
  36. Chang, H.; Zhang, B.; Han, J.; Zhao, Y.; Cao, Y.; Yao, J.; Shi, L. Evaluation of the Coupling Coordination and Sustainable Development of Water–Energy–Land–Food System on a 40-Year Scale: A Case Study of Hebei, China. Land 2024, 13, 1089. [Google Scholar] [CrossRef]
  37. Chang, H.Y.; Cao, Y.Q.; Zhao, Y.; He, G.H.; Wang, Q.M.; Yao, J.Q.; Ren, H.; Yang, H.C.; Hong, Z. Competitive and synergic evolution of the water-food-ecology system: A case study of the Beijing-Tianjin-Hebei region, China. Sci. Total Environ. 2024, 923, 14. [Google Scholar] [CrossRef]
  38. Sun, C.Z.; Hao, S. Research on the competitive and synergistic evolution of the water-energy-food system in China. J. Clean. Prod. 2022, 365, 171509. [Google Scholar] [CrossRef]
  39. Zhang, Y.F.; Li, Y.P.; Huang, G.H.; Ma, Y. A copula-based stochastic fractional programming method for optimizing water-food-energy nexus system under uncertainty in the Aral Sea basin. J. Clean. Prod. 2021, 292, 126037. [Google Scholar] [CrossRef]
  40. Wang, Y.; Zhao, Y.; Wang, Y.Y.; Ma, X.J.; Bo, H.; Luo, J. Supply-demand risk assessment and multi-scenario simulation of regional water-energy-food nexus: A case study of the Beijing-Tianjin-Hebei region. Resour. Conserv. Recycl. 2021, 174, 105799. [Google Scholar] [CrossRef]
  41. Kamrani, K.; Roozbahani, A.; Shahdany, S.M.H. Using Bayesian networks to evaluate how agricultural water distribution systems handle the water-food-energy nexus. Agric. Water Manag. 2020, 239, 106265. [Google Scholar] [CrossRef]
  42. Momblanch, A.; Papadimitriou, L.; Jain, S.K.; Kulkarni, A.; Ojha, C.S.P.; Adeloye, A.J.; Holman, I.P. Untangling the water-food-energy-environment nexus for global change adaptation in a complex Himalayan water resource system. Sci. Total Environ. 2019, 655, 35–47. [Google Scholar] [CrossRef] [PubMed]
  43. Zhang, X.L.; Ren, L. Simulating and assessing the effects of seasonal fallow schemes on the water-food-energy nexus in a shallow groundwater-fed plain of the Haihe River basin of China. J. Hydrol. 2021, 595, 125992. [Google Scholar] [CrossRef]
  44. Zhang, Y.; Jiang, Y.N.; Wei, T.T.; Wang, Y.K.; Liu, Y.J.; Xu, L.G.; He, J.Q.; Wang, X.J. A quantitative analysis framework for analyzing impacts of climate change on water-food-energy-ecosystem nexus in irrigation areas based on WEAP-MODFLOW. J. Clean. Prod. 2024, 470, 143315. [Google Scholar] [CrossRef]
  45. Liu, Y.J.; Jiang, Y.A.; Xu, C.; Lyu, J.Y.; Su, Z.H. A quantitative analysis framework for water-food-energy nexus in an agricultural watershed using WEAP-MODFLOW. Sustain. Prod. Consump. 2022, 31, 693–706. [Google Scholar] [CrossRef]
  46. Wang, X.K.; Dong, Z.C.; Susnik, J. System dynamics modelling to simulate regional water-energy-food nexus combined with the society-economy-environment system in Hunan Province, China. Sci. Total Environ. 2023, 863, 160993. [Google Scholar] [CrossRef]
  47. Howells, M.; Hermann, S.; Welsch, M.; Bazilian, M.; Segerström, R.; Alfstad, T.; Gielen, D.; Rogner, H.; Fischer, G.; Van Velthuizen, H. Integrated analysis of climate change, land-use, energy and water strategies. Nat. Clim. Change 2013, 3, 621–626. [Google Scholar] [CrossRef]
  48. Karnib, A. Bridging Science and Policy in Water-Energy-Food Nexus: Using the Q-Nexus Model for Informing Policy Making. Water Resour. Manag. 2018, 32, 4895–4909. [Google Scholar] [CrossRef]
  49. Imasiku, K.; Ntagwirumugara, E. An impact analysis of population growth on energy-water-food-land nexus for ecological sustainable development in Rwanda. Food Energy Secur. 2020, 9, e185. [Google Scholar] [CrossRef]
  50. Martinez-Hernandez, E.; Leach, M.; Yang, A.D. Understanding water-energy-food and ecosystem interactions using the nexus simulation tool NexSym. Appl. Energy 2017, 206, 1009–1021. [Google Scholar] [CrossRef]
  51. Zhao, Y.; Wang, Q.M.; Jiang, S.; Zhai, J.Q.; Wang, J.H.; He, G.H.; Li, H.H.; Zhang, Y.; Wang, L.Z.; Zhu, Y.N. Irrigation water and energy saving in well irrigation district from a water -energy nexus perspective. J. Clean. Prod. 2020, 267, 122058. [Google Scholar] [CrossRef]
  52. Wang, L.H.; Jia, B.H.; Xie, Z.H.; Wang, B.; Liu, S.; Li, R.C.; Liu, B.; Wang, Y.; Chen, S. Impact of groundwater extraction on hydrological process over the Beijing-Tianjin-Hebei region, China. J. Hydrol. 2022, 609, 127689. [Google Scholar] [CrossRef]
  53. Kattel, G.; Reeves, J.; Western, A.; Zhang, W.J.; Jing, W.; McGowan, S.; Cuo, L.; Scales, P.; Dowling, K.; He, Q.; et al. Healthy waterways and ecologically sustainable cities in Beijing-Tianjin-Hebei urban agglomeration (northern China): Challenges and future directions. Wiley Interdiscip. Rev.-Water 2021, 8, e1500. [Google Scholar] [CrossRef]
  54. Luo, J.M.; Zhang, H.M.; Qi, Y.Q.; Pei, H.W.; Shen, Y.J. Balancing water and food by optimizing the planting structure in the Beijing-Tianjin-Hebei region, China. Agric. Water Manag. 2022, 262, 107326. [Google Scholar] [CrossRef]
  55. Sang, X.; Wang, H.; Wang, J.; Zhao, Y.; Zhou, Z. Water resources comprehensive allocation and simulation model (WAS), part I. Theory and development. J. Hydraul. Eng 2018, 49, 1451–1459. [Google Scholar]
  56. Chang, H.; Sang, X.; He, G.; Wang, Q.; Jiang, S.; He, F.; Li, H.; Zhao, Y. Research and Application of the Mutual Feedback Mechanism of a Regional Natural-Social Dualistic Water Cycle: A Case Study in Beijing–Tianjin–Hebei, China. Water 2022, 14, 3227. [Google Scholar] [CrossRef]
  57. Yan, Z.; Zhou, Z.; Liu, J.; Wen, T.; Sang, X.; Zhang, F. Multiobjective optimal operation of reservoirs based on water supply, power generation, and river ecosystem with a new water resource allocation model. J. Water Resour. Plan. Manag. 2020, 146, 05020024. [Google Scholar] [CrossRef]
  58. Rao, N.; Sarma, P.; Chander, S. A simple dated water-production function for use in irrigated agriculture. Agric. Water Manag. 1988, 13, 25–32. [Google Scholar] [CrossRef]
  59. Stewart, J.I.; Hagan, R.; Pruitt, W.; Danielson, R.; Franklin, W.; Hanks, R.; Riley, J.; Jackson, E. Optimizing Crop Production Through Control of Water and Salinity Levels in the Soil; Merrill-Cazier Library: Logan, UT, USA, 1977. [Google Scholar]
  60. Kuznietsov, P.M.; Biedunkova, O.O.; Yaroschuk, O.V.; Pryshchepa, A.M.; Antonyuk, O.O. Analysis of the Impact of Water Use and Consumption for a Nuclear Power Plant on Alterations in the Hydrological and Temperature Regimes of a River: A Case Study. IOP Conf. Ser. Earth Environ. Sci. 2024, 1415, 012100. [Google Scholar] [CrossRef]
Figure 1. CSM-WEFE structural framework.
Agriculture 15 01271 g001
Figure 2. Study area.
Agriculture 15 01271 g002
Figure 3. Runoff simulation performance evaluation results.
Agriculture 15 01271 g003
Figure 4. Water resource simulation performance evaluation results.
Agriculture 15 01271 g004
Figure 5. Water supply simulation performance evaluation results.
Agriculture 15 01271 g005
Figure 6. Discharge to the sea performance evaluation results.
Agriculture 15 01271 g006
Figure 7. Food production performance evaluation results.
Agriculture 15 01271 g007
Figure 8. Results of interannual simulation of the WEFE system: (a) water shortage rate; (b) food self-sufficiency rate; (c) overexploitation of shallow groundwater; (d) discharge to sea; (e) energy consumption.
Agriculture 15 01271 g008
Figure 9. Results of spatial simulation of the WEFE system.
Agriculture 15 01271 g009
Figure 10. Evaluation results of the (a) REL; (b) CCD; (c) EQU; and (d) CSD.
Agriculture 15 01271 g010
Figure 11. Changes in the WEFE system under different food security scenarios: (a) water shortage rate; (b) food self-sufficiency rate; (c) overexploitation of shallow groundwater; (d) discharge to sea; (e) energy consumption.
Agriculture 15 01271 g011
Figure 12. Evaluation results of the (a) REL; (b) CCD; (c) EQU; and (d) CSD under different food security scenarios.
Agriculture 15 01271 g012
Figure 13. Changes in the WEFE system under different ecological restoration scenarios: (a) water shortage rate; (b) food self-sufficiency rate; (c) energy consumption; and (d) discharge to sea.
Agriculture 15 01271 g013
Figure 14. Evaluation results of the (a) REL; (b) CCD; (c) EQU; and (d) CSD under different ecological restoration scenarios.
Agriculture 15 01271 g014
Figure 15. Index correlation of (a) REL and CCD; (b) REL and EQU; (c) CCD and EQU; and (d) water shortage rate and EQU.
Agriculture 15 01271 g015
Figure 16. Comparison of indicators for S0, SF3, and SE3.
Agriculture 15 01271 g016
Table 1. Comparison of typical nexus models and the improvements introduced by the CSM-WEFE.
ModelFeatureLimitationImprovements of CSM-WEFE
Indicator-based models (e.g., coupling coordination degree, copula functions)Utilization of statistical data and composite indices to assess system coordination and sustainability.Difficult to establish standardized evaluation criteria; scenario comparisons across regions are not directly comparable; results are sensitive to subjective weighting schemes.Integrates three objective performance indices—reliability (REL), coupling coordination degree (CCD), and equilibrium (EQU)—and develops a unified coordinated sustainable development index (CSD) to enable consistent scenario-based comparisons.
System dynamics modelsSimulation of feedback loops and time delays among subsystems using causal loop diagrams.High-level abstraction oversimplifies the underlying physical processes; limited ability to capture spatial heterogeneity.CSM-WEFE embeds physically based modules for natural and social water cycles, agricultural production, and energy feedback, enhancing simulation accuracy and spatial resolution.
Coupled process-based models (e.g., WEAP, SWAT, MODFLOW)Linking mature models to quantify key processes across the water–food–energy–ecology nexus.Coupling complexity; high data requirements; and challenging model calibration and validation.Employs a modular architecture to reduce integration complexity, while achieving dynamic coupling of core processes; validated against multi-source observations to ensure simulation accuracy.
Integrated nexus models (e.g., CLEWS, MuSIASEM, NexSym)Capturing cross-sectoral linkages through optimization or simulation across systems.Frequent focus on macro-scale energy–economic interactions, with limited representation of regional water constraints and ecological dynamics.Anchored in the regional water cycle, CSM-WEFE integrates ecological water needs and food production feedback, addressing ecological–security trade-offs under water scarcity conditions.
Table 2. Scenario setting.
ScenarioScenario Condition
BaselineS0Current situation
Food
security
SF1Irrigated area: 6.6 million ha
Average annual agricultural water demand: 22.8 billion m3
SF2Irrigated area: 4.88 million ha
Average annual agricultural water demand: 14.6 billion m3
SF3Irrigated area: 3.42 million ha
Average annual agricultural water demand: 10.2 billion m3
Ecological
restoration
SE1Balance of groundwater intake and recharge
SE2Extends SE1
Available water supply of SNWDP-MR: 4.95 billion m3
SE3Extends SE2
The amount of discharge to sea shall not be less than 4.05 billion m3
Table 3. Runoff simulation performance evaluation results.
Hydrological
Station
BasinCalibration Period
2000~2010
Validation Period
2011~2016
R e R 2 N S E R e R 2 N S E
SandaoheziLR1.70%0.6920.6844.20%0.6210.613
ZhangjiafenHRN−0.50%0.710.7099.50%0.6940.682
CetianHRN−0.80%0.6360.6322.80%0.7050.703
WangkuaiHRS−9.70%0.7720.76314.80%0.6180.605
HuangbizhuangHRS8.70%0.6190.60810.80%0.7760.766
HoubiHRS2.80%0.710.70713.80%0.8990.761
Table 4. Water resource simulation performance evaluation results.
Water ResourcesLR MountainLR PlainHRN MountainHRN PlainHRS MountainHRS Plain
Surface water resources R 2 0.7830.9390.8830.9050.7830.748
R M S E 5.7992.6892.1442.2089.5535.363
Groundwater R 2 0.5720.8070.6800.7970.6620.796
R M S E 4.6242.6485.1142.03511.3957.466
Table 5. Water supply simulation performance evaluation results.
City R e R 2 R M S E
Beijing0.1%0.9990.047
Tianjin2.8%0.9220.968
Shijiazhuang0.8%0.9900.362
Tangshan1.0%0.9840.351
Qinhuangdao0.4%0.9950.050
Handan1.0%0.9590.279
Xingtai1.7%0.9930.380
Baoding1.0%0.9710.602
Zhangjiakou0.3%0.9980.047
Chengde0.7%0.9840.113
Cangzhou4.6%0.7780.821
Langfang1.8%0.9000.248
Hengshui1.5%0.9660.309
Disclaimer/Publisher’s Note: The statements, opinions and data contained in all publications are solely those of the individual author(s) and contributor(s) and not of MDPI and/or the editor(s). MDPI and/or the editor(s) disclaim responsibility for any injury to people or property resulting from any ideas, methods, instructions or products referred to in the content.

