Abstract
The Huang-Huai-Hai Plain is one of China’s primary winter wheat production regions, making accurate yield estimation critical for agricultural decision-making and national food security. In this study, a yield estimation framework was developed by integrating Sentinel-2 and Landsat-8 satellite data with the WOFOST crop growth model and deep learning techniques. Initially, a multi-scenario sample dataset was constructed using historical meteorological and agronomic data through the WOFOST model. Leaf Area Index (LAI) values were then derived from Landsat-8 and Sentinel-2 imagery, and a GRU (Gated Recurrent Unit) neural network was trained on the simulation samples to establish a relationship between LAI and yield. This trained model was applied to the remote sensing-derived LAI to generate initial yield estimates. To enhance accuracy, the results were further corrected using county-level statistical data, producing a spatially explicit winter wheat yield dataset for the Huang-Huai-Hai Plain from 2014 to 2022. Validation against statistical yearbook data at the county level demonstrated a correlation coefficient (r) of 0.659, a root mean square error (RMSE) of 578.34 kg/ha, and a mean relative error (MRE) of 6.63%. These results indicate that the dataset provides reliable regional-scale yield estimates, offering valuable support for agricultural planning and policy development.
1. Introduction
China is a major agricultural country, yet its per capita arable land area is significantly lower than the global average. In the face of global climate change and population growth, ensuring food security is essential for national stability [1]. Food security involves monitoring key factors such as grain cultivation areas, growth conditions, and yields. Crop yield data are crucial for supporting government decision-making, enhancing agricultural management practices, and optimizing resource allocation [2], thereby contributing to the achievement of Sustainable Development Goal 2 (SDG2): Zero Hunger. The Huang-Huai-Hai (HHH) Plain, one of China’s primary agricultural regions, accounts for approximately 80% of the nation’s wheat production [3]. Therefore, effective monitoring of wheat growth and accurate yield estimation in this region are vital for ensuring food security and promoting national economic development [4].
Traditional crop yield estimation methods rely on manual sampling, which is time-consuming, labor-intensive, and often lacks spatial detail. These methods are not timely and fail to reflect yield variations within administrative boundaries [5]. In contrast, remote sensing offers key advantages: wide-area coverage, frequent data updates, long time series, and non-destructive data collection. These strengths make remote sensing a valuable tool for large-scale yield estimation [6]. In recent decades, significant progress has been made using satellite data [7,8,9]. Satellite remote sensing can compute vegetation growth indicators, such as the Enhanced Vegetation Index (EVI), Normalized Difference Vegetation Index (NDVI), and Leaf Area Index (LAI), using various spectral bands [10,11]. These indices, which are linked to crop growth and photosynthesis, have been demonstrated to be effective for yield estimation [12,13].
Crop yield estimation using remote sensing can generally be categorized into three approaches: empirical models, physical models, and hybrid models [14]. Empirical models establish statistical relationships between remote sensing data and measured yield. For instance, Bolton and Friedl [12] employed MODIS data to correlate vegetation indices with crop yield, achieving credible results at the county level. While such models are easy to implement, they lack constraints on crop growth mechanisms, resulting in poor spatiotemporal universality [5]. In contrast, physical models simulate crop growth processes under varying environmental and management conditions, offering high physical interpretability [15]. Common models include WOFOST [16], DSSAT [17], and APSIM [18]. However, these models are typically complex and require extensive input data that are difficult to obtain. Their accuracy is highly dependent on parameter settings, which limits their applicability at the regional scale [19]. To improve their scalability, data assimilation techniques have been used for parameter calibration. For example, Zhuo et al. [20] integrated MODIS LAI data into WOFOST using the Shuffled Complex Evolution-University of Arizona (SCE-UA) algorithm to reduce yield estimation errors for winter wheat. Although such assimilation improves parameter estimation, physical models still face challenges in large-scale applications, as they typically simulate yields at single points and require high-resolution, spatially explicit input data across extensive areas. Hybrid models offer a promising alternative by combining the strengths of empirical and physical approaches. Typically, a physical crop growth model is first used to simulate yields under diverse scenarios, generating a large synthetic sample set. Then, empirical models are trained on this dataset to establish relationships between remote sensing features and yield, allowing for rapid yield prediction across the entire region. This method reduces reliance on hard-to-acquire input parameters while leveraging the physiological understanding in the crop model.
Deep learning has emerged as a powerful tool for crop yield estimation due to its ability to model complex relationships between input variables and yield outcomes [21,22]. Unlike traditional methods, deep learning leverages large datasets to extract intricate spatial and temporal features, often achieving superior predictive accuracy [23,24]. For instance, convolutional neural networks (CNNs) effectively capture spatial patterns, while recurrent neural networks (RNNs), including long short-term memory (LSTM) and gated recurrent unit (GRU) architectures, mitigate gradient vanishing and explosion issues, enhancing their suitability for temporal yield modeling [25,26]. Nevertheless, these models demand high-quality, representative training data to perform optimally [27]. Additionally, their “black-box” nature limits interpretability, posing challenges for agricultural applications where actionable insights are critical [28]. Hybrid approaches that integrate deep learning with process-based crop models offer a promising solution, combining predictive power with mechanistic understanding to improve regional-scale yield estimates [29].
This study proposes a hybrid yield estimation method that integrates process-based crop growth models with deep learning techniques. The framework leverages multi-scenario crop model simulations—driven by meteorological, soil, and management data—to generate a robust training dataset that embeds agronomic principles while circumventing the need for extensive ground observations. By fusing these simulations with deep learning, the approach enhances both the interpretability and scalability of yield estimation, enabling dynamic analysis of yield-influencing factors at regional scales. Historical yield statistics are further incorporated to calibrate the model, mitigating biases inherent in process-based simulations and improving alignment with local conditions. The specific objectives are:
- (1)
- Multi-scenario wheat growth simulation: Combine crop models with meteorological, soil, and management data. Simulate wheat growth and yield using accumulated temperature theory under multiple scenarios;
- (2)
- Wheat yield mapping: Use remote sensing data and simulated growth results to produce pixel-level yield maps;
- (3)
- Yield calibration: Calibrate simulated yields using historical statistics to enhance accuracy and reduce uncertainty.
2. Study Area and Data
2.1. The HHH Plain
The HHH Plain is located between 32–40° N and 114–121° E, encompassing the regions of Beijing, Tianjin, southern Hebei Province, eastern Henan Province, western Shandong Province, northern Jiangsu Province, and northern Anhui Province (Figure 1). The area is characterized by flat terrain, abundant rivers and lakes, and a monsoon climate that provides favorable light and heat conditions [30]. The primary crops cultivated in the region are wheat, corn, and soybeans.
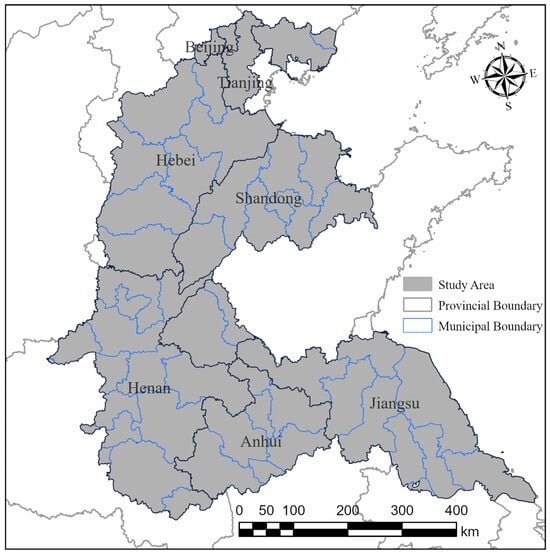
Figure 1.
Geographical location of the study area.
2.2. Data and Preprocessing
2.2.1. Remote Sensing Data and Preprocessing
All image processing was conducted on the Google Earth Engine (GEE) platform. Landsat-8 surface reflectance data were sourced from the LANDSAT/LC08/C02/T1_L2 collection, while Sentinel-2 surface reflectance data were obtained from the COPERNICUS/S2_SR_HARMONIZED collection. Image selection was based on the temporal windows specified in Table 1, with initial filtering to exclude scenes with more than 80% cloud cover, followed by cloud masking using Quality Assessment (QA) band. Landsat-8 data were used for the years 2014–2016, while Sentinel-2 data were used for 2017–2022. Given that Sentinel-2’s B8A band has a spatial resolution of 20 m, all Sentinel-2 imagery was resampled to 20 m. Consequently, the final dataset has a spatial resolution of 30 m for 2014–2016 and 20 m for 2017–2022. For each year, only one image (either Landsat-8 or Sentinel-2) was selected, ensuring temporal consistency and minimizing discrepancies between sensors across years.

Table 1.
Stages of wheat fertility.
2.2.2. Meteorological Data and Preprocessing
- (1)
- Meteorological Station Data
The meteorological observation dataset used in this study comes from the website of the National Meteorological Information Center (http://data.cma.cn/, accessed on 17 March 2024), and 124 meteorological stations in the wheat-growing area of the HHH Plain are selected, with a time range of 1980–2021. The dataset contains daily meteorological observations, including temperature, humidity, wind speed, and wind direction. For this study, the primary variables used are daily average temperature, minimum temperature, maximum temperature, average wind speed, precipitation, average water vapor pressure, and sunshine hours. The total ground radiation data () required for the WOFOST model was calculated based on sunshine hours, using the following formula:
where is the total solar radiation (MJ/m2/d); is the extraterrestrial solar radiation (MJ/m2/d); is the actual daily sunshine hours (h); is the maximum daily sunshine hours (h); and are regression coefficients. The research uses the recommended values of the Angstrom formula parameters proposed by Xia et al. [31] for calculation. The calculation formulas for and N are as follows:
where is the solar constant, which is 0.0820 MJ m−2 min−1; is the relative distance to the sun; is the sunset angle (rad); represents the latitude of the region (rad); is the solar declination (rad); rad represents the unit of radians; and J is the number of days in the Gregorian calendar corresponding to the date (annual accumulated days). The weather station data are used as input to the WOFOST model to construct multi-scenario datasets for simulating wheat growth under various conditions.
- (2)
- Acquisition of temperature data
The daily temperature data come from the ERA5-Land Daily Aggregated ECMWF Climate Reanalysis dataset. ERA5-Land is a reanalysis dataset, a high-resolution version of ERA5, optimized specifically for surface variables. It combines meteorological observations and model simulations to provide global climate data from 1950 to the present. The spatial resolution of this dataset is 0.1° and the temporal resolution is 1 day. The 2014–2022 temperature data for the study area were screened for calculating cumulative temperature during the late growth stage.
2.2.3. Other Data
- (1)
- Soil data
Soil data are sourced from the 1:1,000,000-scale Geographic Data Sharing Infrastructure on the Global Resources Data Cloud (www.gis5g.com, accessed on 17 March 2024), which primarily includes soil types and their key attributes.
- (2)
- Winter wheat distribution data
Winter wheat distribution data [32,33] were downloaded from the National Ecosystem Science Data Center (https://cstr.cn/15732.11.nesdc.ecodb.12003990, accessed on 15 April 2024), covering the period from 2001 to 2024 with a spatial resolution of 30 m. This dataset employs time-weighted dynamic time warping to compare the seasonal change curves of known winter wheat plots with those of unknown landform types. The result is a 30 m spatial resolution map of winter wheat planting distribution across 11 provinces in China, which together account for more than 99% of the national winter wheat area. The dataset was verified through field survey samples and Google Earth samples, yielding an overall accuracy of 91.17%, with producer and user accuracies of 91.6% and 90.92%, respectively. For this study, winter wheat spatial distribution data from 2014 to 2022 were utilized.
- (3)
- Statistical data
Statistical data on winter wheat yield were obtained from the China Economic and Social Big Data Research Platform (https://data.cnki.net/, accessed on 17 September 2024), with the data collected through sampling surveys. Winter wheat yield data at the municipal and county levels in the HHH Plain from 2014 to 2022 were gathered. The municipal-level yield data were used to calibrate the simulated yield, while the county-level yield data served to evaluate the calibration results.
- (4)
- Administrative division data
The administrative division data used in this study were downloaded from the Resource and Environmental Science Data Platform of the Chinese Academy of Sciences (https://www.resdc.cn/, accessed on 17 March 2024).
3. Methods
This study presents an integrated framework for winter wheat yield estimation that synergistically combines process-based crop modeling with deep learning techniques (Figure 2). The methodology addresses regional-scale estimation challenges through four interconnected components:
- (1)
- Agronomic Knowledge Base Development: The WOFOST model simulates winter wheat growth dynamics and yield formation across diverse environmental and management scenarios. By integrating meteorological data, soil parameters, cultivar characteristics, and field management practices, we generate a comprehensive dataset. This simulation dataset provides both the sample volume and mechanistic foundation for subsequent data-driven modeling;
- (2)
- Deep Learning-Based Yield Modeling: Deep learning algorithms are applied to analyze and extract key yield-related indicators from the simulation dataset. By systematically optimizing the model architecture and parameters, the study enhances both the estimation accuracy and the generalization capability of the yield prediction model;
- (3)
- Winter wheat yield estimation: The phenological stages of winter wheat within the study area are determined to guide the acquisition of Landsat-8 and Sentinel-2 remote sensing imagery. These datasets are utilized to derive LAI for yield estimation. The trained yield estimation model is then applied to generate spatially explicit yield distribution maps over multiple years;
- (4)
- Multi-Scale Validation and Calibration: The initially simulated yield estimates are adjusted using municipal-level statistical yield data to improve their reliability. Subsequently, county-level statistical yield data are employed to evaluate and validate the accuracy of the corrected yield estimates, ensuring the practical applicability and robustness of the proposed model.
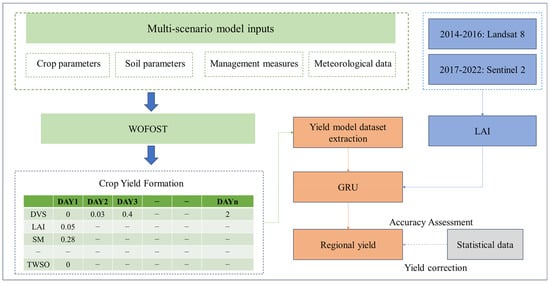
Figure 2.
Workflow diagram: multi-scenario model inputs and WOFOST integration for regional crop yield prediction.
3.1. Construction of Multi-Scenario Wheat Growth Simulation Dataset and Yield Estimation
3.1.1. WOFOST
WOFOST [16] is a crop simulation model developed by the World Food Research Center and Wageningen University. It is designed to simulate crop growth and yield formation under specified soil, crop, weather, and management conditions. The model is widely applied to various crops and agro-climatic regions due to its robust physiological basis and adaptability.
3.1.2. Model Localization
This study uses the PCSE 5.6 software package under Python 3.7 to implement the operation of the WOFOST model. The input data of the model include meteorological, crop, soil, and management parameters. Since large-scale field experimental data are difficult to obtain, this study collected a large number of papers on the WOFOST model simulating wheat growth [34,35,36,37,38,39,40].
In these papers, the sensitivity analysis and localized calibration of the wheat WOFOST model parameters in the HHH Plain were completed, and the parameter value range was provided, which provided a valuable reference for the localization of the WOFOST model parameters in this study.
3.2. Deep Learning-Based Yield Modeling
The Developmental Variant Stage (DVS) is a quantitative measure indicating a crop’s growth progress relative to full maturity. DVS values range from 0 (beginning of growth) to 2 (full maturity). In the WOFOST model, crop growth is divided into two stages: from green-up to flowering (0 < DVS ≤ 1) and from flowering to maturity (1 < DVS ≤ 2). The average Leaf Area Index (LAI) during these two stages (LAImean) is used as the time series input feature, with winter wheat yield as the output feature.
A GRU is able to capture the relationship between temporal features and has been successfully used for crop yield estimation [9]. In this study, the GRU construction and optimization approach follows previous research [41,42]. The data samples are divided into a training set and a validation set in a 9:1 ratio, and the optimal GRU parameters are determined using the Adam optimizer. The GRU model structure is shown in Figure 3.
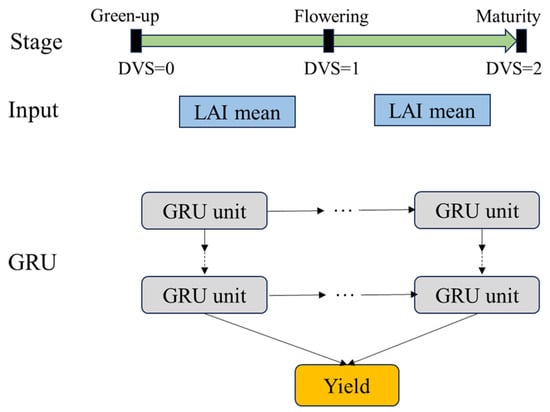
Figure 3.
GRU yield estimation model architecture.
3.3. Estimation of Winter Wheat Yield
3.3.1. Phenological Extraction of Winter Wheat in the HHH Plain
Accurate extraction of the crop growth period is crucial for analyzing spatiotemporal interannual changes, monitoring crop growth, and enhancing the accuracy of crop yield estimation [43]. In this study, the WOFOST model uses the DVS to quantitatively characterize the growth and development of winter wheat. To obtain remote sensing images and accurately estimate the phenological stages, we focus on the period after winter wheat’s wintering phase, as the crop grows slowly and the ground is often covered with snow, which can obscure the vegetation’s reflectivity. To identify the growth stages, we use the effective accumulated temperature (Te), which is the sum of the daily average temperatures above the base temperature for winter wheat. When the effective accumulated temperature reaches a threshold required for a growth stage, the crop advances to the next stage.
To determine the growth stages, historical meteorological data from 2014 to 2022 and ERA5-Land Daily Aggregated ECMWF Climate Reanalysis data are used to calculate the required effective accumulated temperature thresholds for each growth stage. The DVS values are then computed to divide the growth stages accordingly. Table 1 outlines the growth stage timings for winter wheat in the study region.
3.3.2. Feature Inversion Method
The remote sensing data were input into the aforementioned model set to obtain the regional winter wheat yield. Prior to this, the spectral information from the Sentinel-2 image needed to be converted into the LAI for model input. This study utilizes the newly proposed Sentinel-2 LAIgreen index (SeLI) introduced by Pasqualotto et al. [44] to invert the LAI of the experimental area. SeLI is defined as:
R865 corresponds to the vegetation red edge band B8a in Sentinel-2, while R705 corresponds to the vegetation red edge band B5 in Sentinel-2. Based on SeLI, Nieves Pasqualotto et al. [44] compared the fitting results of ground data and SeLI using linear, exponential, and second-order polynomial models. They selected linear fitting and performed validation with test data. The linear fit with the LAIgreen obtained by this method yielded an R2 of 0.732 and an RMSE (Root Mean Square Error) of 0.69. The linear equation is as follows:
For Landsat-8, LAI is inverted based on the NDVI. The calculation formula [45,46] is as follows:
In the pixel-scale yield estimation process, winter wheat distribution data are first used to identify winter wheat planting pixels in the study area. The LAI time series, generated through remote sensing image inversion, are then incorporated into the yield estimation model. For null zones, the average LAI values from the two years before and after the missing data are used as substitutes. By combining these LAI features with the model, winter wheat yield can be estimated at the pixel level.
3.4. Correction of Yield Estimation Results
Recognizing that crop yield estimation inherently contains uncertainties from multiple sources—including structural errors in crop growth models, parameter calibration inaccuracies, remote sensing data inversion discrepancies, and neural network training limitations—we implemented a systematic correction approach at the municipal scale to enhance prediction accuracy.
Building upon established error correction methodologies [47,48,49], the linearly corrected yield value is calculated as:
where is the estimated yield for the i-th pixel in municipality j; is the sum of estimated yields for all pixels in municipality j; is the statistical yield for municipality j, and is the corrected yield for the i-th pixel in municipality j. The correction scheme is based on two assumptions: (1) the relative distribution of initial yield estimates among pixels within the same municipal unit remains consistent, and (2) statistical data accurately reflect the unit’s average yield. This approach ensures consistency between image-scale estimates and administrative-scale statistics.
3.5. Accuracy Evaluation
In this study, three different indicators are used to evaluate the performance of the yield estimation model: correlation coefficient r, root mean square error RMSE and mean relative error MRE (Mean Relative Error). The higher the r, the smaller the RMSE and MRE, which means the better the performance of the yield estimation model. The calculation formula is as follows:
where represents the statistical yield from statistical yearbooks, represents the predicted yield, and denote the mean statistical and predicted values, respectively, and n is the total number of samples.
4. Results
4.1. Accuracy of Winter Wheat Yield Estimation in the HHH Plain
In this study, winter wheat yield distribution data for the HHH Plain from 2014 to 2022 were generated. Yields for 2014–2016 were derived from Landsat-8 imagery at 30 m resolution, while yields for 2017–2022 were derived from Sentinel-2 imagery at 20 m resolution. The combined dataset is referred to as HHHWheatYield20/30 m. Figure 4 illustrates the consistency between the corrected model-predicted yield and the statistical yearbook yield at the county scale. The results demonstrated an r of 0.659 between the remotely sensed yield estimates and the statistical yearbook data, while maintaining low error levels, with an RMSE of 578.34 kg/ha and an MRE of 6.63%. These findings indicate that the model exhibits fundamental reliability in estimating crop yields at the regional scale.
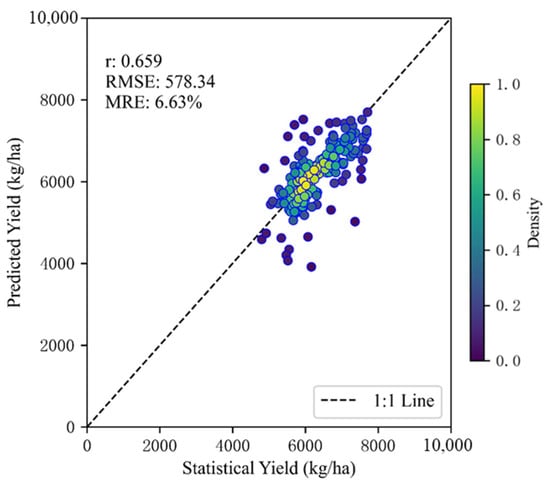
Figure 4.
Scatter plot of county-level corrected wheat yield and statistical yearbook data from 2014 to 2022.
Further analysis revealed systematic underestimation and overestimation patterns when the statistical yearbook-reported yield was approximately 6000 kg/ha. The underestimation may stem from the model’s inability to fully account for the yield-enhancing effects of recent agricultural advancements, such as precision fertilizer application, water-saving irrigation, and the widespread adoption of high-yielding, stress-resistant crop varieties. Conversely, overestimation may be attributed to the inability of remote sensing data to promptly detect yield reductions caused by localized catastrophic events, including pest and disease outbreaks or extreme climatic conditions. Additionally, discrepancies in yield estimates may also be influenced by the spatial heterogeneity of environmental factors, such as variations in soil fertility.
4.2. Estimation Results of Winter Wheat Yield in the HHH Plain
Figure 5 presents the estimated winter wheat yield across the HHH Plain from 2014 to 2022. The results reveal spatial and temporal variability in wheat yield. Over the study period, a general upward trend in regional yields was observed, accompanied by a gradual expansion of high-yielding areas. As the yield distribution maps are derived from wheat distribution data, annual spatial patterns exhibit variability, reflecting not only interannual changes in yield levels but also shifts in the spatial extent of wheat cultivation.
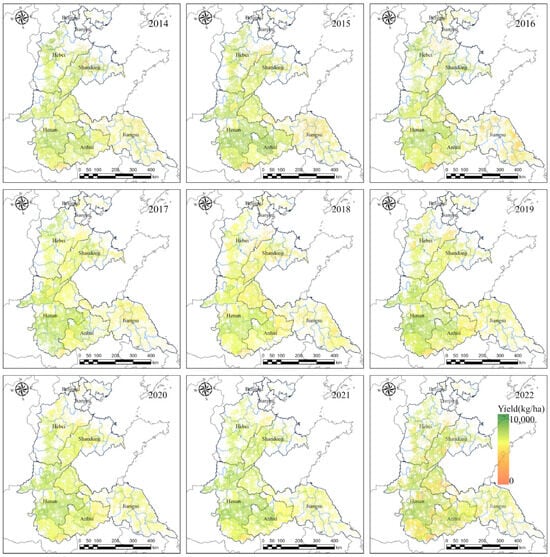
Figure 5.
Spatial distribution of wheat yield from 2014 to 2022.
Spatially, the yield distribution exhibited a consistent pattern, with higher yields in the southern part of the HHH Plain and lower yields in the north. High-yield zones were predominantly located in the eastern plains of Henan Province, especially in Zhoukou and Shangqiu, while low-yield areas were concentrated in the central and northern regions of Hebei Province 2013.
Figure 6 presents the temporal variation in municipal-level winter wheat yields across the study area from 2014 to 2022. Overall, yields exhibited a slight upward trend during this period, with a notable decline observed in 2018. To further illustrate spatial differences, linear regression analysis was conducted for each municipality, as shown in Figure 7. Results indicate an increasing yield trend in major wheat-producing areas of Henan and Hebei, while decreasing trends are observed in Anhui and southern Jiangsu.
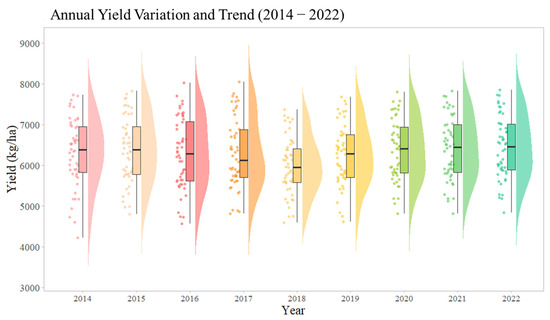
Figure 6.
Temporal variation in municipal winter wheat yields in the Huang-Huai-Hai Plain from 2014 to 2022. Different colors represent different years.
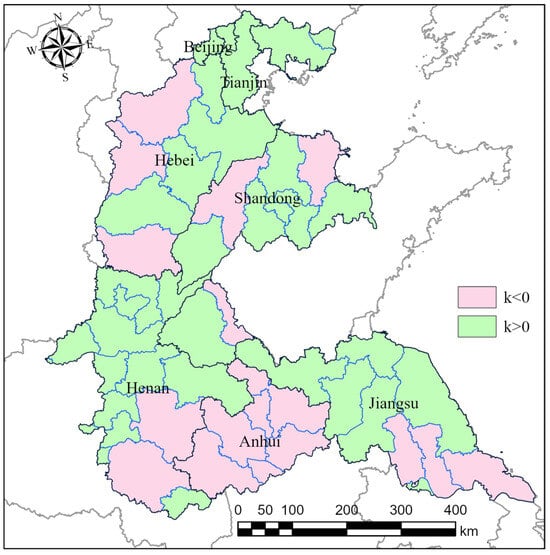
Figure 7.
Linear yield trends in each municipality of the Huang-Huai-Hai Plain from 2014 to 2022. k represents the slope of the linear regression.
5. Discussion
5.1. Comparison of HHHWheatYield20/30 m with Existing Datasets
Figure 8a,b present statistical comparisons of the HHHWheatYield20/30 m dataset against the GlobalWheatYield4 km [50] and ChinaWheatYield30 m [51] datasets at the municipal level, illustrating variations and alignment among the three datasets across different spatial scales.
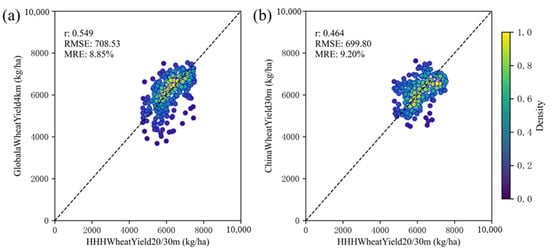
Figure 8.
Statistical comparison of HHHWheatYield20/30 m with (a) GlobalWheatYield4 km and (b) ChinaWheatYield30 m datasets at the municipal level.
In Figure 8a, the HHHWheatYield20/30 m dataset exhibits an r of 0.549 with the GlobalWheatYield4 km dataset, along with an RMSE of 708.53 kg/ha and an MRE of 8.85%. In Figure 8b, the comparison with the ChinaWheatYield30 m dataset yields an r of 0.464, an RMSE of 699.80 kg/ha, and an MRE of 9.20%. These results indicate measurable alignment between HHHWheatYield20/30 m and both datasets, as reflected in the correlation coefficients and error metrics, capturing shared yield estimation trends across spatial scales.
The observed differences may arise from several factors. First, the spatial resolution differs between the datasets: HHHWheatYield20/30 m has a resolution of 20/30 m, whereas GlobalWheatYield4 km is at 4 km. This resolution gap may introduce discrepancies in localized yield estimates. Second, variations in estimation methods and input data—such as differences in remote sensing data sources, model parameter settings, and correction approaches—could further contribute to differences in yield estimates.
5.2. Advantages and Limitations of Model Coupling
Various methods have been developed for remote sensing-based crop yield estimation, leading to significant advancements in the field. However, regional-scale yield analysis typically requires long time series and large-scale datasets [50,52]. Traditional remote sensing yield estimation methods rely heavily on ground sample data for model development, but in practical applications, measured sample points are frequently insufficient [53,54]. For instance, when statistical models are employed, sufficient measured yield data in the study area can facilitate yield estimation through empirical models or machine learning. While these methods are generally straightforward, effective, and capable of producing satisfactory results within the calibration region, their applicability is limited by poor spatial transferability. This is primarily due to spatial heterogeneity and regional differences in agricultural management practices, resulting in models with low generalizability and limited interpretability [55].
Lu et al. [29] demonstrated that integrating deep learning with the WOFOST model and Bayesian optimization improved the accuracy of rice yield estimation compared to conventional machine learning approaches. In contrast, the present study focuses on constructing a knowledge-based simulation dataset that captures a wide range of environmental and management conditions within the study area. All training samples were generated using the WOFOST model, with no direct correspondence to observed imagery. Consequently, feature selection was constrained, and LAI was used as the primary input variable for yield estimation. Future research will explore the incorporation of additional features to enhance predictive accuracy.
Based on the dataset produced in this study, further analyses can also be conducted to examine the influence of environmental and management factors on yield outcomes. For instance, Leonardo Talero-Sarmiento et al. [56] conducted a data-driven analysis on the impact of environmental variables on cocoa growth and identified temperature, humidity, and wind speed as key determinants. Similarly, the yield data generated in this study can be used in future research to explore fine-scale drivers of yield variability and to support data-informed agricultural decision-making.
By constructing a crop-specific knowledge base for the study area, this approach facilitates efficient yield estimation and enables the potential for early-season yield prediction. Since the WOFOST model simulates LAI dynamics throughout the growing season, it is possible to analyze LAI–yield relationships across different time periods. This allows for the selection of key temporal windows in which LAI is most predictive of final yield. Theoretically, earlier yield forecasts can be generated by utilizing LAI data from earlier growth stages, accepting a trade-off in accuracy for timeliness. Such flexibility provides a practical foundation for timely yield distribution mapping, which can support proactive decision-making by government agencies and farmers in implementing management interventions or stabilizing food prices.
5.3. Uncertainty Analysis and Improvement Methods
This study combined the WOFOST crop growth model and the GRU deep learning model to estimate winter wheat yield in the HHH Plain. Several uncertainties remain due to the inherent complexity of regional-scale yield estimation. These uncertainties primarily originate from methodological and data-related factors.
Methodological uncertainties involve both the calibration of the WOFOST model and the optimization of the GRU algorithm. Due to the limited availability of ground-based observations, WOFOST parameters were adopted from the previous literature, which may introduce bias and limit model adaptability to local conditions. The performance of the GRU model is highly sensitive to hyperparameter configurations; therefore, a grid search strategy was employed to optimize the model and reduce configuration-induced uncertainty. Additionally, although the yield correction method based on administrative units is straightforward and practical, its accuracy depends heavily on the reliability of statistical data and may lead to spatial discontinuities at administrative boundaries. To mitigate this, future research should consider the application of spatial smoothing techniques.
Data-related uncertainties stem from the integration of multi-source datasets with differing spatial resolutions. Specifically, inconsistencies between simulated and remotely sensed LAI values, along with the inherent limitations of empirical inversion approaches, may adversely affect yield estimation accuracy. The adoption of data assimilation frameworks and advanced multi-source data fusion techniques could help address these challenges. Furthermore, improvements in LAI estimation, through refined inversion algorithms or the application of machine learning methods, are necessary. Due to the lack of field-level yield observations, validation in this study was limited to the administrative unit scale. Acquiring high-quality yield data for ground validation will be essential in future work.
6. Conclusions
A winter wheat yield dataset for the HHH Plain was generated for the period 2014–2022 by integrating Sentinel-2 and Landsat-8 imagery with the WOFOST and GRU models, without reliance on ground-based yield observations. Comparison with county-level statistical yearbook data produced an r of 0.659, an RMSE of 578.34 kg/ha, and an MRE of 6.63%, indicating acceptable accuracy under conditions of limited in situ data. The proposed framework offers a scalable and data-efficient approach for regional yield estimation, with potential for further methodological refinement. Additionally, the resulting dataset enables detailed analysis of the spatiotemporal dynamics of winter wheat production in the HHH Plain, providing critical support for evidence-based agricultural decision-making and policy development.
Author Contributions
Conceptualization, Y.Z. (Yachao Zhao), X.D. and J.X.; methodology, Y.Z. (Yachao Zhao), X.D. and J.X.; validation, Y.Z. (Yachao Zhao), J.X., S.Y., S.G. and H.H.; investigation, J.X.; data curation, Y.Z. (Yachao Zhao), J.X., S.Y., S.G. and H.H.; writing—original draft preparation, Y.Z. (Yachao Zhao); writing—review and editing, X.D., Y.Z. (Yuan Zhang) and H.W.; visualization, Y.Z. (Yachao Zhao), J.X., S.Y., S.G. and H.H.; supervision, Q.L.; project administration, X.D. All authors have read and agreed to the published version of the manuscript.
Funding
This research was funded by the National Key R&D Program of China (2023YFB3906204), National Science Foundation of China (42371359), and the Science and Disruptive Technology Project of AIRCAS (E2Z203010F).
Data Availability Statement
The data presented in this study are available on reasonable request from the corresponding author.
Conflicts of Interest
The authors declare no conflicts of interest.
References
- Liu, R.; Dong, J.; Ge, Y.; Lin, H.; Che, X.; Di, Y.; Chen, X.; Qi, S.; Ding, M.; Xiao, X.; et al. Tracking Paddy Rice Acreage, Flooding Impacts, and Mitigations during El Niño Flooding Events Using Sentinel-1/2 Imagery and Cloud Computing. ISPRS J. Photogramm. Remote Sens. 2024, 217, 165–178. [Google Scholar] [CrossRef]
- Zhao, L.; Li, F.; Chang, Q. Review on Crop Type Identification and Yield Forecasting Using Remote Sensing. Trans. Chin. Soc. Agric. Mach. 2023, 54, 1–19. [Google Scholar]
- Shi, W.; Wang, M.; Tao, F.; Xu, X.; Deng, X.; Liu, L.; Kong, X.; Zuo, L.; Lei, M.; Shi, X.; et al. Wheat Redistribution in Huang-Huai-Hai, China, Could Reduce Groundwater Depletion and Environmental Footprints without Compromising Production. Commun. Earth Environ. 2024, 5, 380. [Google Scholar] [CrossRef]
- Li, M.; Wang, P.; Tansey, K.; Zhang, Y.; Guo, F.; Liu, J.; Li, H. An Interpretable Wheat Yield Estimation Model Using an Attention Mechanism-Based Deep Learning Framework with Multiple Remotely Sensed Variables. Int. J. Appl. Earth Obs. Geoinf. 2025, 140, 104579. [Google Scholar] [CrossRef]
- Tian, H.; Wang, P.; Tansey, K.; Han, D.; Zhang, J.; Zhang, S.; Li, H. A Deep Learning Framework under Attention Mechanism for Wheat Yield Estimation Using Remotely Sensed Indices in the Guanzhong Plain, PR China. Int. J. Appl. Earth Obs. Geoinf. 2021, 102, 102375. [Google Scholar] [CrossRef]
- Teste, F.; Makowski, D.; Bazzi, H.; Ciais, P. Early Forecasting of Corn Yield and Price Variations Using Satellite Vegetation Products. Comput. Electron. Agric. 2024, 221, 108962. [Google Scholar] [CrossRef]
- Hashemi, M.G.Z.; Tan, P.-N.; Jalilvand, E.; Wilke, B.; Alemohammad, H.; Das, N.N. Yield Estimation from SAR Data Using Patch-Based Deep Learning and Machine Learning Techniques. Comput. Electron. Agric. 2024, 226, 109340. [Google Scholar] [CrossRef]
- Ma, Y.; Liang, S.-Z.; Myers, D.B.; Swatantran, A.; Lobell, D.B. Subfield-Level Crop Yield Mapping without Ground Truth Data: A Scale Transfer Framework. Remote Sens. Environ. 2024, 315, 114427. [Google Scholar] [CrossRef]
- Wang, J.; Wang, P.; Tian, H.; Tansey, K.; Liu, J.; Quan, W. A Deep Learning Framework Combining CNN and GRU for Improving Wheat Yield Estimates Using Time Series Remotely Sensed Multi-Variables. Comput. Electron. Agric. 2023, 206, 107705. [Google Scholar] [CrossRef]
- Tucker, C.J. Red and Photographic Infrared Linear Combinations for Monitoring Vegetation. Remote Sens. Environ. 1979, 8, 127–150. [Google Scholar] [CrossRef]
- Huete, A.R.; Liu, H.Q.; Batchily, K.; van Leeuwen, W. A Comparison of Vegetation Indices over a Global Set of TM Images for EOS-MODIS. Remote Sens. Environ. 1997, 59, 440–451. [Google Scholar] [CrossRef]
- Bolton, D.K.; Friedl, M.A. Forecasting Crop Yield Using Remotely Sensed Vegetation Indices and Crop Phenology Metrics. Agric. For. Meteorol. 2013, 173, 74–84. [Google Scholar] [CrossRef]
- Moriondo, M.; Maselli, F.; Bindi, M. A Simple Model of Regional Wheat Yield Based on NDVI Data. Eur. J. Agron. 2007, 26, 266–274. [Google Scholar] [CrossRef]
- Lyu, Y.; Wang, P.; Bai, X.; Li, X.; Ye, X.; Hu, Y.; Zhang, J. Machine Learning Techniques and Interpretability for Maize Yield Estimation Using Time-Series Images of MODIS and Multi-Source Data. Comput. Electron. Agric. 2024, 222, 109063. [Google Scholar] [CrossRef]
- Xu, X.; Wu, B.; Meng, J.; Li, Q.; Huang, W.; Liu, L.; Wang, J. Research Advances in Crop Yield Estimation Models Based on Remote Sensing. Trans. Chin. Soc. Agric. Eng. 2008, 24, 290–298. [Google Scholar]
- Van Diepen, C.A.; Wolf, J.; van Keulen, H.; Rappoldt, C. WOFOST: A Simulation Model of Crop Production. Soil. Use Manag. 1989, 5, 16–24. [Google Scholar] [CrossRef]
- Jones, J.W.; Hoogenboom, G.; Porter, C.H.; Boote, K.J.; Batchelor, W.D.; Hunt, L.A.; Wilkens, P.W.; Singh, U.; Gijsman, A.J.; Ritchie, J.T. The DSSAT Cropping System Model. Eur. J. Agron. 2003, 18, 235–265. [Google Scholar] [CrossRef]
- Keating, B.A.; Carberry, P.S.; Hammer, G.L.; Probert, M.E.; Robertson, M.J.; Holzworth, D.; Huth, N.I.; Hargreaves, J.N.G.; Meinke, H.; Hochman, Z.; et al. An Overview of APSIM, a Model Designed for Farming Systems Simulation. Eur. J. Agron. 2003, 18, 267–288. [Google Scholar] [CrossRef]
- Huang, J.; Ma, H.; Sedano, F.; Lewis, P.; Liang, S.; Wu, Q.; Su, W.; Zhang, X.; Zhu, D. Evaluation of Regional Estimates of Winter Wheat Yield by Assimilating Three Remotely Sensed Reflectance Datasets into the Coupled WOFOST–PROSAIL Model. Eur. J. Agron. 2019, 102, 1–13. [Google Scholar] [CrossRef]
- Zhuo, W.; Fang, S.; Gao, X.; Wang, L.; Wu, D.; Fu, S.; Wu, Q.; Huang, J. Crop Yield Prediction Using MODIS LAI, TIGGE Weather Forecasts and WOFOST Model: A Case Study for Winter Wheat in Hebei, China during 2009–2013. Int. J. Appl. Earth Obs. Geoinf. 2022, 106, 102668. [Google Scholar] [CrossRef]
- Cao, J.; Zhang, Z.; Tao, F.; Zhang, L.; Luo, Y.; Han, J.; Li, Z. Identifying the Contributions of Multi-Source Data for Winter Wheat Yield Prediction in China. Remote Sens. 2020, 12, 750. [Google Scholar] [CrossRef]
- Guo, Y.; Xiao, Y.; Hao, F.; Zhang, X.; Chen, J.; de Beurs, K.; He, Y.; Fu, Y.H. Comparison of Different Machine Learning Algorithms for Predicting Maize Grain Yield Using UAV-Based Hyperspectral Images. Int. J. Appl. Earth Obs. Geoinf. 2023, 124, 103528. [Google Scholar] [CrossRef]
- LeCun, Y.; Bengio, Y.; Hinton, G. Deep Learning. Nature 2015, 521, 436–444. [Google Scholar] [CrossRef]
- Schmidhuber, J. Deep Learning in Neural Networks: An Overview. Neural Netw. 2015, 61, 85–117. [Google Scholar] [CrossRef]
- Wang, X.; Liu, B.; Chen, Z.; Ju, T. Winter Wheat Yield Estimation at County-Scale Based on the Multi-Source Data and LSTM Model. Res. Agric. Mod. 2023, 44, 1117–1126. [Google Scholar]
- Yu, J.; Zhang, X.; Xu, L.; Dong, J.; Zhangzhong, L. A Hybrid CNN-GRU Model for Predicting Soil Moisture in Maize Root Zone. Agric. Water Manag. 2021, 245, 106649. [Google Scholar] [CrossRef]
- Kamilaris, A.; Prenafeta-Boldú, F.X. Deep Learning in Agriculture: A Survey. Comput. Electron. Agric. 2018, 147, 70–90. [Google Scholar] [CrossRef]
- Sarker, I.H. Deep Learning: A Comprehensive Overview on Techniques, Taxonomy, Applications and Research Directions. SN Comput. Sci. 2021, 2, 420. [Google Scholar] [CrossRef]
- Lu, J.; Li, J.; Fu, H.; Zou, W.; Kang, J.; Yu, H.; Lin, X. Estimation of Rice Yield Using Multi-Source Remote Sensing Data Combined with Crop Growth Model and Deep Learning Algorithm. Agric. For. Meteorol. 2025, 370, 110600. [Google Scholar] [CrossRef]
- Liu, S.; Mo, X.; Lin, Z.; Xu, Y.; Ji, J.; Wen, G.; Richey, J. Crop Yield Responses to Climate Change in the Huang-Huai-Hai Plain of China. Agric. Water Manag. 2010, 97, 1195–1209. [Google Scholar] [CrossRef]
- Xia, X.; Zhu, X.; Pan, Y.; Zhang, J. Calibrating and Optimizing the Parameters in Angstrom Equation for Calculating Evapotranspiration from Mainland China. J. Irrig. Drain. 2020, 39, 123–130. [Google Scholar]
- Dong, J.; Pang, Z.; Fu, Y.; Peng, Q.; Li, X.; Yuan, W. Annual Winter Wheat Mapping Dataset in China from 2001 to 2020. Sci. Data 2024, 11, 1218. [Google Scholar] [CrossRef] [PubMed]
- Dong, J.; Fu, Y.; Wang, J.; Tian, H.; Fu, S.; Niu, Z.; Han, W.; Zheng, Y.; Huang, J.; Yuan, W. Early-Season Mapping of Winter Wheat in China Based on Landsat and Sentinel Images. Earth Syst. Sci. Data 2020, 12, 3081–3095. [Google Scholar] [CrossRef]
- He, L.; Hou, Y.; Zhao, G.; Wu, D.; Yu, Q. Parameter Optimization of WOFOST Crop Model Based on Global Sensitivity Analysis and Bayesian Method. Trans. Chin. Soc. Agric. Eng. 2016, 32, 169–179. [Google Scholar]
- Huang, J.; Jia, S.; Ma, H.; Hou, Y.; He, L. Dynamic Simulation of Winter Wheat Growth Process in China’s Main Production Areas Based on WOFOST Model. Trans. Chin. Soc. Agric. Eng. 2017, 33, 222–228. [Google Scholar]
- Ma, Y.; Wang, S.; Zhang, L. Study on Improvement of WOFOST Against Overwinter of Wheat in North China. Chin. J. Agrometeorol. 2005, 26, 145–149. [Google Scholar]
- Wang, T.; Lu, C.; Yu, B. Assessing the Potential Productivity of Winter Wheat Using WOFOST in the Beijing–Tianjin–Hebei Region. J. Nat. Resour. 2010, 25, 475–487. [Google Scholar]
- Wu, D.; Ouyang, Z.; Zhao, X.; Yu, Q.; Luo, Y. The Applicability Research of WOFOST Model in North China Plain. Chin. J. Plant Ecol. 2003, 27, 594–602. [Google Scholar]
- Zhang, J.; Zhao, Y.; Wang, C.; Yang, X.; Wang, J. Evaluation Technology on Drought Disaster to Yields of Winter Wheat Based on WOFOST Crop Growth Model. Acta Ecol. Sin. 2013, 33, 1762–1769. [Google Scholar] [CrossRef]
- Zhu, J. Study on Winter Wheat Irrigation Simulation in Baoding City, Hebei Province Based on WOFOST Model; Nanjing University of Information Science and Technology: Nanjing, China, 2015. [Google Scholar]
- Cho, K.; van Merrienboer, B.; Gulcehre, C.; Bahdanau, D.; Bougares, F.; Schwenk, H.; Bengio, Y. Learning Phrase Representations Using RNN Encoder-Decoder for Statistical Machine Translation. arXiv 2014, arXiv:1406.1078. [Google Scholar]
- Ren, Y.; Li, Q.; Du, X.; Zhang, Y.; Wang, H.; Shi, G.; Wei, M. Analysis of Corn Yield Prediction Potential at Various Growth Phases Using a Process-Based Model and Deep Learning. Plants 2023, 12, 446. [Google Scholar] [CrossRef] [PubMed]
- Huang, J.; Zhao, J.; Wang, X.; Jie, Z.; Zhuo, W.; Huang, R. Winter Wheat Growth Period Extraction Method Based on Remote Sensing and Accumulated Temperature. Trans. Chin. Soc. Agric. Mach. 2019, 50, 169–176. [Google Scholar]
- Pasqualotto, N.; Delegido, J.; Van Wittenberghe, S.; Rinaldi, M.; Moreno, J. Multi-Crop Green LAI Estimation with a New Simple Sentinel-2 LAI Index (SeLI). Sensors 2019, 19, 904. [Google Scholar] [CrossRef] [PubMed]
- Liu, J.; Pattey, E.; Jégo, G. Assessment of Vegetation Indices for Regional Crop Green LAI Estimation from Landsat Images over Multiple Growing Seasons. Remote Sens. Environ. 2012, 123, 347–358. [Google Scholar] [CrossRef]
- Xie, Y.; Wang, P.; Bai, X.; Khan, J.; Zhang, S.; Li, L.; Wang, L. Assimilation of the Leaf Area Index and Vegetation Temperature Condition Index for Winter Wheat Yield Estimation Using Landsat Imagery and the CERES-Wheat Model. Agric. For. Meteorol. 2017, 246, 194–206. [Google Scholar] [CrossRef]
- Stevens, F.R.; Gaughan, A.E.; Linard, C.; Tatem, A.J. Disaggregating Census Data for Population Mapping Using Random Forests with Remotely-Sensed and Ancillary Data. PLoS ONE 2015, 10, e0107042. [Google Scholar] [CrossRef]
- Wu, N.; Yan, J.; Liang, D.; Sun, Z.; Ranjan, R.; Li, J. High-Resolution Mapping of GDP Using Multi-Scale Feature Fusion by Integrating Remote Sensing and POI Data. Int. J. Appl. Earth Obs. Geoinf. 2024, 129, 103812. [Google Scholar] [CrossRef]
- Zhao, Y.; Du, X.; Li, Q.; Zhang, Y.; Wang, H.; Wang, Y.; Xu, J.; Xiao, J.; Shen, Y.; Dong, Y.; et al. Mapping and Analyzing Winter Wheat Yields in the Huang-Huai-Hai Plain: A Climate-Independent Perspective. Remote Sens. 2025, 17, 1409. [Google Scholar] [CrossRef]
- Zhang, Z.; Luo, Y.; Han, J.; Xu, J.; Tao, F. Estimating Global Wheat Yields at 4 Km Resolution during 1982–2020 by a Spatiotemporal Transferable Method. Remote Sens. 2024, 16, 2342. [Google Scholar] [CrossRef]
- Zhao, Y.; Han, S.; Zheng, J.; Xue, H.; Li, Z.; Meng, Y.; Li, X.; Yang, X.; Li, Z.; Cai, S.; et al. ChinaWheatYield30m: A 30 m Annual Winter Wheat Yield Dataset from 2016 to 2021 in China. Earth Syst. Sci. Data 2023, 15, 4047–4063. [Google Scholar] [CrossRef]
- Han, J.; Zhang, Z.; Xu, J.; Chen, Y.; Jägermeyr, J.; Cao, J.; Luo, Y.; Cheng, F.; Zhuang, H.; Wu, H.; et al. Threat of Low-Frequency High-Intensity Floods to Global Cropland and Crop Yields. Nat. Sustain. 2024, 7, 994–1006. [Google Scholar] [CrossRef]
- Deines, J.M.; Patel, R.; Liang, S.-Z.; Dado, W.; Lobell, D.B. A Million Kernels of Truth: Insights into Scalable Satellite Maize Yield Mapping and Yield Gap Analysis from an Extensive Ground Dataset in the US Corn Belt. Remote Sens. Environ. 2021, 253, 112174. [Google Scholar] [CrossRef]
- Gao, F.; Anderson, M.; Daughtry, C.; Johnson, D. Assessing the Variability of Corn and Soybean Yields in Central Iowa Using High Spatiotemporal Resolution Multi-Satellite Imagery. Remote Sens. 2018, 10, 1489. [Google Scholar] [CrossRef]
- Zhuang, H.; Zhang, Z.; Cheng, F.; Han, J.; Luo, Y.; Zhang, L.; Cao, J.; Zhang, J.; He, B.; Xu, J.; et al. Integrating Data Assimilation, Crop Model, and Machine Learning for Winter Wheat Yield Forecasting in the North China Plain. Agric. For. Meteorol. 2024, 347, 109909. [Google Scholar] [CrossRef]
- Talero-Sarmiento, L.; Roa-Prada, S.; Caicedo-Chacon, L.; Gavanzo-Cardenas, O. A Data-Driven Approach to Improve Cocoa Crop Establishment in Colombia: Insights and Agricultural Practice Recommendations from an Ensemble Machine Learning Model. Agriengineering 2025, 7, 6. [Google Scholar] [CrossRef]
Disclaimer/Publisher’s Note: The statements, opinions and data contained in all publications are solely those of the individual author(s) and contributor(s) and not of MDPI and/or the editor(s). MDPI and/or the editor(s) disclaim responsibility for any injury to people or property resulting from any ideas, methods, instructions or products referred to in the content. |
© 2025 by the authors. Licensee MDPI, Basel, Switzerland. This article is an open access article distributed under the terms and conditions of the Creative Commons Attribution (CC BY) license (https://creativecommons.org/licenses/by/4.0/).