1. Introduction
Internet of Things (IoT) devices have rapidly transformed modern agriculture, enabling precision farming, resource optimization, and automated monitoring [
1] of critical growing conditions. Temperature sensors, in particular, serve as the foundation for numerous agricultural applications, from frost protection in orchards to climate control in greenhouses, where even small deviations of 1–2 °C can significantly impair fruitset and reproductive success in crops like tomatoes [
2]. However, the widespread deployment of IoT sensors in agricultural settings introduces significant cybersecurity vulnerabilities that could compromise not only farm operations but potentially broader food supply chains [
3]. Agricultural IoT systems present unique security challenges due to their deployment in remote locations with limited physical security, constrained computational resources, and direct connection to physical processes that impact food production [
4].
Despite these critical implications, current research addressing agricultural IoT security contains three significant gaps. First, reproducibility challenges are widely acknowledged, with multiple studies [
5] noting difficulties in creating consistent testing environments. Second, the amount of research examining how sensor health anomalies might interact with security vulnerabilities, potentially masking or amplifying threats is limited. Third, real-world validation remains limited, with studies like ref. [
6] noting that “field testing across diverse agricultural environments remains challenging” and ref. [
7] acknowledging that proposed systems “require further validation in real-world farm settings”. Cost barriers further impede implementation, as highlighted by [
8], which cites financial constraints as limitations to comprehensive security solutions.
This paper addresses these research gaps by introducing a reproducible containerized testbed that simulates both cybersecurity vulnerabilities and sensor health anomalies in agricultural IoT systems. Our approach specifically focuses on demonstrating critical vulnerabilities such as Broken Object Level Authorization (BOLA) while simultaneously simulating sensor health issues that may mask or amplify security threats. The containerized design ensures reproducibility while addressing cost limitations through an entirely open-source implementation, enabling researchers to investigate the previously unexplored intersection between sensor malfunctions and security vulnerabilities in agricultural contexts.
1.1. Research Questions and Objective
Our primary research questions include:
How can containerized IoT sensor environments be effectively designed to simulate agricultural-specific cybersecurity vulnerabilities while ensuring reproducibility?
What mechanisms allow for the simulation of sensor health anomalies in agricultural IoT testbeds, and how do these anomalies interact with security vulnerabilities?
How can layered architectural approaches within containerized environments demonstrate the propagation of security vulnerabilities through agricultural IoT systems?
By addressing these questions, this research makes several novel contributions: it provides the first dedicated testbed for agricultural IoT security that incorporates sensor health simulation; it establishes a reproducible environment for security education and testing; and it explores the entirely unaddressed intersection between sensor health and security in agricultural contexts.
1.2. Related Work
The security challenges facing agricultural IoT systems have been documented across multiple studies, though often without providing practical testing environments. As noted by [
9], authentication mechanisms in agricultural sensor networks frequently lack adequate implementation, creating opportunities for unauthorized access. However, their work primarily offers theoretical security frameworks without practical validation methods. Similarly, ref. [
10] proposed a security architecture for agricultural IoT systems but acknowledges limitations in implementation validation, noting that “field testing across diverse agricultural environments remains challenging” without providing a reproducible testing approach.
1.3. Prevalence and Impact of BOLA, DDoS, and Command Injection in Agricultural IoT
The selection of BOLA, DDoS, and command injection vulnerabilities for our framework is grounded in their documented prevalence and severe impact potential in agricultural IoT deployments. The agricultural sector has become an increasingly attractive target for cybercriminals due to the consolidation of small farms into large agribusinesses with extensive digital infrastructure, creating high-value targets for threat actors seeking financial gain or seeking to disrupt critical food production networks [
11].
Broken Object Level Authorization (BOLA) represents a critical API security vulnerability where applications fail to properly verify that users have permission to access or modify specific objects or resources. Ranked as the #1 vulnerability in the OWASP API Security Top 10 [
12], BOLA occurs when attackers can manipulate object identifiers (such as database IDs or file paths) in API requests to access unauthorized data belonging to other users or entities. In agricultural IoT deployments, where numerous sensors and devices generate sensitive operational data across distributed farm operations, BOLA vulnerabilities can enable unauthorized access to soil moisture readings, temperature monitoring data, livestock tracking information, or proprietary farming techniques without proper authorization checks.
The exploitation of BOLA vulnerabilities in agricultural contexts presents particularly severe consequences due to the direct relationship between data accuracy and food production outcomes. Unauthorized data disclosure could expose sensitive information about crop yields, irrigation schedules, or competitive farming techniques to malicious actors or competitors. More critically, data manipulation through BOLA exploits could lead to incorrect agricultural decisions regarding irrigation timing, fertilization applications, or harvest scheduling, potentially resulting in crop damage and significant financial losses. Complete technical implementation details, exploitation examples, and mitigation strategies for BOLA vulnerabilities in our agricultural IoT framework are provided in the supplementary materials [
13].
DDoS attacks pose a significant threat to agricultural IoT due to the sector’s expanded attack surface and the critical nature of time-sensitive farming operations. Recent years have witnessed unprecedented DDoS attacks reaching terabit scale (1.7 Tbps and 2.3 Tbps), while agricultural IoT devices frequently lack robust security measures, making them susceptible to compromise and enlistment in botnets [
14]. The disruption of real-time monitoring systems can prevent farmers from detecting critical issues such as drought conditions or equipment failures, while attacks on automated irrigation or climate control systems can result in immediate crop damage and livestock health issues [
11].
Command injection vulnerabilities are particularly prevalent in agricultural IoT due to the widespread deployment of resource-constrained devices with limited security implementations. These vulnerabilities commonly exist in sensor firmware, irrigation management interfaces, and backend data processing systems, allowing attackers to gain unauthorized control of critical farming infrastructure [
15]. The physical consequences of successful command injection attacks in agricultural settings—such as manipulation of irrigation schedules causing crop damage or alteration of livestock feeding systems—distinguish these vulnerabilities from typical IT security concerns by creating direct pathways to agricultural productivity loss.
1.3.1. BOLA-Related Studies
The specific threat of BOLA vulnerabilities in agricultural contexts has received minimal attention in the literature reviewed in [
16], where BOLA, DDoS, and hardcoded secrets have been reviewed including countermeasures discussions. While [
17] mentions object-level authorization issues in general IoT implementations, their work does not address the specific implications for agricultural systems nor provide testing methodologies. Approaches such as smart secure solutions had been carried out; however, drawbacks or limitations in existing research on blockchain-based security schemes for smart agriculture have been raised in studies like [
18]. A similar solution with a multi-layered architecture with a smart farm layer containing IoT sensor devices has been studied in [
19]; however, the authors did not implement a dedicated IoT gateway, and instead used a home router.
1.3.2. Sensor Health and Reliability
Research addressing sensor health in agricultural systems has largely developed independently from security concerns. Ref. [
20] discussed sensor reliability challenges in agricultural settings but does not connect these issues to potential security implications. Their work acknowledges that “sensor malfunctions may lead to data irregularities” but fails to explore how such irregularities might interact with security vulnerabilities. The relationship between sensor malfunction and security vulnerability appears significantly underexplored in the literature, representing an important research gap. Based on our literature review, very few studies, if any, explicitly examined how sensor health anomalies might mask or amplify security vulnerabilities in agricultural IoT systems.
1.3.3. Testbed Approaches and Reproducibility
Reproducibility challenges constitute a significant limitation across current research. Ref. [
21] acknowledges that “reproducing vulnerability testing environments remains challenging due to the diversity of agricultural deployments”, yet offers no concrete solution to this limitation. Containerized approaches for security simulation in agricultural contexts are notably absent from the literature. Despite the growing adoption of containerization in general IoT testbeds, agricultural-specific implementations that combine security testing with sensor health simulation remain undeveloped.
1.3.4. LLM Integration with IoT Sensor Data
Despite growing interest in applying LLMs to IoT security, significant research gaps remain. Current approaches lack standardized methodologies for preprocessing sensor data into formats suitable for LLM consumption, with most studies using ad hoc conversion techniques that limit reproducibility [
22]. Additionally, researchers face challenges in providing sufficient context for LLMs to distinguish between normal sensor variability and actual security events, particularly in multi-protocol environments [
23]. The literature reveals a critical shortage of labeled datasets that combine both security vulnerabilities and health anomalies, forcing researchers to work with oversimplified scenarios that do not reflect real-world complexity [
24,
25]. Furthermore, current implementations typically treat sensor data as static inputs rather than dynamic streams, failing to leverage LLMs’ potential for temporal pattern recognition across protocol boundaries [
26]. Most significantly, existing work seldom addresses the agricultural domain’s unique characteristics, where environmental factors and seasonal patterns create distinctive challenges for anomaly detection that are not present in industrial or consumer IoT applications [
27]. These limitations highlight the need for purpose-built testbeds that can generate high-quality, contextually rich data specifically designed for LLM consumption in agricultural IoT security applications.
1.4. A Comparison Between Our Solutions and Existing Similar Solutions
As demonstrated in
Section 1.2, several IoT security testbeds and frameworks exist in the literature, yet none fully address the specific requirements for agricultural IoT security testing combined with sensor health anomaly simulation.
Table 1 presents a comparative analysis of our framework against existing solutions across key dimensions relevant to agricultural IoT security research.
Existing testbeds (e.g., SWaT, PowerCyber) primarily target industrial control, water treatment, or power grids. While Edge-IIoTset includes some agricultural sensors, it lacks domain-specific attacks and environmental context crucial for farming. Our framework uniquely addresses agriculture with realistic temperature patterns (diurnal/seasonal), crop-specific ranges, and proprietary techniques representing valuable intellectual property.
Unlike SWaT (limited data manipulation) and IoTSecSim (basic faults), our approach comprehensively integrates security vulnerabilities and specific sensor health anomalies (stuck, drift, spikes, dropouts). This is vital for understanding how sensor malfunctions can mask or amplify security threats in agriculture, where environmental data directly impacts yield. Eclipse IoT-Testware focuses on standardized IoT protocol testing, not sensor simulation.
Our framework offers complete sensor virtualization with configurable behaviors, contrasting with Edge-IIoTset, Gotham Testbed and IoTSecSim, which emphasize network behavior over sensor health. Gotham excels in network security dataset generation but not physical sensor reliability. Eclipse IoT-Testware focuses on test suite development, and FIT IoT-LAB offers limited virtualization. Our approach enables rapid prototyping and testing of diverse sensor configurations and scenarios without physical hardware, accelerating research and education.
Most frameworks implement generic vulnerabilities. Our framework implements agricultural-specific vulnerabilities, such as BOLA weaknesses exposing proprietary techniques and resource exhaustion attacks on time-sensitive monitoring. These reflect unique security concerns in smart agriculture.
While some frameworks (e.g., Gotham, FIT IoT-LAB, Eclipse IoT-Testware) offer reproducible setups, others (e.g., SWaT, PowerCyber) require specialized hardware. Our Docker-based implementation provides consistent, easily deployable environments, addressing limitations in creating consistent agricultural IoT security testing environments [
5].
While several frameworks (e.g., Edge-IIoTset, FIT IoT-LAB, Eclipse IoT-Testware) are open-source, many others have limited or no public access. Our fully open-source approach is crucial for reproducibility, education, and community-driven improvement in agricultural cybersecurity.
Our data generation explicitly distinguishes between security vulnerabilities and health anomalies, unlike Edge-IIoTset [
30] and Gotham Testbed [
31], which generate general security datasets. These structured data are vital for training AI to differentiate between malicious activity and benign failures, a gap in current agricultural IoT security research.
Our framework uniquely combines agricultural domain specificity, integrated sensor health simulation, containerized reproducibility, sensor virtualization, and LLM-ready dataset generation with open-source accessibility, comprehensively addressing the specific requirements for agricultural IoT security research unmet by existing solutions.
2. Materials and Methods
2.1. Testbed Architecture
The architecture follows a data flow pattern from environmental data generation through sensor measurement to gateway aggregation and client access, all within a containerized environment for reproducibility.
At the foundation lies the Data Server component, the “source of truth” for environmental conditions. This microservice generates realistic agricultural data reflecting diurnal cycles, seasonal variations, and crop factors. It exposes a REST API providing both raw environmental values and enriched contextual data specific to agricultural deployments. The component implements deliberate vulnerabilities, including a BOLA weakness in farm data endpoints that exposes proprietary growing techniques (see
Figure 1).
At the foundation lies the Data Server component, the “source of truth” for environmental conditions. This microservice generates realistic agricultural data reflecting diurnal cycles, seasonal variations, and crop factors. It exposes a REST API providing both raw environmental values and enriched contextual data specific to agricultural deployments. The component implements deliberate vulnerabilities (these deliberate vulnerabilities are implemented strictly for educational and research purposes in controlled environments and any use outside these contexts may have ethical and legal implications; see
Section 5 for a complete discussion of these implications), including a BOLA weakness in farm data endpoints that exposes proprietary growing techniques (see
Figure 1).
The temperature sensor layer is composed of containerized sensor instances periodically fetching data from the Data Server and publishing to the messaging system. Each sensor includes a Data Client (reference data), a simulated measurement component (controlled variations, faults), and a REST API (configuration, management). We implemented four sensor containers with diverse data formats (binary, CSV, minimal, rich JSON) reflecting real-world agricultural heterogeneity. Each sensor incorporates deliberate vulnerabilities: command injection (firmware update), resource exhaustion, and DDoS botnet participation.
Serves as the messaging backbone, employing a publish–subscribe mechanism for sensor data, mirroring the prevalent use of lightweight protocols in agricultural IoT, especially in remote, bandwidth-limited installations. The broker facilitates asynchronous communication between sensors and the gateway, enhancing resilience to connectivity issues common in agricultural environments.
Consolidates data from all sensors, performing format normalization, protocol translation, and data enrichment. A Metadata Reconstructor handles diverse sensor data formats, transforming them into a consistent representation, highlighting the necessity of managing protocol diversity while maintaining data integrity in agricultural IoT. The gateway also features a BOLA vulnerability in its user sensor access endpoint, demonstrating how architectural weaknesses can expose sensitive agricultural data.
All components are orchestrated using Docker Compose, with explicit network configuration ensuring interaction while maintaining component isolation. This enables security researchers to observe vulnerability propagation across architectural boundaries, a critical aspect in agricultural deployments spanning multiple physical locations and network segments.
This layer incorporates Prometheus and Grafana for real-time monitoring of system health and security events. This integration allows differentiation between sensor health anomalies and security-induced behaviors, addressing a key gap in agricultural IoT security research. The monitoring system provides visibility into temperature deviations, fault modes, resource utilization, and communication metrics across all layers.
Our implementation ensures extensibility through standardized interfaces defined by Open API Specification (OAS) files. This addresses the challenge of maintaining accurate documentation for complex IoT systems [
37] and provides a structured foundation for automated security analysis. Machine-readable API definitions enhance reproducibility by precisely documenting interface contracts and supplying structured inputs for automated security testing and LLM-based analysis. Each component includes corresponding OAS definitions detailing legitimate functionality and embedded vulnerabilities, enabling comprehensive and systematic security evaluation.
By implementing this layered architecture within a containerized environment, our testbed offers a reproducible platform for exploring the intersection of cybersecurity vulnerabilities and sensor health issues in agricultural IoT systems. The deliberate inclusion of vulnerable components at each architectural layer, combined with agricultural-specific data patterns and fault simulations, establishes a comprehensive environment for security testing and education in smart agriculture contexts.
2.2. Temperature Reading Data Flow Analysis
As in real-world environments, we observe different readings depending on the source of the call, as illustrated in
Figure 2. The following examples demonstrate how the same sensor (TEMP001) returns different values when accessed through different system components:
Data Server (Source of Truth): GET/environment/TEMP001 → Returns 22.5 °C;
Sensor Direct API: GET/temperature → Returns 22.8 °C (for MQTT publishing);
IoT Gateway: GET/data/TEMP001 → Returns 22.8 °C with enriched metadata;
Client via Gateway: GET/data/TEMP001 → Returns 23.0 °C;
Client via Data Server: GET/data/TEMP001 → Returns 22.5 °C.
2.3. Containerization for Reproducibility
To ensure reproducibility of our experimental results, we implemented the entire framework as a containerized application using Docker and Docker Compose. This approach provides consistent deployment across diverse environments while maintaining precise control over component interactions and resource allocation.
The multi-layered design intentionally replicates real-world agricultural IoT deployments, with data flowing from the Data Server through the Temperature Sensors and MQTT broker to the IoT Gateway (
Figure 3). This architecture enables researchers to study vulnerability propagation across architectural boundaries.
Our containerization strategy offers several key advantages for agricultural IoT security research: consistent environments with precisely defined dependencies, scalable deployment configurations, component isolation for targeted security testing, and resource controls that prevent attack propagation to host systems. The full implementation details, including container configurations and deployment instructions, are available in the supplementary materials section of our GitHub repository [
13].
A notable feature of our framework is the integrated observability stack comprising Prometheus [
38] (v3.3.1), Grafana [
39] (v12.0.0), Node Exporter [
40] (v1.9.1), cAdvisor (v0.49.1) [
41], and custom metric exporters. This infrastructure enables detection of subtle security anomalies that might otherwise go unnoticed. During security testing, the monitoring dashboards visualize the correlation between malicious activities and system behavior changes, as further detailed in
Section 2.6.
2.4. Vulnerability Implementation
2.4.1. DDoS Botnet Participation Vulnerability
In our vulnerable-by-design framework, we implemented a critical security flaw that demonstrates how compromised agricultural IoT sensors can be weaponized into botnet participants [
42]. This vulnerability represents a significant threat vector in real-world deployments, where numerous distributed sensors could be hijacked to launch attacks against critical infrastructure.
The vulnerability was implemented as a hidden API endpoint in the temperature sensor microservice that allows an authenticated user to initiate either HTTP flood or SYN flood attacks against specified targets. While not directly mapped to a CVE, it mirrors attack patterns observed in IoT botnets exploiting vulnerabilities like CVE-2023-1389 (TP-Link router command injection) [
43] and CVE-2024-41710 (Mitel phone hijacking) [
44]. Once triggered, the sensor launches a background thread that performs the attack while continuing normal temperature monitoring operations, making the malicious activity particularly difficult to detect through conventional monitoring.
When triggered, the sensor launches a background thread that performs the attack for a configurable duration while continuing normal temperature monitoring operations, making the malicious activity difficult to detect.
Our Wireshark analysis revealed distinctive network traffic patterns for each attack type. HTTP floods showed multiple requests with randomized parameters and properly established TCP connections, while SYN floods exhibited large numbers of incomplete TCP handshakes with connections remaining in SYN_RECEIVED state.
Complete implementation details, attack flow diagrams, Wireshark analysis, and security implications are described in the supplementary materials [
13].
We conducted comprehensive network traffic analysis of the different attack scenarios using Wireshark, revealing distinctive traffic patterns and protocol distributions that can serve as network-level signatures for detection.
Our experimental setup included a victim server container running Nginx, multiple temperature sensor containers participating in attacks, and Wireshark configured to capture traffic on the Docker bridge network interface with specific display filters to isolate attack traffic.
The analysis revealed several key patterns:
HTTP Flood Characteristics: Multiple GET requests with randomized HTTP headers, random query parameters, forged X-Forwarded-For headers, and properly established and terminated TCP connections.
SYN Flood Characteristics: Large number of SYN packets without corresponding ACK packets, TCP connections remaining in SYN_RECEIVED state, and no payload data transmitted after initial handshake attempts.
Command Injection Reverse Shell Patterns: Connections initiated from the sensor to the attacker, persistent TCP connections without normal HTTP request/response patterns, regular low-volume data exchange, and unusual destination ports.
Protocol Distribution Shifts: During normal operation, traffic consisted of 45.2% TCP, 28.7% HTTP, and 21.5% MQTT. During HTTP flood attacks, this shifted to 38.6% TCP, 58.9% HTTP, and 2.1% MQTT. SYN floods showed the most dramatic shift with 99.3% TCP traffic.
I/O graphs, TCP flow analyses, detailed detection recommendations, and comprehensive packet capture examples are available in the supplementary materials [
13].
This vulnerability demonstrates several key security concerns for agricultural IoT deployments:
Amplification potential: Even resource-constrained sensors can participate in damaging attacks when coordinated across a large deployment.
Dual functionality: Compromised devices continue legitimate operations while conducting attacks, making detection challenging.
Authentication weaknesses: Default credentials (admin:admin) permitted triggering the attack capability, highlighting the importance of credential management.
Operational impact: During attack execution, we observed only minimal degradation in the sensor’s primary temperature monitoring functions, further complicating detection.
2.4.2. BOLA Vulnerabilities for Agricultural IoT Sensors
Our framework implements three distinct BOLA vulnerabilities to demonstrate different aspects of this security issue in agricultural settings:
Sensor Control Endpoint Vulnerability: The temperature sensor component includes a deliberate BOLA vulnerability through its /control endpoint, which allows manipulation of critical sensor settings without proper authorization verification.
Default Credentials for Administrative Access: The framework implements a persistent authentication vulnerability by using hardcoded default credentials (admin:admin) for administrative access to temperature sensor configuration.
User Sensor Data Access Vulnerability: The IoT gateway component implements a severe BOLA vulnerability in its /users/{user_id}/sensors endpoint, exposing detailed sensor data, including proprietary agricultural information, without proper authorization checks.
The implementation includes explicitly sensitive agricultural data such as yield predictions, proprietary growth factor settings, nutrient mixing formulas, and optimal harvest windows. This data represent significant intellectual property for agricultural operations, demonstrating how API design flaws can lead to the exposure of competitively valuable information.
Detailed exploitation examples, response snippets, security implications, and mitigation strategies are available in the supplementary materials [
13].
2.4.3. Command Injection Vulnerability
We implemented a critical command injection vulnerability (CWE-77) [
45] in the firmware update API endpoint that allows attackers with administrative credentials to execute arbitrary system commands. The vulnerability stems from two implementation flaws: direct concatenation of unsanitized user input into shell commands and the use of
"shell=True" in execution functions [
12]. Our exploitation methodology followed a systematic approach: authentication, initial verification, tool installation, establishing remote access, and impact assessment. As shown in
Figure 4, we successfully demonstrated the complete attack chain, culminating in a reverse shell connection that provided interactive control of the sensor. This vulnerability enables several high-impact attack scenarios in agricultural settings, including sensor reading manipulation, data exfiltration of proprietary growing techniques, lateral movement throughout the monitoring infrastructure, denial of service affecting critical environmental monitoring, and potential ransomware deployment. Detailed exploitation steps, command examples, and extended technical analysis are available in the supplementary materials [
13].
2.4.4. Resource Exhaustion Vulnerability
Our framework implements a subtle resource exhaustion vulnerability embedded within the firmware update process of the temperature sensors. When exploited, it causes sensors to become unresponsive or significantly delayed in reporting temperature readings, which could have severe consequences in time-sensitive agricultural environments.
The vulnerability exists in the firmware update endpoint ("/firmware/update"), which processes specially crafted firmware files that trigger resource-intensive operations. The implementation introduces two key vulnerabilities:
Decompression bomb: The code accepts arbitrary compression ratios from firmware files without validation, allowing attackers to claim extreme ratios that cause excessive memory allocation.
CPU exhaustion: After allocating memory, the code performs computationally intensive hash operations on each section of the expanded data, consuming significant CPU resources.
When combined, these weaknesses allow a relatively small input file (10–50 KB) to consume gigabytes of memory and monopolize CPU resources, demonstrating the concept of a “decompression bomb” or “zip bomb” attack customized for IoT environments.
Complete implementation details, attack flow diagrams, resource consumption visualizations, and agricultural security implications are described in the supplementary materials [
13].
2.5. Automated Security Testing Using OpenAPI Specifications
Beyond manual security research, our testbed demonstrates automated security testing through the integration of OAS files with LLM-driven frameworks. We used the Karate-BOLA-Guard framework [
46] to automatically generate and execute security tests targeting BOLA vulnerabilities across our IoT components.
The framework successfully identified multiple vulnerabilities in the IoT gateway with 4/5 test cases passing verification (
Figure 5), while showing mixed results for the temperature sensor component with 1/5 tests passing (
Figure 6). This difference reflects the varying authentication mechanisms implemented across components.
Notably, the user data access vulnerability (ID_001_krtestoas_users...) was verified in just 2020 milliseconds, confirming that unauthorized access to proprietary agricultural data was possible—a critical vulnerability where such information represents significant intellectual property. Similarly, the firmware update vulnerability was verified in only 54 milliseconds, demonstrating the efficiency of automated testing compared to manual methods.
These results highlight the importance of accurate OAS documentation as a foundation for security validation in agricultural IoT systems, particularly where frequent firmware updates may undergo limited security review. Complete test execution logs, LLM inference observability reports, and additional test cases are available in the `supplementary-materials’ section of our repository [
13].
2.6. Simulating and Visualizing Sensor Faults in Agricultural IoT Environments
The deliberate implementation of security vulnerabilities described in the previous section enables controlled exploitation scenarios that generate characteristic behavioral signatures across multiple system metrics, allowing us to quantify how sensor health anomalies interact with and potentially mask these attack patterns in agricultural deployments. To systematically study these interactions, our framework implements comprehensive fault simulation capabilities that test system resilience against common sensor malfunctions in agricultural settings, enabling controlled analysis of how different fault types (stuck readings, drift, spikes, and dropouts) affect the detectability of security attacks and complicate incident response in real-world farming environments.
We model four distinct fault types commonly encountered in real-world deployments: Stuck Readings (constant value regardless of environmental changes), Drift (gradual deviation from true value), Spikes (occasional extreme values), and Dropout (complete communication failure). These fault modes are integrated directly into the sensor application code and can be activated via the REST API endpoint.
2.6.1. Dashboard Visualization and Analysis
The monitoring infrastructure provides multi-dimensional visualization of sensor behavior under various fault conditions through Grafana dashboards.
Figure 7 presents a single-sensor view that displays temperature readings from multiple sources (sensor, gateway, data server), tracks fault status over time, quantifies temperature deviations, and monitors resource utilization.
The spike fault is particularly visible in this visualization, where the temperature reading briefly exceeds 200 °C while the ground truth remains around 25 °C, demonstrating the system’s ability to capture anomalous behavior.
For network-wide monitoring, the multi-sensor dashboard (
Figure 8) provides a comprehensive view showing all sensors simultaneously. This visualization allows observation of all four fault types deployed across different sensors, with color-coded indicators (yellow for stuck, orange for drift, red for spike, green for purple for dropout) enabling quick status assessment.
The sensor metrics exposed through this visualization system (temperature readings, fault modes, request latency, failure counts, and resource usage) provide critical data for analyzing the relationship between sensor health and security vulnerabilities in subsequent sections.
2.6.2. Fault Propagation Analysis
A key benefit of our visualization is observing sensor fault propagation across system layers. Temperature comparison panels reveal: (1) Gateway Filtering: Basic filtering or smoothing occurs at the gateway, attenuating extreme sensor spikes. (2) Fault Transparency: Certain faults, like drift, propagate fully, potentially impacting downstream agricultural decision making. (3) Communication Path Dependencies: Dropout faults manifest differently based on their origin (sensor or communication path).
The framework’s fault simulation and visualization capabilities are crucial for researching the cybersecurity implications of sensor health issues in agricultural IoT. By enabling controlled introduction of realistic faults and comprehensive effect visualization, the system supports both offensive security research (exploit understanding) and defensive measures (fault detection and resilience improvement).
2.7. Dataset Generation and LLM Integration
Our framework functions as a comprehensive data factory for agricultural sensor networks, addressing the critical gap in IoT security research identified by [
47,
48]: the lack of labeled, realistic datasets that capture both security and health events. The implemented pipeline automates metrics collection via Prometheus, provides event labeling during controlled experiments, and processes data into machine-learning-ready formats.
The utilities in our
dataset-tools directory enable end-to-end data processing, handling continuous sensor metric sampling and the innovative
prepare_llm_data.py transforming collected datasets into LLM-optimized formats, including human-readable text summaries, CSV files for traditional ML, and JSONL for LLM fine-tuning. Complete implementation details and example datasets are available in the supplementary materials section of our repository [
13].
2.8. Time-Series Machine Learning Validation with LSTM
To validate the practical utility of our agricultural IoT security dataset for machine-learning-based attack detection, we implemented a Long Short-Term Memory (LSTM) neural network approach. This validation demonstrates that the data generated by our testbed can effectively train models to distinguish between normal operations and security attacks, even in the presence of sensor health anomalies.
2.8.1. Dataset Preparation and Preprocessing
We developed a comprehensive dataset containing 20,400 records (16,680 labeled and 3720 unlabeled) across various attack types and fault conditions. The dataset comprised 10,878 training sequences and 4662 testing sequences, with each sequence containing 15 time steps. The attack distribution included no_attack (15,120 records), bola (480), ddos (480), cmd_injection (360), and resource_exhaustion (240), while fault conditions were distributed across stuck (3480), drift (3480), none (3480), dropout (3240), and spike (3000).
The preprocessing pipeline focused on five key features from temperature-sensor-04: CPU usage, memory consumption, temperature deviation (sensor_true_dev), reporting interval, and temperature measurement latency. Time-series data were segmented into fixed-length sequences suitable for LSTM input, with each sequence labeled according to the presence of attack activity. This feature selection directly corresponds to the metrics identified in our detectability score computation.
2.8.2. LSTM Model Architecture
We implemented two distinct LSTM architectures to evaluate model complexity effects on detection performance:
Basic LSTM: A single LSTM layer with 64 units, followed by dropout (0.2) and dense output layers;
Enhanced LSTM: A stacked architecture with two LSTM layers (128 and 64 units), batch normalization, and increased dropout (0.3) for improved generalization.
Both models were trained using binary cross-entropy loss and the Adam optimizer, with early stopping to prevent overfitting. Training was performed using a stratified split to maintain class balance, with careful partitioning to avoid temporal data leakage between sets.
To assess the impact of sensor health on security detection capabilities, we trained separate models for each fault condition and evaluated them using stratified cross-validation. This approach allowed us to quantify detection performance variations across different sensor health scenarios, directly addressing our research question regarding the interaction between sensor faults and security vulnerabilities.
2.9. Detectability Score Calculation
To quantitatively assess attack observability under varying sensor fault conditions, we developed a composite Detectability Score (
D) that aggregates deviations across multiple system metrics. Each metric is weighted according to its importance in attack detection: CPU anomaly (40%), temperature deviation (30%), memory usage deviation (20%), and reporting interval deviation (10%). The final score is computed as:
where
,
,
, and
represent the normalized values (using min–max scaling) of CPU, temperature, memory, and reporting interval deviations, respectively. Higher scores indicate more detectable attack conditions.
For example, a command injection attack during installation phase under a drift fault condition with CPU usage increased by 198.79%, temperature deviation of 13.68%, memory usage decreased by 27.41%, and reporting interval deviation of 7.5% yields a detectability score of 0.227, indicating moderate detectability.
A complete explanation of the methodology, implementation details, and visualization techniques is available in the supplementary materials [
13].
CPU utilization (40% weight) was prioritized as the primary indicator based on our empirical observations showing substantial CPU anomalies across multiple attack types, particularly evident in the DDoS attacks (559.96% increase during event phase) and command injection attacks (125.45% during install phase and 52.94% during shell execution phase) as shown in
Table 2. Temperature deviation (30% weight) was assigned the second-highest weight due to its agricultural relevance and its dual sensitivity to both attack signatures and sensor faults (showing up to 143.97% change during command injection), making it particularly valuable for contextualizing anomalies. Memory usage (20% weight) showed moderate discriminative power (−8.54% to 1.08% variation) but less consistent patterns across attack types, justifying its intermediate weighting. Reporting interval deviations (10% weight) demonstrated the lowest overall correlation with attack behaviors in our experiments, but still provided complementary information for detecting communication anomalies, particularly during dropout conditions.
This formulation ensures consistent comparability across attack and fault scenarios. By computing D for each combination of attack type, operational phase, and fault condition, we can systematically rank the most and least detectable configurations. The detectability scores are further used to generate visualizations (e.g., heatmaps), highlighting where attack symptoms are enhanced or suppressed due to underlying sensor health conditions.
2.10. Fault Masking Methodology
We define fault masking as the phenomenon where sensor fault conditions reduce the detectability of security attacks by obscuring their characteristic signatures. Conversely, fault amplification occurs when sensor faults enhance attack detectability by creating more distinctive patterns.
To quantify these effects, we compared attack detectability under normal sensor operation versus fault conditions. For each attack type
a and phase
p, we first established baseline detectability
with no sensor faults present:
For each fault type
f, we then calculated fault-affected detectability
. The masking percentage
is calculated as:
Positive values indicate masking (reduced detectability); negative values indicate amplification (increased detectability). For example, a stuck fault reduces command injection attack detectability by 17.95% during the recovery phase.
The comprehensive methodology, including implementation code, visualization techniques, and complete findings, is available in the supplementary materials [
13].
2.11. Agricultural Use Case: Greenhouse Tomato Production
To demonstrate the real-world agricultural implications of our framework, we implemented a scenario based on commercial tomato greenhouse production. Tomatoes (
Solanum lycopersicum) are a high-value greenhouse crop with well-documented temperature sensitivity. The optimal temperature range for tomato cultivation is 20–27 °C, particularly during the fruiting stage, with temperatures exceeding 35 °C causing significant physiological stress [
2,
49].
In our demonstration scenario, we simulated a smart greenhouse monitoring system for tomatoes in the fruiting stage using our vulnerable-by-design IoT framework. The methodology followed these steps:
Normal Operation: The system correctly monitored temperatures within the optimal range (22–23 °C) for 30 s.
Environmental Change: A simulated heatwave was triggered through our data server’s event generation API, causing the greenhouse temperature to begin rising rapidly.
Attack Sequence: An attacker executed two actions:
A DDoS attack leveraging the sensor’s botnet capability, consuming compute resources;
Simultaneously activating a stuck fault condition that caused sensors to report a fixed “normal” temperature (24.51 °C).
Impact Assessment: While the sensor reported constant normal temperatures, the actual temperature continued rising, reaching a maximum of 43.0 °C—well above the critical threshold for tomato pollen viability and fruit set.
The scenario was designed to quantify agricultural impact using a yield loss model derived from horticultural research, where each minute above 35 °C reduces yield by 0.5%, up to a maximum of 30% loss [
2].
This use case demonstrates a critical vulnerability in agricultural IoT systems: the combination of security attacks and sensor faults can mask environmental conditions requiring immediate intervention, directly impacting crop production and farm profitability.
3. Results
Our experimental framework analyzed the complex interplay between security vulnerabilities and sensor health anomalies across four attack types (BOLA, command injection, DDoS, and resource exhaustion) and five fault conditions (none, stuck, drift, spike, and dropout). This section presents our findings on attack detectability, fault masking effects, and the distinctive signatures of each attack type.
3.1. Attack Detectability Patterns
Figure 9 presents a comprehensive detectability matrix showing how different fault conditions affect the detectability of various attack types and phases. The detectability scores were calculated using our normalized metric approach (Equation (
1)), which accounts for deviations in CPU usage, temperature readings, memory consumption, and reporting intervals (the detectability analysis was performed on a dataset collected from 21 to 24 April 2025, comprising 14,248 total records from temperature-sensor-04 only—while our current research focused exclusively on this single sensor type, multi-sensor research scenarios are planned as discussed in
Section 4.8). The dataset includes four attack types (BOLA, command injection, DDoS, and resource exhaustion) under five simulated fault conditions (none, stuck, drift, spike, and dropout). The datasets are available in the supplementary materials [
13].
Several key patterns emerged from this analysis:
Spike Faults Increase Detectability: Across all attack types, spike faults consistently increased detectability scores, with some combinations showing 2–8 times higher detectability compared to no-fault conditions. This amplification effect was particularly pronounced for DDoS attacks during the event phase, with a detectability score of 0.466—the highest in our dataset.
Resource exhaustion and BOLA Lowest Baseline Detectability: Resource exhaustion attacks under no-fault and stuck conditions exhibited the lowest detectability scores (0.121–0.133), and BOLA (0.161–0.169), suggesting these attack types are inherently more difficult to detect using sensor metrics alone compared to other attacks.
Command Injection Shows Progressive Signature: Command injection attacks displayed an interesting temporal progression in detectability, with scores increasing from the install phase (0.389) through shell execution (0.416) to recovery (0.443) under no-fault conditions, reflecting the changing resource utilization patterns throughout the attack lifecycle.
DDoS Attacks Show Phase-Dependent Detectability: DDoS attacks exhibited dramatic differences in detectability between phases, highest detectability for DDoS occurred in the event phase with spike fault (0.466), while the lowest was in the baseline phase with stuck fault (0.121).
3.2. Attack Signatures and Temporal Patterns
Each attack type exhibited distinctive metric patterns across its execution phases.
Table 2 summarizes these characteristic signatures based on percentage changes from baseline to active attack phases. The percentage changes in CPU, memory usage, and temperature deviation were calculated as relative differences from baseline to attack phases using the following formula:
For example, the 471.43% CPU increase during the DDoS event phase indicates that CPU usage was 4.7143 times higher than during baseline conditions.
The most striking signatures include:
Command Injection’s Progressive CPU Escalation: Command injection attacks showed a distinctive three-phase CPU usage pattern, increasing from 125.45% during installation to 52.94% during shell execution, then increasing again to 125.69% during recovery. This non-linear pattern creates a unique temporal signature that differs from other attacks.
DDoS’s Dramatic CPU Spike: DDoS attacks exhibited the most dramatic CPU increase (559.96%) during the event phase, creating a sharp, distinctive spike that quickly subsided during recovery (5.92%). This pattern reflects the intensive computational resources used during active attack execution.
Resource Exhaustion’s Temperature Suppression: Resource exhaustion attacks uniquely reduced temperature deviations by 61.64% during the event phase, with continued suppression (54.95%) during recovery. This distinctive signature suggests resource constraints forced sensors to report less variable (more homogeneous) temperature readings.
BOLA’s Subtle Footprint: BOLA attacks showed minimal changes across all metrics, with the highest change being only 11.49% in CPU usage during the event phase and 52.42% during recovery. This subtle signature explains BOLA’s lower detectability scores and highlights the challenges in identifying this particular vulnerability.
3.3. Fault Masking and Amplification Effects
One of our most significant findings is the complex relationship between sensor faults and attack detectability.
Figure 10 visualizes these interactions, revealing both masking effects (where faults reduce attack detectability) and amplification effects (where faults increase attack detectability Masking and amplification percentages were calculated using Equation (
3). Positive values indicate masking (reduced detectability), while negative values indicate amplification (increased detectability). For example, a 13.5% masking effect means detectability decreased by approximately one-eighth compared to no-fault conditions. Values of 100% (for both masking and amplification) represent cases where the effect exceeded this threshold and were capped for visualization purposes.
Several counter-intuitive patterns emerged from this analysis:
BOLA Detection Amplified by Spike Faults: Surprisingly, spike faults significantly amplified BOLA detectability rather than masking it. Spike faults increased BOLA detectability by 95.9% in the baseline phase, 66.5% in the event phase, and 57.2% in the recovery phase. This unexpected amplification contrasts with conventional wisdom that sensor faults generally mask attack signatures.
Command Injection Shows Mixed Effects: Command injection exhibited the most varied fault interactions, with both masking and amplification effects depending on the fault type and attack phase. During the install phase, drift faults masked detection by 13.8% while spike faults amplified detection by 25.3%. This mixed response creates a complex detection landscape for security monitoring systems.
Dropout Faults Mask Command Injection Recovery: Dropout faults had a notable masking effect (13.5%) on command injection during the recovery phase, the strongest masking effect observed for this attack type. This demonstrates that intermittent sensor failures can particularly obscure the final stages of command injection attacks.
DDoS Universally Amplified: All fault types amplified DDoS detection across all phases, with spike faults producing the strongest amplification effects ranging from 57.6% to 100%. This robust amplification suggests that DDoS attacks create such distinctive patterns that they become even more apparent when sensors are malfunctioning.
3.4. Metric Contribution Analysis
To understand which system metrics contribute most significantly to attack detection under different fault conditions, we analyzed the weighted contributions of each metric to the overall detectability score.
Figure 11 shows these contributions for all attack types.
As shown in the figure, each attack type exhibits distinctive metric contribution patterns. For BOLA attacks, temperature deviation dominates under spike faults, contributing significantly to the increased detectability. Command injection attacks show strong temperature deviation signals during shell and recovery phases, with CPU usage being prominent during installation. DDoS attacks exhibit phase-dependent signatures, with CPU usage being key during the event phase (559.96% increase) and temperature deviation driving recovery phase detection. For resource exhaustion attacks, temperature deviation is the primary indicator, showing significant suppression during both event (−61.64%) and recovery (−54.95%) phases.
Key findings from this metric analysis include:
CPU Usage Dominates DDoS Detection: CPU usage consistently provides the strongest signal for DDoS attacks, contributing significantly to detection through a dramatic 559.96% increase during the event phase. This reflects the intensive computational demands of distributed denial of service execution.
Temperature Deviation Critical for Multiple Attacks: Temperature deviation contributes disproportionately to detection scores for command injection (showing 143.97% increase during shell phase) and resource exhaustion (showing 61.64% decrease during event phase). This metric proves especially valuable under spike fault conditions, explaining the strong amplification effect of spike faults on overall detectability.
Memory Usage Signals Resource Exhaustion: During resource exhaustion event phases, memory usage provides a distinctive signature with a 5.82% decrease. While the change appears modest, it represents a consistent pattern that contributes to detection.
Reporting Interval Least Useful: Across all attack–fault combinations, reporting interval consistently contributed the least to detection (showing 0% change in many cases), suggesting this metric has limited utility for agricultural IoT security monitoring despite its weighting in our model.
3.5. Dataset Generation and Analysis
Our framework successfully generated structured, labeled datasets combining both security vulnerabilities and sensor health anomalies. The generated dataset included 4995 records spanning multiple attack types, fault conditions, and operational phases. Although we designed the data structure to support future LLM integration, our current research utilized these datasets through conventional analysis methods.
The data generation pipeline produced multiple formats (JSONL, CSV, and raw JSON) to maximize compatibility with various analysis tools. We developed Jupyter notebook scripts to process these datasets, enabling statistical analysis, correlation identification, and visualization generation. The plots, correlation analyses, and heatmaps presented throughout this paper were derived from these datasets using these analytical scripts, demonstrating the practical utility of our framework’s data generation capabilities even without direct LLM application.
This approach establishes a foundation for future LLM-based analysis while providing immediate value through traditional data science techniques, revealing the patterns and relationships discussed in our findings.
3.6. LSTM-Based Attack Detection Performance
Our time-series machine learning validation demonstrates that LSTM networks can effectively leverage the agricultural IoT security dataset generated by our testbed to detect attacks, even in the presence of sensor faults.
Table 3 summarizes the detection performance across different fault conditions (these results are based on the Enhanced LSTM Model with Multiple Layers, which achieved 0.9513 accuracy compared to the basic model’s 0.9719 accuracy).
As can be seen in
Figure 12, LSTM validation revealed several key findings that corroborate and extend our earlier detectability analysis:
Fault Impact Variability: Detection accuracy varied significantly across fault conditions, with the highest performance observed under drift faults (97.49%) and the lowest under dropout faults (92.40%). This 5.09 percentage point difference highlights how sensor health conditions substantially impact security monitoring effectiveness.
Precision–Recall Tradeoff: The models maintained high precision (especially under drift conditions at 98.21%) but moderate recall (56.53% for drift), indicating a conservative detection approach that minimizes false alarms (1.04% false positive rate) at the cost of missing some attacks. This balance is particularly important in agricultural settings where false alarms could trigger unnecessary interventions affecting crop health.
Attack–Fault Interaction: Our analysis revealed significant variations in detectability across different attack types and fault conditions. Command injection attacks combined with drift faults showed the highest detectability score (0.9109), while BOLA attacks under spike fault conditions were completely undetectable (0.0000). This striking difference demonstrates how certain fault types can either amplify or completely mask specific attack signatures.
When analyzing detection performance by attack type, DDoS attacks were the most consistently detectable (average score: 0.69) across all fault conditions, while resource exhaustion attacks proved most challenging to detect (average score: 0.30). This finding contrasts with our earlier static detectability analysis, suggesting that temporal patterns in sensor data reveal different signatures than point-in-time metrics.
3.7. Tomato Greenhouse Attack Simulation Results
The tomato greenhouse scenario demonstrated how security vulnerabilities and sensor health anomalies can interact to create significant agricultural impacts.
Figure 13 illustrates this interaction by showing both reported and actual temperature values throughout the simulation.
During normal operation, the sensor correctly tracked the greenhouse environment, with reported and actual temperatures closely aligned and remaining within the optimal range for tomato cultivation. When the heatwave began, the sensor initially continued accurate reporting as temperatures rose above 35 °C, potentially triggering automatic alerts or ventilation systems in a real greenhouse.
However, once the DDoS attack was initiated and the stuck fault activated, a critical divergence occurred. While the sensor consistently reported 24.51 °C (within the optimal range), actual greenhouse temperatures continued rising, reaching a maximum of 43.0 °C. This represents a difference of 18.49 °C between reported and actual conditions—a potentially catastrophic error in a commercial greenhouse environment.
Based on agricultural research on temperature sensitivity during tomato flowering and fruit set [
2,
49], our model calculated a 0.6% yield reduction during this brief simulation. In a commercial setting, where such attacks might go undetected for hours or days, yield impacts could be substantially higher. For context, a 15–30% yield reduction in a medium-sized commercial greenhouse operation (1 hectare) growing premium tomatoes (premium tomatoes are generally varieties prized for their superior flavor, aroma, appearance, and often their uniqueness or heirloom status; they tend to command higher prices in the market due to these qualities) could represent economic losses of USD 75,000–150,000 per growing cycle [
50,
51,
52,
53].
While our primary research focuses on how sensor faults affect security attack detectability, this scenario demonstrates a complementary dimension: how security attacks combined with sensor faults can mask critical environmental conditions, leading to quantifiable crop losses. This represents a practical application of our framework in agricultural risk assessment.
Our earlier findings indicate that stuck faults reduce DDoS attack detectability during the recovery phase, suggesting that not only would the temperature increase go undetected, but the security breach itself would be more difficult to identify, further increasing agricultural risk.
4. Discussion
4.1. Addressing Literature Gaps
The deliberate incorporation of security vulnerabilities and health anomalies in IoT sensor environments creates unique opportunities for ML and LLMs in cybersecurity research. As noted by Omar et al. [
54], the quality and structure of training data significantly impacts the performance of AI systems in security contexts. Our testbed addresses this need by generating systematic, labeled datasets that capture both normal operations and anomalous behaviors across multiple dimensions:
Security vulnerabilities: The testbed’s implementation of BOLA vulnerabilities, hardcoded credentials, and command injection vectors creates reproducible attack patterns that can be captured in structured logs.
Health anomalies: The simulation of sensor faults (stuck readings, drift, spikes, and dropouts) generates distinctive patterns that ML algorithms can learn to differentiate from security-induced anomalies.
Protocol-specific data: By implementing both HTTP REST API and MQTT protocols, the testbed generates multi-protocol data streams that reflect real-world IoT deployments.
Current literature reveals a significant gap in the availability of high-quality, labeled datasets that combine both security events and health anomalies in IoT sensors. Gholami [
55] emphasizes that LLMs require context-rich, annotated examples to effectively understand the nuanced differences between malicious activities and benign anomalies. Our containerized approach addresses this gap by:
Creating precisely labeled ground truth data where each anomaly’s cause (security breach vs. health issue) is known with certainty;
Generating time-series data that maintain temporal relationships between events;
Providing multi-layered data representing the complete stack from sensor to gateway to client;
Enabling reproducible scenarios that can generate virtually unlimited training examples.
A key innovation in our approach is the systematic generation of labeled data that maps directly to common cybersecurity scenarios. This addresses limitations identified by Anitha et al. [
22] regarding the disconnect between theoretical security models and practical training exercises.
4.2. Combined Impact of DDoS and BOLA Vulnerabilities
The combination of DDoS and BOLA vulnerabilities in agricultural IoT systems creates a particularly dangerous attack surface with compound effects. An attacker could first exploit BOLA vulnerabilities to gather intelligence about the system architecture, sensor deployment, and proprietary growing techniques. This reconnaissance phase would provide valuable targeting information for subsequent DDoS attacks, allowing the attacker to focus on the most critical sensors or gateway components.
4.3. Implications of LSTM Detection Performance
The LSTM validation results provide crucial insights at the intersection of sensor health and security monitoring in agricultural IoT systems, with several important implications for practical deployments.
Our findings show that detection accuracy varies by 5.09 percentage points depending on sensor fault type, ranging from 92.40% with dropout faults to 97.49% with drift faults. This variation directly challenges the common practice of using fault-agnostic security monitoring thresholds. This suggests that effective agricultural IoT security systems should incorporate dynamic thresholds that adjust based on detected sensor health conditions.
The particularly strong performance under drift conditions (97.49% accuracy, 98.21% precision) is especially noteworthy for agricultural deployments, as sensor drift represents a common degradation pattern in long-term field installations. Rather than degrading security monitoring as might be intuitively expected, drift faults appear to create more distinguishable patterns that enhance attack detection. This counterintuitive finding suggests that some forms of sensor degradation may actually improve security monitoring by making attack signatures more distinct from normal operations.
The substantial variation in detection performance across attack types—from relatively good detection of DDoS attacks (average score: 0.6886) to poor detection of resource exhaustion attacks (average score: 0.3056)—highlights the need for attack-specific detection strategies. This finding contrasts with our static detectability analysis, which identified DDoS and Command injection as highly detectable based on point-in-time metrics.
This discrepancy reveals an important insight: attack detectability in time-series analysis differs fundamentally from static analysis. While resource exhaustion creates significant deviations in individual metrics, its temporal pattern may be easily confused with normal operational variations. Conversely, DDoS attacks create distinctive temporal signatures that LSTM models can more readily identify despite smaller individual metric deviations.
The observed precision–recall tradeoff (high precision of 98.21% but moderate recall of 56.53% under drift conditions) demonstrates a conservative detection approach that minimizes false alarms at the expense of potentially missing some attacks. With a false alarm rate of just 1.04%, this approach would be well-suited to agricultural environments where unnecessary interventions could disrupt critical operations. However, the ability to detect only 56.53% of actual attacks indicates that LSTM-based detection should be complemented with other security measures to provide comprehensive protection.
The observation that our basic LSTM architecture outperformed the enhanced stacked model (97.19% vs. 95.13% accuracy) contradicts the typical assumption that deeper neural networks yield better results. This finding has practical implications for resource-constrained agricultural IoT deployments, suggesting that lightweight models may provide both computational efficiency and superior performance for certain attack detection tasks.
This result indicates that the temporal patterns of many attacks in agricultural IoT systems manifest as relatively simple sequential anomalies that may be obscured by the additional complexity of deeper neural networks. For practical implementations, this supports the deployment of simpler models that could potentially run directly on gateway devices rather than requiring cloud-based processing.
4.4. Practical Implications of Masking and Amplification in Agricultural Monitoring
The concepts of fault masking and amplification have direct practical implications for agricultural IoT security monitoring. Understanding these effects is crucial for developing effective security systems that can distinguish between sensor health issues and genuine security threats.
To illustrate these concepts in practical agricultural terms, consider two scenarios in a commercial greenhouse monitoring system:
Masking Scenario—Command Injection with Dropout Fault: An attacker exploits a command injection vulnerability to manipulate greenhouse climate controls, gradually increasing temperature to damage heat-sensitive crops like lettuce. Simultaneously, a dropout fault causes the temperature sensors to intermittently fail, creating gaps in monitoring data. The irregular sensor readings make it difficult for automated monitoring systems to distinguish between legitimate sensor malfunctions and the malicious temperature manipulation. Our analysis shows this combination reduces attack detectability by 13.5%, potentially allowing the attack to continue undetected until visible crop damage occurs.
Amplification Scenario—BOLA Attack with Spike Fault: An attacker exploits BOLA vulnerabilities to access proprietary growing algorithms and harvest timing data from a premium tomato operation. Under normal conditions, this data exfiltration might go unnoticed as it does not directly affect physical operations. However, a concurrent spike fault in temperature sensors creates erratic readings that trigger additional system monitoring and logging. The combination of unusual API access patterns with the heightened monitoring state makes the unauthorized access 95.9% more detectable than under normal sensor conditions.
These examples demonstrate that sensor faults do not uniformly degrade security monitoring. Instead, the interaction between fault type and attack characteristics can either obscure threats (masking) or inadvertently enhance their visibility (amplification).
4.5. Agricultural Security Implications
The tomato greenhouse scenario (
Section 3.7) illustrates how our work extends beyond theoretical security research to address practical challenges in modern agriculture. When viewed through an agricultural lens, our findings revealed several critical considerations:
Event Chains with Physical Consequences: Unlike general IT security breaches that might result in data loss, agricultural IoT breaches create event chains that directly impact biological systems. Our scenario demonstrated the specific pathway: DDoS attack → sensor fault → undetected heatwave → temperature stress → yield reduction.
Economic Translation of Security Vulnerabilities: The scenario quantifies security risk in agricultural business terms (yield reduction) rather than technical metrics. This translation is particularly valuable for agricultural stakeholders making security investment decisions.
Temporal Constraints in Agricultural Systems: The simulation highlights how time-sensitive agricultural interventions are, particularly in controlled environment agriculture. Unlike many cybersecurity contexts where recovery can be addressed post-breach, biological damage from environmental excursions may be irreversible once the critical threshold is crossed.
Multi-system Integration Challenges: Modern agricultural operations integrate environmental control, irrigation, nutrient delivery, and monitoring systems. Our scenario demonstrates how security frameworks must consider not just individual sensor reliability but the interaction between security status and environmental conditions.
These findings suggest that agricultural IoT security requires specialized approaches that integrate both security monitoring and sensor health assessment. We propose that effective agricultural security systems should not treat these as separate concerns, but instead implement unified monitoring that can detect subtle divergences between reported and expected values across multiple system dimensions.
4.6. Open-Source and Accessibility Considerations
Our fully open-source implementation provides significant advantages for research reproducibility, educational accessibility, and cost-effectiveness in cybersecurity training. Unlike hardware-based approaches such as [
28,
29] that require specialized equipment, our Docker-based framework can be deployed on commodity hardware with minimal resource requirements, democratizing access to agricultural IoT security testing for institutions with limited budgets. Additionally, the modular architecture with clearly defined interfaces facilitates community contribution and extension, enabling researchers to add vulnerability types, sensor implementations, or monitoring tools without requiring comprehensive understanding of the entire system.
4.7. Limitations
While our framework provides a comprehensive environment for studying agricultural IoT security, several limitations should be acknowledged. Our implementation focuses primarily on temperature sensors, whereas real-world deployments incorporate diverse sensor types including soil moisture, humidity, and nutrient sensing, limiting generalizability to broader agricultural IoT ecosystems.
Our detectability metrics use per-attack normalization with fixed weights (0.4, 0.3, 0.2, 0.1) that may overstate the importance of metrics with naturally lower variability and exclude network-level features critical for detecting attacks like BOLA. Future work should explore dynamic weighting schemes that adapt to specific attack profiles and agricultural conditions, potentially incorporating machine learning techniques to determine optimal weights.
The simulated fault types (spike, drift, stuck, dropout) were injected under controlled conditions and do not capture the more complex, hybrid behaviors or fault transitions found in real-world sensors. Additionally, while our framework implements REST APIs and MQTT, it does not support agricultural-specific protocols like LoRaWAN and Zigbee, which represent important security vectors in production deployments.
Our implementation deliberately omits certain production environment components (reconnaissance capabilities, encryption layers, hardware-specific features) to focus on known, reproducible vulnerabilities. Finally, our work lacks external validation against ground-truth data from real-world agricultural deployments or established intrusion detection systems. Detectability values should, therefore, be interpreted as relative indicators rather than absolute measures of security efficacy.
4.8. Future Research Directions
Based on our experimental results, and acknowledged limitations, we identify four key areas for future work:
Future research should explore how LLMs could leverage the multi-dimensional temporal signatures that we identified to improve security monitoring. The distinctive patterns of command injection and DDoS attacks provide rich contextual information that could help distinguish between sensor anomalies and security threats. Integration with visualization platforms could correlate sensor health anomalies with security events, addressing the compound effects identified in our research.
While our LSTM validation demonstrates the utility of our dataset for time-series attack detection, we acknowledge the limitation of not comparing against alternative machine learning approaches. LSTM was selected for its established suitability to sequential data and proven performance in IoT anomaly detection [
56]. Future work should include systematic evaluation against Support Vector Machines, ensemble methods (Random Forest, Gradient Boosting), transformer models, and traditional anomaly detection approaches (Isolation Forest, One-Class SVM). Such comparative studies would establish performance benchmarks across different attack types and fault conditions, identify optimal detection architectures for specific agricultural scenarios, and provide practical guidance for security practitioners selecting detection methods based on deployment constraints and threat requirements. This research direction is particularly important given the resource limitations typical of agricultural IoT deployments, where computational efficiency and detection accuracy must be carefully balanced.
Incorporating agricultural-specific protocols (LoRaWAN, Zigbee) and architectural components (edge processing, cloud analytics) would increase real-world representativeness. Kubernetes orchestration would enable scaling to larger simulated deployments with hundreds of sensors, supporting research into distributed, low-intensity attacks that might go unnoticed in smaller testbeds.
Developing complex fault models that combine multiple fault types or exhibit temporal progression would provide deeper insights into real-world sensor behavior. Field validation alongside actual agricultural sensors would verify our findings against authentic conditions, potentially revealing interaction patterns not captured in our controlled experiments.
Expanding our framework to incorporate diverse sensor types beyond temperature represents a critical research direction for enhancing real-world applicability. Future work should implement soil moisture, humidity, light intensity, and nutrient level sensors alongside temperature monitoring to better reflect authentic agricultural deployments. This multi-sensor approach would enable investigation of cross-sensor attack vectors, where vulnerabilities in one sensor type potentially create cascading effects across the monitoring infrastructure. Of particular interest is whether attack signatures manifest differently across various sensor types and whether certain sensors exhibit greater vulnerability to specific attack patterns. For instance, soil moisture sensors with slower sampling rates might demonstrate different detectability patterns for DDoS attacks compared to temperature sensors, while nutrient sensors handling more complex data structures could present unique BOLA vulnerability profiles. Additionally, multi-sensor deployments would allow research into correlation-based detection techniques that leverage expected relationships between environmental parameters (e.g., temperature and humidity correlation) to identify suspicious deviations that might indicate coordinated attacks targeting multiple sensing modalities simultaneously.
Perhaps most promising is the potential for what we could describes as “self-evolving security datasets” through bidirectional interaction between LLMs and the testbed. Rather than functioning as passive consumers of security data, as we saw in other work [
57], LLMs could become active participants—proposing new vulnerability combinations, generating hypotheses about attack vectors, and analyzing results through a structured API. This approach addresses the limitation of static datasets that fail to capture emerging threat patterns, potentially identifying novel attack patterns before they manifest in real-world environments.
6. Conclusions
This research introduced a vulnerable-by-design framework for agricultural IoT security testing and explored the intersection between sensor health and security vulnerabilities, revealing counter-intuitive relationships that challenge conventional assumptions about fault effects on security monitoring. Our tomato greenhouse scenario demonstrated how this intersection can directly impact agricultural productivity, with security vulnerabilities and sensor faults combining to mask critical environmental conditions that could reduce crop yields by up to 30% in commercial greenhouse operations.
Our LSTM-based validation demonstrated that machine learning approaches can effectively use our testbed’s datasets to differentiate between normal operations and security attacks in agricultural IoT sensors, even with various fault conditions present. The moderate average recall for actual attacks (0.5473), combined with a strong precision (0.8285), confirms our framework’s utility for generating realistic training data for security monitoring systems. The significant variation in detection performance across attack types reinforces our finding that different attack vectors create distinct signatures in sensor telemetry, with DDoS attacks being the most consistently detectable (avg. score: 0.6886) while resource_exhaustion attacks are more difficult to detect (avg. score: 0.3056).
6.1. Addressing Research Questions
Our work directly addressed the three key research questions, with findings that significantly contribute to agricultural IoT security research.
RQ1—Containerized agricultural IoT testbed design: We demonstrated that containerized environments can effectively simulate agricultural-specific vulnerabilities through a multi-layered architecture that implements distinct vulnerability classes at each system level. Our Docker-based implementation achieved full reproducibility across deployment environments while maintaining realistic sensor telemetry patterns specific to agricultural contexts (temperature cycles, humidity patterns, and growth-stage variations).
RQ2—Sensor health anomaly simulation: Our implementation of four distinct fault types (stuck, drift, spike, and dropout) revealed unexpected interactions between sensor health and security metrics. Based on our masking analysis (Equation (
3)), spike faults amplified attack detectability by up to 100% across multiple attack scenarios—contrary to the conventional expectation that faults would mask security events. This counterintuitive finding suggests controlled sensor variability might actually enhance rather than degrade security monitoring capabilities.
RQ3—Vulnerability propagation through layered architecture: Our layered approach demonstrated how vulnerabilities propagate through agricultural IoT systems, revealing distinctive multi-phase attack signatures. These include non-linear CPU utilization patterns in command injection attacks (125.45% → 52.94% → 125.69%) and the sharp resource utilization profile of DDoS attacks (559.96% CPU increase during the event phase, dropping to 5.92% during recovery). These temporal signatures provide a foundation for developing specialized detection models for agricultural environments.
6.2. Key Contributions and Future Directions
Our research has successfully addressed the posed research questions, yielding several key contributions. We established a containerized testbed design for agricultural IoT security (RQ1) that effectively balances realism with reproducibility. Our quantification of the relationships between sensor health anomalies and security vulnerabilities (RQ2) revealed the surprising finding that certain fault types can amplify rather than mask attack signatures. Through our layered architectural approach (RQ3), we demonstrated how vulnerabilities propagate through agricultural IoT systems and identified distinctive temporal patterns that characterize different attack types across fault conditions.
These findings lead to practical security implications: comprehensive monitoring requires multiple context-specific metrics, fault conditions must be considered when establishing detection thresholds, and sensor health data can enhance rather than complicate security monitoring when properly integrated. Our open-source, reproducible testbed provides a foundation for future agricultural IoT security research.
Future work should explore LLM-enhanced detection leveraging the temporal signatures we identified, expand to agricultural-specific protocols like LoRaWAN and Zigbee, and develop self-evolving security datasets through bidirectional interaction between testbeds and AI systems. A detailed exploration of these directions appears in
Section 4.8.
In conclusion, our framework has revealed complex interactions between sensor health and security vulnerabilities in agricultural contexts that challenge conventional security monitoring approaches. By providing an open-source implementation with systematic dataset generation capabilities, our work not only addresses reproducibility challenges but also suggests novel approaches to security monitoring that leverage rather than simply account for sensor variability in agricultural IoT deployments.


 ,
, 
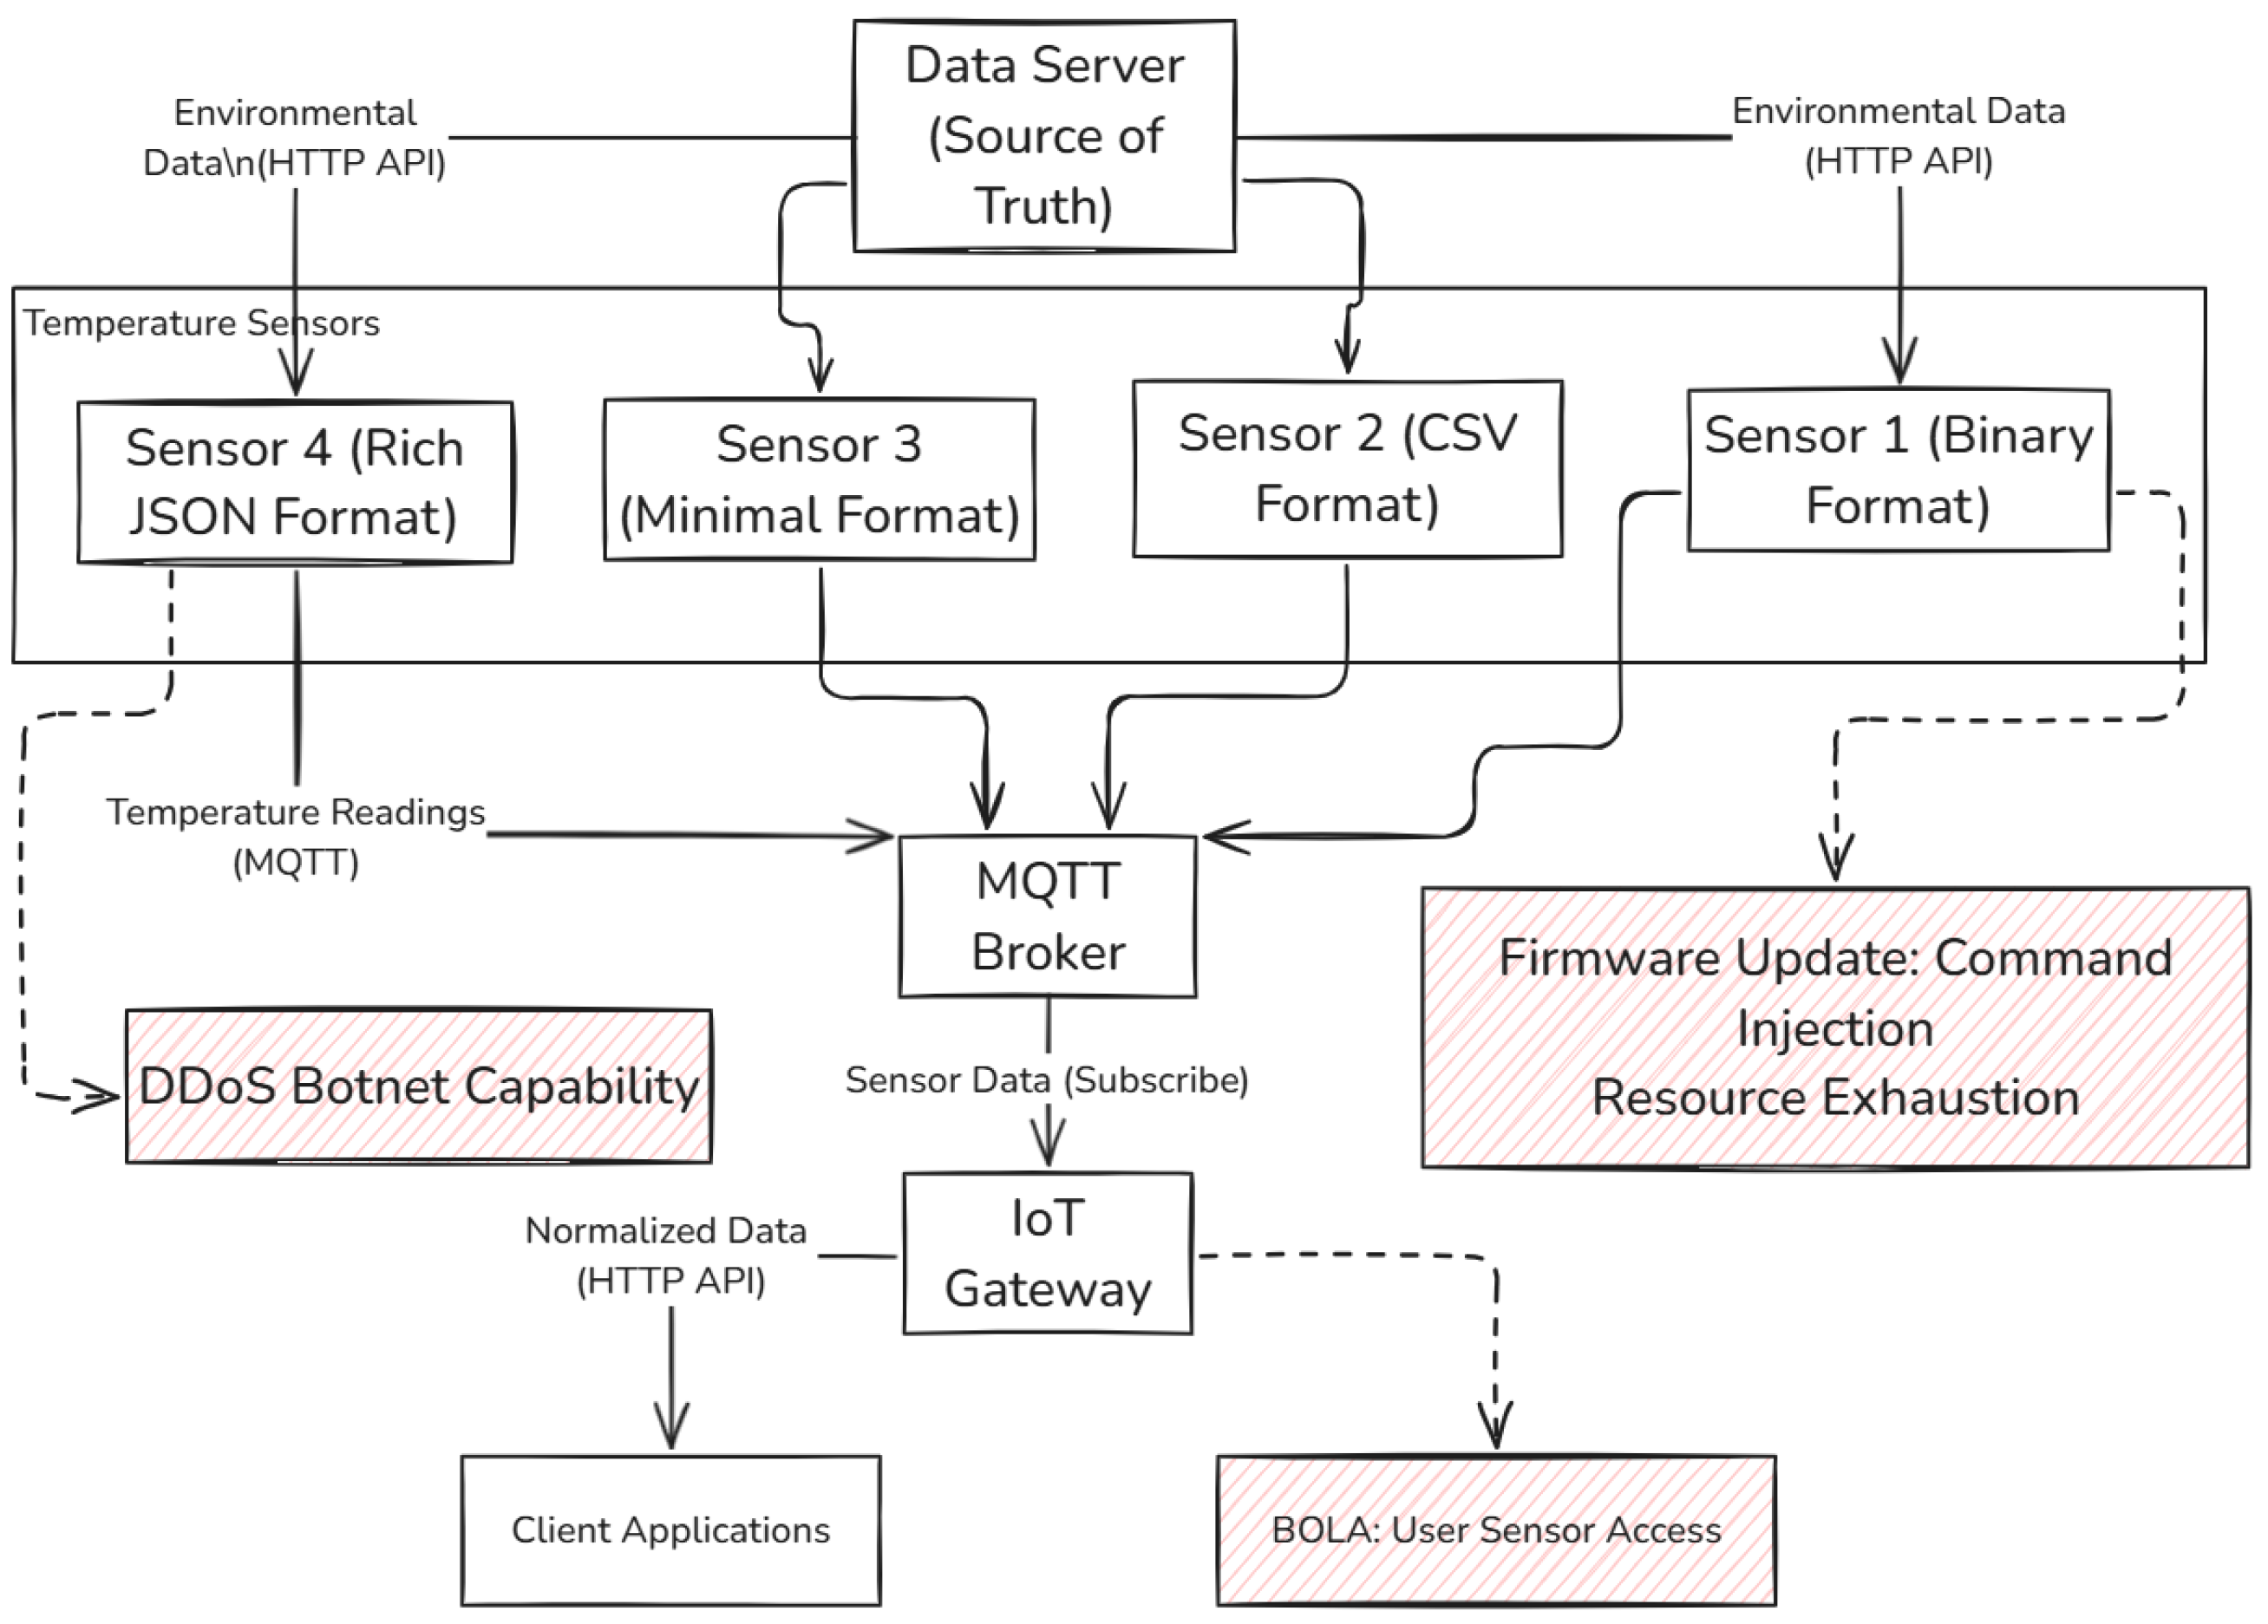
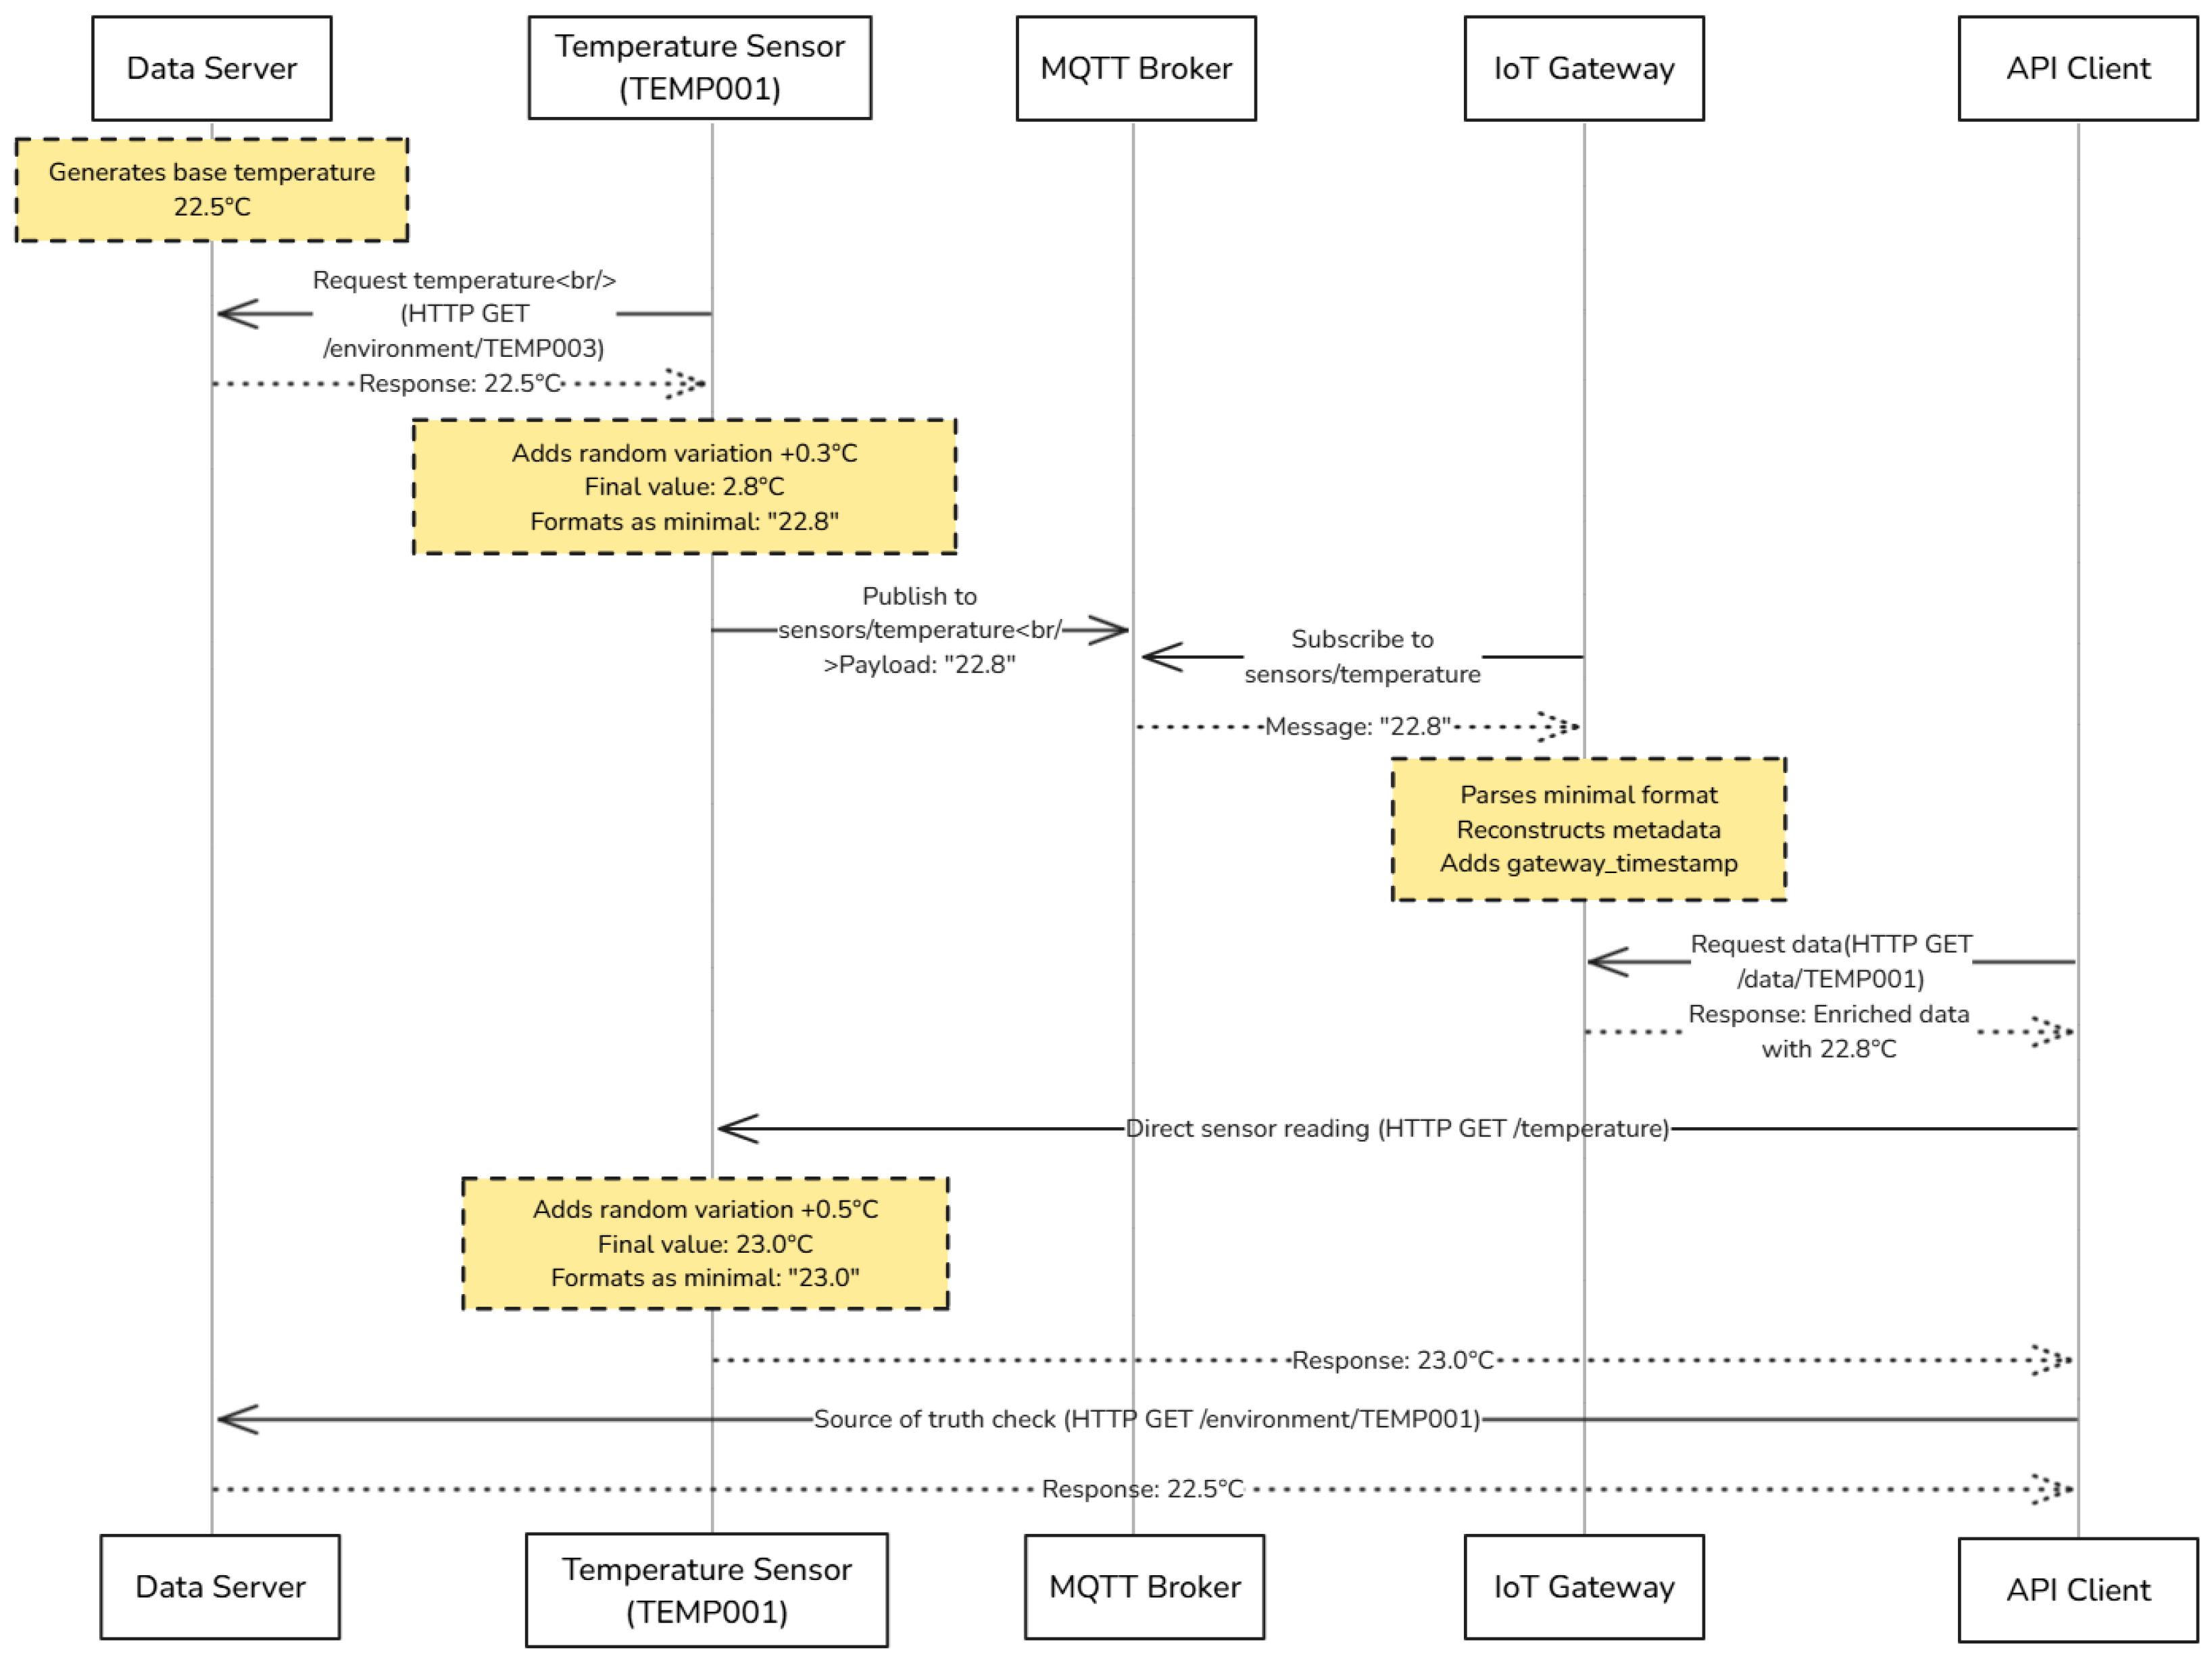
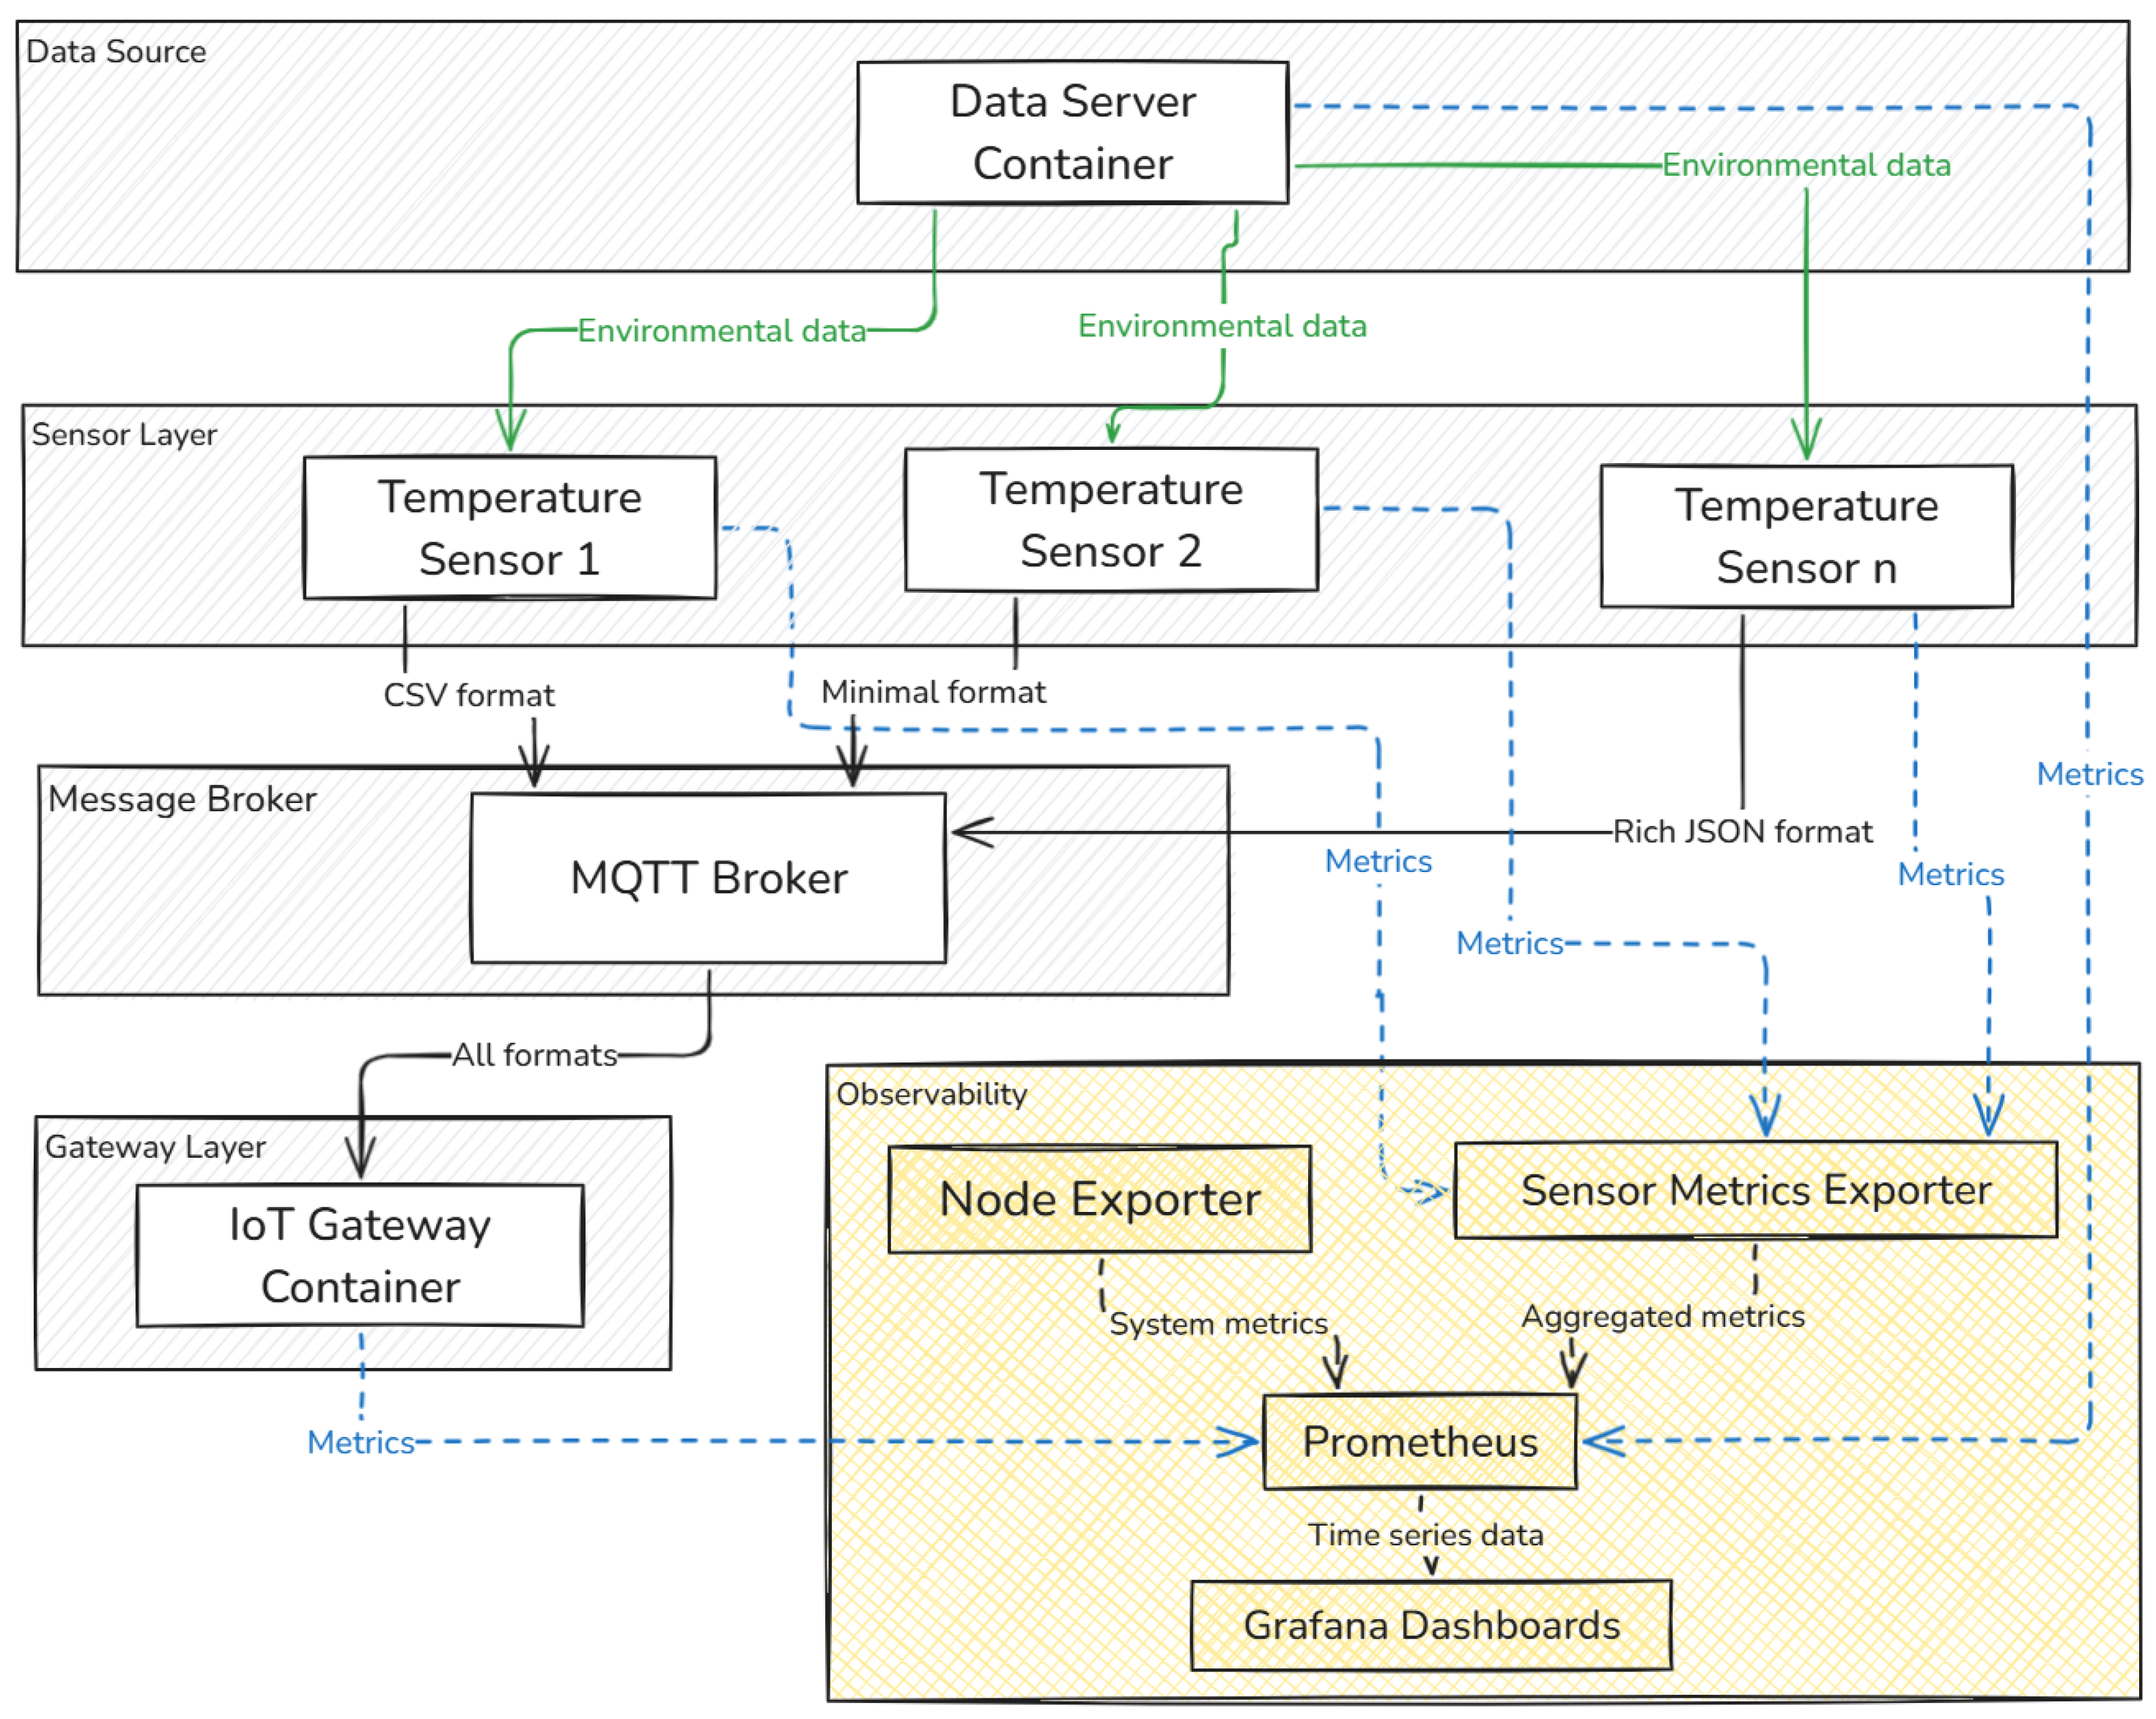
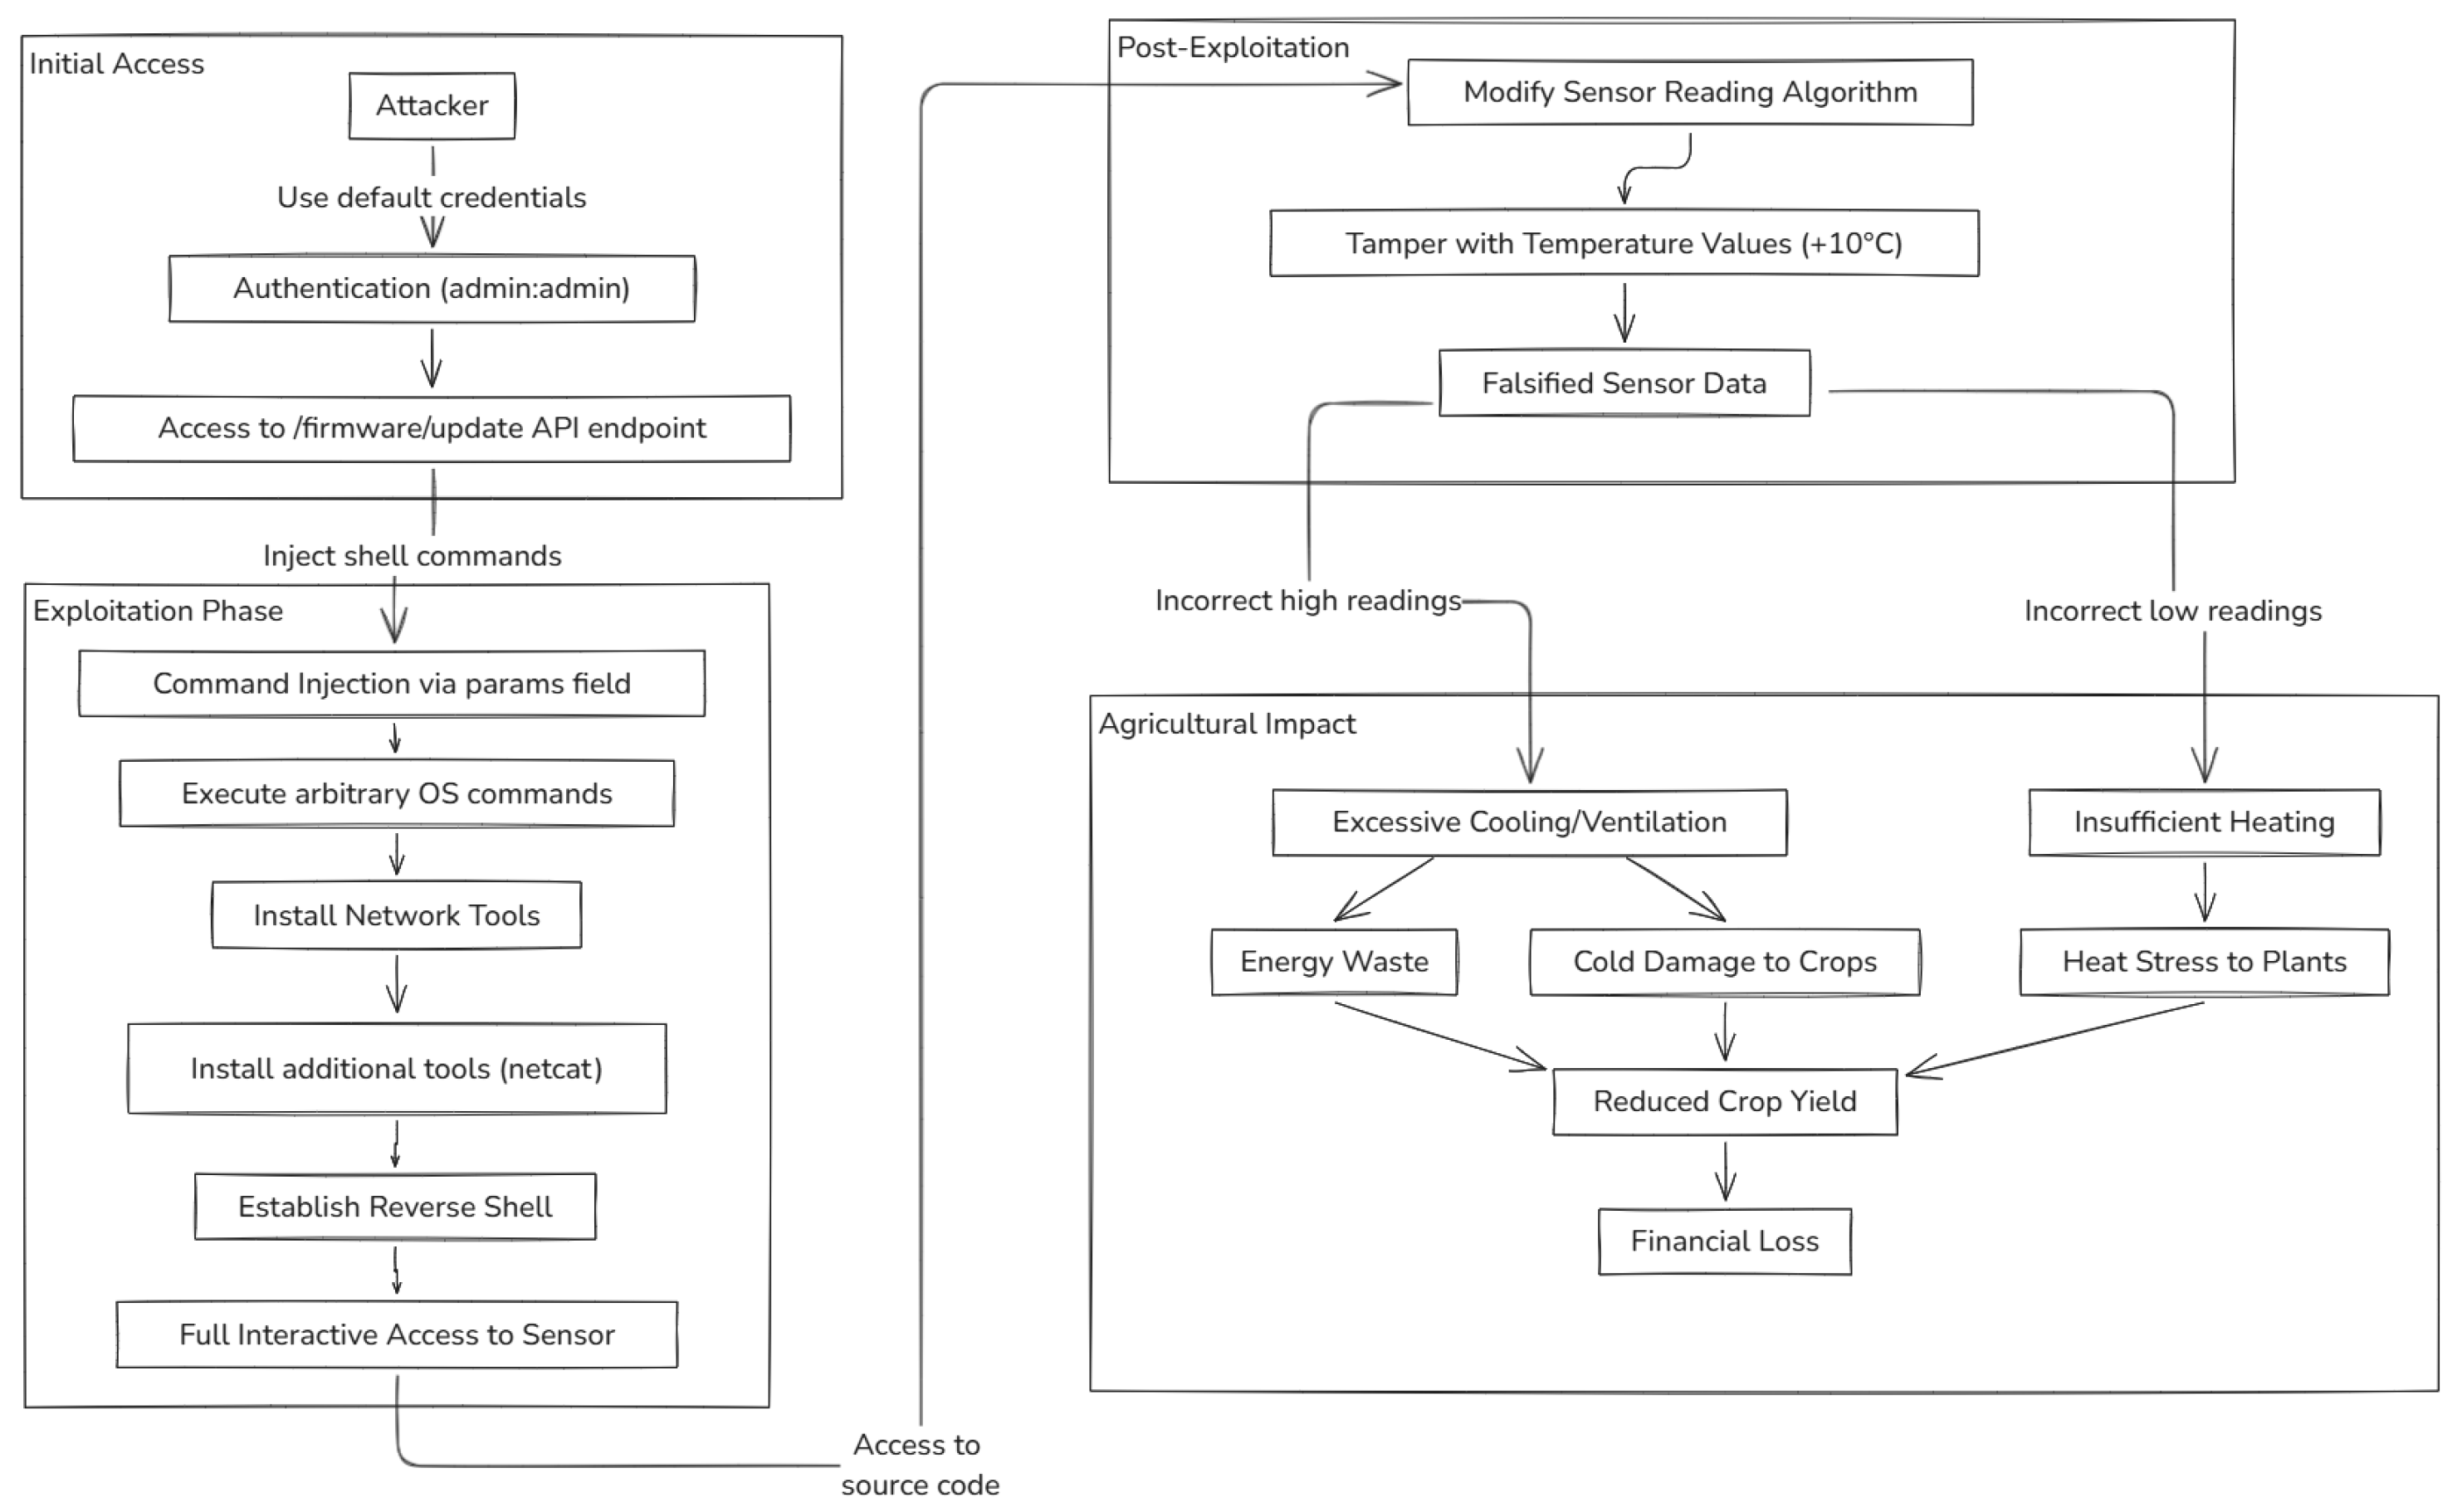
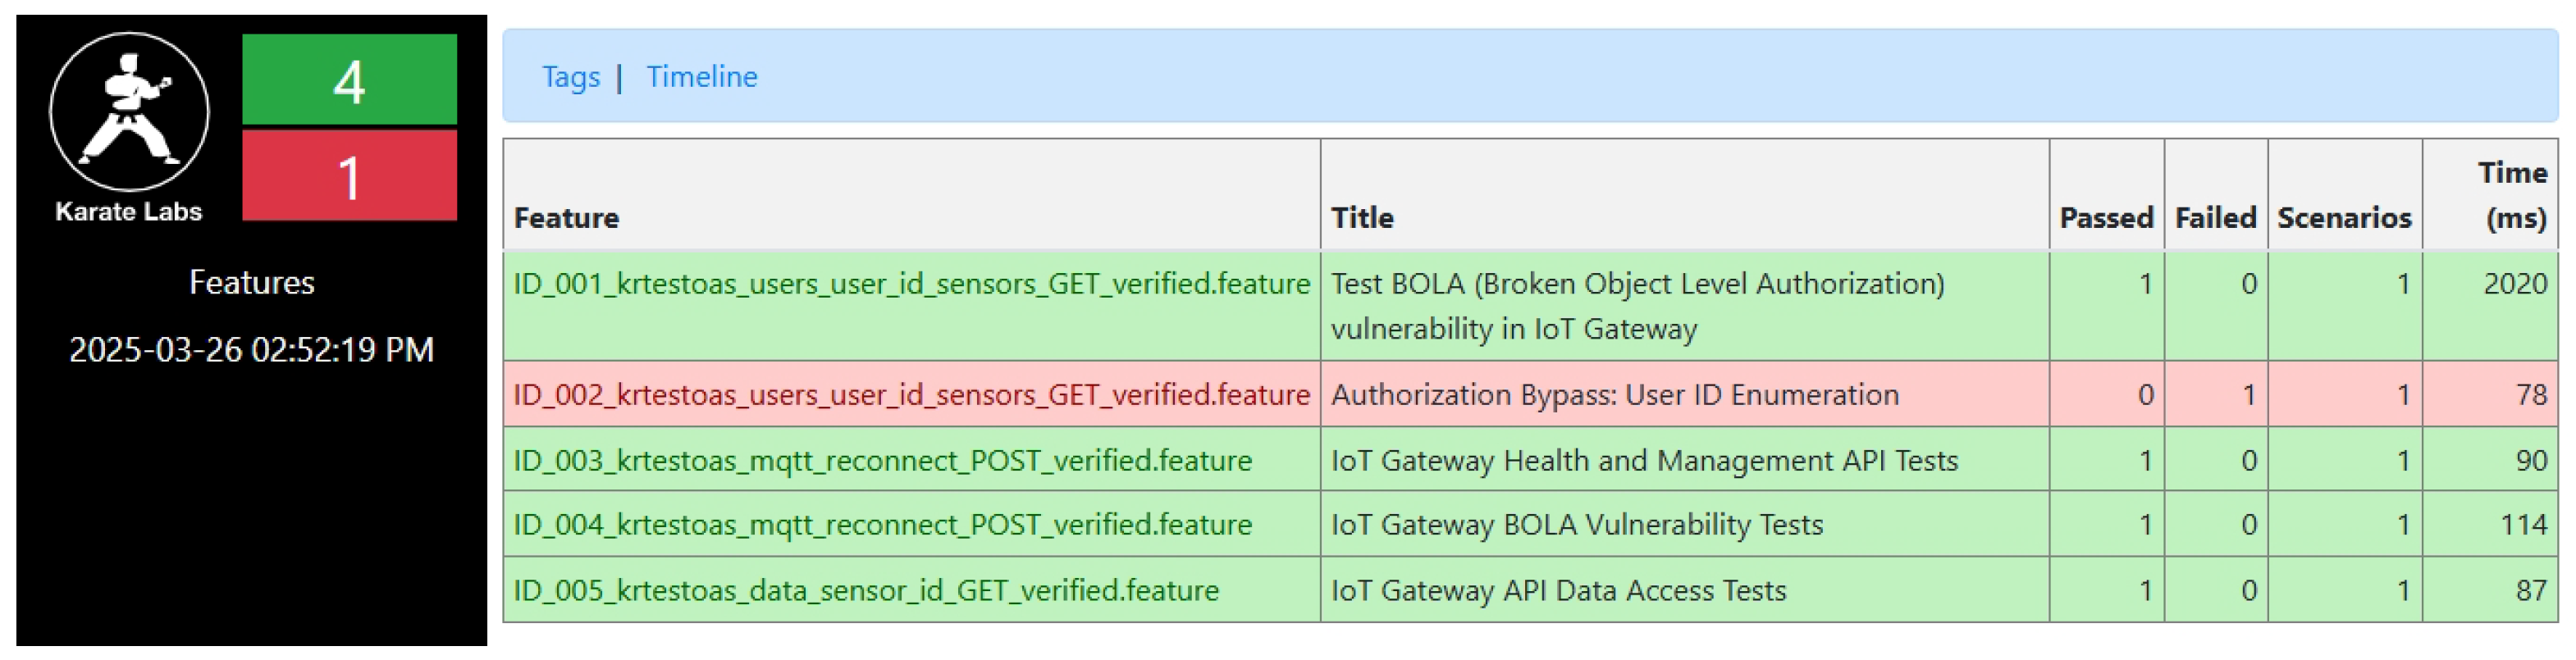
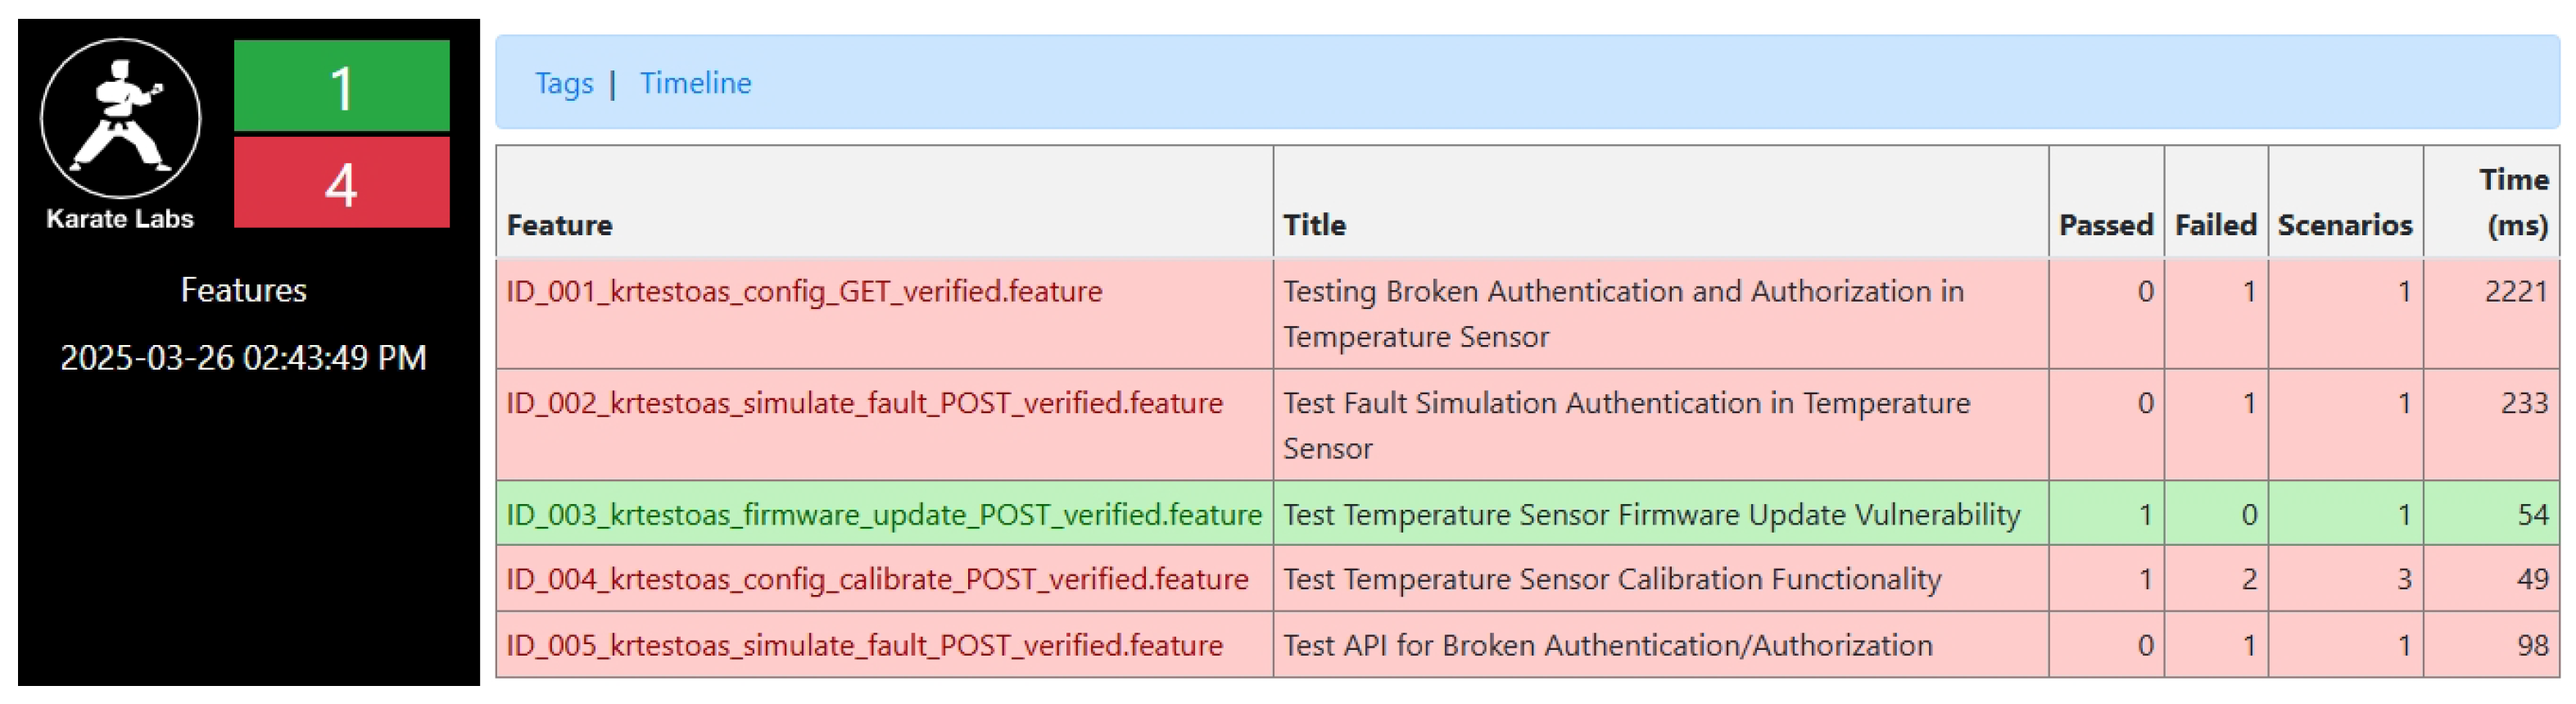
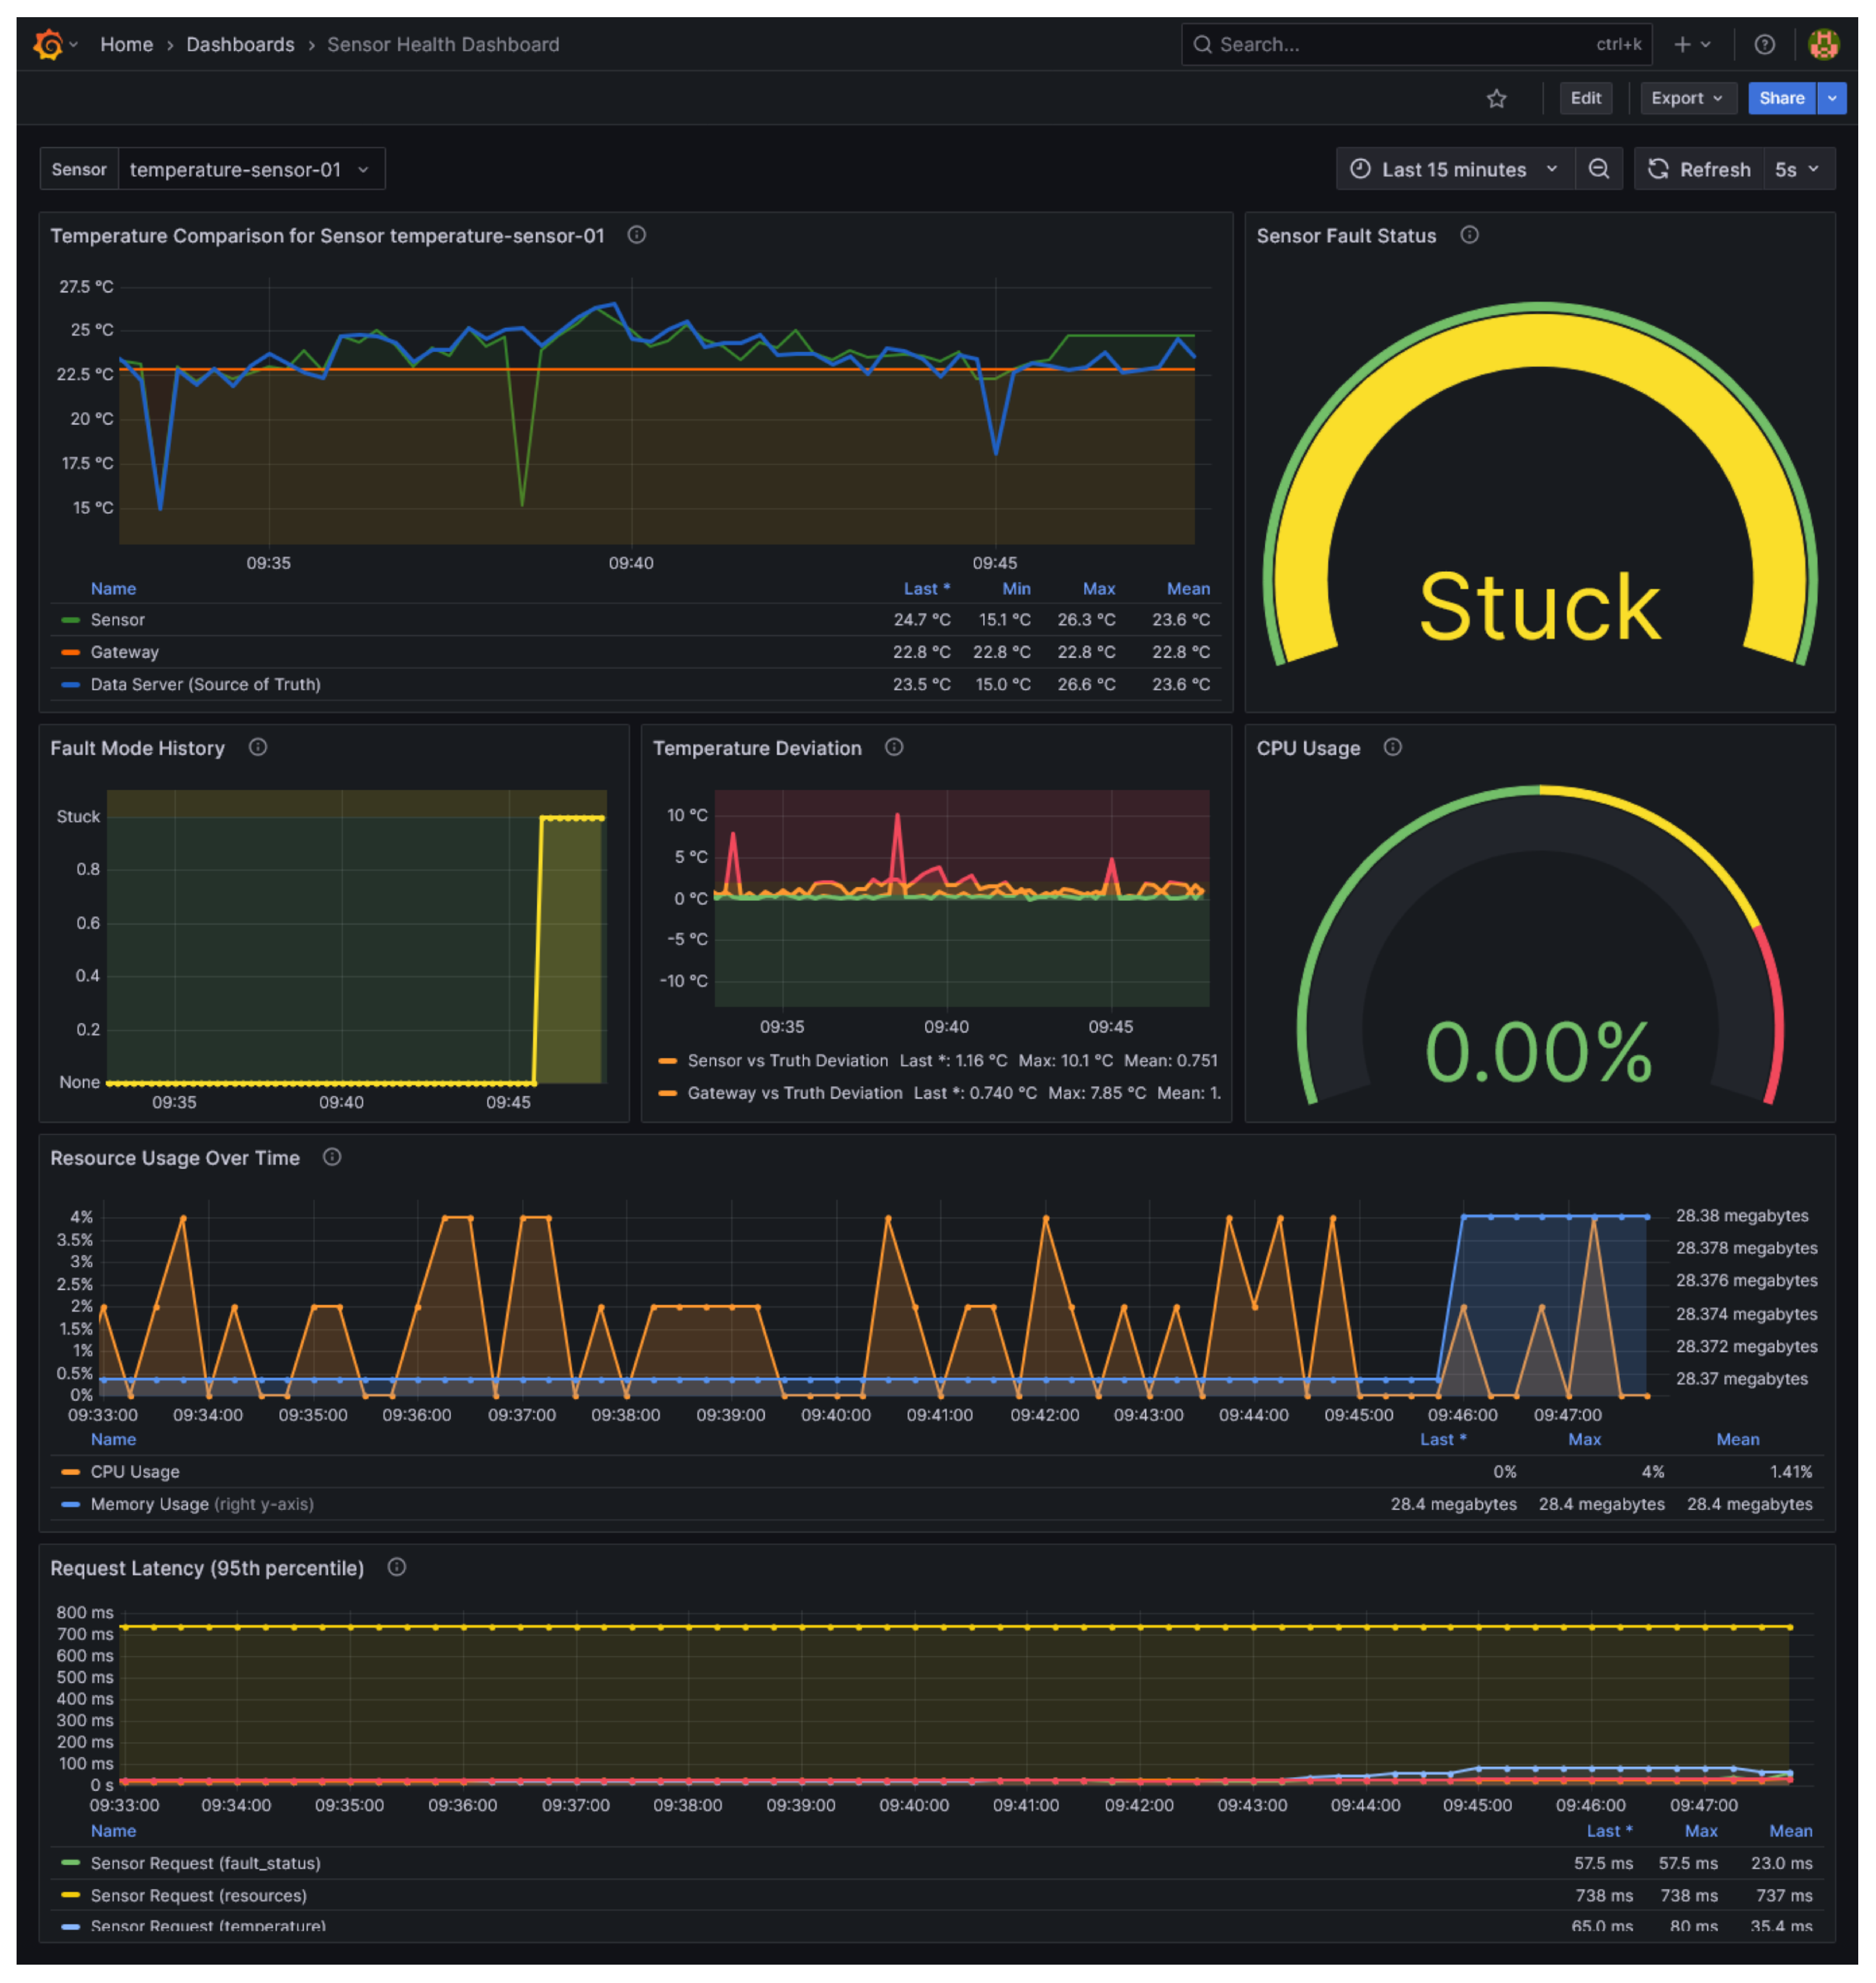
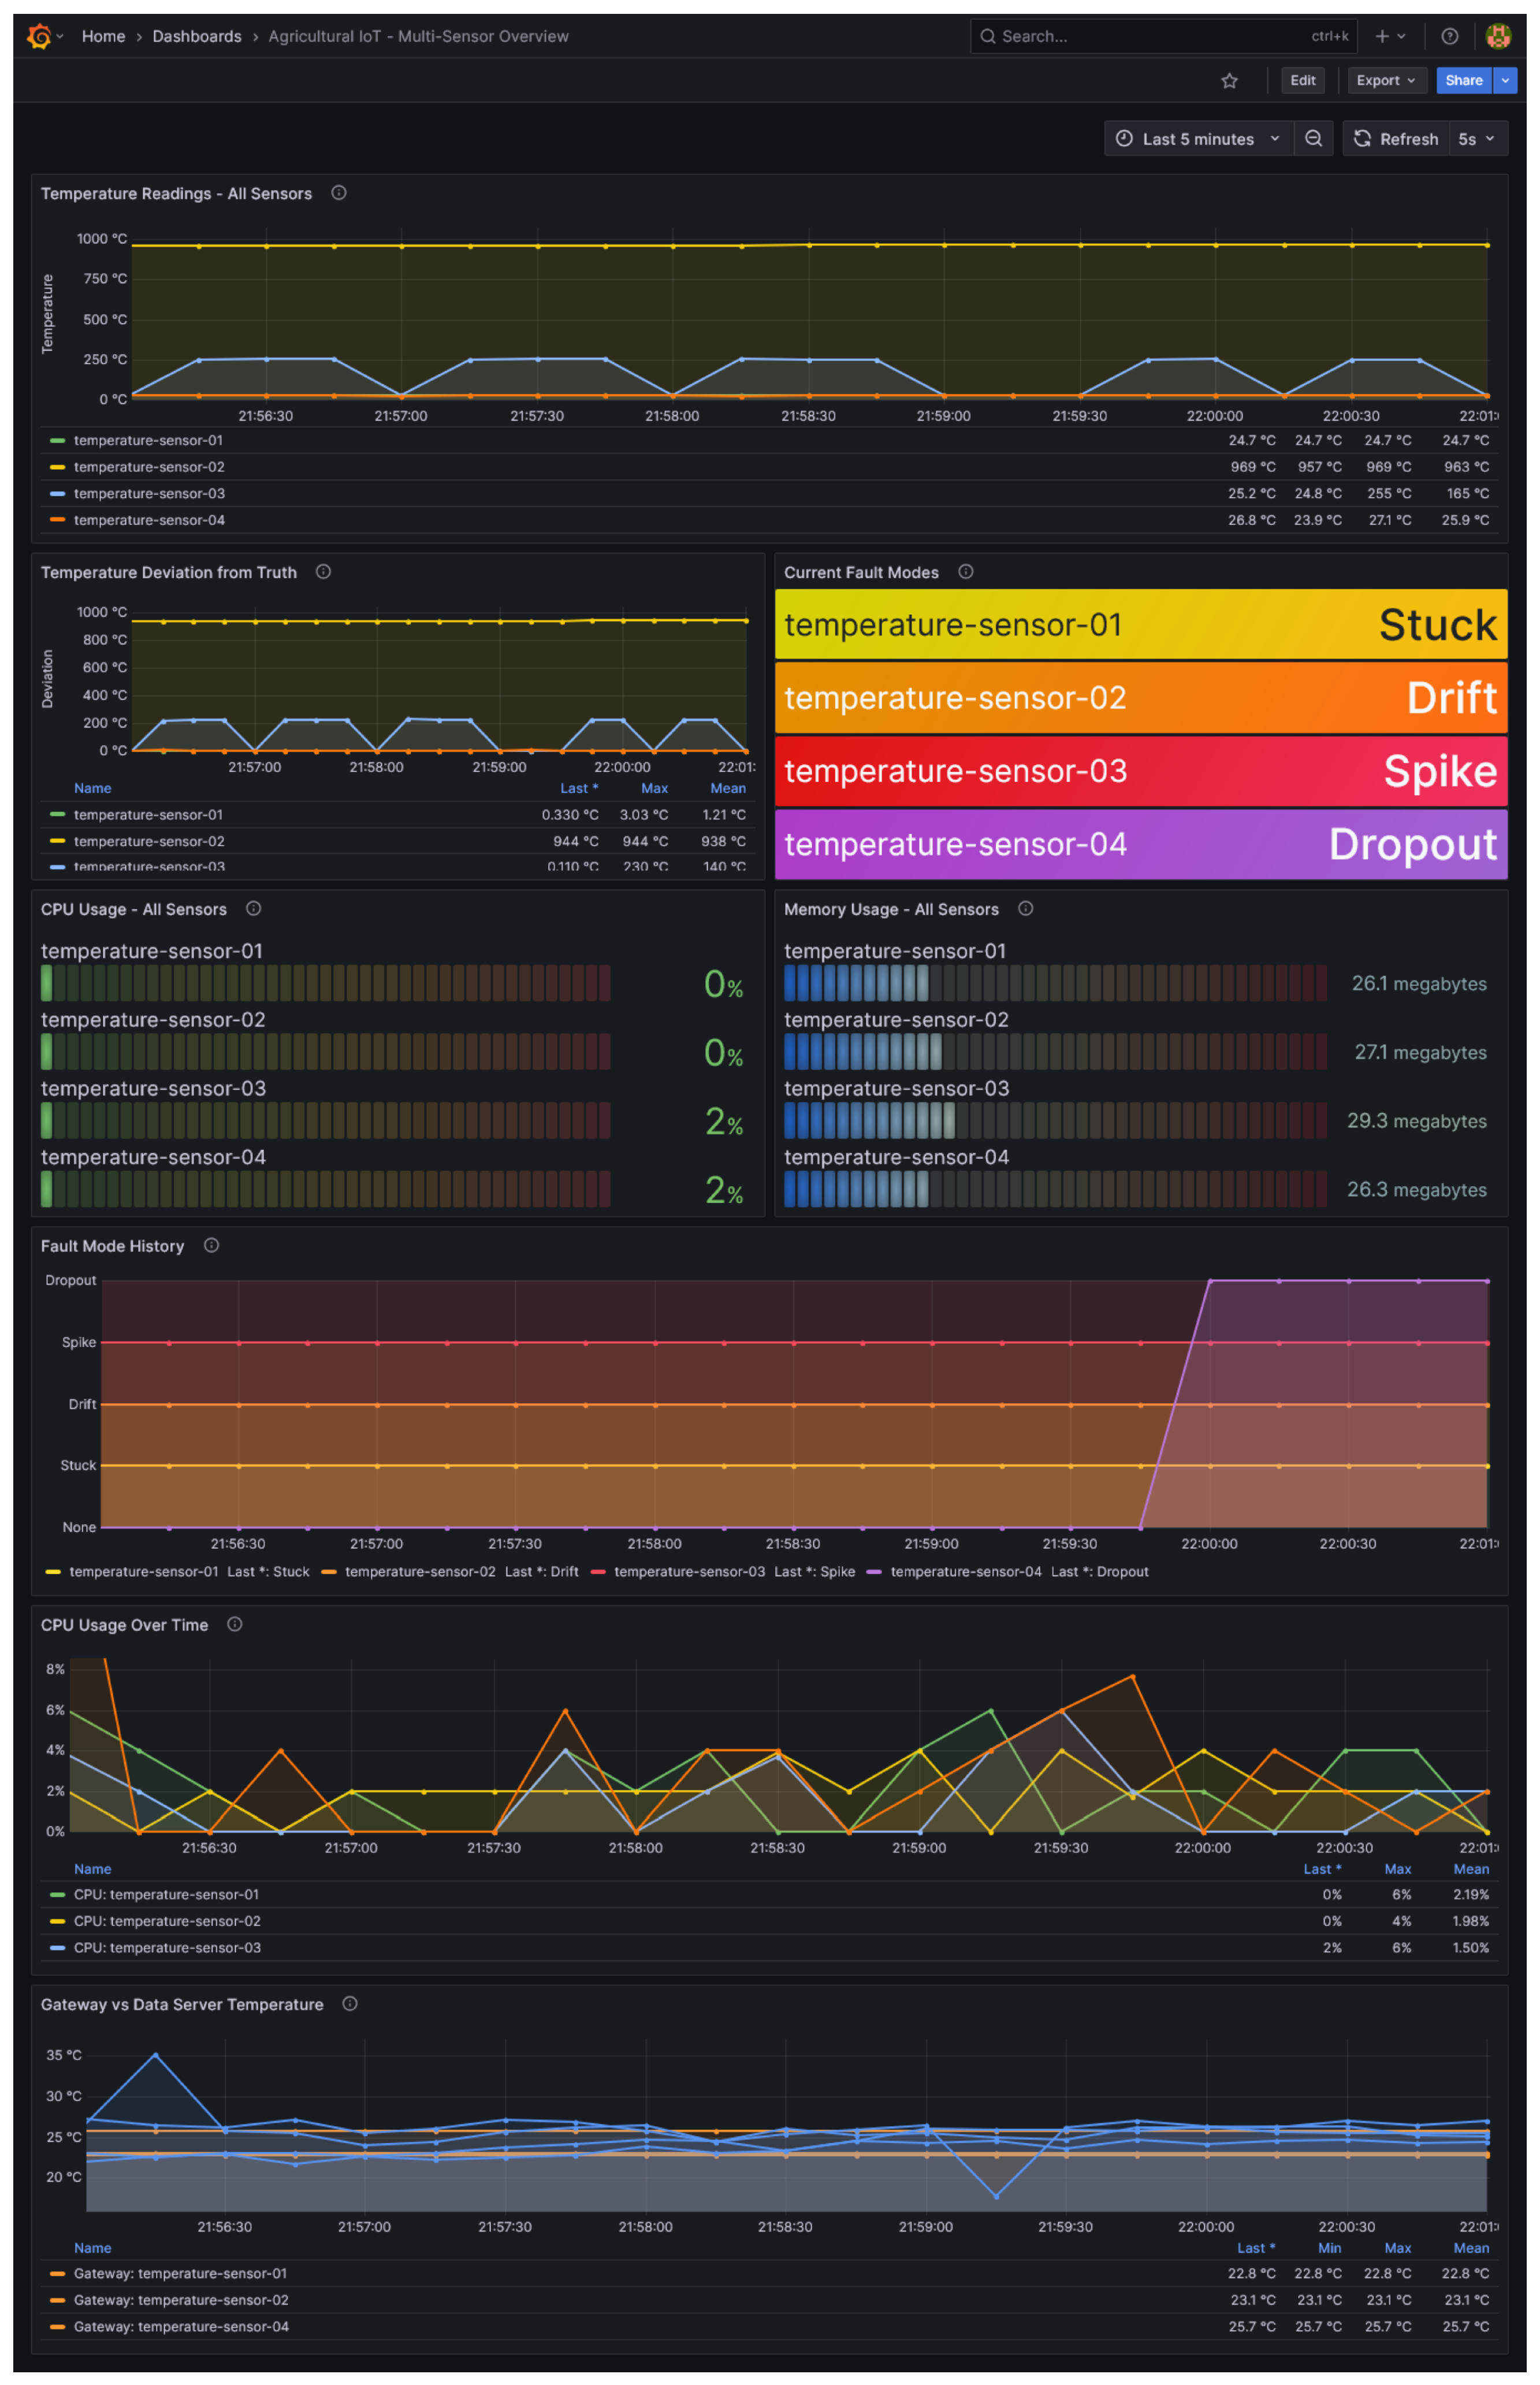
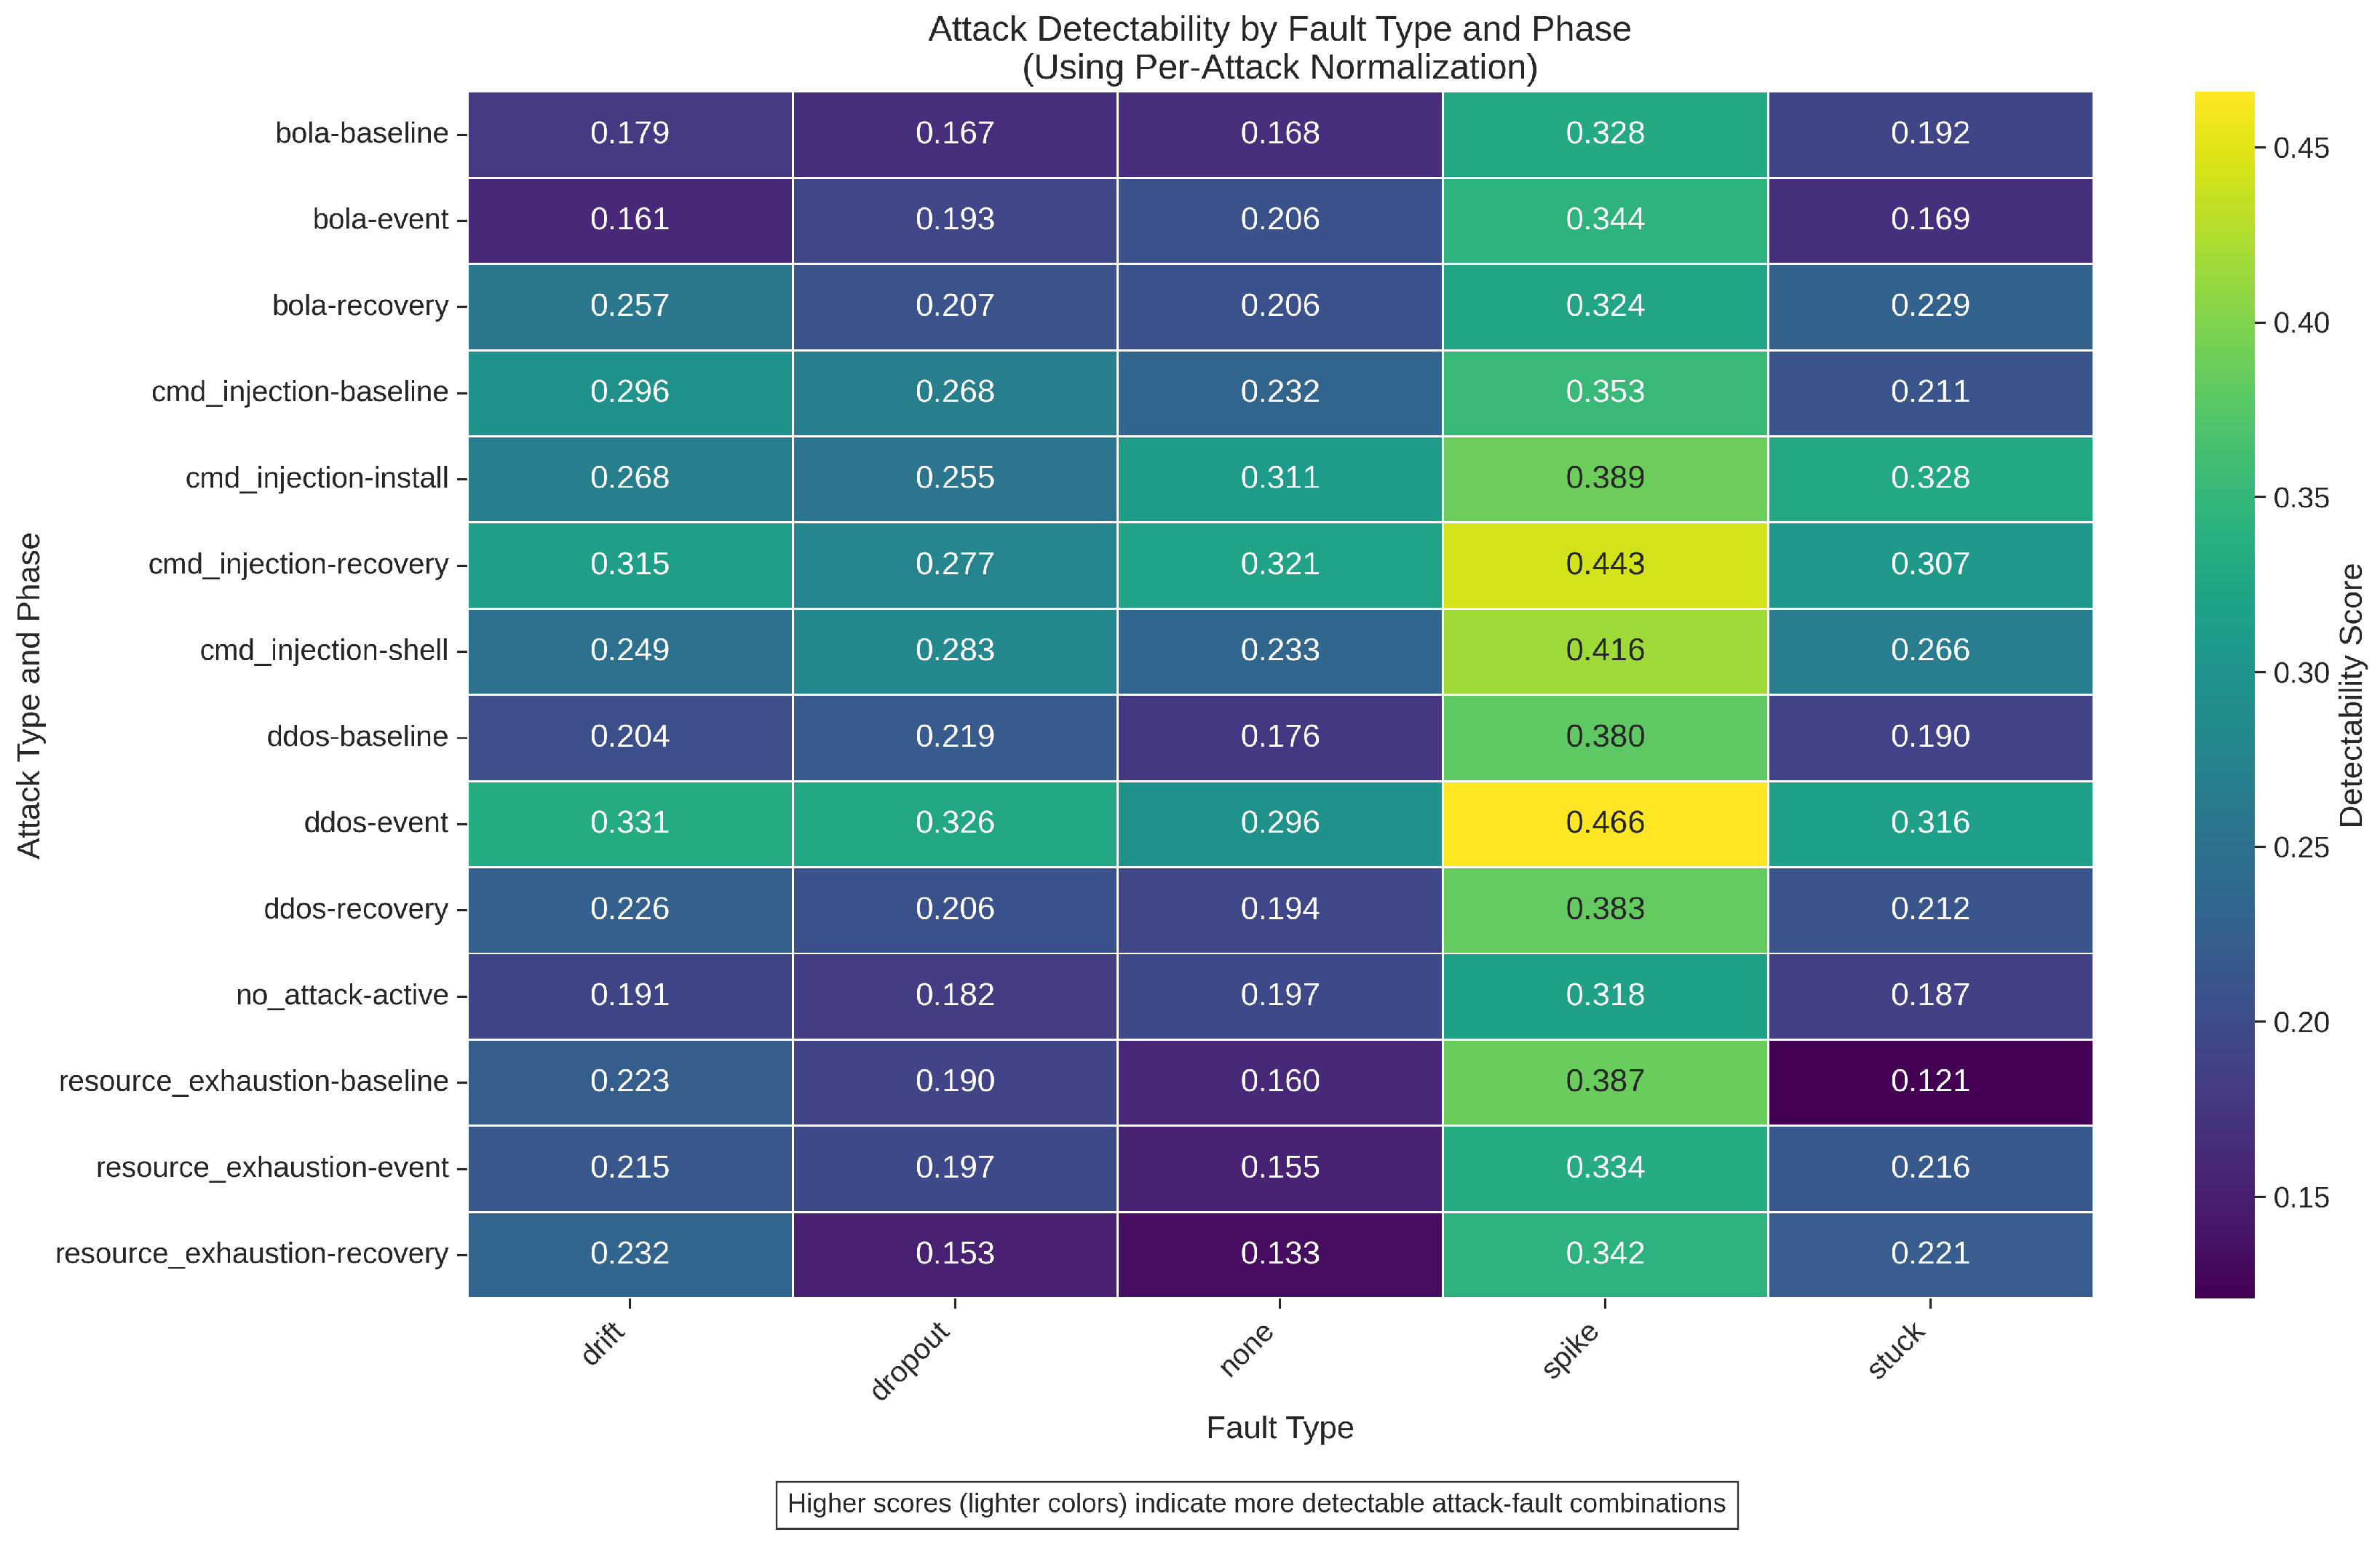
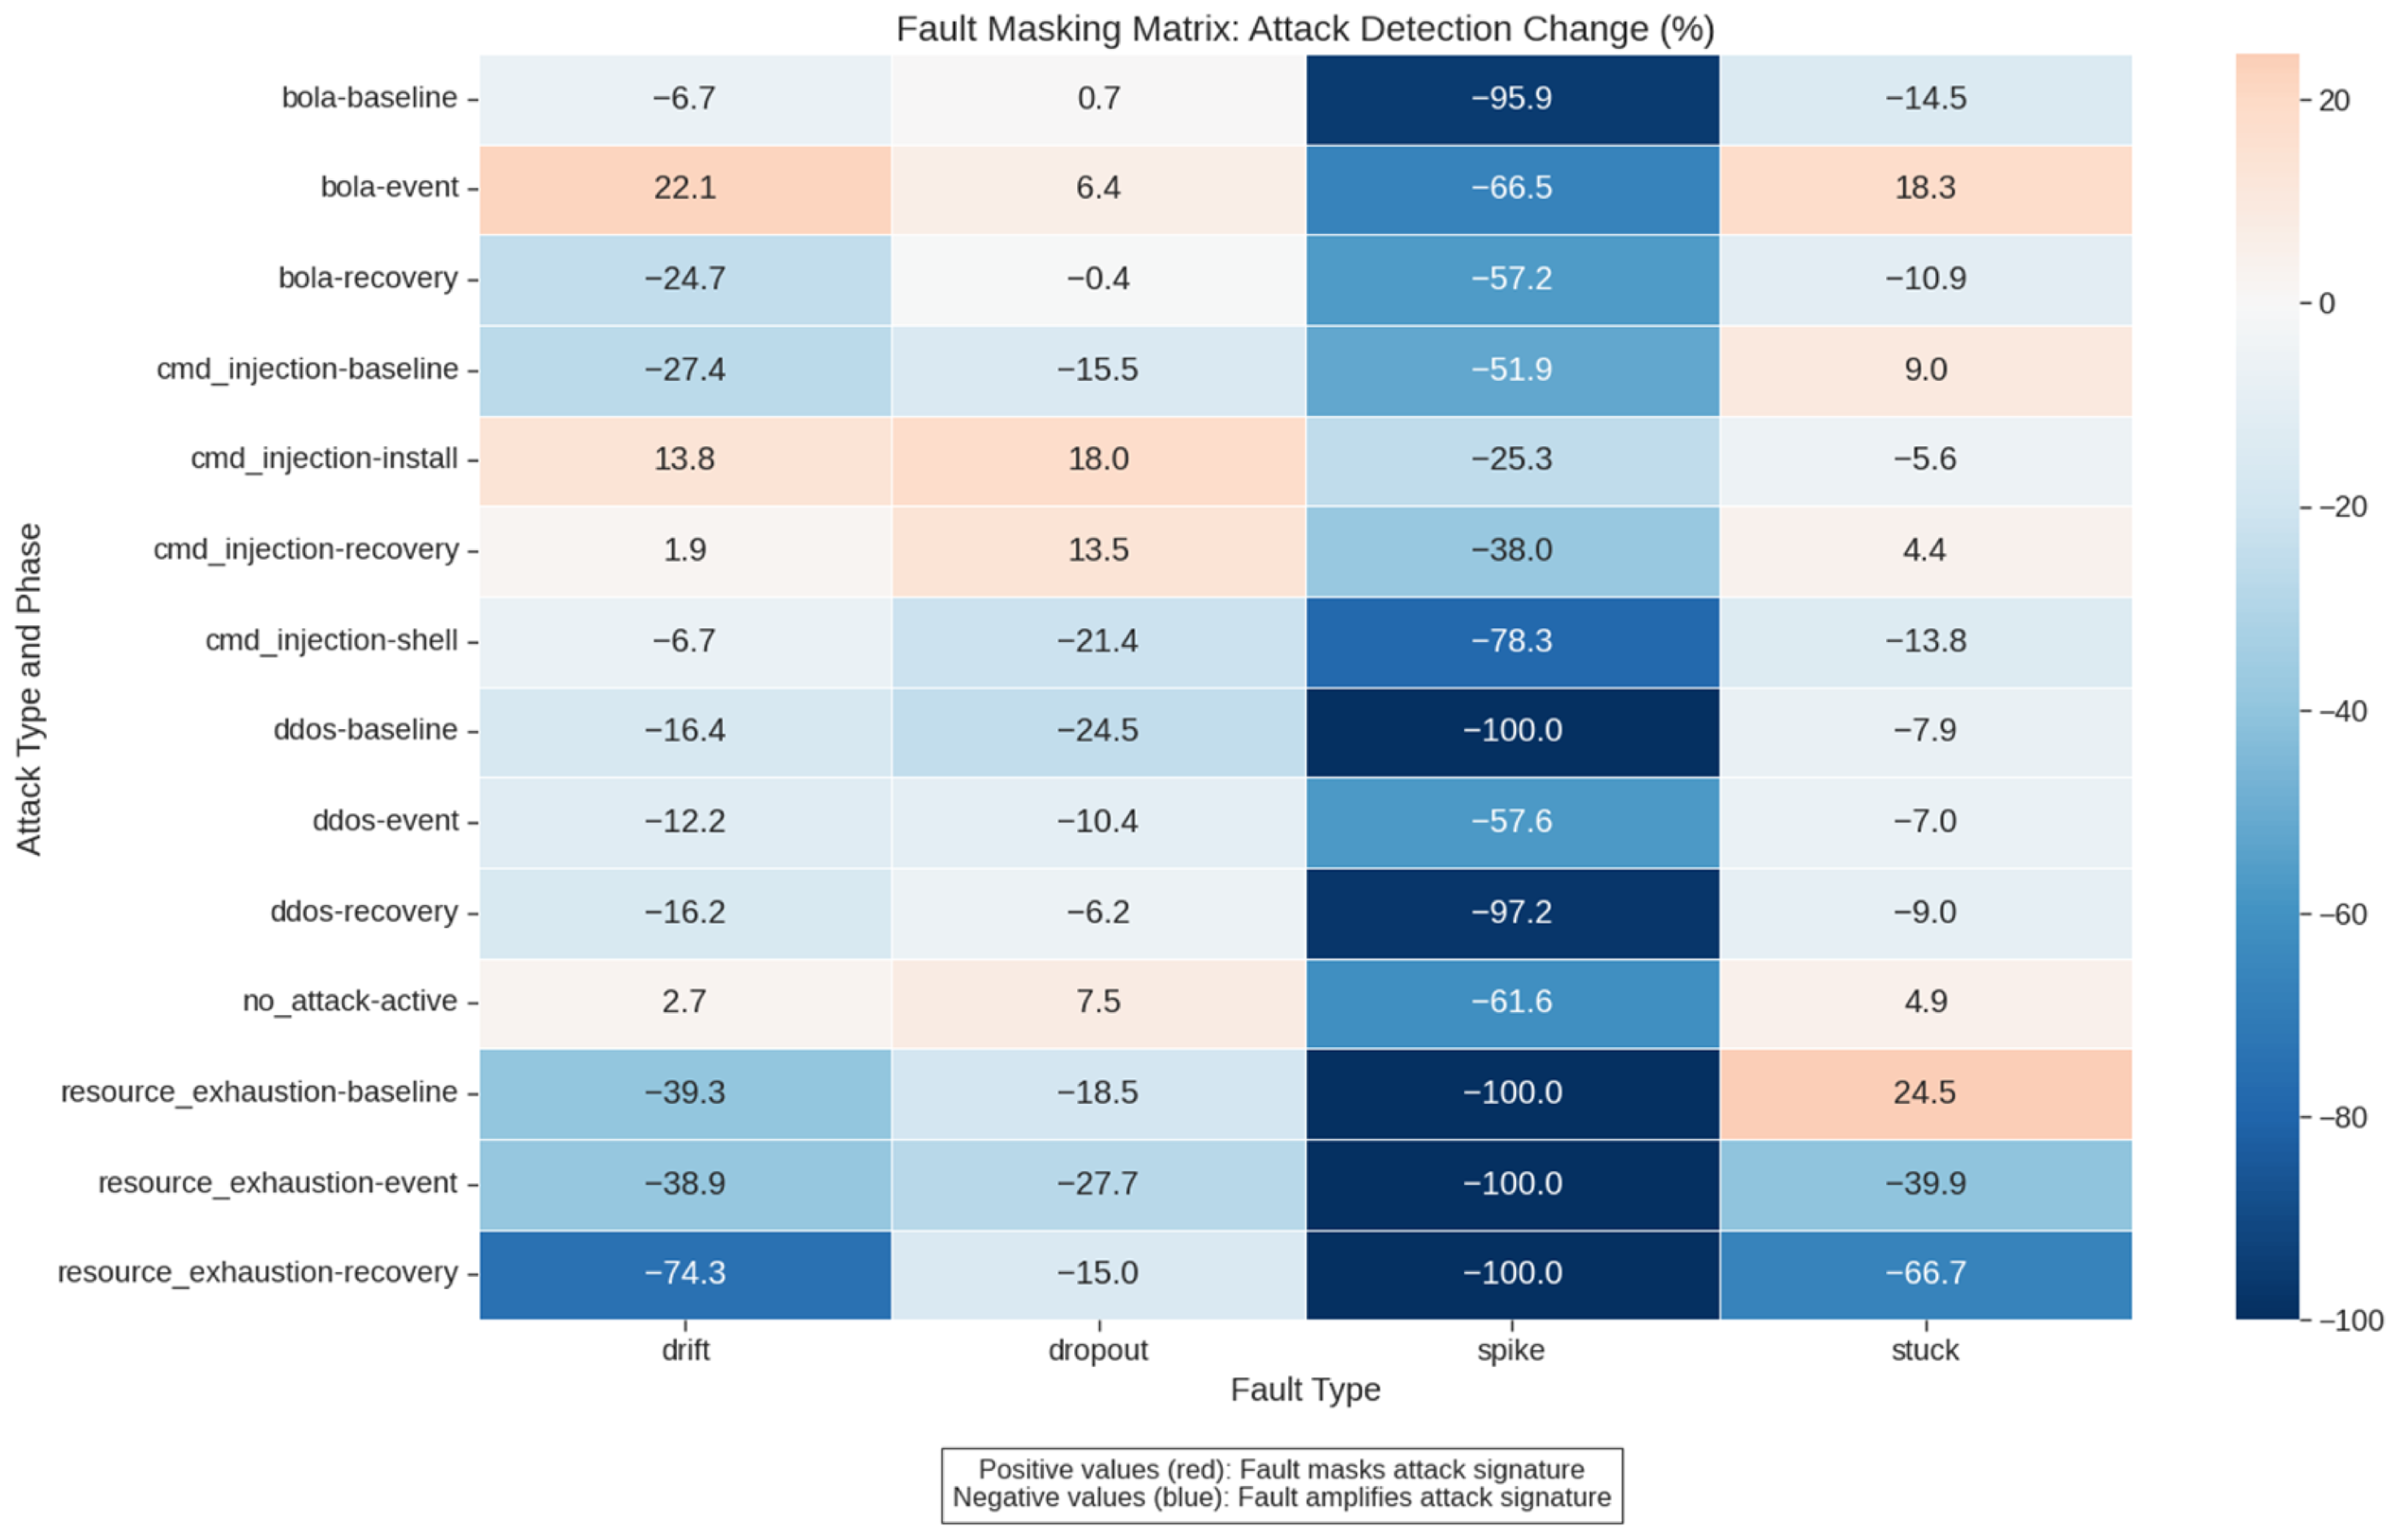
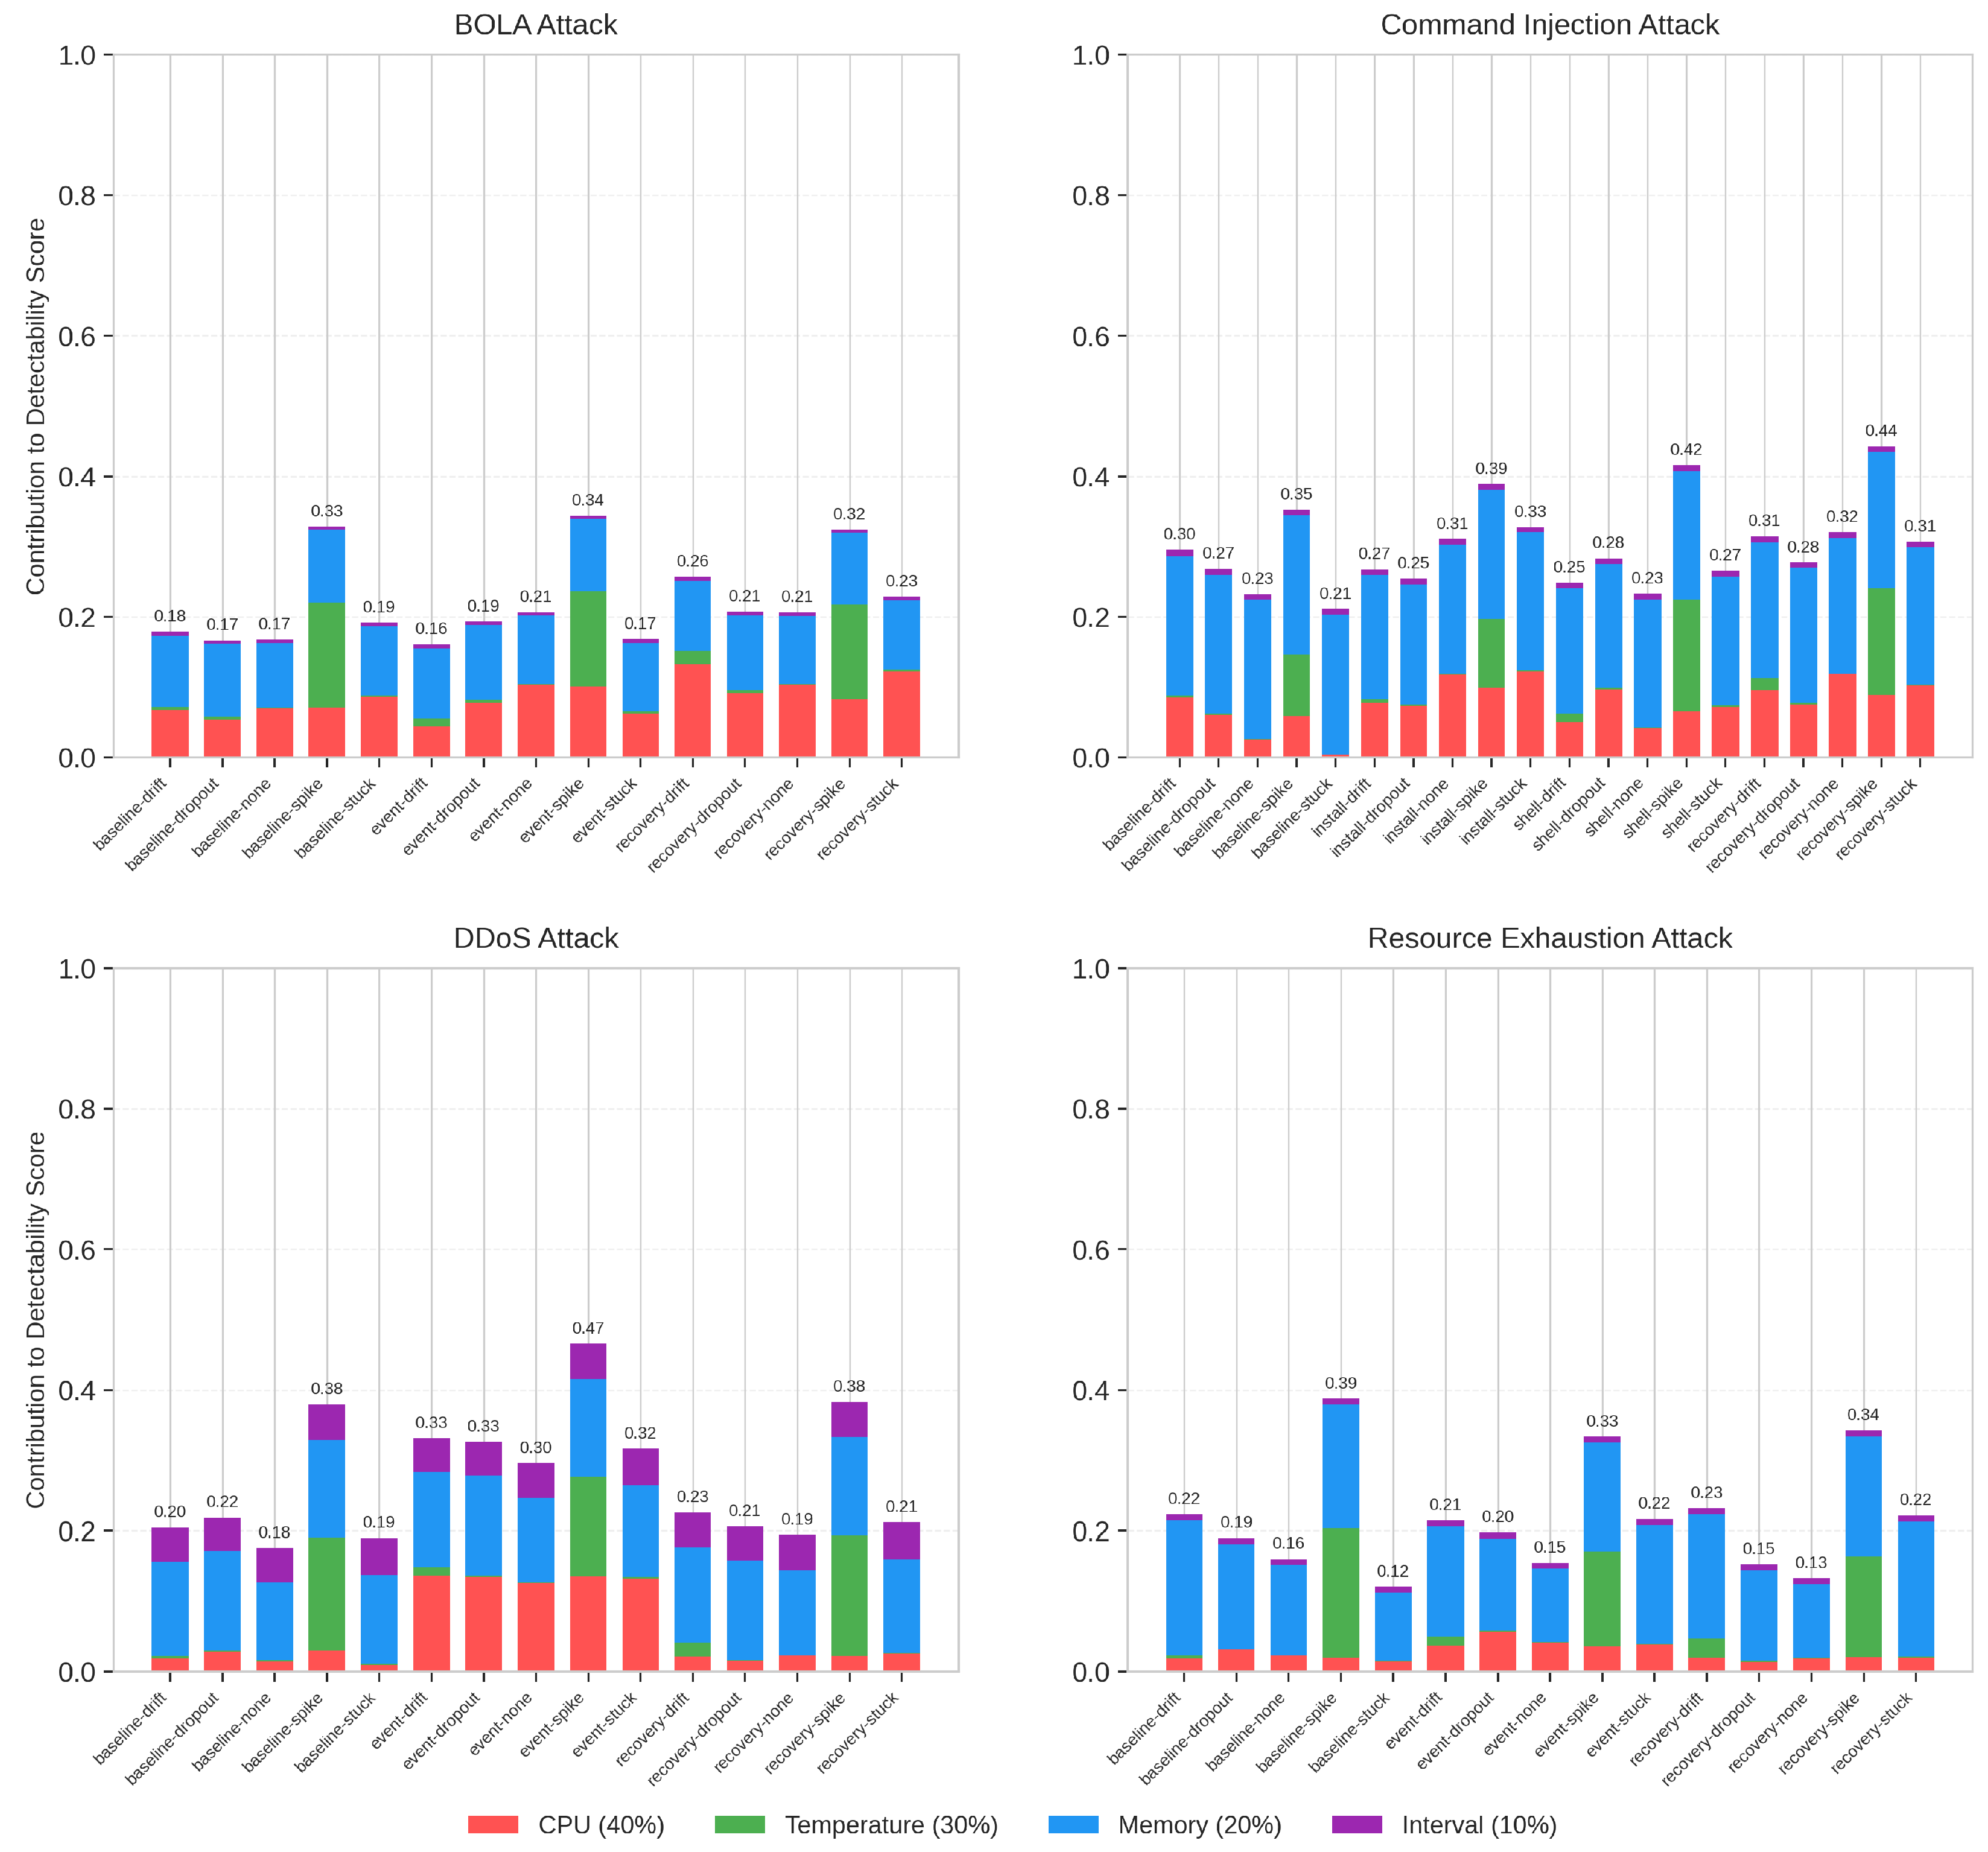
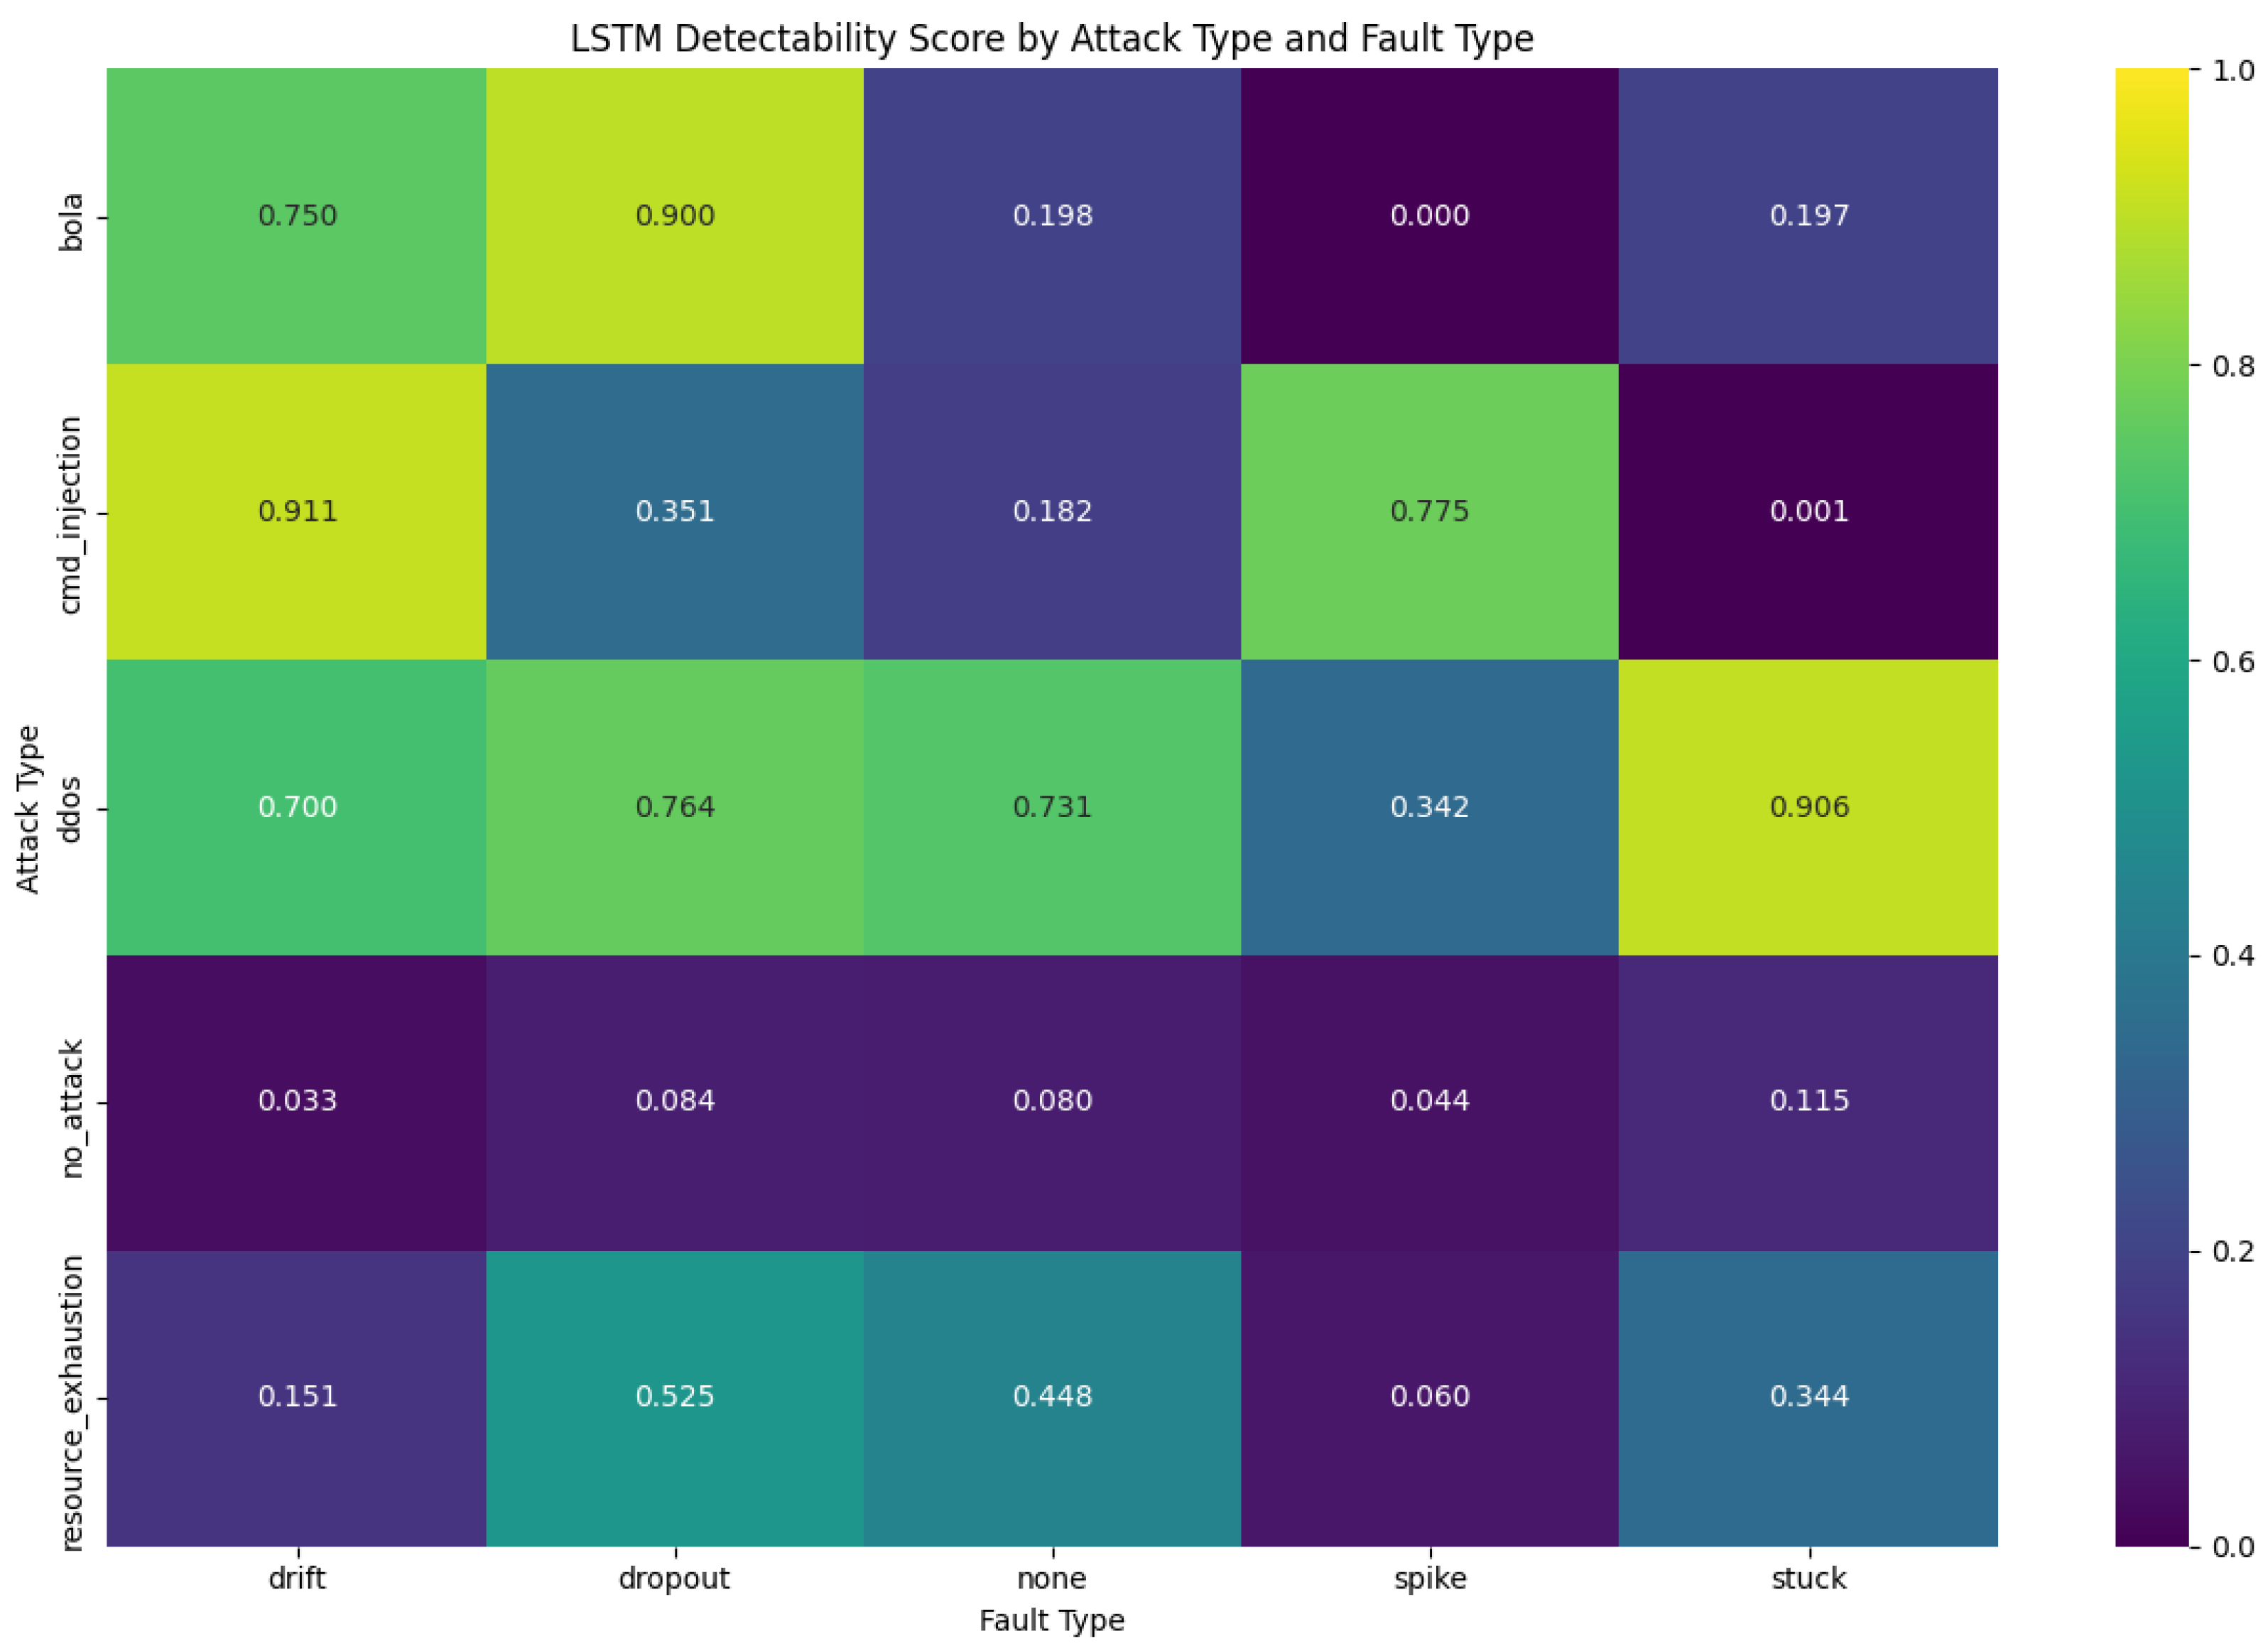

