Article

LGN-YOLO: A Leaf-Oriented Region-of-Interest Generation Method for Cotton Top Buds in Fields

1
College of Information Engineering, Tarim University, Alaer 843300, China
2
Key Laboratory of Tarim Oasis Agriculture, Tarim University, Ministry of Education, Alaer 843300, China
3
Key Laboratory of Modern Agricultural Engineering, Tarim University, Alaer 843300, China
*
Author to whom correspondence should be addressed.
Agriculture 2025, 15(12), 1254; https://doi.org/10.3390/agriculture15121254
Submission received: 10 May 2025 / Revised: 5 June 2025 / Accepted: 7 June 2025 / Published: 10 June 2025
(This article belongs to the Section Artificial Intelligence and Digital Agriculture)

Abstract

As small-sized targets, cotton top buds pose challenges for traditional full-image search methods, leading to high sparsity in the feature matrix and resulting in problems such as slow detection speeds and wasted computational resources. Therefore, it is difficult to meet the dual requirements of real-time performance and accuracy for field automatic topping operations. To address the low feature density and redundant information in traditional full-image search methods for small cotton top buds, this study proposes LGN-YOLO, a leaf-morphology-based region-of-interest (ROI) generation network based on an improved version of YOLOv11n. The network leverages young-leaf features around top buds to determine their approximate distribution area and integrates linear programming in the detection head to model the spatial relationship between young leaves and top buds. Experiments show that it achieves a detection accuracy of over 90% for young cotton leaves in the field and can accurately identify the morphology of young leaves. The ROI generation accuracy reaches 63.7%, and the search range compression ratio exceeds 90%, suggesting that the model possesses a strong capability to integrate target features and that the output ROI retains relatively complete top-bud feature information. The ROI generation speed reaches 138.2 frames per second, meeting the real-time requirements of automated topping equipment. Using the ROI output by this method as the detection region can address the problem of feature sparsity in small targets during traditional detection, achieve pre-detection region optimization, and thus reduce the cost of mining detailed features.

1. Introduction

Cotton is an important economic crop worldwide. Its yield and quality are directly related to the supply of raw materials and the agricultural production efficiency of the textile and military industries. Cotton topping plays a key role in cotton cultivation and management. By removing the growth point at the top of the cotton plant, it can effectively inhibit the top advantage, promote the development of the cotton boll, and increase the yield [1]. In current automated cotton-topping technologies, object detection algorithms based on deep learning are predominantly employed to detect and locate the top bud. However, this method still faces several problems in practical applications. For instance, traditional algorithms are not sensitive enough to the features of small top buds in images, leading to low detection accuracy [2]. In high-resolution images, top buds account for a small proportion of pixels, causing the detection algorithm to waste significant computational resources searching irrelevant areas when scanning the entire image [3]. Traditional full-image search-based detection methods, constrained by both accuracy and efficiency limitations, struggle to meet the requirements for real-time field operations. This challenge has prompted us to integrate cotton plant morphological characteristics with object detection algorithms, driving exploration into optimized detection methods and region-of-interest strategies.
Object detection methods can be primarily categorized into two types based on their bounding-box generation principles: one-stage and two-stage methods. The YOLO (You Only Look Once) [4] series and SSD algorithms [5] represent one-stage methods, while two-stage methods include Faster R-CNN [6], Cascade R-CNN [7], and other derivative algorithms. In agricultural detection applications, two-stage methods are commonly employed to construct precise detection frameworks for localized static scenarios. For instance, Yufan Gao et al. [8] developed an intelligent pest detection system based on an improved Cascade R-CNN model, which is deployed at fixed locations to provide localized pest control recommendations. This system achieved a remarkably low identification error rate of only 2.2% for three target pests. Zhao et al. [9] deployed Mask R-CNN on the green vegetable packaging assembly line to detect the impurities entrained within the leaves. The recognition accuracy was approximately 99.19%, and the detection rate was 8.45 frames per second. Tu Shuqin et al. [10] used an RGB-D camera with an improved Faster R-CNN network deployed on it to conduct one-stop counting and detection of passion fruits, which can be applied in orchard environments. Suchet Bargoti [11] introduced Faster R-CNN as a supporting algorithm for a fruit detection system that can perform multiple agricultural tasks such as surveying, mapping, and robotic harvesting.
Compared with two-stage methods, the network structure of one-stage methods is simpler, and they have lower requirements for computing power during inference. Research results in multiple fields have shown that one-stage methods can be deployed on common low-computing-power devices and achieve real-time detection [12,13,14,15]. These characteristics offer more convenience for automated operations in complex field environments. Therefore, one-stage methods have been more widely applied in the field of agricultural detection. For example, Wang et al. [16] trained an SSD network for citrus pest detection using transfer learning, achieving an mAP of 86.10%. They also conducted mobile and rapid detection tests on embedded devices. Tomáš Zoubek et al. [17] studied the performance of three YOLO algorithms in detecting radish plants and weeds. The accuracy of YOLOv5x in detecting weeds was 91%, and the results provided insights for the development of an automated weed detection system. Tong Li et al. [18] proposed a lightweight model named YOLO-Leaf for detecting apple leaf diseases, achieving an mAP50 score of 93.88%. Daniela Gomez et al. [19] proposed the YOLO-NAS framework for detecting bean diseases and successfully deployed this framework on Android devices, with the detection accuracy exceeding 90%.
Jie Li et al. [20] proposed the Tea-YOLO algorithm framework, based on YOLOv4, as the visual module of tea-picking robots. The computational complexity of this framework was 89.11% lower than that of the original model. In the topping task, the complexity of the field environment means that automated topping equipment can only be equipped with limited computing power. To ensure the reliability of real-time operation, one-stage detection algorithms can be given priority. Through applied research on relevant algorithms, it has been found that the real-time performance advantages and lightweight deployment potential of YOLO make it the preferred framework for the implementation of algorithms in the topping task. Wang, Rui-Fen et al. [21] designed an intelligent weeding device using LettPoint-YOLOv11 as the detection algorithm, which improved the intelligent level of lettuce-planting management. With the transformation of agricultural automation toward precision, an increasing number of scholars have begun to focus on enhancing the algorithm’s ability to detect small targets. For example, Song et al. [22] conducted research on the high-precision detection technology required during the tomato-picking process. By making some structural improvements to the detection algorithm, they enhanced its ability to recognize smaller tomatoes. Haoyu Wu et al. [23] improved the backbone and neck networks of YOLOv4, enabling it to accurately identify small-target weeds, making it suitable for field-weed detection tasks. Huaiwen Wang et al. [24] added a dual-functional pooling structure and the Soft-NMS algorithm to YOLOv5s. For apple target detection, this improved model effectively carried out the small-target detection task. Quan Jiang et al. [25] proposed the MIoP-NMS algorithm based on YOLOv4, which is suitable for detecting small-target crops in drone images. Taking banana tree images with different sparsity levels as examples, this model achieved an accuracy of 98.7%. Shilin Li et al. [26] used YOLOv5 as a baseline model. By adding dual-coordinate attention and adjusting the convolution module, they further boosted the model’s proficiency in identifying small jujube targets. Although these methods have improved the accuracy of small-target detection to a certain extent, as more external algorithms and modules are introduced, the computational load also increases, and the marginal benefit decreases. When operating in the field, the detection algorithm needs to give more consideration to the balance between performance and efficiency and reduce its dependence on hardware.
To address the current bottlenecks faced by detection algorithms, it is possible to optimize the scale of the input images before performing detection. This can reduce the computational resources consumed on irrelevant areas, thereby achieving the goals of improving real-time performance and accurately detecting small targets. Relevant research has shown that methods that extract the regions of interest from the original image as sub-images and conduct target detection within these sub-images effectively filter out redundant information [27,28]. Yang Le et al. [29] emphasized the existence of spatial redundancy in the input samples in their research. They used a resolution-adaptive network to perform multiple croppings on the original image and conduct iterative predictions on the generated sub-images. Due to the lower resolution of the sub-images, the effective features are more concentrated, enabling the network to achieve fast detection while maintaining high accuracy. Ziwen Chen et al. [30] carried out adaptive cropping on high-resolution images and used the generated sub-images as a new dataset for training, increasing the mAP@0.5 of the model from 47.9% to 89.6%.
Before detecting small targets, using a pre-processing algorithm to filter out redundant information effectively increases the proportion of small targets in the image. In the regions of interest output by the pre-processing algorithm, the density of the top bud’s features is higher, which helps reduce the learning cost of the model.
With the integration of deep learning technology and agricultural science, detection methods for small-sized crops based on the morphological characteristics of plants have demonstrated remarkable technical advantages and application potential [31,32,33]. As a monopodial branching plant, the top bud of cotton is always located at the very top of the main stem. The young leaves adjacent to the top bud grow spirally from the root of the bud, causing the petiole bases’ connecting lines to naturally converge at the location of the top bud. In terms of target size, the pixels of young leaves account for a larger proportion in the image compared to those of the top buds. In terms of target features, there are significant differences in morphology and color between young leaves and mature leaves, making them easy to distinguish. Moreover, there is a close positional relationship between young leaves and top buds. Therefore, by performing object detection on young leaves, determining the area of the top buds based on the geometric relationship between the petioles of the young leaves and the buds, and then outputting the region of interest, it is possible to filter out redundant information.
In this study, we propose an ROI generation network named LGN-YOLO, which is based on YOLOv11n. This model incorporates the morphological characteristics of cotton plants and uses the young-leaf parts as a reference to predict the area where the top bud is located. The LP module is added to the detection head of the model. According to the positional relationship between the young leaves and the top bud, the ROI of the top bud is output as the prediction result. The CA mechanism is introduced into the backbone of the model to strengthen the separation process between the young leaves and the background. Moreover, a feature extraction network, named LR-FPN, is constructed in the neck to increase contextual interaction. The inner EIoU is used to further reduce the loss value of the model so as to improve the accuracy of the ROI.
The main contributions of this study are as follows:
1.
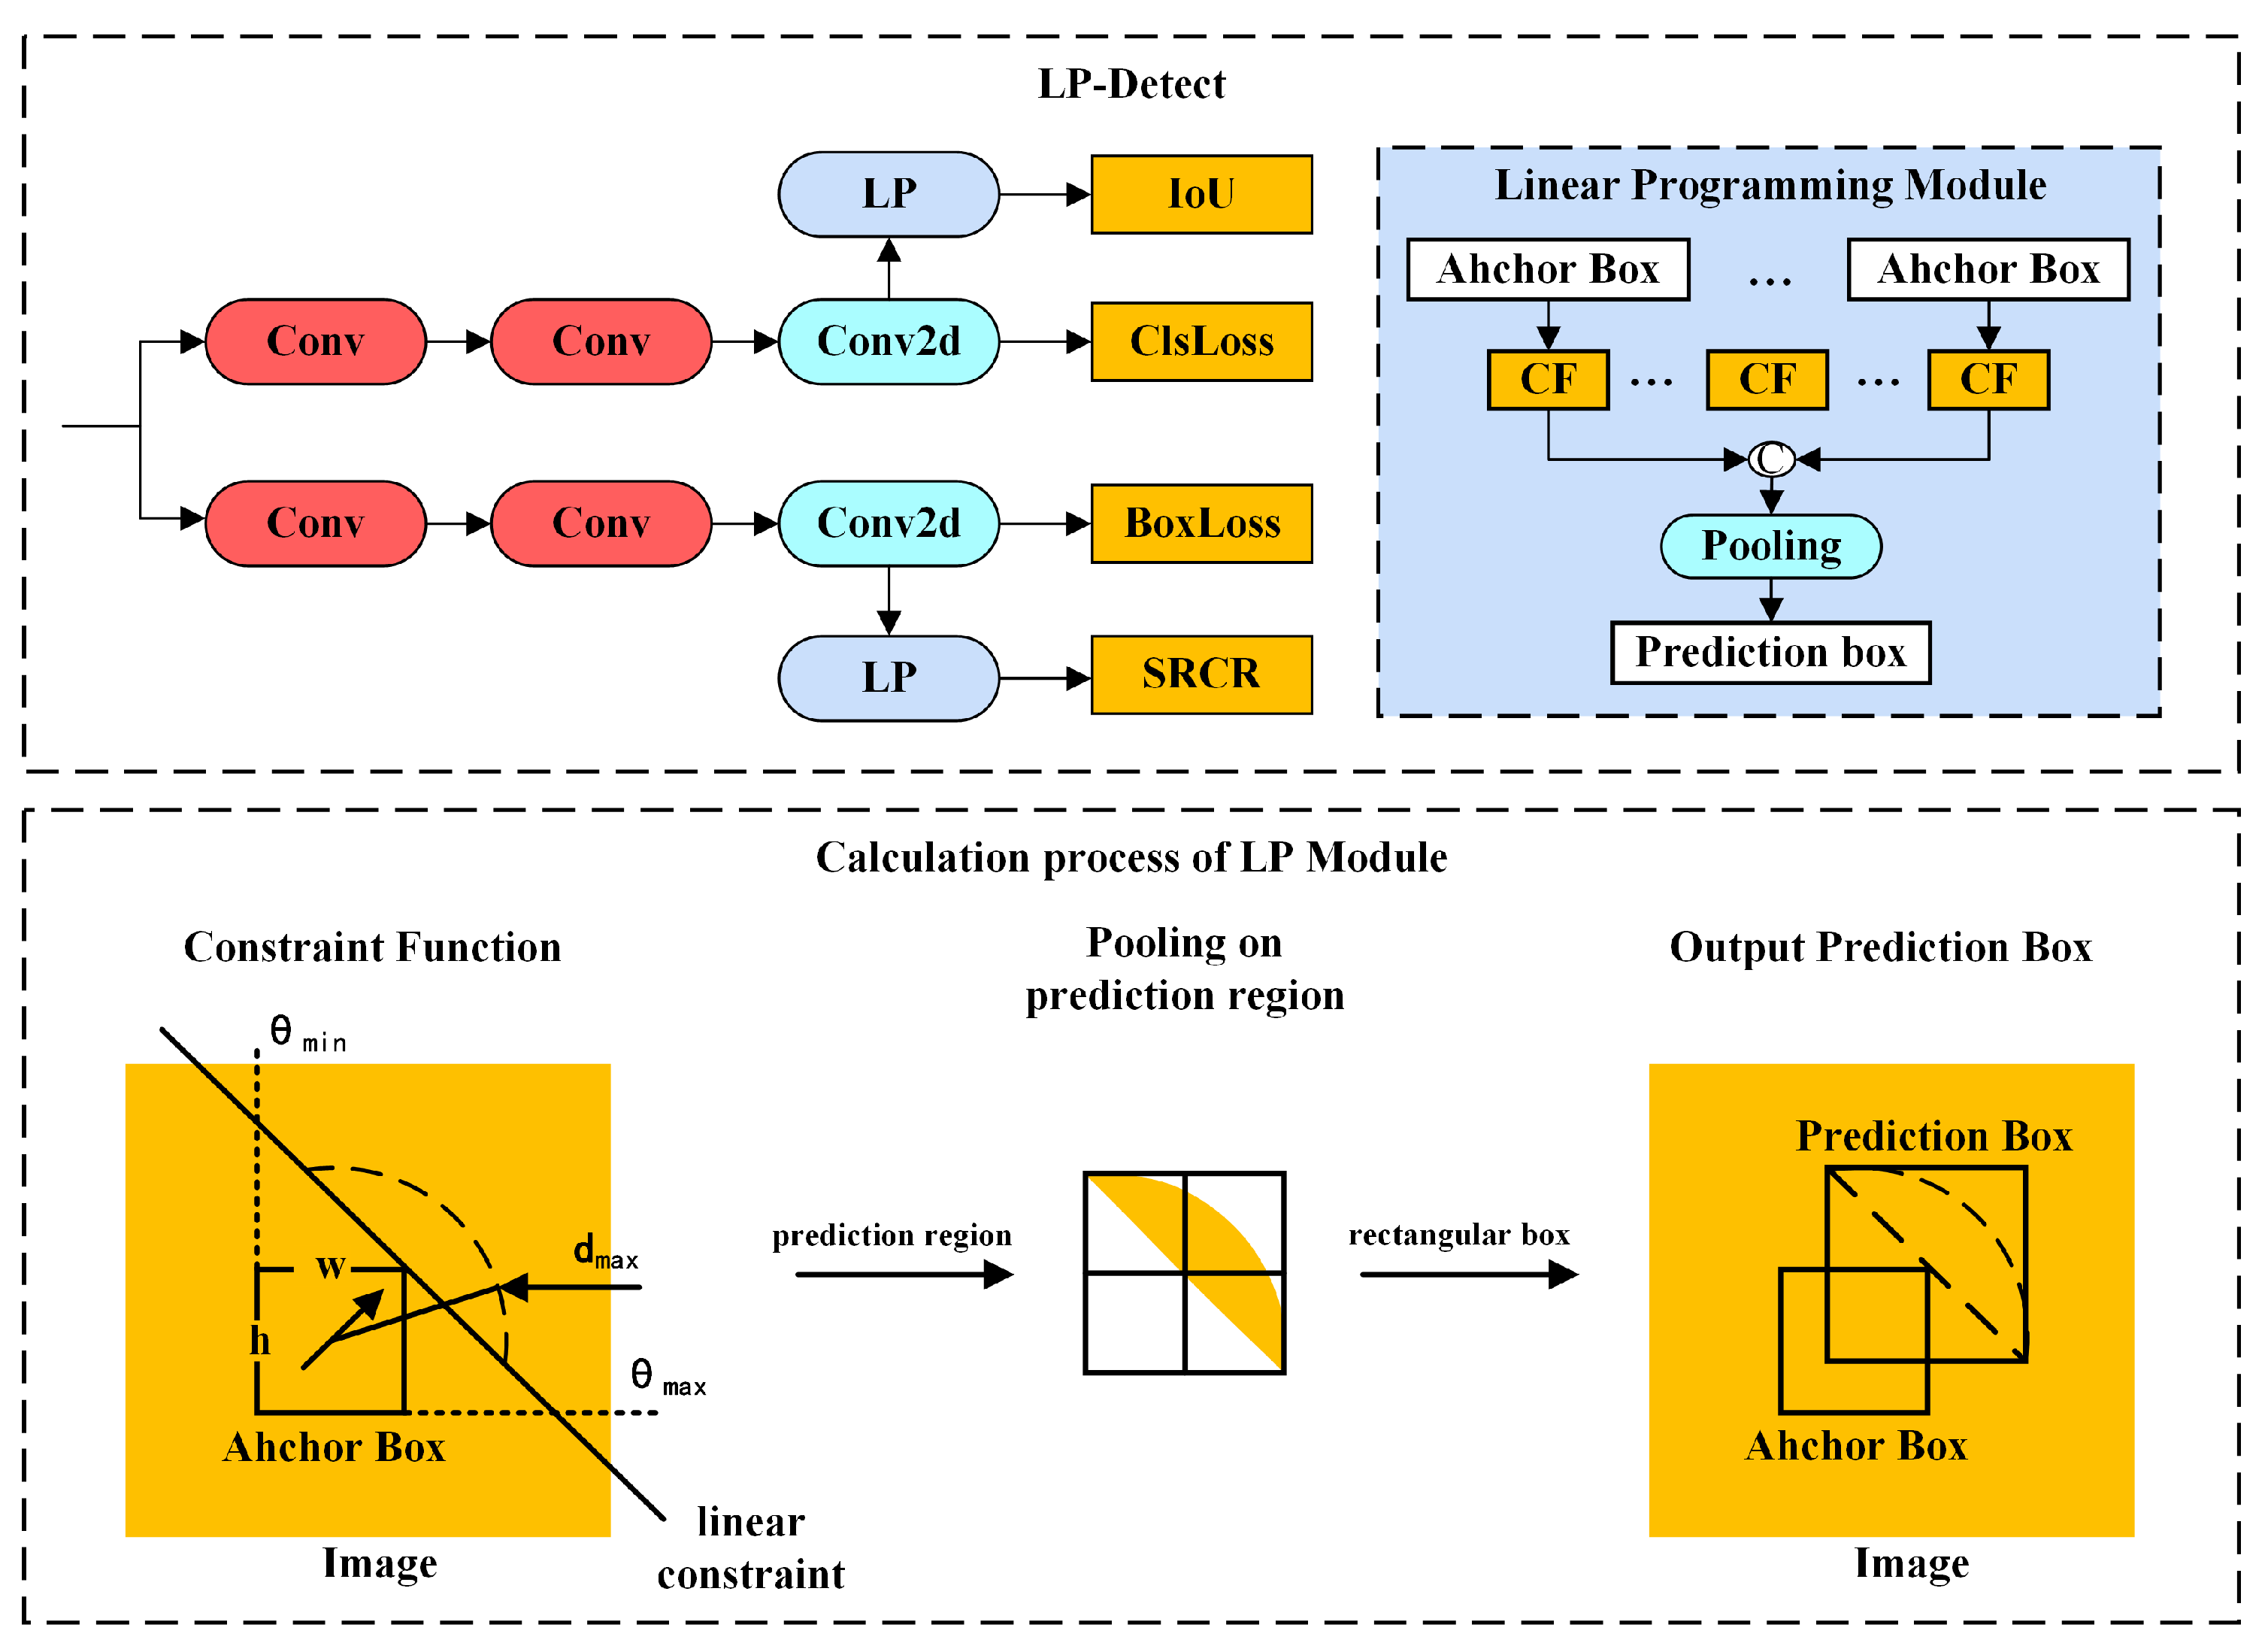
The LP-Detect module is used to intercept the region of interest of the top bud in the high-resolution image, which eliminates a large amount of redundant information in the original image and saves computational resources for the detection of small-sized top buds.
2.
The CA mechanism is introduced at the end of the backbone to enhance the ability to separate the spatial and channel dimensions of the feature map. A new feature pyramid network (FPN) is constructed to preserve the detailed features of the young leaves. The inner EIoU is introduced as the loss function to further reduce the loss value of the anchor boxes of the young leaves, thus improving the accuracy of linear programming.
3.
Combining the morphological characteristics of cotton plants, a leaf-oriented ROI generation method is proposed, which improves the utilization rate of feature information in the image. The extraction effect of the model under field conditions is verified through experiments, providing technical support for the automatic topping of cotton.
Due to the lack of publicly available datasets, this study uses a self-constructed cotton plant dataset to evaluate the LGN-YOLO model and compare it with traditional networks. The results show that the optimized model can generate more accurate ROIs for the top buds. While preserving the features of the top buds, it can effectively reduce the search range during detection and has good real-time generation ability in field environments.
Section 2 introduces the method used to establish the cotton plant dataset and details the improvement process for the LGN-YOLO model. Section 3 describes the experimental conditions and conducts an analysis of the experimental data. Section 4 sums up the experimental results and suggests future research directions.

2. Materials and Methods

2.1. Dataset Image Collection

The images in the cotton plant dataset are of cotton fields in the suburban area of Alar City, Xinjiang. They were collected in the middle of June 2024 using a Redmi K60 smartphone (manufactured in Wuxi City, Jiangsu Province, China), with an image resolution of 3000 × 3000 pixels. The images were collected from a top-down perspective, with young leaves and top buds included within the field of view during collection. To ensure the diversity of the samples, we carried out the collection under two conditions: single leaves and multiple leaves on sunny days and in dusty weather. In order to make up for the loss of the contour features of the young leaves caused by wind disturbance, the inter-frame difference method [34] was adopted to perform motion compensation on the original images. The compensation formula is shown in Equation (1):
M motion ( x , y ) = 1 if | I t ( x , y ) I t + Δ t ( x , y ) | [ τ low , τ high ] 0 otherwise
M m o t i o n is the binarized mask, ( x , y ) is the pixel coordinate, I t and I t + Δ t are two adjacent frames of the same scene within consecutive time periods, and τ low and τ high are the color thresholds of the young-leaf part after the original image was grayscale-processed. During shooting, for the same target, two frames were continuously sampled at a speed of 30 frames per second (FPS). After grayscale processing, the motion mask was calculated. A bitwise OR operation was performed on the two frames within the mask. A 3 × 3 rectangular convolutional kernel was used for the pooling operation at the edge of the mask, and the result was output as a motion-compensated image through the RGB color channel. As shown in Figure 1, after compensation, the contour features of the young leaves became more pronounced, and the dynamically blurred parts on the surface were corrected. Using the motion-compensated images as the dataset images, a total of 600 images were obtained.

2.2. Dataset Pre-Processing

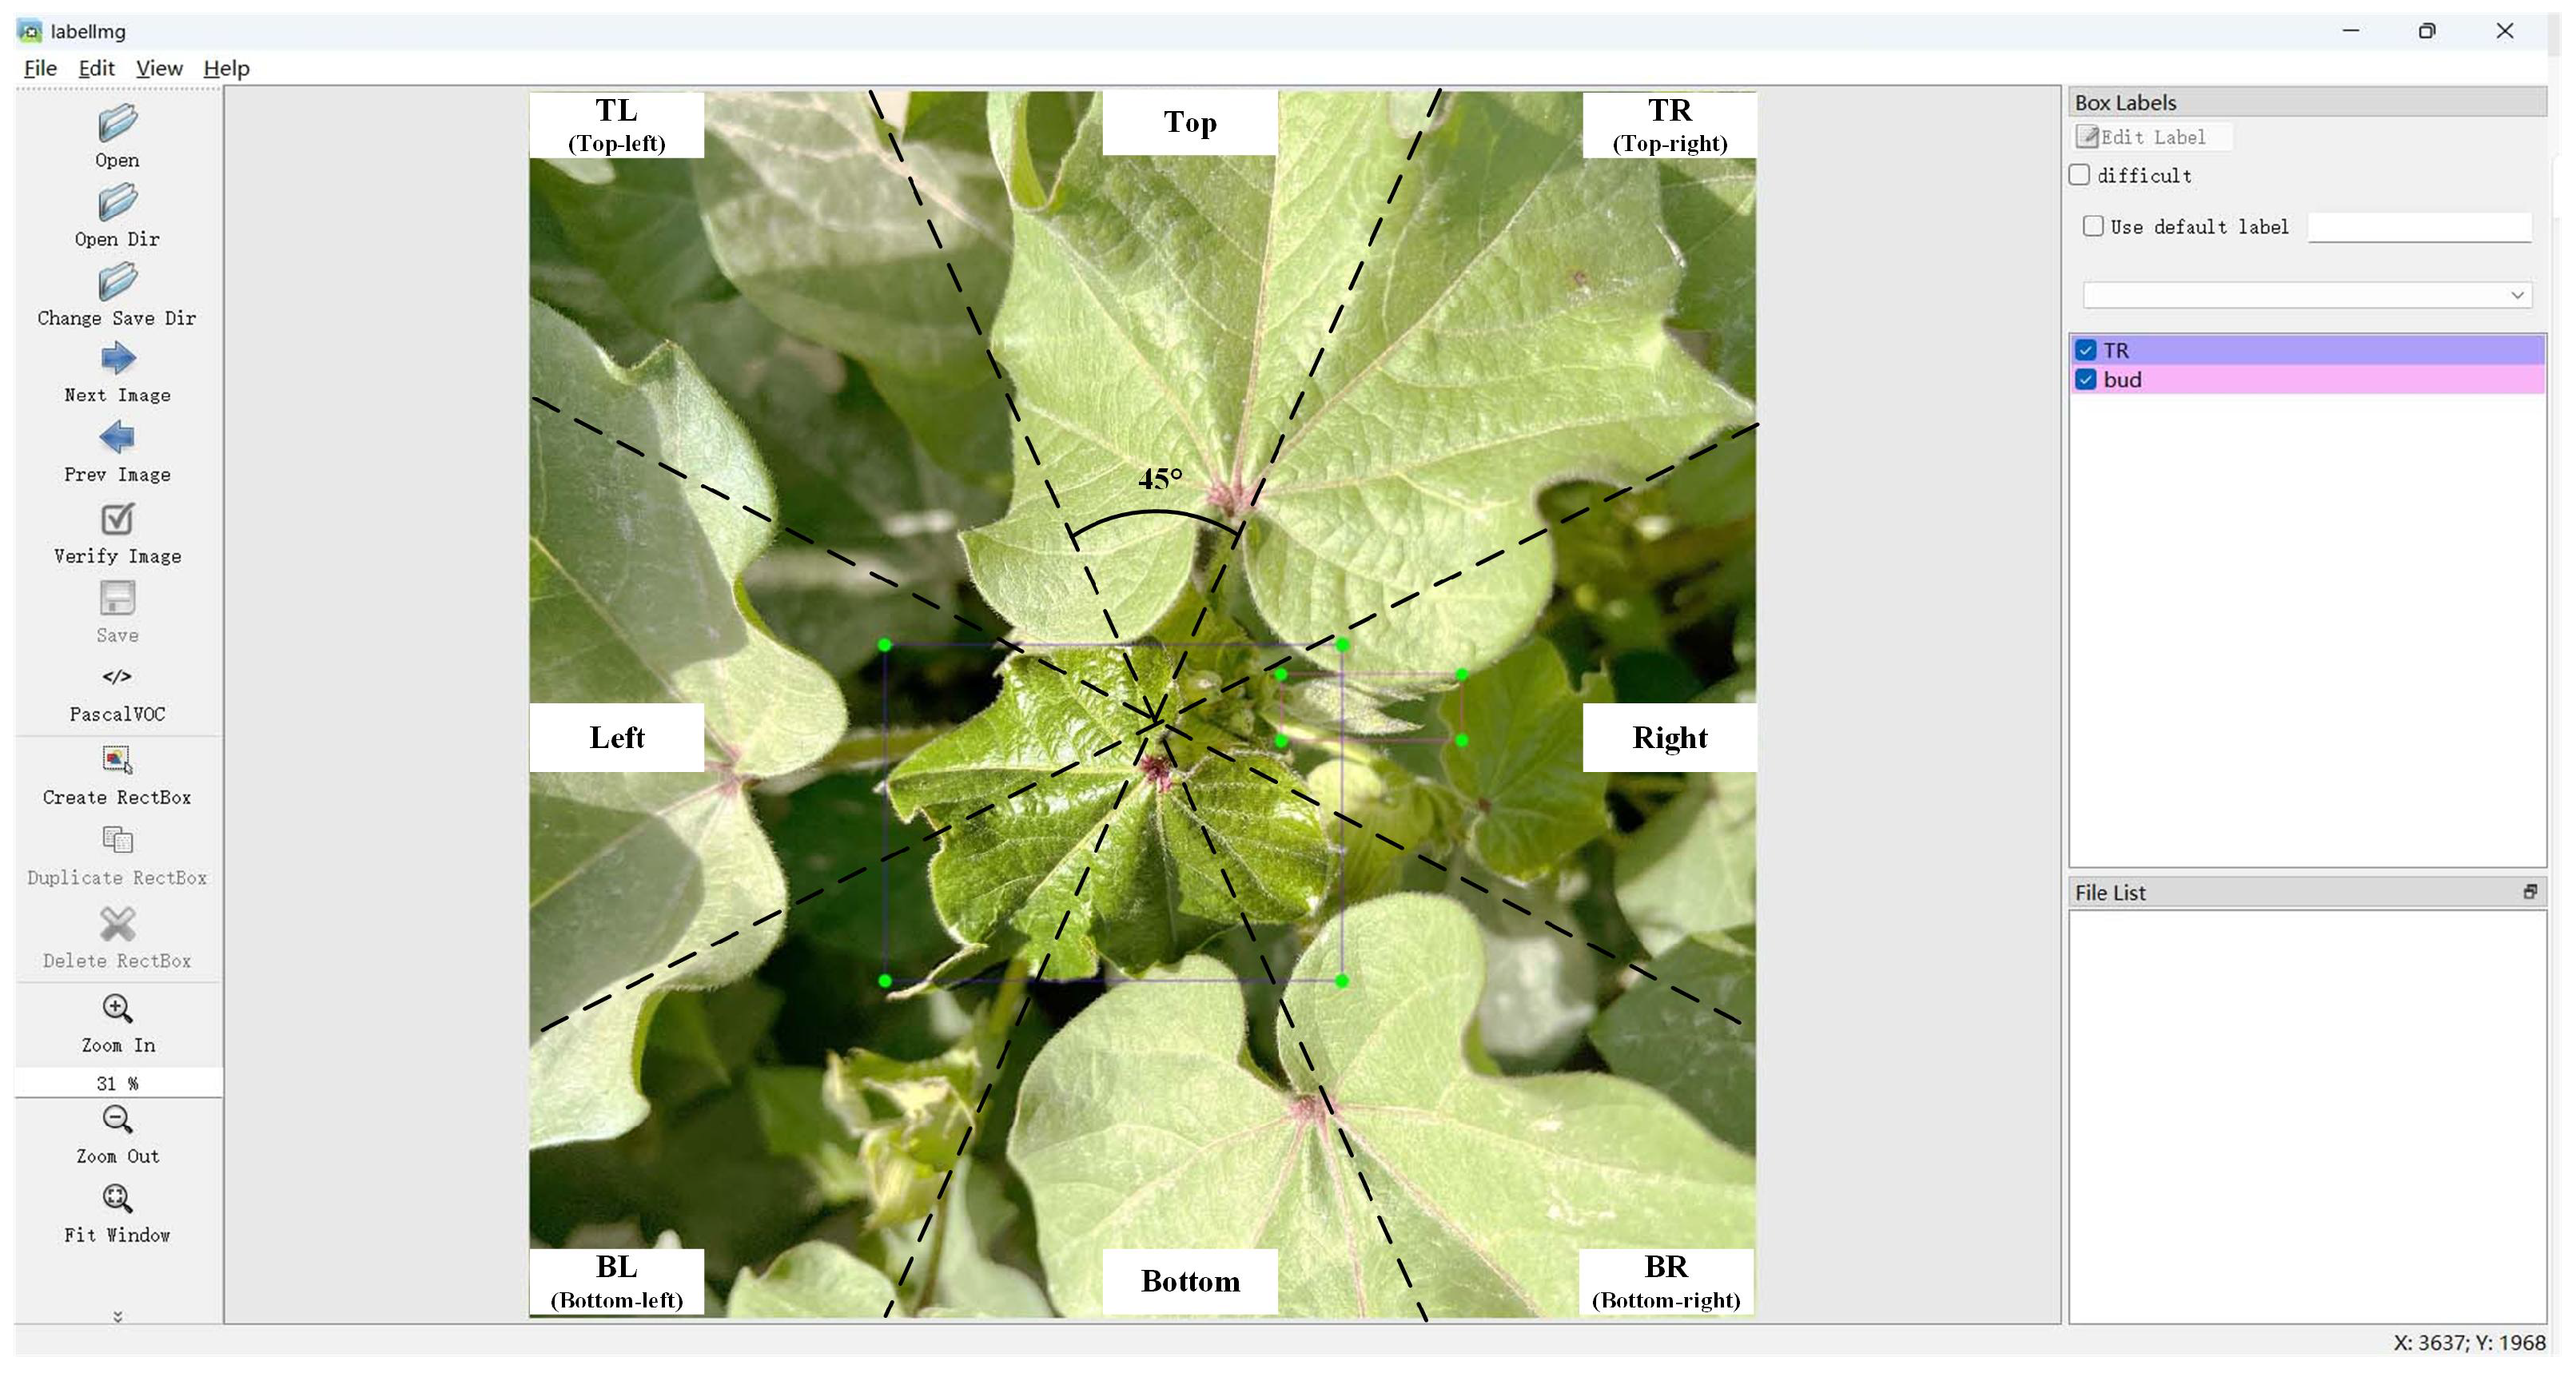
2.2.1. Dataset Annotation

In this study, the LabelImg [35] tool (version 1.8.6) was used to annotate the detection objects in the image. As shown in Figure 2, when annotating, the image was divided into eight planar directions as the young-leaf labels, with each interval being 45°, so as to establish the spatial mapping relationship of the young leaves. To facilitate the quantification of the performance of the ROI, manual annotation was used to precisely mark the top-bud labels in the images and construct a standard reference area. After annotation, an XML file recording the corner points of the rectangular boxes in the image was obtained. This XML file was then adjusted to the label file format required by YOLO to serve as a standard sample.

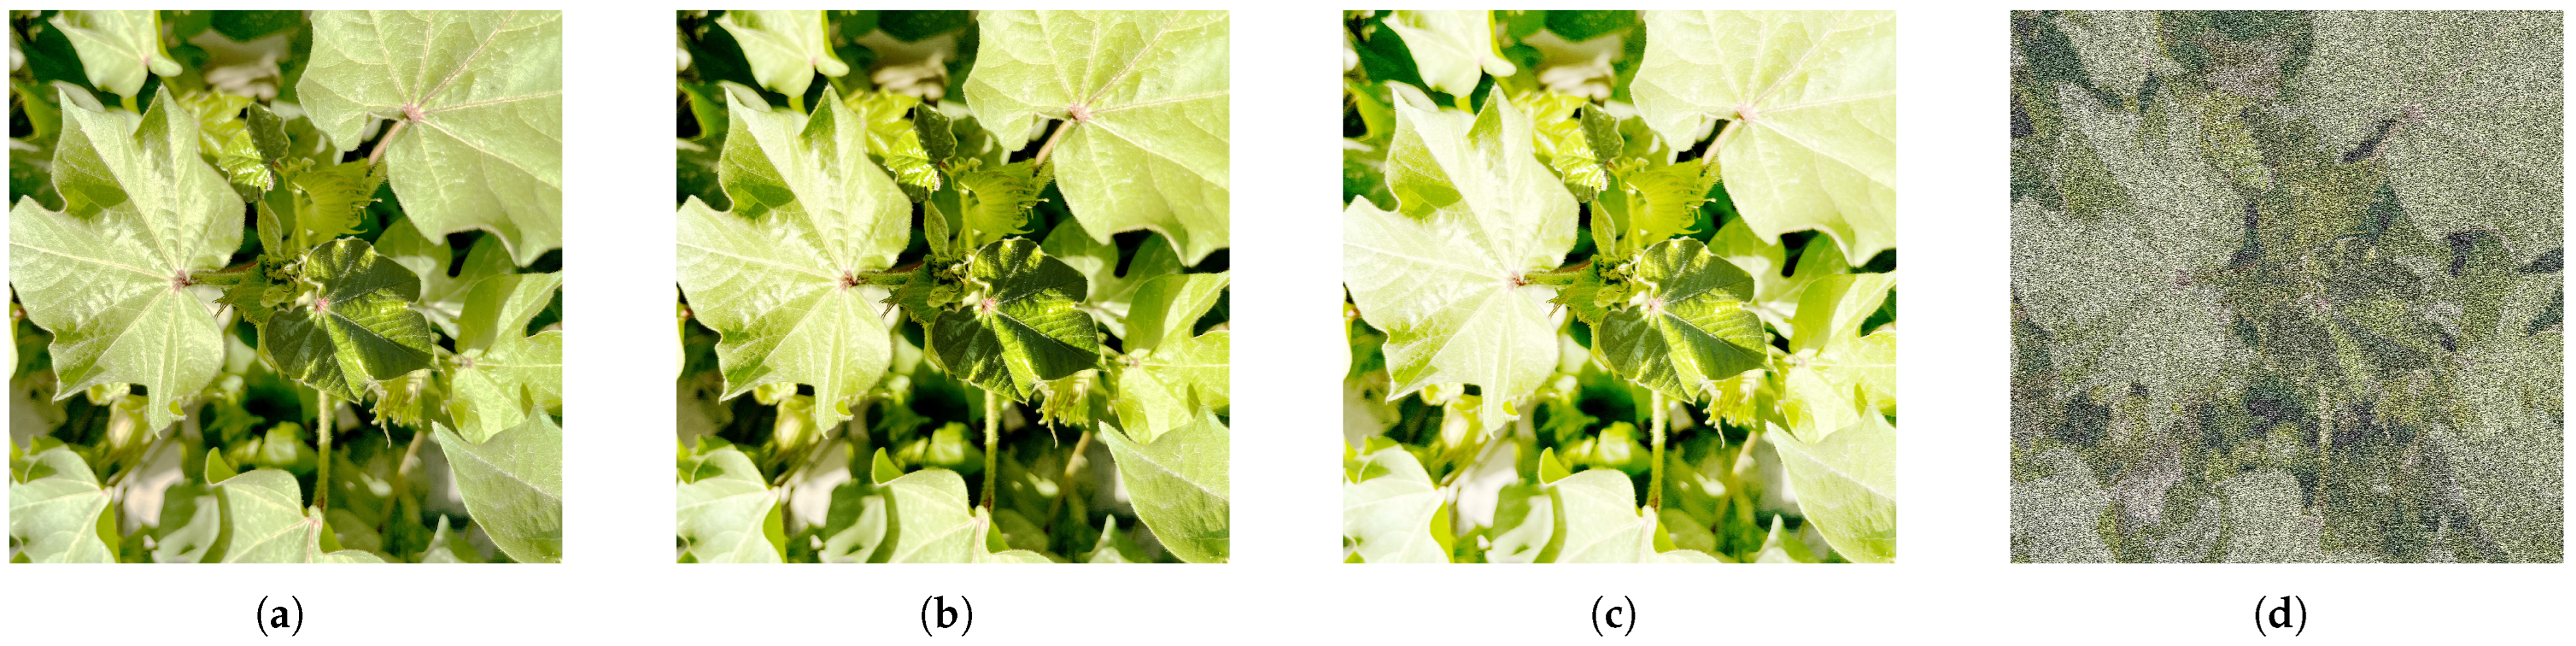
2.2.2. Data Augmentation and Partitioning

To improve the robustness of the model against dynamic interference in the field, we enhanced each sample by adjusting the contrast, randomly adjusting the brightness, and adding Gaussian noise. The effects of these enhancements are shown in Figure 3. After data augmentation, the dataset contained a total of 4200 samples. The samples were randomly divided into a training set, a validation set, and a test set at an 8:1:1 ratio. The number of images and labels contained in each of the three subsets is shown in Table 1.

2.3. LGN-YOLO for Generating the Region of Interest of Cotton Top Buds

2.3.1. Baseline Model: YOLOv11n

This study adopts the latest YOLOv11n [36] algorithm released by Ultralytics in September 2024 as the baseline model. This model represents a major technological breakthrough in the YOLO series of object-detection algorithms. The YOLOv11 series is divided into five versions according to model complexity and computational requirements: nano (n), small (s), medium (m), large (l), and extra-large (x), with the network depth and computational resource requirements increasing in a gradient manner. Considering the balance between performance and efficiency in real-time detection scenarios, this study selects the YOLOv11n with the smallest computational load as the baseline to achieve efficient real-time inference capabilities while ensuring detection accuracy.
As shown in Figure 4, YOLOv11n adopts a classic three-stage architecture design. In the backbone, a deep convolutional neural network is used to extract multi-scale features, and three feature maps of different dimensions are output. In the neck, a feature pyramid structure is adopted to achieve cross-scale feature fusion, effectively enhancing the semantic information interaction between high-dimensional and low-dimensional features. In the detection head, prediction results are generated based on the anchor-box mechanism.

2.3.2. Structure of the LGN-YOLO Model

The LGN-YOLO model proposed in this study can determine the region of interest where the top bud is located based on the position information of the young leaves. The coordinate attention (CA) mechanism is incorporated into the backbone of the model to enhance the connection between pixel features, retain the edge feature details of young leaves, and contribute to their separation from the background. In the neck part, a more lightweight residual feature pyramid network structure is employed. The context interaction among features at different scales is enhanced through adaptive pooling. Moreover, the perception of the target directionality by the detection head is strengthened through a spatial interaction strategy, enabling the model to conduct more accurate classification of the orientation of the young leaves. In the detection head, the linear programming (LP) mechanism is introduced. Linear programming is carried out in the graph based on the type of the input anchor box, and the feasible region is solved. After several updates of the feasible region, the ROI prediction box is finally output. Finally, the inner EIoU is introduced to calculate the regression loss of the anchor boxes for young leaves. Based on the loss feedback, the corner positions of the anchor boxes and the generated ROI prediction boxes are adjusted. The architecture of LGN-YOLO is illustrated in Figure 5.

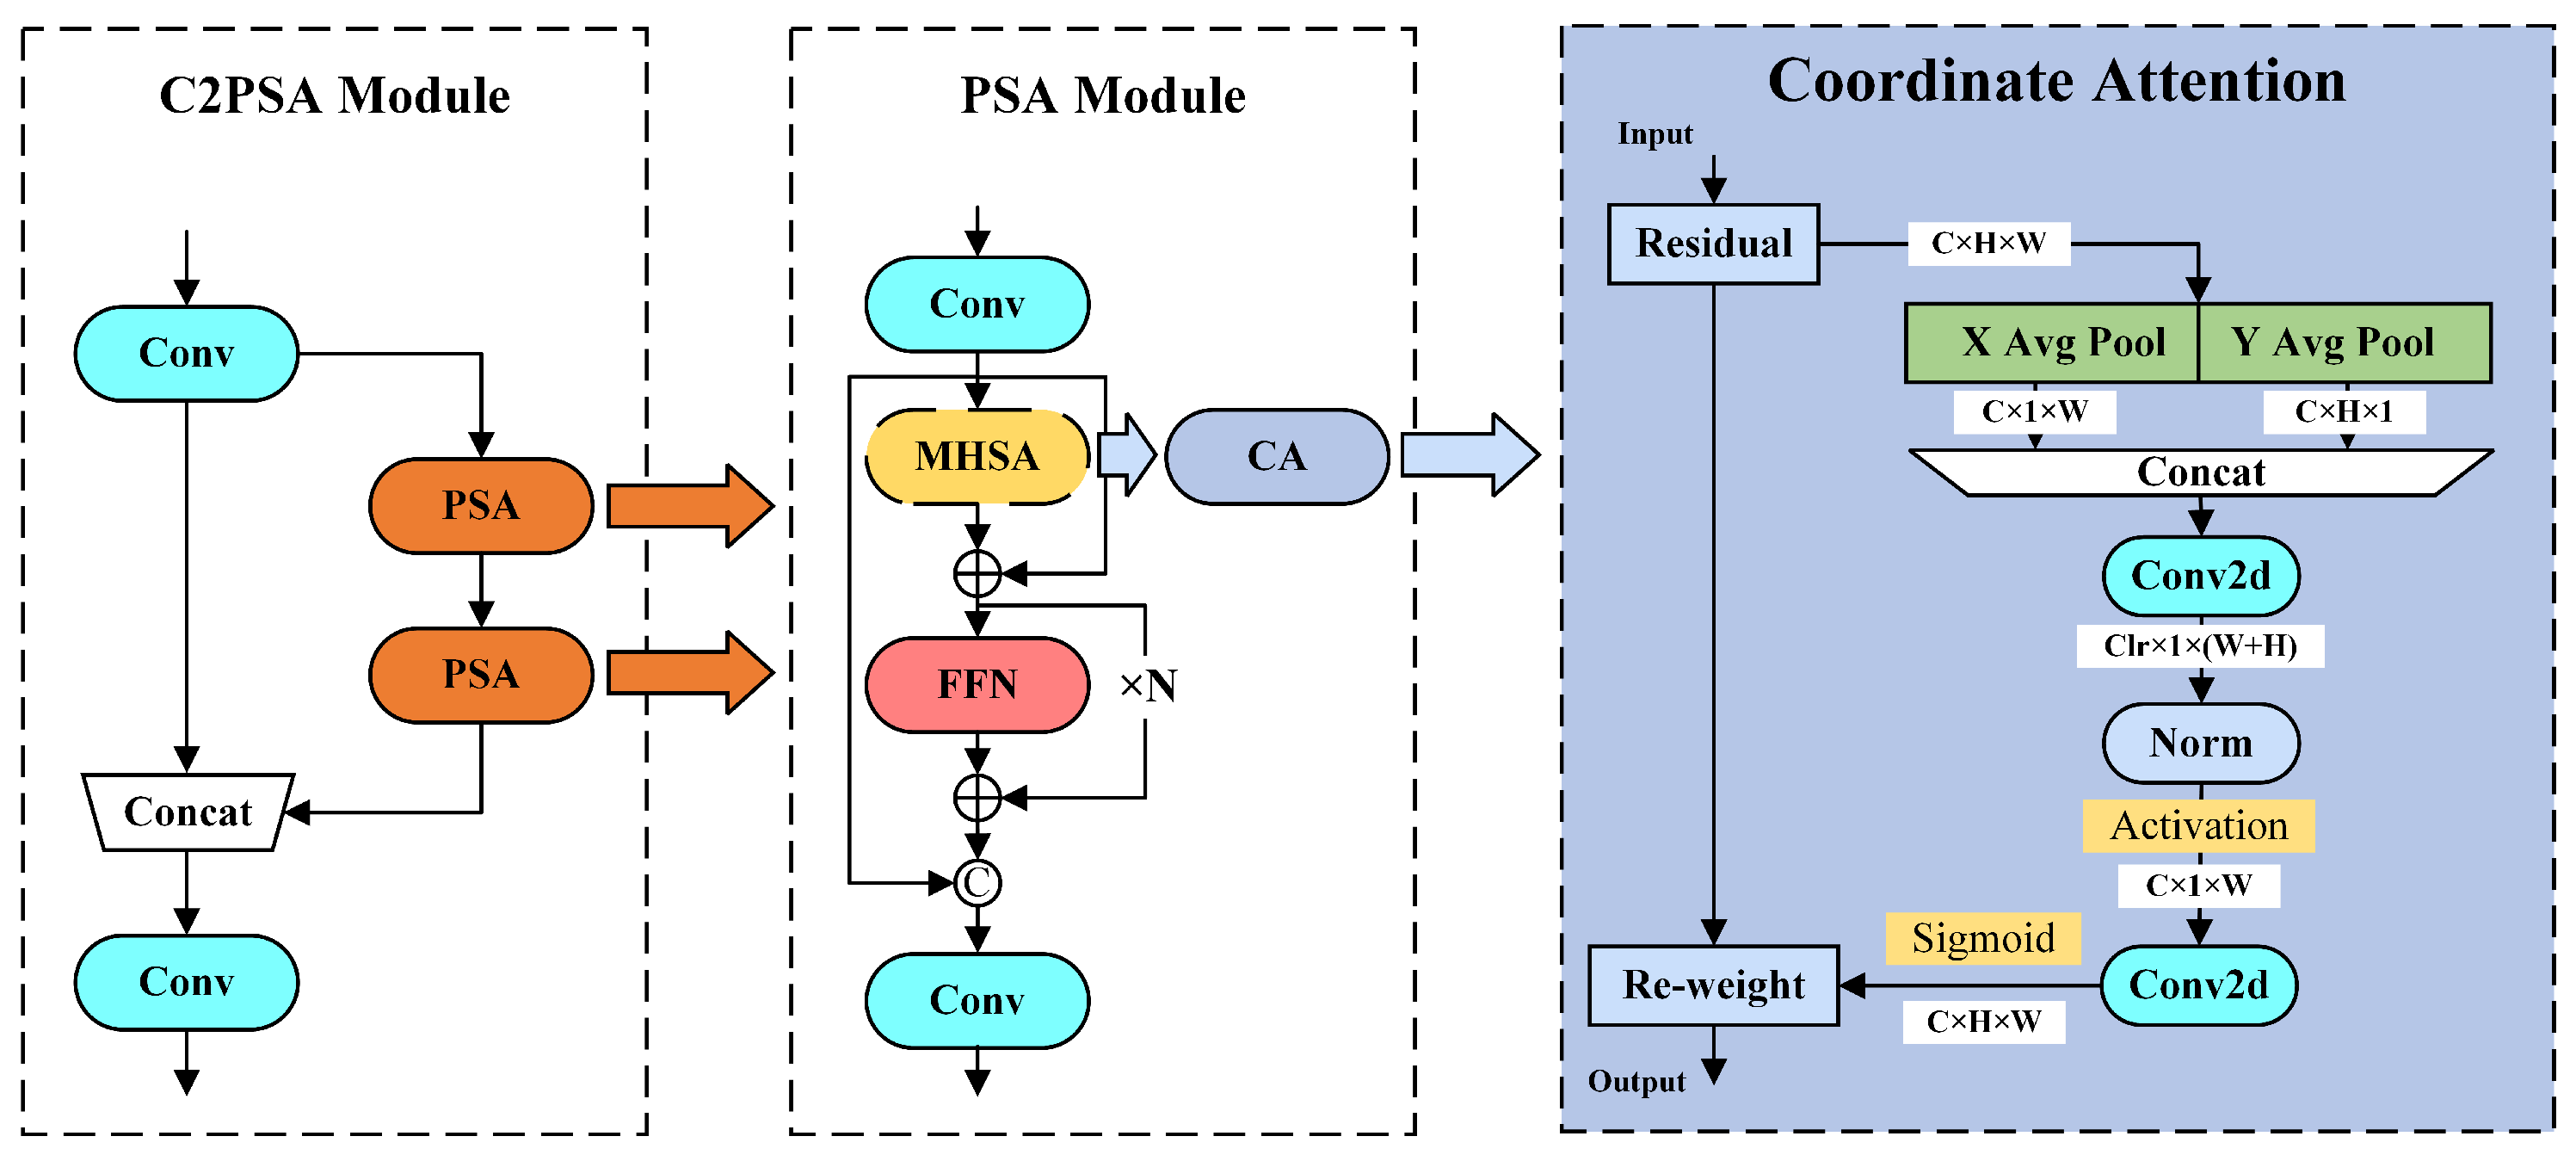
2.3.3. Coordinate Attention Mechanism

In the backbone, this study integrates the CA mechanism proposed by Hou Q et al. [37] to optimize the model’s multi-scale representation ability. As shown in Figure 6, the C2PSA module located at the terminal of the backbone relies on the multi-head self-attention (MHSA) mechanism to achieve cross-scale feature interaction. However, the MHSA mechanism has high computational complexity when processing high-resolution images and is prone to missing local details. Therefore, the MHSA mechanism is replaced with the CA mechanism. A bidirectional coordinate encoding is employed to establish precise positional perception. By decomposing the input vector, the computational load is reduced and the inference speed is improved.
The workflow diagram of the CA mechanism is illustrated in Figure 6. The C2PSA module receives the feature map of the previous scale and strengthens the attention through two cascaded PSA modules internally. Inside the PSA module, the input feature map undergoes global pooling processing in the horizontal and vertical directions. In the horizontal direction, a pooling kernel of size (H, 1) is used to compress each channel, generating a horizontal feature descriptor. This process can be formalized as shown in Equation (2). In the vertical direction, a pooling kernel of size (1, W) is used to perform vertical dimension aggregation, and the relevant process is detailed in Equation (3).
z c h ( h ) = 1 W 0 i < W x c ( h , i )
z c w ( v ) = 1 H 0 j < H x c ( j , w )
In Equation (2), z c h represents the output vector of channel c with a height of h. In Equation (3), z c w represents the output vector of channel c with a width of w. The pooling kernels’ size parameters in the two directions are represented by W and H, and x c stands for the pixel value at the location that corresponds to the convolution kernel during pooling for the input feature map. The dual-scale pooling operation generates feature vectors in two orthogonal dimensions, with scales of (C, 1, W) and (C, H, 1), respectively. The two groups of feature vectors are concatenated in the channel dimension and then subjected to a 1 × 1 convolution operation to extract the global context information across channels. The spatial attention weight matrices in the horizontal and vertical directions are generated through the activation function, and each weight is subjected to an element-wise multiplication operation with the original feature map. This attention mechanism enhances the model’s directional perception ability of the channel features of the young leaves and effectively improves the feature separability between the pixels in the target area and those with similar background pixels.

2.3.4. LR-FPN

The function of the feature pyramid network is to fuse the input multi-scale features. The traditional FPN does not consider spatial information during the fusion process and lacks sufficient analysis of the correlations between different levels. When dealing with low-level features, it often fails to make full use of the shallow position information due to the vanishing gradient problem. Therefore, we introduce the location-refined feature pyramid network (LR-FPN) proposed by Hanqian Li et al. [38] to reconstruct the neck network of YOLOv11n. The network structure of the LR-FPN is illustrated in Figure 7.
In the LR-FPN, the function of the Context Interaction Module (CIM) is to achieve more efficient cross-layer information fusion, which is beneficial for reducing the interference of background noise and suppressing the learning of redundant feature information. The function of the shallow position information extraction module (SPIEM) is to extract low-level features, which can better acquire the leaf orientation information existing in the low-level features. The output of the SPIEM consists of two pooling operations: position pooling and saliency pooling. The formulas are shown in Equations (4) and (5):
F i p = P i 1 h × w r = 1 h c = 1 w F i , r , c
F i s = S i max r , c F i , r , c
F i p and F i s , respectively, represent the outputs obtained after performing the two different pooling operations on the feature map of layer i. P i and S i , respectively, represent the adaptive weights in the two pooling operations. In Equation (4), w and h represent the width and height dimensions of the input feature map, and F i , r , c represents the feature vector at row r and column c in the input feature map.

2.3.5. LP-Detect Module

Linear programming [39] is a mathematical optimization method. In the optimization problem of a planar region, linear programming can dynamically divide the ROI through a set of linear constraints and a decision function. In this study, an LP module is added to the bypass of the detection head, enabling the network to output the ROI prediction boxes. The LP module receives the anchor-box branch output by the detection network and performs linear programming based on the orientation of the young leaves within the constraint function (CF) to generate the preliminary prediction regions. Then, it takes the union of the multiple preliminary prediction regions and outputs the optimal prediction region that has the highest probability of containing the top bud. The calculation for the constraint function CF is shown in Equation (6):
L i R i d max ( d max = 2 w i · h i ) θ min c A ( L i , R i ) θ max c ( c C a t e g o r y 1 , C a t e g o r y 2 , )
In Equation (6), L and R represent the anchor box of the young leaves and the outer edge of the preliminary prediction region, respectively, under each linear constraint, and the Euclidean distance between them does not exceed the maximum distance limit d m a x . w and h are the width and height of the anchor box, respectively. A is the angle limit of the prediction region based on the type of anchor box of the young leaves, and θ m i n c and θ m a x c are the angle intervals associated with a certain type of young leaves. The optimal prediction region generated by the constraint function forms the minimum rectangular box with pixels as the boundary after the pooling operation, which is output as the prediction box. The structure of a single LP-Detect detection head and the process of determining the ROI prediction box are shown in Figure 8. Among the prediction boxes output by multiple LP-Detect detection heads, the intersection over union between the top-bud reference region and the prediction box is used as an accuracy indicator to evaluate and output the most accurate ROI prediction box.

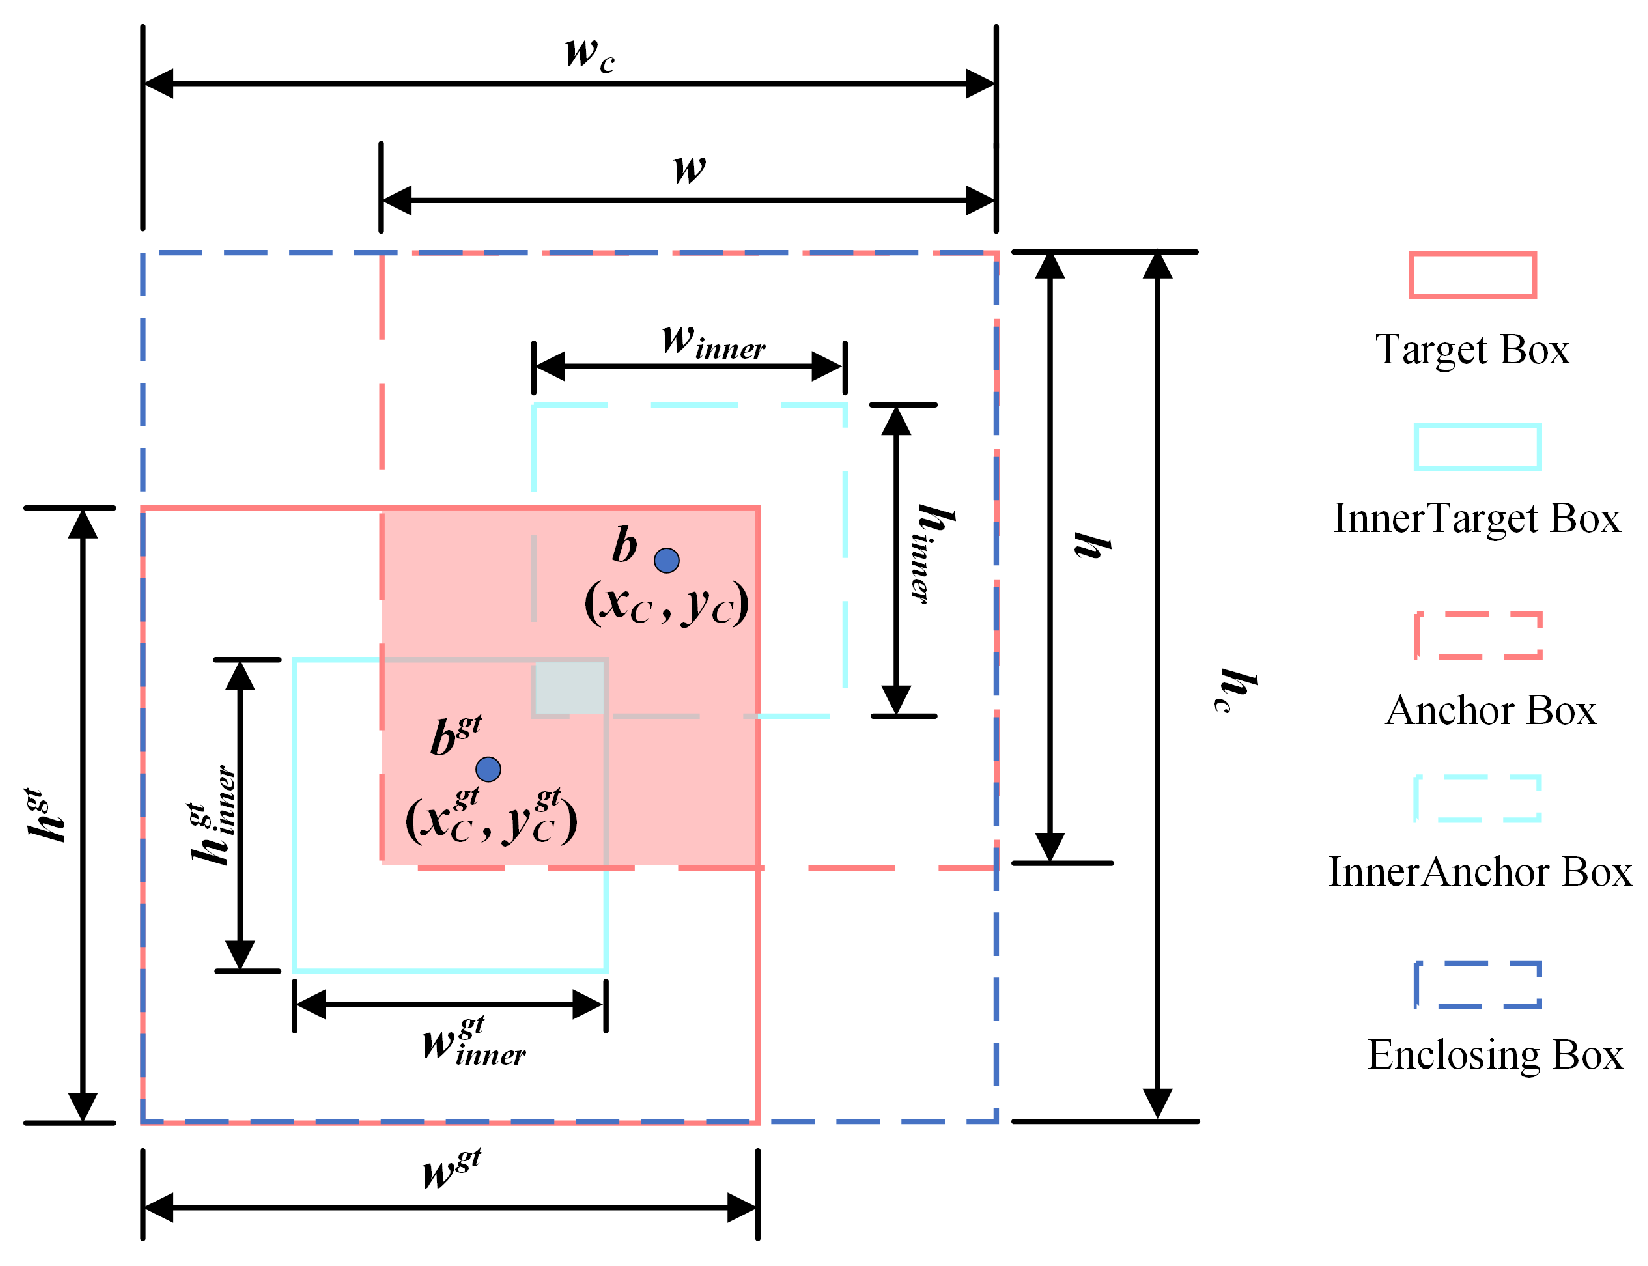
2.3.6. Using the Inner EIoU as the Loss Function

By default, YOLOv11n uses the CIoU as the loss function to determine the regression loss of anchor boxes during the inference process. Its calculation formula is shown in Equation (9):
v = 4 π 2 arctan ( w gt h gt ) arctan ( w h ) 2
α = v 1 IoU + v
L CIoU = 1 IoU + ρ 2 b , b gt c 2 + α v
In Equation (7), the width and height of the target box are represented by w g t and h g t , respectively, whereas the width and height of the anchor box are denoted by w and h. In Equation (8), the parameter v is used to measure the similarity degree of the aspect ratios of the two. The IoU in Equation (8) represents the intersection over union between the ground-truth box and the predicted box, and α is a weight coefficient for similarity. In Equation (9), ρ denotes the Euclidean distance between the center points of the predicted box and the ground-truth box, and c is the diagonal length of the smallest enclosing rectangle that contains these two boxes.
According to the definition of the CIoU, its feedback is based on the shape similarity between the anchor box and the target box. It only relies on the angle to distinguish the difference between the two, with a single criterion, which may lead to deviations in the calibration direction, and there is a risk of degradation of the loss function. In LGN-YOLO, the inner EIoU proposed by Zhang Hao et al. [40] is used as the loss function. The definition is shown in Equation (10):
L E I o U = 1 I o U + ρ 2 ( b , b g t ) c 2 + ρ 2 ( w , w g t ) ( w c ) 2 + ρ 2 ( h , h g t ) ( h c ) 2
In Equation (10), w c and h c are the width and height of the smallest enclosing rectangles of the anchor box and the target box, respectively. The principle of the inner EIoU is shown in Figure 9. The inner EIoU dynamically adjusts the gradient according to the specified ratio factor and generates auxiliary bounding boxes inside the anchor box and the target box to penalize the regression results, overcoming the possible function degradation problem in the CIoU. The auxiliary boxes can further enhance the aspect ratio of the anchor boxes, alleviating the sensitivity of small object regression. Meanwhile, they provide effective gradients for the generation of prediction boxes, assisting the LP solver in approaching the global optimal solution more rapidly.

2.4. Performance Metrics

The performance metrics used to evaluate the model include precision (P), recall (R), and mean average precision (mAP). The real-time capability of the model is evaluated based on the inference speed, measured as the number of frames per second. In addition, the mean intersection over union (mIoU) is used to evaluate the accuracy of the ROI prediction boxes. Considering that there is a significant difference in size between the top bud and the prediction box, in order to highlight the statistical significance and capture the performance changes of the prediction box more sensitively, the original value is multiplied by 10 when calculating the mIoU. The search range compression ratio (SRCR) is used to evaluate the model’s ability to optimize the top-bud detection range. The calculations for the performance metrics are shown in Equations (11) to (15):
P = T P T P + F P
R = T P T P + F N
m A P = i = 1 n 0 1 P ( R ) d R n
S R C R = 1 N i = 1 N 1 | ( x 1 N x 2 N ) ( y 1 N y 2 N ) | S i m a g e N
m I o U = 10 N i = 1 N ( S R O I S b u d ) ( S R O I S b u d )
In Equations (11) and (12), True Positive (TP) refers to the number of young-leaf samples correctly identified, False Positive (FP) represents the number of misjudged samples, and False Negative (FN) corresponds to the number of undetected samples. In Equation (13), the parameter n represents the total number of detection categories, and in the settings for this experiment, this value is fixed at 8. When mAP is calculated using a confidence threshold of 0.5, the obtained performance metric is denoted as mAP50, which means that only when the confidence of the output anchor box exceeds 0.5 is the detection result recognized as belonging to a certain category. In Equation (14), ( x 1 , y 1 ) and ( x 2 , y 2 ) represent the coordinates of two opposite corners of the output ROI prediction box, and S i m a g e represents the pixel area of the image. In Equation (15), S R O I and S b u d represent the pixel areas of the prediction box and the top-bud reference area, respectively. N represents the total number of samples in the current set.

3. Experimental Results and Analysis

3.1. Experimental Environment

The computing platform used for model inference and performance evaluation was an Intel(R) Xeon(R) E5-2680 CPU with an NVIDIA A100 (40G) GPU running on Ubuntu Server 20.04 (64-bit). The version of the CUDA development tool used was 12.4 in conjunction with the PyTorch 2.5.1 deep learning framework. The programming language used was Python 3.10. The preset hyperparameter values before the experiment are shown in Table 2.

3.2. Model Training and Validation Results

The changes in the various performance indicators and loss values of LGN-YOLO during multiple rounds of training are shown in Figure 10. According to the shape of the curve, the model started to converge at around 50 epochs and reached convergence at the 132nd epoch. In this study, a validation set was used for cross-validation during training. As indicated by the loss value change curve in Figure 10, the validation effect was good, and the loss value distribution was narrower than that during training. According to the performance curve, the model exhibited good performance in both detecting young leaves and generating ROI prediction boxes. The detection accuracy for young leaves exceeded 90%, and the accuracy of the ROI was close to 60%. The search range compression ratio was relatively high, which was above 90%.

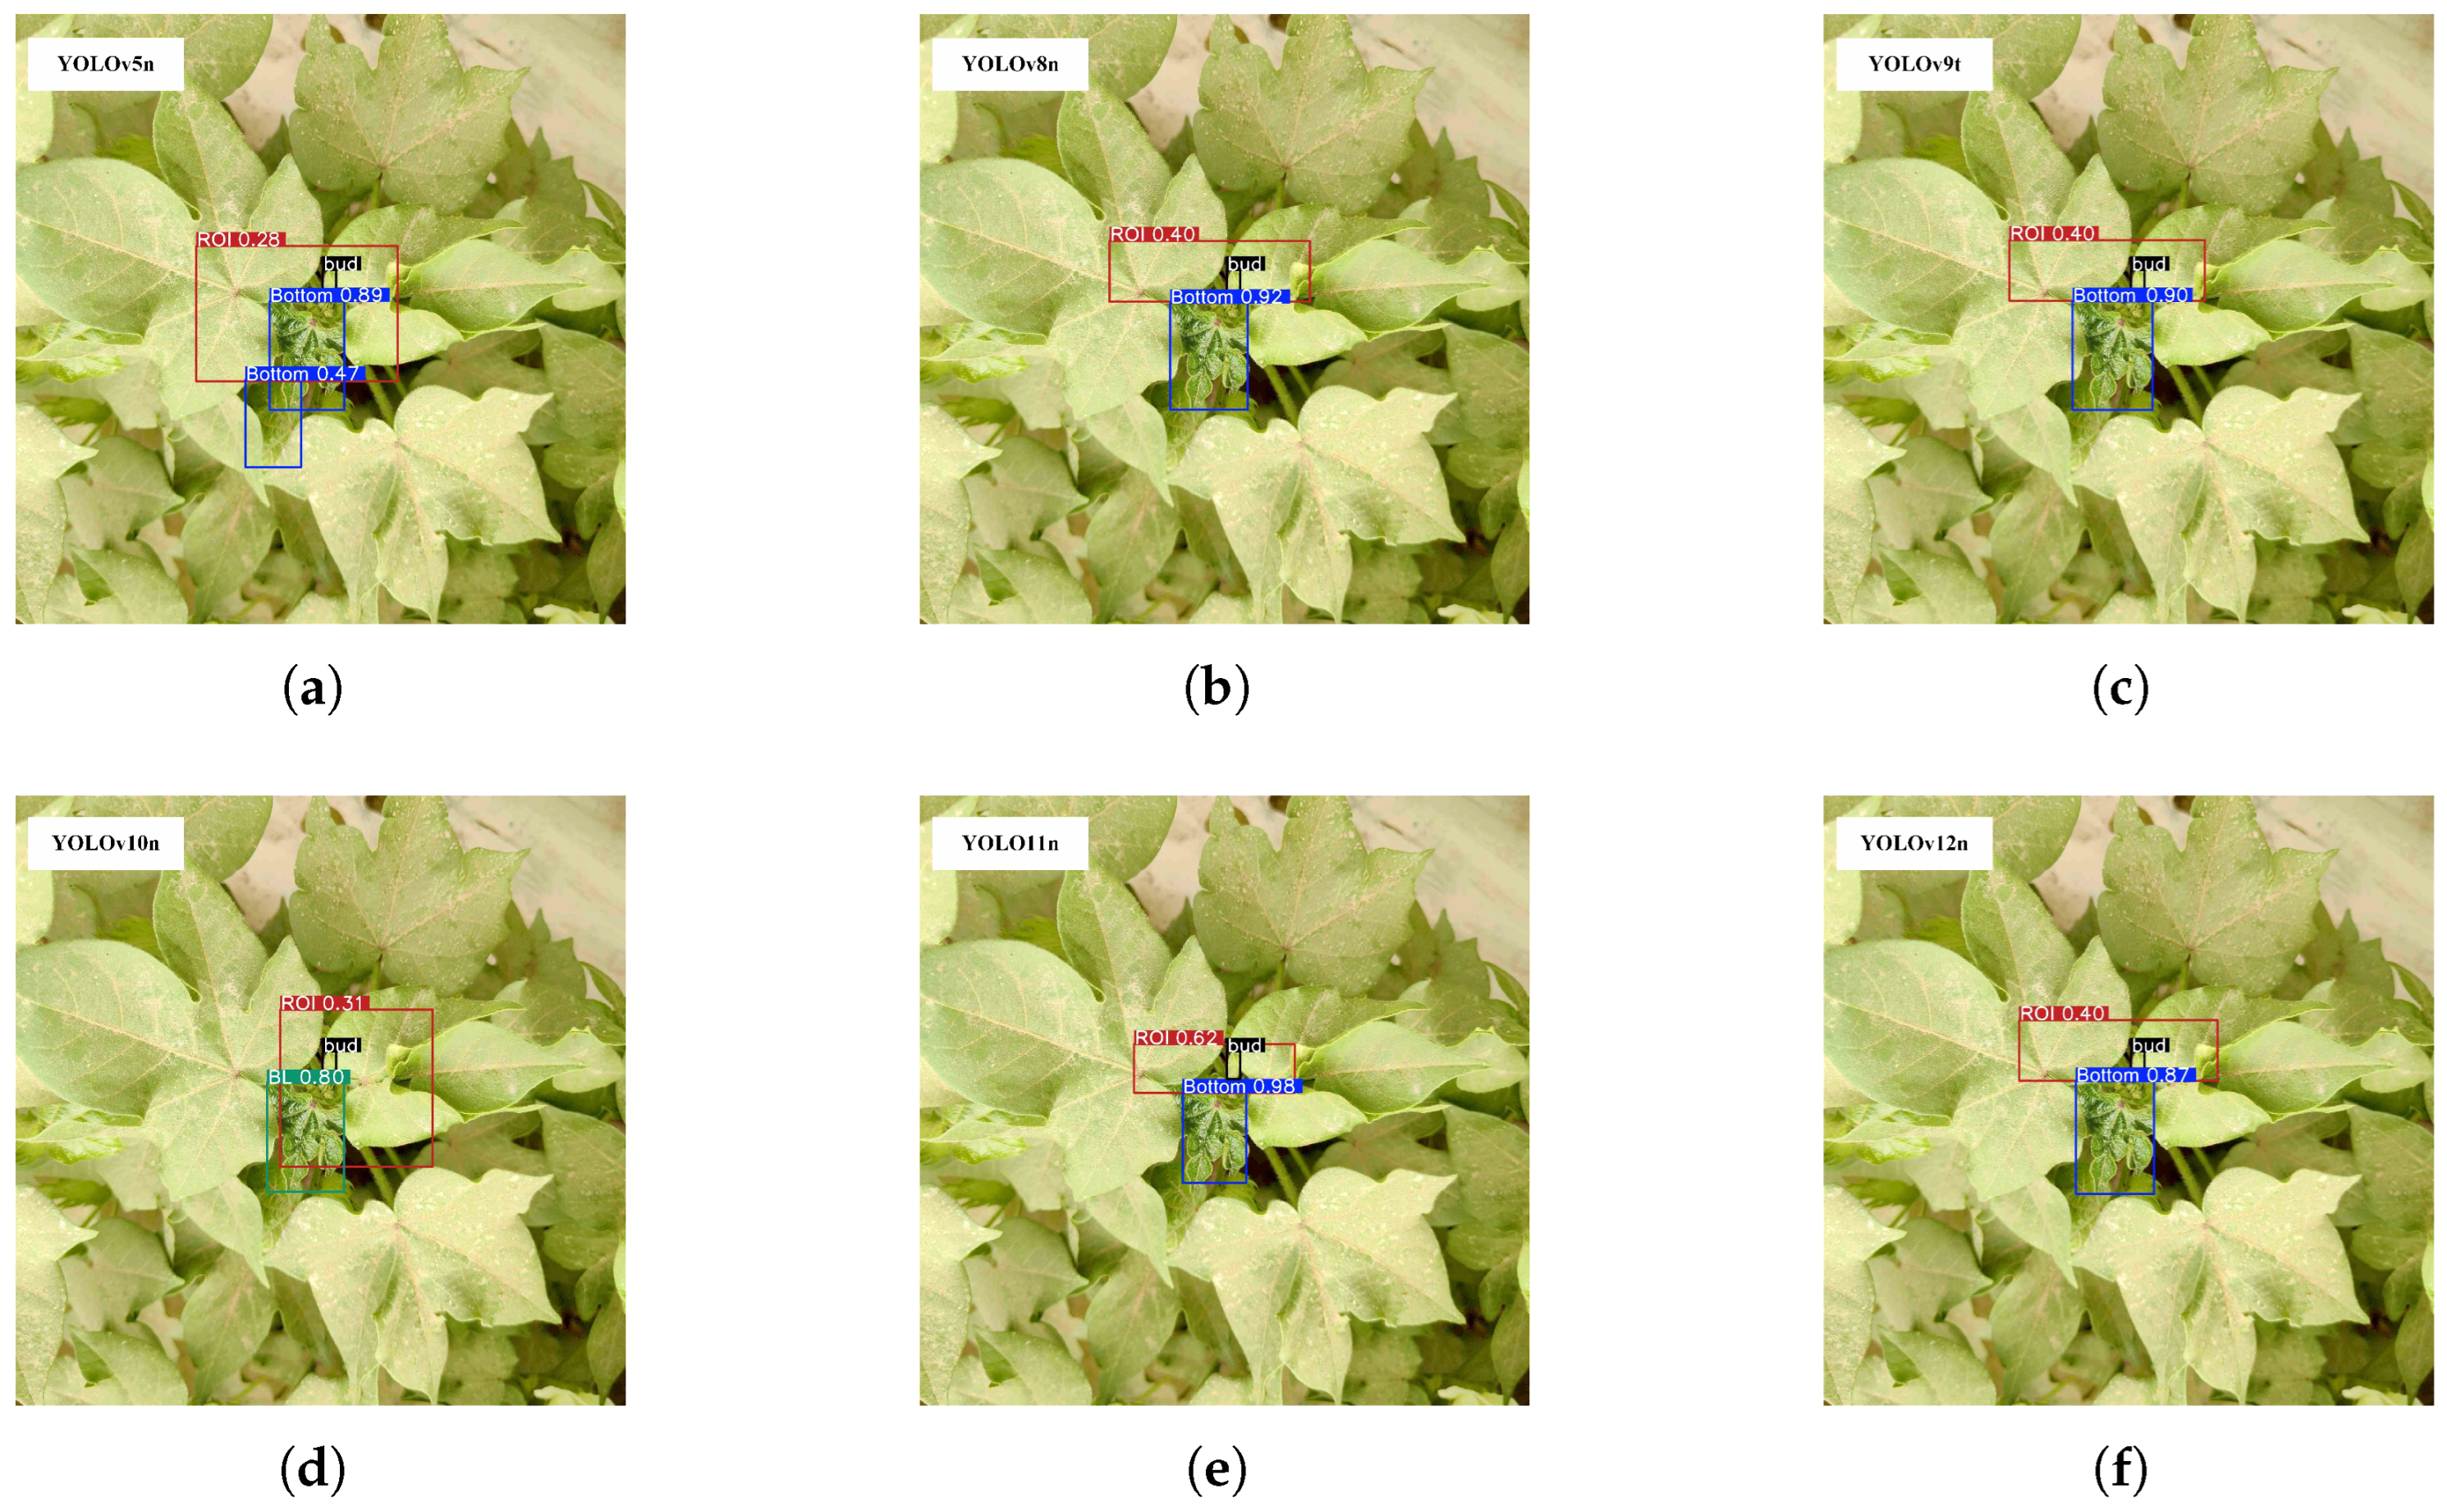
3.3. Comparative Experiment

In order to verify the rationality of the baseline model selected for the experiment, we conducted comparative experiments using single-stage detection models with different specifications, including the smaller-sized YOLOs series, RT-DETRv2 [41], and RT-DETRv3 [42], as well as the micro-sized YOLOn series. In the model, the LP-Detect detection head was integrated to enable it to detect young leaves and perform linear programming. The results on the cotton plant dataset are shown in Table 3.
According to the experimental results shown in Table 3, in terms of young-leaf detection, RT-DETR, YOLOv10, and YOLOv11 exhibited significant advantages in accuracy. Among them, RT-DETRv3 had the highest mAP50 of 94.5%, followed by YOLOv11s and YOLOv10s with 94.4% and 92.7%, respectively. Considering the balance between accuracy and speed in actual production, although these models achieved high accuracy, their inference speeds were all below 100 FPS, which is likely to result in real-time performance degradation due to the limited computing power in production environments. Among the micro-sized models, YOLOv11n exhibited a significant advantage in accuracy, with an mAP50 of 92.4%. It was the closest to the model with the highest accuracy, RT-DETRv3, and differed from YOLOv11s by 2%. In terms of speed, YOLOv11n achieved 133.5 FPS, approximately 15 FPS slower than the fastest model, YOLOv10n, demonstrating high computational speed among the micro-sized models. When generating ROIs, YOLOv11n achieved an average intersection over union of 0.612 and an SRCR of 93.1%, performing the best among the micro-sized models.
This demonstrates that the prediction box output by YOLOv11n more accurately covered the area where the top bud was located, and the proportion of redundant pixels within the prediction box was relatively small. The division of the ROI was more accurate than that of other algorithms. Figure 11 shows the output results of the six micro-sized models on the same image.
In Figure 11a,d, although problems with false detection and misclassification are visible, affecting the performance of the prediction box, from the perspective of the whole image, the ROIs still contain all the features of the top bud and effectively compress the search range for detection. This phenomenon indicates that the ROI generation method used in this study has high robustness. As can be seen in Figure 11b,c,f, the quality of the ROI prediction box is closely related to the position of the anchor box for the young leaves. Although the confidence levels of the three anchor boxes in the figures are different, their spatial distributions are similar. Therefore, the generated ROI regions also exhibit consistency. This fully verifies that the linear programming method and the detection algorithm have good synergy.
From the perspective of balancing detection accuracy and computational speed, the baseline should be selected from among the micro-sized models. YOLOv10n exhibited the lowest computational complexity, with 148.9 FPS, and YOLOv11n ranked second, with 133.5 FPS. Both meet real-time requirements. However, in terms of the mAP50 and SRCR metrics, YOLOv11n has more prominent advantages. Therefore, YOLOv11n is the most suitable model to serve as the baseline.

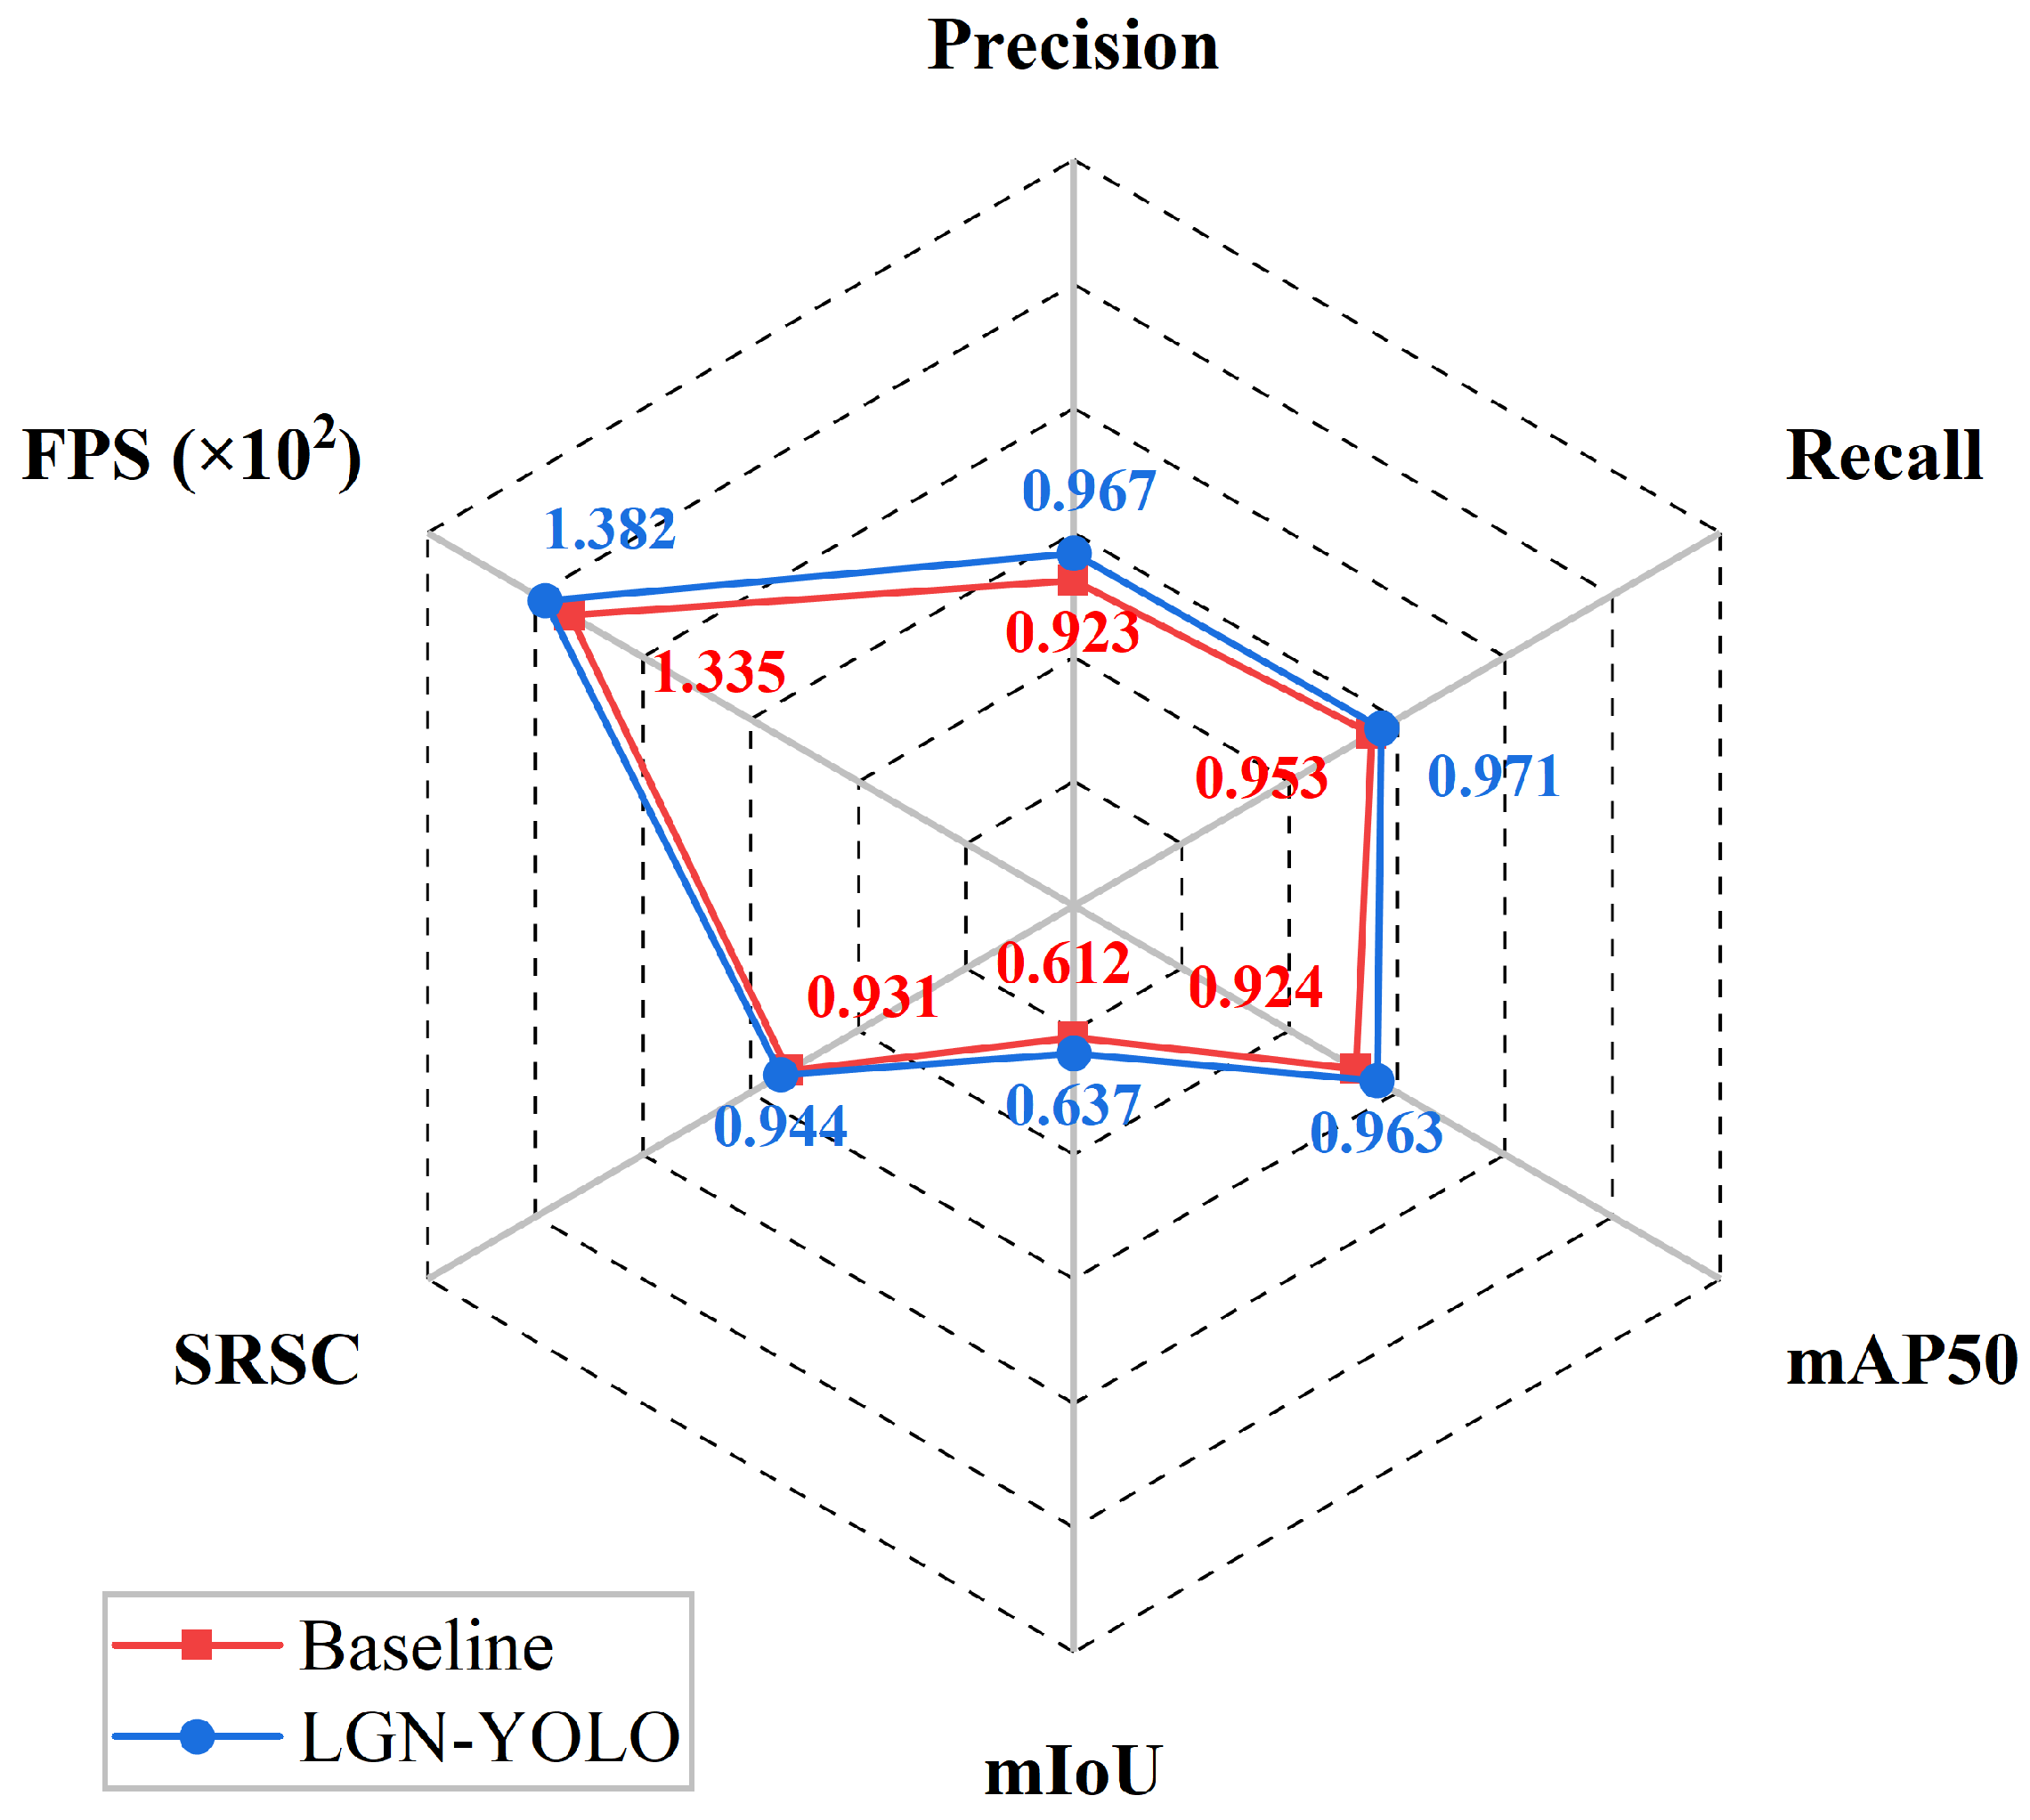
3.4. Ablation Experiment

The LP-Detect detection head is used to generate the ROI. In order to verify the effects of the other introduced modules and structures on the generated prediction boxes, we conducted an ablation experiment, and the experimental results are shown in Table 4.
In Table 4, Group 1 does not include any additional modules and serves as the baseline model, while Group 5 represents LGN-YOLO. By comparing Group 1 and Group 2, it is evident that the introduction of the CA mechanism increased the precision by 1.9% and the mAP by 1.6%. The improvement in the accuracy of the anchor boxes effectively avoided risks such as false detections. While accurately detecting young leaves, it also provided more accurate guidance for the prediction boxes. After introducing the CA mechanism, the SRCR increased by 0.2%, and the ratio of the ROI to the whole image was further reduced. According to the FPS, the inclusion of the CA mechanism did not significantly increase the computational complexity of the model. By comparing Group 1 and Group 3, it is evident that the reorganized LR-FPN structure achieved better lightweight performance, increasing the algorithm’s FPS by 10.7 frames. The precision and recall of Group 3 improved by 1.5% and 0.7%, respectively, compared to the baseline model, indicating that this structure effectively enhances the model’s ability to distinguish the orientation of young leaves. This further strengthened the constraints during ROI generation, leading to improvements of 0.9% and 0.6% in the mIoU and SRCR, respectively. The difference between Group 4 and Group 5 is that the latter utilizes the inner EIoU as the loss function. As the FPS of Group 5 dropped by six frames, it can be seen that the newly introduced loss function increased the computational load. However, since the inner EIoU can dynamically adjust the gradient, the size penalty mechanism for the anchor boxes corrected the loss component, enabling the model to achieve a 0.9% improvement in detection accuracy at the cost of a small amount of computation and further increasing the compression ratio of the prediction boxes by 0.4%. As shown in Figure 12, the improved model demonstrates comprehensive performance enhancements compared to the baseline.

3.5. Adjustment of Loss Function

The inner EIoU optimizes the size of the anchor box for young leaves using the auxiliary box mechanism and provides an effective gradient for the prediction box. The size of the auxiliary box is controlled by the ratio factor. For smaller targets, a larger ratio factor should be selected to generate a larger auxiliary box and expand the effective regression range. In order to enable the model to dynamically adjust the loss calculation process during detection and thus improve the quality of the generated ROI prediction boxes, we conducted four groups of tests within the commonly used value range of the ratio factor [0, 1.5], and the results are shown in Table 5.
By comparing the FPS values of the experimental groups in Table 5, it is evident that varying the size of the auxiliary box did not impact the model’s computational complexity. A comparison between the first and fourth experimental groups reveals that when the ratio was set to 1.5, the accuracy of the anchor boxes increased by 0.9%, and the mIoU and SRCR of the prediction boxes improved by 0.4%. This indicates that the enhancement effect of the inner IoU grew as the ratio factor increased. Analyzing the mAP values of the second, third, and fourth groups shows that the improvement in accuracy reached a plateau as the ratio increased. Specifically, each 0.5 increment in the ratio resulted in less than a 0.1% increase in the mAP. Figure 13 illustrates the changes in the classification loss, box loss, and distribution focal loss during model training with different ratio values. When the ratio was 1.5, the loss values converged the fastest and to the lowest levels, indicating optimal classification and regression performance. Therefore, in this study, the ratio for the inner EIoU was set to 1.5.

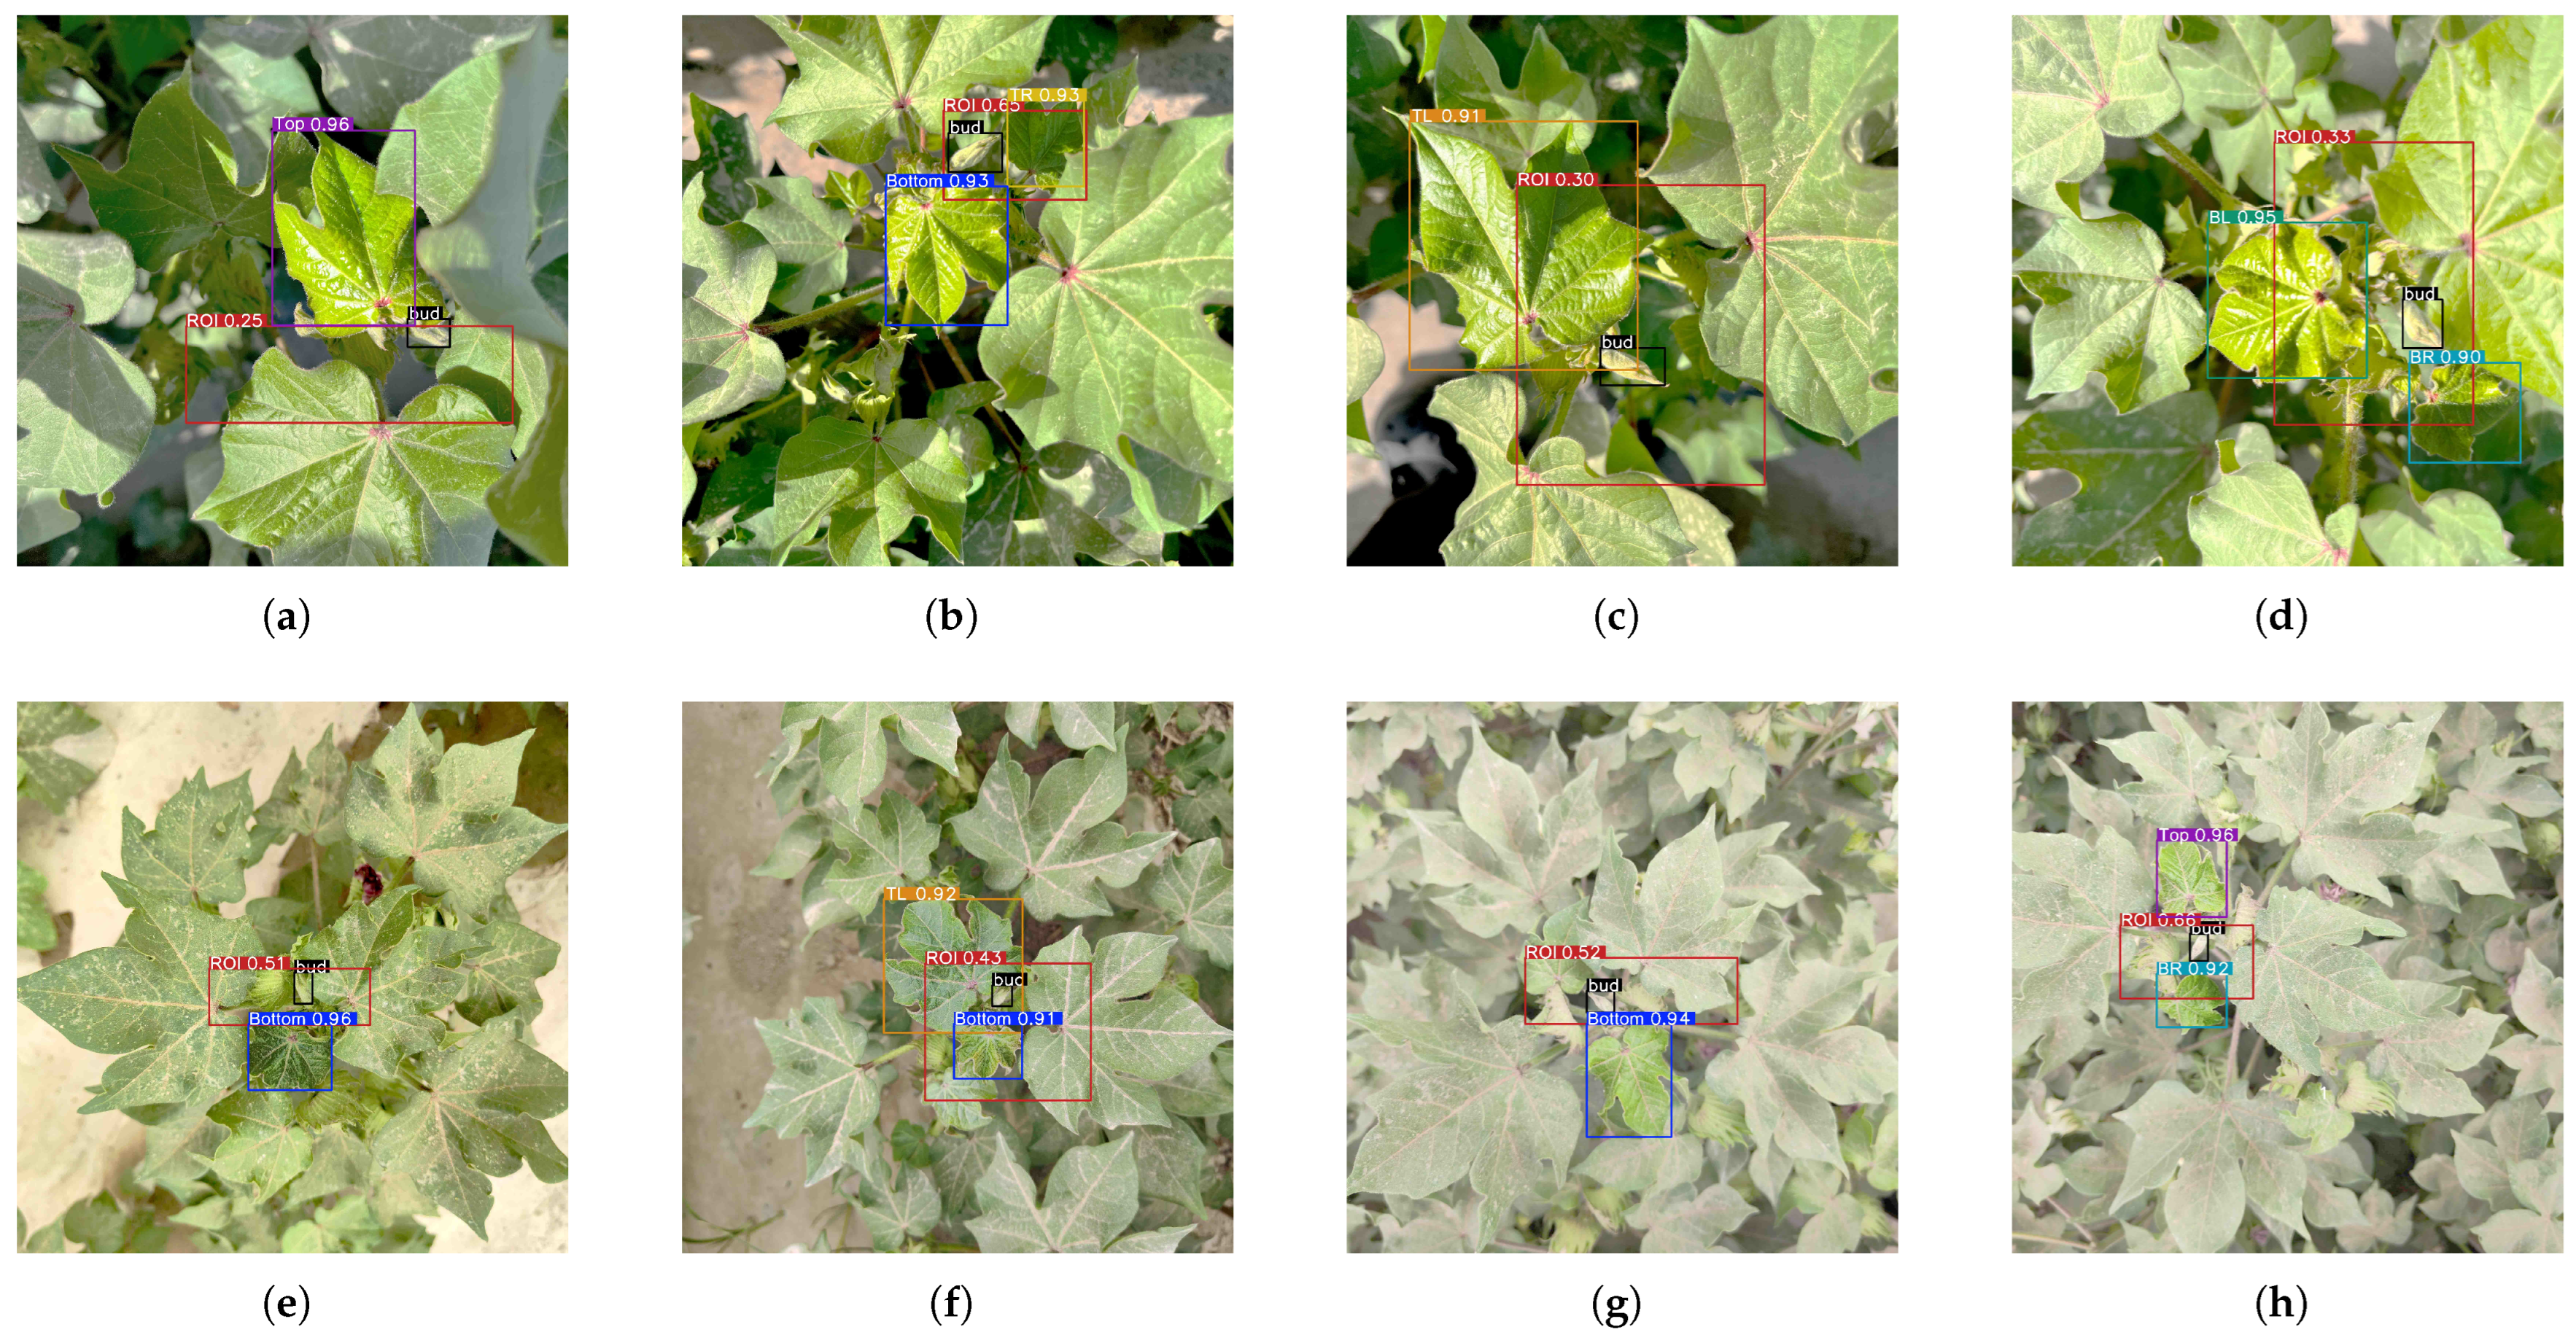
3.6. Experimental Results in a Cotton Field

Under different weather conditions, when locating the top bud based on the young leaves in a field environment, the morphology of the young leaves can mainly be categorized as either single-leaf or multi-leaf, while the morphology of the top bud is categorized as either complete contour (uncovered) or missing contour (covered). We selected samples representing these various categories from the test set, and the performance of LGN-YOLO on these samples is shown in Figure 14.
By comparing (c) and (d), as well as (g) and (h), in Figure 14, it can be seen that whether the contour of the top bud is complete or not has almost no effect on the size of the ROI prediction box. The accuracy of the ROI and the SRCR metrics mainly depends on the number of young leaves and the detection accuracy. By comparing (a) and (b) in Figure 14, it can be seen that under the same weather conditions, the ROI accuracy of the multi-leaf category is higher than that of the single-leaf category, indicating that the morphological characteristics of the young leaves have a strong connection to the spatial position of the top bud. The increase in the number of young leaves leads to more constraints in linear programming, which not only limits the size of the ROI but also increases its accuracy. For all samples, the prediction box contains the complete features of the top bud; the size of the prediction box in the figures is significantly smaller than the size of the whole image, indicating that LGN-YOLO can effectively reduce the search range of the area where the top bud is located.

3.7. Discussion

The results of the comparative experiment show that after adding the LP-Detect detection head, the ROI output by YOLOv11n was the most accurate among algorithms of the same type. The mIoU was 11.8% higher than that of the previous-generation model (YOLOv10n) and 8.9% higher than that of the next-generation model (YOLOv12n). The ROI generated by YOLOv11n excluded a large amount of redundant information in the original image and retained the complete features of the top bud. Using the ROI as the training data for the top-bud detection algorithm can reduce the search range for the features of the top bud by 93.1%, which is of great significance for saving computational resources. The results of the ablation experiment showed that the performance of the ROI generation mechanism was positively correlated with the performance of the young-leaf detection algorithm. By introducing the CA mechanism, LR-FPN, and inner EIoU to improve detection accuracy, the mean intersection over union of the ROI and the compression ratio of the search range were also enhanced. Compared with the baseline model, the accuracy of the ROI of LGN-YOLO increased by 2.5%, the SRCR increased by 1.3%, and the detection speed improved by 3.8%.
In the ablation experiments, LGN-YOLO demonstrated high real-time performance under server-level computing power, verifying that the model structure has lightweight characteristics. This feature gives the model advantages in embedded scenarios, enabling more efficient utilization of limited computational resources when deployed on edge devices [43]. Meanwhile, the lightweight ROI generation mechanism can further concentrate target features, significantly reducing the cost of subsequent processing.
The improved model proposed in this study locates top buds based on the botanical characteristics of cotton, and this method is also worth promoting for the positioning of similar crops. The improved detection model is not only suited for automated topping tasks but can also be migrated to the production practices of other crops, demonstrating broad application potential.

4. Conclusions

In this study, a dataset of cotton plant images containing samples of top buds and young leaves was established. Using LabelImg (version 1.8.6), the young leaves were classified into eight categories according to their growth directions, and the target reference areas of the top buds were annotated. By introducing the LP-Detect detection head, the YOLO network was endowed with the ability to output ROI prediction boxes. Taking the performance of the detection boxes and prediction boxes as the precision index, YOLOv11n, which exhibited better real-time performance, was selected as the baseline model. In the backbone of the baseline model, the CA mechanism was used to strengthen the separation of the target from the background, and a new lightweight feature pyramid network, LR-FPN, was designed in the neck to enhance the cross-scale feature fusion. Finally, the inner EIoU was used as the new loss function, and the penalty strength of the function was adjusted to the optimal state through the ratio factor, achieving higher accuracy and faster convergence gains at the cost of a slight rise in computational complexity. The results of the ablation experiment showed that the accuracy of the generated ROI prediction boxes increased with the precision of the young-leaf detection, and the filtering effect on redundant information was also enhanced. Through testing, the pixel area of the ROIs generated by LGN-YOLO accounted for an average of 6% of the original image, filtering out more than 90% of irrelevant pixels. The mIoU of the model reached 63.7%, maintaining the main features of the top bud while achieving a good balance in the size of the ROIs. In the field experiment, the model showed high accuracy in ROI prediction by detecting young leaves and performing linear programming, demonstrating the reliability of the ROI generation method guided by leaves.
Our research provides an optimization strategy for the top-bud detection algorithm and the detection area. Although the expected results were achieved, there remains potential for improvement in the experimental methods. To improve efficiency in the data collection phase, low-altitude flight sampling by unmanned aerial vehicles (UAVs) will be used in subsequent research to replace manual photography. To reduce the time cost of manual annotation during the data annotation phase, automatic annotation tools such as SAM will be considered.
In subsequent work, we plan to further integrate this method with the top-bud detection algorithm and test the collaborative ability of the two in different hardware scenarios. In future work, we aim to broaden the application range of the model by enriching the dataset and applying this method to more detection scenarios in agricultural automation.

Author Contributions

Conceptualization, Y.X. and L.C.; methodology, Y.X.; software, Y.X.; validation, Y.X.; formal analysis, Y.X.; investigation, Y.X.; resources, Y.X.; data curation, Y.X. and L.C.; writing—original draft preparation, Y.X.; writing—review and editing, L.C.; visualization, Y.X.; supervision, L.C.; project administration, L.C.; funding acquisition, L.C. All authors have read and agreed to the published version of the manuscript.

Funding

This research was funded by the National Natural Science Foundation of China (61961034), the Regional Innovation Guidance Plan of the Science and Technology Bureau of Xinjiang Production and Construction Corps (2021BB012 and 2023AB040), the Modern Agricultural Engineering Key Laboratory at the Universities of the Education Department of Xinjiang Uygur AutonomousRegion (TDNG2022106), and the Innovative Research Team Project of Tarim University President (TDZKCX202308).

Institutional Review Board Statement

Not applicable.

Data Availability Statement

The data utilized in this study can be obtained upon request from the corresponding author.

Acknowledgments

The authors would like to thank the research team members for their contributions to this work.

Conflicts of Interest

The authors declare that they have no known competing financial interests or personal relationships that could have appeared to influence the work reported in this paper.

References

  1. Pettigrew, W.; Heitholt, J.; Meredith, W., Jr. Early season floral bud removal and cotton growth, yield, and fiber quality. Agron. J. 1992, 84, 209–214. [Google Scholar] [CrossRef]
  2. Zhang, X.; Chen, L. Bud-YOLO: A Real-Time Accurate Detection Method of Cotton Top Buds in Cotton Fields. Agriculture 2024, 14, 1651. [Google Scholar] [CrossRef]
  3. Guangze, X.; Jianping, Z.; Yan, X.; Xuan, P.; Chao, C. Cotton top bud recognition in complex environment based on improved YOLOv5s. J. Chin. Agric. Mech. 2024, 45, 275. [Google Scholar]
  4. Redmon, J.; Divvala, S.; Girshick, R.; Farhadi, A. You only look once: Unified, real-time object detection. In Proceedings of the IEEE Conference on Computer Vision and Pattern Recognition, Las Vegas, NV, USA, 27–30 June 2016; pp. 779–788. [Google Scholar]
  5. Liu, W.; Anguelov, D.; Erhan, D.; Szegedy, C.; Reed, S.; Fu, C.Y.; Berg, A.C. Ssd: Single shot multibox detector. In Proceedings of the Computer Vision–ECCV 2016: 14th European Conference, Amsterdam, The Netherlands, 11–14 October 2016; Proceedings, Part I 14. Springer: Berlin/Heidelberg, Germany, 2016; pp. 21–37. [Google Scholar]
  6. Ren, S.; He, K.; Girshick, R.; Sun, J. Faster R-CNN: Towards real-time object detection with region proposal networks. IEEE Trans. Pattern Anal. Mach. Intell. 2016, 39, 1137–1149. [Google Scholar] [CrossRef]
  7. Cai, Z.; Vasconcelos, N. Cascade r-cnn: Delving into high quality object detection. In Proceedings of the IEEE Conference on Computer Vision and Pattern Recognition, Salt Lake City, UT, USA, 18–23 June 2018; pp. 6154–6162. [Google Scholar]
  8. Gao, Y.; Yin, F.; Hong, C.; Chen, X.; Deng, H.; Liu, Y.; Li, Z.; Yao, Q. Intelligent field monitoring system for cruciferous vegetable pests using yellow sticky board images and an improved Cascade R-CNN. J. Integr. Agric. 2025, 24, 220–234. [Google Scholar] [CrossRef]
  9. Shuang, Z.; Yu, Y.; Miao, Y.; Liu, K. Research of impurity detection of green vegetable based on improved Mask R-CNN. J. Chin. Agric. Mech. 2024, 45, 77–82+140. [Google Scholar] [CrossRef]
  10. Tu, S.; Pang, J.; Liu, H.; Zhuang, N.; Chen, Y.; Zheng, C.; Wan, H.; Xue, Y. Passion fruit detection and counting based on multiple scale faster R-CNN using RGB-D images. Precis. Agric. 2020, 21, 1072–1091. [Google Scholar] [CrossRef]
  11. Bargoti, S.; Underwood, J. Deep fruit detection in orchards. In Proceedings of the 2017 IEEE International Conference on Robotics and Automation (ICRA), Singapore, 29 May–3 June 2017; pp. 3626–3633. [Google Scholar] [CrossRef]
  12. Feng, H.; Mu, G.; Zhong, S.; Zhang, P.; Yuan, T. Benchmark analysis of yolo performance on edge intelligence devices. Cryptography 2022, 6, 16. [Google Scholar] [CrossRef]
  13. Wang, X.; Li, X.; Du, H.; Wang, J. Design of an intelligent disinfection control system based on an STM32 single-chip microprocessor by using the YOLO algorithm. Sci. Rep. 2024, 14, 31686. [Google Scholar] [CrossRef]
  14. Shu, M.; Li, C.; Xiao, Y.; Deng, J.; Liu, J. Research on items sorting robot based on SSD target detection. In ITM Web of Conferences; EDP Sciences: Les Ulis, France, 2022; Volume 47, p. 01031. [Google Scholar]
  15. Ramesh, G.; Jeswin, Y.; Divith, R.R.; BR, S.; Daksh, U.; Kiran Raj, K. Real Time Object Detection and Tracking Using SSD Mobilenetv2 on Jetbot GPU. In Proceedings of the 2024 IEEE International Conference on Distributed Computing, VLSI, Electrical Circuits and Robotics (DISCOVER), Mangalore, India, 18–19 October 2024; IEEE: Piscataway, NJ, USA, 2024; pp. 255–260. [Google Scholar]
  16. Wang, L.; Shi, W.; Tang, Y.; Liu, Z.; He, X.; Xiao, H.; Yang, Y. Transfer Learning-Based Lightweight SSD Model for Detection of Pests in Citrus. Agronomy 2023, 13, 1710. [Google Scholar] [CrossRef]
  17. Zoubek, T.; Bumbálek, R.; Ufitikirezi, J.d.D.M.; Strob, M.; Filip, M.; Špalek, F.; Heřmánek, A.; Bartoš, P. Advancing precision agriculture with computer vision: A comparative study of YOLO models for weed and crop recognition. Crop Prot. 2025, 190, 107076. [Google Scholar] [CrossRef]
  18. Li, T.; Zhang, L.; Lin, J. Precision agriculture with YOLO-Leaf: Advanced methods for detecting apple leaf diseases. Front. Plant Sci. 2024, 15, 1452502. [Google Scholar] [CrossRef]
  19. Gomez, D.; Selvaraj, M.G.; Casas, J.; Mathiyazhagan, K.; Rodriguez, M.; Assefa, T.; Mlaki, A.; Nyakunga, G.; Kato, F.; Mukankusi, C.; et al. Advancing common bean (Phaseolus vulgaris L.) disease detection with YOLO driven deep learning to enhance agricultural AI. Sci. Rep. 2024, 14, 15596. [Google Scholar] [CrossRef] [PubMed]
  20. Li, J.; Li, J.; Zhao, X.; Su, X.; Wu, W. Lightweight detection networks for tea bud on complex agricultural environment via improved YOLO v4. Comput. Electron. Agric. 2023, 211, 107955. [Google Scholar] [CrossRef]
  21. Wang, R.F.; Tu, Y.H.; Chen, Z.Q.; Zhao, C.T.; Su, W.H. A Lettpoint-Yolov11l Based Intelligent Robot for Precision Intra-Row Weeds Control in Lettuce. SSRN 2025, 5162748. [Google Scholar]
  22. Song, K.; Chen, S.; Wang, G.; Qi, J.; Gao, X.; Xiang, M.; Zhou, Z. Research on High-Precision Target Detection Technology for Tomato-Picking Robots in Sustainable Agriculture. Sustainability 2025, 17, 2885. [Google Scholar] [CrossRef]
  23. Wu, H.; Wang, Y.; Zhao, P.; Qian, M. Small-target weed-detection model based on YOLO-V4 with improved backbone and neck structures. Precis. Agric. 2023, 24, 2149–2170. [Google Scholar] [CrossRef]
  24. Wang, H.; Feng, J.; Yin, H. Improved method for apple fruit target detection based on YOLOv5s. Agriculture 2023, 13, 2167. [Google Scholar] [CrossRef]
  25. Jiang, Q.; Huang, Z.; Xu, G.; Su, Y. MIoP-NMS: Perfecting crops target detection and counting in dense occlusion from high-resolution UAV imagery. Smart Agric. Technol. 2023, 4, 100226. [Google Scholar] [CrossRef]
  26. Li, S.; Zhang, S.; Xue, J.; Sun, H. Lightweight target detection for the field flat jujube based on improved YOLOv5. Comput. Electron. Agric. 2022, 202, 107391. [Google Scholar] [CrossRef]
  27. Huang, L.; Zhang, X.; Qiang, B.; Yang, H.; Yang, M. Image Clipping Strategy of Object Detection for Super Resolution Image in Low Resource. In Proceedings of the Cognitive Systems and Signal Processing: 5th International Conference, ICCSIP 2020, Zhuhai, China, 25–27 December 2020; Revised Selected Papers; Springer Nature: Berlin/Heidelberg, Germany, 2021; Volume 1397, p. 449. [Google Scholar]
  28. Wei, Y.; Hu, H.; Xie, Z.; Liu, Z.; Zhang, Z.; Cao, Y.; Bao, J.; Chen, D.; Guo, B. Improving clip fine-tuning performance. In Proceedings of the IEEE/CVF International Conference on Computer Vision, Paris, France, 2–3 October 2023; pp. 5439–5449. [Google Scholar]
  29. Yang, L.; Han, Y.; Chen, X.; Song, S.; Dai, J.; Huang, G. Resolution Adaptive Networks for Efficient Inference. In Proceedings of the IEEE/CVF Conference on Computer Vision and Pattern Recognition (CVPR), Seattle, WA, USA, 13–19 June 2020. [Google Scholar]
  30. Chen, Z.; Cao, L.; Wang, Q. YOLOv5-Based Vehicle Detection Method for High-Resolution UAV Images. Mob. Inf. Syst. 2022, 2022, 1828848. [Google Scholar] [CrossRef]
  31. Roy, A.M.; Bose, R.; Bhaduri, J. A fast accurate fine-grain object detection model based on YOLOv4 deep neural network. Neural Comput. Appl. 2022, 34, 3895–3921. [Google Scholar] [CrossRef]
  32. Sachar, S.; Kumar, A. Survey of feature extraction and classification techniques to identify plant through leaves. Expert Syst. Appl. 2021, 167, 114181. [Google Scholar] [CrossRef]
  33. Khakimov, A.; Salakhutdinov, I.; Omolikov, A.; Utaganov, S. Traditional and current-prospective methods of agricultural plant diseases detection: A review. In Proceedings of the IOP Conference Series: Earth and Environmental Science, Bandung, Indonesia, 8–9 November 2022; IOP Publishing: Bristol, UK, 2022; Volume 951, p. 012002. [Google Scholar]
  34. Srinivas, Y.; Ganivada, A. A modified inter-frame difference method for detection of moving objects in videos. Int. J. Inf. Technol. 2025, 17, 749–754. [Google Scholar] [CrossRef]
  35. Tzutalin, D. LabelImg. GitHub Repos. 2015, 6, 4. [Google Scholar]
  36. Khanam, R.; Hussain, M. Yolov11: An overview of the key architectural enhancements. arXiv 2024, arXiv:2410.17725. [Google Scholar]
  37. Hou, Q.; Zhou, D.; Feng, J. Coordinate attention for efficient mobile network design. In Proceedings of the IEEE/CVF Conference on Computer Vision and Pattern Recognition, Nashville, TN, USA, 20–25 June 2021; pp. 13713–13722. [Google Scholar]
  38. Li, H.; Zhang, R.; Pan, Y.; Ren, J.; Shen, F. Lr-fpn: Enhancing remote sensing object detection with location refined feature pyramid network. In Proceedings of the 2024 International Joint Conference on Neural Networks (IJCNN), Yokohama, Japan, 30 June–5 July 2024; IEEE: Piscataway, NJ, USA, 2024; pp. 1–8. [Google Scholar]
  39. Gass, S.I. Linear Programming: Methods and Applications; Courier Corporation: North Chelmsford, MA, USA, 2003. [Google Scholar]
  40. Zhang, H.; Xu, C.; Zhang, S. Inner-iou: More effective intersection over union loss with auxiliary bounding box. arXiv 2023, arXiv:2311.02877. [Google Scholar]
  41. Lv, W.; Zhao, Y.; Chang, Q.; Huang, K.; Wang, G.; Liu, Y. Rt-detrv2: Improved baseline with bag-of-freebies for real-time detection transformer. arXiv 2024, arXiv:2407.17140. [Google Scholar]
  42. Wang, S.; Xia, C.; Lv, F.; Shi, Y. RT-DETRv3: Real-time end-to-end object detection with hierarchical dense positive supervision. In Proceedings of the 2025 IEEE/CVF Winter Conference on Applications of Computer Vision (WACV), Tucson, AZ, USA, 26 February–6 March 2025; IEEE: Piscataway, NJ, USA, 2025; pp. 1628–1636. [Google Scholar]
  43. Qin, Y.M.; Tu, Y.H.; Li, T.; Ni, Y.; Wang, R.F.; Wang, H. Deep Learning for Sustainable Agriculture: A Systematic Review on Applications in Lettuce Cultivation. Sustainability 2025, 17, 3190. [Google Scholar] [CrossRef]
Figure 1. Performing inter-frame motion compensation on the collected images.
Agriculture 15 01254 g001
Figure 2. Annotation of an image using LabelImg.
Agriculture 15 01254 g002
Figure 3. Data enhancement example: (a) Original image. (b) Contrast adjustment. (c) Random brightness adjustment. (d) Addition of Gaussian noise.
Agriculture 15 01254 g003
Figure 4. Network architecture of YOLOv11n.
Agriculture 15 01254 g004
Figure 5. Architecture of LGN-YOLO and its constituent modules.
Agriculture 15 01254 g005
Figure 6. Structure of the CA mechanism.
Agriculture 15 01254 g006
Figure 7. Structure and internal details of the LR-FPN.
Agriculture 15 01254 g007
Figure 8. Detailed structure and calculation process of the LP-Detect module.
Agriculture 15 01254 g008
Figure 9. Graphical depiction of the inner EIoU.
Agriculture 15 01254 g009
Figure 10. Performance iteration process of LGN-YOLO. The blue dots denote the model’s performance metrics after each training epoch, and the orange dots represent performance during cross-validation at each epoch.
Agriculture 15 01254 g010
Figure 11. Performance of different models on the same image: (a) YOLOv5n; (b) YOLOv8n; (c) YOLOv9t; (d) YOLOv10n; (e) YOLO11n; (f) YOLOv12n.
Agriculture 15 01254 g011
Figure 12. Performance improvements of LGN-YOLO relative to the baseline.
Agriculture 15 01254 g012
Figure 13. Alteration of the loss value for the model during the training period: (a) Box loss; (b) Classification loss; (c) Distribution focal loss.
Agriculture 15 01254 g013
Figure 14. ROI generation results under different conditions: (a) Covered bud collected with a single leaf on a sunny day; (b) Covered bud collected with multiple leaves on a sunny day; (c) Uncovered bud collected with a single leaf on a sunny day; (d) Uncovered bud collected with multiple leaves on a sunny day; (e) Covered bud collected with a single leaf in dusty weather; (f) Covered bud collected with multiple leaves in dusty weather; (g) Uncovered bud collected with a single leaf in dusty weather; (h) Uncovered bud collected with multiple leaves in dusty weather.
Agriculture 15 01254 g014
Table 1. Number of images and labels in each dataset.
DatasetNumber
of Images
Number of Labels
Top TR Right BR Bottom BL Left TL
Train3360674650618602582567553538
Validation4208581787573716967
Test4208481777573716967
Total4200843812773752728709691672
Table 2. Hyperparameter values.
HyperparameterValue
epochs150
patience10
batch size32
img size640
lr0 1 × 10 3
lrf 1 × 10 3
momentum0.937
Table 3. Model performance comparison results.
ModelPRmAP50mIoUSRCRFPS
YOLOv5n0.8740.8840.8510.4520.855108.1
YOLOv8n0.8980.8660.8720.4940.914121.4
YOLOv9t0.8740.8650.8810.4930.901115.6
RT-DETRv20.9240.9050.9220.5560.92772.3
RT-DETRv30.9400.9540.9450.6340.93884.5
YOLOv10n0.9910.8980.9160.4970.923148.9
YOLOv10s0.9040.9010.9270.5090.92899.4
YOLOv11n0.9230.9530.9240.6120.931133.5
YOLOv11s0.9330.9570.9440.6270.93393.7
YOLOv12n0.9050.9130.8920.5030.898110.0
Table 4. Comparison of the effects of adding different modules.
GroupCALR-FPNInner
EIoU
PRmAP50mIoUSRCRFPS
1 0.9230.9530.9240.6120.931133.5
2 0.9420.9550.9400.6180.933135.7
3 0.9370.9610.9490.6210.937140.0
4 0.9580.9690.9600.6330.940144.2
5 (Ours)0.9670.9710.9630.6370.944138.2
Table 5. Influence of various ratio factor values on model performance.
RatioPRmAP50mIoUSRCRFPS
0 (CIoU)0.9580.9690.9600.6330.940144.2
0.50.9550.9700.9620.6330.941138.1
10.9630.9710.9630.6350.943136.4
1.50.9670.9710.9630.6370.944138.2
Disclaimer/Publisher’s Note: The statements, opinions and data contained in all publications are solely those of the individual author(s) and contributor(s) and not of MDPI and/or the editor(s). MDPI and/or the editor(s) disclaim responsibility for any injury to people or property resulting from any ideas, methods, instructions or products referred to in the content.

