Abstract
Assessing cropland soil quality and identifying limiting indicators are crucial in guiding sustainable agricultural practices, particularly in fragile agricultural ecosystems. However, a unified understanding of key limiting indicators and the controlling factors of soil quality remains lacking due to the dual demands of environmental protection and agricultural production. To address this gap, 621 soil samples were collected across the “One River and Its Two Tributaries” agricultural region on the Tibetan Plateau. Twenty-four soil physicochemical indicators and eight environmental parameters were analyzed to evaluate soil quality and identify the key limiting factors. Meanwhile, the random forest model, correlation analysis, and the structural equation model were used to determine the factors influencing limiting indicator. The results showed that (1) croplands had a mean soil quality index (SQI) of 0.66 with obvious spatial heterogeneity, where eastern, northern, and southern regions exhibited higher SQI values than western and central valley areas. (2) Soil organic matter (SOM) was identified as the primary limiting indicator, with its limiting degree increasing with soil depth. (3) Total nitrogen is the strongest statistical predictor of SOM content in this region, while soil pH negatively impacted SOM. Environmental factors, including fertilizer amount, altitude, and normalized difference vegetation index, positively influenced SOM, whereas temperature and precipitation negatively affected it. (4) The structural equation model revealed effective intervention pathways for addressing SOM deficiency, highlighting targeted measures such as optimizing nitrogen management and increasing organic fertilizer application, particularly in relative lower-altitude areas. This study provides a unified perspective for managing soil quality and offers a potentially replicable framework for similar alpine ecosystems worldwide.
1. Introduction
Soil is a foundational component of agricultural production and ecosystems stability, playing a critical role in maintaining global ecological balance and supporting sustainable development [1]. As agricultural land expands rapidly worldwide [2], accurate soil quality assessment has becomes essential for monitoring negative trends [3], safeguarding crop productivity, and preserving ecosystem functions [4]. However, soil quality is shaped by complex interactions among physical, chemical, and biological processes, necessitating the use of measurable soil indicators for reliable evaluation [5,6]. Thus, selecting appropriate indicators and robust evaluation method is crucial to ensuring precision in soil quality assessment.
Globally, various soil quality evaluation methods have been developed [7,8,9], ranging from qualitative soil test cards to quantitative index methods and spatiotemporal models [10,11,12,13,14]. Among these, the soil quality index (SQI) is widely utilized due to its methodological simplicity and adaptability in diverse conditions. The selection of soil quality indicators commonly focuses on physicochemical properties [1,4,15], with cited indicators including soil organic matter, pH, available phosphorus, bulk density, texture, and available nitrogen and potassium. Furthermore, soil biological indicators have also gained attention due to their sensitivity [16]. However, their widespread application is often limited by high testing costs and complex data collection requirements [17]. Studies have demonstrated significant correlations between biological and physicochemical indicators [1,5], such as between soil organic matter, nitrogen, phosphorus, heavy metals, and enzymatic activity [18,19,20]. To some extent, biological indicators can be approximated using easily measurable chemical attributes. Despite soil quality evaluation being a valuable tool for facilitating scientific communication and providing theoretical support for agricultural and environmental management [21], its practical applicability for farmers and policymakers remains limited due to the lack of actionable recommendations [22]. Addressing this gap requires identifying key limiting factors of soil quality to guide targeted soil management strategies.
Understanding the factors that shape soil properties is also crucial for soil quality evaluation. Soil properties are influenced by multiple environmental conditions and anthropogenic activities [23]. Climate variables, including temperature and precipitation, directly affect soil moisture and temperature, thereby influencing organic matter decomposition rates [24]. Topography exerts indirect effects through alterations in microclimatic conditions and land-use patterns. For instance, elevation gradients influence the accumulation of soil organic matter and microbial activity, shaping nutrient availability [25]. Slope gradient and aspect affect the redistribution of water and heat, with south-facing slopes often being more suitable for cultivation [26,27]. Vegetation type and coverage determine litter inputs, which subsequently impacts organic matter levels [28]. In addition, agricultural practices such as irrigation and fertilization can directly alter soil properties. Irrigation modifies the solid–liquid–gas composition of soil, thereby influencing biological processes [29], whereas fertilization introduces macronutrients and micronutrients that reshape soil chemistry and microbiota [30]. Critically, the relative importance of these factors varies spatially [12]. Research has indicated that topographic and vegetative factors are more pronounced at smaller scales, whereas climate factors prevail in regional analyses [27,31,32,33]. Consequently, conclusions derived from small-scale studies cannot be directly applied to larger-scale contexts [34]. Thus, understanding the interaction between these factors and soil properties is essential for sustainable soil management, especially in fragile ecosystems.
The Tibetan Plateau (TP) is one of the world’s most ecologically sensitive alpine ecosystems, faces unique soil quality challenges due to its high altitudes, low temperatures, and sparse vegetation [35]. Previous studies have concentrated on grassland ecosystems in this region [36], revealing low organic matter content [37,38], widespread erosion [39], elevated heavy metal backgrounds [40,41], and soil quality degradation [42]. However, there is an obvious knowledge gap regarding cropland soils at the regional scale. The TP plays a dual role as an ecological security barrier and a key agricultural production zone [43], particularly in barley cultivation. Existing studies on cropland soil quality are mostly localized, focusing on specific geomorphological regions, watersheds, or administrative units [37,44,45]. As a result, there is a lack of large-scale evaluations, which are crucial for capturing broader spatial variability and informing region-wide management strategies. This knowledge gap significantly limits our ability to prioritize effective soil management interventions and develop unified strategies for sustainable cropland use across the TP.
In response to these challenges, this study comprehensively evaluates cropland soil quality across the “One River and Its Two Tributaries” agricultural region of the TP, focusing on identifying key limiting indicators of SQI and their influencing factors. The study aims to (i) develop an SQI based on physicochemical indicators for regional soil quality assessment; (ii) identify the primary limiting indicators of the SQI; and (iii) quantify the impacts of soil properties and environmental factors on the primary limiting indicators of soil quality. The findings of this study offer a potentially replicable framework for managing soils in alpine ecosystems globally.
2. Materials and Methods
2.1. Study Area
The “One River and Its Two Tributaries” agricultural region (N 28°20′–30°20′, E 87°00′–92°35′) was selected as the study area (Figure 1). This region encompasses the middle reaches of the Yarlung Zangbo River and its two main tributaries, namely the Lhasa and Nyangqu Rivers (YLN). It represents the largest agricultural zone on the TP, covering approximately 520 km from east to west and 220 km from north to south. The area includes eighteen agricultural counties, distributed across the cities of Lhasa, Xigaze, and Lhoka, which account for more than 60% of Xizang’s total cropland [46]. The climate is characterized by a temperate monsoon semi-arid plateau regime, with mean annual temperature ranging from 2.4 to 8.2 °C and precipitation between 270 and 550 mm (Figure A1). The topography consists of alternating wide and narrow valleys, with cropland primarily concentrated in the broad valleys. The average elevation of valleys ranges from 3500 to 4500 m, significantly impacting soil formation processes and agricultural practices. Barley, wheat, and rapeseed are the major crops, all of which are well adapted to the cool climate and follow an annual growth cycle. According to the World Reference Base for Soil Resources (WRB), the region’s soils are classified as Fluvisols, Leptosols, and Arenosols [47]. Specially, Fluvisols, predominantly developed on active floodplains, are characterized by weak horizon development, loam to sandy loam textures, and distinct stratified layers resulting from periodic flood deposition. Leptosols, which dominate steep slope areas, typically contain abundant coarse rock fragments with limited fine earth material. Arenosols, formed on ancient fluvial terraces and aeolian deposits, exhibit deep, sandy profiles showing minimal horizon differentiation. Conventional tillage practices in the region employ mechanical plowing to 35–40 cm depth, resulting in effective homogenization of the plow layer.
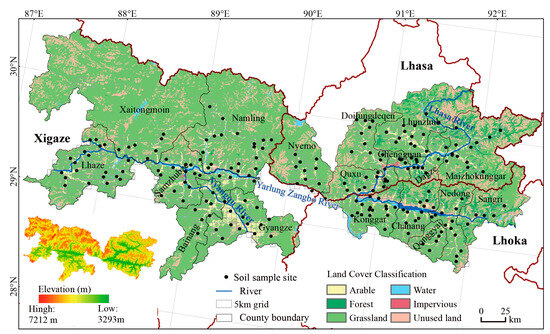
Figure 1.
Location of the study area and the distribution of sampling sites.
2.2. Soil Sampling and Chemical Analysis
Soil sampling sites were systematically established using a 5 km × 5 km grid across the croplands of the Yarlung Zangbo River and its tributaries to ensure spatial homogeneity. From each pair of adjacent grids, with similar natural conditions and management practices, one grid was randomly selected through simple random sampling. After excluding inaccessible sites, 207 sampling sites were established. At each sampling site, soil samples were collected at three depth intervals: 0–10 cm, 10–20 cm, and 20–40 cm. Sampling was conducted in August of 2019 and 2020. For each depth interval, a plum blossom sampling method was used where five subsamples were collected and mixed into a composite sample. Simultaneously, undisturbed soil samples were also taken using a cutting ring with a volume of 100 cm3. In total, 621 composite soil samples and 621 undisturbed soil samples for cropland analysis were analyzed. The geographic coordinates (longitude, latitude, and altitude), sampling time, and crop type were recorded for each sampling site.
All composite soil samples were encapsulated and transported to the laboratory, where they were air-dried at room temperature until a constant weight was achieved. Gravel and organic debris were manually removed, and the samples were then crushed and thoroughly mixed for analysis. The undisturbed samples were used to determine bulk density (BD) and soil moisture (SM). BD was determined by drying the samples at 105 °C to constant weight and calculating the mass per unit volume of the soil. SM was determined gravimetrically. Undisturbed soil samples were weighed immediately after collection (wet weight), then oven-dried at 105 °C for 24–48 h to constant weight. After cooling in a desiccator, samples were reweighed (dry weight). SM content was calculated as SM (%) = [(wet weight − dry weight)/dry weight] × 100%. The composite soil samples were analyzed at the laboratory of Southwestern University. Soil texture was ascertained using a laser particle size analyzer and classified according to the International Soil Classification System. Soil organic matter (SOM) was measured by the dichromate oxidation method [48]. Total nitrogen (TN) and alkali-hydrolysable nitrogen (AN) were measured using the Kjeldahl digestion method and the sodium hydroxide alkaline diffusion method, respectively [49]. Total phosphorus (TP) and available phosphorus (AP) were extracted using the sodium hydroxide fusion and the sodium bicarbonate extraction methods, respectively, followed by molybdenum blue colorimetric determination [50]. Total potassium (TK) and available potassium (AK) were extracted using the acid dissolution and the ammonium acetate leaching methods, respectively, and then measured using flame photometry [51]. Soil pH was measured using a digital pH meter with a 1:2.5 soil–water ratio. Electrical conductivity (EC, 1:5 soil–water ratio) was measured using a conductivity meter. The total soluble salt content (TS) was determined by the residue on ignition method [45]. Heavy metals, including Cr, Ni, Cu, Zn, Pb, and Cd, were analyzed using microwave digestion followed by inductively coupled plasma mass spectrometry (ICP-MS), while Hg and As were analyzed using the same digestion method followed by multi-channel atomic fluorescence spectrometry [52]. The carbon-to-nitrogen (C/N) ratio is defined as the ratio of soil organic carbon (converted from SOM) to TN. To ensure the accuracy and reliability of the test results, each sample was measured in triplicate, and the average value was recorded. Additionally, 20% of the samples in each batch were set as parallel samples, ensuring that the relative standard deviation remained below 5%.
2.3. Data Sources
The slope gradient and slope aspect at each soil sampling site were extracted from 30 m digital elevation model provided by the Geospatial Data Cloud (http://www.gscloud.cn (accessed on 2 March 2021)). Climate data, including mean annual temperature and precipitation for 2019 and 2020 (spatial resolution: 1 km), were obtained from the National Tibetan Plateau Data Centre (https://data.tpdc.ac.cn (accessed on 10 April 2024)). These climate datasets were aligned with the sampling dates to ensure temporal consistency. Normalized difference vegetation index data for 2019 and 2020 were sourced from the Resource and Environmental Science Data Platforms (https://www.resdc.cn, 1 km spatial resolution (accessed on 10 April 2024)). Fertilizer application data were collected through structured questionnaires administered to farmers at each sampling site. Information recorded included fertilizer type, total fertilizer amount, and application timing during the crop growth cycle. To validate the accuracy of the reported fertilizer data, we compared them against county-level fertilizer quotas from the Xizang Statistical Yearbook 2020, which reflects the region’s strict quota and “zero-growth” fertilizer policy. The coordinates of each sampling point and the nearest main irrigation canal were recorded using a handheld GPS (±5 m accuracy). The distance to the irrigation canal was calculated using the Euclidean distance tool in ArcGIS. These measurements were further verified using Google Earth Pro, with the mean absolute difference between the two methods being less than 10 m.
2.4. Methods for the Analyses
2.4.1. Soil Quality Evaluation and Its Limiting Indicators
The soil quality index (SQI) is a comprehensive metric that evaluates soil quality by integrating various soil indicators through a weighted method [13]. It is computed using the following formula:
where SQI is the soil quality index, Wi is the weight of the ith indicator, Ni is the score of the ith indicator, and n is the total number of indicators.
In this study, the weights of soil quality indicators were calculated by the common factor variance through principal component analysis (PCA) [6]. There were 24 soil quality indicators, which included commonly used indicators in soil quality evaluations, namely clay, silt, sand, BD, SM, SOM, TN, TP, TK, AN, AP, AK, EC, C/N, and pH. Furthermore, the study also included soil characteristics relevant to soil quality research of the TP, namely TS, Cr, Ni, Cu, Zn, Pb, Cd, Hg, and As. To avoid differences in the magnitude and units of indicators, standard scoring functions (SSFs) were used to standardize them. These SSFs classified the indicators into three types: more is better (M), less is better (L), and optimal range (O) [53]. The standardization was based on previous studies and soil conditions suitable for barley and rapeseed growth [6,17]. The clay, silt, SOM, TN, TP, TK, AN, AP, and AK were standardized by M(x); the sand, EC, TS, BD, Cr, Ni, Cu, Zn, Pb, As, Hg, and Cd were standardized by L(x); and pH, SM, and C/N were standardized by O(x). The reference standards and thresholds of soil quality indicators are listed in Table A1. The three equations are defined as:
where M(x), L(x), and O(x) represent the standardized score of the indicator between 0.1 and 1. x is the test value of the indicator. The a and b are the lower and upper threshold values of the indicator, respectively. The a1 and b1 are the lower and upper optimum threshold values of the indicator, respectively.
We introduced a constraint factor model to identify limiting indicators that match the SQI of cropland, based on the barrel effect principle [54]. This model posits that the soil quality is constrained by its most limiting indicator, similar to the capacity of a barrel is limited by its shortest stave. The limiting effect of each indicator was evaluated using the following formula:
where Mj is the average limiting value of the indicator and Zij is the limiting value of the indicator. Pij represents the deviation between the score of the indicator and 1. Wj is the weight of the indicator. The m and n are the number of indicators and soil samples. We classified the limiting value into four levels: no limitation (0%), slight limitation (0–10%), moderate limitation (10–20%), and severe limitation (≥20%).
2.4.2. Random Forest Analysis and Correlation Analysis
The random forest model (RF), which is based on classification and regression tree methods, was used to rank the importance of explanatory variables [34]. In this study, RF was used to identify the key soil physicochemical properties and environmental factors that influenced the primary limiting indicator of SQI. To begin, the variance inflation factor (VIF) was calculated to assess multicollinearity among the explanatory variables. Any variables with VIF values exceeding 10 were removed to mitigate multicollinearity [55]. After preprocessing, two RF models were constructed: (i) Model 1: The primary limiting indicator of SQI was set as the dependent variable, and the explanatory variables were soil physicochemical properties. (ii) Model 2: The primary limiting indicator was set as the dependent variable, while environmental factors including topography, climate, vegetation, and agricultural management were the explanatory variables.
We conducted ten random sampling procedures, with each covering 80% of the dataset. The average relative importance of each explanatory variable was calculated using the IncMSE and IncNodePurity. The explanatory variables were then ranked in descending order based on their importance scores, with negative values being excluded. Variables with higher scores were recognized as having a more obvious impact on the primary limiting indicator. Negative values that may have indicated noise or irrelevant variables were excluded from the final ranking. After ranking the importance of variables, Pearson correlation analysis was used to further explore the relationships between the primary limiting indicator and the soil properties and environmental factors. This analysis result allowed us to quantify the strength and direction of linear relationships between variables.
2.4.3. Structural Equation Model
The structural equation model (SEM) is a widely used path analysis method that assesses direct and indirect effects within a hypothesized causal framework [56,57]. This study used SEM to reveal the pathways through which environmental factors influence soil physicochemical properties, and subsequently, the primary limiting indicator of the SQI. The conceptual SEM was based on the following key assumptions (Figure 2): (i) Soil physicochemical properties directly influence the primary limiting indicator. (ii) Environmental factors exert direct and indirect effects on the primary limiting indicator by altering soil properties. (iii) Environmental factors interact, with relationships such as topography influencing climate conditions and human activities impacting vegetation [34,58].
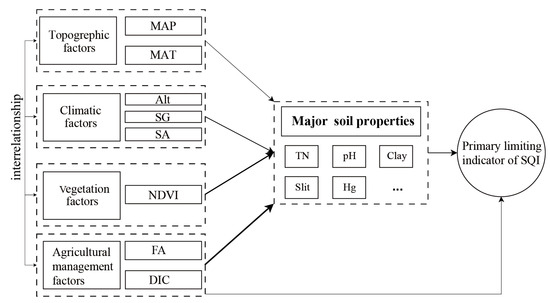
Figure 2.
A conceptual equation model showing the primary limiting indicator of SQI and influencing factors. The thickness of the arrows represents the strength of the relationships between variables. MAT, mean annual temperature; MAP, mean annual precipitation; Alt, altitude; SG, slope gradient; SA, slope aspect; NDVI, normalized difference vegetation index; FA, fertilizer amount; DIC, distance to irrigation canal.
Each variable of the SEM was selected based on its importance and relevance as determined by the RF analysis. According to SEM modeling rules, the number of sample points should be at least five times the number of variables [27]. Our model met this criterion, ensuring the robustness of the analysis. The validity of the SEM was evaluated using multiple fit indices [59]. The p > 0.05 indicates that the model’s predictions are not significantly different from the observed data, suggesting a good fit. The chi-square/degrees of freedom < 3 is indicative of a good fit; the goodness-of-fit index and adjusted goodness-of-fit index ≥ 0.9 are considered indicative of a good fit; the normed fit index and comparative fit index should also exceed 0.9 for the model to be deemed acceptable; and root mean square error of approximation < 0.05 indicates a close fit between the model and the data.
2.4.4. Data Analysis
The Shapiro–Wilk and Levene’s tests were initially used to evaluate the normality and homogeneity of variances for soil physicochemical indicators, respectively. Then, one-way analysis of variance (ANOVA) and the least significant difference (LSD) test were used to test the significance of soil physicochemical indicators and SQI under different soil depths (p ≤ 0.05). To identify the primary limiting indicator of soil quality, a constraint factor model was used. Subsequently, the average value of the primary limiting indicator from the 0–40 cm depth was used as the dependent variable in both RF and SEM analyses to identify key influencing factors. The random forest model was used to rank the importance of key soil physicochemical properties and environmental factors affecting SOM. Further, Pearson correlation analysis was used to examine the interrelationships between these factors. Finally, the conceptual model was optimized using SEM, with non-significant paths eliminated in turn until a valid final model was obtained. Statistical analyses and graphs were executed using Python 3.12.3 with pandas and matplotlib libraries [60]. The PCA was conducted using SPSS 27.0 (SPSS Inc., Chicago, IL, USA) [61]. Environmental factor data were extracted and a spatial distribution map was performed using ArcGIS (version 10.8, Environmental Systems Research Institute, Redlands, CA, USA). The RF was constructed using the random forest package in R, and the correlation analyses were plotted by the ggcorrplot2 package in R [62]. SEM was built and optimized within IBM SPSS Amos 28.0 software.
3. Results
3.1. Descriptive Statistics of Cropland Soil Properties
Table 1 summarizes the descriptive statistics of the cropland soil physicochemical properties. The dominant soil texture was sandy loam with moderate soil moisture, providing sufficient root penetration and water retention for crop growth. The average value of BD was 1.33 g·cm⁻3, indicating a moderately compacted soil suitable for root development. The soil pH was slightly alkaline, with an average value of 7.62, which is within the optimal range for local crops. The EC was low, at 0.21 ms·m⁻1, and TS was 0.3%, which classifies the soil as slightly saline. The SOM and AK average values were 17.99 g·kg⁻1 and 70.1 mg·kg⁻1, respectively, both of which fall below the adequate range defined by the Second National Soil Nutrient Survey of China. In contrast, TN, TK, AN, and AP levels were moderate, with an average value of 1.24 g·kg⁻1, 20.36 g·kg⁻1, 96.48 mg·kg⁻1, and 16.52 mg·kg⁻1, respectively. TP is relatively abundant in this area. The C/N ratio of 8.76 indicated a high mineralization rate. The concentrations of heavy metals, including Cr, Ni, Cu, Zn, Pb, Cd, As, and Hg, were all below the thresholds of agricultural land contamination in China, indicating a low risk of heavy metal pollution.

Table 1.
Descriptive statistics of soil physicochemical indicators.
Soil properties also varied with depth. SM, pH, AK, EC, and TS, showed significant differences between the 0–10 cm and 20–40 cm depths. SOM, TN, AN, and AP were significantly higher in the 0–20 cm range compared to 20–40 cm. The lowest BD was observed at 0–10 cm, with an average value of 1.29 g·cm⁻3. However, no significant differences were observed in soil texture, TP, TK, C/N, and heavy metal. Overall, soil properties showed a wide range of coefficients of variation (CV) from moderate (10 < CV < 100) to high (CV > 100), and soil properties demonstrated both homogeneity and heterogeneity at the regional scale.
3.2. Soil Quality Evaluation and Its Spatial Distribution Patterns
The SQI of cropland across 0–40 cm depth ranged from 0.52 to 0.85, with an average value of 0.66 and a CV of 9.41% (Figure 3). Notably, 48.79% of the sampling sites had an SQI that was below the regional average. The SQI values showed a decreasing trend at increasing soil depth, with average values of 0.68 (0–10 cm) > 0.67 (10–20 cm) > 0.65 (20–40 cm).
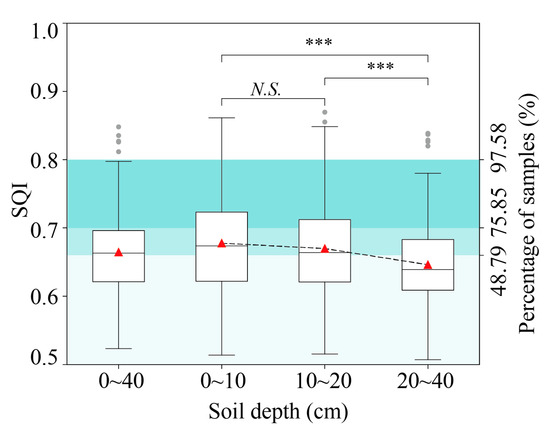
Figure 3.
Soil quality index of cropland soil. Statistical tests were performed using ANOVA. *** indicates significance at p ≤ 0.001, while N.S. denotes no significant difference.
Figure 4 shows the spatial distribution pattern of the SQI. Longitudinally (Figure 4a), the SQI followed a distinct east–west gradient, with a trend of higher values in the east and lower values in the west. Notably, there were two high-density areas at 90.5°–92° E and 88.5°–89.5° E. Among these, the eastern high-density area showed SQI values that exceeded both the western area and regional average values (0.66). Latitudinally (Figure 4b), the SQI values were lower in the central valley area compared to higher values in the northern and southern areas. In particular, the high-density area between 29.15° N and 29.55° N showed lower SQI values compared to the northern and southern areas, as well as the regional average. At the city level, Lhasa had an SQI above the regional average, whereas Lhoka and Xigaze showed relatively lower SQI values. Among all counties, Maizhokunggar county had the highest SQI of 0.74. This was closely followed by Linzhou, Doilungdeqen, Dazi, Gyangze, and Konggar counties, each of which also demonstrated a relatively high SQI, reaching up to 0.68.
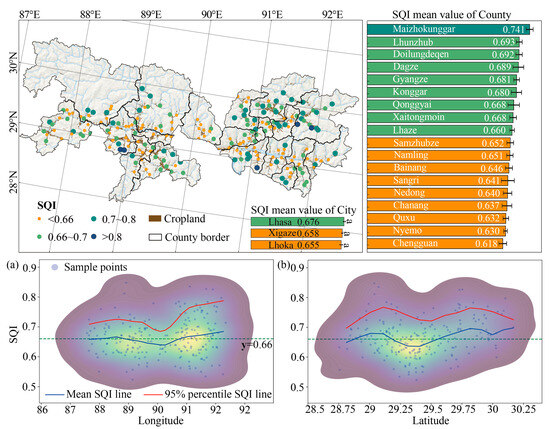
Figure 4.
Spatial distribution pattern of the SQI across the study area. (a,b) Point density plots showing the relationship between SQI and longitude, and latitude, respectively. Brighter colors indicate higher point density.
3.3. Identification of the Primary Limiting Indicator for Soil Quality
The limiting indicators for the SQI in cropland soils are presented in Figure 5. Within the 0–40 cm soil layer, the top five common limiting indicators were SOM, TN, clay, AN, and AP. These indicators impose slight to moderate limitations on soil quality. Among them, SOM was identified as the primary limiting indicator, with an average limitation degree of 12.86%, categorized as a moderate limitation. This was followed by TN (9.92%), clay (9.51%), AN (9.3%), and AP (9.06%), all of which have slight limitations. The degrees of limitation for these physicochemical indicators increased with soil depth, reinforcing that SOM content is the primary limiting factor for SQI in this region.
Figure 5.
Limitation degree of soil quality indicators under different soil depths.
3.4. Analysis of Factors Influencing the Primary Limiting Indicator of Soil Quality
3.4.1. Influence of Soil Properties on the SOM
The random forest model ranked the relative importance of soil physicochemical properties influencing SOM, as shown in Figure 6a. Among these properties, soil nutrients variables were found to have the most obvious impact on SOM. Specifically, TN, AN, and C/N emerged as the top three influential factors, with relative importance values of 8.2%, 6.7%, and 4.62%, respectively. These were followed by soil pH (2.34%), Hg (1.42%), and clay content (1.17%). Correlation analysis further revealed that SOM content was significantly positively correlated with TN, AN, and C/N, whereas a significant negative correlation with pH was observed (Figure 6b). In addition, weak positive correlations were observed between SOM and Hg, as well as clay content.
Figure 6.
Variable importance and relationship between soil properties and SOM. (a) Random forest model, (b) correlation analysis, ***, **, and * indicate significance at p ≤ 0.001, p ≤ 0.01, and p ≤ 0.05, respectively.
3.4.2. Influence of Environmental Factors on the SOM
The random forest model ranked the relative importance of environmental factors influencing SOM (Figure 7a). Among these factors, FA emerged as the most important environmental factor, contributing 4.97% to SOM contents. This was followed by Alt (3.24%), MAT (1.75%), and NDVI (1.43%). Correlation analysis in Figure 7b revealed that agricultural management factors (FA, DIC), topographic factors (Alt, SG), and NDVI were positively correlated with SOM, with FA and NDVI showing significant positive correlations (p < 0.05). In contrast, climatic factors (MAT, MAP) were negatively correlated with SOM.
Figure 7.
Variable importance and relationship between environmental factors and SOM. (a) Random forest model, (b) correlation analysis, ***, **, and * indicate significance at p ≤ 0.001, p ≤ 0.01, and p ≤ 0.05, respectively. FA, fertilizer amount; Alt, altitude; MAT, mean annual temperature; NDVI, normalized difference vegetation index; DIC, distance to irrigation canal; MAP, mean annual precipitation; SG, slope gradient.
3.4.3. Combined Effects of Soil Properties and Environmental Factors on the SOM
The path analysis of the SEM revealed that environmental factors indirectly influence SOM through their effects on soil properties, explaining 67% of the variance in SOM (Figure 8). Among them, TN had the most significant impact on SOM, with a path coefficient of 0.753. The FA, Alt, MAP, and NDVI indirectly affected SOM through TN, among which the effects of FA and Alt were particularly obvious. MAT indirectly affected SOM through pH. Furthermore, Alt and SG indirectly affected TN and pH through MAP and MAT. FA and DIC also positively affected TN by increasing NDVI. Overall, our model highlights that environmental factors indirectly influence SOM by altering soil properties.
Figure 8.
Structural equation model showing the combined effects of soil properties and environmental factors on SOM. Blue and red arrows respectively represent positive and negative directions. FA, fertilizer amount; Alt, altitude; MAT, mean annual temperature; NDVI, normalized difference vegetation index; DIC, distance to irrigation canal; MAP, mean annual precipitation; SG, slope gradient.
4. Discussion
4.1. Agricultural Soil Quality Evaluation and Indicator Selection
Evaluating agricultural soil quality is critical in balancing crop productivity with environmental sustainability [13]. Given the Tibetan Plateau’s (TP) dual role as both an ecological security barrier and a key agricultural region, a comprehensive soil quality assessment framework is especially important. In this study, we prioritized nutrient indicators, including SOM, N, P, and K, which are good at maintaining soil fertility, supporting nitrogen fixation, and enhancing crop productivity [4]. These indicators are especially important in the cold environment of the TP, where nutrient cycles and soil processes may be limited. Our results indicated that soil SOM and AK were low, falling below the levels observed in undisturbed alluvial fans [6] and agricultural greenhouse soil [44,45]. This nutrient deficiency may be attributed to local agricultural practices that emphasize short-term yield over sustainable soil management. The observed C/N of 8.76 suggests a rapid decomposition rate of organic matter, which supports sufficient nitrogen availability for plant growth. Soil physical properties were evaluated because of their direct influence on soil function and plant growth [63]. Soils on the TP are relatively young [37], characterized by coarse textures, and classified as Leptosols. However, our findings reveal that soils are sandy loams, with moderate BD and adequate moisture content, suggesting that agricultural practices have improved soil physical conditions.
The soil pH affects nutrient availability and microbial activity [64]. The soil pH of the study area was found to be slightly alkaline, higher than that in undisturbed soil and agricultural greenhouse soil [6], and above the WRB benchmark of 6.9. This suggests that cultivation has adjusted the soil pH to a level more suitable for barley growth. Soil EC and TS were also assessed as reliable indicators of soil salinity. EC values (0.21 ms·m−1) in the study area were lower than those in uncultivated land [6] and far below China’s threshold for saline soils (2.86 ms·m−1) [65]. The soils are thus classified as slightly saline, which poses no obvious threat to crop growth. Heavy metals are a known concern in agricultural soils due to their potential to accumulate in the environment and enter food chains [41]. In many agricultural regions of China, heavy metal levels have risen due to human activity [9]. However, our study found that the average values of heavy metals were below China’s risk-screening thresholds and lower than those in other agricultural regions, indicating minimal contamination risk [9]. Furthermore, essential trace elements (including Zn and Cu) which are vital for crop growth, were found to be relatively abundant in the area [52].
The mean SQI in our study area was 0.66, higher than previously reported values for the Lhasa River Basin (0.38–0.42) [6]. This improvement is largely attributable to the inclusion of heavy metal indicators. In our model, heavy metals were treated as negative indicators, accounting for 31.59% of the total weight (Table A2). Previous SQI studies on the TP have rarely included heavy metals, yet their incorporation is justified. As the Third Pole of the Earth, the Tibetan Plateau serves as China’s critical ecological barrier, where environmental protection remains the TP’s top priority. The study area overlays two metallogenic belts; although current HM concentrations remain below national risk thresholds, recent monitoring shows an obvious upward trends for Cd and Zn under agricultural intensification. Alpine soils are thin, renew slowly, and added metals can persist and biomagnify, posing long-term risks to ecosystem integrity and grain safety. Moreover, local high-standard farmland regulations mandate that productivity assessments be coupled with contaminant safety evaluations. Hence, treating HMs as negative indicators aligns the SQI with current management requirements. To validate our results, we calculated two additional SQI values (Figure A2): SQI-I including only macronutrients, and SQI-II excluding heavy metals. The results were 0.36 and 0.47, respectively. The SQI-I aligns with previous studies from the Lhasa River Basin but lower than those of China’s Loess Plateau (0.51) [66] and the Sichuan Basin (0.49) [67]. These comparisons confirm that TP’s agricultural soils exhibit lower fertility than those of other regions when assessed solely by productivity indicators. However, our SQI model aligns with contemporary literature emphasizing that environmental and ecological indicators are essential for sustainable land management assessments [4]. Given the TP’s unique dual role, the clean status of soil heavy metals provides a more objective assessment of soil quality than traditional fertility-based evaluations. Our findings confirm that incorporating heavy metal data enhances site-level evaluation accuracy without compromising fertility gradient interpretation. Spatially, approximately half of the sampling sites fell below the regional average, with lower values concentrated in the western and the Yarlung Zangbo River Valley. In contrast, eastern areas near Lhasa exhibited higher SQI values. This spatial heterogeneity highlights the importance of using a comprehensive indicator set to effectively identify limiting factors affecting cropland soil quality.
4.2. Key Limiting Indicators in Soil Quality
One of the main objectives of this study was to identify key limiting indicators within the SQI. Our analysis revealed that SOM, TN, clay, AN, and AP were identified as the key limiting factors. Among these, SOM was identified as the primary limiting indicator, with the highest average limitation degree of 12.86%. This finding aligns with extensive literature documenting SOM’s critical role in sustaining soil quality through its effects on soil structure, nutrient cycling, and microbial activity [68]. Given the young and coarse-textured soils of the TP, the importance of SOM in supporting soil functions is even more pronounced [38]. The moderate limitation imposed suggests that the soil’s capacity to maintain optimal agricultural productivity is suboptimal. Notably, the increasing limitation degree with soil depth reflects declining organic matter content in subsurface layers, potentially exacerbating productivity constraints.
Following SOM, TN, clay, AN, and AP were found to impose slight limitations on soil quality. Among these, TN was the second key limiting indicator, with an average limitation degree of 9.92%. The limitation imposed by TN reflects both the high nitrogen demand of crops [69] and the region’s traditional low-fertilization practices, which may inadequately meet crop requirements. AN and AP showed relatively minor limitations, suggesting potential nutrient deficiencies in certain parts of the study area. Although the limiting effect of clay content is slight, it persists due to the geologically young soils of the TP and the limited impact of traditional agricultural practices on improving soil structure. This persists despite clay’s well-documented role in enhancing water and nutrient retention [70].
Overall, SOM emerged as the primary limiting indicator of soil quality in the agricultural regions of the TP. This finding provides a unified perspective on the major constraints to soil quality. Although SOM and AK content were found to be low, only SOM emerged as a key limiting factor. This is likely because the potassium-rich parent material of soils in this region. The observed AK deficiency may thus be a temporary issue related to current farming practices that do not emphasize potassium supplementation [37]. In contrast, other studies have highlighted different nutrient deficiencies and heavy metal accumulation as key constraints to soil quality across the TP. For example, soil profile surveys have reported AP levels below in this region, classifying them as extremely deficient and considering them primary soil quality limitations. However, our findings indicate that agricultural areas have largely alleviated phosphorus deficiency. Similarly, the accumulation of heavy metals (including mercury and cadmium) poses potential risks to agricultural production and environmental health [52]. Our results indicate that these indicators have a minimal impact on soil quality. In summary, the deficiency of SOM represents the primary challenge to soil quality in the agricultural regions of the TP.
4.3. Factors Influencing SOM and Improvement Recommendations
SOM is highly sensitive to variations in soil properties and environmental factors [71]. The random forest model identified TN as the most influential factor affecting SOM. This relationship was further confirmed by the SEM analysis, which demonstrated a significant positive effect of TN on SOM. This finding is consistent with studies suggesting that nitrogen availability influences the amount of plant residues and litter, which are key sources of SOM [72]. In the nutrient-limited environment of the TP, traditional low-input practices create a dual limitation: directly restricting nitrogen availability while indirectly constraining SOM replenishment through reduced biomass production [73]. The relationship between TN and SOM also reflects the importance of maintaining an appropriate C/N ratio in soils, because this ratio influences organic matter decomposition rates and microbial activity. The relatively low C/N ratio observed in the TP suggests rapid organic matter decomposition, which may limit SOM accumulation. Soil pH emerged as another critical factor influencing SOM. Our findings indicated a significant negative relationship between pH and SOM, which aligns with existing studies [70]. Acidic soil conditions tend to inhibit microbial and enzyme activity [74], while relatively alkaline soils may enhance microbial activity, thereby accelerating organic matter decomposition and limiting SOM accumulation. Numerous studies have also highlighted the role of clay content in stabilizing organic matter through adsorption, which makes it less susceptible to microbial decomposition and fosters aggregate formation, thereby reducing erosion and organic matter loss [63]. However, due to the relatively low clay content of TP soils [6], the stabilizing effect of clay on SOM is likely limited. The impact of soil Hg content on SOM was also examined, as Hg can inhibit microbial activity and bind with organic molecules like humus, thereby slowing down organic matter decomposition [75]. However, the soils in the study area remain uncontaminated. While Hg ranks as one of the important factors influencing SOM, its concentration is insufficient to significantly impact SOM levels.
Among environmental factors, fertilizer amount had a significant influence on SOM. More than 90 % of soil TN is organically bound within SOM. Thus, TN co-varies with SOM and emerged as the strongest statistical predictor in our models. However, this covariance does not mean that applying mineral N will directly increase SOM stocks. Nitrogen fertilization can raise crop biomass and, over multiple seasons, enhance organic-matter inputs through greater root turnover and residue return [76]. However, traditional low-input fertilization and use of organic amendments constrain SOM accumulation in the TP [6]. Our analysis also revealed a positive relationship between altitude and SOM. High-altitude areas in the TP experience shorter growing seasons and earlier plant senescence, resulting in extended decomposition periods for plant residues, which in turn promote SOM accumulation [6]. Furthermore, lower temperatures in these regions suppress microbial activity and reduce nutrient uptake by plants, facilitating greater nutrient retention in the soil [71]. In contrast, both temperature and precipitation exhibited negative correlations with SOM content. Higher temperatures stimulate microbial activity and accelerate organic matter decomposition [77]. The observed decline in SOM with increasing precipitation contradicts findings from studies on TP grassland soils [27]. This discrepancy may reflect the poor water and nutrient retention capacity of the sandy soils in the study area. Moreover, as a water vapor corridor, increased precipitation in valley regions may exacerbate soil erosion and leaching, further depleting SOM stocks. The NDVI also showed a positive relationship with SOM. Generally, higher NDVI values correspond to greater litter production and thus higher SOM accumulation potential [71]. However, the overall contribution of NDVI to SOM was constrained by the limited vegetation types (primarily alpine grasslands) and restricted crop straw return in the agricultural region [68].
The SEM analysis elucidated the complex interactions among factors influencing SOM and identified potential intervention pathways for soil quality enhancement in the TP. Our results demonstrated that fertilizer amount emerged as the most significant indirect factor affecting SOM through TN mediation. The limited use of organic fertilizers in the TP is an obvious constraint to SOM improvement [6]. Our field surveys indicated that urea is the primary nitrogen fertilizer applied in this region. To effectively address SOM deficiency, we recommend implementing precision fertilization strategies that combine organic amendments (compost/manure) with optimized nitrogen fertilization (including slow-release formulations and split applications). This integrated approach would simultaneously enhance TN availability, support crop growth, and increase organic inputs for SOM formation. Notably, altitude exhibited a positive indirect effect on SOM through TN, indicating that low-altitude regions require prioritized intervention due to their pronounced TN and SOM limitations. Additional environmental factors (temperature, precipitation, NDVI) contributed to SOM dynamics, consistent with observations from other high-altitude systems like the Loess Plateau [71]. Given the unique climatic conditions and the low soil retention capacity of the TP, efforts to stabilize SOM should also focus on improving soil structure and buffering soil pH. Therefore, sustainable agricultural practices, including crop residue return and expanded use of cover crops, should be promoted to enhance soil quality and ensure long-term productivity.
4.4. Implications and Limitations of the Study
This study establishes critical baseline data for soil quality assessment across the TP’s agricultural regions, providing valuable insights for sustainable land management. Our findings identify SOM as the primary limiting factor for soil quality in this ecologically sensitive region, offering a unified framework for understanding agricultural soil constraints in alpine ecosystems. The methodology used to identify limiting indicators and analyze their influencing factors provides a potentially replicable framework for managing soil quality in other cold and fragile ecosystems globally.
However, several limitations warrant consideration. First, while the sampling design adequately represents the TP’s largest agricultural region, the inherent soil heterogeneity across the entire plateau suggests future studies should expand spatial coverage to include more diverse topographies and cultivation systems. Second, the current framework’s emphasis on physicochemical properties could be enhanced by incorporating biological indicators like microbial biomass and enzyme activity to achieve more comprehensive assessments, with potential benefits from developing a minimal yet effective indicator set for long-term monitoring. Lastly, our structural equation model explained 67% of the variance in SOM across the region, but more than 30% of the variability remains unexplained. The cross-validated R2 for SOM (excluding fertilizer variables to address missing data and to test the most conservative scenario) was 0.56 ± 0.08, compared to 0.74 in the training set, indicating that the model was stable and not overfitting. The remaining unexplained variability likely reflects the influence of unmeasured factors including soil parent material, microbial community dynamics, land-use history, and cropping systems [38,78], all known to significantly affect SOM turnover and nutrient cycling [63]. Therefore, future research should integrate these variables to improve predictive capacity and elucidate long-term soil quality dynamics in these vulnerable alpine agroecosystems.
5. Conclusions
Our study provides a comprehensive assessment of soil quality in the agricultural regions of the Tibetan Plateau, highlighting the importance of integrating multiple soil physicochemical indicators into a unified evaluation framework. The results showed that the mean SQI was 0.66, with higher soil quality in the eastern, northern, and southern regions compared to the western and central valleys. SOM was identified as the primary limiting factor for soil quality in the region, with its limiting degree increasing with soil depth. A total of 67% of variations in SOM content could be jointly explained by the indirect effects of environmental factors that alter soil properties. TN is the strongest statistical predictor of SOM content in this region. Fertilizer amount and altitude emerged as the important indirect on SOM through TN. These findings highlight the need for targeted soil management strategies including optimized nitrogen fertilization and increased organic inputs, especially in lower-altitude areas.
Author Contributions
Conceptualization, Z.W. and D.G.; methodology, Z.W., D.G. and M.D.; formal analysis, D.G. and Z.W.; investigation, D.G., Z.W., X.H., B.W. and C.G.; resources, Z.W. and Y.Z.; writing—original draft preparation, D.G. and Z.W.; writing—review and editing, D.G. and Z.W.; visualization, D.G., B.W. and B.Z.; supervision, Z.W. and Y.Z.; project administration, Z.W. and Y.Z.; funding acquisition, Z.W. and Y.Z. All authors have read and agreed to the published version of the manuscript.
Funding
This research was funded by the Science and Technology projects of Xizang Autonomous Region, China (XZ202501ZY0008) and the Second Tibetan Plateau Scientific Expedition and Research Program (STEP) (2019QZKK0603).
Data Availability Statement
Data presented in this study are available upon reasonable request to the corresponding author.
Conflicts of Interest
The authors declare no conflicts of interest.
Abbreviations
The following abbreviations are used in this manuscript:
| BD | Bulk density |
| SM | Soil moisture |
| SOM | Soil organic matter |
| TN | Total nitrogen |
| TP | Total phosphorus |
| TK | Total potassium |
| AN | Alkali-hydrolysable nitrogen |
| AP | Available phosphorus |
| AK | Available potassium |
| EC | Electrical conductivity |
| TS | Total soluble salt content |
| C/N | Carbon-to-nitrogen |
| SQI | Soil quality index |
| SSF | Standard scoring functions |
| RF | Random forest |
| VIF | Variance inflation factor |
| SEM | Structural equation model |
| MAT | Mean annual temperature |
| MAP | Mean annual precipitation |
| Alt | Altitude |
| SG | Slope gradient |
| SA | Slope aspect |
| NDVI | Normalized difference vegetation index |
| FA | Fertilizer amount |
| DIC | Distance to irrigation canal |
| ANOVA | One-way analysis of variance |
| LSD | Least significant difference |
| PCA | Principal component analysis |
| TP | Tibetan Plateau |
Appendix A
Table A1.
The thresholds of soil quality indicators.
Table A1.
The thresholds of soil quality indicators.
| SSF Equation | Soil Indicator | a | b | a1 | b1 |
|---|---|---|---|---|---|
| M(x) | Clay | 0 | 15 | ||
| Silt | 0 | 45 | |||
| SOM | 20 | 40 | |||
| TN | 1 | 2 | |||
| TP | 0.6 | 1 | |||
| TK | 15 | 25 | |||
| AN | 90 | 150 | |||
| AP | 10 | 40 | |||
| AK | 100 | 200 | |||
| L(x) | Sand | 55 | 85 | ||
| EC | 0 | 0.37 | |||
| TS | 0.1 | 0.3 | |||
| BD | 1 | 1.4 | |||
| Cr | 150 | 250 | |||
| Ni | 60 | 190 | |||
| Cu | 50 | 100 | |||
| Zn | 200 | 300 | |||
| Pb | 70 | 170 | |||
| Cd | 0.3 | 0.6 | |||
| As | 25 | 40 | |||
| Hg | 1.3 | 3.4 | |||
| O(x) | pH | 5 | 8 | 6.5 | 7.2 |
| SM | 0.15 | 0.45 | 0.15 | 0.3 | |
| C/N | 1 | 15 | 5 | 10 |
Note: The a and b are the lower and upper threshold value of the indicator, respectively. The a1 and b1 are the lower and upper optimum threshold value of the indicator, respectively. The nutrient indicators primarily refer to the Second National Soil Survey of China, while soil heavy metals refer to the Soil Environmental Quality–Risk Control Standard for Soil Contamination of Agricultural Land.
Table A2.
Common factor variance and weight of soil quality indicators under 0~40 cm.
Table A2.
Common factor variance and weight of soil quality indicators under 0~40 cm.
| Soil Indicator | Common Factor Variance | Weight |
|---|---|---|
| Clay | 0.79 | 5.22% |
| Silt | 0.88 | 5.47% |
| Sand | 0.91 | 5.67% |
| BD | 0.74 | 3.30% |
| SM | 0.77 | 2.84% |
| pH | 0.66 | 3.97% |
| SOM | 0.84 | 5.48% |
| TN | 0.87 | 5.53% |
| TP | 0.71 | 3.06% |
| TK | 0.68 | 4.18% |
| AN | 0.86 | 5.02% |
| AP | 0.60 | 4.05% |
| AK | 0.37 | 1.95% |
| C/N | 0.81 | 4.97% |
| EC | 0.67 | 3.88% |
| TS | 0.62 | 3.81% |
| Cr | 0.58 | 4.35% |
| Ni | 0.75 | 4.82% |
| Cu | 0.69 | 3.34% |
| Zn | 0.73 | 4.57% |
| Pb | 0.62 | 3.83% |
| Cd | 0.55 | 4.17% |
| As | 0.46 | 3.73% |
| Hg | 0.49 | 2.78% |
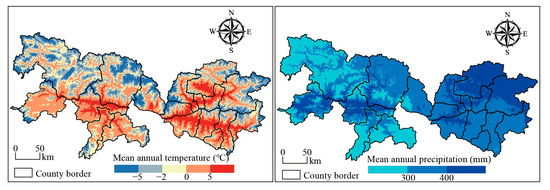
Figure A1.
Mean annual temperature and precipitation in study area.
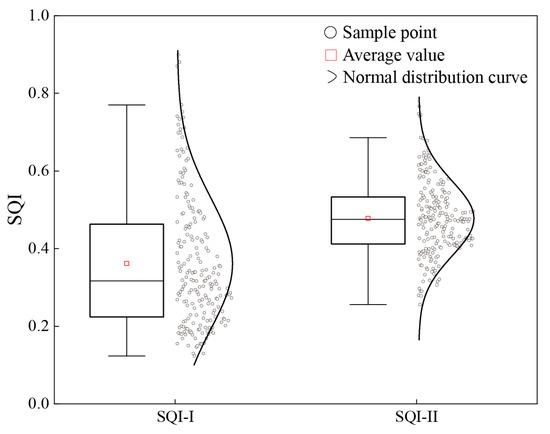
Figure A2.
The soil quality index (SQI) of cropland soil based on different datasets. The SQI-I dataset includes only major nutrient elements (SOM, N, P, and K), while SQI-II excludes heavy metal indicators.
References
- Lehmann, J.; Bossio, D.A.; Kögel-Knabner, I.; Rillig, M.C. The Concept and Future Prospects of Soil Health. Nat. Rev. Earth Environ. 2020, 1, 544–553. [Google Scholar] [CrossRef]
- Foley, J.A.; DeFries, R.; Asner, G.P.; Barford, C.; Bonan, G.; Carpenter, S.R.; Chapin, F.S.; Coe, M.T.; Daily, G.C.; Gibbs, H.K.; et al. Global Consequences of Land Use. Science 2005, 309, 570–574. [Google Scholar] [CrossRef]
- Bindraban, P.S.; Stoorvogel, J.J.; Jansen, D.M.; Vlaming, J.; Groot, J.J.R. Land Quality Indicators for Sustainable Land Management: Proposed Method for Yield Gap and Soil Nutrient Balance. Agric. Ecosyst. Environ. 2000, 81, 103–112. [Google Scholar] [CrossRef]
- Bünemann, E.K.; Bongiorno, G.; Bai, Z.; Creamer, R.E.; De Deyn, G.; de Goede, R.; Fleskens, L.; Geissen, V.; Kuyper, T.W.; Mäder, P.; et al. Soil Quality—A Critical Review. Soil Biol. Biochem. 2018, 120, 105–125. [Google Scholar] [CrossRef]
- Cardoso, E.J.B.N.; Vasconcellos, R.L.F.; Bini, D.; Miyauchi, M.Y.H.; dos Santos, C.A.; Alves, P.R.L.; de Paula, A.M.; Nakatani, A.S.; Pereira, J.d.M.; Nogueira, M.A. Soil Health: Looking for Suitable Indicators. What Should Be Considered to Assess the Effects of Use and Management on Soil Health? Sci. Agric. 2013, 70, 274–289. [Google Scholar] [CrossRef]
- Chen, T.; Jiao, J.; Zhang, Z.; Lin, H.; Zhao, C.; Wang, H. Soil Quality Evaluation of the Alluvial Fan in the Lhasa River Basin, Qinghai-Tibet Plateau. Catena 2022, 209, 105829. [Google Scholar] [CrossRef]
- MacDonald, K.B.; Bruce, K.; Agriculture, C.; Branch, A.-F.C.R. Broad-Scale Assessment of Agricultural Soil Quality in Canada Using Existing Land Resource Databases and Gis; Research Branch Technical Bulletin: Ottawa, ON, Canada, 1998. [Google Scholar]
- Moebius-Clune, B.N. Comprehensive Assessment of Soil Health: The Cornell Framework Manual; Cornell University: Ithaca, NY, USA, 2016. [Google Scholar]
- Teng, Y.; Wu, J.; Lu, S.; Wang, Y.; Jiao, X.; Song, L. Soil and Soil Environmental Quality Monitoring in China: A Review. Environ. Int. 2014, 69, 177–199. [Google Scholar] [CrossRef]
- McKenzie, D.C. Rapid Assessment of Soil Compaction Damage I. The SOILpak Score, a Semi-Quantitative Measure of Soil Structural Form. Soil Res. 2001, 39, 117–125. [Google Scholar] [CrossRef]
- Ditzler, C.A.; Tugel, A.J. Soil Quality Field Tools. Agron. J. 2002, 94, 33–38. [Google Scholar] [CrossRef]
- Li, Y.; Ma, J.; Li, Y.; Jia, Q.; Shen, X.; Xia, X. Spatiotemporal Variations in the Soil Quality of Agricultural Land and Its Drivers in China from 1980 to 2018. Sci. Total Environ. 2023, 892, 164649. [Google Scholar] [CrossRef]
- Qi, Y.; Darilek, J.L.; Huang, B.; Zhao, Y.; Sun, W.; Gu, Z. Evaluating Soil Quality Indices in an Agricultural Region of Jiangsu Province, China. Geoderma 2009, 149, 325–334. [Google Scholar] [CrossRef]
- AbdelRahman, M.A.E.; Tahoun, S. GIS Model-Builder Based on Comprehensive Geostatistical Approach to Assess Soil Quality. Remote Sens. Appl. Soc. Environ. 2019, 13, 204–214. [Google Scholar] [CrossRef]
- Kinoshita, R.; Moebius-Clune, B.N.; Es, H.M.; Hively, W.D.; Bilgilis, A.V. Strategies for Soil Quality Assessment Using Visible and Near-Infrared Reflectance Spectroscopy in a Western Kenya Chronosequence. Soil Sci. Soc. Am. J. 2012, 76, 1776–1788. [Google Scholar] [CrossRef]
- Dose, H.L.; Fortuna, A.-M.; Cihacek, L.J.; Norland, J.; DeSutter, T.M.; Clay, D.E.; Bell, J. Biological Indicators Provide Short Term Soil Health Assessment during Sodic Soil Reclamation. Ecol. Indic. 2015, 58, 244–253. [Google Scholar] [CrossRef]
- Guo, L.; Sun, Z.; Ouyang, Z.; Han, D.; Li, F. A Comparison of Soil Quality Evaluation Methods for Fluvisol along the Lower Yellow River. Catena 2017, 152, 135–143. [Google Scholar] [CrossRef]
- Daunoras, J.; Kačergius, A.; Gudiukaitė, R. Role of Soil Microbiota Enzymes in Soil Health and Activity Changes Depending on Climate Change and the Type of Soil Ecosystem. Biology 2024, 13, 85. [Google Scholar] [CrossRef]
- Zhai, J.; Zhou, H.; Wu, Y.; Wang, G.; Xue, S. Effect of Nitrogen and Phosphorus on Soil Enzyme Activities and Organic Carbon Stability in Qinghai–Tibet Plateau. Agronomy 2024, 14, 1376. [Google Scholar] [CrossRef]
- Lee, S.-H.; Kim, M.-S.; Kim, J.-G.; Kim, S.-O. Use of Soil Enzymes as Indicators for Contaminated Soil Monitoring and Sustainable Management. Sustainability 2020, 12, 8209. [Google Scholar] [CrossRef]
- Bone, J.; Head, M.; Barraclough, D.; Archer, M.; Scheib, C.; Flight, D.; Voulvoulis, N. Soil Quality Assessment under Emerging Regulatory Requirements. Environ. Int. 2010, 36, 609–622. [Google Scholar] [CrossRef]
- El Behairy, R.A.; El Arwash, H.M.; El Baroudy, A.A.; Ibrahim, M.M.; Mohamed, E.S.; Kucher, D.E.; Shokr, M.S. How Can Soil Quality Be Accurately and Quickly Studied? A Review. Agronomy 2024, 14, 1682. [Google Scholar] [CrossRef]
- Wei, L.; Chen, S.; Cui, J.; Ping, H.; Yuan, C.; Chen, Q. A Meta-Analysis of Arable Soil Phosphorus Pools Response to Manure Application as Influenced by Manure Types, Soil Properties, and Climate. J. Environ. Manag. 2022, 313, 115006. [Google Scholar] [CrossRef] [PubMed]
- Zhuo, Z.; Chen, Q.; Zhang, X.; Chen, S.; Gou, Y.; Sun, Z.; Huang, Y.; Shi, Z. Soil Organic Carbon Storage, Distribution, and Influencing Factors at Different Depths in the Dryland Farming Regions of Northeast and North China. Catena 2022, 210, 105934. [Google Scholar] [CrossRef]
- Mayor, J.R.; Sanders, N.J.; Classen, A.T.; Bardgett, R.D.; Clement, J.-C.; Fajardo, A.; Lavorel, S.; Sundqvist, M.K.; Bahn, M.; Chisholm, C. Elevation Alters Ecosystem Properties across Temperate Treelines Globally. Nature 2017, 542, 91–95. [Google Scholar] [CrossRef]
- Yu, H.; Zha, T.; Zhang, X.; Nie, L.; Ma, L.; Pan, Y. Spatial Distribution of Soil Organic Carbon May Be Predominantly Regulated by Topography in a Small Revegetated Watershed. Catena 2020, 188, 104459. [Google Scholar] [CrossRef]
- Wang, Z.; Huang, L.; Shao, M. Spatial Variations and Influencing Factors of Soil Organic Carbon under Different Land Use Types in the Alpine Region of Qinghai-Tibet Plateau. Catena 2023, 220, 106706. [Google Scholar] [CrossRef]
- Kudureti, A.; Zhao, S.; Zhakyp, D.; Tian, C. Responses of Soil Fauna Community under Changing Environmental Conditions. J. Arid Land 2023, 15, 620–636. [Google Scholar] [CrossRef]
- Sapkota, A.; Haghverdi, A.; Avila, C.C.E.; Ying, S.C. Irrigation and Greenhouse Gas Emissions: A Review of Field-Based Studies. Soil Syst. 2020, 4, 20. [Google Scholar] [CrossRef]
- Zhao, Z.; Gao, S.; Lu, C.; Xiaoyu, L.I.; Li, F.; Wang, T. Effects of Different Tillage and Fertilization Management Practices on Soil Organic Carbon and Aggregates under the Rice–Wheat Rotation System. Soil Tillage Res. 2021, 212, 105071. [Google Scholar] [CrossRef]
- Yang, H.; Song, X.; Zhao, Y.; Wang, W.; Cheng, Z.; Zhang, Q.; Cheng, D. Temporal and Spatial Variations of Soil C, N Contents and C: N Stoichiometry in the Major Grain-Producing Region of the North China Plain. PLoS ONE 2021, 16, e0253160. [Google Scholar] [CrossRef]
- Marrugo-Negrete, J.; Pinedo-Hernández, J.; Díez, S. Assessment of Heavy Metal Pollution, Spatial Distribution and Origin in Agricultural Soils along the Sinú River Basin, Colombia. Environ. Res. 2017, 154, 380–388. [Google Scholar] [CrossRef]
- Zhu, Y.; Jia, X.; Qiao, J.; Binley, A.; Horton, R.; Hu, W.; Wang, Y.; Shao, M. Capacity and Distribution of Water Stored in the Vadose Zone of the Chinese Loess Plateau. Vadose Zone J. 2019, 18, 180203. [Google Scholar] [CrossRef]
- Huang, K.; Ma, Z.; Xia, P.; Lin, T.; Zhang, Z.; Jiang, X.; Wang, X.; Huang, X. Spatial Pattern and Controlling Factors of Soil Organic Carbon Density in a Typical Karst Province, China. Soil Tillage Res. 2024, 242, 106160. [Google Scholar] [CrossRef]
- Zeng, C.; Zhang, F.; Wang, Q.; Chen, Y.; Joswiak, D.R. Impact of Alpine Meadow Degradation on Soil Hydraulic Properties over the Qinghai-Tibetan Plateau. J. Hydrol. 2013, 478, 148–156. [Google Scholar] [CrossRef]
- Genxu, W.; Ju, Q.; Guodong, C.; Yuanmin, L. Soil Organic Carbon Pool of Grassland Soils on the Qinghai-Tibetan Plateau and Its Global Implication. Sci. Total Environ. 2002, 291, 207–217. [Google Scholar] [CrossRef] [PubMed]
- Zhang, D.; Zhou, Z.; Zhang, B.; Du, S.; Liu, G. The Effects of Agricultural Management on Selected Soil Properties of the Arable Soils in Tibet, China. Catena 2012, 93, 1–8. [Google Scholar] [CrossRef]
- Zhang, X.; Li, M.-J.; Yang, C.; Zhan, L.-Q.; Wu, W.; Liu, H.-B. The Stratification of Soil Organic Carbon and Total Nitrogen Affected by Parent Material and Cropping System. Catena 2022, 210, 105898. [Google Scholar] [CrossRef]
- Zhu, X.; Huang, L.; Wang, J.; Shao, M. Soil Erodibility and Its Scale-Specific Controls along a Southeast-Northwest Transect on the Tibetan Plateau. Catena 2023, 232, 107431. [Google Scholar] [CrossRef]
- Du, H.; Wang, J.; Wang, Y.; Yao, Y.; Liu, X.; Zhou, Y. Contamination Characteristics, Source Analysis, and Spatial Prediction of Soil Heavy Metal Concentrations on the Qinghai-Tibet Plateau. J. Soils Sediments 2023, 23, 2202–2215. [Google Scholar] [CrossRef]
- Tian, Y.; Zha, X.; Gao, X.; Yu, C. Geochemical Characteristics and Source Apportionment of Toxic Elements in the Tethys–Himalaya Tectonic Domain, Tibet, China. Sci. Total Environ. 2022, 831, 154863. [Google Scholar] [CrossRef]
- Zhao, W.; Huang, L.-M. Deciphering Spatial Variability and Dominant Controls of Soil Quality under Four Types of Grassland along a Southeast-Northwest Transect in Tibet, Southwestern China. Catena 2024, 243, 108221. [Google Scholar] [CrossRef]
- Namgyal. China’s West Development Strategy and Rural Empowerment: Is There A Link? A Case Study of the Tibetan Plateau Region. In China’s West Region Development; World Scientific: Singapore, 2004; pp. 409–438. ISBN 978-981-238-800-1. [Google Scholar]
- Zhang, L.; Xu, E. Effects of Agricultural Land Use on Soil Nutrients and Its Variation along Altitude Gradients in the Downstream of the Yarlung Zangbo River Basin, Tibetan Plateau. Sci. Total Environ. 2023, 905, 167583. [Google Scholar] [CrossRef] [PubMed]
- Wang, Z.; Gong, D.; Zhang, Y. Investigating the Effects of Greenhouse Vegetable Cultivation on Soil Fertility in Lhasa, Tibetan Plateau. Chin. Geogr. Sci. 2020, 30, 456–465. [Google Scholar] [CrossRef]
- Sang, Y.; Xin, L. Factors Determining Concurrent Reclamation and Abandonment of Cultivated Land on the Qinghai-Tibet Plateau. Land 2023, 12, 1081. [Google Scholar] [CrossRef]
- IUSS Working Group WRB. World Reference Base for Soil Resources. International Soil Classification System for Naming Soils and Creating Legends for Soil Map, 4th ed.; International Union of Soil Sciences (IUSS): Vienna, Austria, 2022. [Google Scholar]
- Shamrikova, E.V.; Vanchikova, E.V.; Kondratenok, B.M.; Lapteva, E.M.; Kostrova, S.N. Problems and Limitations of the Dichromatometric Method for Measuring Soil Organic Matter Content: A Review. Eurasian Soil Sci. 2022, 55, 861–867. [Google Scholar] [CrossRef]
- Liu, J.; Gou, X.; Liu, J.; Yin, D.; Zhang, D. Comparative Analysis of the Drivers of Soil Organic Carbon, Total Nitrogen, and Phosphorus Stocks in Different Coniferous Plantations on the Eastern Tibetan Plateau. J. Soil Sci. Plant Nutr. 2024, 24, 331–342. [Google Scholar] [CrossRef]
- Wan, H.-S.; Zhang, W.-C.; Wu, W.; Liu, H.-B. Environmental Factors Affecting Soil Organic Carbon, Total Nitrogen, Total Phosphorus under Two Cropping Systems in the Three Gorges Reservoir Area. J. Soils Sediments 2023, 23, 831–844. [Google Scholar] [CrossRef]
- Liu, X.; Ma, J.; Ma, Z.-W.; Li, L.-H. Soil Nutrient Contents and Stoichiometry as Affected by Land-Use in an Agro-Pastoral Region of Northwest China. Catena 2017, 150, 146–153. [Google Scholar] [CrossRef]
- Xiao, F.; Cui, X.; Zhao, Y.; Fu, J.; Yu, T.; Bu, D.; Zhang, Q. Concentration, Spatial Distribution, and Source Apportionment of Heavy Metals in Agricultural Soils from the Yarlung Zangbo River Basin, Tibetan Plateau. Environ. Earth Sci. 2023, 82, 577. [Google Scholar] [CrossRef]
- Andrews, S.; Mitchell, J.; Roberto, M.; Karlen, D.; Hartz, T.; Horwath, W.; Pettygrove, S.; Scow, K.; Munk, D. On-Farm Assessment of Soil Quality in California’s Central Valley. Agron. J. 2002, 94, 12. [Google Scholar] [CrossRef]
- Doran, J.W.; Parkin, T.B. Defining and Assessing Soil Quality. In Defining Soil Quality for a Sustainable Environment; John Wiley & Sons, Ltd.: Hoboken, NJ, USA, 1994; pp. 1–21. ISBN 978-0-89118-930-5. [Google Scholar]
- Xie, Y.; Shen, Z.; Wang, T.; Malanson, G.P.; Peñuelas, J.; Wang, X.; Chen, X.; Liang, E.; Liu, H.; Yang, M.; et al. Uppermost Global Tree Elevations Are Primarily Limited by Low Temperature or Insufficient Moisture. Glob. Change Biol. 2024, 30, e17260. [Google Scholar] [CrossRef]
- Jin, Z.; Ping, L.; Wong, M. Systematic Relationship between Soil Properties and Organic Carbon Mineralization Based on Structural Equation Modeling Analysis. J. Clean. Prod. 2020, 277, 123338. [Google Scholar] [CrossRef]
- Li, Q.; Cai, L.; Wang, R.; Xia, C.; Cui, G.; Li, C.; Zheng, X.; Cai, X. Development of Structural Equation Models to Unveil Source-Sink Switches of Mid-Latitude Soils for Semi-Volatile Banned Pesticides. Environ. Pollut. 2023, 318, 120888. [Google Scholar] [CrossRef] [PubMed]
- Zhang, X.; Li, X.; Ji, X.; Zhang, Z.; Zhang, H.; Zha, T.; Jiang, L. Elevation and Total Nitrogen Are the Critical Factors That Control the Spatial Distribution of Soil Organic Carbon Content in the Shrubland on the Bashang Plateau, China. Catena 2021, 204, 105415. [Google Scholar] [CrossRef]
- Hu, L.; Bentler, P.M. Cutoff Criteria for Fit Indexes in Covariance Structure Analysis: Conventional Criteria versus New Alternatives. Struct. Equ. Model. A Multidiscip. J. 1999, 6, 1–55. [Google Scholar] [CrossRef]
- Virtanen, P.; Gommers, R.; Oliphant, T.E.; Haberland, M.; Reddy, T.; Cournapeau, D.; Burovski, E.; Peterson, P.; Weckesser, W.; Bright, J.; et al. SciPy 1.0: Fundamental Algorithms for Scientific Computing in Python. Nat. Methods 2020, 17, 261–272. [Google Scholar] [CrossRef]
- IBM Corp. IBM SPSS Statistics for Windows, Version 27.0; IBM: Armonk, NY, USA, 2020.
- R Core Team. R: A Language and Environment for Statistical Computing; R Foundation for Statistical Computing: Vienna, Austria, 2024. [Google Scholar]
- Wiesmeier, M.; Urbanski, L.; Hobley, E.; Lang, B.; von Lützow, M.; Marin-Spiotta, E.; van Wesemael, B.; Rabot, E.; Ließ, M.; Garcia-Franco, N.; et al. Soil Organic Carbon Storage as a Key Function of Soils—A Review of Drivers and Indicators at Various Scales. Geoderma 2019, 333, 149–162. [Google Scholar] [CrossRef]
- Mu, C.; Zhang, T.; Zhang, X.; Cao, B.; Peng, X.; Cao, L.; Su, H. Pedogenesis and Physicochemical Parameters Influencing Soil Carbon and Nitrogen of Alpine Meadows in Permafrost Regions in the Northeastern Qinghai-Tibetan Plateau. Catena 2016, 141, 85–91. [Google Scholar] [CrossRef]
- Xie, X.; Pu, L.; Zhu, M.; Wu, T.; Xu, Y.; Wang, X. Effect of Long-Term Reclamation on Soil Quality in Agricultural Reclaimed Coastal Saline Soil, Eastern China. J. Soils Sediments 2020, 20, 3909–3920. [Google Scholar] [CrossRef]
- Ma, J.; Chen, Y.; Zhou, J.; Wang, K.; Wu, J. Soil Quality Should Be Accurate Evaluated at the Beginning of Lifecycle after Land Consolidation for Eco-Sustainable Development on the Loess Plateau. J. Clean. Prod. 2020, 267, 122244. [Google Scholar] [CrossRef]
- Jin, H.; Shi, D.; Lou, Y.B.; Zhang, J.; Ye, Q.; Jiang, N. Evaluation of the Quality of Cultivated-Layer Soil Based on Different Degrees of Erosion in Sloping Farmland with Purple Soil in China. Catena 2021, 198, 105048. [Google Scholar] [CrossRef]
- Zhang, Y.; Cai, X.; Lv, J. Size and Dynamics of Soil Organic Carbon Stock in Cropland of the Eastern Qinghai-Tibetan Plateau. Agric. Ecosyst. Environ. 2016, 222, 125–132. [Google Scholar] [CrossRef]
- Peng, S.; Huang, J.; Zhong, X.; Yang, J.; Wang, G.; Zou, Y.; Zhang, F.; Zhu, Q.; Buresh, R.; Witt, C. Challenge and Opportunity in Improving Fertilizer-Nitrogen Use Efficiency of Irrigated Rice in China. Agr. Sci. China 2002, 1, 776–785. [Google Scholar]
- Tian, L.; Zhao, L.; Wu, X.; Fang, H.; Zhao, Y.; Yue, G.; Liu, G.; Chen, H. Vertical Patterns and Controls of Soil Nutrients in Alpine Grassland: Implications for Nutrient Uptake. Sci. Total Environ. 2017, 607–608, 855–864. [Google Scholar] [CrossRef]
- Xin, Z.; Qin, Y.; Yu, X. Spatial Variability in Soil Organic Carbon and Its Influencing Factors in a Hilly Watershed of the Loess Plateau, China. Catena 2016, 137, 660–669. [Google Scholar] [CrossRef]
- Zhan, J.; Li, Y.; Cheng, L.; Yang, H.; Ning, Z.; Liang, R. Effect of N Addition and Litter Manipulation on Plant Community Productivity in the Semiarid Sandy Grassland. Ecol. Eng. 2024, 201, 107191. [Google Scholar] [CrossRef]
- Chen, H.; Ju, P.; Zhu, Q.; Xu, X.; Wu, N.; Gao, Y.; Feng, X.; Tian, J.; Niu, S.; Zhang, Y.; et al. Carbon and Nitrogen Cycling on the Qinghai–Tibetan Plateau. Nat. Rev. Earth Environ. 2022, 3, 701–716. [Google Scholar] [CrossRef]
- Sridhar, B.; Lawrence, G.; Debenport, S.; Fahey, T.; Buckley, D.; Wilhelm, R.; Goodale, C. Watershed-scale Liming Reveals the Short- and Long-term Effects of pH on the Forest Soil Microbiome and Carbon Cycling. Environ. Microbiol. 2022, 24, 6184–6199. [Google Scholar] [CrossRef]
- Casucci, C.; Okeke, B.C.; Frankenberger, W.T. Effects of Mercury on Microbial Biomass and Enzyme Activities in Soil. Biol. Trace Elem. Res. 2003, 94, 179–191. [Google Scholar] [CrossRef]
- Fang, H.J.; Cheng, S.L.; Yu, G.R.; Yang, X.M.; Xu, M.J.; Wang, Y.S.; Li, L.S.; Dang, X.S.; Wang, L.; Li, Y.N. Nitrogen Deposition Impacts on the Amount and Stability of Soil Organic Matter in an Alpine Meadow Ecosystem Depend on the Form and Rate of Applied Nitrogen. Eur. J. Soil Sci. 2014, 65, 510–519. [Google Scholar] [CrossRef]
- Liu, Y.; He, N.; Wen, X.; Xu, L.; Sun, X.; Yu, G.; Liang, L.; Schipper, L.A. The Optimum Temperature of Soil Microbial Respiration: Patterns and Controls. Soil Biol. Biochem. 2018, 121, 35–42. [Google Scholar] [CrossRef]
- Li, F.; Yuan, C.; Lao, D.; Yao, B.; Hu, X.; You, Y.; Wang, L.; Sun, S.; Liang, X. Drip Irrigation with Organic Fertilizer Application Improved Soil Quality and Fruit Yield. Agron. J. 2020, 112, 608–623. [Google Scholar] [CrossRef]
Disclaimer/Publisher’s Note: The statements, opinions and data contained in all publications are solely those of the individual author(s) and contributor(s) and not of MDPI and/or the editor(s). MDPI and/or the editor(s) disclaim responsibility for any injury to people or property resulting from any ideas, methods, instructions or products referred to in the content. |
© 2025 by the authors. Licensee MDPI, Basel, Switzerland. This article is an open access article distributed under the terms and conditions of the Creative Commons Attribution (CC BY) license (https://creativecommons.org/licenses/by/4.0/).