Article

Enhancement of Antioxidant Enzymatic Defenses in Salt-Adapted Rice Seedlings

Department of Life Science and Biotechnology, University of Ferrara, Via L. Borsari 46, I-44121 Ferrara, Italy
Agriculture 2025, 15(12), 1234; https://doi.org/10.3390/agriculture15121234
Submission received: 18 April 2025 / Revised: 28 May 2025 / Accepted: 4 June 2025 / Published: 6 June 2025
(This article belongs to the Special Issue Physiological and Molecular Mechanisms of Stress Tolerance in Rice)

Abstract

While a rapid activation of antioxidant defense mechanisms following the exposure to salt stress has been widely reported in plants, less is known about their role under prolonged ionic stress conditions. This study aimed at investigating whether increased levels of enzymatic antioxidants are required in salt-acclimated plants. Rice, a staple crop for more than half of the world’s population, is very sensitive to excess salt, mainly at the seedling stage. The levels of selected antioxidant enzymes and the non-enzymatic antioxidant glutathione were measured in seedlings of a group of five Italian rice cultivars showing a natural variability in the susceptibility to a moderate saline environment. Up to 15.62 dS/m, the presence of salts caused a progressive growth inhibition, yet thiobarbituric acid reactive substance levels did not significantly increase. Accordingly, chlorophyll content appeared unaffected, suggesting successful acclimation. Immunological analysis showed increases of catalase protein levels in shoots, and of Cu/Zn- and Mn-dependent superoxide dismutases in both roots and shoots, whereas no variations were found for other enzymes. Only slight differences in glutathione content were evident between salt-grown seedlings and untreated controls. The data suggest that an enhancement of antioxidant defenses in different tissues takes place in rice plants to cope with sublethal salt stress conditions.

1. Introduction

Because of climate change, hyperosmotic stress conditions due to lower rainfall, irrigation with poor quality water or salt build-up in the soil are increasingly taking place [1] and threatening agricultural yields [2]. Excess salt occurs when ionic concentration in the soil solution exceeds an electrical conductivity of 4 dS/m, corresponding to about 30–40 mM ions [3]. Aside from NaCl, other salts such as CaCl2, MgSO4 and Na2SO4 contribute to field salinity [4]. High salt concentration in the soil may severely affect plant growth through three different mechanisms: osmotic, ionic and secondary stress [5]. Raising the salt concentration in the soil solution decreases its water potential, thereby hindering water uptake by the roots. Plants can avoid symplast dehydration by osmotic compensation, i.e., by accumulating high intracellular levels of the so-called compatible osmolytes [6], the most widespread being the amino acid proline [7]. In different tissues, ion uptake by the cells interferes with physiological ion homeostasis and disrupts nutrient balance [8,9], whereas the presence of high Na+ (or Cl in some species [10]) levels in the cytosol causes protein denaturation and membrane damage [11]. A progressive reduction of the photosynthetic rate is also found due to a direct reduction of chlorophyll content [12]. To avoid these adverse effects, plants can limit ion uptake at either the root or the shoot level [13], or compartmentalize/extrude Na+ and Cl in the vacuole/apoplast [14,15].
Osmotic- and ionic-induced damages cause the production of reactive oxygen species (ROS), which can lead to a secondary oxidative stress at the cellular level [15,16]. ROS arise as a consequence of many stress conditions in plants, and comprise both radical (such as the superoxide anion O2•−) and non-radical molecules (as hydrogen peroxide, H2O2). At low levels, ROS play a role as secondary messengers, leading to defense activation [17,18], whereas at high levels, they cause dramatic effects through lipid peroxidation and protein inactivation [19]. The main product of membrane lipid peroxidation, malondialdehyde, is considered a marker of the degree of cell oxidative damage. It can be measured by reaction with thiobarbituric acid, and an increased level of thiobarbituric acid reactive substances (TBARS) can be used as an index of susceptibility to salt stress [20]. To avoid, or at least limit these damages, efficient antioxidant pathways are promptly activated that work in concert to scavenge ROS [19]. The core of this redox hub is the dismutation of O2•− into molecular oxygen and H2O2, which in turn is converted into water (or water and oxygen) using (or not) reducing power. The latter is regenerated by the ascorbate-glutathione-NADPH (also known as the Halliwell–Asada) pathway, where glutathione (GSH) is the center of a much more complex regulatory network for redox homeostasis [21]. A number of studies showed that faster or greater activation of these antioxidant systems correlates with increased tolerance to hyperosmotic stress (e.g., [22,23,24,25,26,27]). Most of such evidence was obtained at a short time after the exposure to excess salt, when levels of several antioxidant enzymes and/or non-enzymatic antioxidant molecules were found strikingly higher than in untreated controls. Much less information is available concerning their levels in salt-adapted plants, i.e., in plants directly sown and grown in the presence of inhibitory but sublethal concentration of salts.
Rice (Oryza sativa L.) is a staple food for over half the world’s population, with more than 475 million tons consumed worldwide. In India and China, this cereal provides up to 50% of the dietary caloric supply for millions [28]. Rice is very sensitive to excess salt at the seedling stage and at the onset of flowering, when it can cause poor crop establishment or disrupt grain formation and lower the yield, respectively [29]. Even a low conductivity value (3 dS/m) was found to inhibit growth, and about 12% yield reduction was shown for each further 1 dS/m increase [30]. Additional experimental evidence showed, in some instances, a damage threshold as low as 1.9 dS/m [4]. Because of the agronomical relevance, the effect of salt stress conditions on rice physiology and its defense responses are of great interest [31,32]. Several studies on rice showed the salt-induced activation of an antioxidant defense system consisting of both enzymatic (superoxide dismutase [SOD], catalase [CAT], ascorbate peroxidase [APX] and glutathione reductase [GR]) and non-enzymatic components (glutathione, ascorbate and proline) to counteract the secondary toxicity of excess salt [15]. Consistently, increased activity levels of APX and CAT have been found in salt-tolerant rice varieties, allowing it to reduce ROS levels and to ameliorate ionic imbalance [33,34]. SOD plays a pivotal role by reducing the primary radical formed, superoxide. Since toxic O2 levels can arise in several compartments of a salt-stressed cell, gene duplication events led to evolving multiple enzyme forms with different subcellular localizations that may ensure its quenching throughout. SOD isoforms have been identified in rice chloroplasts, mitochondria and in the cytosol, which use various metal ions as co-factors [35,36]. Superoxide reduction by SOD gives rise to H2O2, which has to be detoxified by CAT or APX. Additionally, in the case of CAT, higher activity levels have been found to correlate with increased salt tolerance [37]. The role of antioxidant enzymes in counteracting part of the toxic effects of excess salt has also been strengthened by the results obtained by overexpressing selected genes. Rice plants overexpressing a plastidal Cu/ZnSOD performed better under salt stress than non-transgenic controls [38]. Transgenic rice plants overexpressing a CAT gene from Escherichia coli survived at 100 mM NaCl, whereas non-transgenic plants did not grow at 50 mM NaCl [39]. When overexpressed in A. thaliana, two APX genes from rice induced increased salt tolerance, though to a different extent [40]. Interestingly, higher levels of CAT and peroxidase activity were found in plants overexpressing Cu/ZnSOD 2 and 3, suggesting concerted regulation of the antioxidant defense system [41].
However, most studies were carried out with Asian rice genotypes. Limited information has been obtained to date for the European rice germplasm, where Italy is the main producer, with about 250,000 ha (www.enterisi.it, accessed on 24 March 2025) and hundreds of cultivated varieties [42]. A differential susceptibility to excess salt was previously found among a set of 17 Italian rice cultivars during early growth under moderate stress conditions [43]. The characterization of a subset of representative genotypes showed that the differential tolerance is not due to a different ion homeostasis in leaves [44]. The measurement of salt-induced proline levels in shoots led to the conclusion that the ability to withstand salt stress conditions is at least in part due to an increase in proline metabolic rates, and not to the resulting intracellular proline levels [43]. To go one step further, the activation of selected antioxidant defenses was investigated. In more detail, the aims of this study were: ➀ to verify whether oxidative damages are detectable in rice seedlings directly sown in the presence of sublethal salt levels; ➁ to ascertain whether higher levels of antioxidant enzymes are present in roots and/or shoots of salt-acclimated seedlings; ➂ to investigate whether different levels of antioxidant enzymes contribute to the differential sensitivity to salts previously found among these rice varieties. The results herein described suggest that increased homeostatic levels of antioxidant enzymes are required to allow growth under partially inhibitory conditions.

2. Materials and Methods

The experiments were carried out in 2023–2024; the immunological analyses were performed first in 2014, and then repeated in 2024.

2.1. Plant Material and Growth Conditions

Rice (Oryza sativa L.) seeds of five Italian genotypes (Loto [long A grain type], Volano [long A grain type], Baldo [long A grain type], Carnaroli [long A grain type] and Vialone nano [medium grain type]), previously shown to differ in their susceptibility to salt stress [43,44], were provided by the Unità di ricerca per la risicoltura of the Consiglio per la Ricerca in Agricoltura e l’Analisi della Economia Agraria (CREA; Vercelli, Italy). Seeds were surface-sterilized by treatment with absolute ethanol for 5 min under vacuum, followed by 10 min in a 3% NaClO solution containing 0.04% (v/v) Triton X100. Seeds were then washed at least 5 times with sterile distilled water to completely remove NaClO, and allowed to imbibe in the dark for 4–5 h. Seeds were then transferred to Magenta vessels (6⇨ × 6⇗ × 20⇧ cm) containing 75 mL of agarized (6‰) water; 16 seeds were sown for each vessel, which were covered with 75 mL of 2× nutrient solution (Supplementary Table S1 [44]), pH 5.8, containing 2 mL L−1 Plant Preservative Mixture (Plant Cell Technology, Washington, DC, USA). Vessels were placed in an incubator equipped with E27 ES 1700 lumen daylight lamps (GE Lighting, Cleveland, OH, USA) under a photoperiod of 14 h light (about 150 µmol m−2 s−1) and 10 h dark at 26 ± 1 °C (day) and 22 ± 1 °C (night).

Salt Treatments

To evaluate the antioxidant response in salt-adapted plants, seedlings of the five rice varieties were grown under conditions that in previous studies had been found inhibitory for growth, but not lethal [43,44]. Increasing conductivity values were obtained by adding to the nutrient solution a salt mixture (NaCl, CaCl2, MgSO4 and Na2SO4 in a 10:1:2:1 molar ratio) so as to obtain the same ionic composition that has been reported in rice-growing areas affected by excess salt [4]. The actual conductivity values were measured with a conductivity meter (Hanna HI 8733, Leighton Buzzard, UK) 24 h after sowing and 2 weeks thereafter, at the end of incubation. A randomized complete block design with four replicates was used, each block consisting of Magenta vessels (each one containing 16 seedlings) of various salt rates (from 4.68 to 15.64 dS/m) and untreated controls (0.72 dS/m). Destructive harvest was performed when untreated controls reached the three-leaf stage, 14 to 16 days after sowing. Seedlings were weighed individually to the nearest 0.1 mg for the determination of the fresh weight (FW). Chlorophyll content was measured just before harvesting on 20 seedlings (5 seedlings for each of the four Magenta vessels that had been carried out for each treatment) using a SPAD-502 meter (Minolta, Ramsay, NJ, USA) by reading at ⅓, ½ and ⅔ of the distance from the base of the second, fully developed leaf, as described [45]. For the determination of dry weight (DW), the material obtained from a single Magenta vessel was combined and treated in an oven at 90 °C for 48 h. In all cases, mean values ± SE are reported.

2.2. Quantitation of Thiobarbituric Acid Reactive Substances

To measure TBARS, plant material (shoots or roots) was weighed and transferred into a mortar equilibrated on ice at 4 °C. After the addition of 2 mL g−1 of a 0.1% (w/v) TCA solution and 1 g g−1 quartz sand, pestle homogenization proceeded for 5 min. The homogenate was centrifuged for 3 min at 14,000× g, and TBARS were determined in the supernatant. With this aim, proper dilutions in a final volume of 40 μL were mixed with 80 μL of 20% (w/v) TCA and 80 μL of 0.67% (w/v) thiobarbituric acid solutions. Samples were treated at 70 °C for 30 min, and then read at 532 nm. Two technical replications were performed for each sample. TBARS were estimated on the basis of a calibration curve obtained with increasing amounts (from 2 to 20 nmol) of an authentic standard of malondialdehyde. Ten biological replications were performed for each of the 20 treatments (5 rice cultivars x 3 salt treatments plus the untreated control). Data were expressed on a DW basis. Mean values ± SE are reported.

2.3. Immunological Analyses

Shoots or roots from six uniformly grown seedlings were combined and extracted in an ice-cold mortar with 6 mL g−1 of 50 mM Tris–HCl buffer (pH 6.8) containing 1 mM dithiothreitol, and 2 g g−1 quartz sand. The homogenate was centrifuged for 3 min at 14,000× g, and the supernatant received ammonium sulphate to 70% saturation. Salted-out proteins were pelleted by centrifugation as above, and pellets were resuspended in a minimal volume of extraction buffer. Protein content was determined by the Coomassie Blue assay [46], using bovine serum albumin as the standard. Following proper dilution so as to obtain a protein concentration of 20 mg mL−1 (extracts from shoots) or 10 mg mL−1 (roots), samples were mixed with the same volume of 125 mM Tris–HCl buffer (pH 6.8), containing 4% (w/v) SDS, 20% (v/v) glycerol and 10% (v/v) β-mercaptoethanol, and denatured by boiling 5 min. Aliquots of the denatured samples (50-μL) were subjected to discontinuous SDS-PAGE in a vertical stab gel unit (SE 400 Hoefer, Bridgewater, MA, USA) with a 5% stacking gel and a separating gel with various acrylamide concentrations (29:1 acrylamide:bisacrylamide), as required (Table 1). Gels were run at 8 mA. Proteins were transferred to a nitrocellulose membrane at 10 mV overnight. Immunodetection was performed with a 1:4000 dilution of a suitable antiserum (Agrisera AB, Vännäs, Sweden; Table 1), and a 1:10,000 dilution of goat anti-rabbit IgG conjugated with alkaline phosphatase (Sigma A3687, Sigma-Aldrich-Merck, Darmstadt, Germany). Blots were developed by soaking at 37 °C in 20 mL of 100 mM Tris-HCl buffer, pH 9.5, containing 100 mM NaCl, 5 mM MgCl2, 6 mM nitro blue tetrazolium and 3 mM 5-bromo-4-chloro-3-indolyl phosphate. The reaction was stopped by transferring the blots into 20 mM EDTA. Densitometric analysis of immunoblots was performed using the ImageJ (version 1.54g) software [47]. Results were expressed as fold variation with respect to the signal obtained for untreated controls. Two independent experiments were performed, and data were combined.

2.4. Determination of GSH and GSSG Levels

Glutathione was quantitated by the method of Queval and Noctor [48]. Seedlings were weighted, resuspended in 2 mL g−1 of 3% (w/v) 5-sulfosalicylic acid solution and extracted in a mortar, as described. After centrifugation, the supernatant was split into two identical aliquots, one of which was mixed with the same volume of a 6 mM solution of 1-methyl-2-vinylpyridinium (MVP) in 0.1 M HCl, immediately buffering by the addition of 2 mL mL−1 of 160 mM sodium carbonate, pH 10. MVP forms a conjugate with the thiol of GSH, blocking its reactivity. Total glutathione was then quantified in both aliquots by the 2,2′-dinitro–5,5′-dithiodibenzoic acid (DTNB)-GR recycling assay. By using a 96-well microplate, sample dilutions in a final volume of 10 μL were mixed with 150 μL of 0.04 mg mL−1 DTNB in 100 mM potassium phosphate buffer, pH 7.0, containing 1 mM EDTA and 0.16 U of glutathione reductase from baker’s yeast (Sigma G3664, Sigma-Aldrich-Merck, Darmstadt, Germany). After 5 min, the reaction was started by adding 50 μL of 0.16 mg mL−1 NADPH, and the increase of absorbance was determined for 5 min at 1 min intervals using a plate reader (Ledetect 96; Labexim, Lengau, Austria) equipped with an LED plug-in at 405 nm. Total glutathione concentration was determined by comparison with a calibration curve obtained under the same conditions with increasing amounts (from 5 to 60 nmol) of an authentic standard. GSSG was estimated from the values obtained with MVP-treated samples, and GSH was calculated by difference between untreated and treated samples. Three technical replications were performed for each sample. Ten biological replications were performed for each of the 20 treatments (5 rice cultivars × 3 salt treatments plus the untreated control). The obtained values were expressed on a DW basis. The whole experiment was repeated twice, and data were combined.

2.5. Statistical Analysis

Data were analyzed with the Prism 6 program (version 6.03, GraphPad Software, Inc., Boston, MA, USA). The tests used are detailed in the legend of each figure. Significant differences at the 5% (p < 0.05), 1% (p < 0.01) and 0.1% (p < 0.001) level are marked with *, ** and ***, respectively.

3. Results

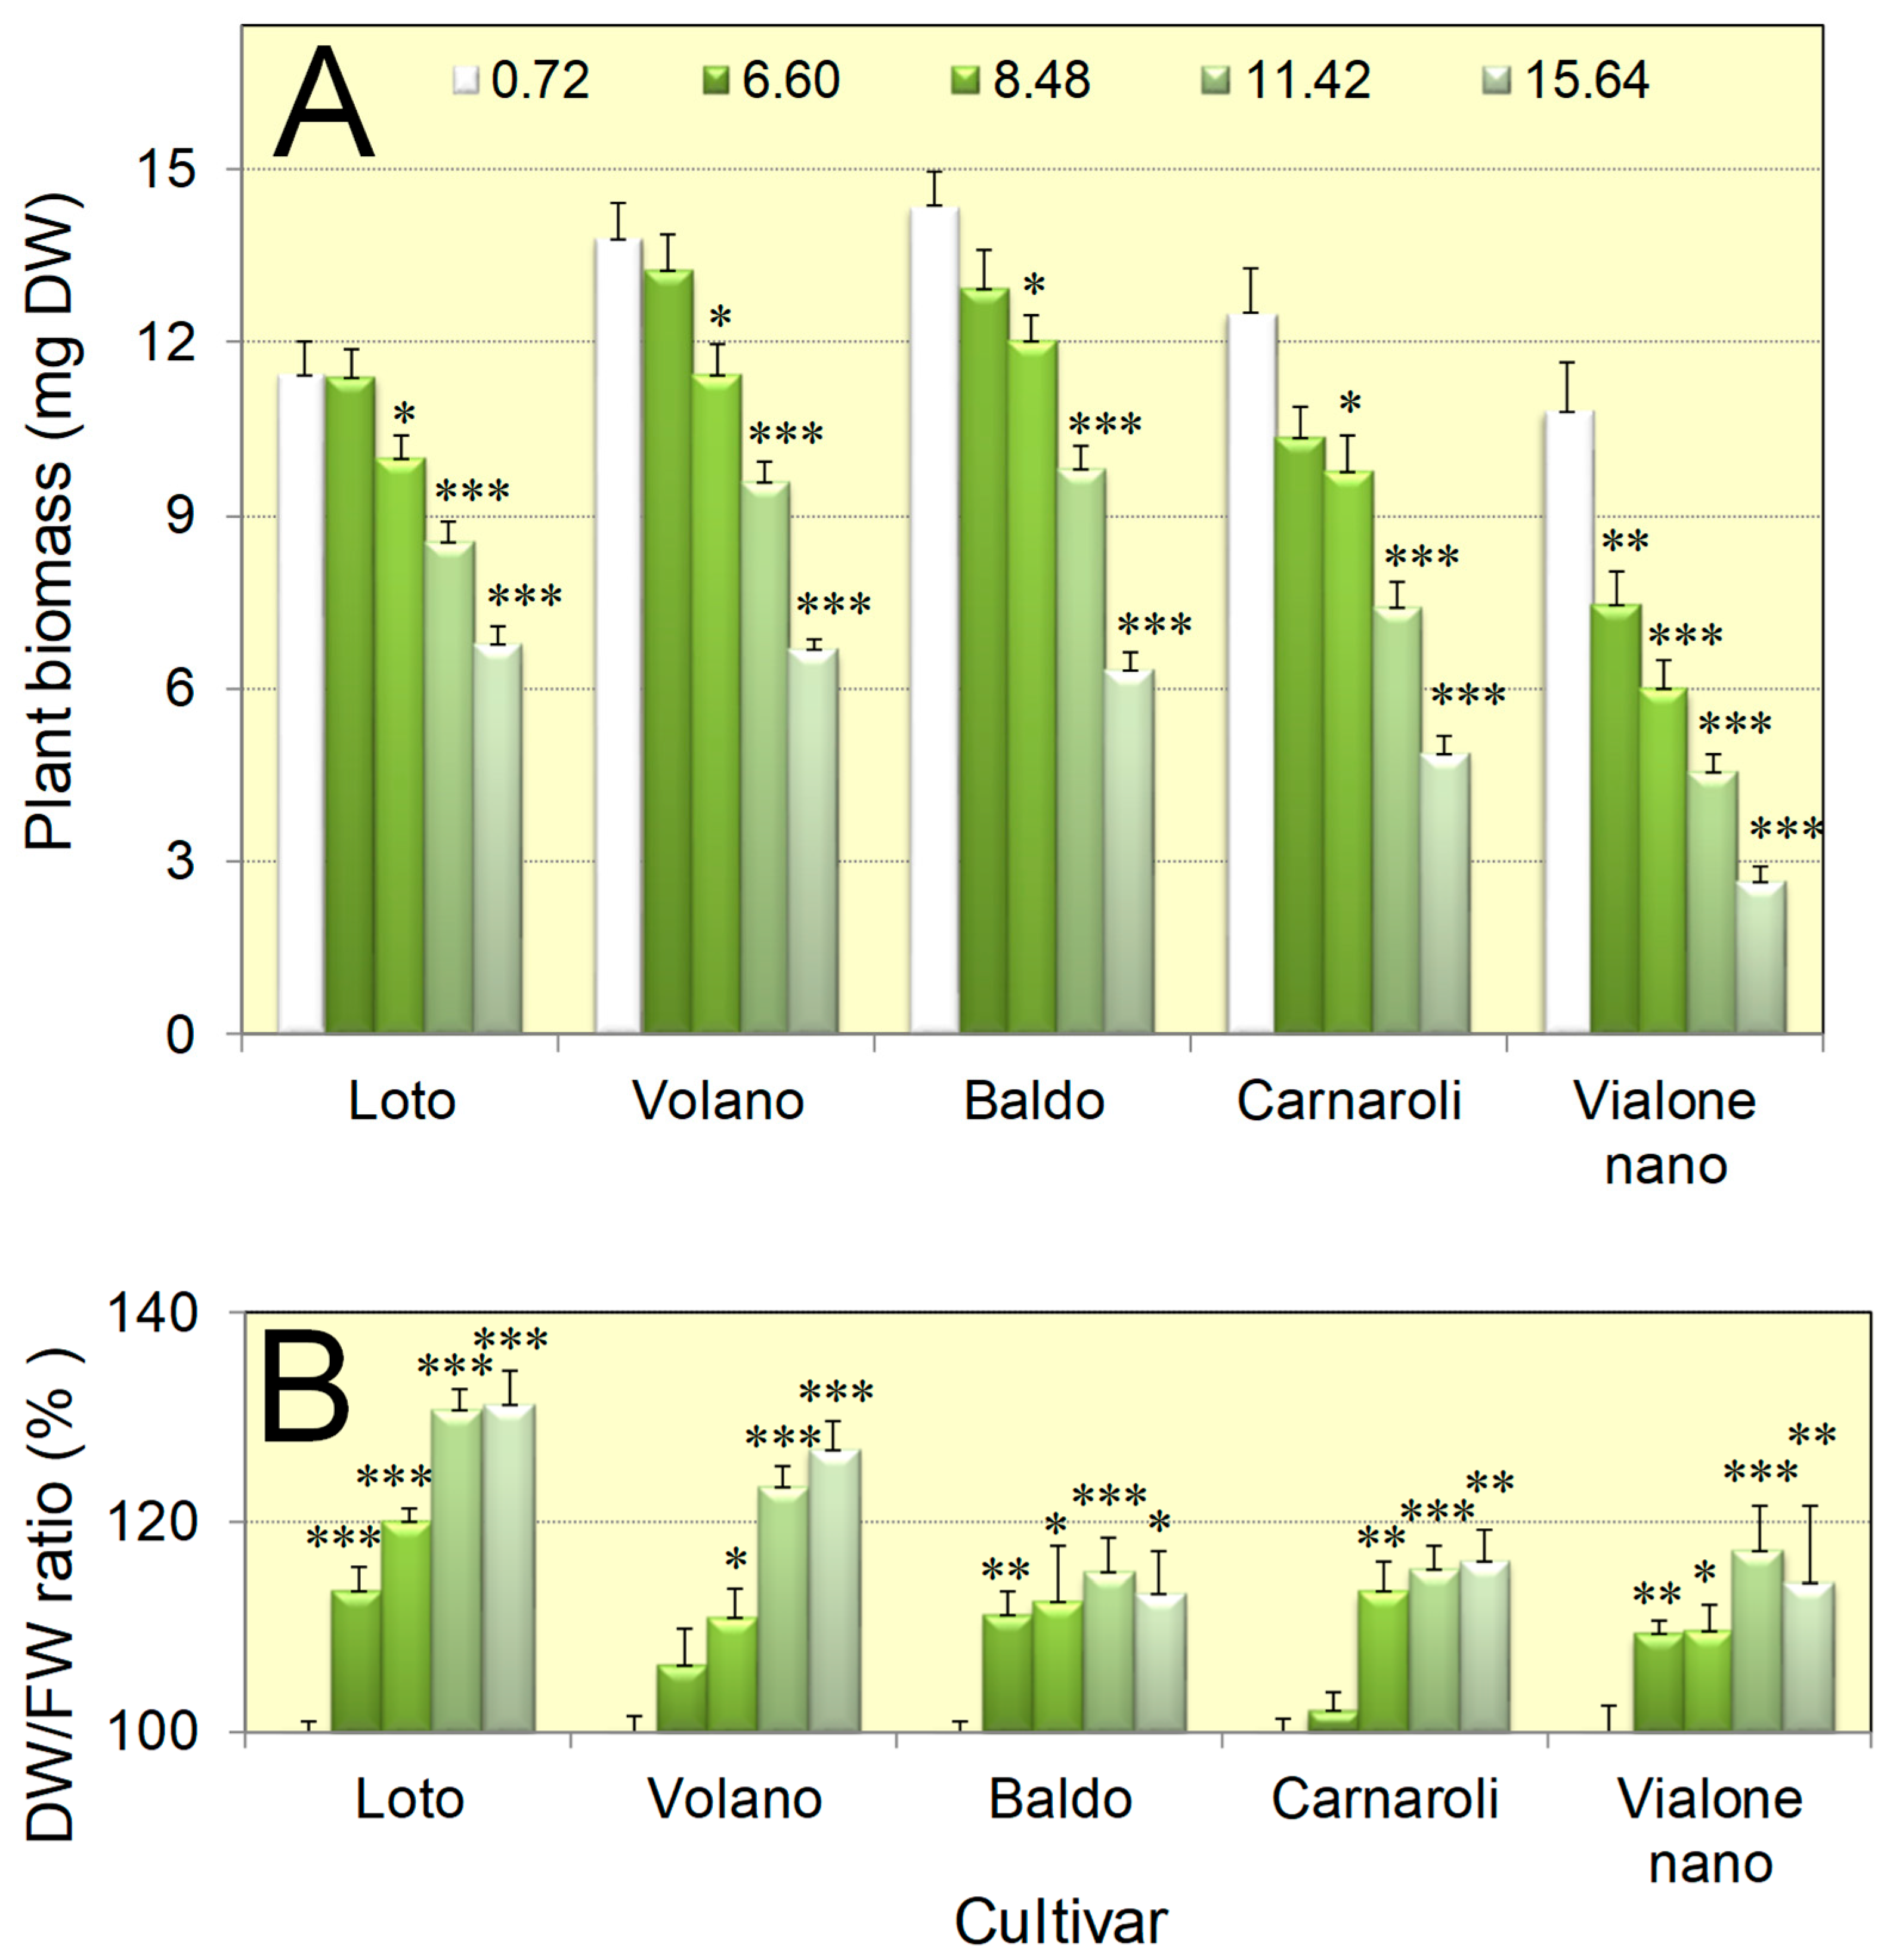
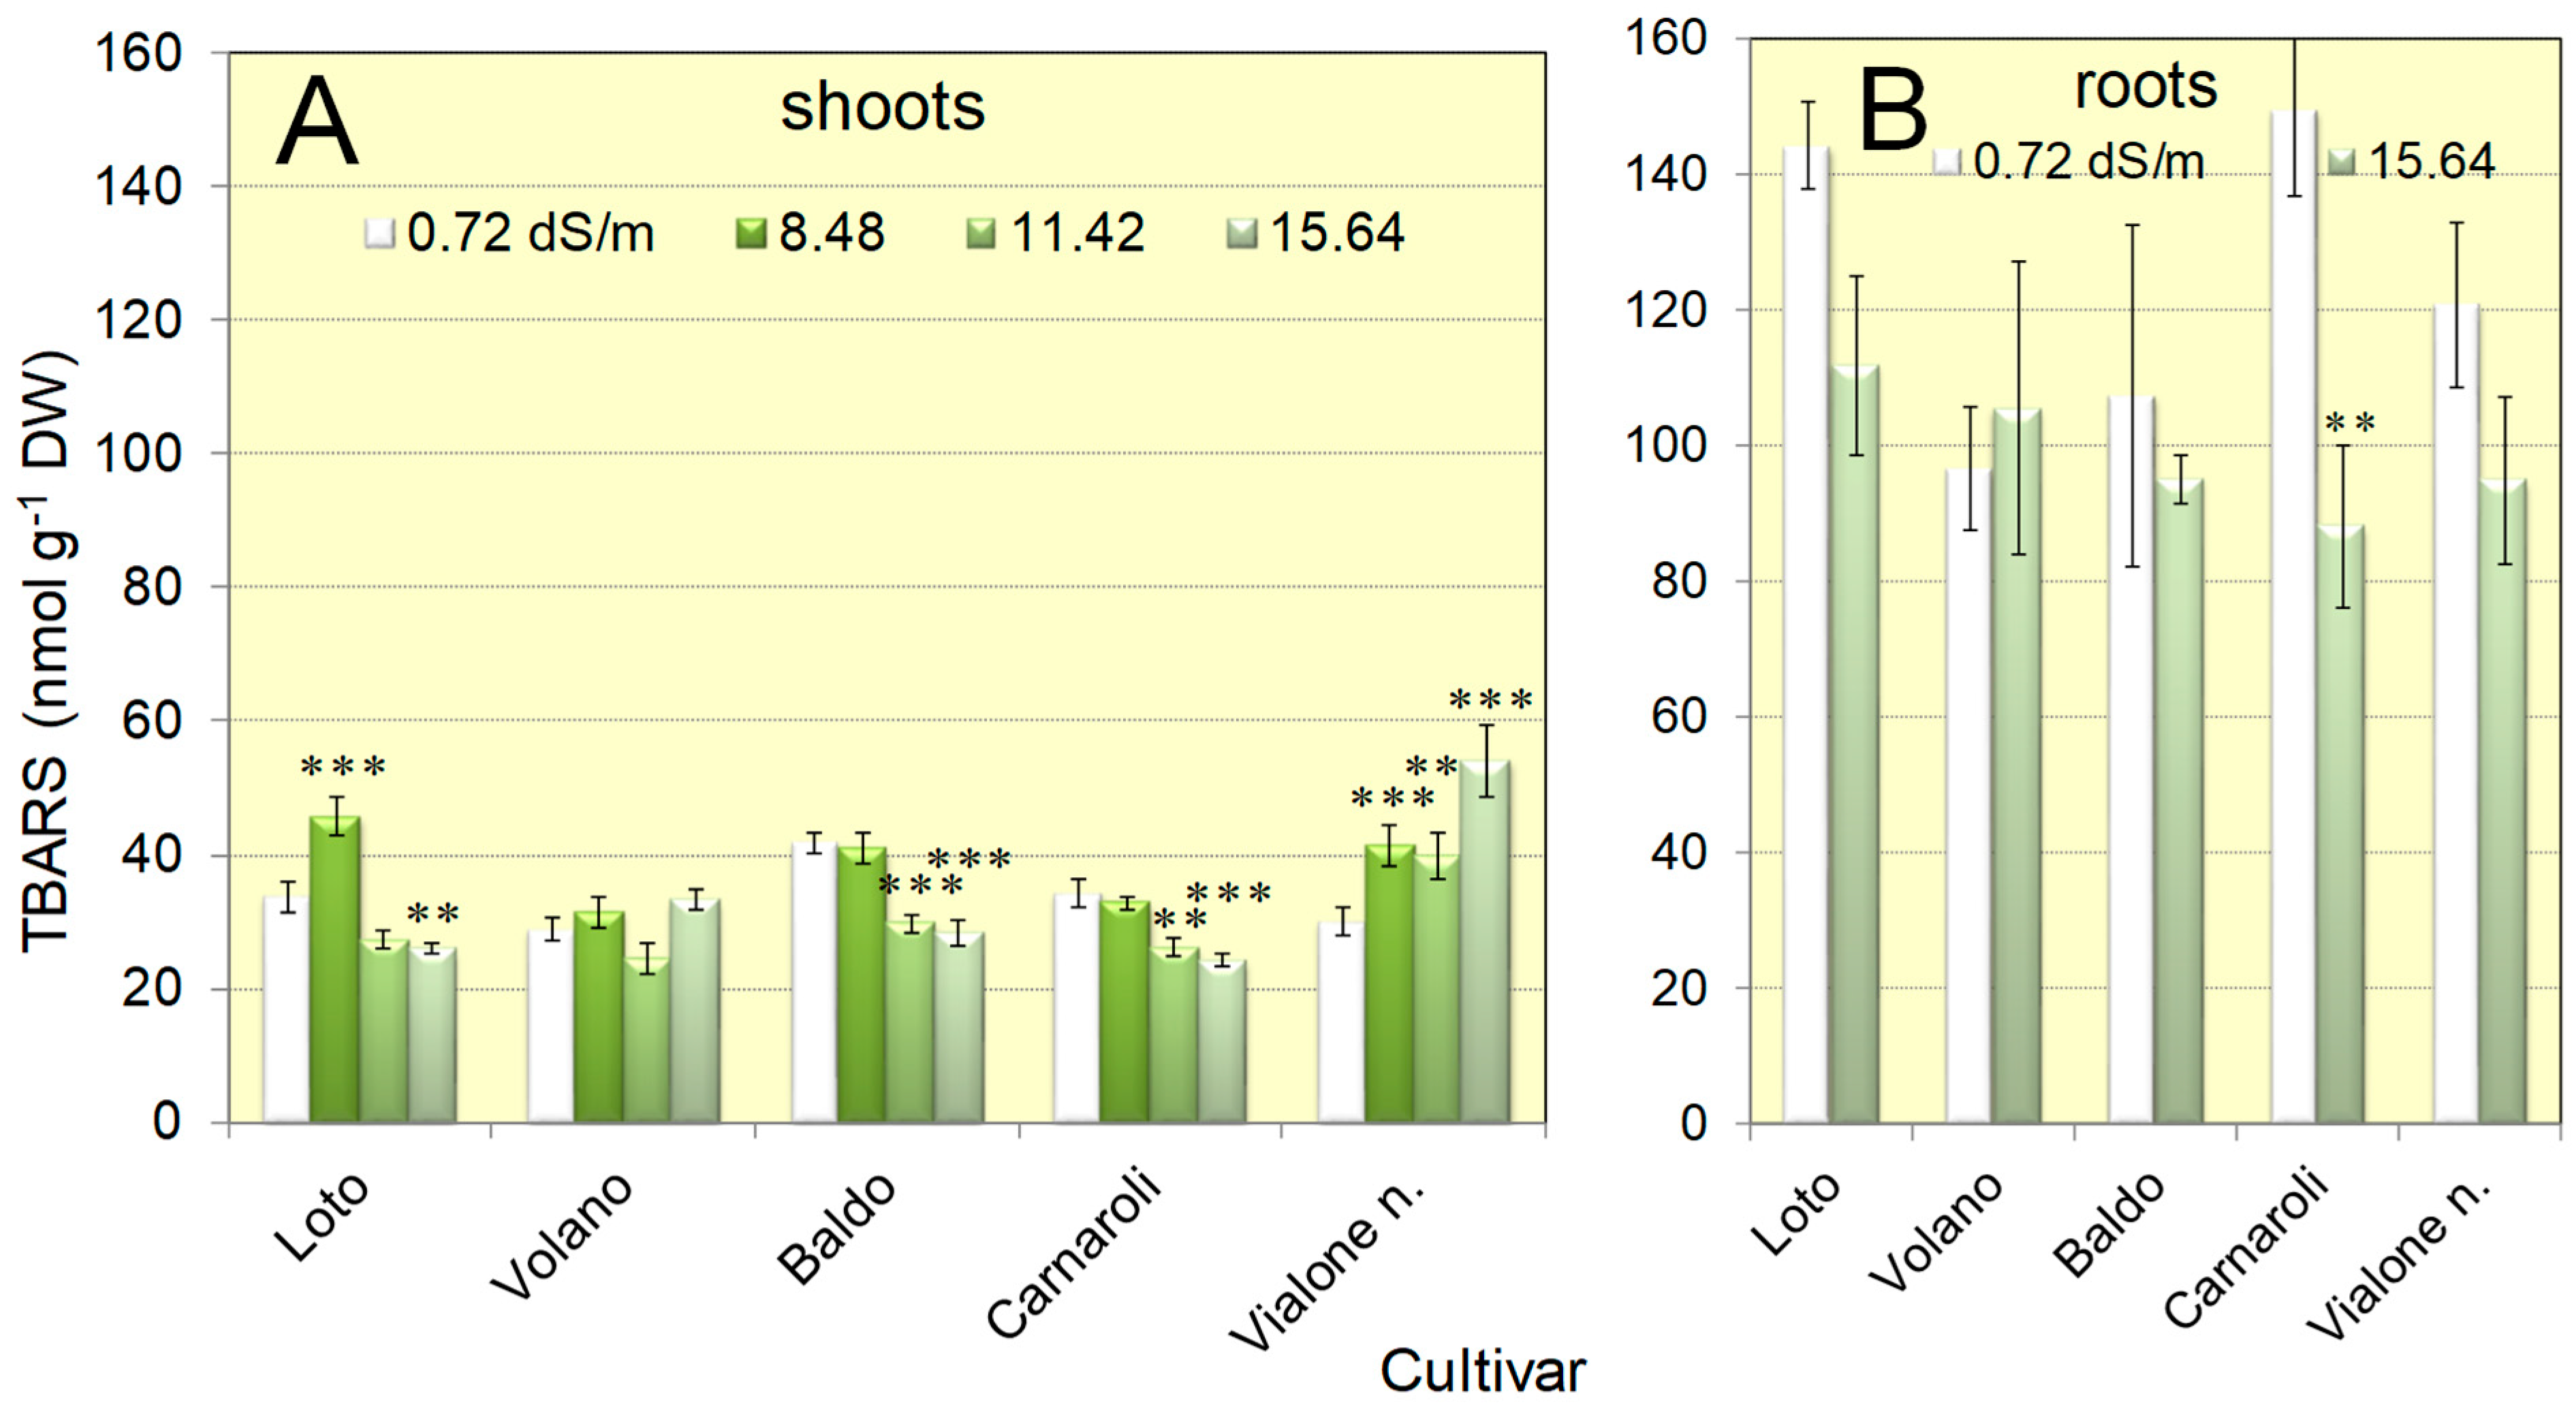
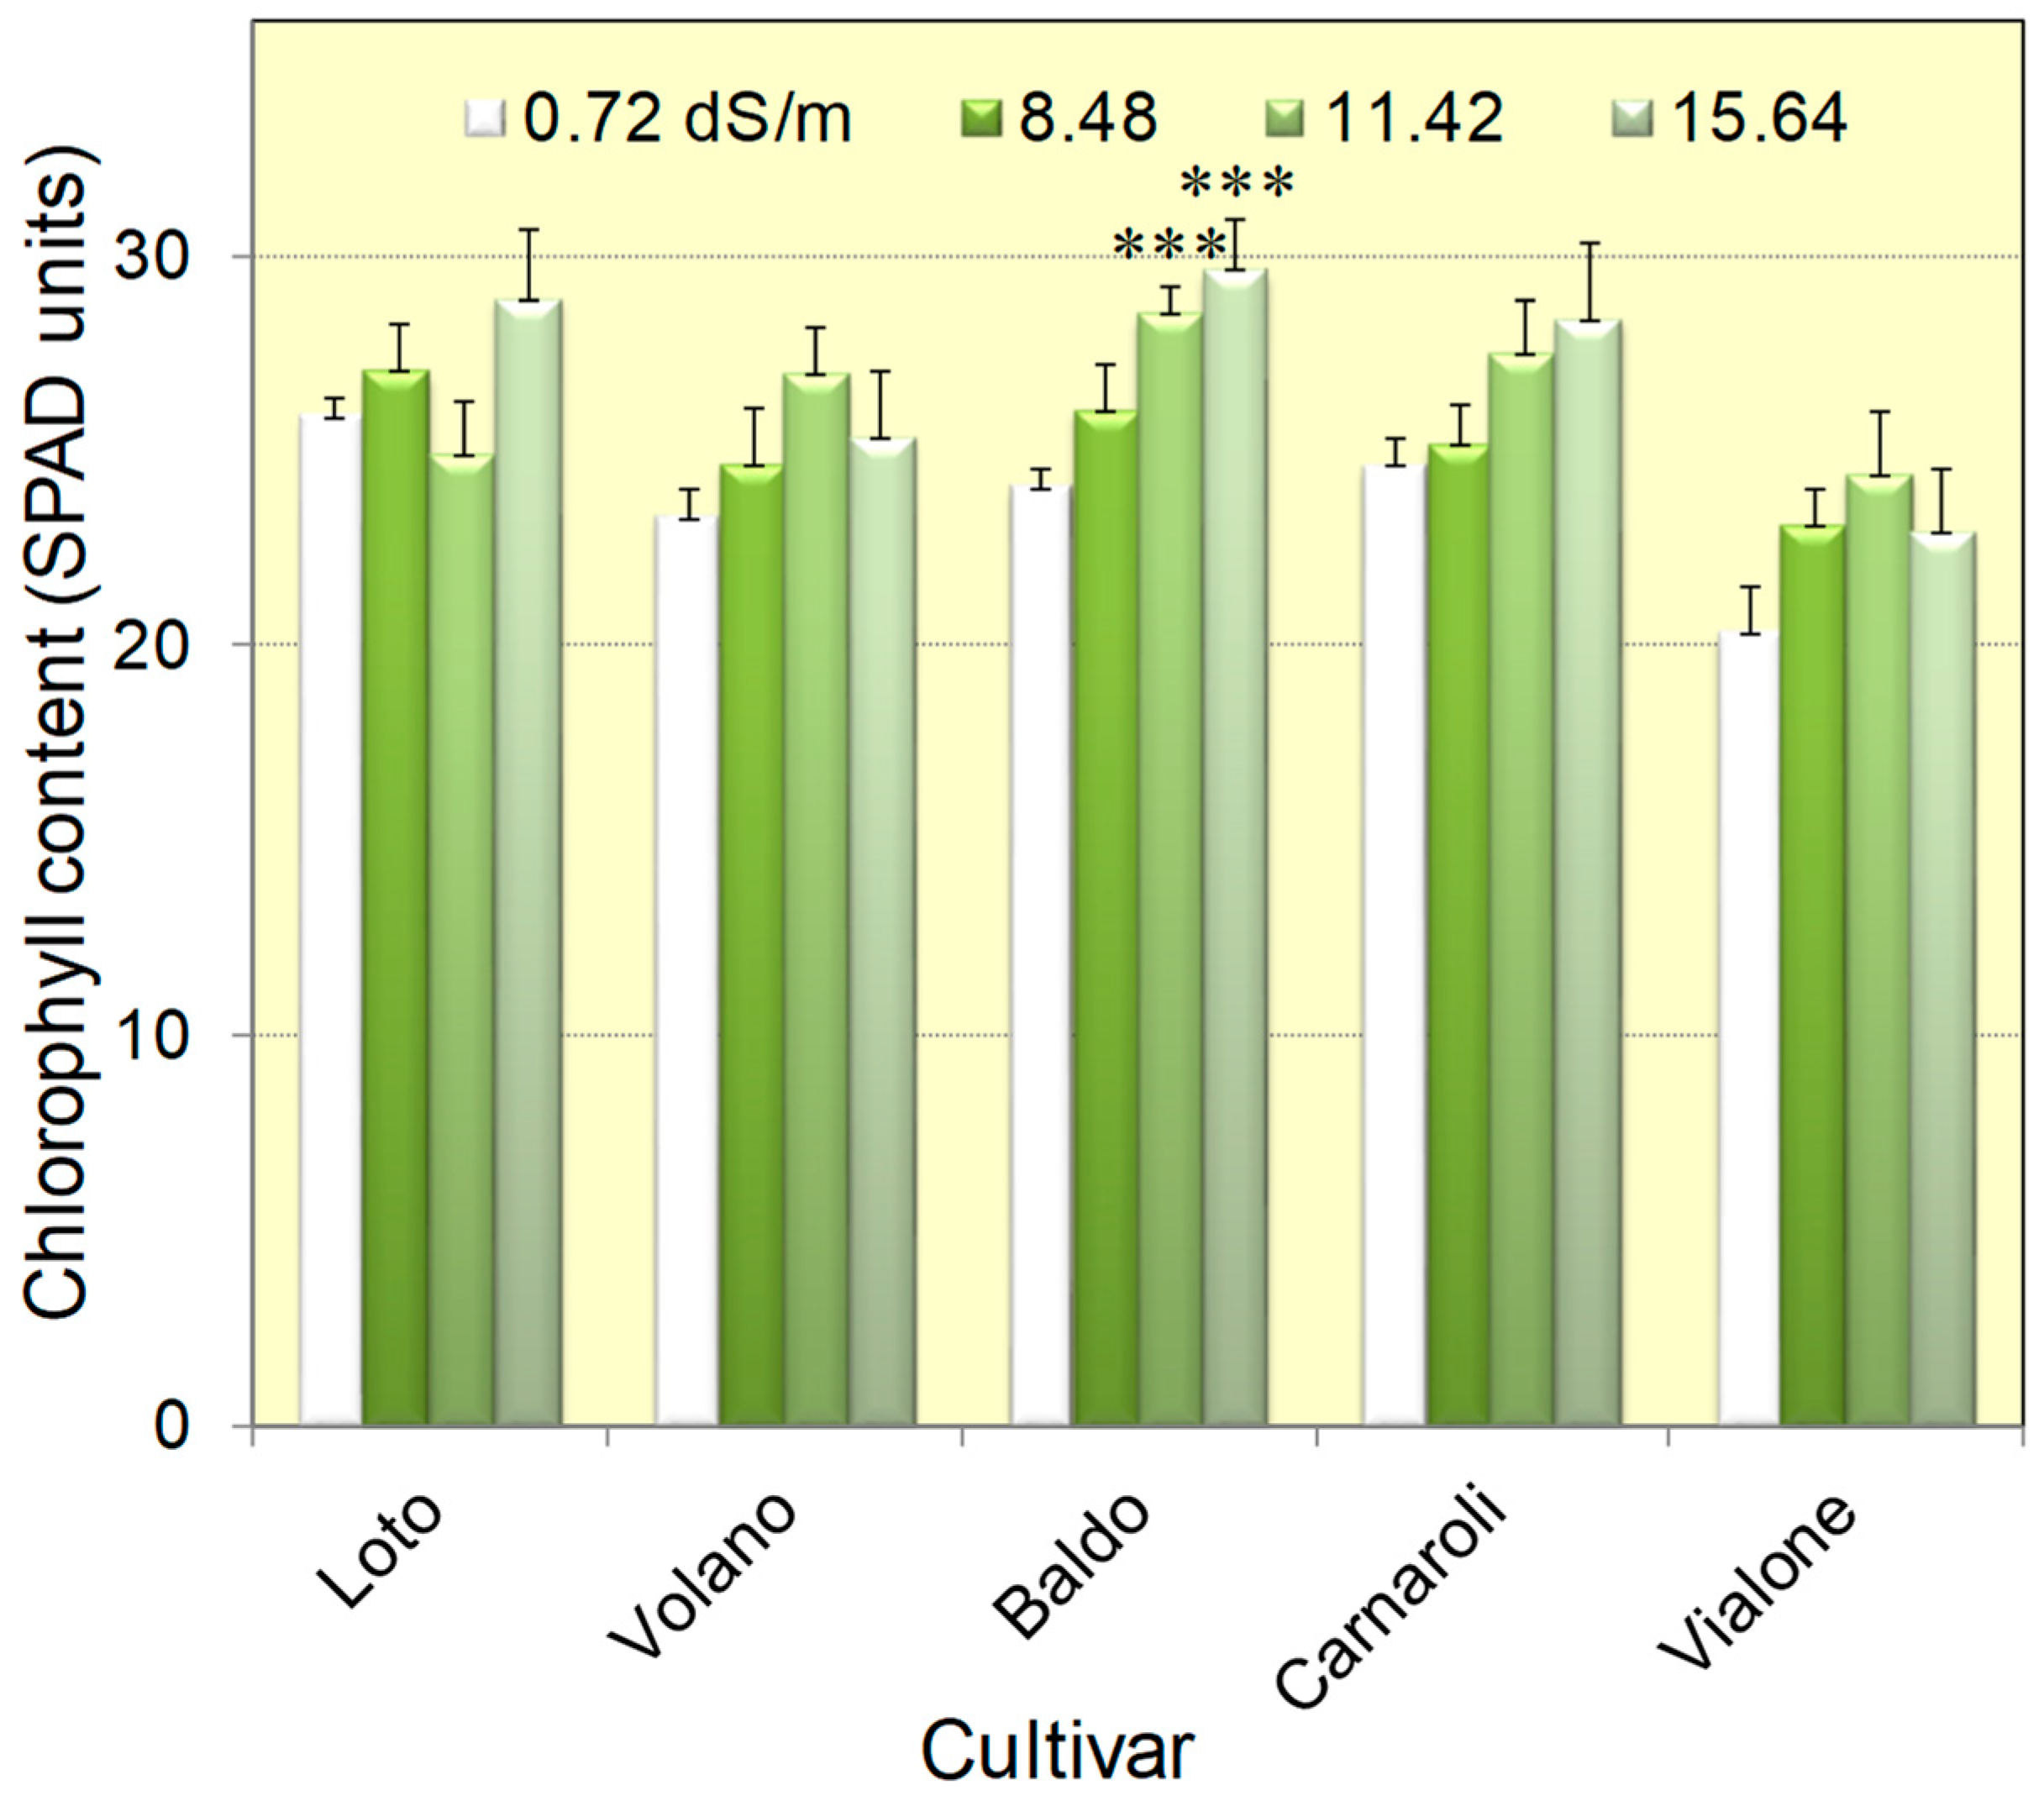
3.1. Seedlings of Five Italian Rice Genotypes Were Able to Cope with Salt Concentrations as High as 16 dS/m

A group of five Italian rice genotypes, which were representative of the natural variability in salt tolerance previously shown in a group of 17 varieties [43], were sown directly in the presence of a wide conductivity range (0.72, 6.60, 8.48, 11.42 and 15.64 dS/m), obtained by the addition of increasing levels of a salt mixture that had been reported to mimic field conditions [4]. Two weeks after germination, when untreated controls reached the three-leaf stage (Supplementary Figure S1), plant biomass was found progressively but differentially reduced by the treatments (Figure 1). Data were subjected to a two-way ANOVA, pointing out highly significant effects of both genotype (p < 0.0001) and conductivity (p < 0.0001), and a significant value for the interaction (p = 0.0136), showing that salts exert different toxicity on the five genotypes. In the case of the moderately salt-resistant genotype Loto, at an electrical conductivity of 6.60 dS/m, growth was unaffected, whereas under the same conditions, the salt-sensitive variety Vialone nano showed a 30% reduction. At 15.64 dS/m, their growth was inhibited by about 40% and 70%, respectively (Figure 1A). A concomitant and inversely proportional increase of the dry-to-fresh weight (DW/FW) ratio (Figure 1B) accounted for the establishment of osmotic stress conditions, besides ionic imbalance.
Despite growth inhibition, plant viability was not compromised, and seedlings continued growth even under the most severe conditions applied (15.64 dS/m). Consistently, when the occurrence of oxidative damages was investigated in seedlings grown under conditions that were inhibitory for all five varieties (8.48, 11.42 and 15.64 dS/m), results showed very little effects. In roots of plantlets grown at 15.64 dS/m, the measurement of thiobarbituric acid reactive substances (TBARS) showed in no case levels significantly higher than those in untreated controls. On the contrary, for the variety Carnaroli, levels were even lower (Figure 2B). However, a remarkably high intra-group variability made it difficult to detect true differences. In shoots, where a much lower TBARS content was found in controls, slight differences were evident, and without a clear relationship with the severity of the stress. Only in the case of the most salt-sensitive cultivar Vialone nano, TBARS levels increased with increasing salt concentrations in the substrate (Figure 2B), but the correlation was not significant (p = 0.0584 in a two-tailed Pearson test). On the contrary, in several instances the values in salt-grown plants were lower than in controls.
Successful adaptation was strengthened also by the measurement of chlorophyll content, which has been reported to decline in salt-stressed seedlings and cause progressive reduction of the photosynthetic rate [49]. Indeed, when measured indirectly by reading absorbance using a SPAD-meter, chlorophyll concentration in the second, fully developed leaf was found to differ among genotypes and influenced by the presence of salt. A two-way ANOVA of the results pointed out a significant effect of the genotype (p = 0.0001) and of the conductivity (p < 0.0001), but the interaction was not significant (p = 0.4864), showing that salts exert the same effect on the five genotypes. Moreover, the content was not reduced, but on the contrary, slightly enhanced under most of the experimental conditions tested, being the effect statistically significant in the case of the variety Baldo (Figure 3).

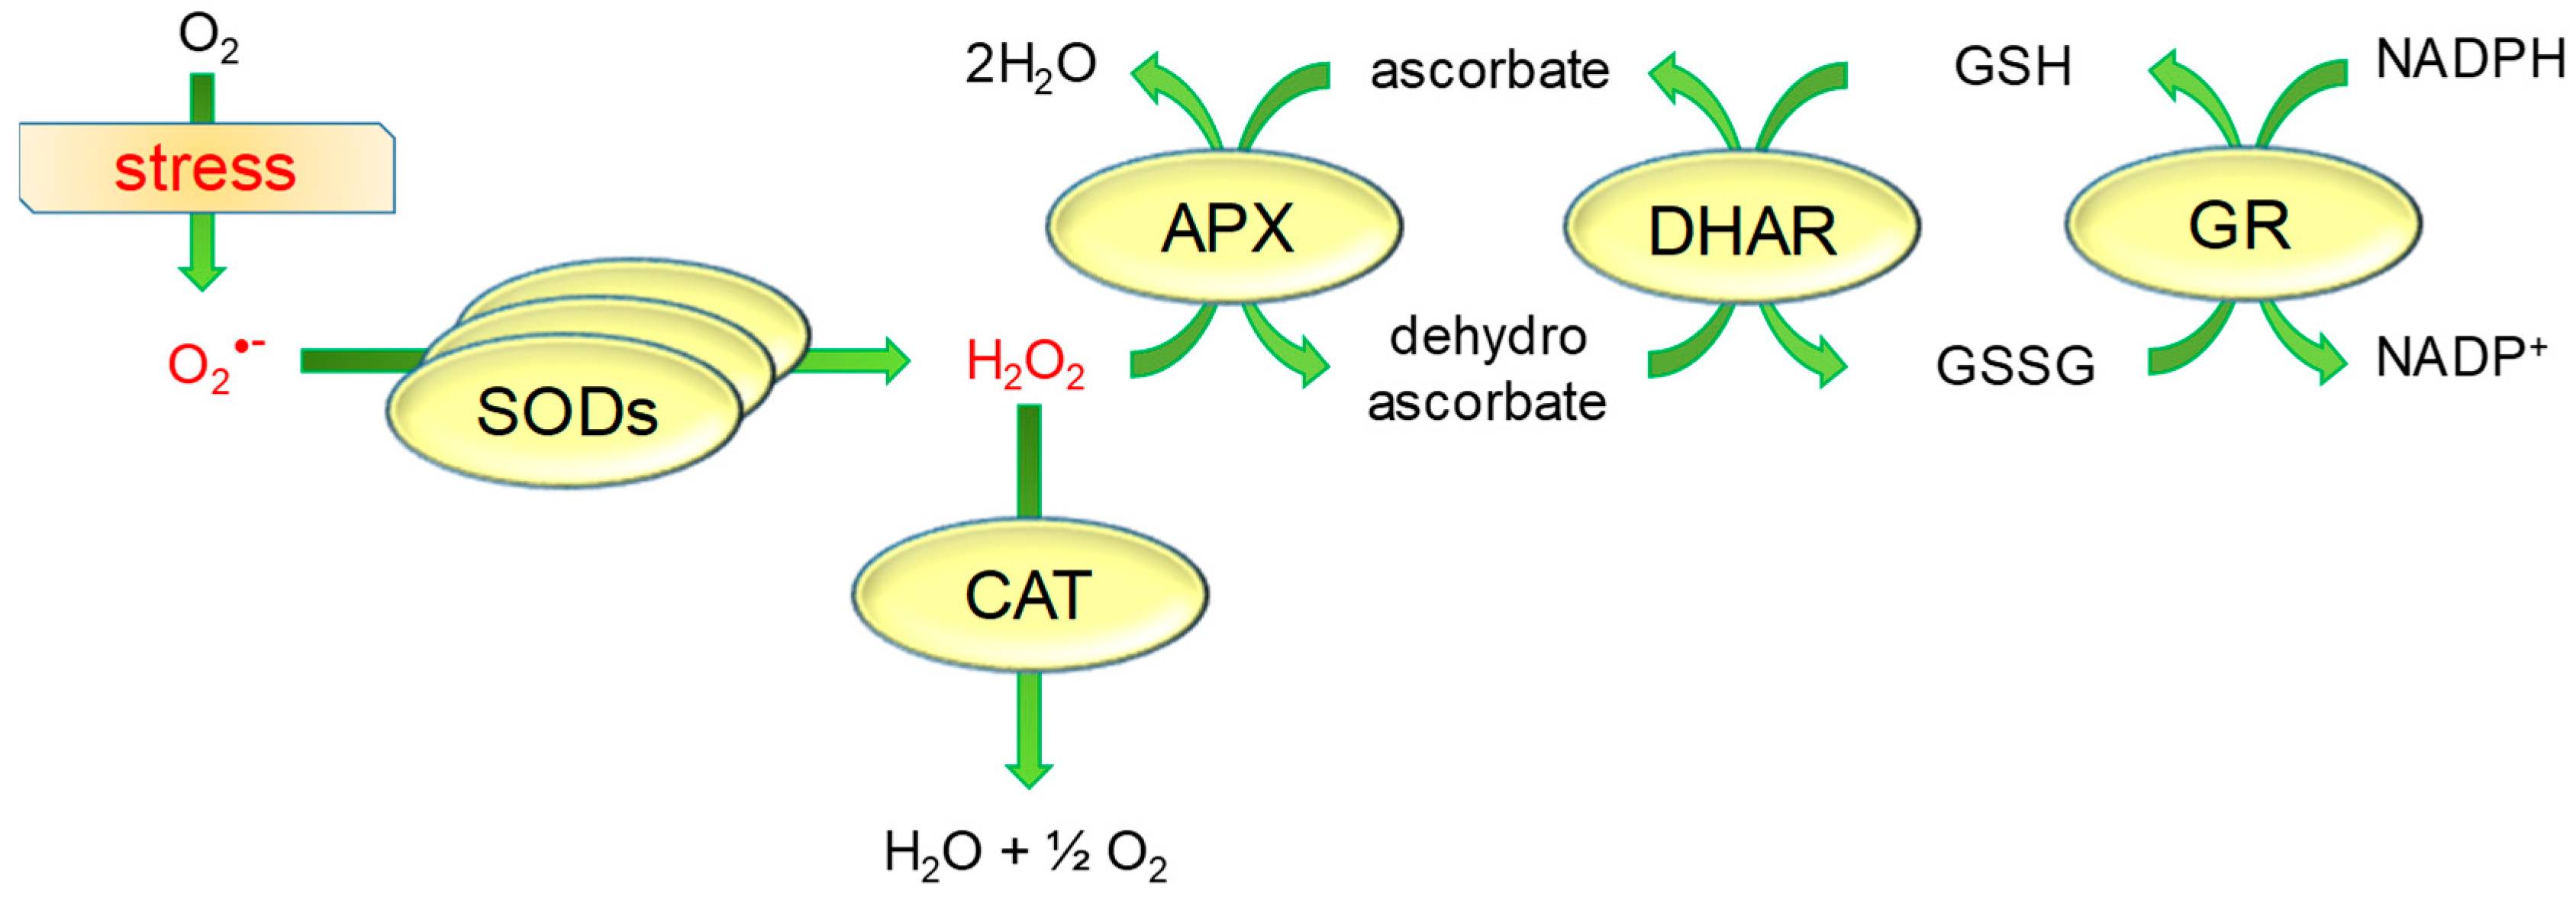
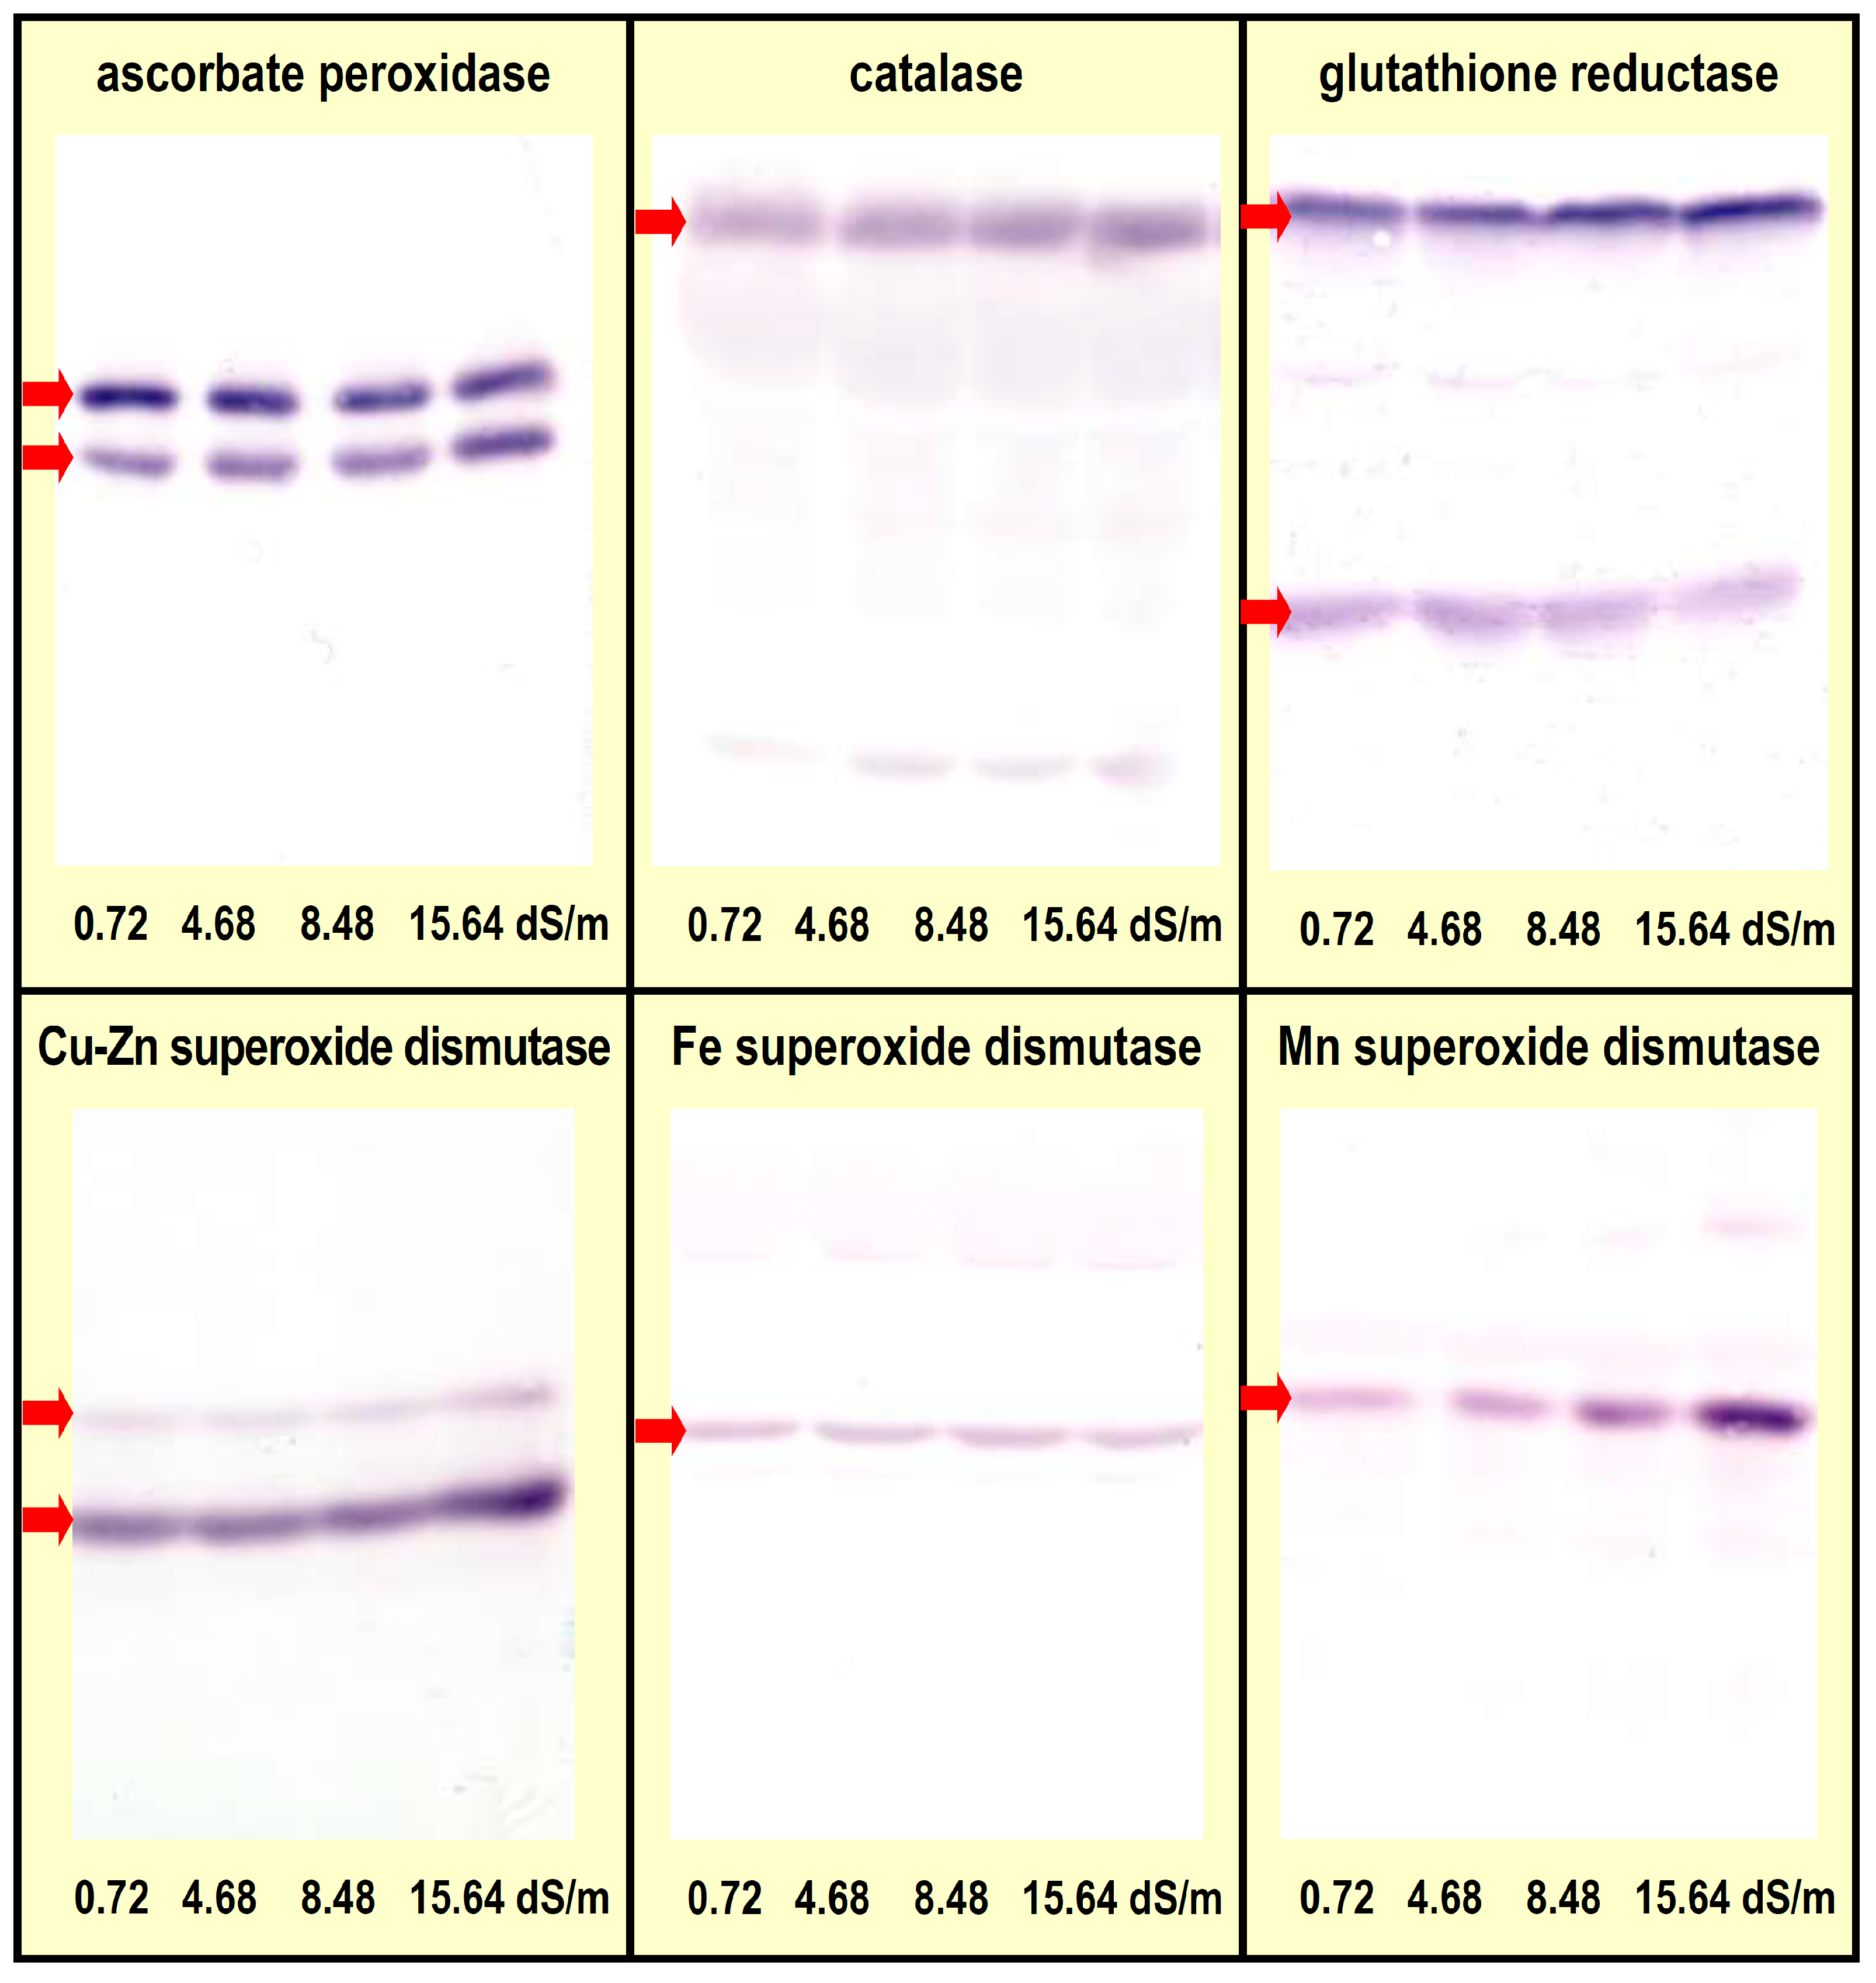
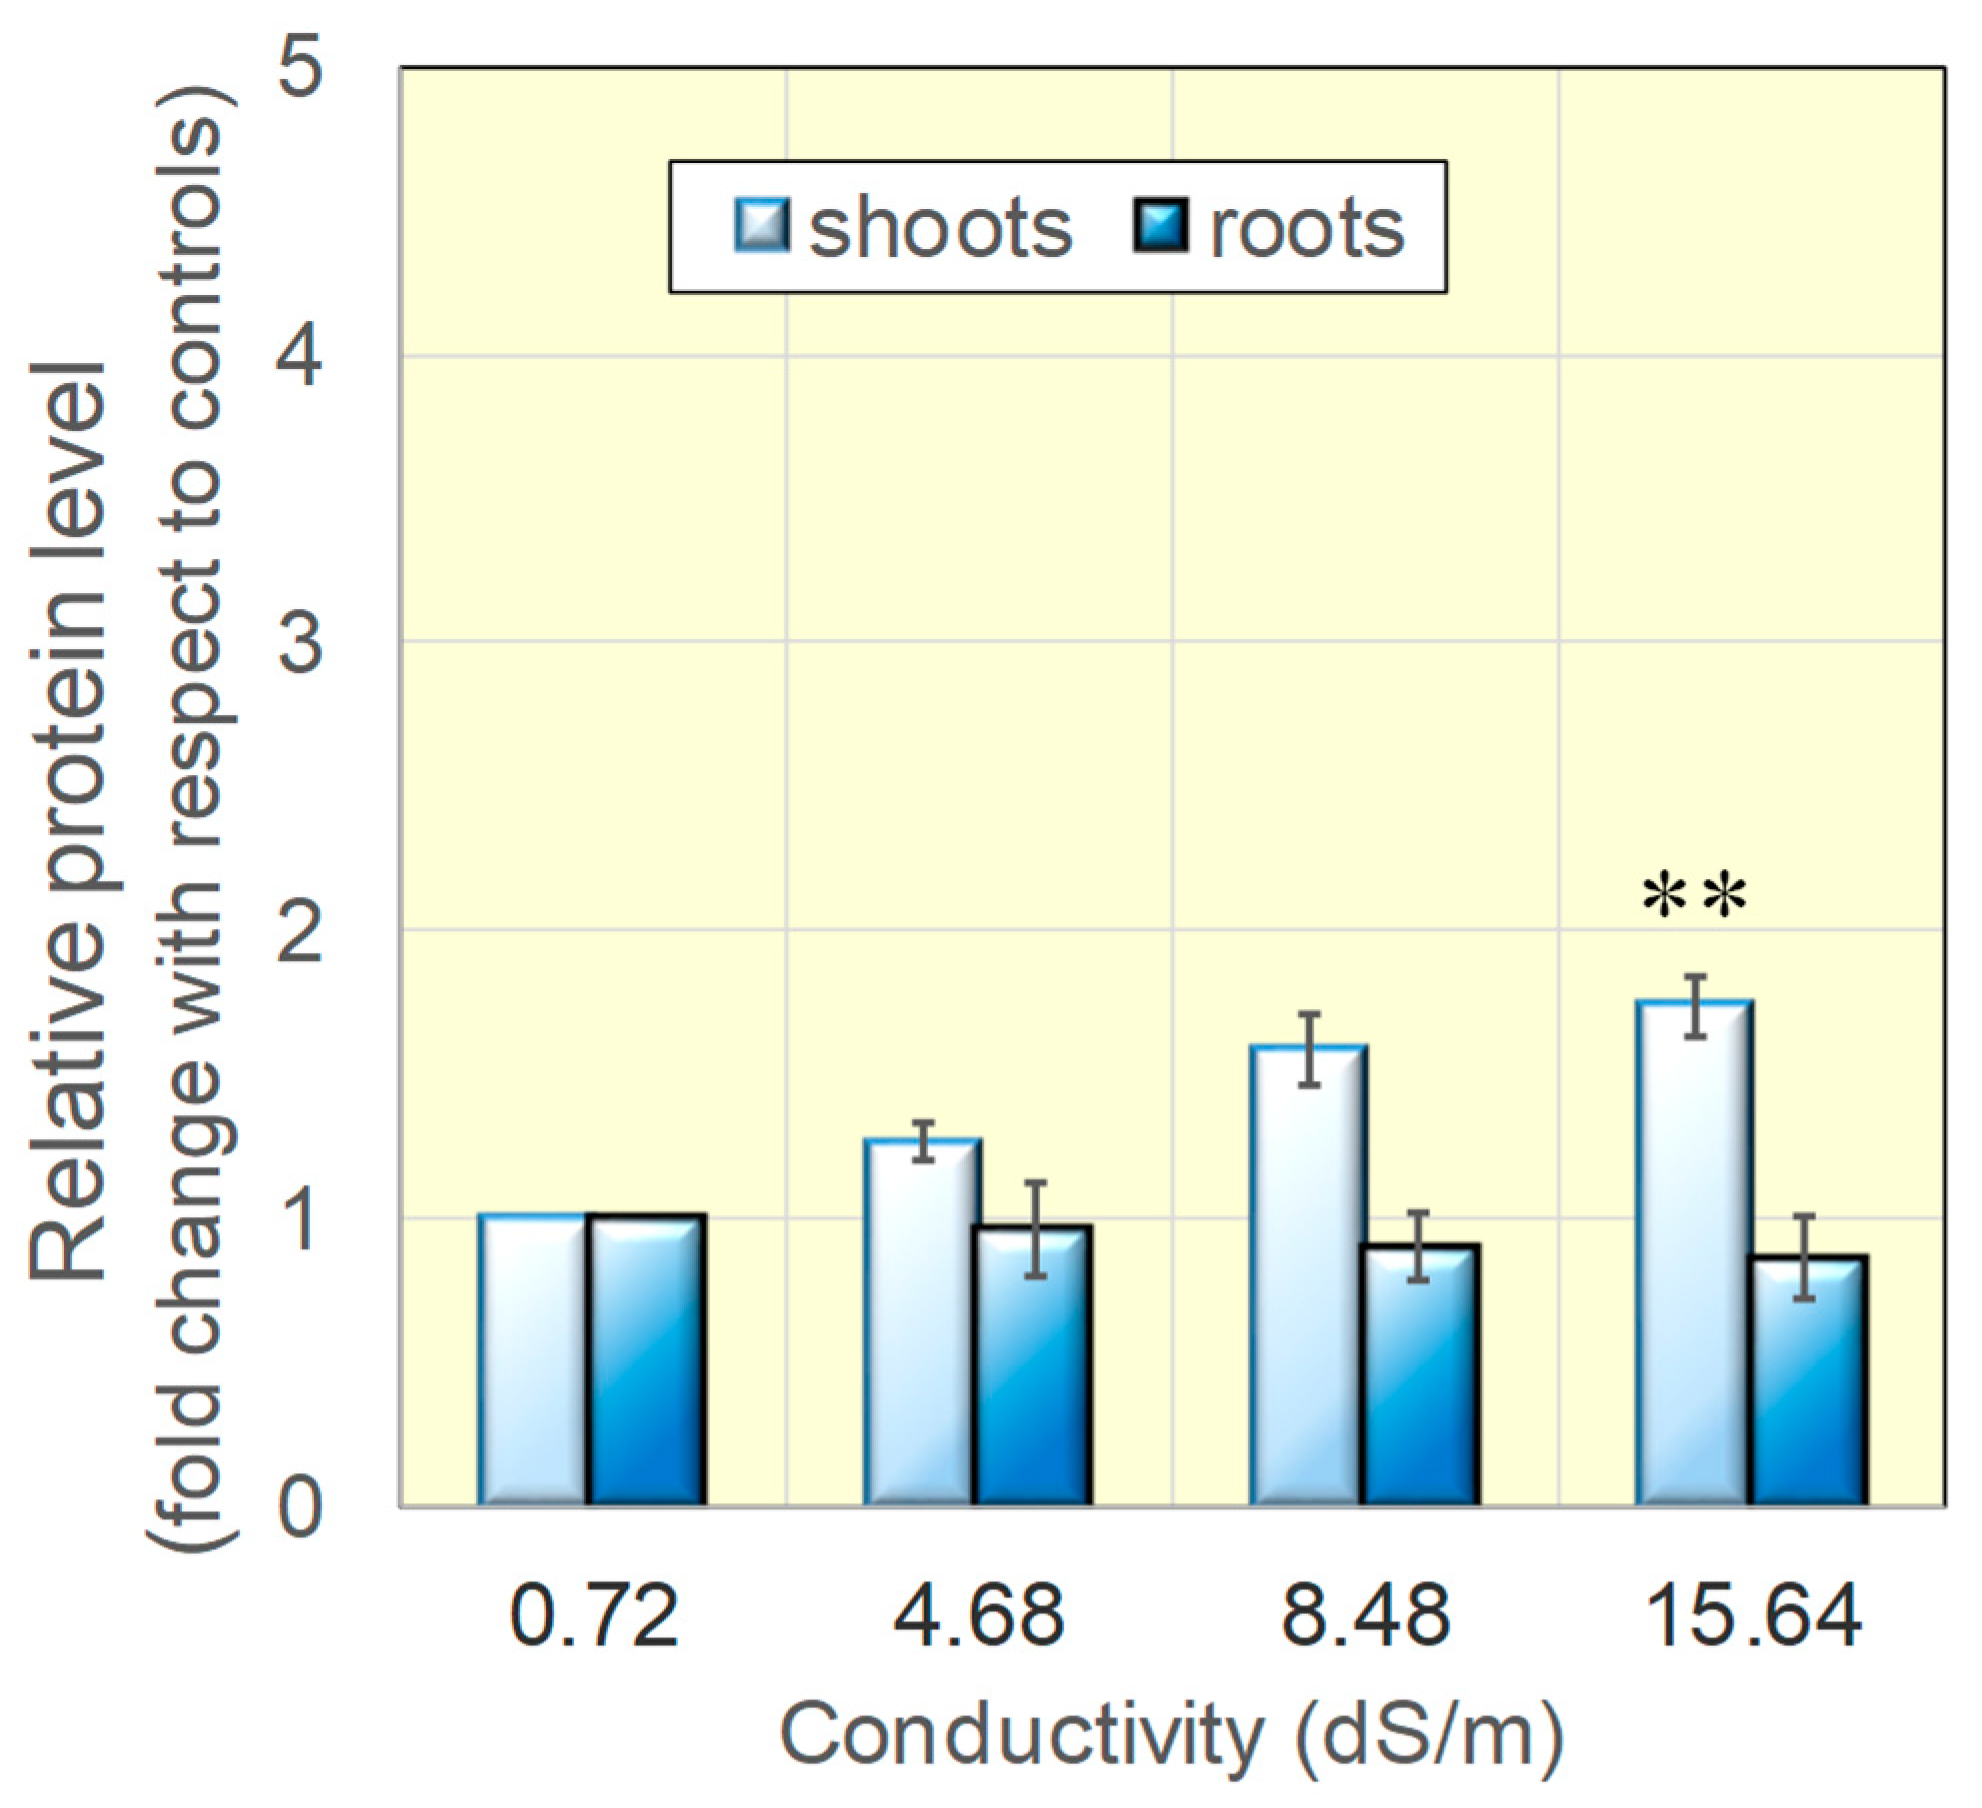
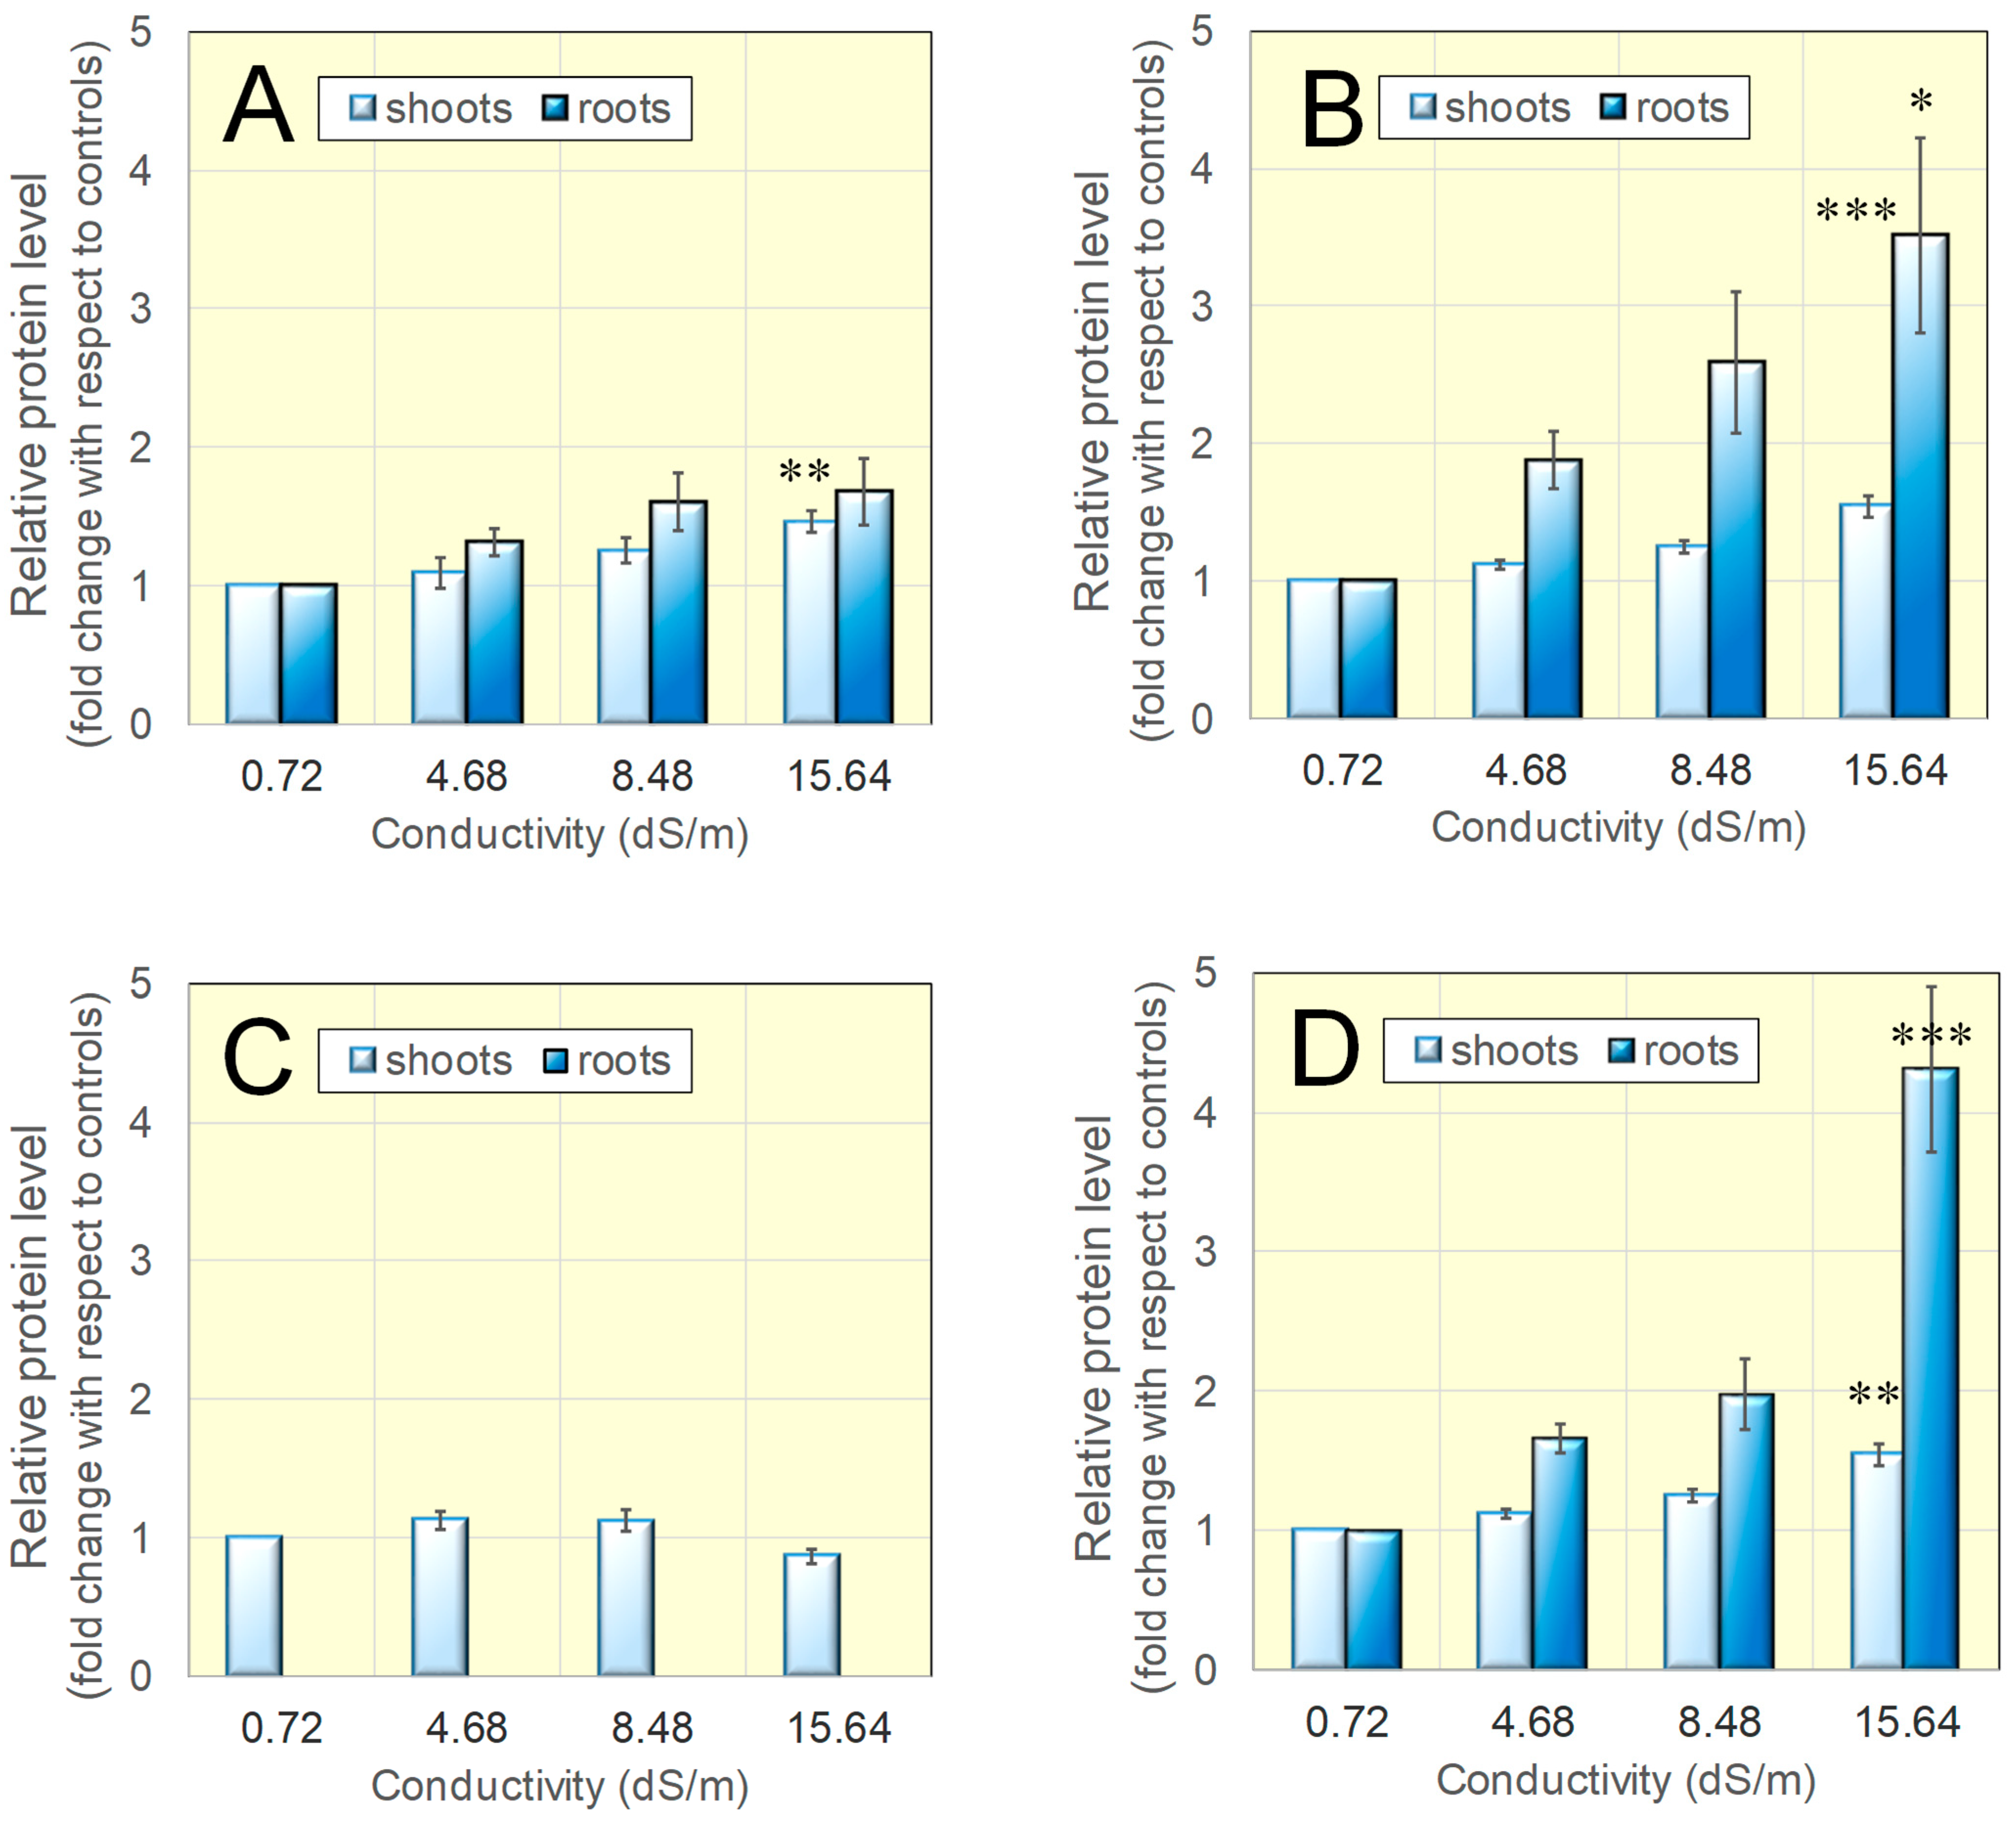
3.2. Protein Levels for Catalase, Mn- and Cu/Zn-Dependent Superoxide Dismutases Were Found Increased in Salt-Grown Rice Seedlings

Because ROS production is expected to take place as a consequence of osmotic and ionic imbalance [16], but TBARS levels were found to be substantially unaffected (Figure 2), the possible activation of antioxidant defenses in salt-grown seedlings was investigated. With this aim, the levels of the main antioxidant enzymes that have been reported to be upregulated in rice in response to salinity stress [15], namely, the three SOD isoforms, CAT, APX and GR, were considered (Figure 4).
The effect of an intermediate (8.48 dS/m) and the most severe condition (15.64 dS/m) was examined. A lower conductivity value (4.68 dS/m, one at which plant growth had been found substantially unaffected in preliminary experiments) was also included to see whether higher levels of antioxidant enzymes might be induced also under conditions at which growth inhibition is not yet evident. To measure the levels of selected antioxidant enzymes, an immunological approach was used. Western blot experiments showed the presence of reactive proteins for all of the antibodies used (Figure 5). Two antigens were recognized in the case of APX (upper band, about 35 kDa, most likely a plastidal isozyme; lower band, 26 kDa, cytosolic isozyme), GR (upper band, about 60 kDa, cytosolic isozyme; lower band, 42 kDa, plastidal isozyme) and Cu/ZnSOD (upper band, about 20 kDa, plastidal isozyme; lower band, 15 kDa, cytosolic isozyme). A densitometric analysis of the blots thus allowed us to obtain a semi-quantitative estimate of the levels of SODs, CAT, APX and GR in normalized extracts prepared with leaves or roots from seedlings grown under normo- or hyperosmotic conditions.
To rule out possible variations due to different ratios between antibodies and antigens or different time of blot development, all of the extracts obtained with pooled shoots or roots of the five varieties grown under different conductivity values were analyzed on the same blot (Supplementary Figure S2A–F for APX, CAT, GR, Cu/ZnSOD, FeSOD and MnSOD, respectively). Data were expressed as a function of the signal obtained for untreated controls, and presented in Supplementary Figures S3–S5. Since similar patterns were obtained for all genotypes, data were combined and subjected to one-way ANOVA with a post-test for linear trend.
Concerning CAT, no significant difference was found in roots (p = 0.8806). In shoots, statistical analysis accounted, on the contrary, for both a significant difference among samples (p = 0.0082) and a significant linear trend (p = 0.0026) at raising conductivity values (Figure 6).
Various patterns were found in the case of SODs. FeSOD was not detectable in roots, suggesting an expression level, if any, lower than that measurable with the experimental approach adopted. In shoots, a signal was found that was substantially independent from the growth conditions (Figure 7C). In the case of the plastidal Cu/Zn-dependent isoenzyme, protein levels in roots of salt-treated plants were not statistically different, while in shoots, a slight but significant increase was evident (p = 0.0331 and p = 0.0099 for differences between samples and an increasing trend, respectively; Figure 7A). For the cytosolic isoenzyme, in roots, a remarkable increase was found, but due to a high intra-sample variation, differences were not significant (p = 0.0985). This notwithstanding, a post-test for linear trend accounted for a significant increase (p = 0.0334) of protein levels at increasing levels of stress severity. In shoots, a highly significant increase was also found (p < 0.0001; Figure 7B). Similar results were obtained for the Mn-dependent SOD both in shoots (p = 0.0055 and p = 0.0014 for differences between samples and an increasing trend, respectively) and roots (p < 0.0001 and p < 0.0001, respectively). In the latter case, a pronounced and highly significant increase was found, with protein levels at 15.64 Ds/m that were 4.3-fold higher than those in untreated controls (Figure 7D).
Finally, when two enzymes of the Halliwell–Hasada pathway were considered, relatively constant protein levels were found in both roots and shoots for the mitochondrial and the plastidal forms of GR (Figure 8C,D, respectively). Similar results were obtained for the plastidal and the cytosolic isozymes of APX in shoots (Figure 8A,B). A slight tendency to increase was, on the contrary, found in roots. However, because of a relatively high intra-sample variability, such trend was not significant.

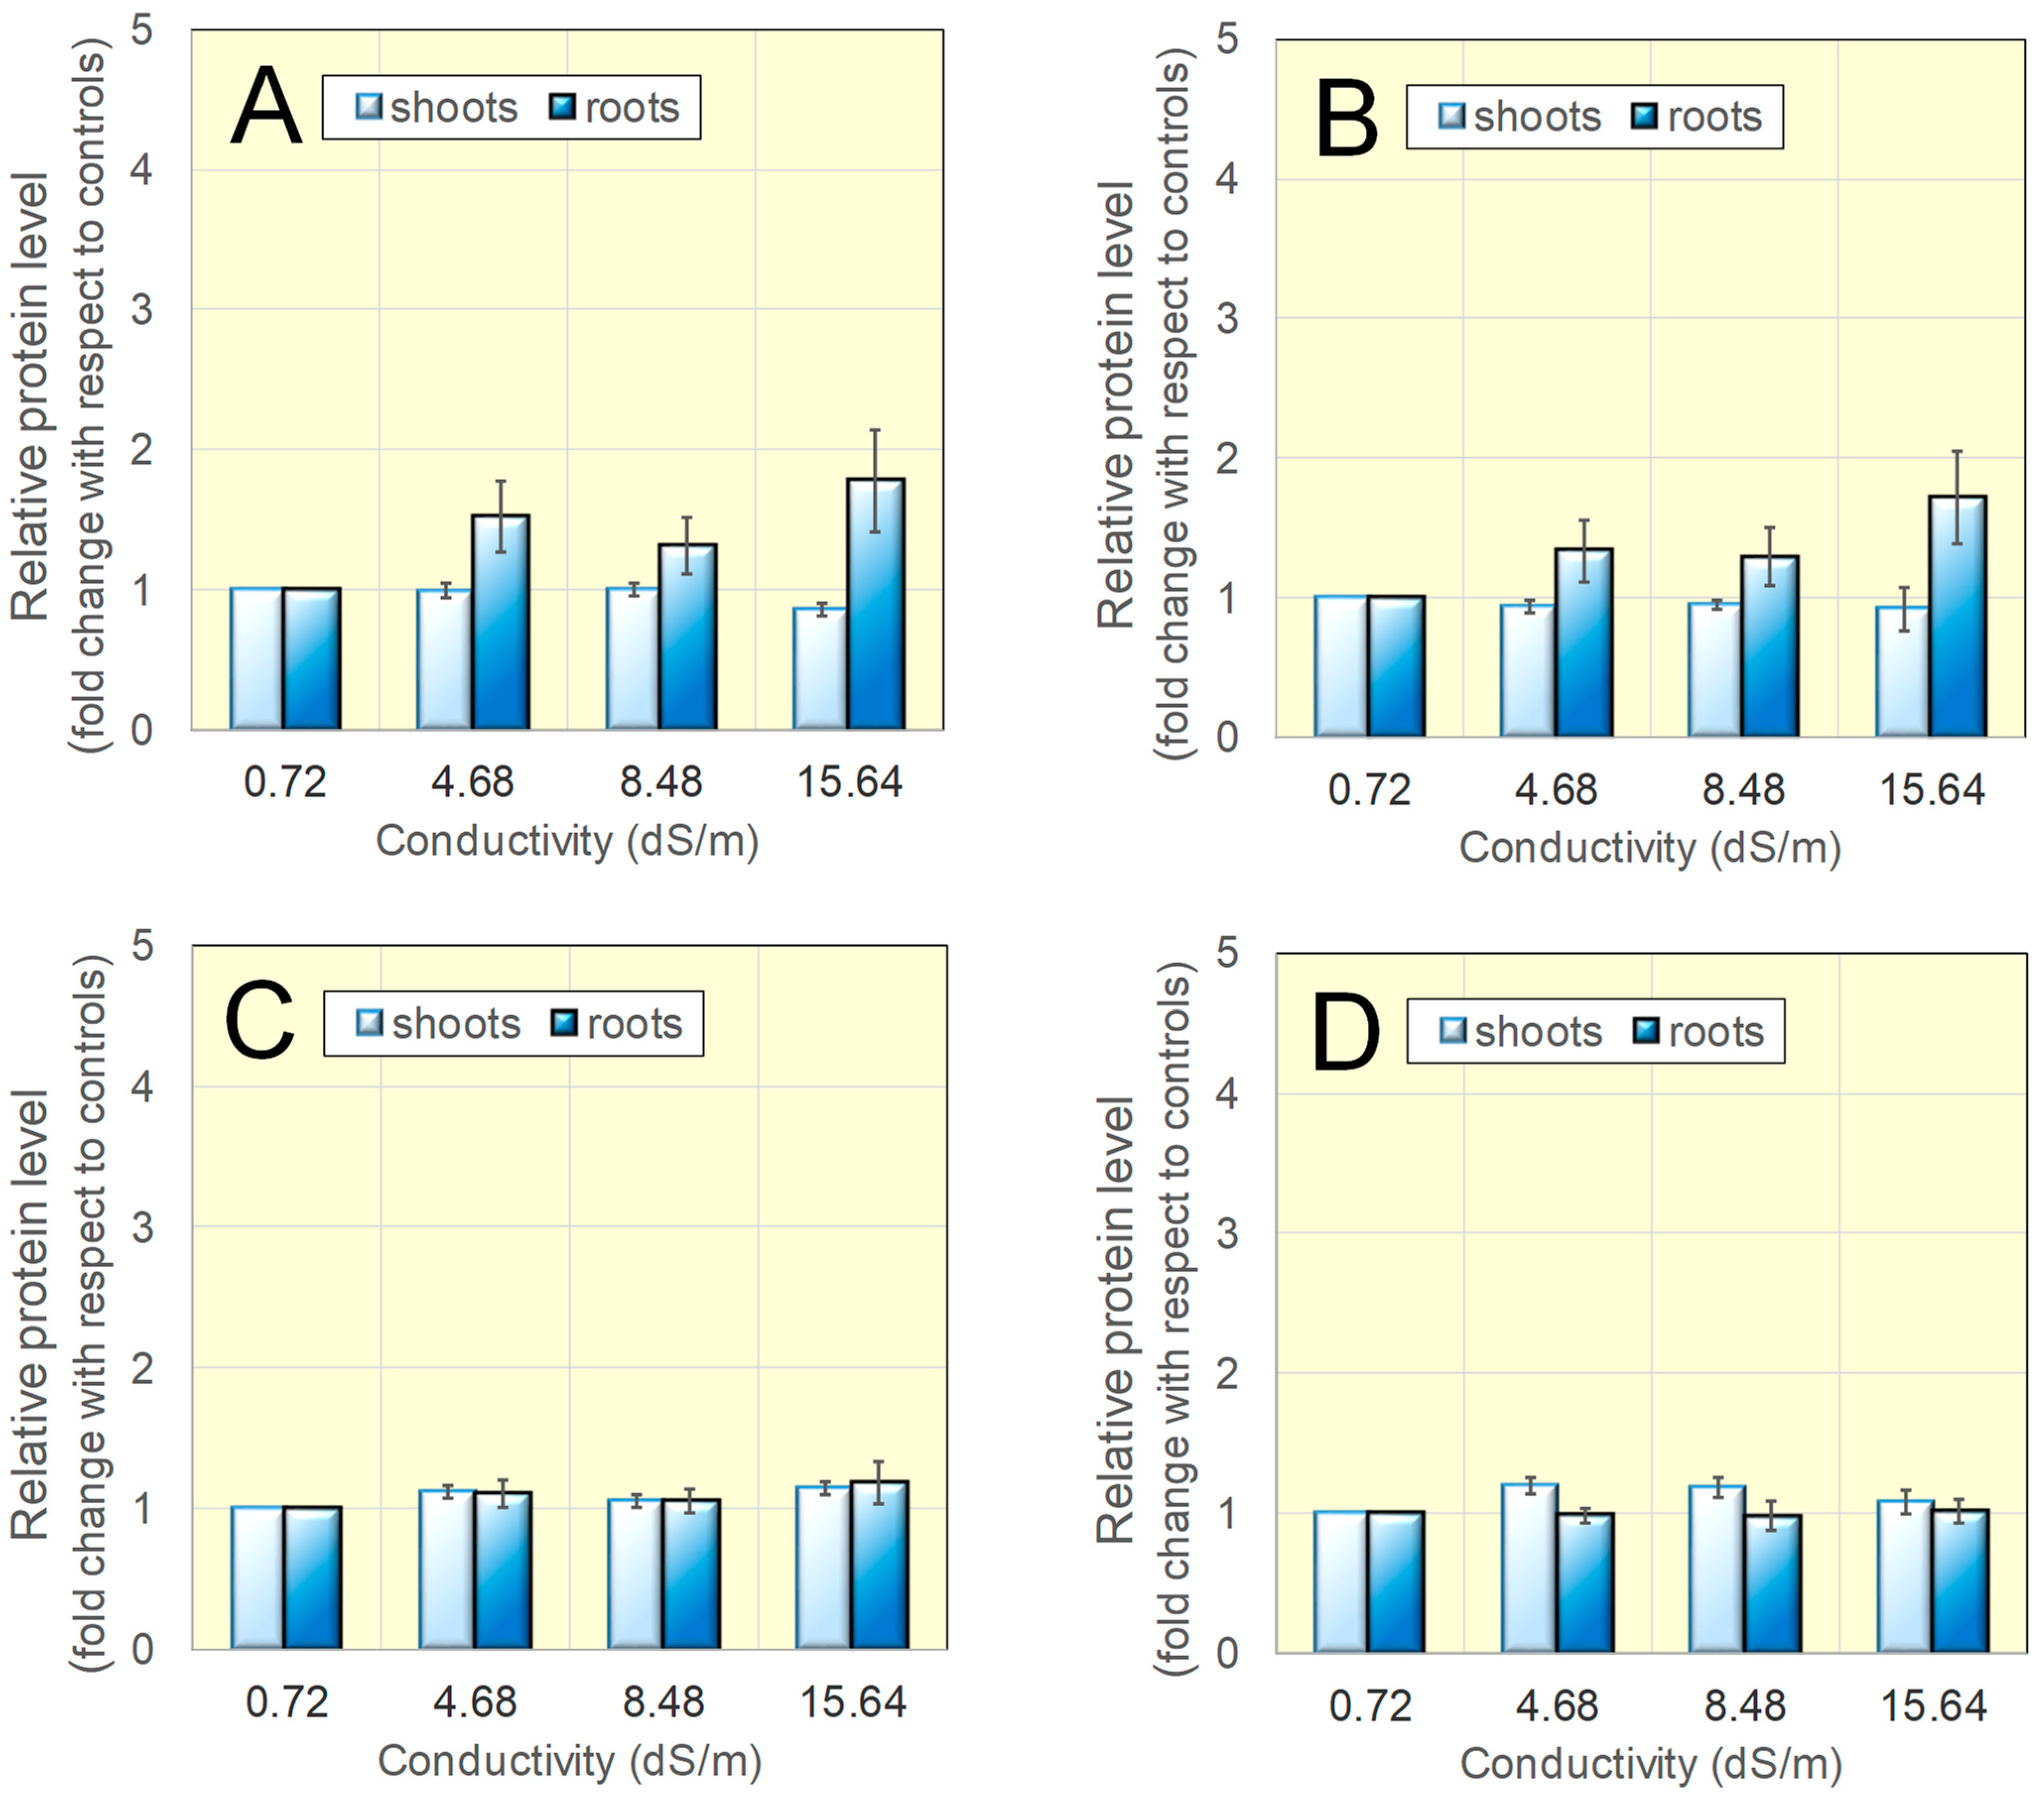
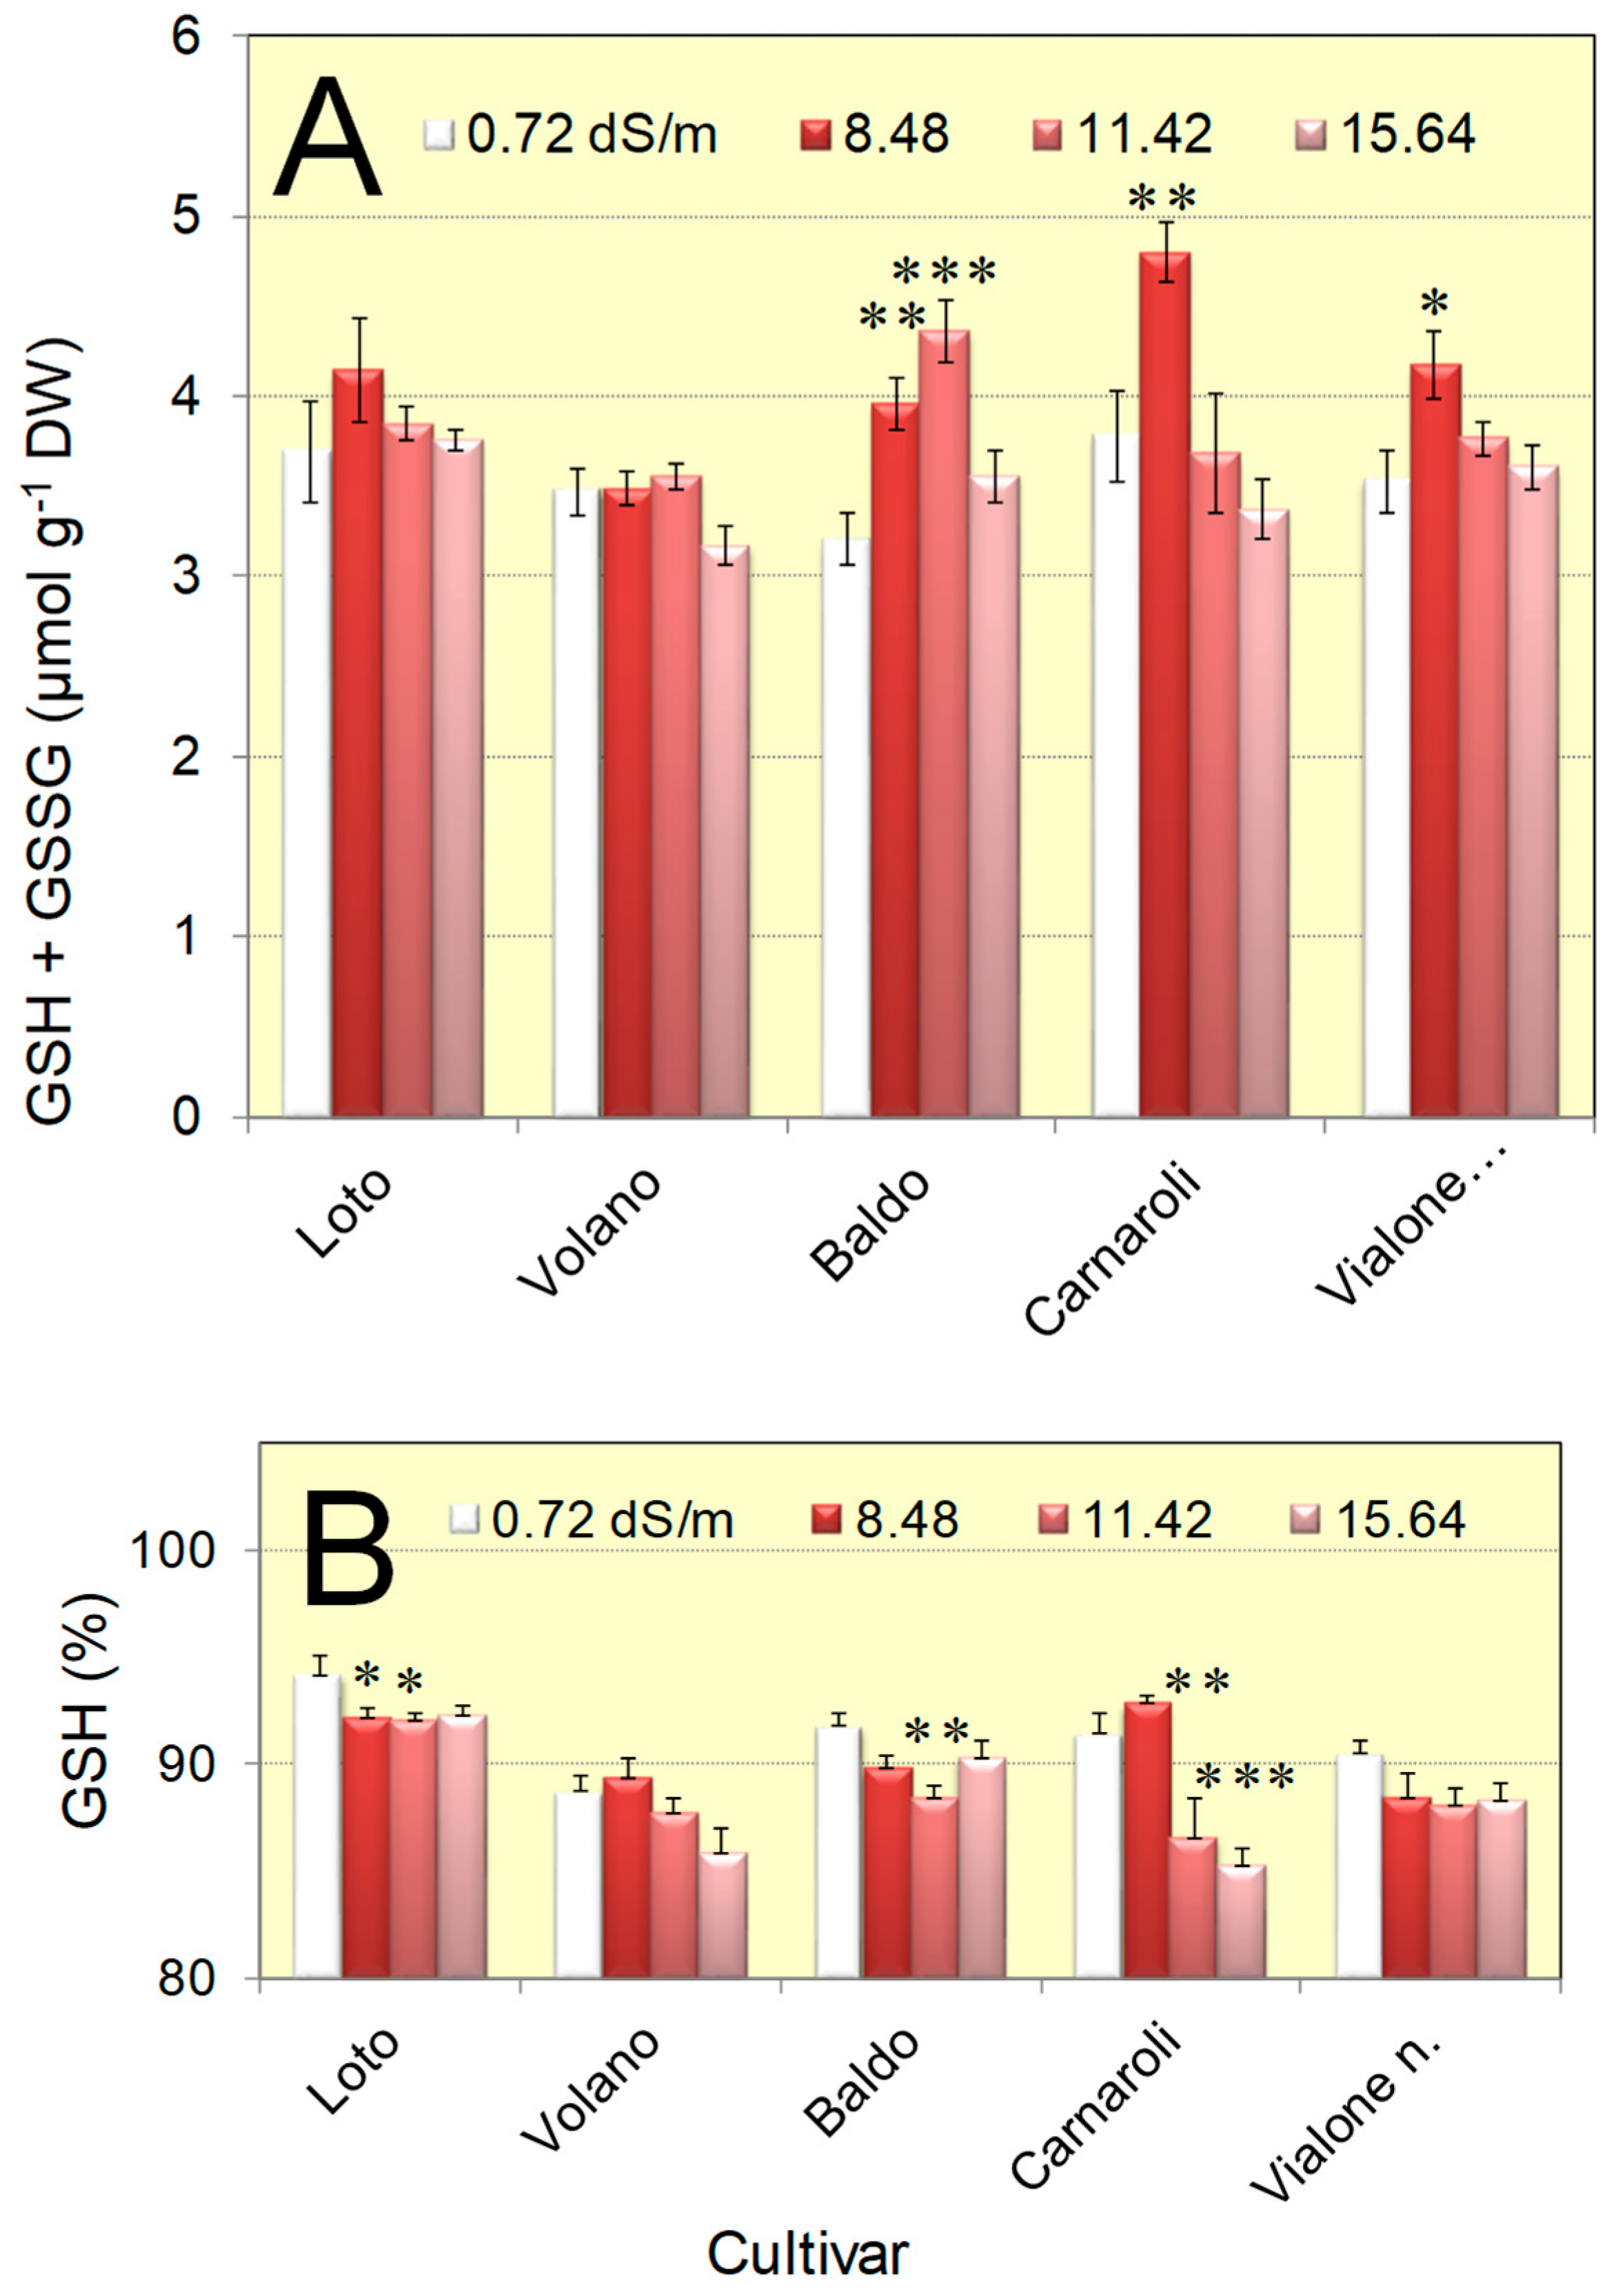
3.3. The Concentration of Glutathione and Its Reduction Level Vary Only Slightly in Salt-Adapted Seedlings

Because the immunological analysis accounted for significantly increased SOD levels in roots under stress, whereas no variations have been found for CAT, a higher demand of reducing power is expected to sustain H2O2 reduction. In fact, a slight increase of APX protein levels was also evident, although not statistically significant. On the contrary, no effect was found on GR protein levels. To assess whether this could cause a decrease of reduced glutathione in tissues of plants grown at increasing conductivity values, the whole content of the tripeptide and that of the reduced form were quantified in seedlings of the five rice varieties. Results showed a rather stable trend (Figure 9A). Total glutathione concentration in salt-grown seedlings of the salt-tolerant varieties Loto and Vialone did not show any significant variation. That of the other, more sensitive varieties showed some statistically significant differences at 8.48 dS/m, but a slight increase was evident instead. GSH content, in some cases, showed indeed a mild, yet significant decrease, but only in the case of the cultivar Carnaroli was this correlated with the intensity of the stress (p < 0.001 in a post-test for linear trend following one-way ANOVA). Moreover, no relationship with the sensitivity to salts of the cultivars was evident (Figure 9B).

4. Discussion

To cope with the effects of the climate change and the consequent increase in the frequency of abiotic stress conditions, rice breeding programs currently have to target both adaptation to water-saving strategies and salinity tolerance. Our understanding of the genetic determinants underlying these traits made significant advances in the last decades [50], but a deeper insight in the plant response to excess salt is still needed to develop tolerant varieties. Moreover, public disfavor against genetically modified plants in most European countries hampers the use of transformation with exogenous genes to obtain salt-tolerant cultivars. As a consequence, the identification of genotypes with contrasting ability to cope with salt stress conditions and the recognition of candidate genes for salt tolerance would be greatly desirable. Many studies dealt with these aspects in the case of Asian rice varieties [33,51,52]. Despite the large number of cultivars, much less is known to date for the European rice germplasm. Two hundred selected rice accessions were indeed phenotyped for salinity tolerance, and 14 QTLs and 65 candidate genes were targeted for association mapping [53]. However, the effect of only a single conductivity value (12 dS/m) was assessed, using NaCl alone as the stressor. An exclusive presence of NaCl in salt-affected soils is quite uncommon. In addition to exerting osmotic effects and direct ionic toxicity, salinity perturbs the acquisition of mineral nutrients [54], thus the presence of other ions may either ameliorate or exacerbate the effect of NaCl [55,56]. Salinity research should therefore be performed under conditions mimicking the composition of the soil solution. This is the reason why in this study, a mixture of various salts was used in proportions so as to obtain water close to the same ionic composition that has been reported in rice-growing areas affected by salinity [4].
Some other studies focused on the comparison between a sensitive and a mildly tolerant European rice varieties to gain information on the molecular bases for salinity tolerance. A transcriptome analysis showed the setting up in the tolerant cultivar of an adaptive program consisting of sodium distribution preferentially limited to the roots and older leaves, and in the activation of regulatory mechanisms of photosynthesis in the new leaves [57]. At the cultured cell level, a rapid upregulation of K+ transporter genes and an innate ROS scavenging systems that enabled ROS, in particular H2O2, to act as a signal molecule were also found in the tolerant cultivar [58]. These findings, as in many other studies, were obtained at increasing time after the exposure to a severe stress of seedlings that had been initially grown under normo-osmotic conditions, i.e., by measuring the ability to cope with a salt shock. Under field conditions, rice plants are more often subjected to mild stress during all their development than episodically exposed to more severe conditions. An abrupt exposure to excess salt could not let enough time to establish effective countermeasures. To address these possible drawbacks, in the present study, seeds of five Italian rice varieties, previously shown to differ in salt sensitivity [43,44], were directly sown in the presence of increasing conductivity values obtained with a salt mixture mimicking the composition of the soil solution, levels that were maintained thereafter during seedling growth up to the three-leaf stage.
Under these conditions, the differential salt sensitivity of these varieties previously shown during both germination [43] and early growth [44] was confirmed (Figure 1), allowing us to categorize them from the most tolerant (Loto) to the most sensitive (Vialone nano). However, despite growth inhibition, all rice varieties showed adaptation. Seedlings also developed under the most severe condition (15.64 dS/m), and chlorophyll content was found unaffected (Figure 3). When subjected to the same high conductivity value in a salt shock experiment, seedlings of the sensitive variety Vialone nano showed leaf wilting three days after the treatment, and multiple chlorotic leaves with a large decrease in PSII maximum quantum yield after a further three days in the saline solution [57]. This strengthens the possibility that an experimental approach based on an abrupt exposure to excess salt of plants previously grown under non-stressful conditions may underestimate the ability of a given genotype to adapt to hyperosmotic soils.
Seedling adaptation was also confirmed by the measurement of TBARS in roots and shoots (Figure 2). Despite being expected to induce ROS production, leading in turn to a secondary oxidative stress [16], growth in the presence of inhibitory salt concentrations did not cause a significant increase of lipid peroxidation. Only for the most sensitive cultivar Vialone nano was an increase of TBARS found in shoots at all of the salt concentrations tested, but this was not significantly proportional to the severity of the stress. TBARS levels were 4- to 5-fold higher in roots than in shoots, and in this case, salt-treated seedlings showed even lower values than untreated controls. In a previous study, the same varieties had shown slightly increased levels, but in that case, TBARS content had been determined only in shoots and in response to a single stress condition (15.64 dS/m), and data were expressed on a fresh weight basis, possibly leading to an overestimation of the effect [44]. The present results thus suggest successful activation of antioxidant defenses. In addition to the two main mechanisms conferring reduced sensitivity to excess salt, namely, ion exclusion and osmotic compensation [59,60], salt tolerance can also rely upon adaptations to secondary effects of salinity, such as the damages of salt-induced ROS [61]. The essential role of antioxidant systems to maintain a balance between ROS overproduction and their scavenging to keep them at a signaling level for reinstating metabolic homeostasis has been well established [62]. To confirm induction of antioxidant systems and to see whether their levels may account for different rates of growth inhibition under stress, protein levels of the main antioxidant enzymes were quantified in the five rice cultivars by an immunological approach. Multiple genes are present in the rice genome coding for the enzymes considered (Supplementary Table S2). The possibility that some of these isoforms are not recognized by the antibodies used, or are expressed at a level below the detection limit of the method, cannot be completely excluded. However, the immunological probes showed, in all cases, the presence of a reactive protein, and in some instances a second band was also identified. Therefore, it is likely that the data obtained in this way provide a reliable picture of the antioxidant systems that are expressed in rice seedlings.
When results obtained for extracts from salt-grown seedlings were expressed as a function of those obtained for the untreated control of the same variety, similar patterns were obtained for the five rice cultivars (Supplementary Figures S3–S5). This strongly suggests that their differential sensitivity does not rely on a different ability to activate enzymatic antioxidant defenses. Similar results were obtained when cations were quantified in shoots of the same rice varieties exposed to salt stress, leading to the conclusion that mechanisms for Na+ exclusion do not explain such different susceptibility [44]. To date, the only parameter found to significantly correlate with the differential effect of excess salt was the increase in proline homeostatic levels under stress [43].
However, even if the results do not contribute to explain the differential susceptibility to salts, the analysis of the overall set of data allowed us to point out a significant increase of several antioxidant enzymes as a part of the rice defense response. The picture obtained in this way suggests that in salt-acclimated seedlings, higher levels of O2•− are produced that require an increase of the level of the enzymes capable of superoxide detoxification. In shoots, significantly increased protein levels were found for MnSOD and both Cu/ZnSOD isoenzymes that were proportional to the severity of the stress. In roots, an even more pronounced increase was found, although for the plastidal form of Cu/ZnSOD, the difference was not significant (Figure 7). This pattern was consistently paralleled with an increase in the level of proteins that are required for detoxification of the product of SODs, H2O2: in shoots, significantly increased amounts of CAT were evident (Figure 6), whereas in roots, a slight (although not statistically significant) increase of APX was found (Figure 8).

4.1. Limitations of This Study

The experimental approach used allowed us to show the presence of different protein levels for some antioxidant enzymes in rice seedlings grown in the presence of growth-inhibitory salt concentrations. The immunoblots showed different band intensities among the two isoforms detected for Zn/CuSOD, GR and APX (Figure 5). Slight differences were also found among rice varieties for a given enzyme in extracts from untreated seedlings (Supplementary Figure S2). However, in the absence of a proper titration that would require the availability of the pure antigens, such differences cannot be used to infer different expression levels between different forms of the same enzyme, or between different rice cultivars. Variations of band intensity in Western blot may simply rely on a different efficiency of target recognition by the antibodies. Additionally, for the same enzyme form, slight differences among rice varieties may depend on small variations in the amino acid sequence that could have arisen by mutation, thereby varying the nature of a given epitope. Therefore, to avoid any unsupported speculation, only the comparison of the intensity of a single band among samples obtained from the same cultivar has been considered. Moreover, quantitation of protein levels does not provide any information regarding enzyme activities. The occurrence of post-translational regulation mechanisms could modulate enzymatic levels even if protein levels remain the same. More information will therefore be required to obtain a conclusive picture on the activation of antioxidant defenses in salt-stressed rice seedlings.

4.2. Future Directions

To overcome such limitations, future studies should be focused on the recognition of the genes involved among those identified in rice (Supplementary Table S2), and the measurement of their expression levels during development and under stress [36]. As well, the measurement of enzyme activity levels, which remain for further study, would confirm data on protein levels, and possibly allow one to point out differences between rice varieties that could at least in part contribute to their differential sensitivity to salt.

4.3. Conclusions

Despite the above limitations, the results herein described allowed us to achieve the objectives of this study and to reach the following conclusions. ➀ If directly sown under salt stress conditions, rice seedlings showed the ability to adapt up to an electric conductivity as high as 15.64 dS/m, although their growth was progressively inhibited as a consequence. Consistently, chlorophyll levels were found unaffected, and TBARS levels did not show a significant increase. ➁ Adaptation to salt stress was concomitant with a significant increase of the levels of some antioxidant enzymes, namely, CAT in shoots and Cu/Zn- and Mn-dependent SODs in both roots and shoots. ➂ A similar increase of the level of these antioxidant enzymes was found in all five rice cultivars tested, ruling out the possibility that this may provide the basis for the differential sensitivity to salts previously found for these varieties. Confirmatory data on the enhancement of these enzyme levels as a requisite for adaptation to sublethal salt concentrations could therefore lead to the identification of candidate genes useful for the future development of salt-tolerant rice varieties.

Supplementary Materials

The following supporting information can be downloaded at: https://www.mdpi.com/article/10.3390/agriculture15121234/s1, Figure S1: Seedlings of the five Italian rice cultivars 2 weeks after germination in the presence of increasing conductivity values. Figure S2: Western blot analysis of APX, CAT, GR, Cu/ZnSOD, FeSOD and MnSOD protein levels in extracts from pooled seedlings of five Italian rice varieties grown at increasing conductivity values; Figure S3: Variations of protein levels for catalase in shoots and roots of rice seedlings grown at increasing values of electrical conductivity; Figure S4: Variations of protein levels for SOD isoforms in shoots and roots of rice seedlings grown at increasing values of electrical conductivity; Figure S5: Variations of protein levels for selected enzymes of the Halliwell–Asada pathway in shoots and roots of rice seedlings grown at increasing values of electrical conductivity. Table S1: Composition of the nutrient solutions used for seedling growth, and corresponding values of electrical conductivity. Table S2: Isoforms of the studied antioxidant enzymes as listed in the Uniprot database for Oryza sativa.

Funding

This work was supported in part by AGER Foundation in the frame of the Risinnova project, grant # 2010-2369.

Institutional Review Board Statement

Not applicable.

Data Availability Statement

Some of the raw data supporting the conclusions of this article are presented in the Supplementary Material; other raw data will be made available by the author upon reasonable request.

Acknowledgments

The author wishes to acknowledge the Unità di ricerca per la risicoltura of the CREA (Vercelli, Italy) for providing seeds of the five rice varieties used in this study, and Michele Bertazzini for skilful technical assistance.

Conflicts of Interest

The author declares no conflicts of interest.

Abbreviations

The following abbreviations are used in this manuscript:
APXascorbate peroxidase
CATcatalase
DHAdehydroascorbate
DHARdehydroascorbate reductase
DTNB2,2′-dinitro–5,5′-dithio-dibenzoic acid
DW/FWdry-to-fresh weight ratio
GRglutathione reductase
GSHglutathione, reduced
GSSGglutathione, oxidized
MVP1-methyl-2-vinylpyridinium
ROSreactive oxygen species
SODsuperoxide dismutase
TBARSthiobarbituric acid reactive substances

References

  1. Munns, R.; Gilliham, M. Salinity tolerance of crops—What is the cost? New Phytol. 2015, 208, 668–673. [Google Scholar] [CrossRef] [PubMed]
  2. Li, C.; Camac, J.; Robinson, A.; Kompas, T. Predicting changes in agricultural yields under climate change scenarios and their implications for global food security. Sci. Rep. 2025, 15, 2858. [Google Scholar] [CrossRef] [PubMed]
  3. Munns, R.; Tester, M. Mechanisms of salinity tolerance. Annu. Rev. Plant Biol. 2008, 59, 651–681. [Google Scholar] [CrossRef]
  4. Grattan, S.; Zeng, L.; Shannon, M.; Roberts, S. Rice is more sensitive to salinity than previously thought. Calif. Agric. 2002, 56, 189–198. [Google Scholar] [CrossRef]
  5. Yang, Y.; Guo, Y. Elucidating the molecular mechanisms mediating plant salt-stress responses. New Phytol. 2018, 217, 523–539. [Google Scholar] [CrossRef] [PubMed]
  6. Yancey, P.H. Organic osmolytes as compatible, metabolic and counteracting cytoprotectants in high osmolarity and other stresses. J. Exp. Biol. 2005, 208, 2819–2830. [Google Scholar] [CrossRef]
  7. Forlani, G.; Trovato, M.; Funck, D.; Signorelli, S. Regulation of proline accumulation and its molecular and physiological functions in stress defence. In Osmoprotectant-Mediated Abiotic Stress Tolerance in Plants: Recent Advances and Future Perspectives; Hossain, M.A., Kumar, V., Burritt, D.J., Fujita, M., Mäkelä, P.S.A., Eds.; Springer International Publishing: Cham, Switzerland, 2019; pp. 73–97. [Google Scholar]
  8. Gul, Z.; Tang, Z.H.; Arif, M.; Ye, Z. An insight into abiotic stress and influx tolerance mechanisms in plants to cope in saline environments. Biology 2022, 11, 597. [Google Scholar] [CrossRef] [PubMed]
  9. Shabala, S.; Pottosin, I. Regulation of potassium transport in plants under hostile conditions: Implications for abiotic and biotic stress tolerance. Physiol. Plant 2014, 151, 257–279. [Google Scholar] [CrossRef]
  10. Teakle, N.L.; Tyerman, S.D. Mechanisms of Cl transport contributing to salt tolerance. Plant Cell Environ. 2010, 33, 566–589. [Google Scholar] [CrossRef]
  11. Flowers, T.J.; Munns, R.; Colmer, T.D. Sodium chloride toxicity and the cellular basis of salt tolerance in halophytes. Ann. Bot. 2015, 115, 419–431. [Google Scholar] [CrossRef]
  12. Soltabayeva, A.; Ongaltay, A.; Omondi, J.O.; Srivastava, S. Morphological, physiological and molecular markers for salt-stressed plants. Plants 2021, 10, 243. [Google Scholar] [CrossRef]
  13. Assaha, D.V.M.; Ueda, A.; Saneoka, H.; Al-Yahyai, R.; Yaish, M.W. The role of Na+ and K+ transporters in salt stress adaptation in glycophytes. Front. Physiol. 2017, 8, 509. [Google Scholar] [CrossRef]
  14. Keisham, M.; Mukherjee, S.; Bhatla, S.C. Mechanisms of sodium transport in plants—Progresses and challenges. Int. J. Mol. Sci. 2018, 19, 647. [Google Scholar] [CrossRef] [PubMed]
  15. Sackey, O.K.; Feng, N.; Mohammed, Y.Z.; Dzou, C.F.; Zheng, D.; Zhao, L.; Shen, X. A comprehensive review on rice responses and tolerance to salt stress. Front. Plant Sci. 2025, 16, 1561280. [Google Scholar] [CrossRef]
  16. Sharma, P.; Jha, A.B.; Dubey, R.S.; Pessarakli, M. Reactive oxygen species, oxidative damage, and antioxidative defense mechanism in plants under stressful conditions. J. Bot. 2012, 2012, 217037. [Google Scholar] [CrossRef]
  17. Choudhury, S.; Panda, P.; Sahoo, L.; Panda, S.K. Reactive oxygen species signaling in plants under abiotic stress. Plant Signal. Behav. 2013, 8, e23681. [Google Scholar] [CrossRef]
  18. Baxter, A.; Mittler, R.; Suzuki, N. ROS as key players in plant stress signalling. J. Exp. Bot. 2014, 65, 1229–1240. [Google Scholar] [CrossRef]
  19. Gill, S.S.; Tuteja, N. Reactive oxygen species and antioxidant machinery in abiotic stress tolerance in crop plants. Plant Physiol. Biochem. 2010, 48, 909–930. [Google Scholar] [CrossRef] [PubMed]
  20. Liang, W.; Ma, X.; Wan, P.; Liu, L. Plant salt-tolerance mechanism: A review. Biochem. Biophys. Res. Commun. 2018, 495, 286–291. [Google Scholar] [CrossRef]
  21. Foyer, C.H.; Noctor, G. Ascorbate and glutathione: The heart of the redox hub. Plant Physiol. 2011, 155, 2–18. [Google Scholar] [CrossRef]
  22. Garratt, L.C.; Janagoudar, B.S.; Lowe, K.C.; Anthony, P.; Power, J.B.; Davey, M.R. Salinity tolerance and antioxidant status in cotton cultures. Free Radic. Biol. Med. 2002, 33, 502–511. [Google Scholar] [CrossRef] [PubMed]
  23. Vaidyanathan, H.; Sivakumar, P.; Chakrabarty, R.; Thomas, G. Scavenging of reactive oxygen species in NaCl-stressed rice (Oryza sativa L.)—Differential response in salt-tolerant and sensitive varieties. Plant Sci. 2003, 165, 1411–1418. [Google Scholar] [CrossRef]
  24. El-Shabrawi, H.; Kumar, B.; Kaul, T.; Reddy, M.K.; Singla-Pareek, S.L.; Sopory, S.K. Redox homeostasis, antioxidant defense, and methylglyoxal detoxification as markers for salt tolerance in Pokkali rice. Protoplasma 2010, 245, 85–96. [Google Scholar] [CrossRef]
  25. Abogadallah, G.M. Antioxidative defense under salt stress. Plant Signal. Behav. 2010, 5, 369–374. [Google Scholar] [CrossRef]
  26. Kibria, M.G.; Hossain, M.; Murata, Y.; Hoque, M.A. Antioxidant defense mechanisms of salinity tolerance in rice genotypes. Rice Sci. 2017, 24, 155–162. [Google Scholar] [CrossRef]
  27. Laus, M.N.; De Santis, M.A.; Flagella, Z.; Soccio, M. Changes in antioxidant defence system in durum wheat under hyperosmotic stress: A concise overview. Plants 2021, 11, 98. [Google Scholar] [CrossRef]
  28. Muthayya, S.; Sugimoto, J.D.; Montgomery, S.; Maberly, G.F. An overview of global rice production, supply, trade, and consumption. Ann. N. Y. Acad. Sci. 2014, 1324, 7–14. [Google Scholar] [CrossRef]
  29. Singh, R.K.; Kota, S.; Flowers, T.J. Salt tolerance in rice: Seedling and reproductive stage QTL mapping come of age. Theor. Appl. Genet. 2021, 134, 3495–3533. [Google Scholar] [CrossRef] [PubMed]
  30. Reddy, I.N.B.L.; Kim, B.-K.; Yoon, I.-S.; Kim, K.-H.; Kwon, T.-R. Salt tolerance in rice: Focus on mechanisms and approaches. Rice Sci. 2017, 24, 123–144. [Google Scholar] [CrossRef]
  31. Rajkumari, N.; Chowrasia, S.; Nishad, J.; Ganie, S.A.; Mondal, T.K. Metabolomics-mediated elucidation of rice responses to salt stress. Planta 2023, 258, 111. [Google Scholar] [CrossRef]
  32. Reddy, I.N.B.L.; Kim, S.-M.; Kim, B.-K.; Yoon, I.-S.; Kwon, T.-R. Identification of rice accessions associated with K+/Na+ ratio and salt tolerance based on physiological and molecular responses. Rice Sci. 2017, 24, 360–364. [Google Scholar] [CrossRef]
  33. Li, Q.; Zhu, P.; Yu, X.; Xu, J.; Liu, G. Physiological and molecular mechanisms of rice tolerance to salt and drought stress: Advances and future directions. Int. J. Mol. Sci. 2024, 25, 9404. [Google Scholar] [CrossRef]
  34. Kumar, V.; Srivastava, A.K.; Sharma, D.; Pandey, S.P.; Pandey, M.; Dudwadkar, A.; Parab, H.J.; Suprasanna, P.; Das, B.K. Antioxidant defense and ionic homeostasis govern stage-specific response of salinity stress in contrasting rice varieties. Plants 2024, 13, 778. [Google Scholar] [CrossRef] [PubMed]
  35. Sanyal, R.P.; Prashar, V.; Jawali, N.; Sunkar, R.; Misra, H.S.; Saini, A. Molecular and biochemical analysis of duplicated cytosolic CuZn superoxide dismutases of rice and in silico analysis in plants. Front. Plant Sci. 2022, 13, 864330. [Google Scholar] [CrossRef]
  36. Nath, K.; Kumar, S.; Poudyal, R.S.; Yang, Y.N.; Timilsina, R.; Park, Y.S.; Nath, J.; Chauhan, P.S.; Pant, B.; Lee, C.-H. Developmental stage-dependent differential gene expression of superoxide dismutase isoenzymes and their localization and physical interaction network in rice (Oryza sativa L.). Genes Genom. 2014, 36, 45–55. [Google Scholar] [CrossRef]
  37. Yang, Q.; Zheng, Y.; Li, X. Integrative RNA-seq and ATAC-seq analysis unveils antioxidant defense mechanisms in salt-tolerant rice variety Pokkali. BMC Plant Biol. 2025, 25, 364. [Google Scholar] [CrossRef]
  38. Guan, Q.; Liao, X.; He, M.; Li, X.; Wang, Z.; Ma, H.; Yu, S.; Liu, S. Tolerance analysis of chloroplast OsCu/Zn-SOD overexpressing rice under NaCl and NaHCO3 stress. PLoS ONE 2017, 12, e0186052. [Google Scholar] [CrossRef] [PubMed]
  39. Motohashi, T.N.K.; Prodhan, S.H.; Nakao, K.; Shishido, T.; Yamamoto, Y.; Moriwaki, T.; Hattori, E.; Asada, M.; Morishima, H.; Hirose, S.; et al. Production of salt stress tolerant rice by overexpression of the catalase gene, katE, derived from Escherichia coli. Asia-Pac. J. Mol. Biol. Biotechnol. 2010, 18, 37–42. [Google Scholar]
  40. Lu, Z.; Liu, D.; Liu, S. Two rice cytosolic ascorbate peroxidases differentially improve salt tolerance in transgenic Arabidopsis. Plant Cell Rep. 2007, 26, 1909–1917. [Google Scholar] [CrossRef]
  41. Zheng, X.; Yuan, Z.; Yu, Y.; Yu, S.; He, H. OsCSD2 and OsCSD3 Enhance seed storability by modulating antioxidant enzymes and abscisic acid in rice. Plants 2024, 13, 310. [Google Scholar] [CrossRef]
  42. Faivre-Rampant, O.; Bruschi, G.; Abbruscato, P.; Cavigiolo, S.; Picco, A.M.; Borgo, L.; Lupotto, E.; Piffanelli, P. Assessment of genetic diversity in Italian rice germplasm related to agronomic traits and blast resistance (Magnaporthe oryzae). Mol. Breed. 2011, 27, 233–246. [Google Scholar] [CrossRef]
  43. Forlani, G.; Bertazzini, M.; Cagnano, G. Stress-driven increase in proline levels, and not proline levels themselves, correlates with the ability to withstand excess salt in a group of 17 Italian rice genotypes. Plant Biol. 2019, 21, 336–342. [Google Scholar] [CrossRef]
  44. Bertazzini, M.; Sacchi, G.A.; Forlani, G. A differential tolerance to mild salt stress conditions among six Italian rice genotypes does not rely on Na+ exclusion from shoots. J. Plant Physiol. 2018, 226, 145–153. [Google Scholar] [CrossRef] [PubMed]
  45. Yuan, Z.; Cao, Q.; Zhang, K.; Ata-Ul-Karim, S.T.; Tian, Y.; Zhu, Y.; Cao, W.; Liu, X. Optimal leaf positions for SPAD meter measurement in rice. Front. Plant Sci. 2016, 7, 719. [Google Scholar] [CrossRef] [PubMed]
  46. Bradford, M.M. A rapid and sensitive method for the quantitation of microgram quantities of protein utilizing the principle of protein-dye binding. Anal. Biochem. 1976, 72, 248–254. [Google Scholar] [CrossRef]
  47. Schneider, C.A.; Rasband, W.S.; Eliceiri, K.W. NIH Image to ImageJ: 25 years of image analysis. Nat. Methods 2012, 9, 671–675. [Google Scholar] [CrossRef]
  48. Queval, G.; Noctor, G. A plate reader method for the measurement of NAD, NADP, glutathione, and ascorbate in tissue extracts: Application to redox profiling during Arabidopsis rosette development. Anal. Biochem. 2007, 363, 58–69. [Google Scholar] [CrossRef]
  49. Chaves, M.M.; Flexas, J.; Pinheiro, C. Photosynthesis under drought and salt stress: Regulation mechanisms from whole plant to cell. Ann. Bot. 2009, 103, 551–560. [Google Scholar] [CrossRef]
  50. Zhang, J.; Che, J.; Ouyang, Y. Engineering rice genomes towards green super rice. Curr. Opin. Plant Biol. 2024, 82, 102664. [Google Scholar] [CrossRef]
  51. Raghuvanshi, R.; Srivastava, A.K.; Verulkar, S.; Suprasanna, P. Unlocking allelic diversity for sustainable development of salinity stress tolerance in rice. Curr. Genomics 2021, 22, 393–403. [Google Scholar] [CrossRef]
  52. Padmavathi, G.; Bangale, U.; Rao, K.N.; Balakrishnan, D.; Arun, M.N.; Singh, R.K.; Sundaram, R.M. Progress and prospects in harnessing wild relatives for genetic enhancement of salt tolerance in rice. Front. Plant Sci. 2023, 14, 1253726. [Google Scholar] [CrossRef]
  53. Ahmadi, N.; Negrão, S.; Katsantonis, D.; Frouin, J.; Ploux, J.; Letourmy, P.; Droc, G.; Babo, P.; Trindade, H.; Bruschi, G.; et al. Targeted association analysis identified japonica rice varieties achieving Na+/K+ homeostasis without the allelic make-up of the salt tolerant indica variety Nona Bokra. Theor. Appl. Genet. 2011, 123, 881–895. [Google Scholar] [CrossRef]
  54. Joshi, S.; Nath, J.; Singh, A.K.; Pareek, A.; Joshi, R. Ion transporters and their regulatory signal transduction mechanisms for salinity tolerance in plants. Physiol. Plant. 2022, 174, e13702. [Google Scholar] [CrossRef]
  55. Geilfus, C.-M. Chloride in soil: From nutrient to soil pollutant. Environ. Exp. Bot. 2019, 157, 299–309. [Google Scholar] [CrossRef]
  56. Liu, X.X.; Zhu, Y.X.; Fang, X.Z.; Ye, J.Y.; Du, W.X.; Zhu, Q.Y.; Lin, X.Y.; Jin, C.W. Ammonium aggravates salt stress in plants by entrapping them in a chloride over-accumulation state in an NRT1.1-dependent manner. Sci. Total Environ. 2020, 746, 141244. [Google Scholar] [CrossRef] [PubMed]
  57. Formentin, E.; Sudiro, C.; Perin, G.; Riccadonna, S.; Barizza, E.; Baldoni, E.; Lavezzo, E.; Stevanato, P.; Sacchi, G.A.; Fontana, P.; et al. Transcriptome and cell physiological analyses in different rice cultivars provide new insights into adaptive and salinity stress responses. Front. Plant Sci. 2018, 9, 204. [Google Scholar] [CrossRef]
  58. Formentin, E.; Sudiro, C.; Ronci, M.B.; Locato, V.; Barizza, E.; Stevanato, P.; Ijaz, B.; Zottini, M.; De Gara, L.; Lo Schiavo, F. H2O2 signature and innate antioxidative profile make the difference between sensitivity and tolerance to salt in rice cells. Front. Plant Sci. 2018, 9, 1549. [Google Scholar] [CrossRef] [PubMed]
  59. Zhang, H.; Han, B.; Wang, T.; Chen, S.; Li, H.; Zhang, Y.; Dai, S. Mechanisms of plant salt response: Insights from proteomics. J. Proteome Res. 2012, 11, 49–67. [Google Scholar] [CrossRef]
  60. Hualpa-Ramirez, E.; Carrasco-Lozano, E.C.; Madrid-Espinoza, J.; Tejos, R.; Ruiz-Lara, S.; Stange, C.; Norambuena, L. Stress salinity in plants: New strategies to cope with in the foreseeable scenario. Plant Physiol. Biochem. 2024, 208, 108507. [Google Scholar] [CrossRef]
  61. Martins, T.S.; Da-Silva, C.J.; Shabala, S.; Striker, G.G.; Carvalho, I.R.; de Oliveira, A.C.B.; do Amarante, L. Understanding plant responses to saline waterlogging: Insights from halophytes and implications for crop tolerance. Planta 2023, 259, 24. [Google Scholar] [CrossRef]
  62. Türkan, I.; Demiral, T. Recent developments in understanding salinity tolerance. Environ. Exp. Bot. 2009, 67, 2–9. [Google Scholar] [CrossRef]
Figure 1. Effect of increasing salt concentration on the growth of the rice cultivars used in this study, expressed as seedling biomass (dry weight [DW]) two weeks after germination (panel (A)). Data are mean ± SE over at least 54 replications. The dry-to-fresh weight (DW/FW) ratio, expressed as percent of values for untreated controls (0.1005 ± 0.0009, 0.1124 ± 0.0016, 0.1066 ± 0.0014, 0.1007 ± 0.0011 and 0.1058 ± 0.0027 for Loto, Volano, Baldo, Carnaroli and Vialone nano, respectively) is also reported (panel (B)). Data are mean ± SE over four replications. Data were subjected to t test, corrected for multiple comparisons using the Holm–Sidak method. Significant differences with respect to untreated controls are marked (*, p < 0.05; **, p < 0.01; ***, p < 0.001).
Agriculture 15 01234 g001
Figure 2. Thiobarbituric acid reactive substances (TBARS) levels in shoots (panel (A)) and roots (panel (B)) of salt-grown seedlings. Results refer to mean values ± SE over 10 biological replicates. Data were subjected to t-test, corrected for multiple comparisons using the Holm–Sidak method. Significant variations with respect to untreated controls are marked (**, p < 0.01; ***, p < 0.001).
Agriculture 15 01234 g002
Figure 3. Chlorophyll levels in salt-grown seedlings two weeks after sowing, measured as Soil Plant Analysis Development (SPAD) units. Results are means ± SE over 20 replicates. Data were subjected to t-test, corrected for multiple comparisons using the Holm–Sidak method. Significant variations with respect to untreated controls are marked (***, p < 0.001).
Agriculture 15 01234 g003
Figure 4. A scheme of the antioxidant pathway mediating ROS quenching in plants. Superoxide anion is enzymatically converted to H2O2 by an array of superoxide dismutases (SODs) with different subcellular localization and metal requirement. Peroxide is disproportionated in turn to oxygen and water by catalase (CAT), or oxidized to water by various peroxidases. Among the latter, ascorbate peroxidase (APX) uses ascorbate as the reducing co-factor. The resulting dehydroascorbate (DHA) is reduced back by DHA reductase (DHAR), with concomitant glutathione (GSH) oxidation to GSSG. Lastly, glutathione reductase (GR) regenerates GSH from GSSG using NADPH as the electron donor.
Agriculture 15 01234 g004
Figure 5. Immunological detection of selected antioxidant enzymes in shoots of salt-grown seedlings of the cultivar Carnaroli. Bands of the expected molecular weights are labelled with arrows.
Agriculture 15 01234 g005
Figure 6. Variations of protein levels for catalase in shoots and roots of rice seedlings grown at increasing values of electrical conductivity. Results are means ± SE over 10 replicates. Data were subjected to one-way ANOVA with a post-test for linear trend. Significant trends are marked (**, p < 0.01).
Agriculture 15 01234 g006
Figure 7. Variations of protein levels for SOD isoforms in shoots and roots of rice seedlings grown at increasing values of electrical conductivity. Panel (A): Cu/ZnSOD, plastidal; panel (B): Cu/ZnSOD, cytosolic; panel (C): FeSOD; panel (D): MnSOD. Results are means ± SE over 10 replicates. Data were subjected to one-way ANOVA with a post-test for linear trend. Significant trends are marked (*, p < 0.05; **, p < 0.01; ***, p < 0.001).
Agriculture 15 01234 g007
Figure 8. Variations of protein levels for selected enzymes of the Halliwell–Asada pathway in shoots and roots of rice seedlings grown at increasing values of electrical conductivity. Panel (A): ascorbate peroxidase (APX), plastidal; panel (B): APX, cytosolic; panel (C): glutathione reductase (GR), mitochondrial; panel (D): GR, plastidal. Results are means ± SE over 10 replicates. Data were subjected to one-way ANOVA with a post-test for linear trend.
Agriculture 15 01234 g008
Figure 9. Total glutathione (the sum of reduced (GSH) and oxidized glutathione [GSSG], panel (A)) and reduced glutathione (% of GSH over the sum of GSH and GSSG, panel (B)) levels in rice seedlings grown in the presence of increasing salt concentrations. Presented results are mean ± SE over 20 replicates. Data were subjected to t-test using the Dunnett’s correction for multiple comparisons. Significant differences with respect to untreated controls are marked (*, p < 0.05; **, p < 0.01; ***, p < 0.001).
Agriculture 15 01234 g009
Table 1. Antibodies used in this work.
Agrisera CodeTargetImmunogenAcrylamide in Separating Gel Expected Band(s) (kDa)
AS08 368ascorbate peroxidasesynthetic peptide derived from Arabidopsis thaliana tAPX (At1g77490) and sAPX (At4g08390)12%27 (cytosolic)
33–37 (plastidial)
AS09 501catalaseKLH-conjugated peptide chosen from know plant catalase sequences including A. thaliana10%57
AS06 181glutathione reductasemaltose binding protein (MBP) fusion of Zea mays glutathione reductase, O6440910%42 (plastidial)
60 (cytosolic)
AS06 170Cu/Zn superoxide dismutaseheterologously expressed Arabidopsis thaliana Cu/ZnSOD O7831012%15 (cytosolic)
21 (plastidial)
AS06 125Fe superoxide dismutaseoverexpressed Chlamydomonas reinhardtii thioredoxin fusion protein A8IGH1, FeSOD 12%29
AS09 524Mn superoxide dismutaseKLH-conjugated synthetic peptide derived from MnSOD sequences in dicots and monocots including A. thaliana O8123512%25 (21–29)
Disclaimer/Publisher’s Note: The statements, opinions and data contained in all publications are solely those of the individual author(s) and contributor(s) and not of MDPI and/or the editor(s). MDPI and/or the editor(s) disclaim responsibility for any injury to people or property resulting from any ideas, methods, instructions or products referred to in the content.

