Article

For Precision Animal Husbandry: Precise Detection of Specific Body Parts of Sika Deer Based on Improved YOLO11

1
College of Information Technology, Jilin Agricultural University, Changchun 130118, China
2
College of Animal Science and Technology, Jilin Agricultural University, Changchun 130118, China
3
Jilin Province Intelligent Environmental Engineering Research Center, Changchun 130118, China
4
Jilin Province Agricultural Internet of Things Technology Collaborative Innovation Center, Changchun 130118, China
*
Authors to whom correspondence should be addressed.
Agriculture 2025, 15(11), 1218; https://doi.org/10.3390/agriculture15111218
Submission received: 30 April 2025 / Revised: 21 May 2025 / Accepted: 31 May 2025 / Published: 3 June 2025
(This article belongs to the Section Digital Agriculture)

Abstract

The breeding of sika deer has significant economic value in China. However, the traditional management methods have problems such as low efficiency, easy triggering of strong stress responses, and damage to animal welfare. Therefore, the development of non-contact, automated, and precise monitoring and management technologies has become an urgent need for the sustainable development of this industry. In response to this demand, this study designed a model MFW-YOLO based on YOLO11, aiming to achieve precise detection of specific body parts of sika deer in a real breeding environment. Improvements include: designing a lightweight and efficient hybrid backbone network, MobileNetV4HybridSmall; The multi-scale fast pyramid pooling module (SPPFMscale) is proposed. The WIoU v3 loss function is used to replace the default loss function. To verify the effectiveness of the method, we constructed a sika deer dataset containing 1025 images, covering five categories. The experimental results show that the improved model performs well. Its mAP50 and MAP50-95 reached 91.9% and 64.5%, respectively. This model also demonstrates outstanding efficiency. The number of parameters is only 62% (5.9 million) of the original model, the computational load is 60% (12.8 GFLOPs) of the original model, and the average inference time is as low as 3.8 ms. This work provides strong algorithmic support for achieving non-contact intelligent monitoring of sika deer, assisting in automated management (deer antler collection and preparation), and improving animal welfare, demonstrating the application potential of deep learning technology in modern precision animal husbandry.

1. Introduction

In China, the breeding of sika deer has developed into a characteristic industry with significant economic value, the core of which lies in the continuously growing market demand for products such as deer antler in traditional medicine and health care products [1]. This economic orientation not only puts forward higher requirements for improving the efficiency of breeding and product quality, but also brings new challenges to ensuring animal welfare and achieving sustainable production in an intensive or semi-intensive breeding environment. The traditional management methods of sika deer, such as relying on manual observation for health assessment, determination of the maturity of deer antler, or when precise operations are required (such as the preparatory work before collecting deer antler), mainly depend on manual fixation or chemical fixation (using sedatives or anesthetics) [2]. These two methods not only generally have problems such as high labor intensity, need for professional skills, and high operational risks, but more importantly, such invasive or compulsory close-range contact operations are very likely to trigger a strong stress response in sika deer. This kind of stress not only seriously damages animal welfare, but also may affect the quality of deer products (such as deer antler). Therefore, the development of non-contact, automated, and precise monitoring and management technologies has become an urgent need to promote the transformation and upgrading of the sika deer breeding industry towards modernization, humanization, and sustainability [3].
In recent years, computer vision technology centered on deep learning has made breakthrough progress [4,5], providing strong technical support for addressing the above-mentioned challenges. The object detection algorithm based on deep learning, as one of the core technologies in this field, has been widely applied in ecology and precision animal husbandry [6]. In ecology, the automatic identification of wild animals has been successfully achieved. For instance, Sibusi Oreu Benbakana and others proposed a lightweight and efficient wild animal identification model based on YOLOv5s [7]. Through StemBlock optimization, MobileBottleneckBlock replacement, and BiFPN feature fusion, the parameters are reduced by 28.5%, the FLOPs are decreased by 50.9%, the loading speed is faster, and it is suitable for real-time monitoring in resource-constrained fields, providing efficient technical support for ecological protection. Lingli Chen et al. [8] proposed the YOLO-SAG model to balance accuracy and speed. Softplus enhances stability, AIFI module strengthens the interaction of features at the same scale, GSConv and VoV-GSCSP lightweight neck. On the self-built wildlife dataset, mAP50 reached 96.8%, which is 3.2% higher than the original model, 25% faster than inference, and only requires 7.2 GFLOPs of computing power. The model performs well in complex backgrounds and small target detection, and is suitable for long-term real-time monitoring scenarios in the field. Langkun Jiang et al. [9] proposed an improved YOLOv8n model that integrates extended Kalman filtering, integrating DCNv3 and EMGA attention mechanisms to optimize multi-object tracking. Enhanced by StableDiffusion data, the detected mAP50 reached 88.5%, and the tracked MOTA increased by 3.9%. It effectively dealt with occlusion and small targets, providing a reliable technical solution for ecological monitoring and endangered species protection.
In precision livestock farming, target detection technology enables the individual identification and behavior analysis of livestock. For instance, Junpeng Zhang et al. [10] proposed a behavior detection method for dairy goats based on YOLO11 and ElSlow fast-LSTM. The target is located through YOLO11, and spatio-temporal feature modeling is carried out by combining the improved SlowFast network and LSTM to achieve the recognition of five behaviors such as standing and walking. A mAP of 78.70% was achieved on the self-built DairyGoat dataset, with lower parameters and higher computational efficiency than the traditional model. Xiwen Zhang et al. [11] proposed the lightweight sheep facial recognition model LSR-YOLO. It adopted ShuffleNetv2 and the Ghost module to reduce the number of parameters and introduced the CA attention mechanism to enhance feature extraction. The model size was only 9.5 MB, and the mAP50 reached 97.8%. Verified on the self-built dataset, the number of parameters decreased by 33.4%, FLOPs decreased by 25.5%, and the mobile terminal was successfully deployed to achieve real-time detection. Ye Mu et al. [12] proposed an improved CBR-YOLO model of YOLOv8 for the behavior recognition of beef cattle under multiple weather conditions. Combining the Inner-MPDIoU loss function, the MCFP multi-scale feature pyramid and the lightweight LMFD detection head, the mAP reached 90.2% in the complex weather dataset and the FLOPs was reduced by 3.9 G. Experiments show that the model is superior to 12 SOTA models in terms of the number of parameters and computational efficiency, and is suitable for the real-time monitoring system of pastures. Based on the improvement of YOLOv8, He Gong et al. [3] enhanced feature fusion by introducing the C2f_iAFF module, replaced SPPF with the AIFI module to process high-level semantics, designed the CSA module to optimize feature extraction, and combined it with the SPFPN detection head to improve multi-scale feature fusion. Experiments show that the model achieves an average accuracy of 91.6% on the self-built dataset, with a 4.6% increase in mAP50, which outperforms other models in the YOLO series. This model can effectively achieve non-contact real-time monitoring of sika deer postures in complex breeding environments, providing technical support for health assessment.
However, the existing research mainly focuses on the detection of individual animals themselves [13]. For more refined management requirements, such as accurately identifying and locating specific parts of an animal’s body, the research is relatively insufficient, especially in the breeding or management scenarios of large mammals. More importantly, to achieve stable and reliable part detection in a real and dynamically changing breeding environment, the algorithm must be able to cope with many practical challenges such as light changes, background interference, diverse and unpredictable animal postures, and the target parts being often occlusions. This greatly increases the difficulty of algorithm design and optimization. Precise positioning of key body parts is precisely the fundamental prerequisite and core link for achieving downstream automated operations (such as robot guidance [14]), health monitoring [15] (such as non-contact body scale measurement, automated gait analysis), and complex behavior recognition [16] (such as distinguishing between feeding and alert postures).
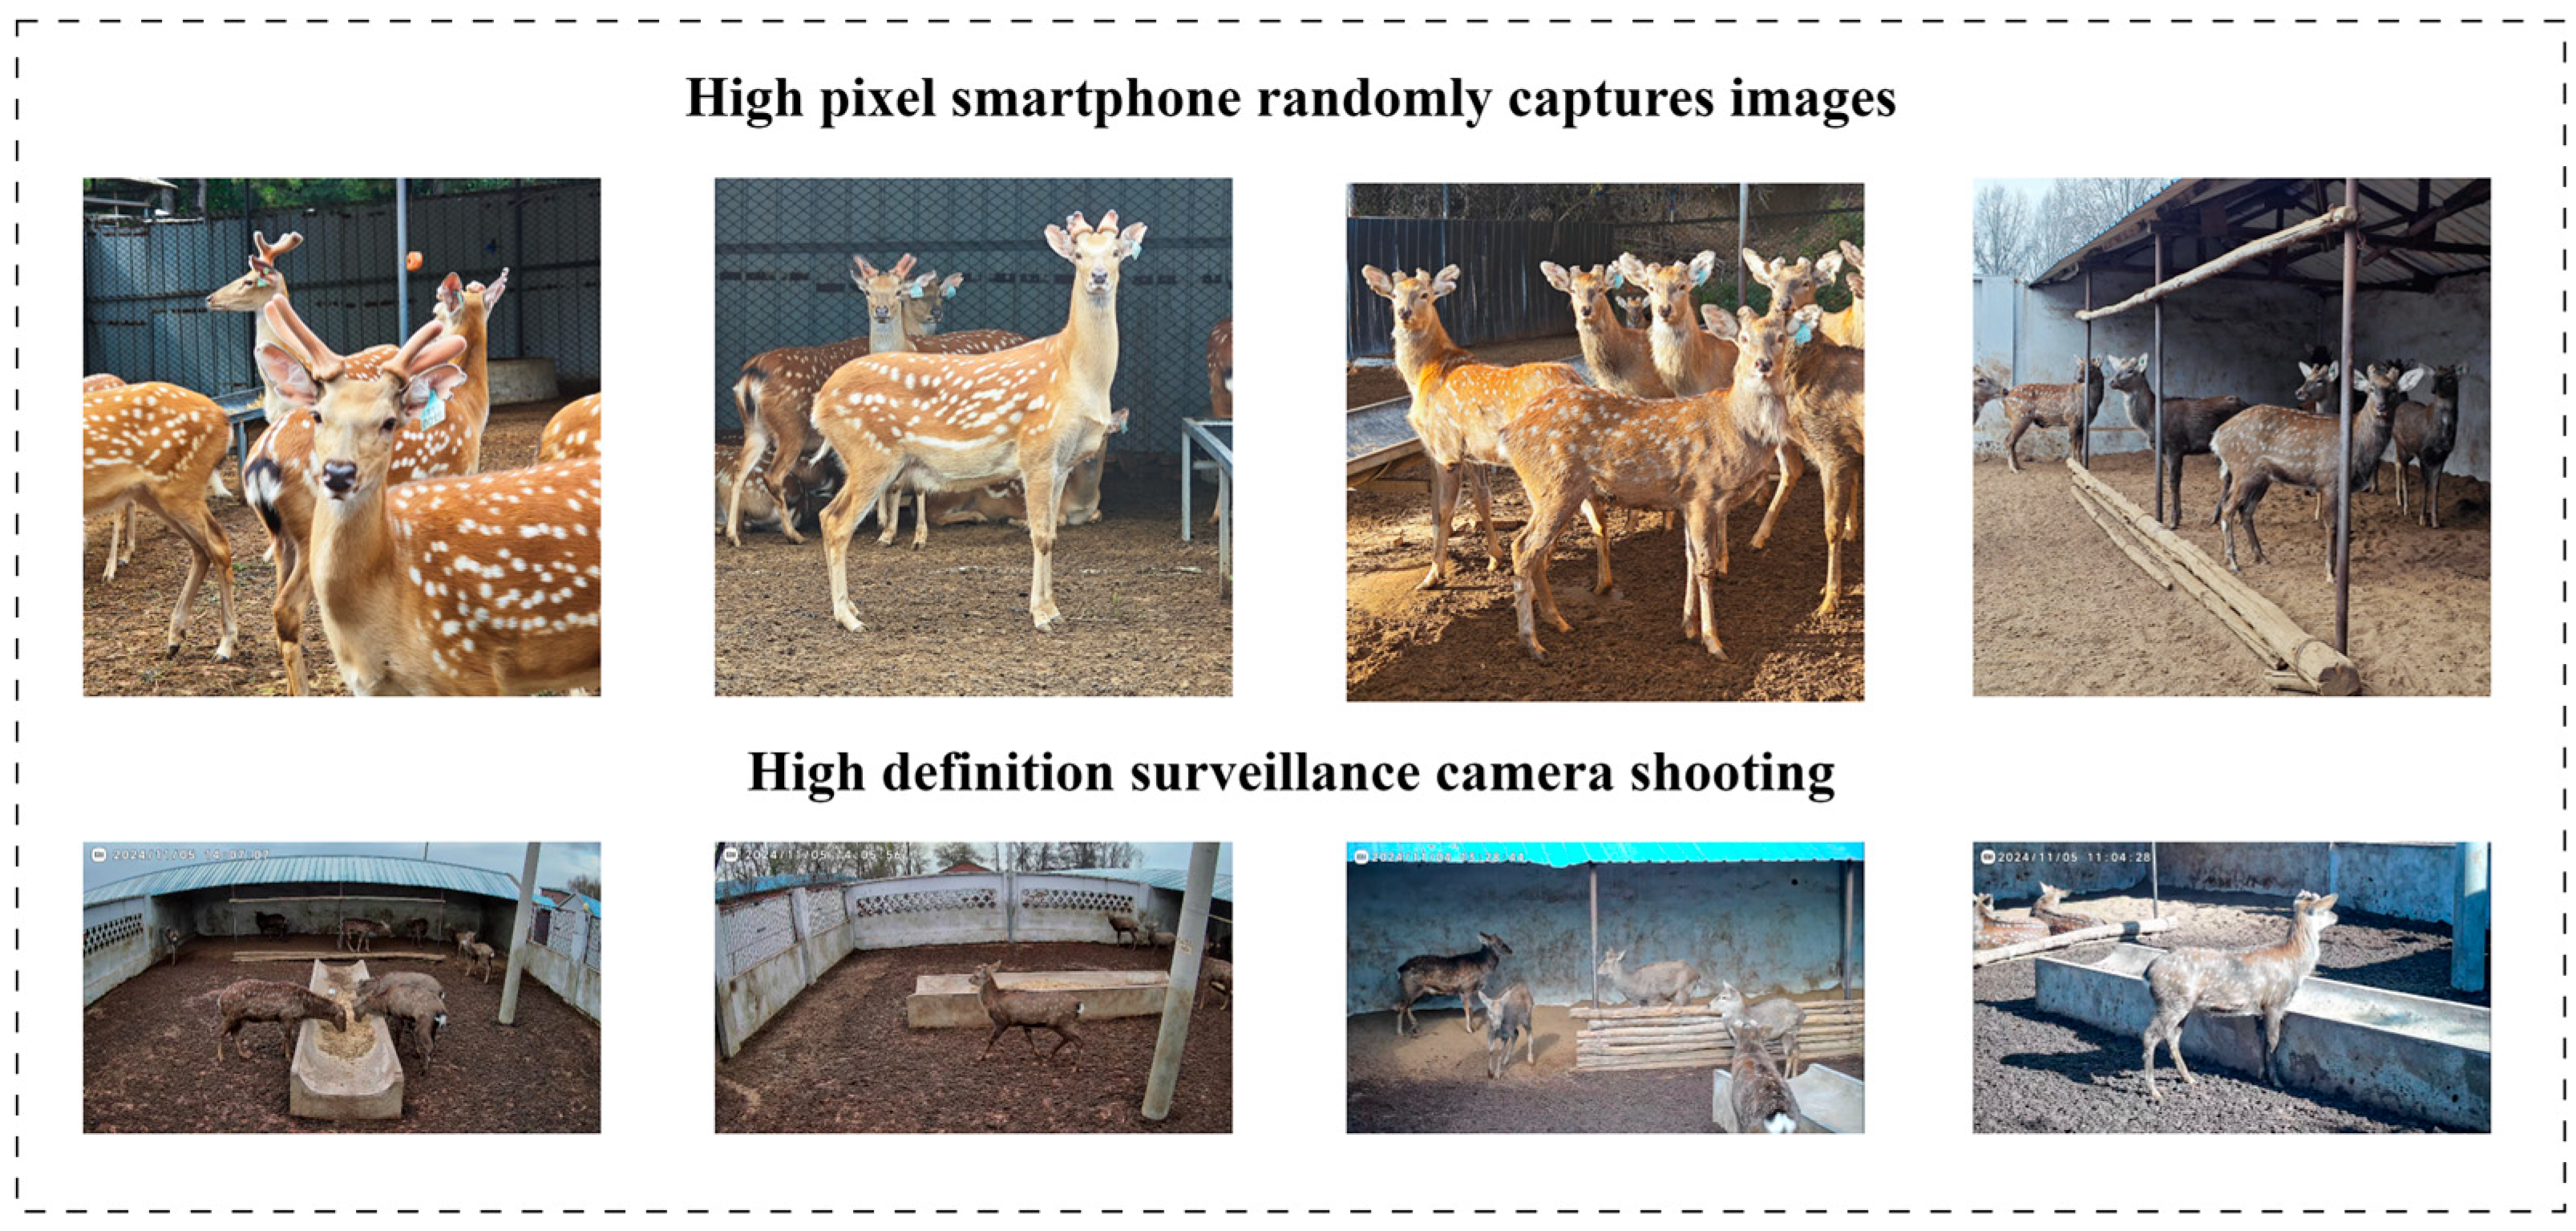
In response to the actual demands in the management of sika deer breeding, the gaps in existing technologies, and the challenges brought by the real environment, this study aims to develop a deep learning model based on YOLO11 to achieve automatic, rapid, and accurate detection of multiple key body parts of sika deer. The parts we focus on include deer antlers, the front of the head, the sides of the head, the front legs, and the hind legs. The selection of these specific body parts is based on their value as key information in the interpretation of the biological characteristics of sika deer, the assessment of their health status, and modern breeding management practices. Precise deer antler detection is the basis for assessing economic value (such as maturity to determine the harvest timing) and provides visual evidence for related automated processes. Accurate identification of the head (side and front) is crucial for interpreting behavioral patterns such as feeding and alertness. Precise leg detection makes automated gait analysis possible, which is conducive to the early diagnosis of health problems such as lameness. This is far superior to traditional observation in ensuring animal welfare and production performance. Therefore, reliable detection of these specific parts is a technical prerequisite for achieving refined, intelligent, and humanized management of sika deer.

2. Materials and Methods

2.1. Dataset

2.1.1. Data Sample Collection

The data collection work of this study was carried out in the intelligent sika deer breeding base of Jilin Agricultural University. This base provides a typical semi-intensive breeding environment for purebred sika deer. To capture the diverse visual information of sika deer in their natural state, data collection mainly relies on researchers conducting random snapshots using high-pixel smartphones (the focal length is 23 mm, the sensor’s native pixel size is 0.8 microns, and the total sensor pixels are 54 million) during their daily management patrols. This approach greatly enriches the perspective, distance, and scene of the image data, and can flexibly capture various instantaneous postures and behavioral details of the sika deer. This is an angle and close-up shot that are difficult to be covered by fixed cameras. As a supplement, high-definition surveillance cameras have also been deployed at key locations within the base (food troughs, rest areas) to record videos at regular intervals, obtaining image data at different time periods (covering from dawn to dusk) and fixed locations, serving as a supplement to the mobile phone capture data. Some representative images are shown in Figure 1. The entire data collection process ran from May 2024 to March 2025, covering different seasonal changes, and strictly adhered to the principles of non-contact and non-intrusion to ensure that the interference to sika deer was minimized. A large amount of original image and video materials collected were then carefully screened. Based on clarity and content diversity (covering different individuals, postures, lighting, backgrounds, and occlusion situations), low-quality and highly redundant samples were eliminated. Finally, a dataset of 1025 high-quality images were sorted out and randomly divided into the training set and the validation set in an 8:2 ratio. The dataset was then used for subsequent model training and evaluation.

2.1.2. Data Augmentation

To significantly improve the generalization ability and robustness of the model and effectively reduce the risk of overfitting [17], we only applied a series of data augmentation strategies to the training dataset, while keeping the validation set in its original state to ensure the objectivity of the model evaluation. We applied random rotations within the range of 10° to 20° to the training images to simulate different shooting perspectives and target tilts. Random cropping was implemented, which not only forces the model to focus on the local area information of the image, but also enables it to better adapt to the natural changes of the target scale. Random Gaussian noise was superimposed to enhance the model’s resistance to the degradation of image quality under sensor noise. Random horizontal and vertical translations within ± 20% of the image size were applied to simulate the slight and natural changes in the position of the target in the field of view. By comprehensively applying the above-mentioned geometric transformation and noise techniques, we effectively increased the representational richness of the training data and expanded the number of original training samples by four times. Figure 2 visually presents an example of the image after representative enhancement operations such as rotation, cropping, noise addition, and translation. Meanwhile, Table 1 makes a detailed comparison of the quantity distribution of each target instance (such as deer antler, head, etc.) in the training set and the validation set before and after the application of data augmentation.

2.2. Model Improvement

Although YOLO11 [18], as a current advanced object detection framework, has demonstrated outstanding performance in general object detection tasks, applying it directly to our specific precise detection tasks of key body parts of sika deer, especially in real farm environments with varying lighting, complex backgrounds, diverse object scales, and frequent occlusion, still faces many challenges. The standard model may have optimization space in aspects such as the balance between the fine granularity of feature representation and global context capture, the effective fusion of multi-scale features, and the positioning accuracy of difficult samples (such as small targets or partially occluded targets). Furthermore, considering the possibility of future deployment on resource-constrained edge computing devices, clear requirements have also been put forward for the computational efficiency and lightweight of the model. Therefore, in order to create a detection model that better meets the requirements of this task and achieves a better balance among accuracy, robustness, and efficiency, we have made targeted improvements to the architecture of YOLO11 in three key aspects, as shown in Figure 3. The overall structure consists of the backbone network, the neck network, and the detection head. These improvements respectively focus on designing a more efficient and feature-expressing lightweight backbone network to replace the original backbone structure; optimize the spatial pyramid pooling module in the neck network, aiming to more effectively aggregate multi-scale spatial context information; and introduce an advanced bounding box regression loss function to improve the positioning accuracy, especially the processing ability for samples of different qualities. The following sections will elaborate in detail on the specific principles and implementation methods of these three improvements one by one.

2.2.1. MobileNetV4HybridSmall

To effectively balance the demands for computational efficiency and feature extraction ability in the detection task of specific parts of sika deer, we have made crucial improvements to the backbone network of the original YOLO11 model. We did not directly adopt the standard MobileNetV4 [19]. Instead, based on its design concept, we proposed and implemented a more compact customized version—MobileNetV4HybridSmall. The core idea of this new backbone network lies in integrating efficient convolution with a lightweight self-attention mechanism, aiming to capture rich local details and key global context information at a lower computational cost. Its overall structure is shown in Figure 4.
MobileNetV4HybridSmall ingeniously combines multiple advanced modules. In the shallow stage of the network, it relies on standard convolution and optimized universal inverted residual blocks (UIB) to efficiently extract the basic local visual features. In particular, by introducing a dynamic kernel size selection mechanism and establishing a parametry-sharing path between the depth-separable convolution [20] of 3 × 3 and 5 × 5 , the model can adaptively adjust the receptive field size, enhancing the ability to capture local patterns at different scales. In the middle and high-level stages of the network (for example, when dealing with feature maps of 40 × 40 and 20 × 20 resolutions), lightweight multi-query attention (MQA) modules are strategically embedded, the formula is as follows:
A t t e n t i o n Q i , K s h a r e d , V s h a r e d = s o f t m a x Q i K s h a r e d T d k V s h a r e d
MQA effectively establishes long-distance dependencies in the spatial dimension through the multi-head grouped attention mechanism, enhances global semantic perception, and significantly reduces the computational complexity of the traditional self-attention mechanism by using learnable downsampling gating. This alternating stacking design of convolution and attention enables the network to capture fine-grained texture details and macroscopic context associations simultaneously and efficiently.
To further enhance the feature quality and integrate with the YOLO11 detection framework, we have made adaptation adjustments to the output layer of MobileNetV4HybridSmall. The final output feature map of the original model retains high-semantic abstract information after Layer4 (outputs a 20 × 20 feature map under a 160 × 160 input), forming a natural connection with the multi-scale detection head of YOLO11. Furthermore, the model utilizes 1 × 1 convolution to dynamically adjust the channel dimension to ensure that the outputs at each level are compatible with the Path Aggregation Network (PANet) [21]. The lightweight feature of MobileNetV4HybridSmall runs through it all. By precisely controlling the channel expansion factors of UIB blocks in each layer (using a 4.0 expansion ratio for deep layers) and widely applying depth-separable convolution, the number of parameters and computational requirements have been significantly reduced. Compared with the original YOLO11 backbone, the parameter count of MobileNetV4HybridSmall has decreased by approximately 40%. However, this improvement in efficiency has not come at the expense of performance. For example, the introduction of using 4-head attention and 64-dimensional key-value pairs to model the global context in Layer4 significantly enhances the model’s responsiveness to key regions. This enables the improved model to maintain or even enhance the real-time reasoning speed while significantly improving the detection accuracy and generalization ability in complex scenes (especially when there are occlusions and small targets), providing an efficient and reliable backbone network solution for resource-constrained edge vision tasks.

2.2.2. SPPFMscale

In order to further enhance the feature extraction ability of the model for targets of different scales and optimize the computational efficiency, we have improved the standard fast spatial pyramid pooling (SPPF) module used in YOLO11 and proposed a multi-scale fast spatial pyramid pooling module, named SPPFMscale. The standard SPPF module efficiently increases the receptive field and fuses multi-scale information by serializing multiple Max pooling layers with the same core size. Although this design is effective and computationally friendly, we believe that directly using pooling kernels of different sizes may capture diverse spatial context information more clearly. Meanwhile, combined with lightweight convolution operations, the model complexity can be further reduced. The core structure of the SPPFMscale module is shown in Figure 5.
Unlike the standard SPPF, we have proposed two main changes. Firstly, in the design of the pooling layer, we did not adopt the repetitive 5 × 5 Max pooling. Instead, we successively used three Max pooling layers with different core sizes in series. The core sizes were k = 3 , k = 5 , and k = 7 respectively, and the step size was s = 1 . And perform the corresponding padding ( p a d d i n g = k ÷ 2 ) to maintain the spatial resolution of the feature map. Specifically, given the input feature map Y 0 , the cascading pooling process can be expressed as:
Y 1 = MaxPool 3 × 3 Y 0 stride = 1 ,   padding = 1
Y 2 = MaxPool 5 × 5 Y 1 stride = 1 ,   padding = 2
Y 3 = MaxPool 7 × 7 Y 2 stride = 1 ,   padding = 3
This design aims to capture multi-scale features ranging from fine granularity to coarser granularity directly through pooling windows of different sizes. Secondly, in order to improve the computational efficiency and reduce the number of model parameters, we replace both the initial convolution used for channel transformation and the final convolution used for feature fusion with depth-separable convolution (DWConv). Let the number of input channels be C 1 , the number of intermediate channels be C 3 , the number of output channels be C 2 , and the size of the convolution kernel be K . Then, the number of standard convolution parameters is:
P s t d = C 1 × C 3 × K 2 + C 3 × C 2 × K 2
The depth-separable convolution decomposes it into deep convolution and pointwise convolution, with the number of parameters being:
P D = C 3 × K 2 DW + C 3 × C 2 PW
The reduction ratio of the number of parameters is:
η = 1 K 2 + C 2 C 1 K 2 + C 2 K 2
When C 1 = C 2 = 512 and then K = 1 , the computing cost is reduced by approximately 89%. Specifically, first, depth-separable convolution is used to adjust the input feature channels from C 1 to c 3 . Subsequently, cascade pooling operations of 3 × 3 , 5 × 5 , and 7 × 7 are sequentially performed on the adjusted features. Each pooling operation acts on the output of the previous step rather than the original input. In this way, the receptive field is equivalently expanded in a step-by-step superposition manner. Finally, the initial features are concatenated with the results of the three pooling operations along the channel dimension, and then compressed to the target channel c 2 through another layer of depth-separable convolution. Through these two key improvements—that is, directly capturing diverse contexts with multi-scale pooling kernels and optimizing computational efficiency with depth-separable convolution—SPPFMscale aims to provide a solution that achieves a better balance between feature fusion capabilities and model lightweighting for the specific part detection task of sika deer. We will quantitatively evaluate the specific contribution of the SPPFMscale to the overall performance of the model in the subsequent ablation experiment section.

2.2.3. WIoU v3

To enhance the robustness of bounding box regression, especially when dealing with samples with significant quality differences (such as small targets, occluding targets, or easily detectable large targets), this paper adopts the WIoU v3 loss function [22] instead of the CIoU loss default to YOLO11. Traditional IoU and its variants (such as CIoU [23], DIoU [24], and GIoU [25]) have potential problems in gradient distribution: The gradients generated by high-quality samples (with high IoU values) often dominate the optimization direction, which may inhibit the model’s ability to learn from ordinary quality samples; meanwhile, the gradient noise generated by low-quality samples (with low IoU values, which may correspond to difficult samples) sometimes interferes with the training process and damages the generalization performance of the model. WIoU v3 aims to balance the contributions of samples of different qualities to model optimization more intelligently by introducing a dynamic and non-monotonic gradient focusing mechanism.
The core of WIoU v3 lies in its sample quality assessment based on outlierness. Firstly, the outlierness of the anchor box is defined as the quality assessment index:
β = L IoU L IoU ¯ , L IoU = 1 I o U B pred , B gt
where L I o U is the global average loss of the exponential moving average (EMA), which is dynamically updated by the momentum coefficient m :
L IoU t ¯ = m L IoU t 1 ¯ + 1 m L IoU t
Outlier β anchor boxes are classified into three categories: β < 1 high-quality samples (with losses below the average level), β = 1 normal-quality samples, and β > 1 low-quality outliers. Based on this, WIoU v3 constructs non-monotonic gradient gain coefficients r and dynamically adjusts the loss weights:
r = β δ α β δ , α > 1 , δ > 0
Among them δ is the peak position parameter of the gain (default δ = 1.9 ), and the α control gain decay rate (default α = 3 ). When β = δ this function reaches its maximum value r = 1 , the gradient gain is suppressed for both the β < δ high-quality samples and the β > δ low-quality samples (as shown in Figure 6).
Finally, the WIoU v3 loss function is defined as:
L W I o U   v 3 = r R WIoU L IoU
The distance attention penalty term inherited from WIoU v1 in the formula R WIoU :
R W I o U = exp x pred x gt 2 + y pred y gt 2 w gt 2 + h gt 2 / 4
This penalty item amplifies the influence of positioning deviation on the loss through the normalized distance between the center point of the anchor box and the center point of the real box.
WIoU v3 integrates the advantages of the previous two versions: from introducing the distance attention mechanism in WIoU v1 to enhance spatial sensitivity, to v2 drawing on the dynamic normalization idea of Focal Loss, v3 finally achieves adaptive gradient allocation without the need for manual preset thresholds through β dynamic partitioning and r non-monotony design. The key L I o U lies in the EMA update mechanism, which enables the model to perceive the distribution changes of the overall sample quality during the training process. Furthermore, WIoU v3 usually has a lower computational complexity and avoids the optimization deviation that may be caused by the solidification of geometric assumptions in loss functions such as CIoU not matching the actual scenarios. Therefore, the adoption of WIoU v3 is expected to achieve more accurate and robust bounding box localization in the task of detecting specific parts of sika deer, especially when facing targets with different sizes, occlusion degrees, and background complexities.

2.3. Evaluation Indicators

The evaluation of the detection performance of MFFW-YOLO mainly relies on the precision rate (P), recall rate (R), and mean average precision (mAP). Precision (P) measures the proportion of correct predictions made by a model, reflecting the model’s ability to distinguish between the background and the target. The recall rate (R) measures the model’s ability to find all targets. While mAP integrates precision and recall, it is the core indicator for measuring the overall performance of the model. The commonly used one specifically is mAP50, which calculates the mean of the average precision (AP) of all categories when the intersection and union ratio (IoU) threshold is 0.5, representing the performance of the model under relatively loose positioning requirements. The stricter indicator is mAP50-95, which calculates the average of a series of mAP values with IoU thresholds ranging from 0.5 to 0.95 (step size 0.05), and can evaluate the comprehensive detection ability of the model under different positioning accuracy requirements more comprehensively. The calculation formulas of the above indicators are as follows:
P = T P T P + F P ; R = T P T P + F N
A P = 0 1 p r d r ; m A P = I = 1 N A P i N

3. Experimental Results and Analysis

3.1. Experimental Environment and Parameter Settings

The MFFW-YOLO model proposed in this study is implemented based on the PyTorch deep learning framework and the model development and training are completed in the Anaconda environment. The experimental environment configuration includes hardware platforms and software dependencies. For specific parameters, please refer to Table 2. The complete configuration scheme of the hyperparameter combinations adopted in the model training stage is listed in Table 3.

3.2. Experimental Results of the MFW-YOLO Model

Figure 7 shows the variation curves of key indicators of the MFFW-YOLO model during the training process. The figure contains the loss function values of the training set and the validation set, as well as the evolution of the performance metrics (P, R, mAP50, and MAP50-95) evaluated on the validation set with the number of training rounds. It can be observed that each loss value drops rapidly in the early stage of training and then stabilizes, indicating that the model effectively learns features from the training data. Meanwhile, the performance indicators such as mAP on the validation set also showed a trend of rapid increase followed by gradual saturation, and eventually converged to a relatively high level. mAP50 was stable at around 90%, which confirmed that the model achieved good detection performance through training, and the training process was stable without overfitting.
Figure 8 shows the variation of the comprehensive performance index F1 score of MFFW-YOLO under different confidence thresholds. The F1 score, as the harmonic mean of precision and recall, can balance the precision and recall capabilities of the evaluation model. The curve shows that with the increase of the confidence threshold, the F1 score gradually rises at first and begins to decline after reaching a peak point of 0.8. The confidence threshold corresponding to this peak value represents that, under this setting, the model can achieve the best balance between the precision rate and the recall rate, thereby achieving the optimal overall detection effect.
Figure 9 presents the P-R curves for each detection category (deer antler, front of the head, side of the head, front legs, hind legs). The area under each curve is the average accuracy of this category. The closer the curve is to the upper right corner of the graph, the more superior the detection performance of this category is; that is, it can achieve a high recall rate while maintaining a high precision rate. By comparing the P-R curves of different categories and the corresponding AP values, the differences in the model’s recognition ability for each specific body part of the sika deer can be clearly evaluated, and the overall average performance level (mAP50) of the model can be understood.
Figure 10 shows the confusion matrix of the model on the validation set, which visually reveals the classification accuracy of the model for each category and the existing confusion situations. The diagonal elements of the matrix represent the proportion (or quantity) of samples that are correctly classified, while the non-diagonal elements indicate the situation where the model wrongly predicts instances of one category as those of another. By observing the matrix, we can quantify the recognition accuracy of the model for each specific body part and identify the main confusion patterns. For example, the prediction accuracy of the model on the deer antlers category is relatively low, and it is mainly misjudged as the background category. This is helpful for an in-depth understanding of the specific classification difficulties and potential improvement directions of the model.

3.3. Comparative Experiments of Different Models

To comprehensively evaluate the performance and efficiency of MFW-YOLO, we conducted a series of rigorous comparative experiments. During this process, we conducted a benchmark comparison of MFW-YOLO with several current mainstream real-time object detection architectures. These reference models cover the recently highly concerned RT-DETR series [26], as well as several representative versions of the widely used YOLO series, specifically including YOLOv3 [27], YOLOv5s, YOLOv6 [28], YOLOv8s, YOLOv9c, YOLOv9s [29], YOLOv10s [30], and even the latest YOLO11 and YOLOv12 [31]. All the detailed numerical comparison results are presented in Table 4:
It can be seen from Table 4 that the MFW-YOLO proposed in this paper outperforms the vast majority of comparison models in multiple indicators. Specifically, the improved model achieved 91.9% of mAP50 and 64.5% of MAP50-95, showing a slight improvement compared to its baseline model YOLO11s. More importantly, the memory usage of the improved model is only 12.413 MB, the number of parameters is 5.9 million, the computational cost is 12.8 GFLOPs, and the average inference time is 3.8 ms. These indicators highlight the advantages of the model in this paper in terms of lightweight and computational efficiency. The comparative evaluation not only focuses on the core detection accuracy index, but also comprehensively considers the complexity and efficiency of the model. As shown in Figure 11, MFW-YOLO has achieved the best level in terms of parameter count, computational complexity, and inference speed.
We have noticed that some advanced models, such as the RT-DETR series and the YOLOv9 series, have also achieved quite excellent results in the mAP50 index, but MFW-YOLO is superior in terms of comprehensive performance, as shown in Table 5. When the balance between accuracy and efficiency is comprehensively considered, the model in this paper shows better overall performance. Especially in terms of model volume and computing resource requirements, the advantages of the method proposed in this paper are more prominent, which can be confirmed from the data in Figure 11 and Table 5. This high-efficiency feature is of crucial significance for practical application scenarios that need to be deployed on resource-constrained edge devices and require real-time response.

3.4. Visual Comparison of Test Results

To visually demonstrate the improvement of detection performance of MFW-YOLO compared to the original YOLO11s model, we selected several representative test images containing complex scenes and challenging targets for visual comparative analysis. The results are shown in Figure 12. The selected image scenes cover typical challenges such as small target scale (such as a distant sika deer or tiny deer antlers/legs), partial occlusion (body parts being obscured by other objects or their own structures), poor lighting conditions (overexposure or dimness), and complex background interference (background textures similar to the target).
By comparing the detection results in Figure 12, it can be clearly observed that the improved model proposed in this paper shows more superior performance when dealing with these complex situations. For example, when it comes to small targets or partially occluded targets, the improved model can more accurately locate and identify key parts such as deer antlers and legs, while the original YOLO11s model may have missed detections or large deviations in the positioning box. Furthermore, in scenarios with complex backgrounds or poor lighting, the improved model demonstrates stronger robustness. It can effectively suppress background interference, reduce false detections, and at the same time assign a higher confidence score to the correctly detected targets, indicating that its recognition certainty is higher.
All in all, these visualized comparison results strongly prove the effectiveness of the improvement strategy proposed in this paper, especially in enhancing the practical application performance of the model in real and complex breeding environments.

3.5. Ablation Experiment

To rigorously quantify the specific contributions of each improvement we proposed to the overall performance of the model and verify its effectiveness, we designed and carried out a series of ablation experiments. These experiments, taking YOLO11s as the baseline model, systematically evaluated the impact of introducing and cumulatively superimposing the three key improvements we proposed on the performance of the specific part detection task of sika deer. All experiments were conducted under the same training and testing conditions to ensure the fairness of the comparison. The detailed results are shown in Table 6. The following sections provide an in-depth analysis of each modification.

3.5.1. Performance Impact Analysis of MobileNetV4HybridSmall

Firstly, we evaluated the impact of replacing the backbone network of the original YOLO11 with our designed lightweight hybrid architecture, MobileNetV4HybridSmall. As shown in Table 6, after this replacement, the detection accuracy of the model slightly decreased, but the complexity of the model was significantly reduced. The number of parameters decreased by approximately 32%, and the computational cost (GFLOPs) decreased by approximately 40%. To gain a deeper understanding of the advantages of MobileNetV4HybridSmall, we generated a heatmap of the network, as shown in Figure 13. By comparing the heat maps of the original backbone network and MobileNetV4HybridSmall when processing the same challenging images, it can be clearly seen that MobileNetV4HybridSmall can focus more precisely on the key body parts of the sika deer and has a better suppression effect on background noise. This is attributed to the design of its hybrid convolution and self-attention mechanism, which effectively enhances the discriminative power and localization ability of features. It proves that this backbone network achieves a better balance between efficiency and performance, and is particularly suitable for resource-sensitive application scenarios.

3.5.2. Performance Impact Analysis of SPPFMscale

Next, we analyzed the effect of the SPPFMscale module replacing the original SPPF module. The data in Table 6 show that the introduction of SPPFMscale has slightly reduced mAP50 by 2.6% in the detection accuracy of the model, but its main advantage lies in the optimization of computational efficiency. To more specifically demonstrate the trade-off between efficiency and performance of the SPPFMscale, in Table 7, we directly compare it with the standard SPPF, SPP, and SPPCSPC modules in terms of parameter count, computational power (GFLOPs), and mAP50 performance when integrated separately. The comparison results clearly show that although the SPPFMscale is slightly lower than SPPF and SPPCSPC in the mAP50 metric, it has achieved a significant reduction in model complexity. Specifically, compared with SPPF, the number of parameters has decreased by approximately 89%, and the computational power (GFLOPs) has dropped by approximately 88%. This is attributed to its lightweight design that adopts cascading pooling kernels of different sizes and depth-separable convolution. Therefore, SPPFMscale offers a trade-off between accuracy and efficiency, especially suitable for application scenarios with strict limitations on model size and computing resources. It can significantly reduce the computational burden of the model while maintaining competitive detection performance.

3.5.3. Performance Impact Analysis of WIoU v3

Finally, we evaluated the gain brought by using the WIoU v3 loss function to replace the default bounding box regression loss of the model. It can be seen from Table 6 that after the introduction of WIoU v3, the model performance has been improved; especially in the MAP50-95 index, which has higher requirements for positioning accuracy, the improvement reached 1.3%, and mAP50 has also increased by 0.7%. This proves the effectiveness of WIoU v3 in optimizing bounding box regression. To demonstrate its optimization characteristics more intuitively, we compared the variation curves of mAP50 and MAP50-95 of the model when trained using WIoU v3 and other commonly used loss functions (CIoU, DIoU, GIoU). As shown in Figure 14, the model trained with WIoU v3 ultimately achieves higher performance, which is attributed to its dynamic non-monotone gradient focusing mechanism. It can better balance the gradient contributions of samples of different qualities, thereby achieving more accurate and robust bounding box positioning. This advantage is particularly obvious when dealing with the common parts of sika deer with different sizes and occlusion in this task.

4. Discussion

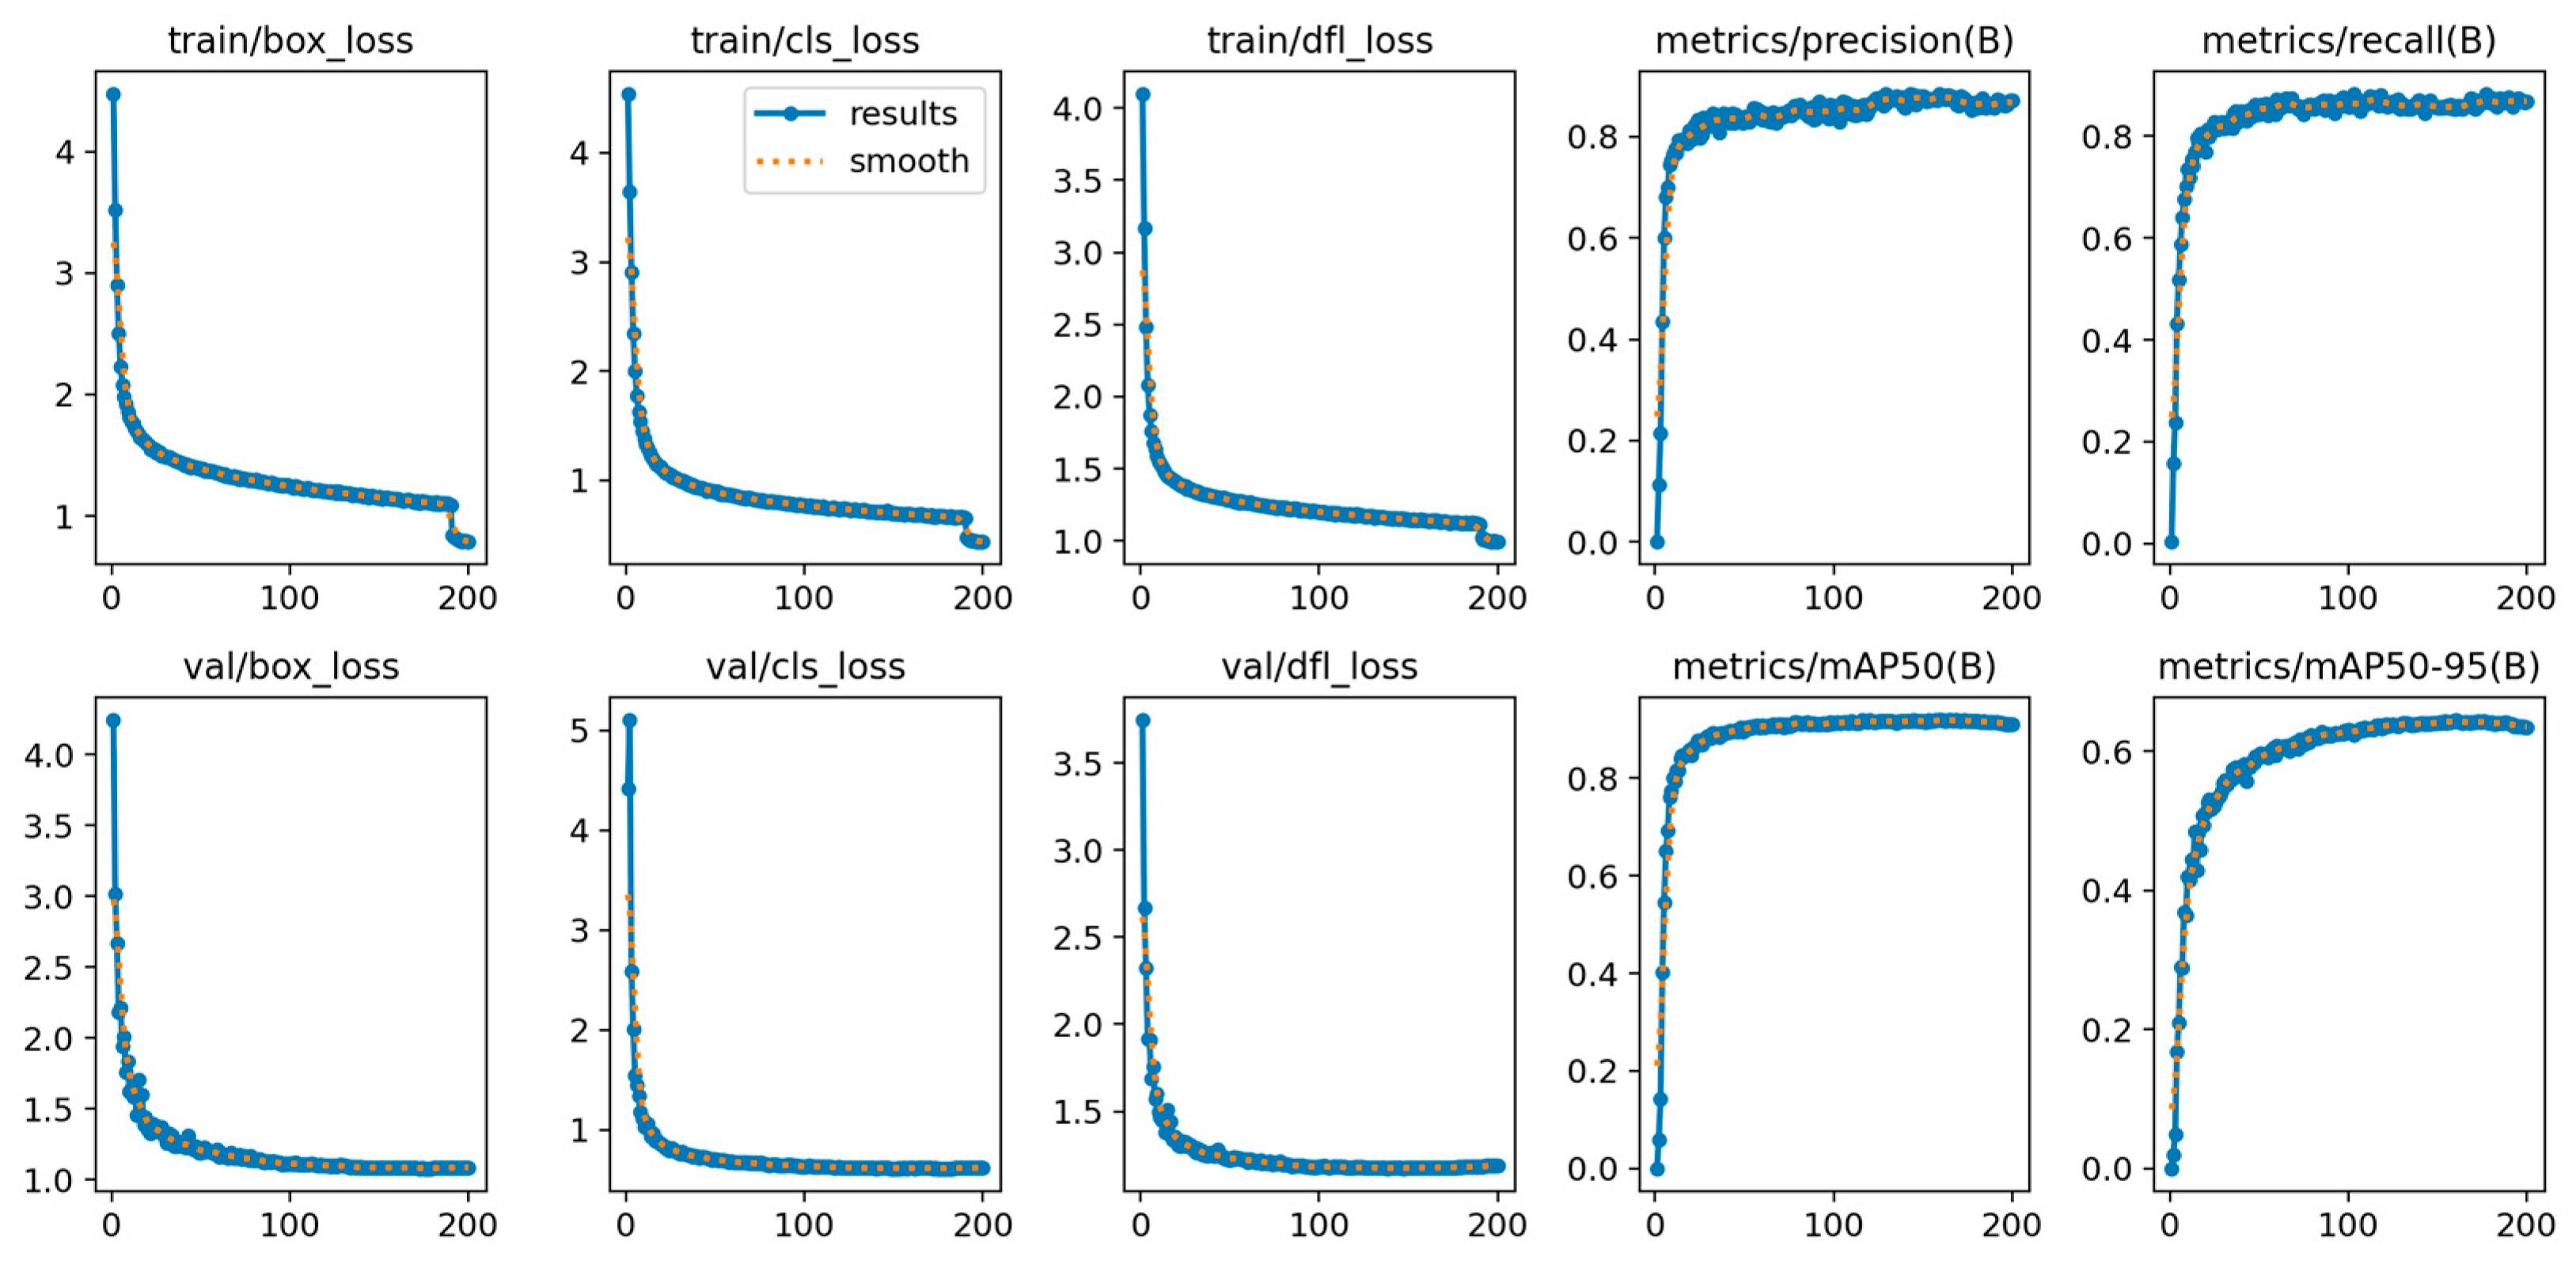
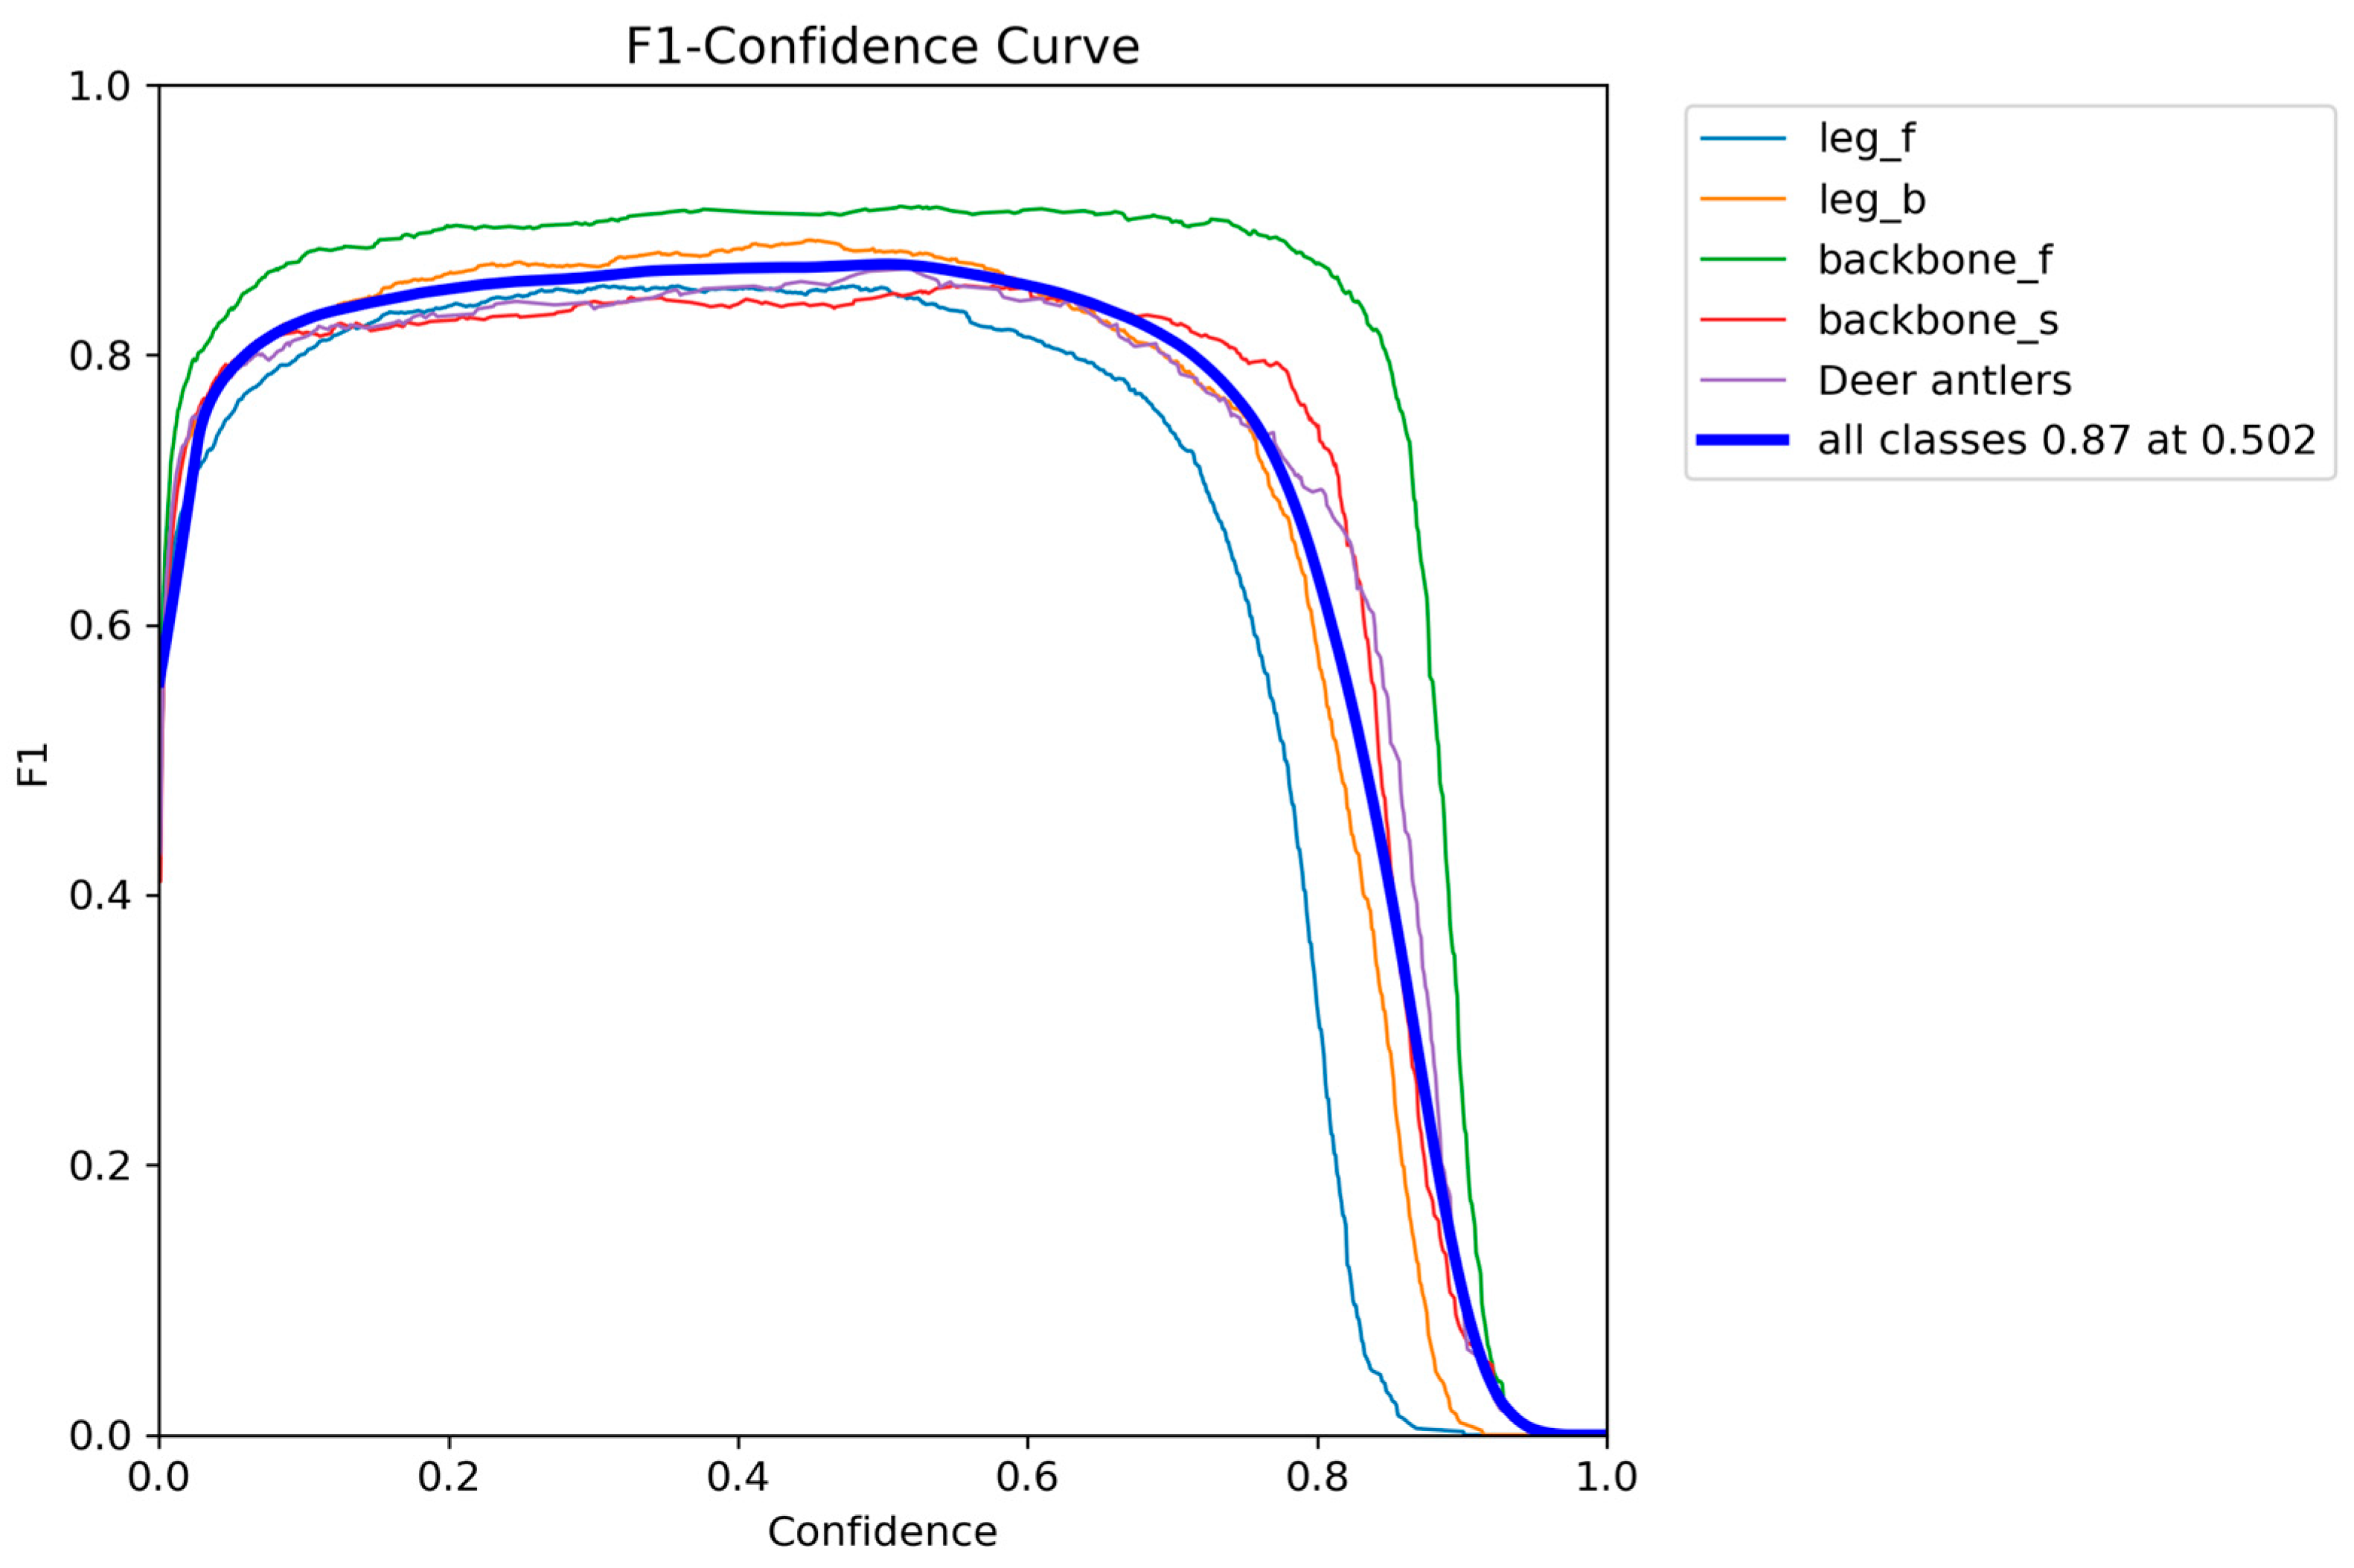
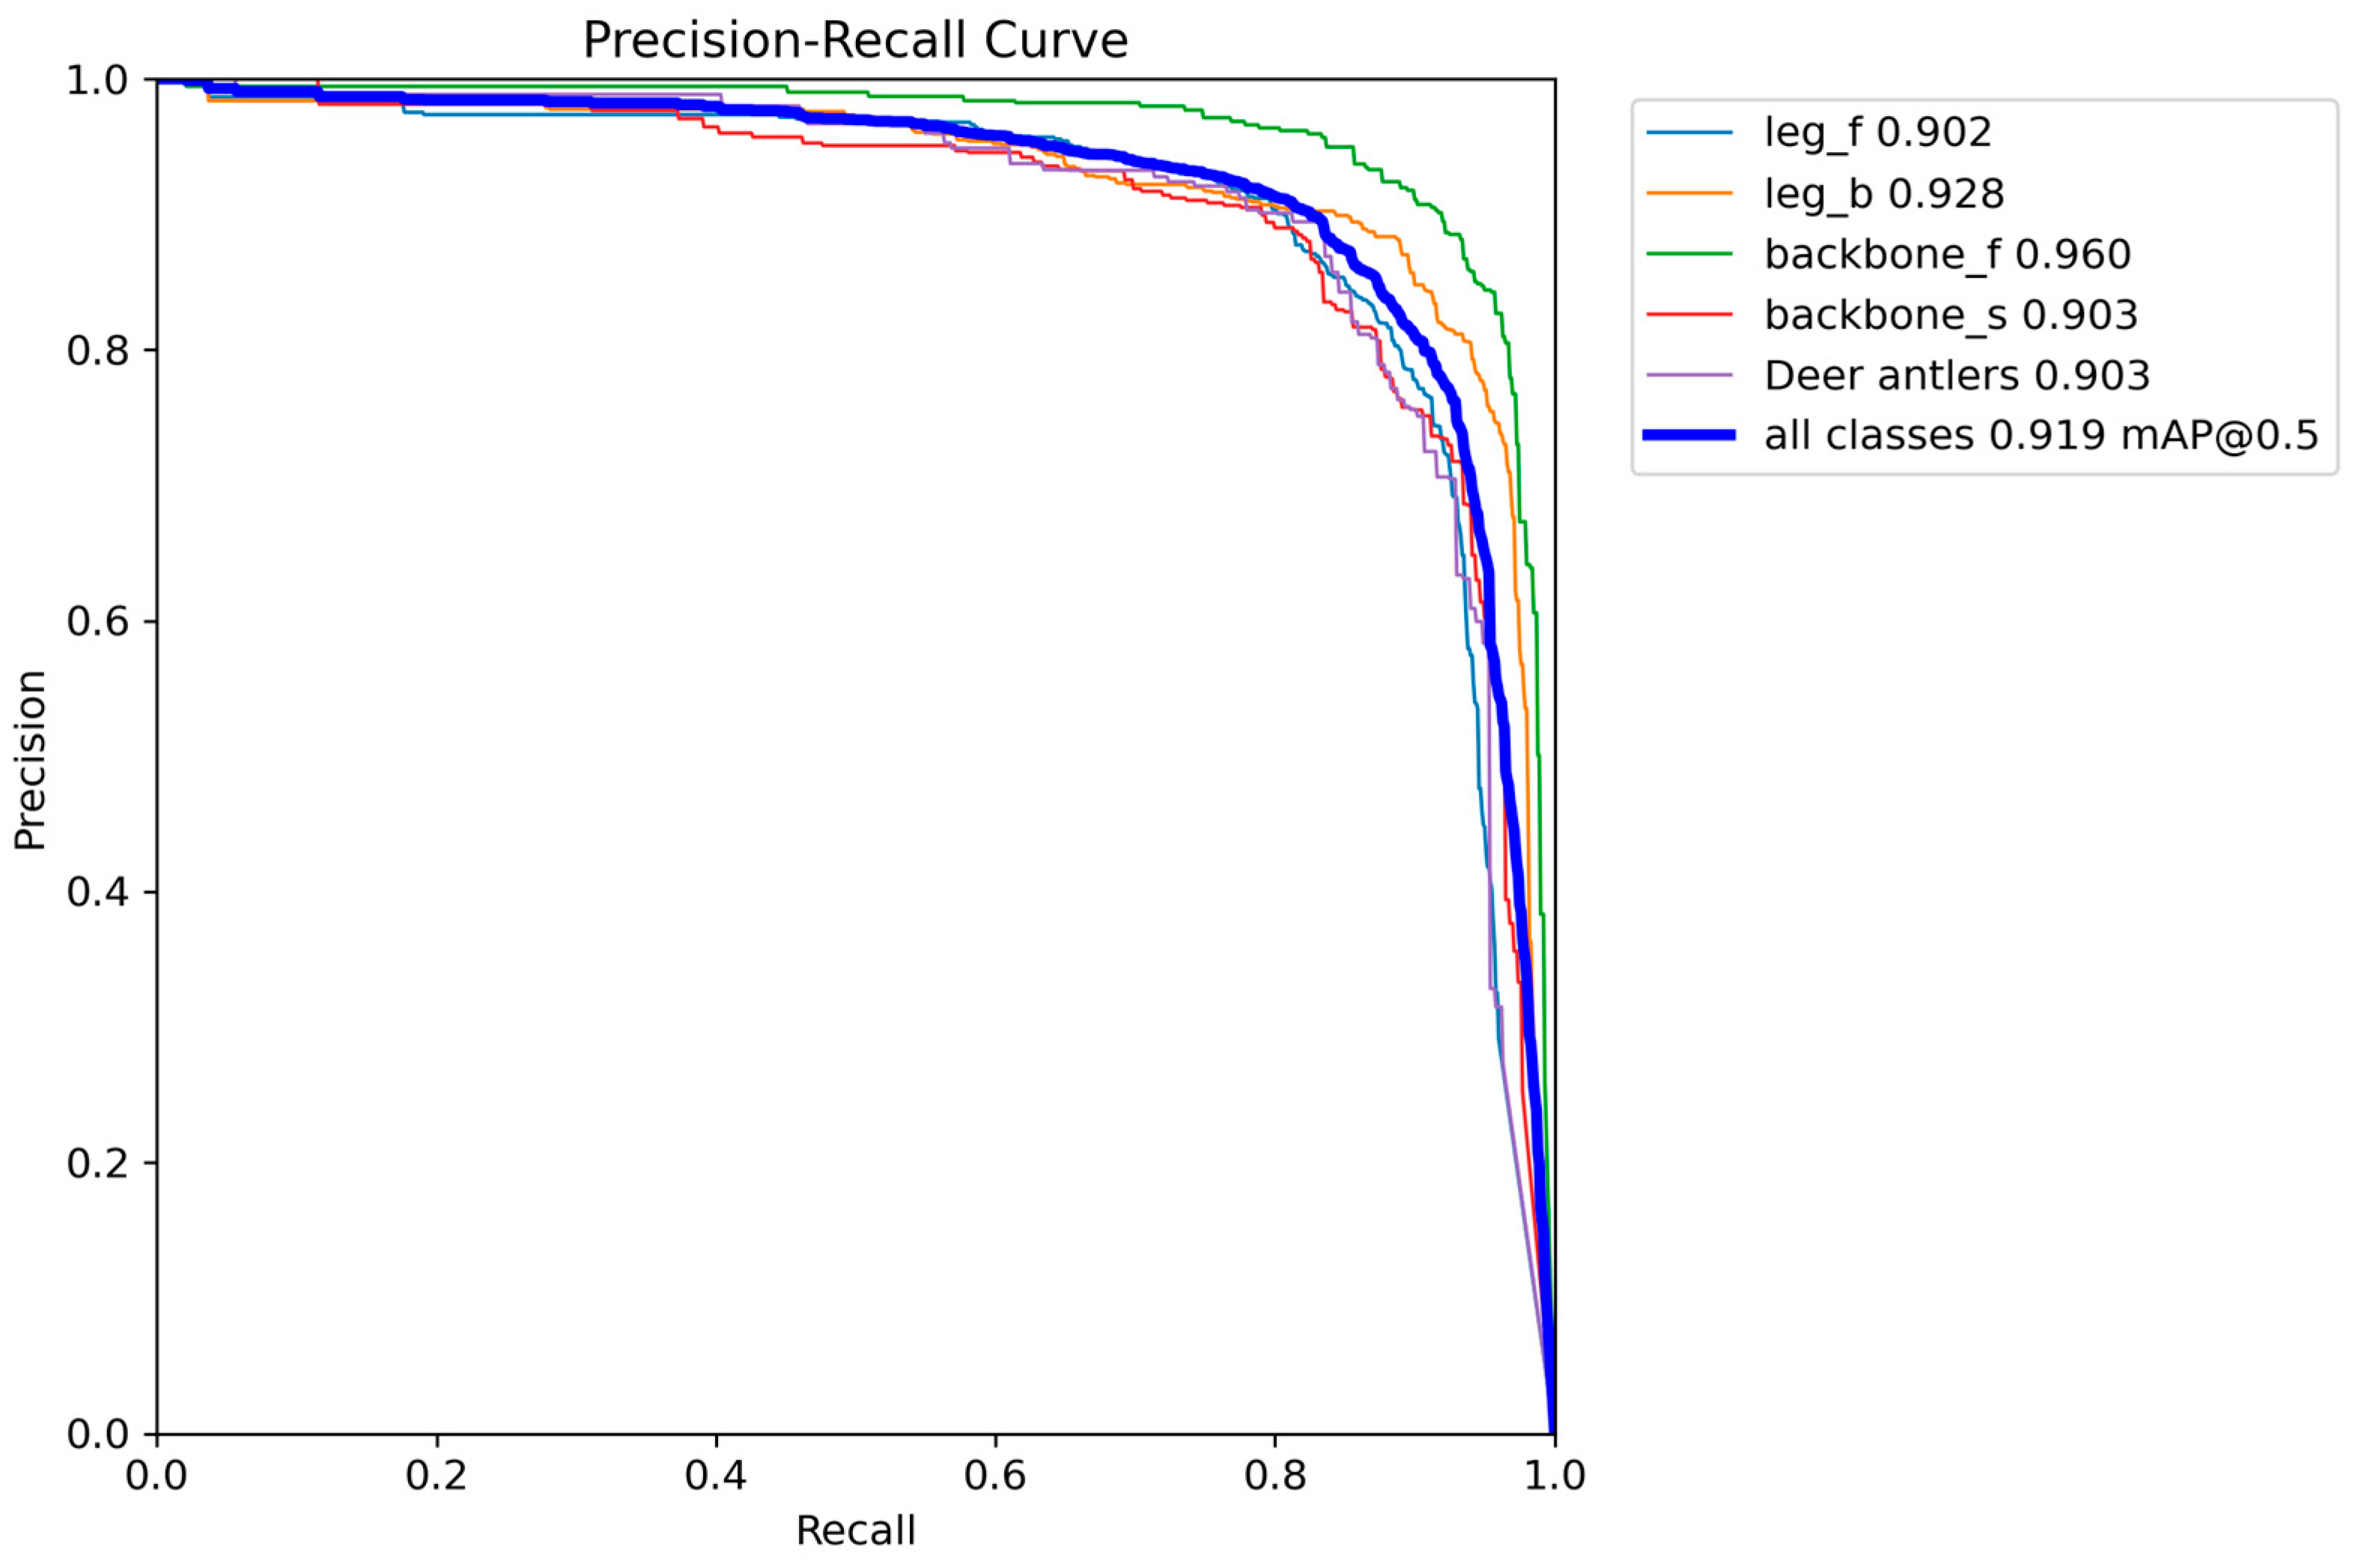
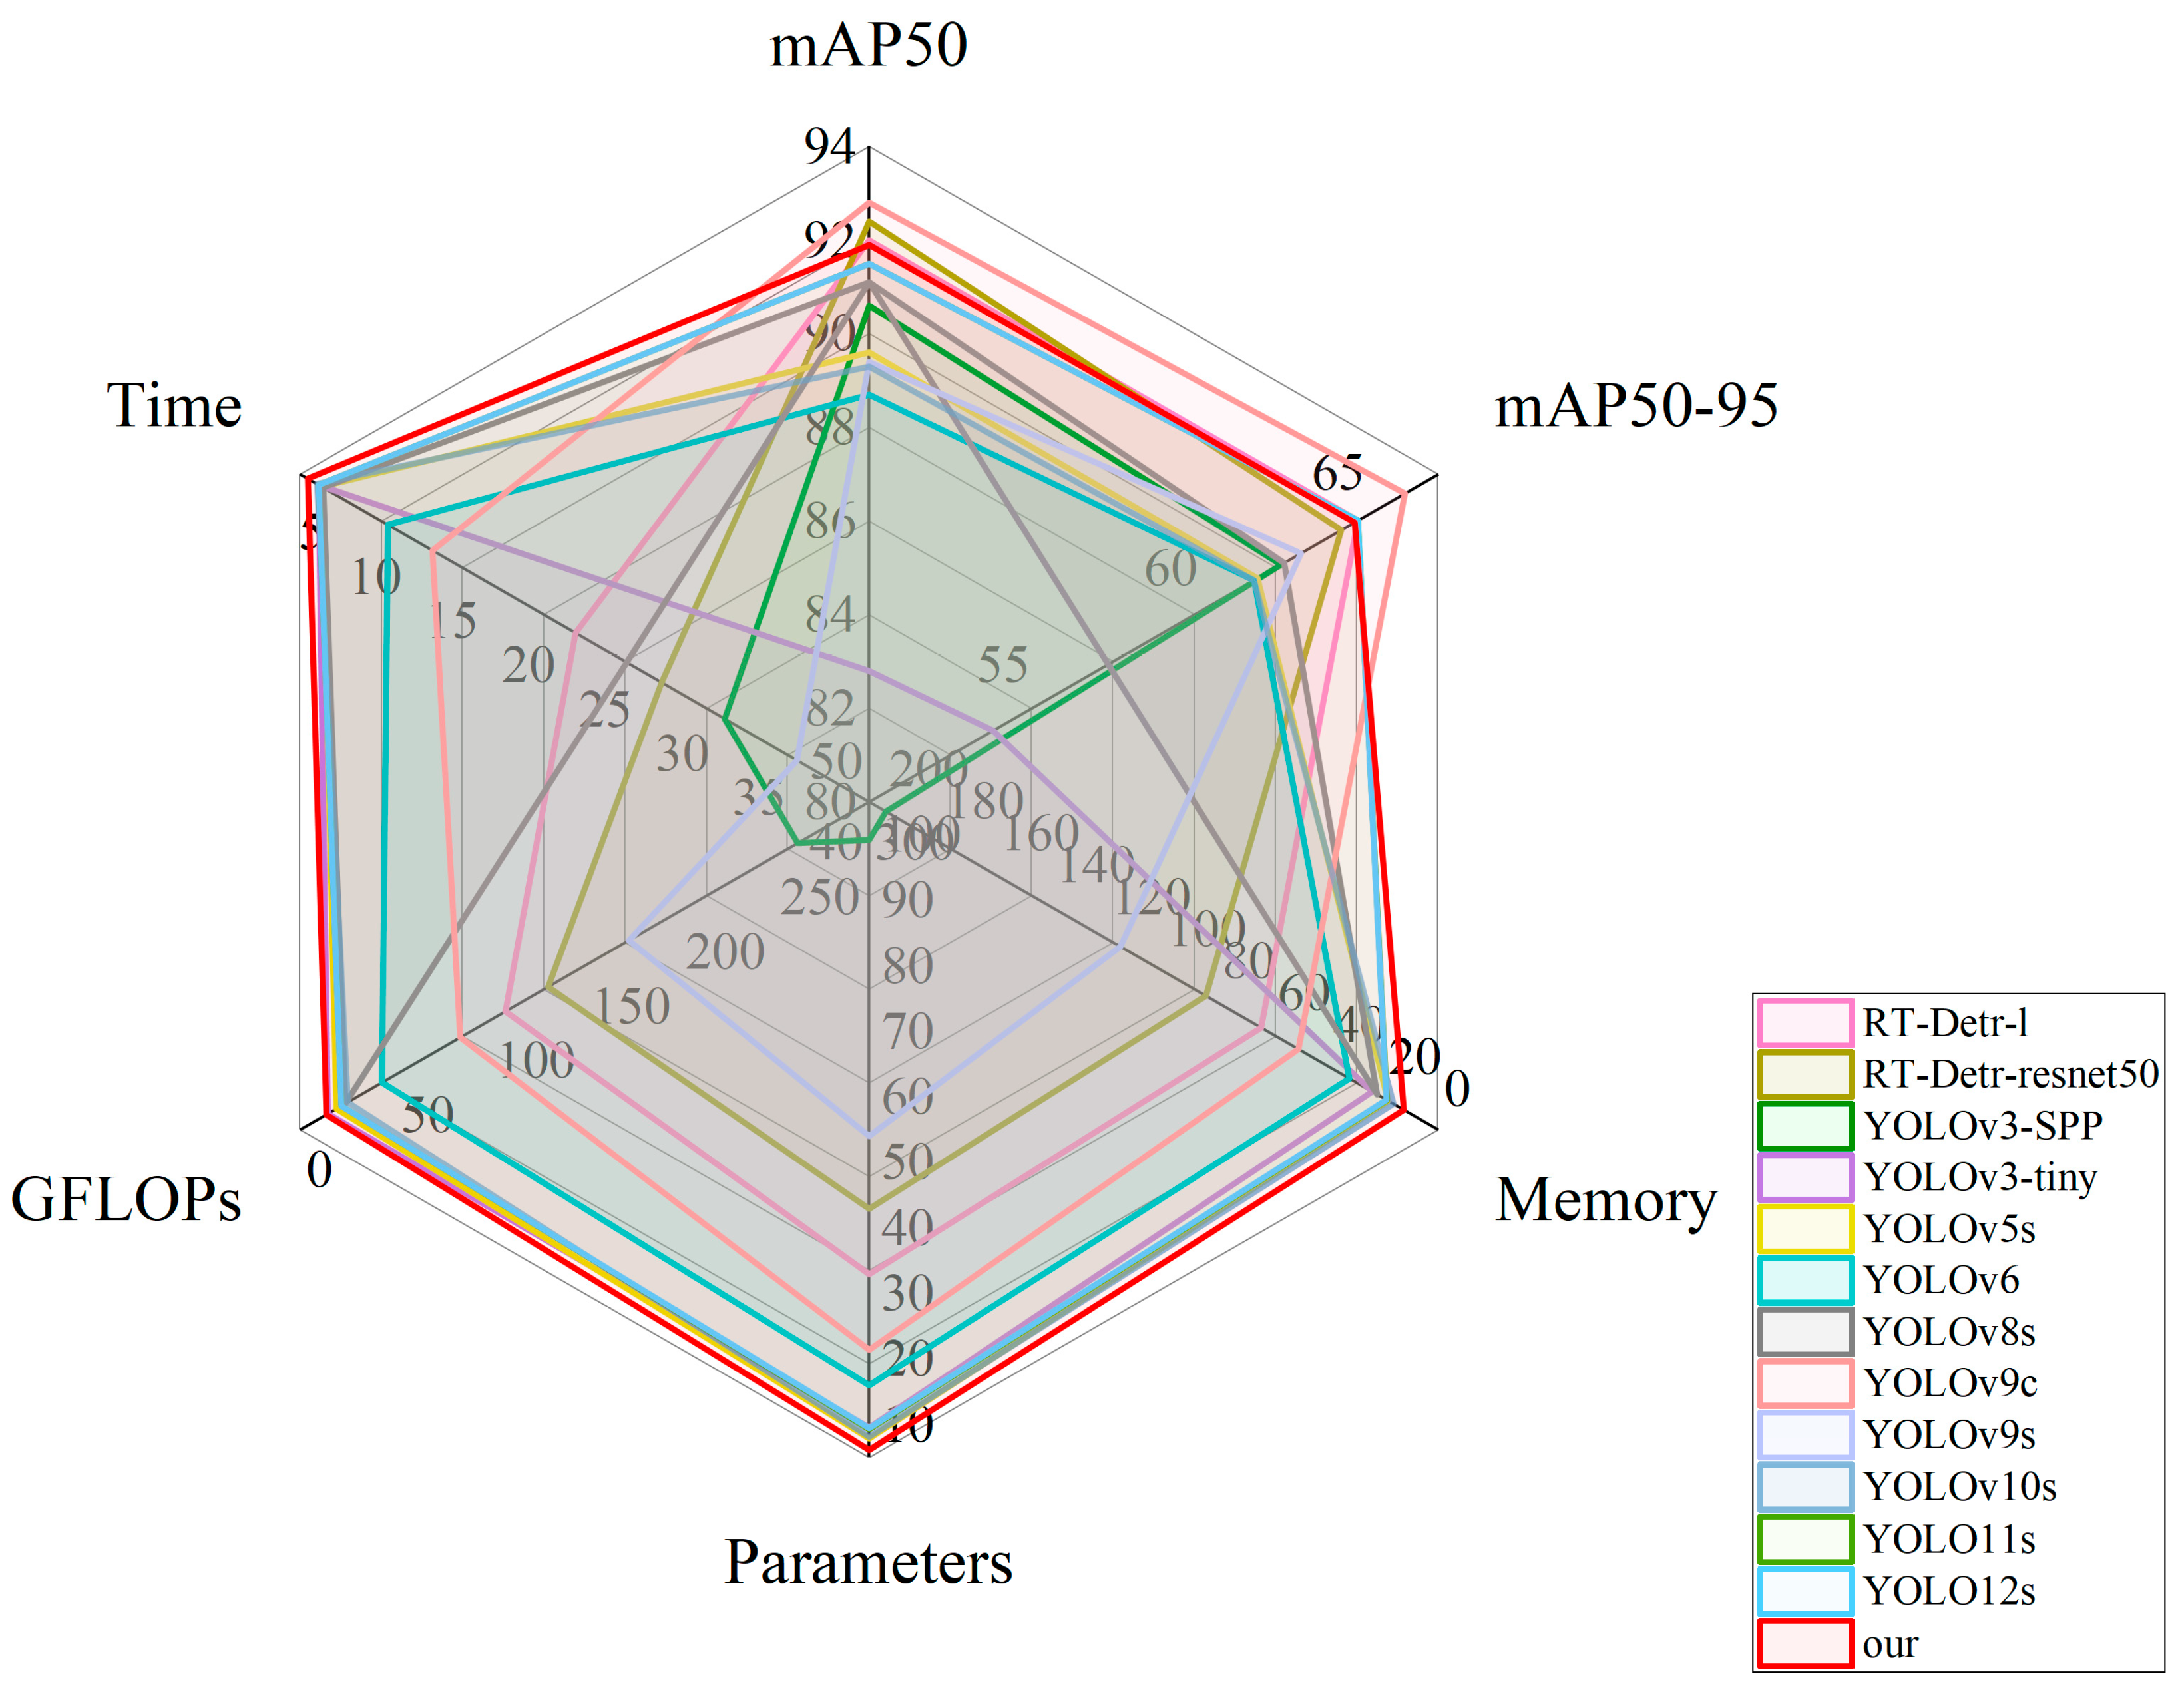
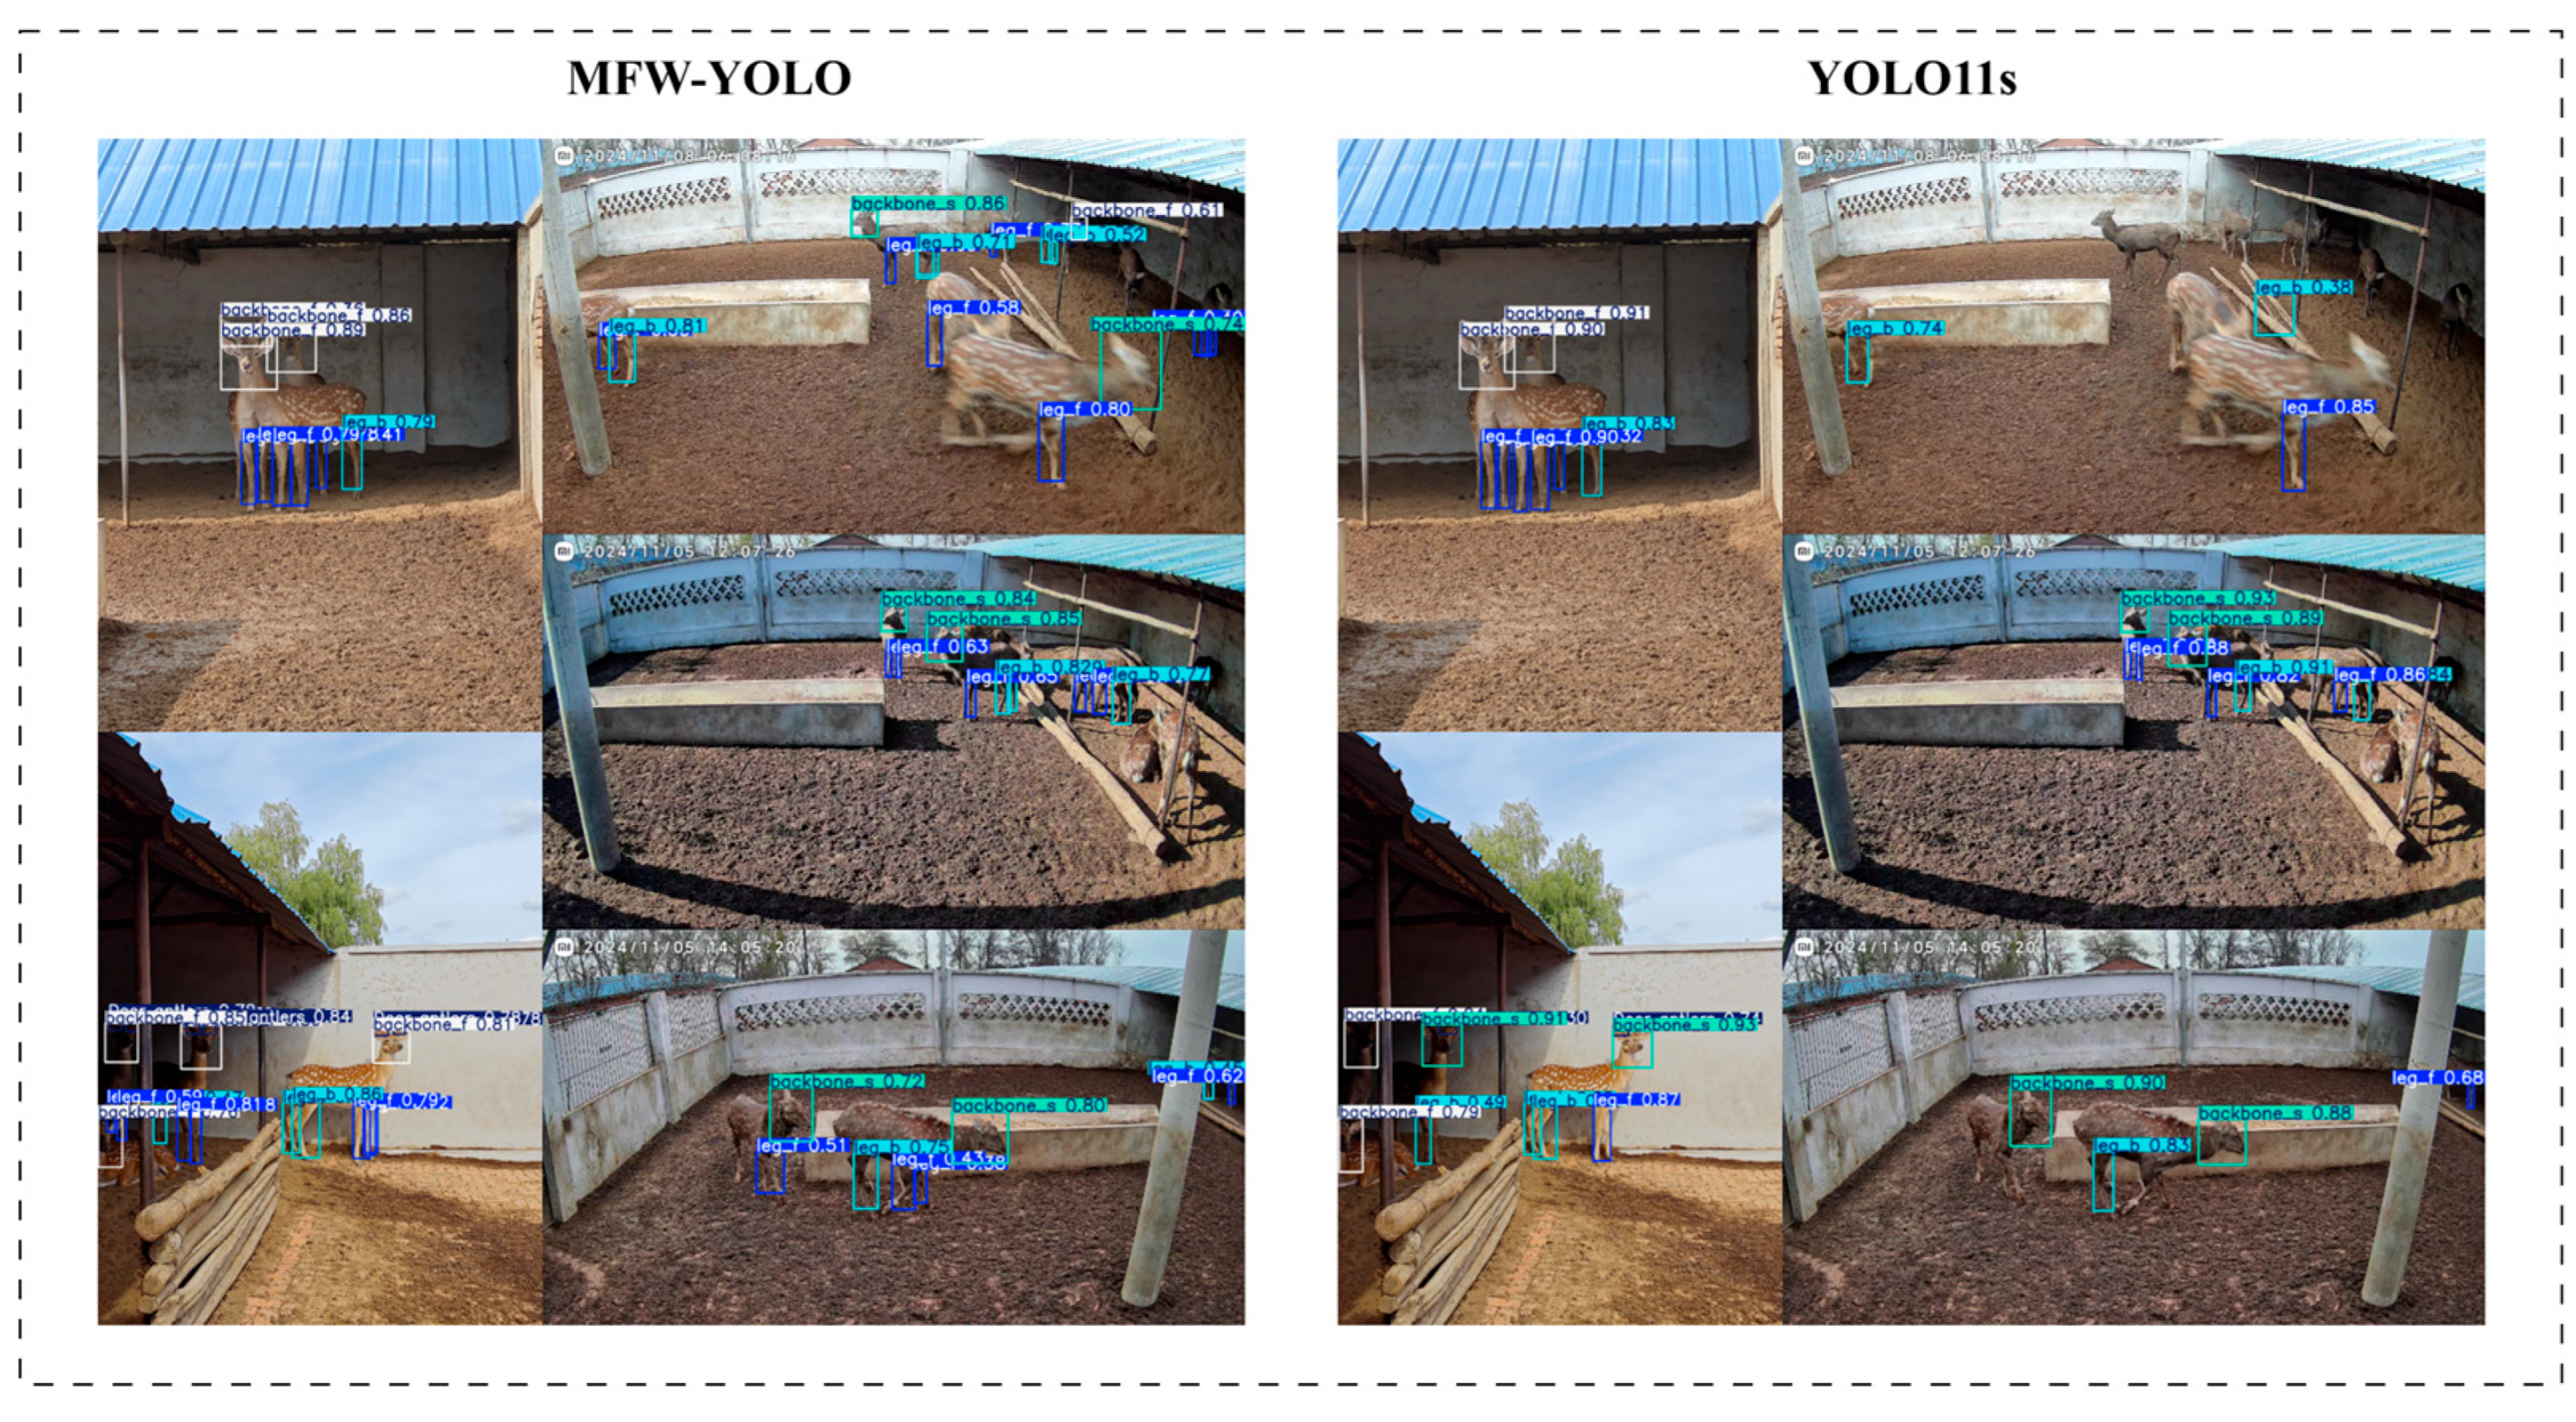
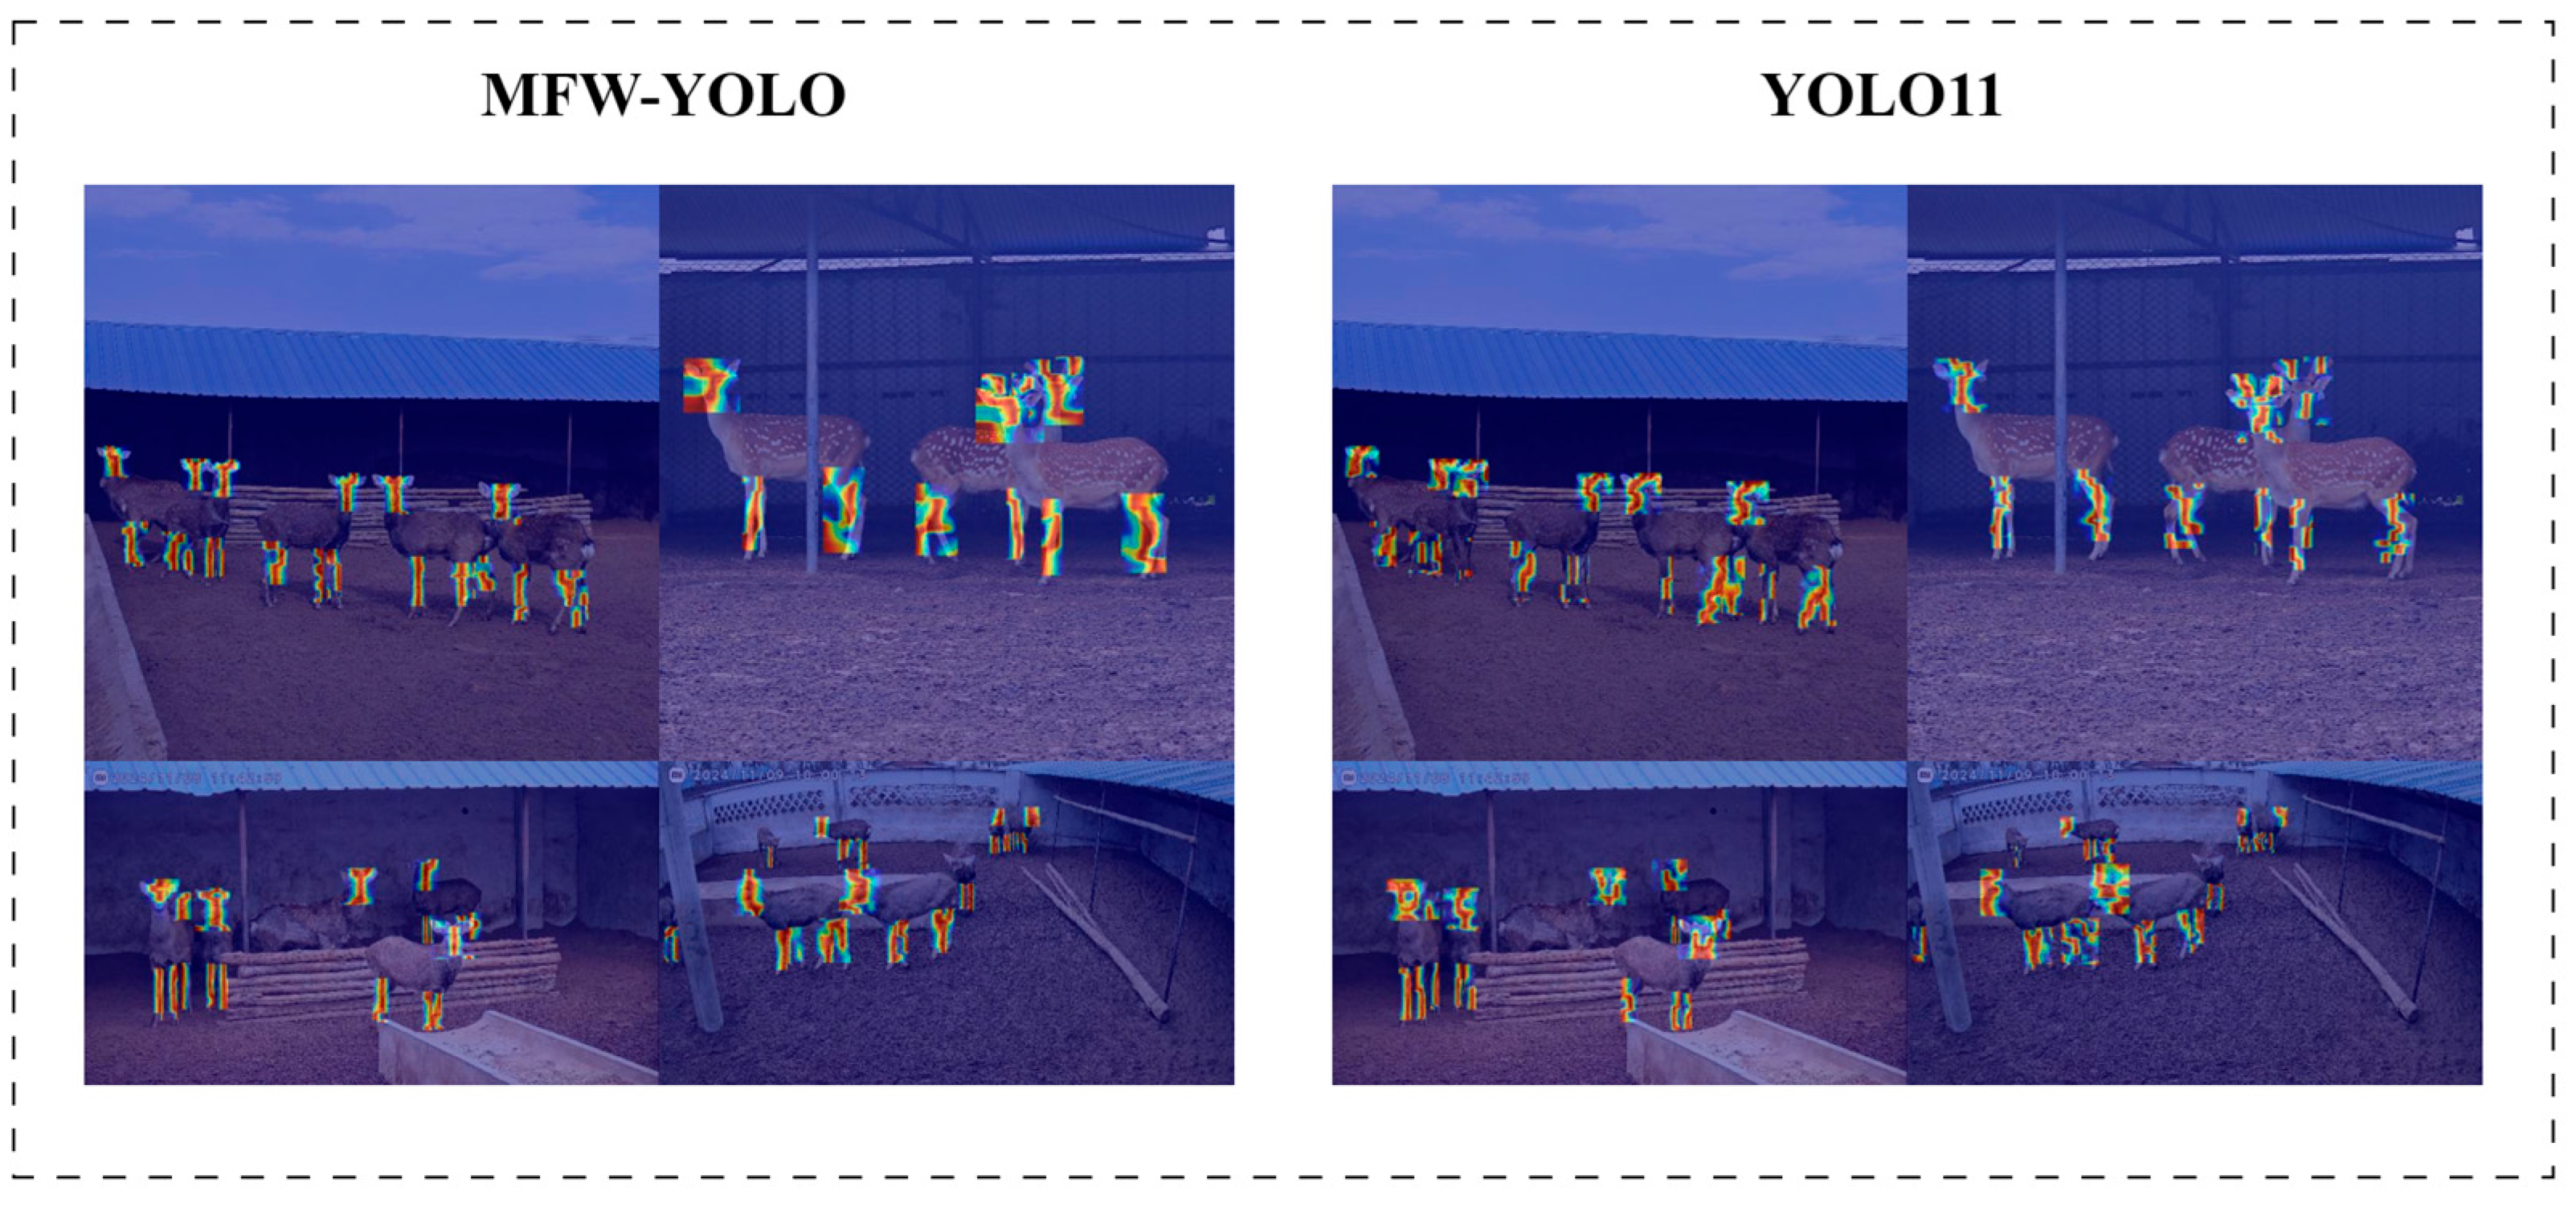
This study successfully developed a deep learning model based on YOLO11. This algorithm can achieve automated, rapid and accurate detection of key body parts such as deer antlers, heads (distinguishing between front and side), and front and hind legs in a real sika deer breeding environment. The research results show that the mAP50 and MAP50-95 of MFFW-YOLO reach 91.9% and 64.5%, respectively. Meanwhile, it outperformed in terms of model efficiency, with only 5.9 million parameters, a computational cost of 12.8 GFLOPs, and an inference speed of 3.8 ms.
The most core contribution of this study lies in its great potential to promote the realization of a non-contact management model, which is expected to significantly enhance the animal welfare level of sika deer. The significant stress response caused by traditional physical and chemical fixation methods to sika deer is a key issue that urgently needs to be addressed in modern humanized breeding. Our algorithm provides a key technical basis for replacing or assisting these invasive operations by offering long-distance and automated precise location positioning capabilities. For instance, in the future, when combined with automated equipment (such as mechanical arms used for deer antler collection and preparation), the visual perception information provided by this algorithm is the core prerequisite for achieving safe and low-stress operations. This shift from “forced contact” to “intelligent perception” aligns with the ethical requirements and development trends of enhancing farm animal welfare standards and achieving sustainable production on a global scale. From a methodological perspective, this study verified the effectiveness of MFW-YOLO in dealing with the complex task of refined detection of specific parts of large mammals, especially in challenging real breeding environments (such as light variations, background disturbances, diverse postures, and occlusion, etc.). This provides valuable references for computer vision applications in similar scenarios. Of course, the research also has limitations. For instance, the current model training mainly relies on the dataset obtained from the intelligent sika deer breeding base of Jilin Agricultural University. Although this dataset covers various scenarios of this specific site, data from a single source may not fully represent the diversity of the sika deer breeding environment. Therefore, the generalization ability of this model in a broader environment or different deer populations needs to be further verified. Furthermore, to stably deploy the algorithm in actual production, further research on model compression techniques (such as pruning) is still needed to significantly reduce computing resource consumption and memory usage while maintaining acceptable detection accuracy, in order to adapt to challenges such as edge computing devices [32,33].
Based on the foundation and limitations of the current research, future studies will focus on the following aspects: Firstly, continuously optimize the algorithm performance by using generative adversarial networks to synthesize challenging samples (such as rare poses, extreme lighting, or partial occlusion) to further enhance detection accuracy, speed, and robustness [34]. Secondly, explore multimodal information fusion and combine data sources such as infrared and depth to obtain more comprehensive animal status information [35]. Furthermore, conduct system integration and empirical research, embed the algorithm into the actual monitoring or management system, and carry out long-term verification in the real production environment. Finally, evaluate the feasibility of migrating and applying this method to other species (such as domestic animals like pigs, cattle and sheep). To sum up, this study proposes the MFW-YOLO detection algorithm for specific parts of sika deer. Not only has significant progress been made at the technical level, but more importantly, it has opened up a new way for the intelligent, non-contact, and humanized management of sika deer and similar large animals. This algorithm is expected to promote the innovation of traditional animal management models and play a key role in improving animal welfare, optimizing production management, and deepening health monitoring capabilities, fully demonstrating the significant value and broad potential of deep learning in addressing the challenges of modern agricultural management.

5. Conclusions

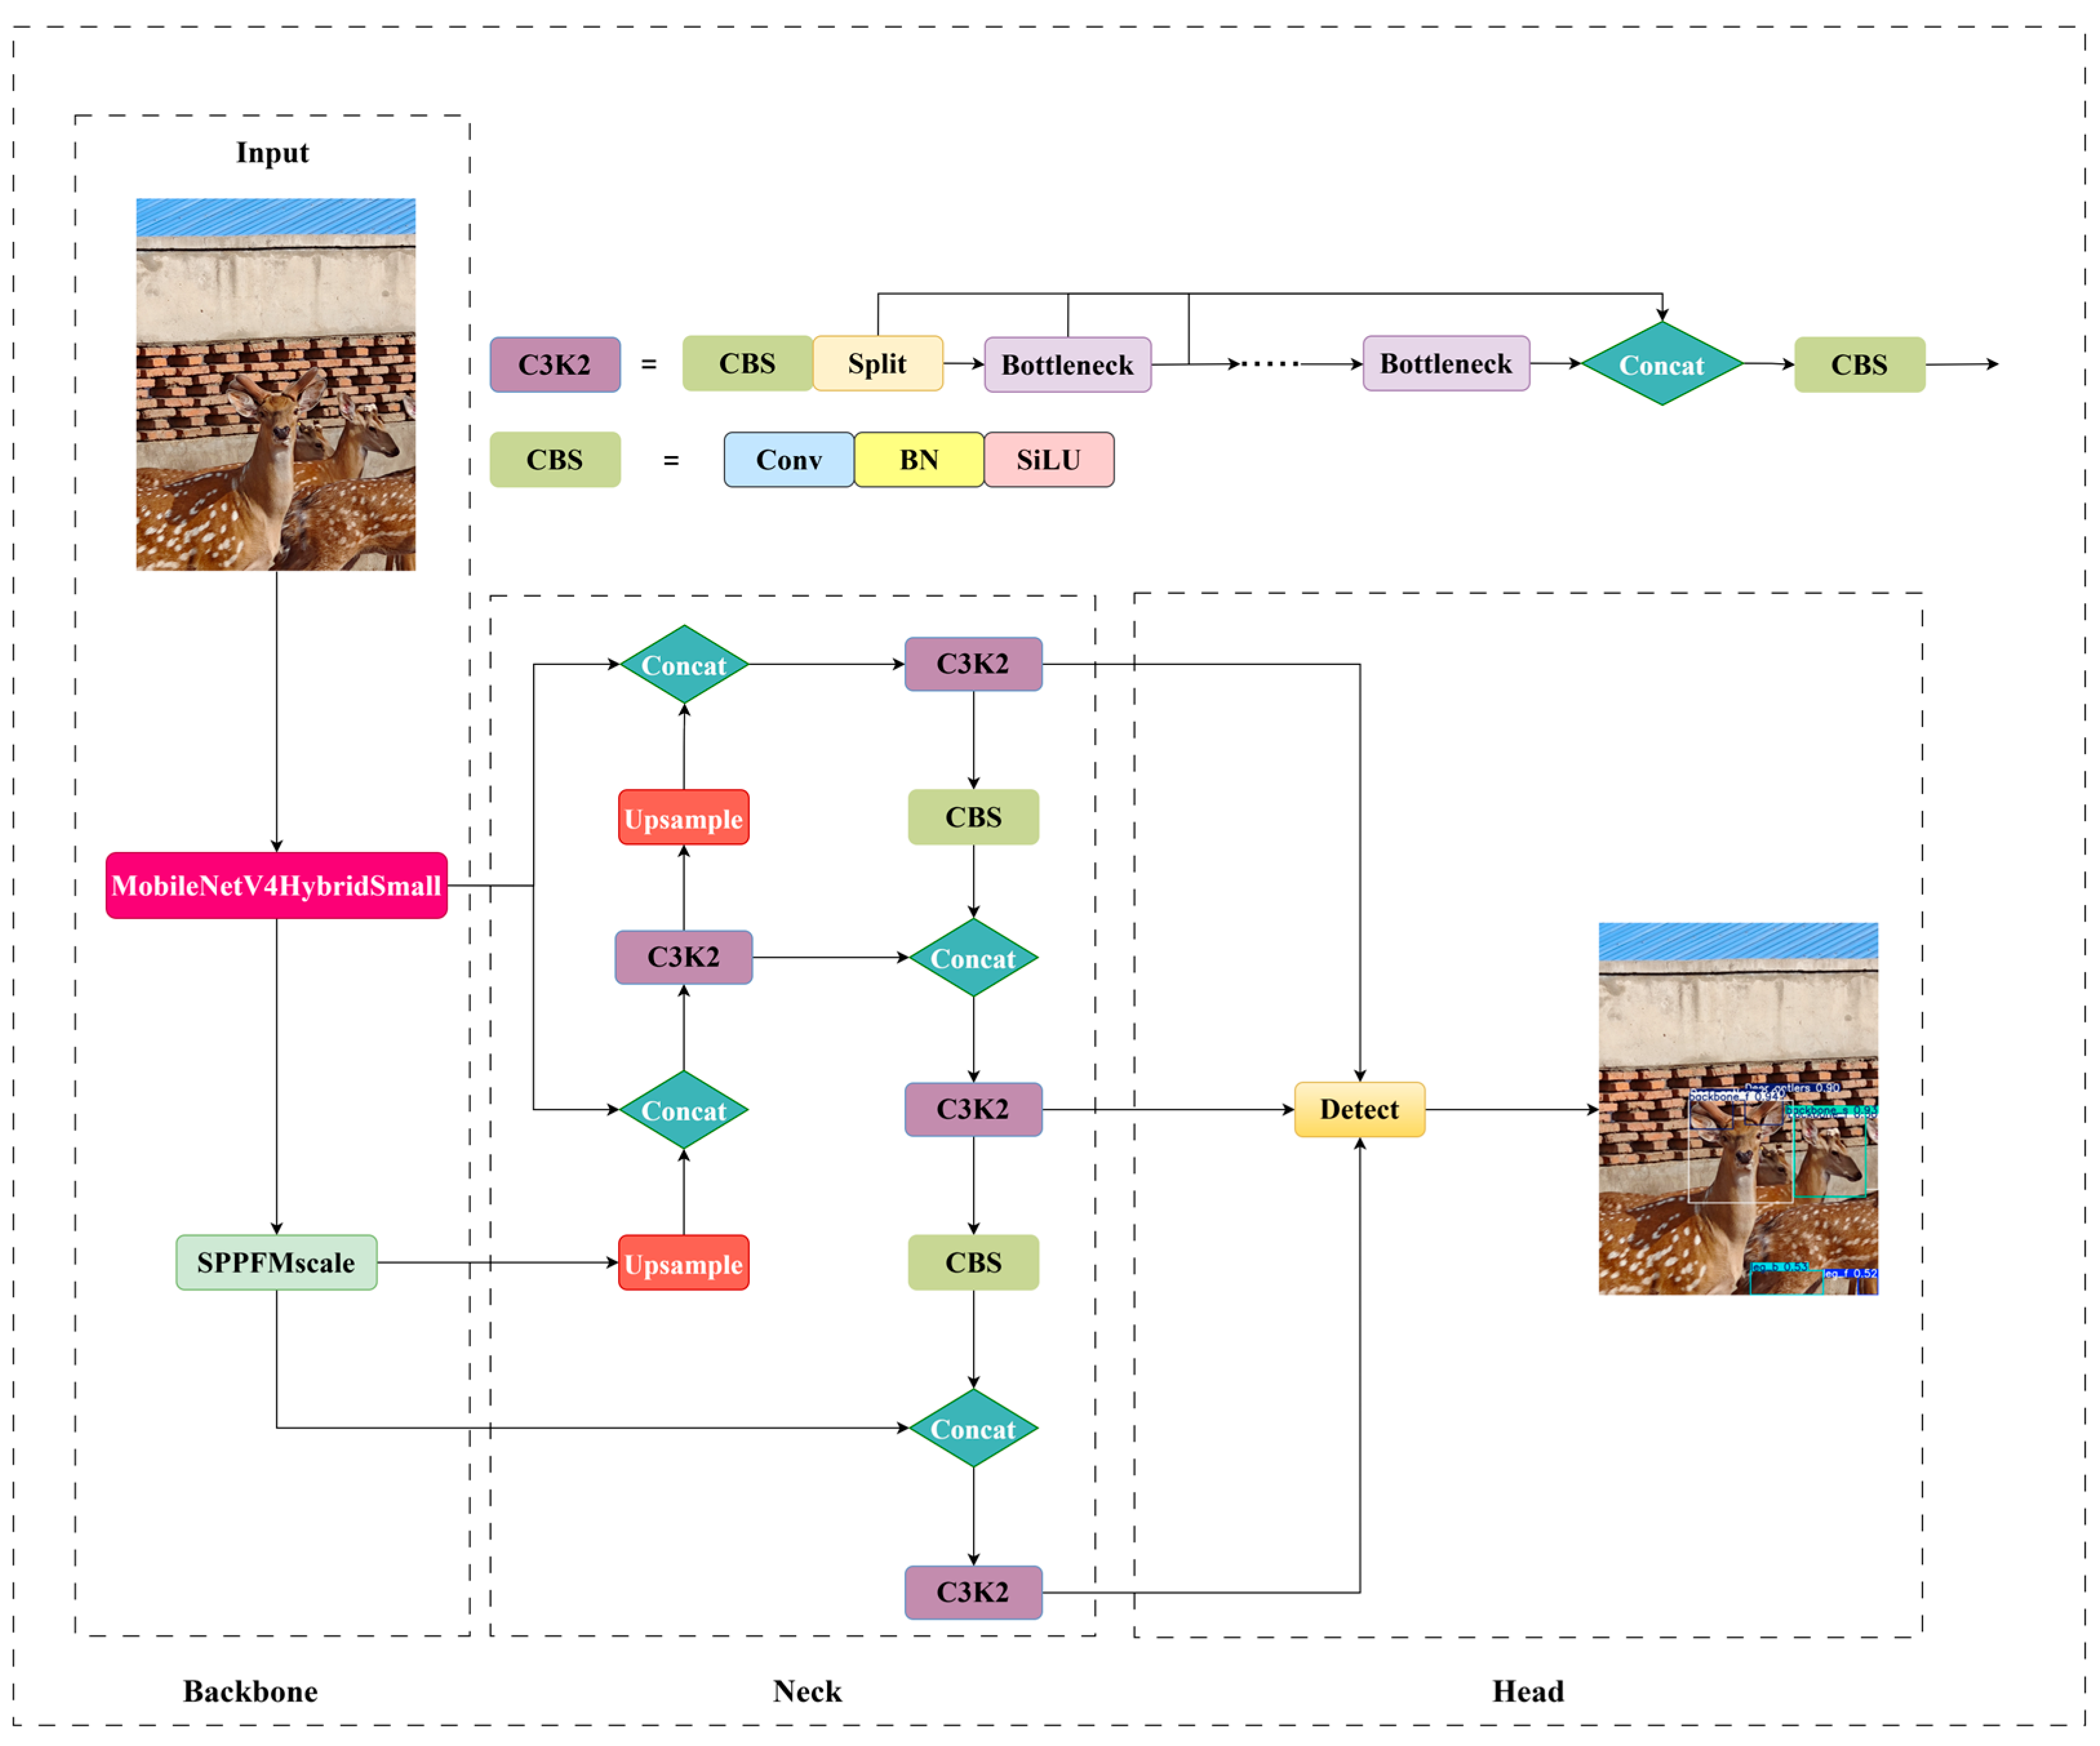
In this study, aiming at the problems such as low efficiency of management methods (physical fixation and chemical fixation), strong stress, and damage to animal welfare existing in the sika deer breeding industry, a target detection algorithm based on the YOLO11 framework has been successfully developed. MFFW-YOLO achieves precise detection of key body parts of sika deer (antlers, head, and front and hind legs) in a real breeding environment through non-contact visual technology. Experimental evaluations conducted on the sika deer dataset indicate that MFW-YOLO has excellent performance: Its mAP50 and MAP50-95 reached 91.9% and 64.5%, respectively. Meanwhile, it performed outstandingly in terms of model efficiency, with only 5.9 million parameters, a computational load of 12.8 GFLOPs, and an inference speed of 3.8 ms, achieving an excellent balance between accuracy and efficiency. This performance improvement is attributed to three key targeted enhancements: First, the design of the lightweight backbone network MobileNetV4HybridSmall effectively integrates convolution and self-attention mechanisms. Second, a multi-scale fast pyramid pooling module SPPFMscale was designed, which enhanced the ability of multi-scale feature aggregation. Thirdly, the advanced WIoU v3 loss function was adopted to optimize the robustness of bounding box regression. These innovations work together to significantly enhance the model’s detection ability in complex scenarios.
The core value of this research lies in providing strong technical support for the intelligent, non-contact and humanized management of sika deer. The success of this algorithm not only promotes the improvement of animal welfare, but also lays the foundation for downstream applications such as automated health monitoring (for example, analysis based on deer antler morphology, head behavior, or leg gait) and data-driven refined management decisions. This is of great significance for improving production efficiency, reducing risks and promoting the sustainable development of the industry. Despite the significant progress made, this study still has limitations. Mainly, the model validation is based on a single data source, and its generalization ability in a broader environment needs to be further confirmed. The future research directions will include: expanding the diversity of the dataset to enhance the generalization ability of the model; continuously optimizing the algorithm architecture and training strategy; exploring multimodal information fusion to obtain more comprehensive animal states; conducting system integration and large-scale field verification; and assessing the possibility of expansion into other species domains.

Author Contributions

Conceptualization, J.W. and H.G. (He Gong); methodology, J.W.; software, J.W. and L.L.; validation, H.G. (Haotian Gong), Z.L., J.F. and Y.S.; formal analysis, T.H. and Y.M.; investigation, H.G. (Haotian Gong) and Y.S.; resources, J.F. and Y.M.; data curation, L.L. and L.N.; writing—original draft preparation, J.W.; writing—review and editing, Y.S. and L.L.; visualization, L.N.; supervision, J.F. and T.H.; project administration, H.G. (He Gong) and Y.S.; funding acquisition, Z.L., J.F., Y.M. and H.G. (He Gong). All authors have read and agreed to the published version of the manuscript.

Funding

This work was supported by the National Key Research and Development Program of China (Grant No. [2023YFD1302000, accessed on 23 April 2025: https://service.most.gov.cn/]), the Science and Technology Department of Jilin Province (Grant No. [YDZJ202501ZYTS581, accessed on 23 April 2025: http://kjt.jl.gov.cn/]), and the Science and Technology Bureau of Changchun City (Grant No. [21ZGN27, accessed on 23 April 2025: http://kjj.changchun.gov.cn/]).

Institutional Review Board Statement

Not applicable.

Data Availability Statement

The data presented in this study are available on request from the corresponding author. The data are not publicly available due to ongoing research projects.

Conflicts of Interest

The authors declare no conflicts of interest.

References

  1. Yuan, C.; Wu, M.; Tahir, S.M.; Chen, X.; Li, C.; Zhang, A.; Lu, W. Velvet Antler Production and Hematological Changes in Male Sika Deers Fed with Spent Mushroom Substrate. Animals 2022, 12, 1689. [Google Scholar] [CrossRef] [PubMed]
  2. Xiong, H.; Xiao, Y.; Zhao, H.; Xuan, K.; Zhao, Y.; Li, J. AD-YOLOv5: An Object Detection Approach for Key Parts of Sika Deer Based on Deep Learning. Comput. Electron. Agric. 2024, 217, 108610. [Google Scholar] [CrossRef]
  3. Gong, H.; Liu, J.; Li, Z.; Zhu, H.; Luo, L.; Li, H.; Hu, T.; Guo, Y.; Mu, Y. GFI-YOLOv8: Sika Deer Posture Recognition Target Detection Method Based on YOLOv8. Animals 2024, 14, 2640. [Google Scholar] [CrossRef] [PubMed]
  4. Shanmugam, M.; Gomathi, R.D.; Shanmugam, S.; Shanmugam, D.K.; Murugesan, G.; Duraisamy, P. Real-Time Implementation of YOLO V5 Based Helmet with Number Plate Recognition and Logging of Rider Data Using PyTorch and XAMPP. In Proceedings of the 2023 14th International Conference on Computing Communication and Networking Technologies (ICCCNT), New Delhi, India, 6–8 July 2023; pp. 1–7. [Google Scholar]
  5. Arunkumar, T.; Maheswaran, S.; Dineshkumar, P.; Geetha, K.; Sureshkumar, A.; Praveenkumar, S. Design and Implementation of an Astute Infant Monitoring System Based on YOLO v8 Algorithm. In Proceedings of the 2024 15th International Conference on Computing Communication and Networking Technologies (ICCCNT), Mandi, India, 24–28 June 2024; pp. 1–6. [Google Scholar]
  6. Ghavi Hossein-Zadeh, N. Artificial Intelligence in Veterinary and Animal Science: Applications, Challenges, and Future Prospects. Comput. Electron. Agric. 2025, 235, 110395. [Google Scholar] [CrossRef]
  7. Bakana, S.R.; Zhang, Y.; Twala, B. WildARe-YOLO: A Lightweight and Efficient Wild Animal Recognition Model. Ecol. Inform. 2024, 80, 102541. [Google Scholar] [CrossRef]
  8. Chen, L.; Li, G.; Zhang, S.; Mao, W.; Zhang, M. YOLO-SAG: An Improved Wildlife Object Detection Algorithm Based on YOLOv8n. Ecol. Inform. 2024, 83, 102791. [Google Scholar] [CrossRef]
  9. Jiang, L.; Wu, L. Enhanced Yolov8 Network with Extended Kalman Filter for Wildlife Detection and Tracking in Complex Environments. Ecol. Inform. 2024, 84, 102856. [Google Scholar] [CrossRef]
  10. Zhang, J.; Bai, Z.; Wei, Y.; Tang, J.; Han, R.; Jiang, J. Behavior Detection of Dairy Goat Based on YOLO11 and ELSlowFast-LSTM. Comput. Electron. Agric. 2025, 234, 110224. [Google Scholar] [CrossRef]
  11. Zhang, X.; Xuan, C.; Xue, J.; Chen, B.; Ma, Y. LSR-YOLO: A High-Precision, Lightweight Model for Sheep Face Recognition on the Mobile End. Animals 2023, 13, 1824. [Google Scholar] [CrossRef]
  12. Mu, Y.; Hu, J.; Wang, H.; Li, S.; Zhu, H.; Luo, L.; Wei, J.; Ni, L.; Chao, H.; Hu, T.; et al. Research on the Behavior Recognition of Beef Cattle Based on the Improved Lightweight CBR-YOLO Model Based on YOLOv8 in Multi-Scene Weather. Animals 2024, 14, 2800. [Google Scholar] [CrossRef]
  13. Chang, A.Z.; Fogarty, E.S.; Moraes, L.E.; García-Guerra, A.; Swain, D.L.; Trotter, M.G. Detection of Rumination in Cattle Using an Accelerometer Ear-Tag: A Comparison of Analytical Methods and Individual Animal and Generic Models. Comput. Electron. Agric. 2022, 192, 106595. [Google Scholar] [CrossRef]
  14. Özentürk, U.; Chen, Z.; Jamone, L.; Versace, E. Robotics for Poultry Farming: Challenges and Opportunities. Comput. Electron. Agric. 2024, 226, 109411. [Google Scholar] [CrossRef]
  15. Wang, Y.; Wang, X.; Liu, K.; Cuan, K.; Hua, Z.; Li, K.; Wang, K. Non-Invasive Monitoring for Precision Sheep Farming: Development, Challenges, and Future Perspectives. Comput. Electron. Agric. 2025, 231, 110050. [Google Scholar] [CrossRef]
  16. Rohan, A.; Rafaq, M.S.; Hasan, M.J.; Asghar, F.; Bashir, A.K.; Dottorini, T. Application of Deep Learning for Livestock Behaviour Recognition: A Systematic Literature Review. Comput. Electron. Agric. 2024, 224, 109115. [Google Scholar] [CrossRef]
  17. Chen, Z.; Xue, W.; Tian, W.; Wu, Y.; Hua, B. Toward Deep Neural Networks Robust to Adversarial Examples, Using Data Importance Perception. J Electron. Imaging 2022, 31, 063046. [Google Scholar] [CrossRef]
  18. Jocher, G.; Chaurasia, A.; Qiu, J. Ultralytics YOLO. 2023. Available online: https://github.com/ultralytics/ultralytics (accessed on 5 April 2025).
  19. Qin, D.; Leichner, C.; Delakis, M.; Fornoni, M.; Luo, S.; Yang, F.; Wang, W.; Banbury, C.; Ye, C.; Akin, B. MobileNetV4—Universal Models for the Mobile Ecosystem. arXiv 2024, arXiv:2404.10518. [Google Scholar]
  20. Howard, A.G.; Zhu, M.; Chen, B.; Kalenichenko, D.; Wang, W.; Weyand, T.; Andreetto, M.; Adam, H. MobileNets: Efficient Convolutional Neural Networks for Mobile Vision Applications. arXiv 2017, arXiv:1704.04861. [Google Scholar]
  21. Liu, S.; Qi, L.; Qin, H.; Shi, J.; Jia, J. Path Aggregation Network for Instance Segmentation. In Proceedings of the 2018 IEEE/CVF Conference on Computer Vision and Pattern Recognition, Salt Lake City, UT, USA, 18–22 June 2018; pp. 8759–8768. [Google Scholar]
  22. Tong, Z.; Chen, Y.; Xu, Z.; Yu, R. Wise-IoU: Bounding Box Regression Loss with Dynamic Focusing Mechanism. arXiv 2023, arXiv:2301.10051. [Google Scholar]
  23. Zheng, Z.; Wang, P.; Ren, D.; Liu, W.; Ye, R.; Hu, Q.; Zuo, W. Enhancing Geometric Factors in Model Learning and Inference for Object Detection and Instance Segmentation. IEEE Trans. Cybern. 2022, 52, 8574–8586. [Google Scholar] [CrossRef]
  24. Zheng, Z.; Wang, P.; Liu, W.; Li, J.; Ye, R.; Ren, D. Distance-IoU Loss: Faster and Better Learning for Bounding Box Regression. arXiv 2019, arXiv:1911.08287. [Google Scholar] [CrossRef]
  25. Rezatofighi, H.; Tsoi, N.; Gwak, J.; Sadeghian, A.; Reid, I.; Savarese, S. Generalized Intersection Over Union: A Metric and a Loss for Bounding Box Regression. In Proceedings of the 2019 IEEE/CVF Conference on Computer Vision and Pattern Recognition (CVPR), Long Beach, CA, USA, 15–20 June 2019; pp. 658–666. [Google Scholar]
  26. Zhao, Y.; Lv, W.; Xu, S.; Wei, J.; Wang, G.; Dang, Q.; Liu, Y.; Chen, J. DETRs Beat YOLOs on Real-Time Object Detection. In Proceedings of the 2024 IEEE/CVF Conference on Computer Vision and Pattern Recognition (CVPR), Seattle, WA, USA, 16–22 June 2024; pp. 16965–16974. [Google Scholar]
  27. Redmon, J.; Farhadi, A. YOLOv3: An Incremental Improvement. arXiv 2018, arXiv:1804.02767. [Google Scholar]
  28. Li, C.; Zhang, B.; Li, L.; Li, L.; Geng, Y.; Cheng, M.; Xiaoming, X.; Chu, X.; Wei, X. YOLOv6: A Single-Stage Object Detection Framework for Industrial Applications. arXiv 2024, arXiv:2209.02976. [Google Scholar]
  29. Wang, C.-Y.; Yeh, I.-H.; Liao, H.-Y.M. YOLOv9: Learning What You Want to Learn Using Programmable Gradient Information. arXiv 2024, arXiv:2402.13616. [Google Scholar]
  30. Wang, A.; Chen, H.; Liu, L.; Chen, K.; Lin, Z.; Han, J.; Ding, G. YOLOv10: Real-Time End-to-End Object Detection. arXiv 2024, arXiv:abs/2405.14458. [Google Scholar]
  31. Tian, Y.; Ye, Q.; Doermann, D. YOLOv12: Attention-Centric Real-Time Object Detectors. arXiv 2025, arXiv:2502.12524v1. [Google Scholar]
  32. Zhao, C.-T.; Wang, R.-F.; Tu, Y.-H.; Pang, X.-X.; Su, W.-H. Automatic Lettuce Weed Detection and Classification Based on Optimized Convolutional Neural Networks for Robotic Weed Control. Agronomy 2024, 14, 2838. [Google Scholar] [CrossRef]
  33. Wang, R.-F.; Su, W.-H. The Application of Deep Learning in the Whole Potato Production Chain: A Comprehensive Review. Agriculture 2024, 14, 1225. [Google Scholar] [CrossRef]
  34. Krichen, M. Generative Adversarial Networks. In Proceedings of the 2023 14th International Conference on Computing Communication and Networking Technologies (ICCCNT), New Delhi, India, 6–8 July 2023; pp. 1–7. [Google Scholar]
  35. Arablouei, R.; Wang, Z.; Bishop-Hurley, G.J.; Liu, J. Multimodal Sensor Data Fusion for In-Situ Classification of Animal Behavior Using Accelerometry and GNSS Data. Smart Agric. Technol. 2023, 4, 100163. [Google Scholar] [CrossRef]
Figure 1. Constructed a diverse sika deer dataset that includes different devices, lighting conditions, overlaps, and occlusions.
Agriculture 15 01218 g001
Figure 2. Examples of application of data enhancement techniques include randomly rotating images about 10 to 20 degrees, cropping, adding random gaussian noise, and panning.
Agriculture 15 01218 g002
Figure 3. MFW-YOLO model structure.
Agriculture 15 01218 g003
Figure 4. Design structure of MobileNetV4HybridSmall model.
Agriculture 15 01218 g004
Figure 5. Core structure of SPPFMscale module.
Agriculture 15 01218 g005
Figure 6. Mapping of outlier degree β and gradient gain r , which is controlled by hyperparameters α , δ .
Agriculture 15 01218 g006
Figure 7. Loss and performance index changes after 200 rounds of model training.
Agriculture 15 01218 g007
Figure 8. F1 scores at different confidence thresholds.
Agriculture 15 01218 g008
Figure 9. Precision–recall curve by class.
Agriculture 15 01218 g009
Figure 10. Confusion matrix.
Agriculture 15 01218 g010
Figure 11. Comprehensive performance comparison of 13 models across multiple metrics, including mAP50, mAP50-95, model size, number of parameters, computational cost, and average inference time. Each curve in the radar chart represents a model. The closer the intersection point of the curve with each axis is to the outer side, the better the metric. The larger the area enclosed by the curve, the better the overall performance of the model.
Agriculture 15 01218 g011
Figure 12. Visual comparison of detection results between MFW-YOLO and YOLO11 in different scenarios.
Agriculture 15 01218 g012
Figure 13. Comparison of heatmaps in backbone feature extraction network between improved model and original model. Each pixel value on the heatmap represents the activation value at that location. The higher the activation value, the greater the likelihood of the target appearing at that location, and the brighter and more prominent the location in the heatmap. It can be observed that, compared with the heatmap generated by the original model, the heatmap generated by the improved model is significantly more focused on the specific parts of the sika deer. This indicates that the improved model can effectively enhance the model’s feature-extraction ability, enabling it to focus more on the target area, thereby improving the accuracy of detection.
Agriculture 15 01218 g013
Figure 14. Comparison of mAP50 and mAP50-95 for four loss functions.
Agriculture 15 01218 g014
Table 1. Composition of dataset, including number of images in original training set, augmented training set, and original validation set, as well as number of instances in five categories.
TrainVal
ImagesOriginal (820)Enhance (2460)Original (205)
Instances
leg_f419712,5911031
leg_b344810,344845
backbone_f16875061410
backbone_s17195157426
Deer antlers8262478226
All11,87735,6312938
Table 2. Experimental environment configuration.
Environment ConfigurationParameter
Operating systemLinux
CPUIntel(R) Xeon(R) Gold 6148 CPU @ 2.40 GHz
GPU2 * A100 (80 GB)
Development environmentPyCharm 2023.2.5
LanguagePython 3.8.10
framePyTorch 2.0.1
Operating platformCUDA 11.8
Table 3. Hyperparameter settings.
HyperparameterParameter
Epochs200
Batch16
AdamW learning rate0.000714
Momentum0.9
Weight decay0.0005
Input image size640
Table 4. Thirteen mainstream models, with mAP50 and mAP50-95 as core comparison indices.
ModelP (%)R (%)mAP50 (%)mAP50-95 (%)
RT-Detr-l84.183.192.064.6
RT-Detr-resnet5084.382.392.464.1
YOLOv3-SPP87.884.190.662.3
YOLOv3-tiny85.573.982.853.7
YOLOv5s86.482.389.661.6
YOLOv6s82.585.388.761.5
YOLOv8s85.283.391.162.4
YOLOv9c88.083.592.866.0
YOLOv9s84.284.789.462.9
YOLOv10s86.177.989.361.5
YOLO11s87.386.391.864.1
YOLOv1287.486.391.564.6
Our model88.385.391.964.5
Table 5. Comparison of comprehensive performance parameters among MFW-YOLO, RT-Detr Series, and YOLOv9c Model. Advantages of MFW-YOLO are highlighted by number of parameters and number of calculations.
ModelmAP50 (%)mAP50-95 (%)Memory (MB)Parameters (M)FLOPs (G)Time (ms)
RT-Detr-l92.064.666.231.9103.512.2
RT-Detr-resnet5092.464.186.041.9125.613.1
YOLOv9c92.866.043.321.182.710.9
our91.964.511.55.9012.83.8
Table 6. Results of ablation experiments for each module.
ModelP (%)R (%)mAP50 (%)mAP50-95 (%)Parameters (M)FLOPs(G)
YOLO11s87.386.391.864.19.45821.7
+MobileNetV4HybridSmall85.686.990.163.96.48413.2
+SPPFMscale85.987.389.263.18.87720.1
+WIoU v386.586.992.565.49.45821.7
MFW-YOLO88.385.391.964.55.9012.8
Table 7. Parameter comparison of SPPFMscale with SPPF, SPP, and SPPCSPC modules.
ModuleParameters (M)FLOPs (G)mAP50 (%)
SPPF0.65680.2691.9
SPP1.57490.5991.1
SPPCSPC7.0852.891.4
SPPFMscale0.07220.0389.2
Disclaimer/Publisher’s Note: The statements, opinions and data contained in all publications are solely those of the individual author(s) and contributor(s) and not of MDPI and/or the editor(s). MDPI and/or the editor(s) disclaim responsibility for any injury to people or property resulting from any ideas, methods, instructions or products referred to in the content.

