Article

Research on Intelligent Control Technology for a Rail-Based High-Throughput Crop Phenotypic Platform Based on Digital Twins

1
Information Technology Research Center, Beijing Academy of Agriculture and Forestry Sciences, Beijing 100097, China
2
Beijing Key Lab of Digital Plant, National Engineering Research Center for Information Technology in Agriculture, Beijing 100097, China
*
Author to whom correspondence should be addressed.
Agriculture 2025, 15(11), 1217; https://doi.org/10.3390/agriculture15111217
Submission received: 13 April 2025 / Revised: 29 May 2025 / Accepted: 31 May 2025 / Published: 2 June 2025
(This article belongs to the Section Digital Agriculture)

Abstract

Rail-based crop phenotypic platforms operating in open-field environments face challenges such as environmental variability and unstable data quality, highlighting the urgent need for intelligent, online data acquisition strategies. This study proposes a digital twin-based data acquisition strategy tailored to such platforms. A closed-loop architecture “comprising connection, computation, prediction, decision-making, and execution“ was developed to build DT-FieldPheno, a digital twin system that enables real-time synchronization between physical equipment and its virtual counterpart, along with dynamic device monitoring. Weather condition standards were defined based on multi-source sensor requirements, and a dual-layer weather risk assessment model was constructed using the analytic hierarchy process (AHP) and fuzzy comprehensive evaluation by integrating weather forecasts and real-time meteorological data to guide adaptive data acquisition scheduling. Field deployment over 27 consecutive days in a maize field demonstrated that DT-FieldPheno reduced the manual inspection workload by 50%. The system successfully identified and canceled two high-risk tasks under wind-speed threshold exceedance and optimized two others affected by gusts and rainfall, thereby avoiding ineffective operations. It also achieved sub-second responses to trajectory deviation and communication anomalies. The synchronized digital twin interface supported remote, real-time visual supervision. DT-FieldPheno provides a technological paradigm for advancing crop phenotypic platforms toward intelligent regulation, remote management, and multi-system integration. Future work will focus on expanding multi-domain sensing capabilities, enhancing model adaptability, and evaluating system energy consumption and computational overhead to support scalable field deployment.

1. Introduction

Global food security challenges and the transition toward precision agriculture are driving field-based plant phenomics from discrete sampling toward full-season, continuous monitoring [1]. Traditional workflows with discrete sampling followed by offline, static data analysis cannot capture dynamic crop environment interactions, leading to delayed phenotypic interpretation, which is a bottleneck for precision breeding and intelligent cultivation [2]. The rail-based high-throughput phenotypic platform (HTP) exemplified by LQ-FieldPheno employs a multimodal sensor array to acquire crop traits continuously and with high resolution [3,4,5,6,7], greatly improving data collection efficiency. However, when deployed in open fields, two core problems remain unsolved if one relies solely on conventional IoT monitoring and manual inspection: First of all, with a lack of life-cycle, predictive monitoring, and virtual commissioning, equipment faults are usually detected only after downtime. Secondly, without simulation-driven, environmentally adaptive scheduling, it is difficult to avoid quality degradation caused by wind, rainfall, and other field disturbances, compromising data reliability.
The digital twin (DT) concept, first coined by Grieves, has evolved into a canonical five-layer architecture physical entity, virtual model, data connection, service application, and feedback loop. Driven by real-time data, DT reproduces physical states in a virtual space, forecasts potential risks, and performs closed-loop control, thereby enhancing operational reliability and management efficiency [8,9]. In aerospace, energy, and manufacturing, DT has been adopted for product design, production line management, and fault prediction [10,11,12]. For example, additive manufacturing processes for large aircraft, marine, and rail components are optimized by combining multi-physics simulation with real-time process data to explore cost-effective hybrid manufacturing plans.
Inspired by successful paradigms in the industrial sector, digital twin (DT) technology is rapidly expanding into agriculture, demonstrating notable potential in areas such as the design and operation of intelligent agricultural machinery [13,14], crop cultivation management [15,16,17], and product management planning [18,19]. However, DT applications in the context of field-based phenotyping equipment remain in their infancy and face two key challenges: First, the nature of the target objects differs significantly. Industrial DTs typically focus on static equipment or process-oriented systems [20,21], whereas plant phenotyping targets living organisms with pronounced spatiotemporal heterogeneity and irreversible growth [22]. For example, phenotypic platforms must acquire large volumes of heterogeneous, multimodal data, which are then analyzed to extract key physiological and morphological traits [23,24] or used to reconstruct digital plant models for virtual simulation and trait quantification [25], ultimately enabling the investigation of phenotype–environment–genotype interactions. Second, functional limitations persist. Existing agricultural DT frameworks are often limited to the one-way monitoring of environmental conditions, equipment status, or management activities [19,26], with few systems capable of dynamically coupling the three core domains of equipment, environment, and crops within a unified, interactive model [27].
Current research on agricultural DTs is primarily concentrated on controlled-environment agriculture and orchard management [28,29], such as intelligent climate control in greenhouses [30], irrigation and fertigation optimization models [31], and orchard scenario simulations [32]. These systems typically operate in stable, enclosed or semi-enclosed environments that are highly structured and subject to low external disturbances. In contrast, rail-based phenotypic platforms operate in open-field conditions with frequent fluctuations in light, wind, and rainfall. This significantly increases environmental uncertainty and places higher demands on the DT system in terms of spatiotemporal resolution, multisource sensing, risk prediction, and closed-loop responses for active task scheduling.
This study proposes DT-FieldPheno, whose aims include (1) fusing a 3D model of rail equipment, a 3D visualization of crop individuals, and a virtual micro-meteorological scene into the same DT instance; (2) embedding an AHP-based fuzzy comprehensive meteorological risk assessment model in the DT architecture to enable environment-adaptive task scheduling; and (3) conducting continuous field monitoring to initially verify the system’s potential for reducing inspection workload and improving data validity and comparing its performance with a conventional IoT monitoring scheme.
The key innovations of this study include the following: The first is the realization of a fully closed-loop architecture, which, for the first time, realizes the cycle of “perception–prediction–decision–execution” in phenotypic scenarios, going beyond unidirectional monitoring. The second is the realization of a multi-domain unified twin system that provides a real-time collaborative simulation of railroad equipment, crop canopies, and micrometeorology within a single system, realizing three-domain interactions. Lastly, it is the realization of an environmentally adaptive collection strategy that dynamically optimizes data collection tasks under complex outdoor weather conditions and improves phenotypic data quality through a two-layer meteorological risk model (AHP and fuzzy logic).
The remainder of this paper is organized as follows. Section 2 describes the system architecture and key methods; Section 3 presents the experimental results; Section 4 discusses the limitations of DT-FieldPheno and future improvements; and Section 5 summarizes the main contributions and outlines prospects for practical deployment.

2. Materials and Methods

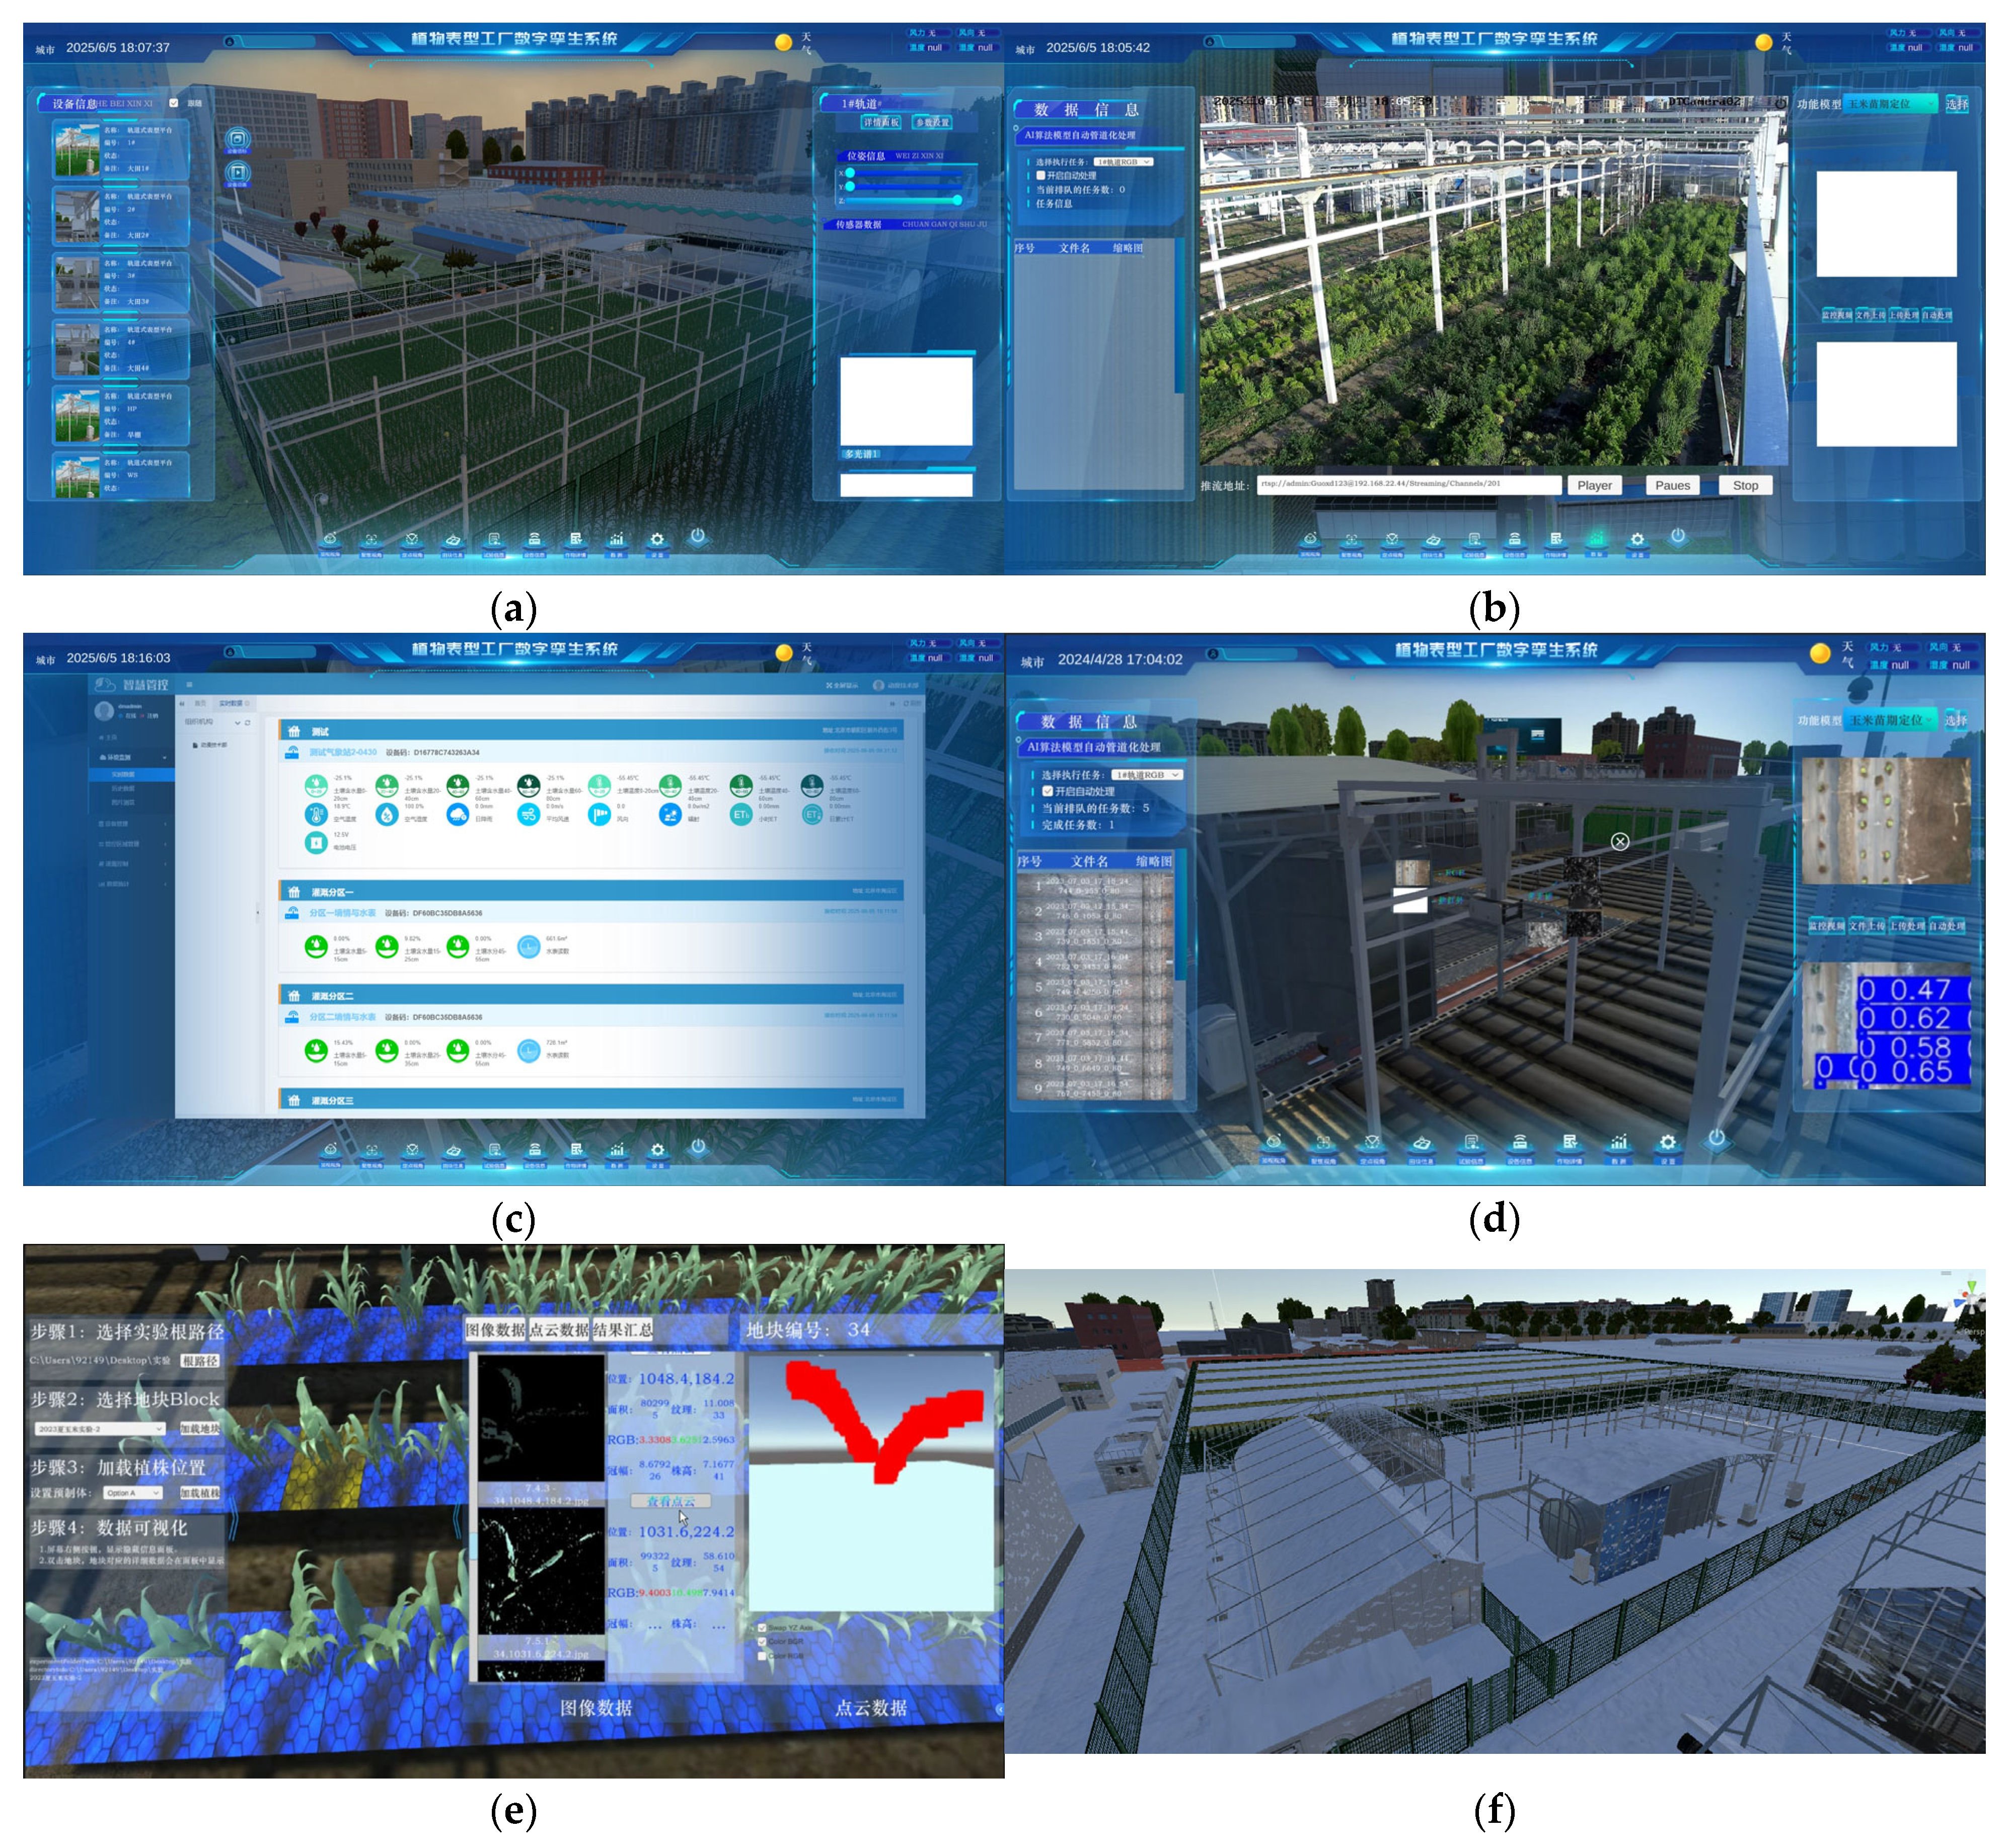
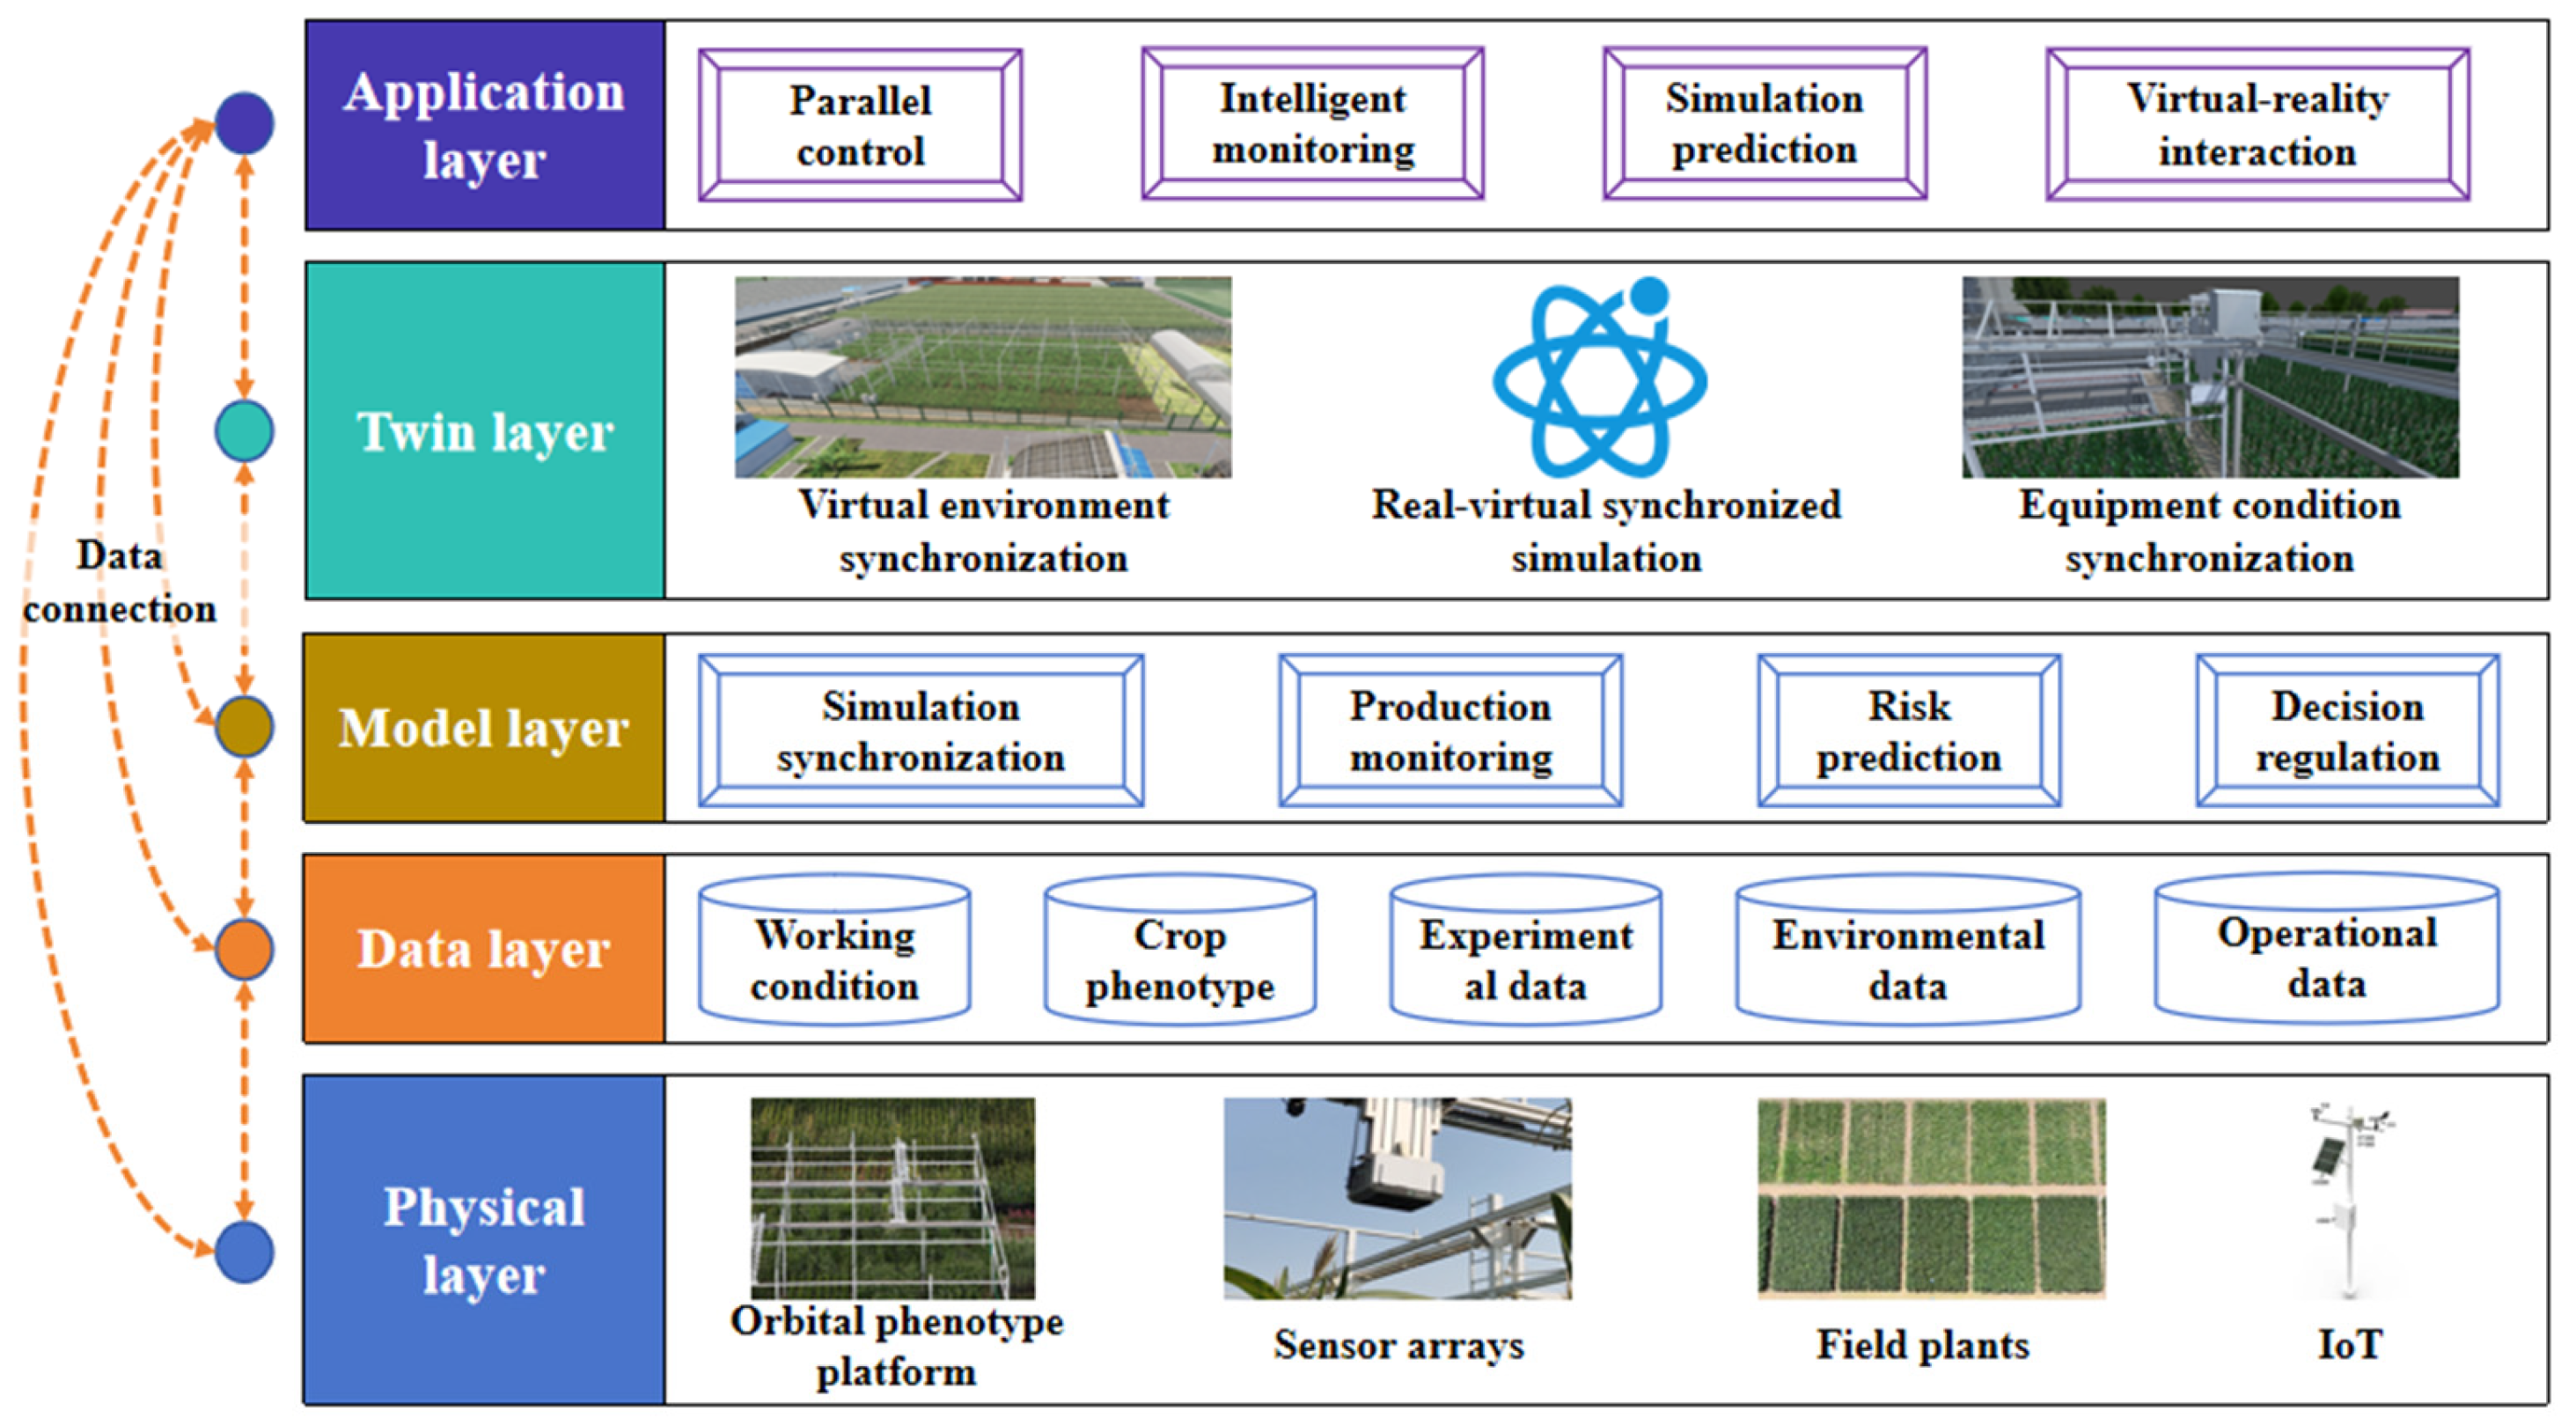
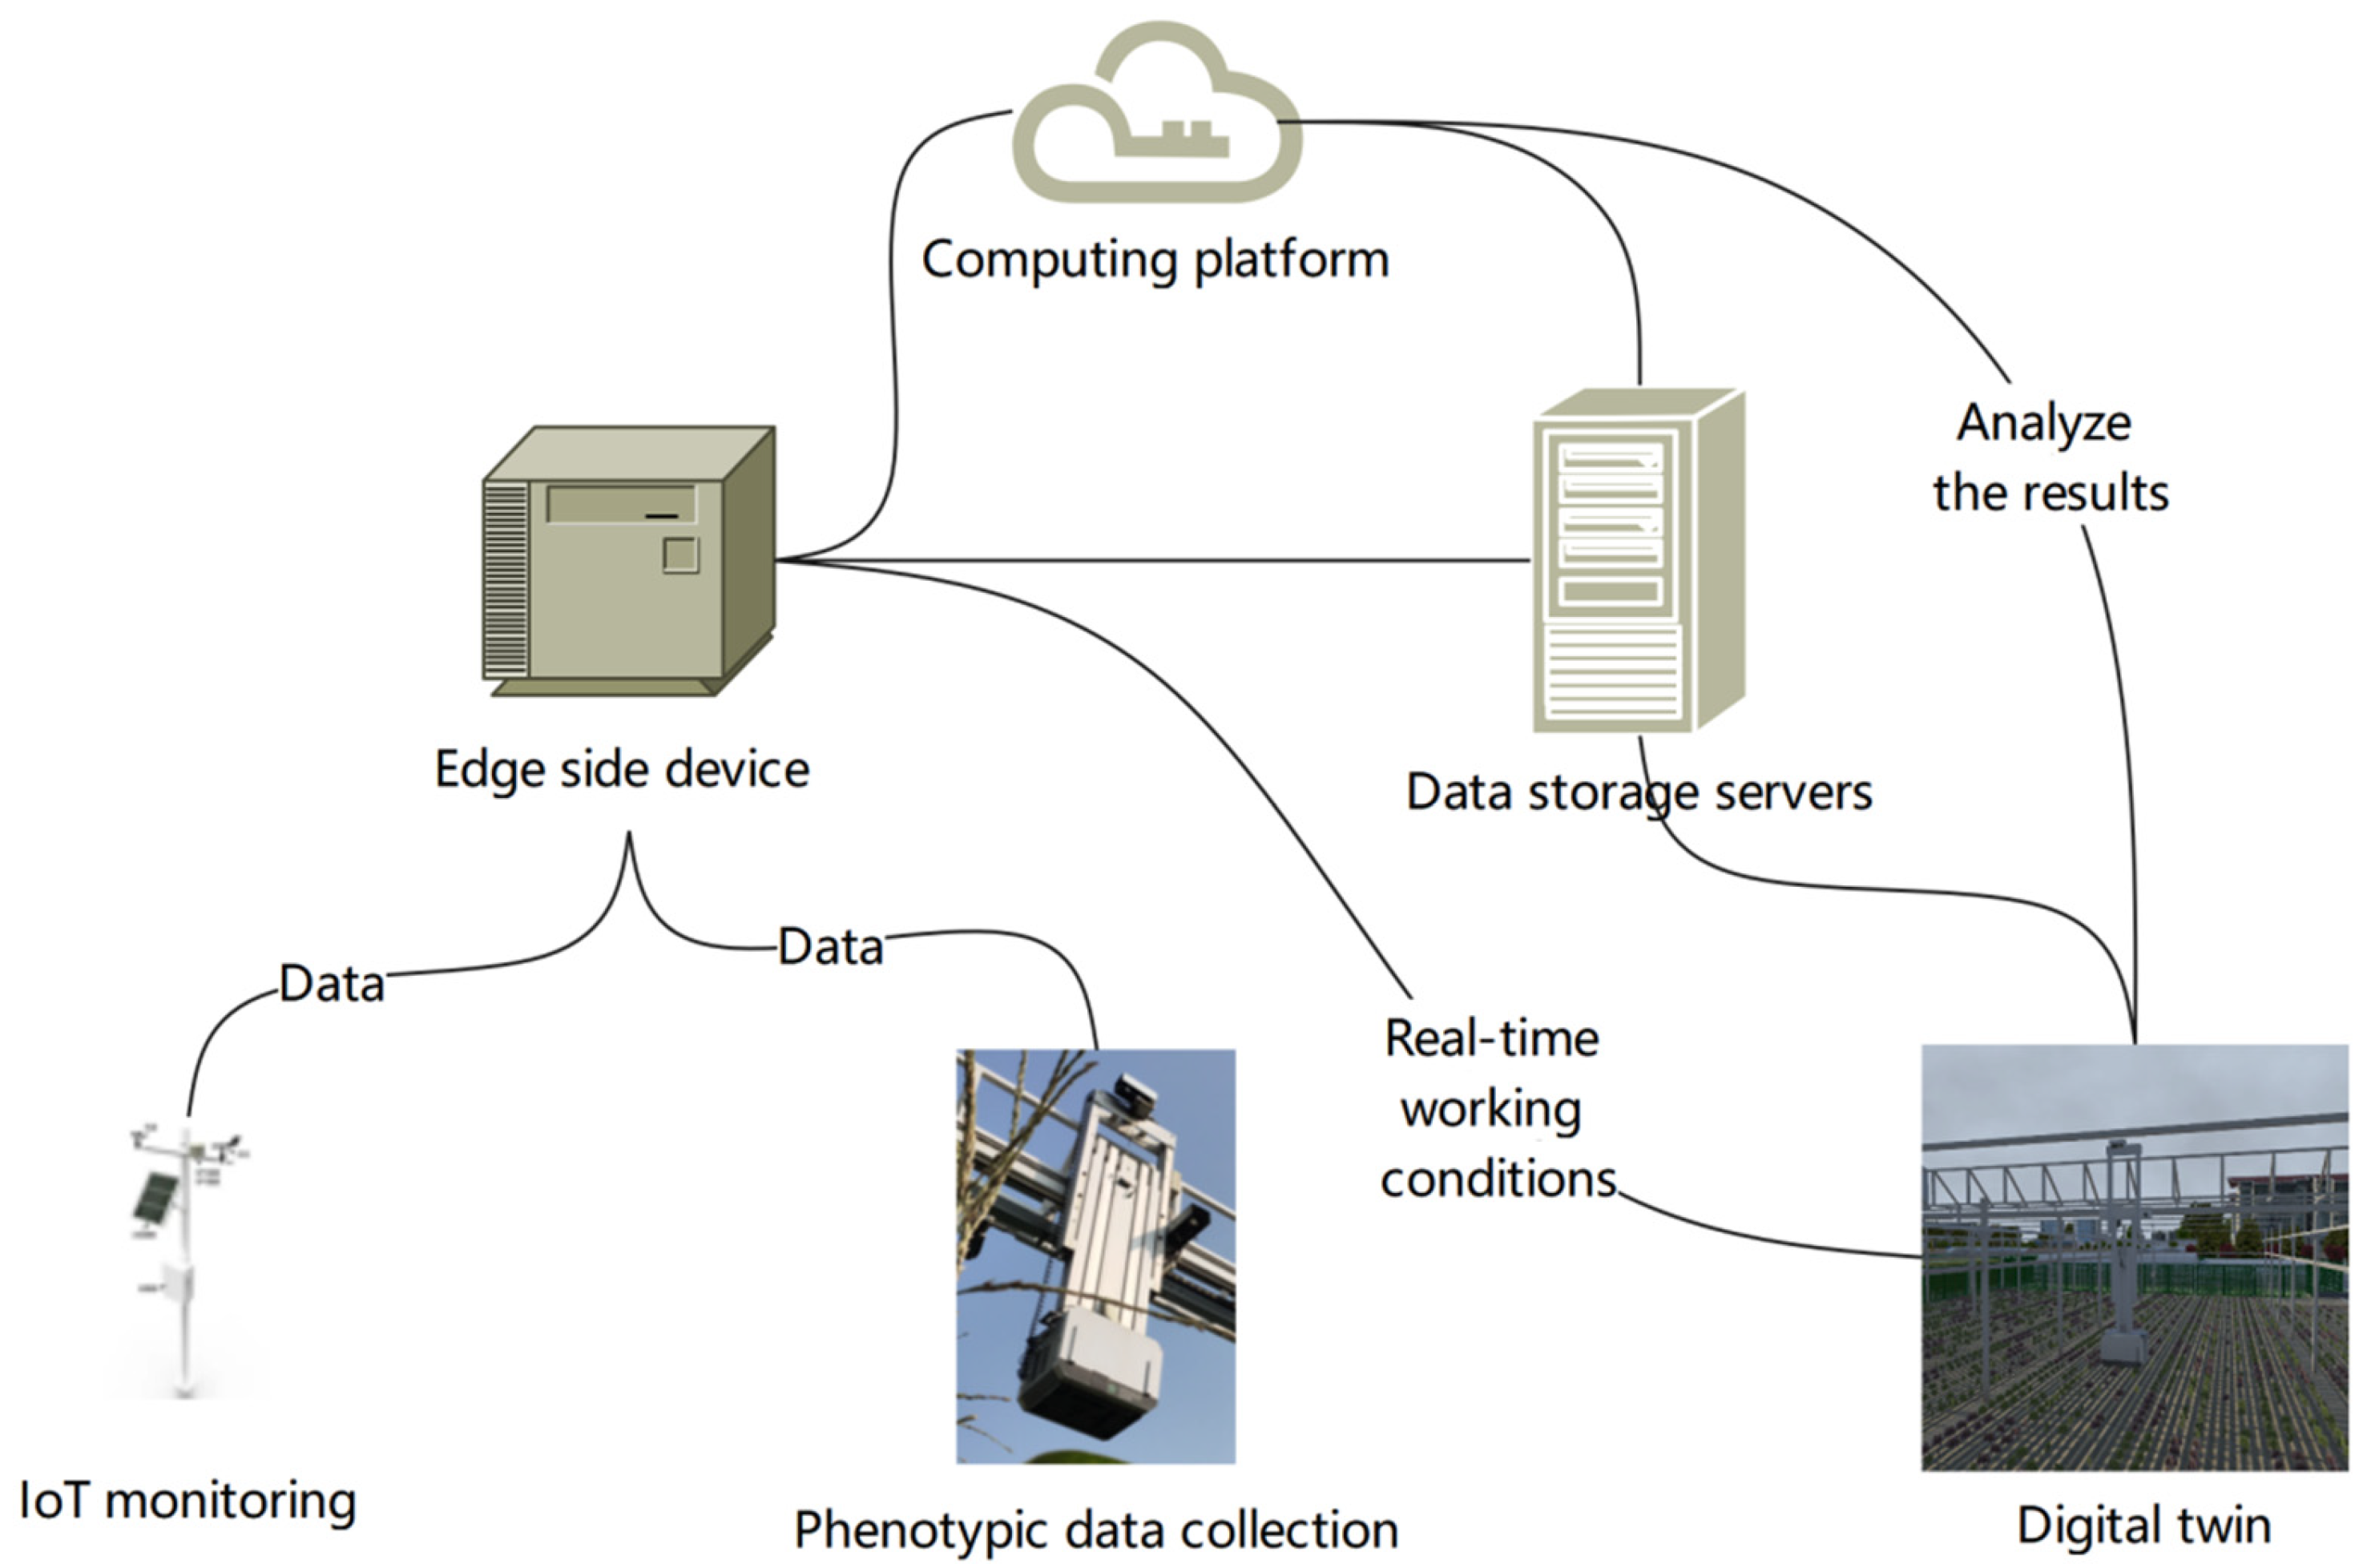
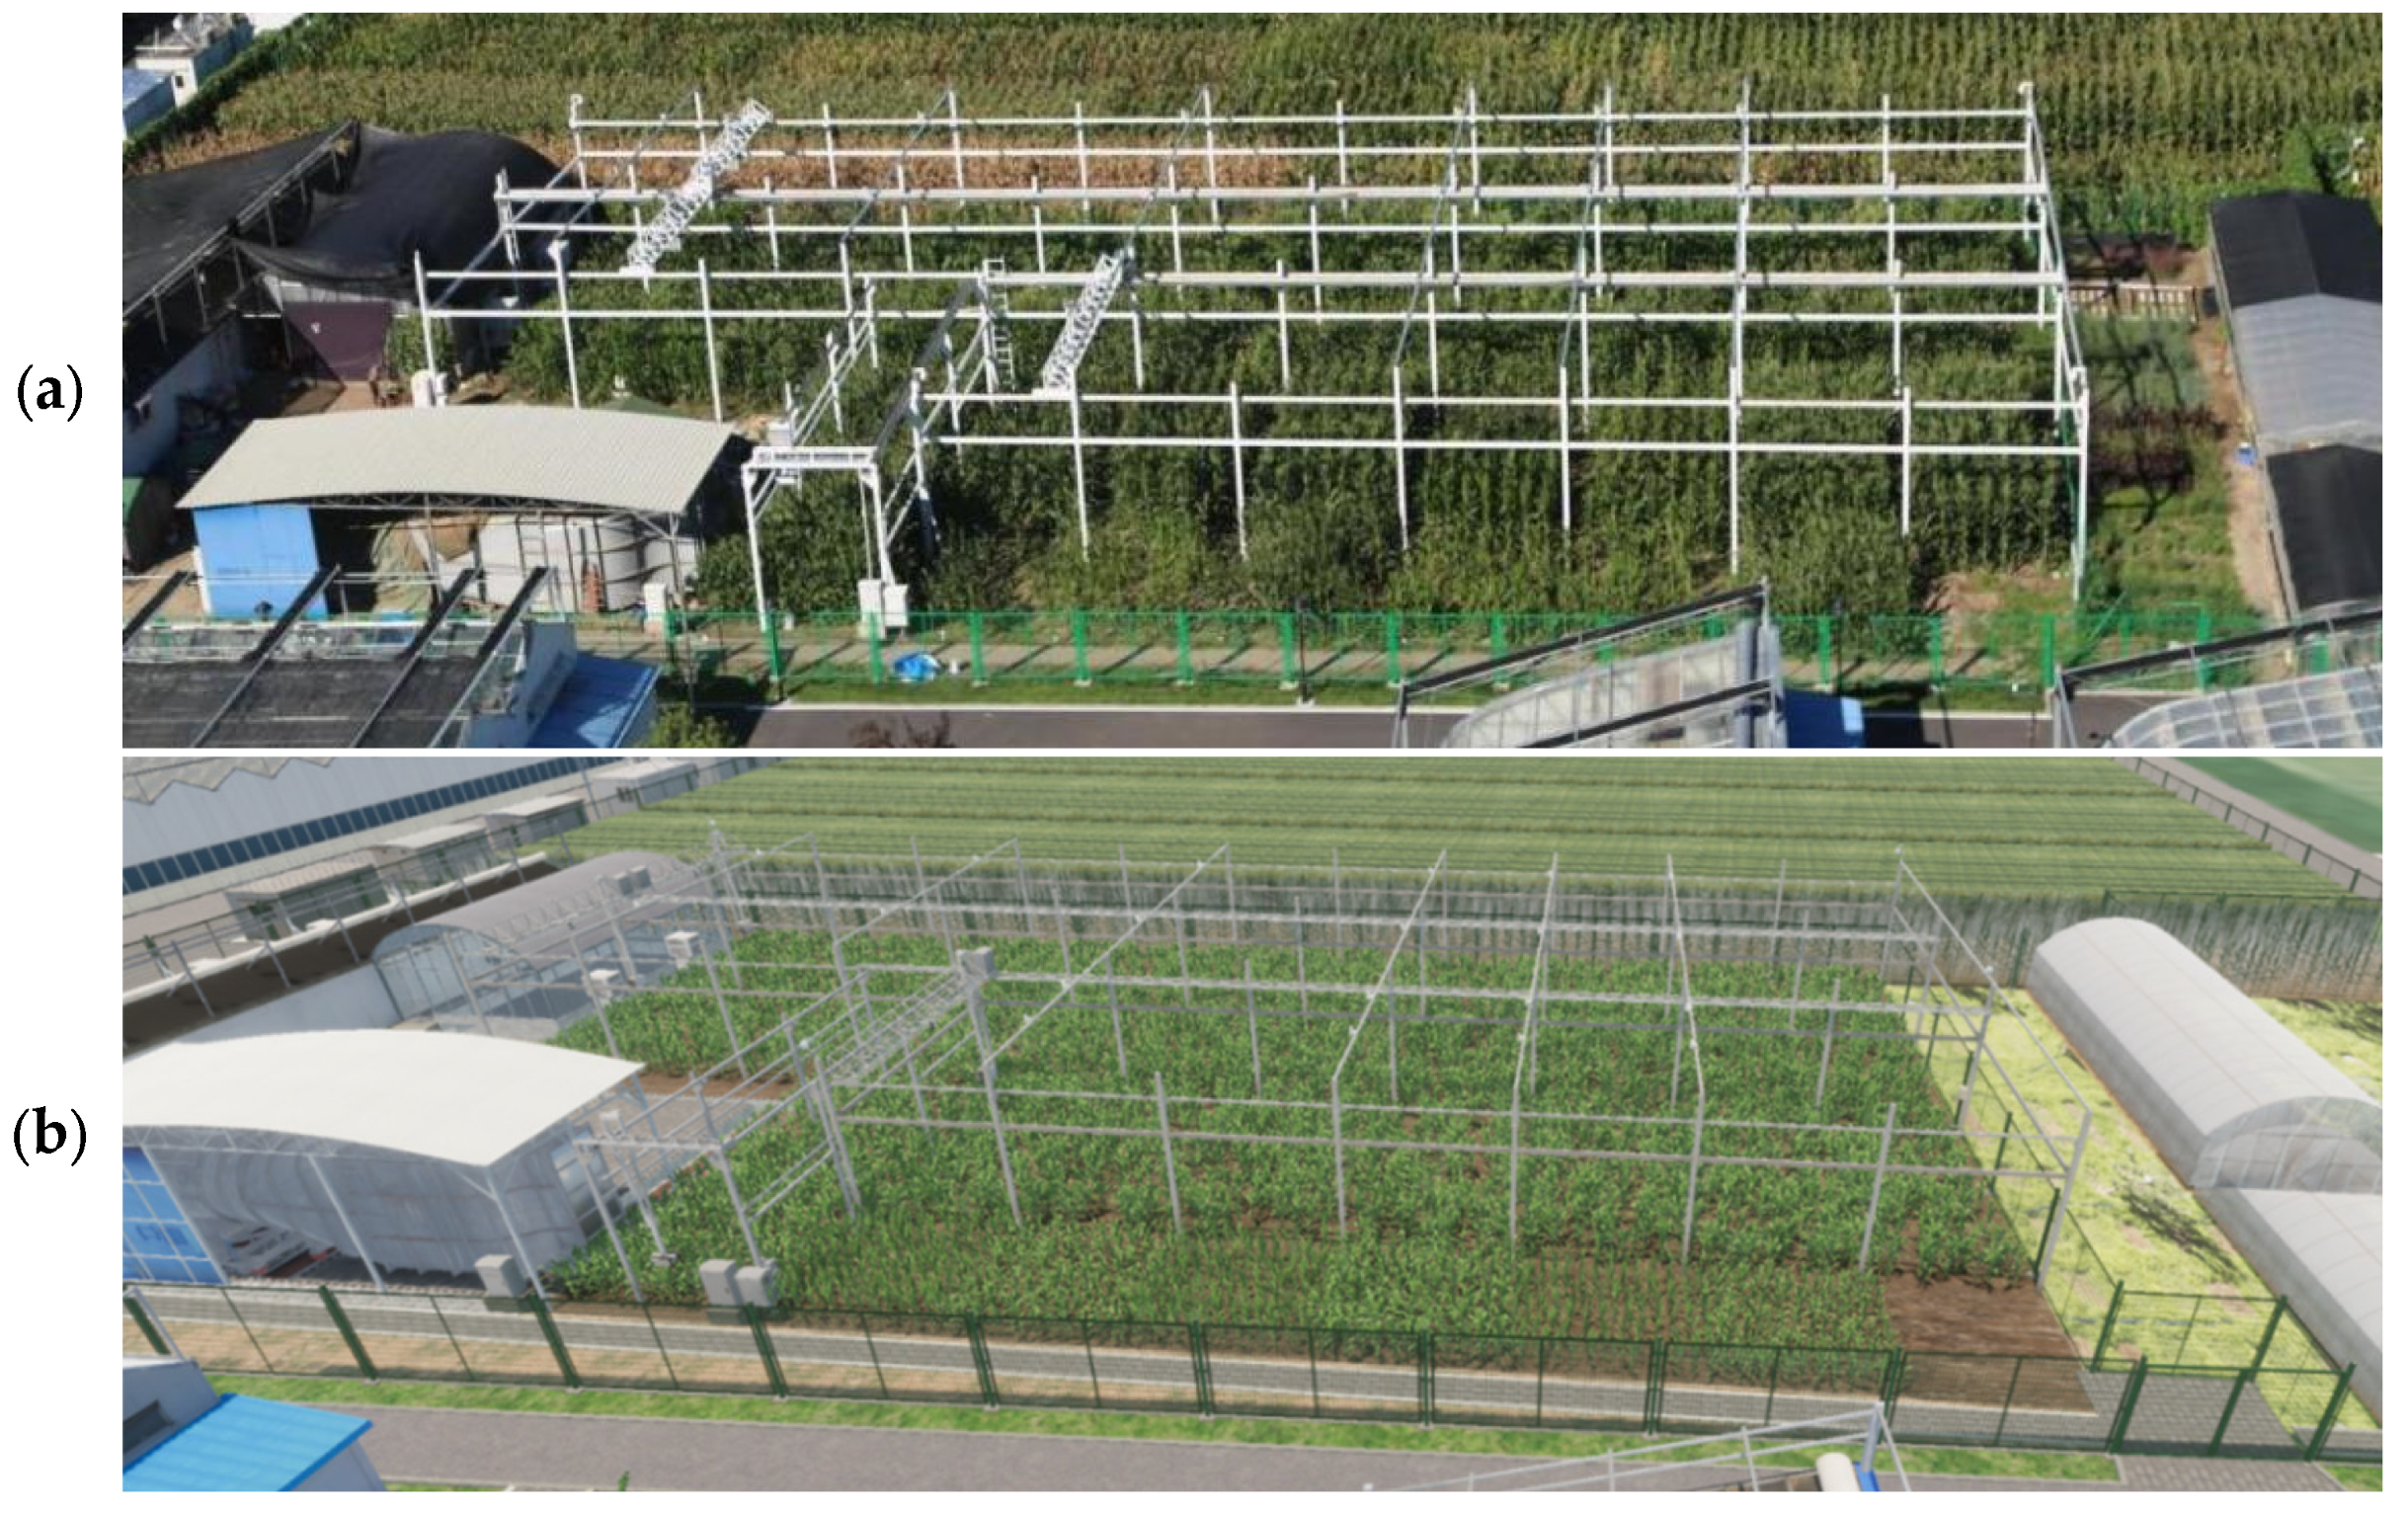
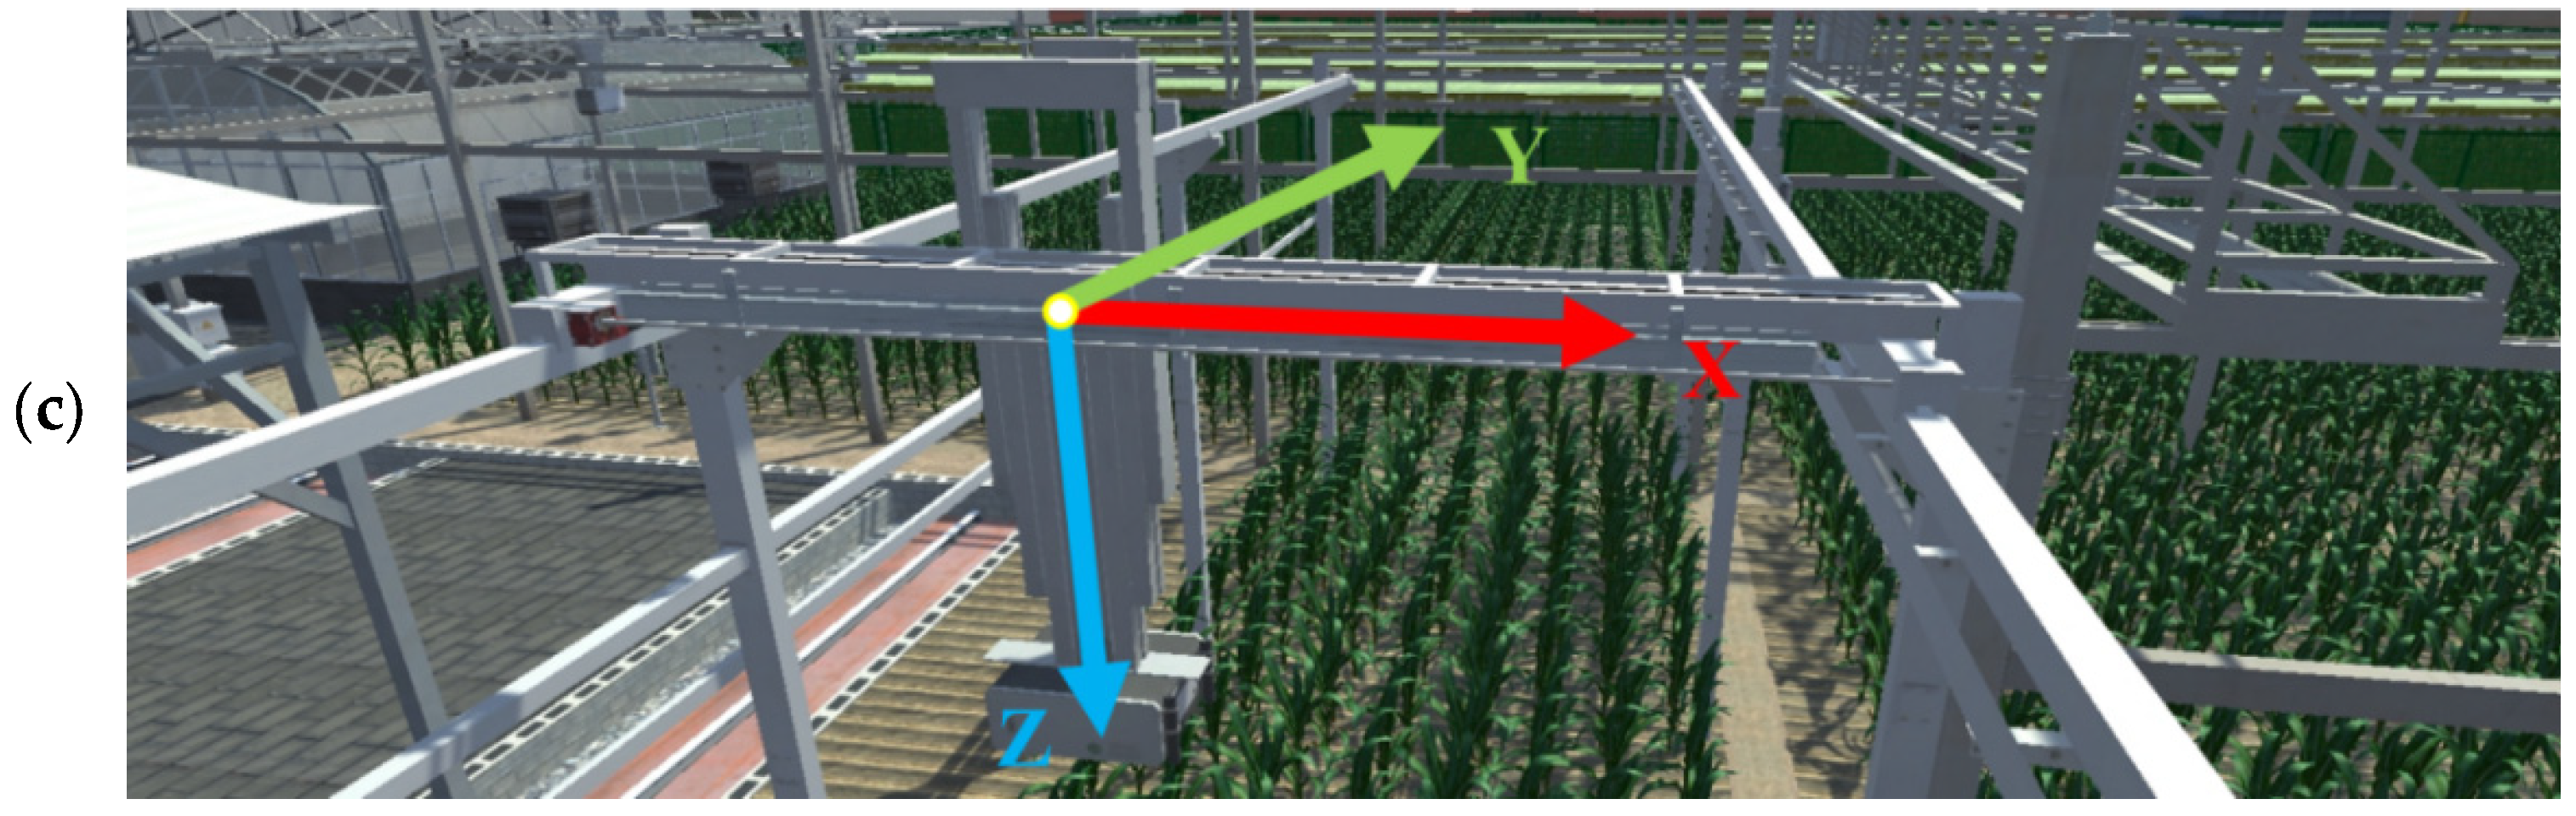
2.1. System Architecture Design

This study proposes a digital twin architecture (Figure 1) for a field track phenotypic platform, through the deep coupling of physical space and digital space, to build a closed-loop system for the “synchronous mapping of physical and digital spaces—dynamic simulation and deduction—intelligent decision-making, and feedback”, which breaks through the limitations of the traditional static phenotypic analysis and provides integrated technological support for real-time sensing and adaptive regulation in precision agriculture. The system adopts a five-layer architecture design.
Physical layer: This covers field equipment and facilities (rail platform, multi-source sensors, and IOT terminals) and biological environment (crop groups, individual plants, and the field microenvironment), constituting the physical basis for phenotypic data collection, achieving the total sensing of the work objects.
Data layer: This is responsible for managing, storing, scheduling, and transmitting the large amount of data generated in phenotypic production. It realizes cloud synchronous storage and the virtual–real interactive scheduling of physical layer data and provides real-time data flow for the upper layer model.
Model Layer: This integrates phenotypic feature resolution, growth monitoring, and equipment scheduling algorithm modules to drive multi-dimensional business decisions.
Twin layer: This is based on the Unity 3D physics engine and is used to build a 1:1 mirror image of the operation site, supporting real-time simulation and early warning control.
Application layer: This achieves three-dimensional situational awareness based on a digital twin sand table, combined with an environmentally adaptive decision engine to complete “monitoring–analysis–regulation” closed-loop management, which significantly improves operational efficiency in complex farmland scenarios.
To further illustrate the operational workflow of the digital twin system in practical scenarios, Figure 2 depicts the complete data flow and modeling process, from field devices to the virtual space. Field sensing equipment (e.g., RGB cameras and LiDAR) collects crop phenotypic images via control modules. The acquired data are transmitted through edge computing units to the processing platform for preliminary classification and then synchronized to the central data hub for storage and advanced analysis. Simultaneously, the system leverages this high-resolution data to update the virtual model in real time, generating 3D digital replicas of individual plants, thereby achieving seamless synchronization between the physical and digital spaces. To meet the intelligent data acquisition requirements of the rail-based phenotyping platform, the system is equipped not only with high-precision phenotyping sensors but also with a suite of environmental sensing terminals that monitor key parameters in real time, including wind speed, rainfall, solar irradiance, air temperature, humidity, and soil moisture. These environmental data are uploaded to the computing platform via edge gateways and are integrated into meteorological risk assessments and task scheduling strategies. Through the fusion of phenotypic and environmental data, the system reconstructs a dynamic 3D scene of both crops and their surrounding environment within the digital twin space, establishing a solid foundation for adaptive environmental regulation.

2.2. Key Technical Methods

In this study, a digital twin base was constructed for an LQ-FieldPheno [7] experimental field at the Beijing Academy of Agricultural and Forestry Sciences (39°56′ N, 116°16′ E) (Figure 3). The real-world experimental field and phenological platform were accurately mapped (Figure 3a) and digitally reconstructed 1:1 to generate a virtual scene (Figure 3b) that includes the rail structure, sensor layout, and spatial distribution of crops and simulates the dynamic trajectory of the rail-based platform (Figure 3c). Through the two-way mapping of physical form (geometry and topology) and behavioral attributes (motion logic and equipment response), the digital twin realizes the in-depth synchronization of the virtual and real space and lays the foundation for subsequent real-time monitoring and adaptive regulation.

2.2.1. Digital Twin Data Synchronization

DT-FieldPheno system data are categorized into three types according to business attributes:
(1) Phenotype data: These are generated by multi-source phenotype sensor collection (RGB camera, depth camera, multi-spectral camera, thermal infrared sensor, LiDAR, etc.), with multi-dimensional, multi-structural, large data volume, etc., to track the 1000 m2 phenotypic platform production environment (which can be planted with about 2900 crop materials); for example, its continuous collection operations for 1 h can produce more than 150 GB of data files [33].
(2) Work condition data: These are all kinds of work status data produced by the equipment during the operation of the rail platform, covering rail operation parameters, coordinates, movement speed, and other equipment status information, with a small amount of data but high real-time requirements.
(3) Production monitoring data, including an environmental weather station, video monitoring, and other auxiliary information.
Aiming at the characteristics of heterogeneous data, the system adopts a hierarchical transmission strategy: the phenotype data are optimized by the TCP protocol and edge cache to achieve high-speed and reliable data transmission [34]; the working condition data adopt the lightweight MQTT protocol to enable efficient information transmission in a restricted network environment [35]; the video monitoring data are independently grouped in the network to avoid competing for bandwidth with the phenotype data. This strategy ensures the real-time synchronization of multi-source data and supports the dynamic simulation of virtual models.

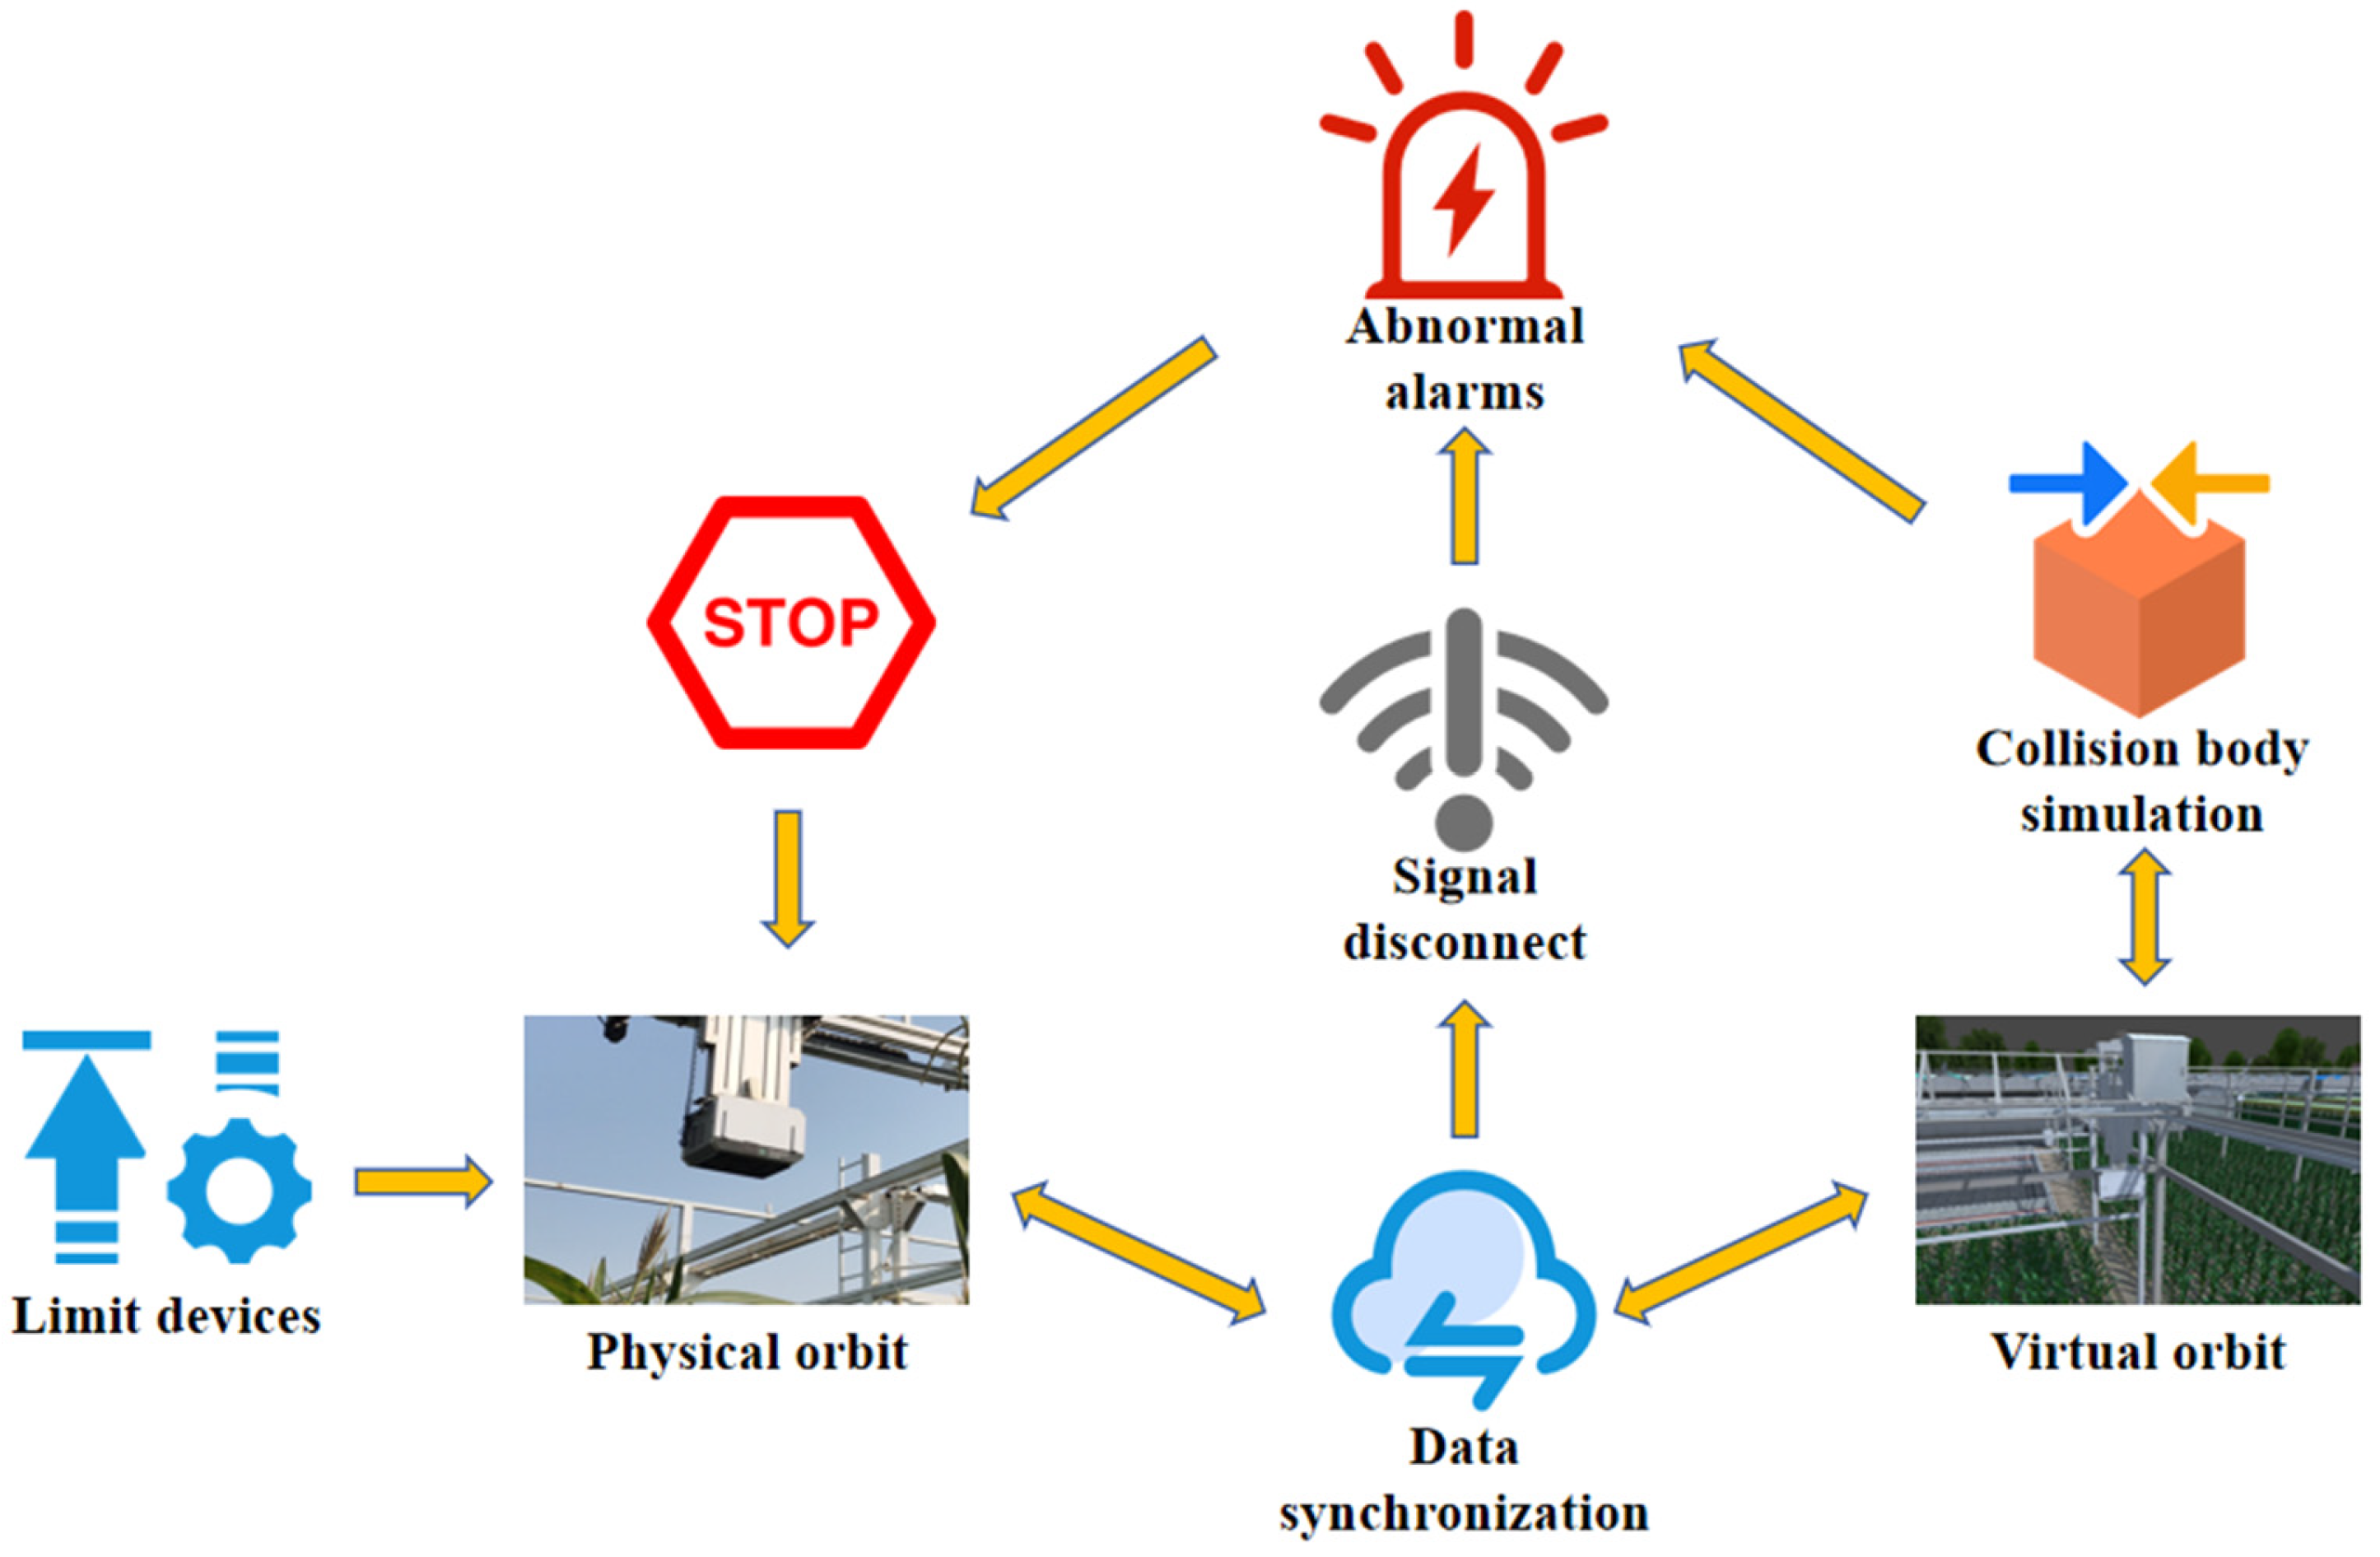
2.2.2. Digital Twin Condition Monitoring

Through real-time working condition data, two-way mapping is established between the virtual track platform and its physical counterpart. On the one hand, the virtual model reproduces the motion trajectory of the physical platform. On the other hand, it predicts potential risks through simulation and triggers early warnings, enabling active intervention via the decision-making control module to ensure stable operation. To achieve precise control, this study develops a two-way closed-loop monitoring system involving virtual simulation and data mapping, as illustrated in Figure 4.
In summary, compared with traditional two-dimensional video surveillance, the digital twin system builds a three-dimensional operation monitoring system through the fusion of multi-source data and the synchronization of real and virtual reality, reducing the frequency of on-site inspection by personnel and significantly improving the reliability and safety of automated collection.

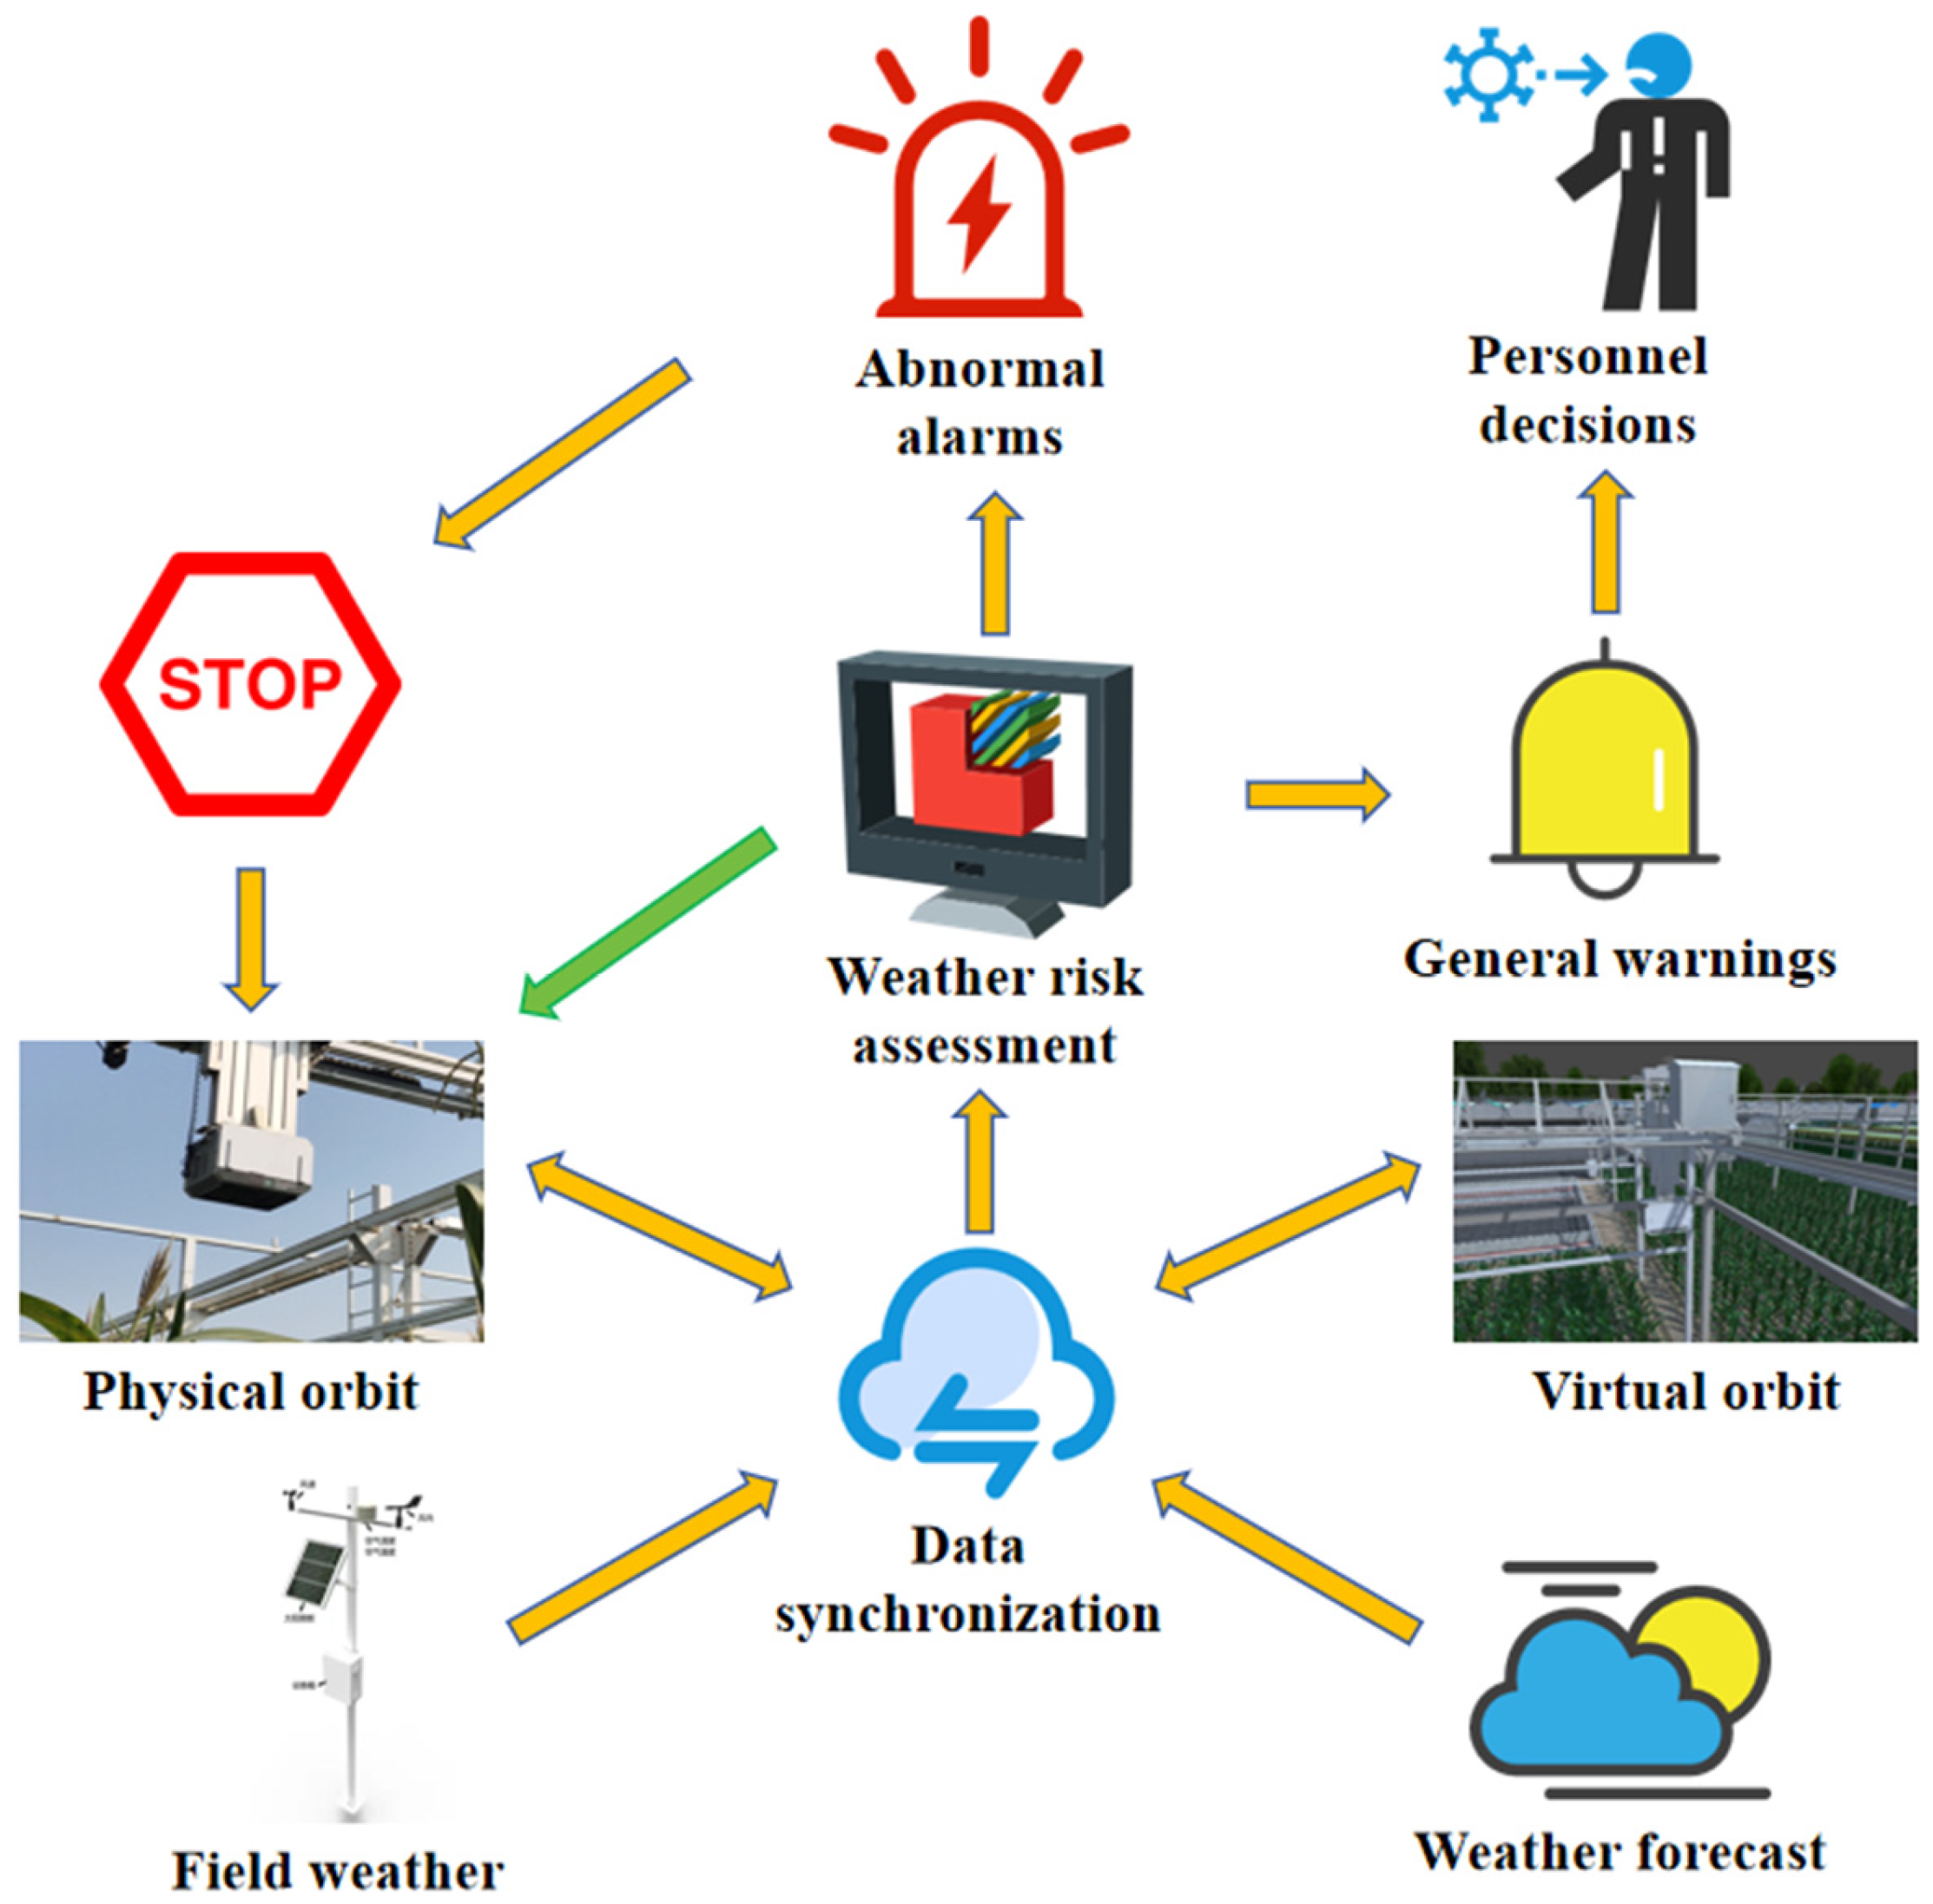
2.2.3. Meteorological Sensing-Driven Strategy for Dynamic Collection of Phenotypic Data

Phenotypic data quality is jointly influenced by sensor parameters (e.g., altitude and frame rate) and environmental disturbances (e.g., wind speed, light, and rainfall). In this study, we propose a dynamic acquisition strategy based on digital twins and develop a meteorological risk assessment model using the analytic hierarchy process (AHP) and fuzzy comprehensive evaluation theory [36,37] to achieve environmentally adaptive operation optimization. AHP is a structured multi-criteria decision-making method that decomposes complex problems into hierarchical factors and assigns relative weights based on expert knowledge and operational experience. Combined with fuzzy comprehensive evaluation, this approach enables the quantitative assessment and classification of meteorological risks under uncertainty, enhancing the system’s ability to adapt to changing environmental conditions (Figure 5).
(1)
Risk indicator framework.
Based on production logs from 2021 to 2024 and manual quality checks, especially of LiDAR reconstructed point clouds, we observed that when the mean wind speed is < 3.3m/s (Beaufort 0–2), image frames and point clouds remain usable; at 3.3–5.5 m/s (Beaufort 2–3), point clouds exhibit noticeable motion noise, and operators must decide on-site whether to continue; above 5.5 m/s (≥Beaufort 4) noise points increase sharply, reconstruction becomes unusable, and data acquisition is routinely stopped.
To validate these ranges, we installed an open jet wind tunnel (14 m × 4 m, axial fan plus diffuser, Figure 3a) on the south side of the trial field and performed a gradient blowing test on tasseling-stage maize (plant height ≈ 2.8 m), holding each wind class for 10 s [38], using high-definition cameras (1920 * 1080 pixels). The results are shown in Figure 6, red dots indicate the positions of maize ear leaves, and red arrows point to enlarged views of these positions.
  • 0~2 m/s: stems and leaves only slight vibrations;
  • 2~3 m/s: first visible leaf bending;
  • 3~4 m/s: larger leaf oscillation and point cloud noise visible to the naked eye;
  • >4 m/s: severe tilting and frequent frame loss.
These phenomena correspond with the production logs, so we define four wind-speed zones as follows: recommended (0–2 m/s), safe (2–3 m/s), to-be-evaluated (3–4 m/s), and stop (>4 m/s).
Our in-house multimodal sensor array is not fully waterproof; an engineering assessment shows that rainfall > 15 mm/h greatly increases the risk of lens splash and connector leakage. For safety redundancy, the operational threshold is set at 14.9 mm/h, and no water ingress failures have been recorded in the past two seasons.
To balance shadow effects and light stability, three acquisition windows are scheduled daily: 08:00–08:30 and 16:00–16:30 (soft side or diffuse light; shallow shadows) and 12:00–13:30 (strong overhead light with minimal shadows) [7]. Historical quality control indicates that when PAR ≤ 200 μmol/m2/s, image contrast and SNR deteriorate markedly; data collection is, therefore, suspended below this threshold.
Finally, given the platform’s operating procedure, extreme weather events (strong winds, heavy rain, or thunderstorms) can cause severe interference and may damage equipment. Whenever such conditions are forecasted or detected, field-based phenotyping is halted immediately to safeguard personnel and devices.
In the process of field phenological data collection, fully considering the influence of meteorological factors and flexibly adjusting the collection strategy according to different meteorological conditions is the key to ensuring data quality. In summary, this study describes the development of a specification for collecting meteorological conditions, integrating real-time weather, U 1 (wind speed, U 11 ; rainfall, U 12 ; irradiance, U 13 ), and weather forecasts, U 2 (wind level, U 21 ; weather phenomena, U 22 ), and constructing a two-level evaluation system (Equation (1)):
U = U 1 = {   U 11 ,   U 12 ,   U 13 }     U 2 = {   U 21 , U 22 }                    
(2)
Analytic hierarchy process (AHP) and fuzzy comprehensive evaluation methods
In order to ensure the objectivity and consistency of the weights of meteorological risk assessment indicators, this study adopts the AHP method to construct a three-layer recursive structure: objective layer (O)–criterion layer (Ui)–indicator layer (Uij). The specific steps are as follows.
(2.1) Expert ratings
Expert scoring was used to calculate the weights of the indicators; seven professionals who have long been engaged in the operation and maintenance of the orbital phenotyping platform, experimental planting, and phenotyping data analysis were invited to independently distribute questionnaires for scoring; and pairwise comparisons were made for the elements of the guideline layer and the indicator layer. After two rounds of investigation, the quartile difference, IQR ≤ 1, for each comparison element determined the convergence of opinions.
(2.2) Judgment matrix construction
Criterion-level judgment matrix (2 × 2) (Equation (2)):
A = 1 5 1 5 1 , ( k = 5 )
where “5” indicates that experts generally considered the importance of real-time weather versus weather forecasts to be “strong”.
The indicator-level judgment matrix (5 × 5) is shown in Table 1.
(2.3) Weighting and consistency tests
After constructing the judgment matrix, the eigenvector method is used to find the weight vector, and the consistency test is performed.
Criterion-layer eigenvectors, ω ( C ) = 0.70 ,   0.30 ; criterion-layer matrix order, n = 2 ; stochastic consistency indicators, R I 2 0 . No inspection is required.
Indicator-layer feature vectors, ω ( I ) = 0.50 , 0.30 , 0.20 C 1 , ω ( I ) = 0.67 , 0.33 C 2 ; indicator-layer matrix order, n = 5 ; maximum characteristic root, λ m a x = 5.12 , C I = λ m a x n n 1 = 0.03 , C R = C I R I 5 = 0.06 < 0.10 . These meet consistency requirements.
(2.4) Global weight synthesis and sorting
Summarizing the information above, the criterion-layer and indicator-layer weights are multiplied to obtain the global weights (Table 2).
(2.5) Judgment matrix construction
We can combine wind tunnel experiments, sensor specifications, and meteorological guidelines to determine the four levels of scoring (Table 3).
(3)
Fuzzy Integrated Evaluation
In order to map the quantitative results of multiple indicators into a unified risk level, a three-step process of affiliation function, relationship matrix, and fuzzy synthesis was used to find a composite score.
According to the risk-scoring criteria (Table 3), the indicators were evaluated by a fuzzy numerical evaluation (Equation (3)).
μ i = [ f a ( x a ) , f b ( x b ) , f c ( x c ) , f d ( x d ) ]
where μ i denotes the evaluation indicator, f a ( x a ) denotes the affiliation function of the 90 score, and the rest of the indicators are constructed in the same way according to the threshold.
Equation (3) represents the parameters of each segment in the risk score. After that, the affiliation relationship matrix is constructed (Equation (3)).
R = μ 11         μ 12         μ 13         μ 14 μ 21         μ 22         μ 23         μ 24 μ 31         μ 32         μ 33         μ 34 μ 41         μ 42         μ 43         μ 44 μ 51         μ 52         μ 53         μ 54
Each row of the matrix in Equation (3) represents an indicator, and each column corresponds to the rating scale [90, 70, 50, 30].
According to the fuzzy comprehensive evaluation model, using the total score method, the direct affiliation value, B, was obtained by synthesizing the results from the weight score vector and the relationship matrix:
B = U ° R = ( U i + μ i 1 ) , ( U i + μ i 2 ) , . . .
(4)
Risk evaluation rules
Risk decision-making: First, we set up hard constraint rules when encountering extreme weather (high winds, thunderstorms, rainstorms, etc.) directly in the hard rules to determine that the collection task and the plan directly stop to prevent the loss of equipment.
Risk determination involves using the principle of maximum subsidiarity for non-extreme weather:
M a r k = a r g m a x ( B )
Under non-extreme weather conditions, the risk level is determined by the principle of “maximum affiliation” based on the composite score (Equation (6)). The thresholds were optimized by combining the scoring criteria in Table 3 and the platform operation logs for 2023–2024 to finalize the decision logic for risk evaluation (Table 4).
Relying on the two-layer evaluation framework composed of real-time monitoring data and 72 h weather forecasts, this study first determines the weights of each meteorological indicator by using the hierarchical analysis method (AHP), combines the operational records of previous years to carry out fuzzy optimization, and constructs a meteorological risk assessment model. The model has been embedded in the digital twin system, which can synchronize the perception of field weather and the linkage of forecast information to generate real-time collection decisions for the orbital phenotype platform.

3. Results

To evaluate the real-world effectiveness of the DT-FieldPheno system, we designed a twofold validation experiment focused on (1) the system’s ability to achieve the real-time synchronization of heterogeneous data and (2) its responsiveness to environmental changes for adaptive decision-making. The following results, collected during 27 consecutive days of field operation, demonstrate the system’s feasibility and operational performance under actual field conditions.

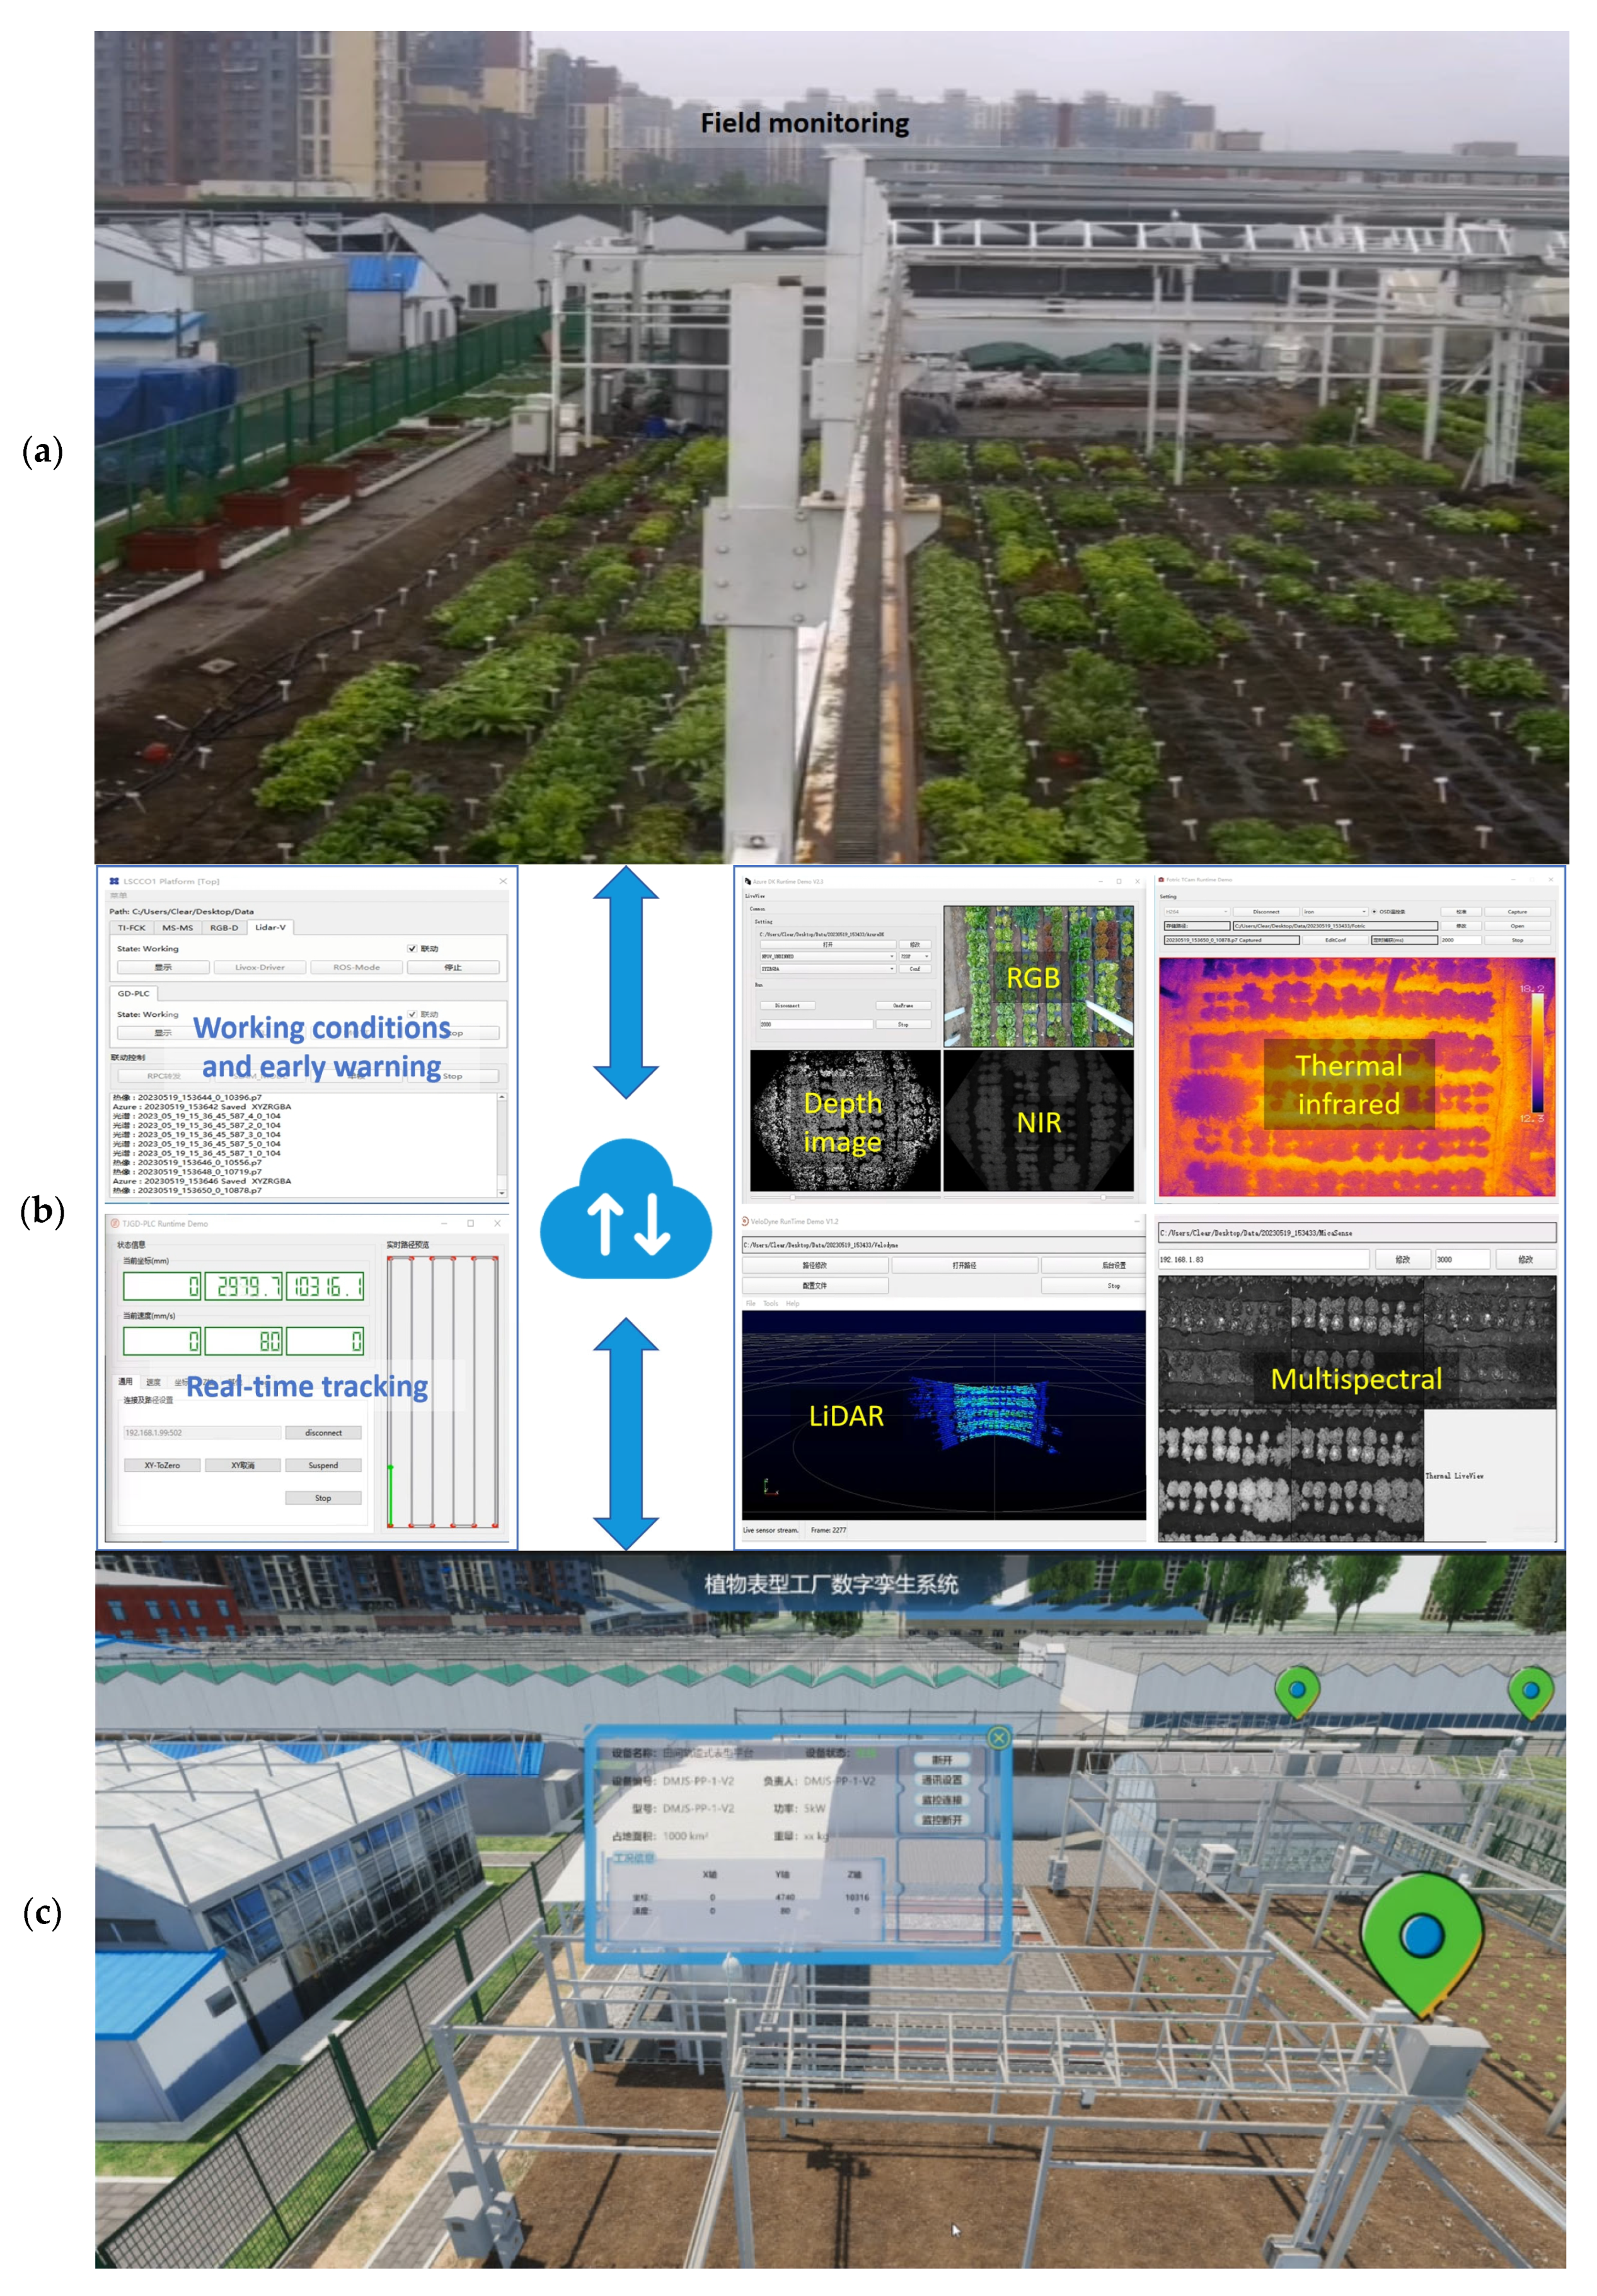
3.1. System Performance

This study validates the technical performance of the DT-FieldPheno system in terms of two dimensions: data transfer effectiveness and anomaly response capability.
(1)
Heterogeneous data real-time synchronization performance
The digital twin system developed for the rail-based crop phenotypic platform in this study has demonstrated, through real-world agricultural deployment, its ability to efficiently and stably transmit heterogeneous data under complex field conditions. By implementing a three-tier transmission strategy, the system effectively achieves the hierarchical optimization of data flow and ensures robust performance in challenging farmland environments. First, the phenotype data are optimized with edge caching and the TCP protocol, with a peak transmission rate of 11.2 MB/s (average 8.5 MB/s), which guarantees the real-time synchronization of data in the cloud; second, the condition data are transmitted through the lightweight MQTT protocol, which maintains a latency of ≤100 ms, even in the context of batch uploading the phenotype data, and fulfills the demand for the real-time mapping of the equipment state parameters. Finally, the on-site monitoring video is transmitted through an independent network with a delay of ≤500 ms, avoiding the problem of bandwidth competition from multiple sources. The system significantly improves the cooperative transmission efficiency of heterogeneous data through the three-level transmission strategy (edge caching, protocol hierarchy, and network isolation), which provides technical support for the stable operation of the digital twin base. To visually demonstrate the operational workflow and virtual physical synchronization of the system in a real-world field application, Figure 7 presents screenshots of the system interface, including the following: (7a) the field operation monitoring view; (7b) the platform status and multi-source data panel; and (7c) the 3D dynamic view of the digital twin system. Key interface modules, such as condition and warning information, rail status parameters, and sensor data panels, have been annotated to enhance the interpretability of the system design and support reproducibility.
(2)
Automated operational exception-handling ability
The system significantly improves the equipment management and control level through the virtual–real synergy mechanism. Through the double protection of virtual collision body simulation and physical limiters, the track overrun fault warning delay is shortened to 1.8 ± 0.2 s; communication interruption detection adopts a 5 s heartbeat mechanism, and the fault location time is compressed to 5 s (the traditional model usually requires the manual identification of the monitoring screen or on-site inspection to find faults, and the response time is often as long as 30 min). The system monitored the system data interruption nine times in about 100 total operating hours in 27 consecutive days of data collection tasks and recognized the warning in time, prompting the staff to solve it quickly. Experiments have shown that the use of a digital twin system allows staff to synchronize real-time working conditions through the digital sandbox combined with field site monitoring to achieve remote operation monitoring so that the frequency of manual inspection is reduced by 50%, greatly reducing the burden on the staff to optimize the savings in labor costs.

3.2. Meteorological Adaptive-Driven Optimization of Phenotype Acquisition

Based on the virtual–real dynamic coupling capability of the digital twin system (DT-FieldPheno), this study realizes the dynamic optimization of the phenotype collection task in an open farmland environment through a meteorological risk assessment model and real-time data fusion mechanism. The system constructs a two-level meteorological risk decision-making framework by integrating real-time monitoring data (5 min updates) from field weather stations and weather forecast data and combining the AHP and fuzzy comprehensive evaluation models.
In order to verify the dynamic regulation ability of the digital twin system under complex meteorological conditions, this study conducted a corn phenotypic data collection experiment from 18 June to 14 July 2024 in the experimental field in Beijing. The experiment was set up with three collection tasks (8:30, 13:30, and 16:30) during the daytime each day, with a single duration of 90 min. During the test period, the system triggered 46 high-risk decisions (risk score, B ≤ 63) and 296 general risk warnings (63 < B ≤ 70) during working hours. The key control cases are as follows (Table 5).
  • Extreme weather warnings: No extreme weather warnings occurred during the monitoring period of the weather risk assessment module of the digital twin system.
  • High-Risk Task Avoidance: On 23 June, the system monitored sustained level 3 wind (wind speed 4.0–4.8 m/s) and light fluctuations (PAR 600–1100 μmol/m2/s) and decided that the periods of 13:30 and 16:30 on that day were high-risk, so it took the initiative to cancel the two collection tasks to avoid invalid data collection due to the strong wind.
  • Dynamic Task Suspension–Resumption: On 24 June and 12 July, the system triggered a single high-risk warning for episodic gusts of wind (4.0 m/s) and heavy rainfall (7.5 mm/h), which was determined by suspending the collection for 5 min and then automatically resumed after the risk scores were normalized to reduce the amount of invalid data.
  • Non-Operational Hours Warning: On 21 and 29 June, the system detected light rain (1.2 mm/h) and heavy rain (rainfall >14.9 mm/h after 18:00) during non-operational hours, generating a warning log for manual review without affecting the normal operational process.
  • General Risk Alerts: A total of 296 general risk determinations were also triggered during the 27th experiment, with several frequent warnings occurring for high winds, rainfall, and other weather. The system issued alerts to assist the staff in operational decision-making.
Compared with the traditional manual decision-making mode (response delay, ≥30 min), the system monitors the meteorological environment in real-time through the closed-loop chain of “sensing–decision-making–execution”, risk assessment, and task optimization decision-making (environmental monitoring data are updated once every 5 min). The experimental results show that the system successfully avoids two high-risk collection events, dynamically optimizes two operation sequences, reduces the amount of invalid data storage by 300 G, and significantly improves the usability of phenotypic data during the 27-day monitoring cycle.
In this study, the optimized control strategy based on environmental adaptation significantly improves the meteorological adaptability of the phenological data acquisition system and builds a hierarchical warning mechanism through real-time monitoring data (wind speed, PAR, and rainfall) and weather forecast information (wind levels and weather phenomena) to avoid the risk of misjudgment from a single data source. For the first time, it realizes the fully automated closed loop of “data collection–risk determination–strategy adjustment” in open farmland scenarios, providing a reusable technology paradigm for the intelligentization of agricultural equipment.

4. Discussion

This study integrates digital twin technology with a rail-based crop phenotypic platform to construct an intelligent decision-making system that couples equipment, the environment, and data, forming a comprehensive framework for precision agriculture in open-field scenarios. Compared with traditional manual management approaches, the proposed system demonstrates significant advantages in three key aspects: First, a hierarchical data transmission strategy (incorporating TCP, MQTT, and dedicated video channels) ensures the efficient and coordinated synchronization of heterogeneous data. The system maintains stable operation even under fluctuating field network conditions. Second, real-time virtual–physical synchronization and sub-second anomaly detection reduce the need for manual inspections and enhance the system’s autonomous maintenance capabilities. Third, by integrating both weather forecasts and real-time field data (updated every 5 min), the system establishes a dual-layer risk assessment model that enables dynamic task adjustment. This effectively avoids inefficient operations during high-risk periods. Unlike environmental control models used in plant factory scenarios [17], which rely on passive monitoring, DT-FieldPheno achieves fully automated “monitoring–early warning–control” in open-field conditions for the first time. Notably, the system operated continuously for 27 days in real field trials without any major failures, demonstrating high engineering reliability. All core modules are built using standard industrial-grade hardware, offering strong compatibility and deployment flexibility. The system can be launched with a single command and maintained remotely, even in environments without high-performance computing infrastructure. Field tests also confirm its ease of deployment, with subsequent maintenance mainly involving routine sensor checks highlighting its practical feasibility for real-world agricultural applications.
Despite the DT-FieldPheno system demonstrating promising results in constructing a closed-loop framework for sensing, computation, decision-making, and execution, several limitations remain to be addressed.
First, although the current system integrates operational device data with weather information in real time, it has not yet incorporated critical environmental parameters such as soil moisture and canopy microclimate (e.g., temperature and humidity). This limits its potential for advanced decision-making tasks such as precision irrigation or variable-rate fertilization. Compared with digital twin platforms for citrus orchards [39], which support the coordinated optimization of light, temperature, and water, our system currently focuses on macro-level coordination between equipment and environmental conditions. Future enhancements should aim to incorporate multi-source sensing and high-resolution environmental modeling to unlock the system’s full potential.
Second, while the system supports online remote monitoring and can identify specific fault events, such as trajectory deviations and signal loss with sub-second latency, it lacks a robust mechanism for detecting non-structured hardware or software anomalies. As such, its overall autonomous maintenance ability remains limited and warrants further development.
Third, the current adaptive data acquisition strategy is driven by environmental risk assessment. It employs the analytic hierarchy process (AHP) and fuzzy comprehensive evaluation methods to construct risk-scoring models, which have proven effective in avoiding high-risk operations. However, these models rely heavily on expert-defined weights and lack the flexibility and generalization power of data-driven approaches such as machine learning. Their ability to adapt to complex and multidimensional environmental scenarios remains insufficient.
In addition, this study does not include a detailed analysis of system-level energy consumption or computational cost. The observed energy savings are achieved indirectly by reducing the frequency of operations under high-risk conditions through optimized task scheduling. Future work should consider incorporating node-level power monitoring and task-efficiency modeling to establish a quantitative link between operational performance and resource consumption, thereby supporting evaluations for large-scale deployment.
Regarding cross-crop adaptability, the current system has been fully validated in maize-dominant field scenarios. In addition, multiple data collection tasks have been conducted on short-stature crops such as lettuce using the same platform. Based on field observations, low-growing crops like lettuce, due to their plant height and leaf structure, demonstrate better stability under low wind speed conditions. Therefore, the current strategy is also applicable to such crops. However, considering the differences in sensitivity to meteorological factors such as wind speed and radiation between different crops, further parameter tuning and validation under multi-crop conditions will be required in future work.
Future research should also explore the development of self-supervised, cross-crop phenotyping models and incorporate large language model-based reasoning [40] to build intelligent control frameworks that integrate crop, environment, equipment, and domain knowledge. Additionally, further efforts should be directed toward advancing phenotypic platforms into fully integrated systems with multi-domain sensing, multi-system coordination, and low-operational-burden automation. These developments will enable long-term, high-frequency autonomous operations and support the deep integration of digital twin technologies into scientific research, production management, and educational outreach across the agricultural value chain.

5. Conclusions

This study presents DT-FieldPheno, a digital twin-driven system that integrates sensing, modeling, scheduling, and execution for high-throughput phenotyping under open-field conditions. The system enables real-time synchronization between a physical phenotyping platform and its virtual representation, providing a novel solution to challenges in operational reliability and data effectiveness in dynamic agricultural environments. The main conclusions are as follows.
Construction of a Digital Twin Architecture for Field Phenotypic Platforms: Based on the principles of virtual–physical mapping and model-driven control, a five-layer architecture and a multi-protocol coordination mechanism were designed. The system supports the tiered acquisition, synchronization, and visualization of heterogeneous data—including phenotypic traits, device conditions, and environmental variables—ensuring stable operation and consistency under complex field conditions. Implementation of Autonomous Monitoring and Risk-Responsive Control: With the integration of virtual collision bodies, trajectory simulation, and heartbeat signal monitoring, the system achieves sub-second fault response, significantly reducing the manual inspection workload and enhancing operational safety. The interactive 3D twin interface provides comprehensive situational awareness and enables remote intervention in real time. Development of an Environmental Risk-Aware Scheduling Strategy: A dual-layer risk assessment model was constructed using the analytic hierarchy process (AHP) and fuzzy comprehensive evaluation, enabling the dynamic optimization of task scheduling and the proactive avoidance of high-risk operations. During a 27-day field deployment, the system successfully avoided two weather risk scenarios and rescheduled two tasks, improving data reliability and operational efficiency. Compared to existing digital twin applications in controlled environments such as plant factories and greenhouses, DT-FieldPheno is the first to realize a real-time “perception–prediction–decision–execution” loop in an open, unstructured agricultural setting. This represents a major step forward in the shift from passive monitoring to intelligent, proactive field operation.
Future research will focus on improving model granularity for key environmental factors such as soil moisture and canopy microclimate, enhancing cross-crop adaptability, and evaluating energy consumption and computational costs to support scalable deployment. In addition, the integration of self-supervised learning and large language models will be explored to build intelligent control frameworks that fuse crop, device, environmental, and knowledge domains. These advancements will drive the evolution of phenotypic platforms toward greater intelligence, robustness, and ease of deployment, enabling the deeper integration of digital twin technologies across research, production, and education in agriculture.

Author Contributions

Conceptualization, X.G.; data curation, W.G., M.Z. and X.L.; funding acquisition, X.G.; methodology, X.G., H.L. and X.L.; resources, M.Z.; software, H.L., W.G., L.Z. and S.W.; supervision, X.G.; validation, H.L.; visualization, H.L.; writing—original draft, H.L., H.M., W.W. and X.G.; writing—review and editing, H.L., W.W. and X.G. All authors have read and agreed to the published version of the manuscript.

Funding

This work was partially supported by the National Key R&D Program of China (2022YFD2002300) and the Project of Collaborative Innovation Centre for Crop Phenomics, Beijing Academy of Agriculture and Forestry Sciences (No. KJCX20240406).

Institutional Review Board Statement

Not applicable.

Data Availability Statement

The data will be made available upon request.

Acknowledgments

The authors would like to thank the editor and the reviewers for their contributions.

Conflicts of Interest

The authors declare no commercial or financial conflicts of interest. This research was independently conducted with funding from the National Key R&D Program of China.

Appendix A

Table A1. Weather risk assessment model triggers high-risk specific details.
Real-Time WeatherWeather ForecastRisk Score B
Measurement TimeWind m/s PAR μmol/m2/sPrecip mm/5 min Wind PowerWeather Level *Weather
6/21/24 12:503.08276.50.213Light rain62.6
6/23/24 12:454.03840.50.032Cloudy~Sunny60.2
6/23/24 12:504.06446.80.032Cloudy~Sunny57.4
6/23/24 13:404.331409.90.032Cloudy~Sunny63
6/23/24 13:504.24351.60.032Cloudy~Sunny57.4
6/23/24 14:004.17265.50.032Cloudy~Sunny57.4
6/23/24 14:154.121221.30.032Cloudy~Sunny63
6/23/24 14:255.191278.10.032Cloudy~Sunny63
6/23/24 14:304.491272.60.032Cloudy~Sunny63
6/23/24 14:354.721292.70.032Cloudy~Sunny63
6/23/24 14:454.381089.50.032Cloudy~Sunny63
6/23/24 15:054.331085.80.032Cloudy~Sunny63
6/23/24 15:104.041054.70.032Cloudy~Sunny63
6/23/24 15:154.341029.10.032Cloudy~Sunny63
6/23/24 15:204.371030.90.032Cloudy~Sunny63
6/23/24 15:304.03979.60.032Cloudy~Sunny60.2
6/23/24 16:054.51596.90.032Cloudy~Sunny57.4
6/23/24 16:104.54708.60.032Cloudy~Sunny60.2
6/23/24 16:354.26655.50.032Cloudy~Sunny60.2
6/23/24 16:404.28325.90.032Cloudy~Sunny57.4
6/23/24 16:454.66699.50.032Cloudy~Sunny60.2
6/23/24 16:554.18703.10.032Cloudy~Sunny60.2
6/23/24 17:004.19712.30.032Cloudy~Sunny60.2
6/23/24 17:154.06477.90.032Cloudy~Sunny57.4
6/23/24 17:403.78181.30.032Cloudy~Sunny61.6
6/23/24 17:453.69197.80.032Cloudy~Sunny61.6
6/23/24 17:504.10146.50.032Cloudy~Sunny54.6
6/23/24 17:553.78144.70.032Cloudy~Sunny61.6
6/23/24 18:104.05250.90.032Cloudy~Sunny57.4
6/23/24 18:253.47184.90.032Cloudy~Sunny61.6
6/23/24 18:303.05157.50.032Cloudy~Sunny61.6
6/23/24 18:353.37104.40.032Cloudy~Sunny61.6
6/23/24 18:403.23128.20.032Cloudy~Sunny61.6
6/23/24 18:453.1495.20.032Cloudy~Sunny61.6
6/23/24 18:503.3093.40.032Cloudy~Sunny61.6
6/23/24 18:553.3771.40.032Cloudy~Sunny61.6
6/24/24 13:554.02195.90.021Sunny60.6
6/29/24 18:053.350.00.624Heavy rain~Light rain53.8
6/29/24 18:103.710.00.624Heavy rain~Light rain53.8
6/29/24 18:153.400.00.824Heavy rain~Light rain53.8
6/29/24 18:203.430.00.424Heavy rain~Light rain58
6/29/24 18:253.000.02.024Heavy rain~Light rain56.6
6/29/24 18:302.160.01.624Heavy rain~Light rain56.6
6/29/24 18:352.290.00.624Heavy rain~Light rain60.8
6/29/24 18:402.180.00.624Heavy rain~Light rain60.8
7/12/24 13:402.410.03.824Heavy rain~Light rain56.6
* Weather level [1, 2, 3, 4] corresponds to the scale [90, 70, 50, 30].
Figure A1. DT-FieldPheno system showing other function screens. (a) Showcase roaming. (b) Video monitoring. (c) IOT control. (d) Online calculation. (e) Crop digital twin maps. (f) Weather visualization.
Agriculture 15 01217 g0a1

References

  1. Zhang, J.; Yao, Q.; Zhou, G.; Wu, W.; Xiu, X.; Wang, J. Intelligent Identification of Crop Agronomic Traits and Morphological Structure Phenotypes: A Review. Smart Agric. 2024, 6, 14–27. [Google Scholar] [CrossRef]
  2. Song, P.; Wang, J.; Guo, X.; Yang, W.; Zhao, C. High-Throughput Phenotyping: Breaking through the Bottleneck in Future Crop Breeding. Crop J. 2021, 9, 633–645. [Google Scholar] [CrossRef]
  3. Rui, Z.; Zhang, Z.; Zhang, M.; Azizi, A.; Igathinathane, C.; Cen, H.; Vougioukas, S.; Li, H.; Zhang, J.; Jiang, Y. High-Throughput Proximal Ground Crop Phenotyping Systems—A Comprehensive Review. Comput. Electron. Agric. 2024, 224, 109108. [Google Scholar] [CrossRef]
  4. Wen, W.; Gu, S.; Zhang, Y.; Yang, W.; Guo, X. Standard Framework Construction of Technology and Equipment for Big Data in Crop Phenomics. Engineering 2024, 42, 175–184. [Google Scholar] [CrossRef]
  5. Fan, J.; Li, Y.; Yu, S.; Gou, W.; Guo, X.; Zhao, C. Application of Internet of Things to Agriculture—The LQ-FieldPheno Platform: A High-Throughput Platform for Obtaining Crop Phenotypes in Field. Research 2023, 6, 0059. [Google Scholar] [CrossRef]
  6. Fan, J.; Zhang, Y.; Wen, W.; Gu, S.; Guo, X. The Future of Internet of Things in Agriculture: Plant High-Throughput Phenotypic Platform. J. Clean. Prod. 2020, 280, 123651. [Google Scholar] [CrossRef]
  7. Li, Y.; Wen, W.; Fan, J.; Gou, W.; Gu, S.; Lu, X.; Yu, Z.; Wang, X.; Guo, X. Multi-Source Data Fusion Improves Time-Series Phenotype Accuracy in Maize under a Field High-Throughput Phenotyping Platform. Plant Phenomics 2023, 5, 0043. [Google Scholar] [CrossRef]
  8. Tao, F.; Zhang, M. Digital Twin Shop-Floor: A New Shop-Floor Paradigm towards Smart Manufacturing. IEEE Access 2017, 5, 20418–20427. [Google Scholar] [CrossRef]
  9. Tao, F.; Cheng, J.; Qi, Q.; Zhang, M.; Zhang, H.; Sui, F. Digital Twin-Driven Product Design, Manufacturing and Service with Big Data. Int. J. Adv. Manuf. Technol. 2018, 94, 3563–3576. [Google Scholar] [CrossRef]
  10. Park, S.; Maliphol, S.; Woo, J.; Fan, L. Digital Twins in Industry 4.0. Electronics 2024, 13, 2258. [Google Scholar] [CrossRef]
  11. Li, H.; Yang, Y.; Zhang, C.; Zhang, C.; Chen, W. Visualization Monitoring of Industrial Detonator Automatic Assembly Line Based on Digital Twin. Sustainability 2023, 15, 7690. [Google Scholar] [CrossRef]
  12. Rauch, M.; Hascoet, J.-Y. Opening New Opportunities for Aeronautic, Naval and Train Large Components Realization with Hybrid and Twin Manufacturing. J. Mach. Eng. 2022, 22, 5–20. [Google Scholar] [CrossRef]
  13. Susarev, S.V.; Orlov, S.P.; Morev, A.S.; Kravets, O.J. Digital Tests of the Robotic Chassis’ Cyber-Physical System for Agricultural Unmanned Vehicle. J. Phys. Conf. Ser. 2019, 1399, 044032. [Google Scholar] [CrossRef]
  14. Guo, D.; Wang, L.; Du, Y.; Wu, Z.; Zhang, W.; Zhi, Q.; Ma, R. Online Optimization of Adjustable Settings for Agricultural Machinery Assisted by Digital Twin. Comput. Electron. Agric. 2024, 227, 109504. [Google Scholar] [CrossRef]
  15. Slob, N.; Hurst, W. Digital Twins and Industry 4.0 Technologies for Agricultural Greenhouses. Smart Cities 2022, 5, 1179–1192. [Google Scholar] [CrossRef]
  16. Melesse, T.Y. Digital Twin-Based Applications in Crop Monitoring. Heliyon 2025, 11, e42137. [Google Scholar] [CrossRef]
  17. Skobelev, P.O.; Mayorov, I.V.; Simonova, E.V.; Goryanin, O.I.; Yalovenko, V.V. Development of Models and Methods for Creating a Digital Twin of Plant within the Cyber-Physical System for Precision Farming Management. J. Phys. Conf. Ser. 2020, 1703, 012022. [Google Scholar] [CrossRef]
  18. Ibrahimov, F.; Rzayeva, U.; Balayev, R. Opportunities and Perspectives of the Digital Twins’ Conception: The Case in Agriculture. East. -Eur. J. Enterp. Technol. 2023, 1, 102–112. [Google Scholar] [CrossRef]
  19. Escriba-Gelonch, M.; Liang, S.; Van Schalkwyk, P.; Fisk, I.; Long, N.V.D.; Hessel, V. Digital Twins in Agriculture: Orchestration and Applications. J. Agric. Food Chem. 2024, 72, 10737–10752. [Google Scholar] [CrossRef]
  20. Liu, T.; Bao, J.; Zheng, Y.; Lu, Y. Digital Twin and Industrial Intelligence. Springer Cham 2025, 383–453. [Google Scholar] [CrossRef]
  21. Ibrahim, M.; Rjabtikov, V.; Rasslkin, A. Digital Shadow of an Electric Vehicle-Permanent Magnet Synchronous Motor Drive for Real-Time Performance Monitoring. Digit. Twins Appl. 2025, 2, e12024. [Google Scholar] [CrossRef]
  22. Iuchi, Y.; Kitamura, T.; Honjo, S.; Doi, T.; Imaoka, K.; Emaru, T. Method for Improving Speed of Instance Segmentation by Limiting Image Area Using High Precision Maps in Agricultural Field. Proc. JSME Annu. Conf. Robot. Mechatron. (Robomec) 2022, 2022, 1A1-M01. [Google Scholar] [CrossRef]
  23. Guo, X.; Qiu, Y.; Nettleton, D.; Schnable, P.S. High-Throughput Field Plant Phenotyping: A Self-Supervised Sequential CNN Method to Segment Overlapping Plants. Plant Phenomics 2023, 5, 0052. [Google Scholar] [CrossRef] [PubMed]
  24. Gao, Y.; Li, Y.; Jiang, R.; Zhan, X.; Lu, H.; Guo, W.; Yang, W.; Ding, Y.; Liu, S. Enhancing Green Fraction Estimation in Rice and Wheat Crops: A Self-Supervised Deep Learning Semantic Segmentation Approach. Plant Phenomics 2023, 5, 0064. [Google Scholar] [CrossRef]
  25. Wu, Y.; Wen, W.; Gu, S.; Huang, G.; Wang, C.; Lu, X.; Xiao, P.; Guo, X.; Huang, L. Three-Dimensional Modeling of Maize Canopies Based on Computational Intelligence. Plant Phenomics 2024, 6, 0160. [Google Scholar] [CrossRef]
  26. Moghadam, P.; Lowe, T. Digital Twin for the Future of Orchard Production Systems. Proceedings 2019, 36, 92. [Google Scholar] [CrossRef]
  27. Catala-Roman, P.; Navarro, E.A.; Segura-Garcia, J.; Garcia-Pineda, M. Harnessing Digital Twins for Agriculture 5.0: A Comparative Analysis of 3D Point Cloud Tools. Appl. Sci. 2024, 14, 1709. [Google Scholar] [CrossRef]
  28. Costa, G.; Forestiero, A.; Gentile, A.F.; Macrì, D.; Ortale, R.; Bernardi, B.; Cerruto, E. An AI-Driven Architecture for Precision Agriculture: IoT, Machine Learning, and Digital Twin Integration for Sustainable Crop Protection. In Proceedings of the 2024 IEEE International Conference on Big Data (BigData), Washington, DC, USA, 15–18 December 2024; pp. 4685–4691. [Google Scholar]
  29. Zarembo, I.; Kodors, S.; Apeināns, I.; Lācis, G.; Feldmane, D.; Rubauskis, E. Digital twin: Orchard management using uav. ETR 2023, 1, 247–251. [Google Scholar] [CrossRef]
  30. Madjid, M.K.A.; Noureddine, S.; Amina, B.; Khelifa, B.; Sofiane, A.; Ahmed, C. Design a Digital Twin Sensors System Using cGAN-LSTM for Greenhouse Climate Control. In Proceedings of the 2024 4th International Conference on Embedded & Distributed Systems (EDiS), Bechar, Algeria, 3–5 November 2024; pp. 132–136. [Google Scholar]
  31. Goldenits, G.; Mallinger, K.; Raubitzek, S.; Neubauer, T. Current Applications and Potential Future Directions of Reinforcement Learning-Based Digital Twins in Agriculture. Smart Agric. Technol. 2024, 8, 100512. [Google Scholar] [CrossRef]
  32. Zhang, J.; Wang, X.; Ni, X.; Dong, F.; Tang, L.; Sun, J.; Wang, Y. Neural Radiance Fields for Multi-Scale Constraint-Free 3D Reconstruction and Rendering in Orchard Scenes. Comput. Electron. Agric. 2024, 217, 108629. [Google Scholar] [CrossRef]
  33. Chunjiang, Z. Big Data of Plant Phenomics and Its Research Progress. J. Agric. Big Data 2019, 12, 5–14. [Google Scholar]
  34. Ramos, J.H.S.; Barra, M.A.Q.; Ponce, G.R.V.; Coral, D.L.C.; Sergio, E.; Chirapo, K.A.C. Real-Time Monitoring of Constant Pressure and Variable Frequency Drive Motor in a Control Plant Using Modbus TCP/IP, IoT Core, MQTT, and Grafana. Springer Cham 2025, 586, 881–890. [Google Scholar] [CrossRef]
  35. Haman, S.; Temoa, D.; Djomadji, E.M.D. Kolyang Proposal for Energy Consumption Reduction between Connected Objects in a Network Running on MQTT Protocol. J. Comput. Commun. 2024, 12, 12. [Google Scholar] [CrossRef]
  36. Adnan, R.S.A.; Kumaravel, R. Prioritization of Meteorological Factors for Rainfall Prediction: A Hybrid Fuzzy AHP and Fuzzy TOPSIS Approach. Phys. Scr. 2025, 100, 055236. [Google Scholar] [CrossRef]
  37. Han, B.; Ming, Z.; Zhao, Y.; Wen, T.; Xie, M. Comprehensive Risk Assessment of Transmission Lines Affected by Multi-Meteorological Disasters Based on Fuzzy Analytic Hierarchy Process. Int. J. Electr. Power Energy Syst. 2021, 133, 107190. [Google Scholar] [CrossRef]
  38. Huang, G.; Zhang, Y.; Gu, S.; Wen, W.; Lu, X.; Guo, X. Identifying Key Factors Influencing Maize Stalk Lodging Resistance through Wind Tunnel Simulations with Machine Learning Algorithms. Artif. Intell. Agric. 2025, 15, 316–326. [Google Scholar] [CrossRef]
  39. Kim, S.; Heo, S. An Agricultural Digital Twin for Mandarins Demonstrates the Potential for Individualized Agriculture. Nat. Commun. 2024, 15, 1561. [Google Scholar] [CrossRef]
  40. Chunjiang, Z.; Jingchen, L.I.; Huarui, W.U.; Yusen, Y. Vegetable Crop Growth Modeling in Digital Twin Platform Based on Large Language Model Inference. Smart Agric. 2024, 6, 63. [Google Scholar] [CrossRef]
Figure 1. Digital twin architecture for a rail-based crop phenotypic platform.
Agriculture 15 01217 g001
Figure 2. Data flow and virtual–physical synchronization in the digital twin system for a rail-based phenotypic platform.
Agriculture 15 01217 g002
Figure 3. Phenotype platform scene, from real to virtual. (a) Realistic phenotype platform scene; (b) virtual phenotype platform scene; (c) rail-based platform simulation motion trajectory.
Agriculture 15 01217 g003aAgriculture 15 01217 g003b
Figure 4. Collision body simulation warning and real-time working condition monitoring mechanism.
Agriculture 15 01217 g004
Figure 5. Adaptive optimization and regulation mechanism of meteorological environment.
Agriculture 15 01217 g005
Figure 6. Effectiveness of wind tunnel observation experiment on corn during grain filling.
Agriculture 15 01217 g006
Figure 7. Real time synchronization of digital twin system data: (a) field monitoring; (b) work condition data and multi-source heterogeneous phenotype data; (c) digital twin system.
Agriculture 15 01217 g007
Table 1. Indicator-level judgment matrix.
U11U12U13U21U22
Wind speed, U1113537
Rainfall, U121/31213
Irradiance, U131/51/2112
Wind power, U211/31113
Weather, U221/71/31/21/31
Table 2. Hierarchy and weighting of the indicator system.
ObjectiveCriteriaWeightsIndicatorLocal WeightGlobal WeightSorting
Weather risk assessment OU10.7U110.50.351
U120.30.212
U130.20.144
U20.3U210.70.213
U220.30.095
Table 3. Risk scoring criteria.
Risk Score90705030
U11 (m/s) ≤22.1–3.03.1–4.0>4
U12 (mm/h)≤1.51.6–6.97.0–14.9>14.9
U21≤234≥5
U21 (μmol/m2/s) ≥1000600–1000200–600≤200
U22∈Sunny∈Overcast, cloudy∈Light rain, showers∈Moderate rain and above
Table 4. Risk evaluation decision logic.
Risk JudgmentJudgment Scoring ThresholdsResponse Strategy
Security B > 70 Perform acquisition tasks as planned
General warning 63 < B 70 Alert the operator to the details of the warning
Risk warning B 63 Cancelation or suspension of tasks; optimized scheduling to high-scoring timeslots
Table 5. Weather risk assessment models trigger high-risk statistics (see Table A1 in Appendix A for details).
Risk levelDatesNumber of DeterminationsParticularsStrategic Decision
High-risk warnings21 June1Weather: Light rain, 12:50 p.m., combination of rainfall and low PAR levelsDuring non-operational hours, prompt the operator
23 June35Level 3 winds; the risk warning is concentrated after noon; light intensity is higher at noon, and afternoon warning moment wind speeds are >4 m/s; evening wind speeds are back down 3 m/s; light insufficientCancelation of the 13:30 slot; cancelation of the 16:30 slot
24 June1Overlapping effects of episodic gusts and overcast events; wind speed, 4.0 m/s; PAR = 196 μmol/m2/sPause acquisition for 5 min and continue
29 June8Average wind speed, 3.5 m/s; heavy rain; risk warning time clustered after 18:00during non-operational hours; prompt the operator
12 July1Weather: Heavy to moderate rain; warning triggered at 13:40 due to increased rainfallPause acquisition for 5 min and continue
Disclaimer/Publisher’s Note: The statements, opinions and data contained in all publications are solely those of the individual author(s) and contributor(s) and not of MDPI and/or the editor(s). MDPI and/or the editor(s) disclaim responsibility for any injury to people or property resulting from any ideas, methods, instructions or products referred to in the content.

