Article

Soil Phosphorus Content, Organic Matter, and Elevation Are Key Determinants of Maize Harvest Index in Arid Regions

1
College of Life Sciences, Shihezi University, Shihezi 832003, China
2
Xinjiang Production and Construction Corps Key Laboratory of Oasis Town and Mountain, Basin System Ecology, Shihezi University, Shihezi 832003, China
3
Department of Agriculture and Rural Affairs of Xinjiang, Urumqi 830000, China
4
Xinjiang Shihezi Vocational and Technical College, Shihezi 832003, China
*
Author to whom correspondence should be addressed.
There authors contributed equally to this work.
Agriculture 2025, 15(11), 1207; https://doi.org/10.3390/agriculture15111207
Submission received: 29 April 2025 / Revised: 27 May 2025 / Accepted: 30 May 2025 / Published: 31 May 2025
(This article belongs to the Section Agricultural Soils)

Abstract

This study systematically investigates the mechanistic effects of multifactor interactions (including soil properties, climatic conditions, and cultivation practices) on the productivity parameters (grain yield, stover yield, dry biomass, harvest index) of maize cultivars of different maturity groups in the arid region of Xinjiang, China. Twelve representative maize-growing counties were selected as study sites, where we collected maize samples to measure HI, grain yield, stover yield, and soil physicochemical properties (e.g., organic matter content, total nitrogen, and available phosphorus). Additionally, climate data (effective accumulated temperature) and agronomic parameters (planting density) were integrated to comprehensively analyze the interactive effects of multiple environmental factors on HI using structural equation modeling (SEM). The results demonstrated significant varietal differences in HI across maturity periods. Specifically, early-maturing cultivars showed the highest average HI (0.58), significantly exceeding those of medium-maturing (0.55) and late-maturing varieties (0.54). Environmental analysis further revealed that soil phosphorus content (both available and total phosphorus), elevation, and organic matter content significantly positively affected HI, whereas soil bulk density and electrical conductivity exhibited negative impacts. Notably, HI exhibited a strong negative correlation with stover yield (R2 = 0.49), but remained relatively stable across different dry matter (DM) and grain yield levels. Despite the strong positive correlation between DM and grain yield (R2 = 0.81), the relative stability of HI suggests that yield improvement requires balanced optimization of both DM and partitioning efficiency. This study provides crucial theoretical foundations for optimizing high-yield maize cultivation systems, regulating fertilizer application rates and their ratios, and improving the configuration of planting density in arid regions. These findings offer practical guidance for sustainable agricultural development in similar environments.

1. Introduction

Arid and semi-arid regions, which constitute critical components of global terrestrial ecosystems, cover approximately 41% of the Earth’s land surface [1]. These areas are characterized by water scarcity and ecological sensitivity due to imbalanced precipitation and high evapotranspiration rates, making them particularly vulnerable to climate change [2]. Northwest China exemplifies these challenges, receiving less than 500 mm of annual precipitation, yet supporting 51% of the nation’s arid-zone cultivated land [3]. A typical representative is Xinjiang, where maize was cultivated on 1437.66 thousand hectares in 2023, accounting for 21.02% of the region’s total sown area for major crops (National Bureau of Statistics, https://data.stats.gov.cn/search.htm?s (accessed on 10 June 2024)).
The harvest index (HI), a key metric for evaluating the allocation efficiency of photosynthetic assimilates to economic yield [4], holds multidisciplinary significance. In agronomy, the HI quantifies the ratio of grain yield to aboveground biomass [5]; in plant ecology, it reflects resource allocation strategies toward reproductive structures [6,7]; and in soil science, it facilitates the estimation of straw carbon input [8]. With the rise of the bioenergy industry, HI has gained increasing importance for straw resource assessment and bioethanol feedstock prediction [9,10]. As the material basis of yield formation, dry matter (DM) accumulation and partitioning directly determine grain productivity. High yields fundamentally depend on enhanced DM production and its efficient translocation to grains [11]. However, yield formation mechanisms vary significantly among crops: wheat primarily achieves yield gains through HI improvement [12,13]; rice initially focused on HI enhancement, before shifting toward DM-driven strategies after 1980 [14]; whereas maize, as a high-photosynthetic-efficiency C4 crop, achieves yield breakthroughs through the synergistic effects of dense planting, genetic improvement, and post-anthesis DM [15,16]. Geographical disparities exist in maize HI improvement. Early North American cultivars maintained relatively stable HI values [17,18], whereas modern Chinese and Argentinian varieties have elevated HI values of 0.37–0.51, demonstrating genetic improvement potential [19,20]. Recent research reveals that U.S. commercial hybrids exhibit HI fluctuations between 0.471 and 0.643, with a 16.3% increase from 1964 to 2020, primarily attributable to breeding advancements [21]. Therefore, the HI retains significant improvement potential, underscoring the need for a mechanistic understanding of DM–yield variations and their interactions with the HI in modern maize varieties.
Ecological research on biomass allocation reveals that while total biomass remains relatively stable under varying environmental conditions, resource limitations primarily influence partitioning patterns—particularly root–shoot allocation [22], stem–leaf distribution [23], and the HI [24]. These partitioning processes are regulated through complex interactions involving four key factors: (1) genetic potential, (2) agronomic practices (e.g., fertilizer rate and planting density), (3) climatic and geographic conditions (e.g., latitude, temperature, elevation), and (4) soil properties (e.g., organic carbon content, bulk density, total phosphorus) [25,26,27,28]. HI development is governed by genotype–environment interactions [4,29], which are particularly evident in China’s ecologically diverse maize belt [30,31]. This heterogeneity results in distinct regional growth patterns [32,33,34] and substantial spatial variability in HI as a fundamental yield determinant [35,36]. Research demonstrates that the relative contributions of the HI and DM to yield vary significantly across environments [34,37]. Key management factors—including planting density [16], irrigation [38], and nitrogen supply [39]—mediate DM–HI relationships by altering resource (light, water, nutrient) allocation patterns. Concurrently, soil physicochemical properties influence root development and plant architecture, thereby affecting canopy light interception and grain-filling duration [40]. For example, critical growth parameters such as the leaf area index and DM show strong correlations with soil moisture and nutrient dynamics [41,42], where optimal nutrition delays flowering while simultaneously enhancing grain filling [43]. These findings underscore the importance of understanding soil–environment–agronomy interactions for elucidating yield formation mechanisms across different regional contexts.
This study systematically investigates the complex interactions between the maize harvest index (HI) and growth parameters, environmental factors, and management practices in arid regions, with three primary research objectives. First, it quantifies growth-period effects on maize growth parameters by analyzing the specific impacts of distinct growth phases on dry matter (DM) accumulation, stover yield, grain yield, and HI, while elucidating their inter-relationships. Second, the research evaluates high-density planting systems’ influence on HI dynamics, specifically investigating how increased planting density modifies grain–stover partitioning patterns and deciphering the physiological mechanisms underlying density-mediated HI alterations. Third, the study identifies key drivers for HI enhancement through determination of dominant soil nutrient constituents influencing photosynthate allocation, the establishment of environmental predictors for HI optimization, and the development of evidence-based strategies for HI improvement in water-limited ecosystems. These integrated objectives aim to advance understanding of crop performance determinants under arid conditions, while providing actionable insights for agricultural management.

2. Materials and Methods
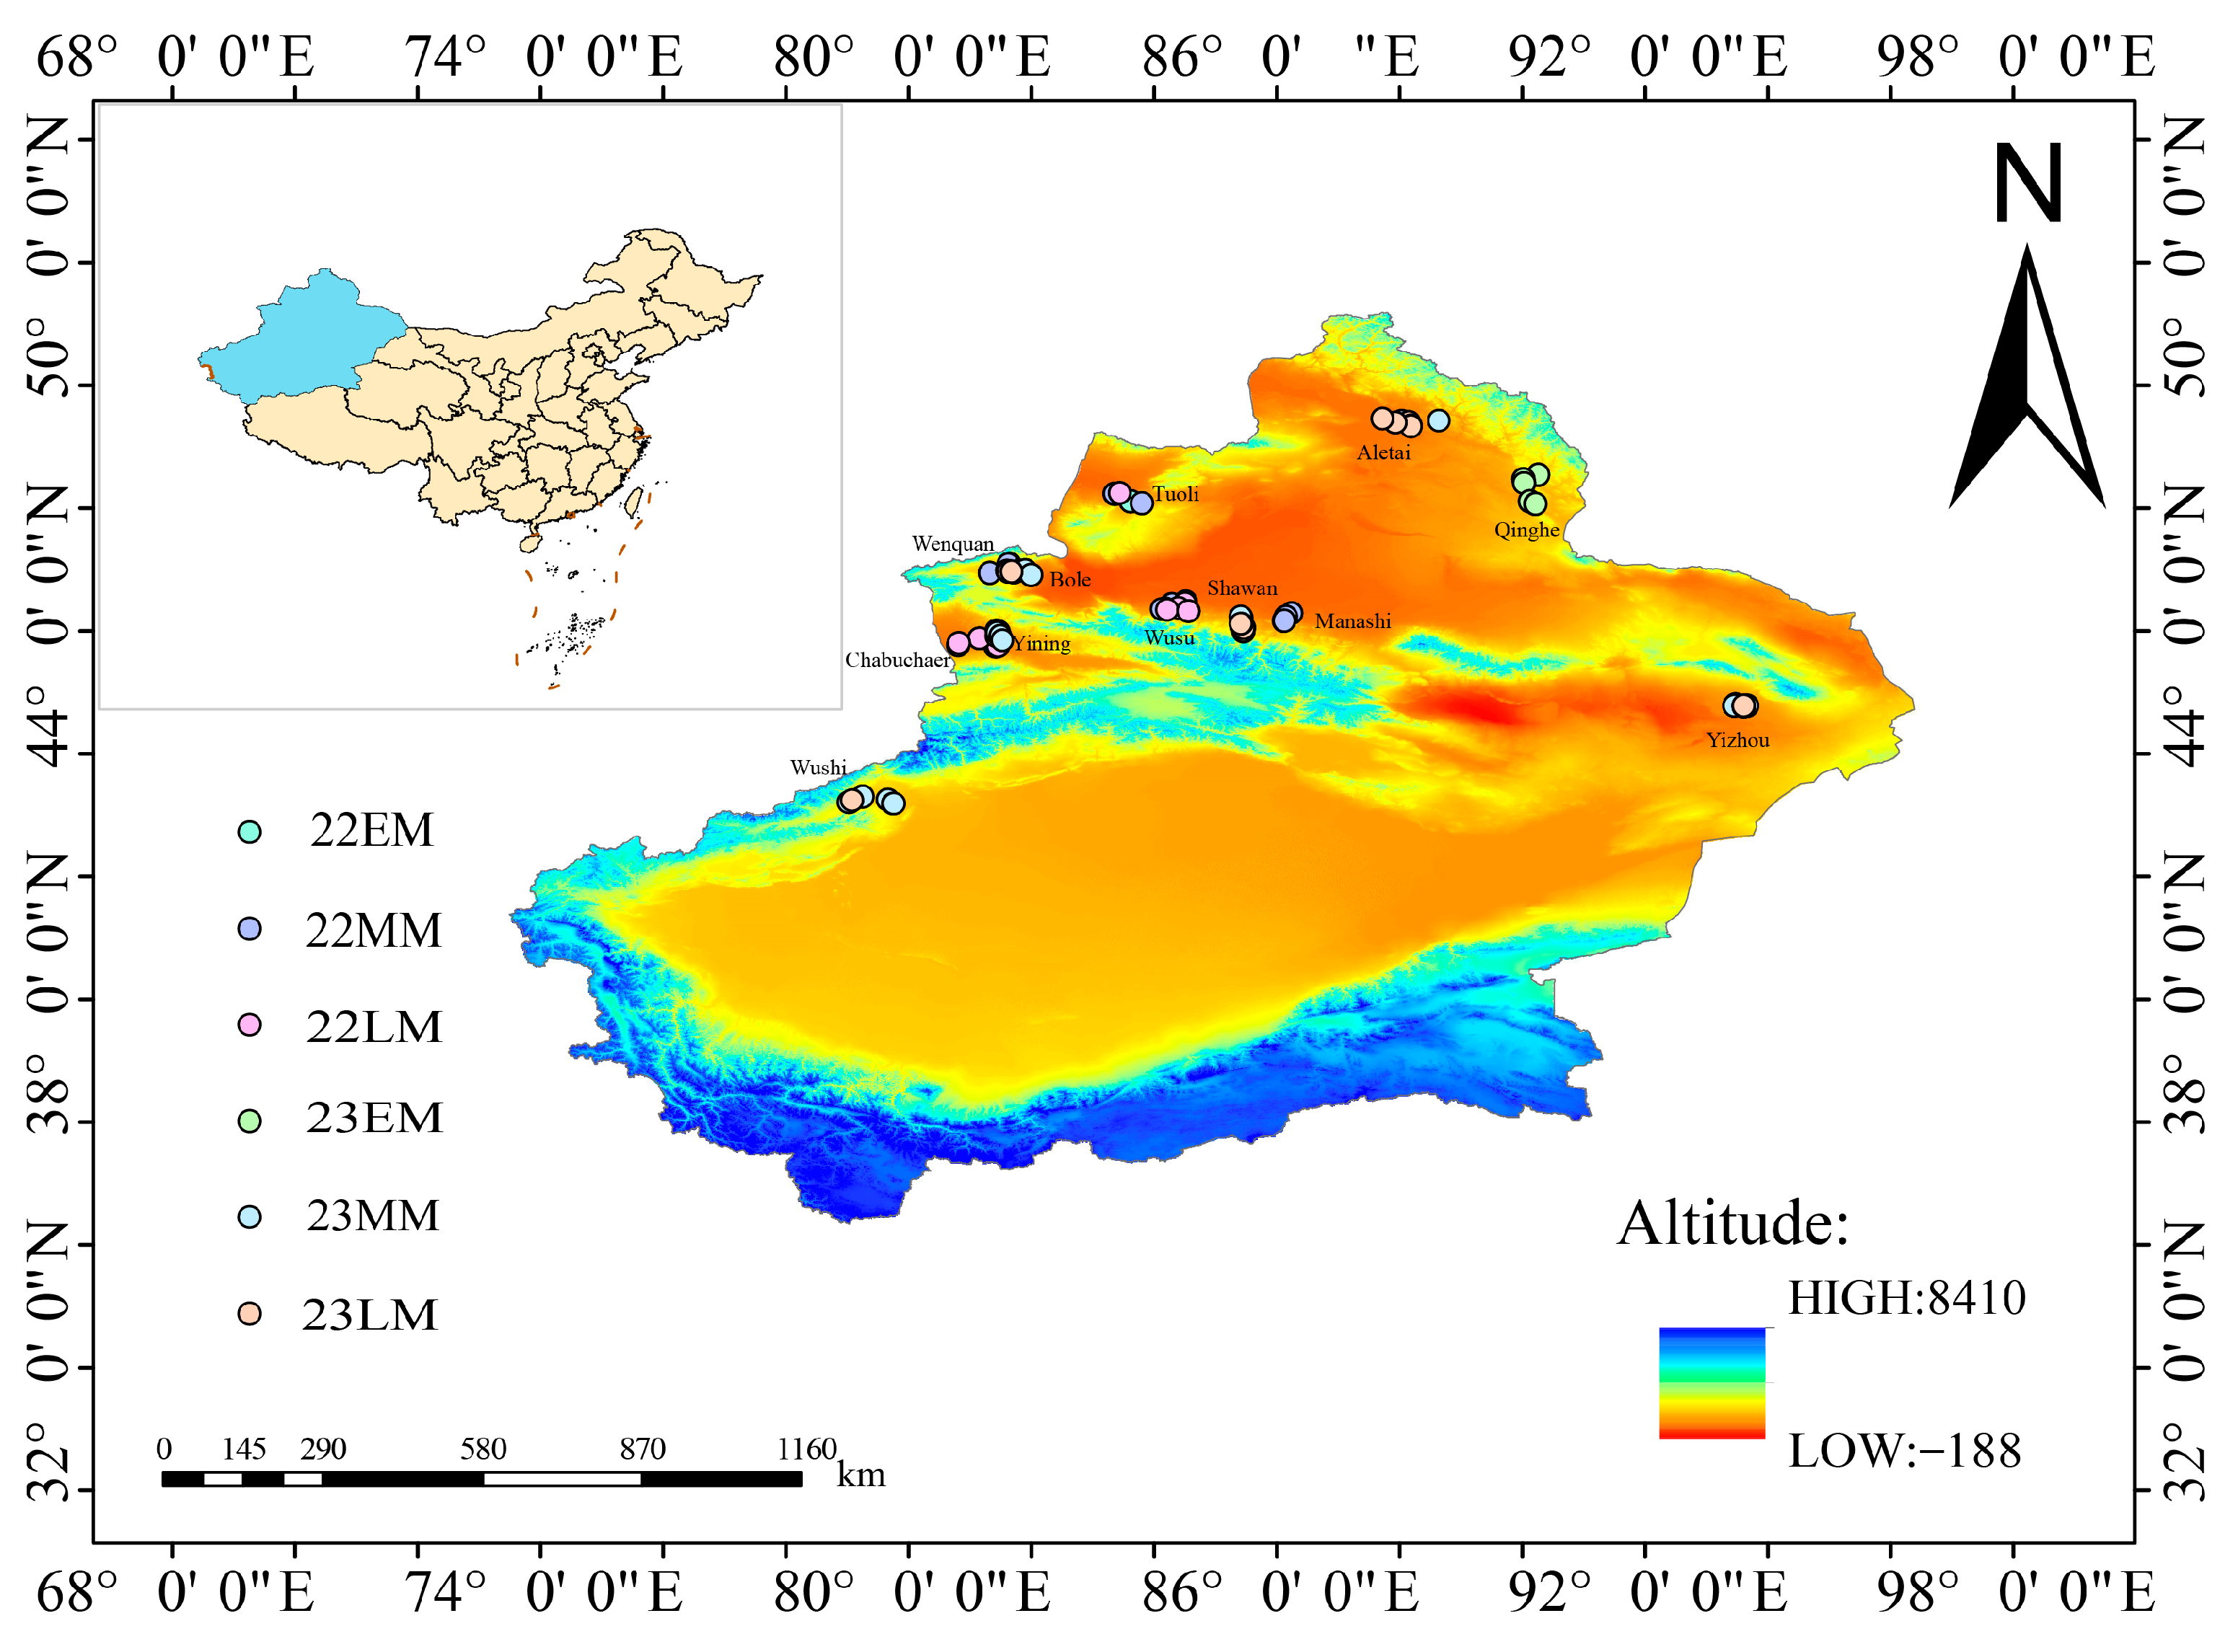
2.1. Study Sites

This study was conducted during the 2022–2023 growing seasons across major maize-producing regions in the Xinjiang Uygur Autonomous Region, China. Xinjiang’s continental arid ecosystem is defined by the synergistic interplay of temperate desert and alpine steppe climates, with spatially heterogeneous precipitation averaging < 300 mm annually [44]. Extreme aridity is amplified by an evapotranspiration ratio exceeding 10:1, where potential evapotranspiration surpasses 2000 mm/yr, yielding an aridity index of <0.2. Distinctive photothermal characteristics include 2550–3500 annual sunshine hours. The Tianshan Mountains establish a sharp ecoregional gradient: Southern Xinjiang (Tarim Basin) exhibits hyper-aridity (MAP = 85 ± 12 mm, MAT = 11.2 °C), contrasting with Northern Xinjiang (Junggar Basin), where semi-arid conditions (MAP = 176 ± 24 mm, MAT = 5.8 °C) support enhanced agroecological viability [45].

2.2. Study Design

Field measurements were performed at 120 sampling sites distributed across 12 counties/cities (Figure 1): Yining County, Chabuchaer County, Wenquan County, Bole City, Aletai City, Qinghe County, Tuoli County, Wusu City, Shawan City, Wushi County, Manashi County, and Yizhou District. Within each county-level division, ten maize fields were randomly selected for harvest index assessment. Following the exclusion of seed production fields, the final dataset included 116 sampling sites encompassing 47 maize cultivars, ensuring comprehensive geographical coverage while maintaining rigorous sampling consistency across the diverse agroecological conditions of the study region. Cultivar classification was conducted using data obtained from the National Variety Approval Database, with stratification based on physiological maturity duration.
The collection of variables covered genetic factors, agronomic practices, and environmental variables (Table 1). Genetic factors were categorized by maize cultivar maturity groups: early-maturing (EM, 22 cases), medium-maturing (MM, 40 cases), and late-maturing (LM, 54 cases). Agronomic practices focused on planting density (PD) as the core variable, covering all 116 cases. Environmental variables included soil chemical properties (e.g., organic matter, total nitrogen/phosphorus/potassium, available nutrients), physical properties (bulk density, electrical conductivity), and climatic–geographic parameters (altitude, effective accumulated temperature), all determined based on 116 sampling points. As shown in Table 1, the distribution characteristics of variables are quantified by mean values (Average) and coefficients of variation (CV%), with units and abbreviations (e.g., SOM: g·kg−1, EAT: °C) provided to facilitate standardized interpretation and cross-parameter comparisons.

2.3. Data Collection

2.3.1. Plant Sampling and Processing

Plant samples were collected one week prior to harvest using a standardized five-point sampling method, with each sampling point consisting of 5 × 5 plant quadrats (total 125 plants per site). Following air-drying to stabilize the moisture content, all samples were manually separated into cob and stover components for individual fresh-weight measurement. To account for regional moisture variations, stover subsamples were mechanically chopped into 2–3 cm segments. Duplicate 100 g aliquots of both grain and stover were then oven-dried at 105 °C until a constant weight was achieved for precise moisture determination. All fresh weight measurements were converted to a 0% moisture basis. During the maize harvest, we designated more than five plots in each maize sampling area, and within each plot, we randomly chosen over ten maize plants for measurement. Final yield parameters, including the dry weight per plant (kg), grain yield (kg·m−2), stover yield (kg·m−2), and total dry matter (kg·m−2), were derived by incorporating both the determined moisture content and site-specific planting density data. Using a steel tape measure with an accuracy of 1 mm, the height from the base to the top growth point of each maize plant was measured. The average height across all plots within the sampling area was calculated and considered as the representative plant height (PLH, cm).

2.3.2. Agronomic Management Factors

Planting density (PD, unit: plants·m−2), as a core parameter in the crop production system, is not only a key quantitative indicator for yield composition, but also significantly affects the morphogenesis and physiological metabolism processes of maize through mechanisms such as light interception, nutrient competition, and population niche regulation. It has dual regulatory value in agronomic management practices. The measurement method involves using a steel tape measure with an accuracy of 1 mm to conduct multi-point repeated measurements of the row spacing and plant spacing of maize. The theoretical population density value is calculated based on the geometric model (Planting density = Unit area/(Row spacing × Plant spacing)). Xinjiang’s maize production system predominantly utilizes mulched drip irrigation with scheduled irrigation events at 7–10 days intervals post emergence, incorporating precision fertigation management, where N-P2O5-K2O ratios and application rates are adjusted according to growth-stage-specific requirements. Despite spatial variations in water–fertilizer parameters across study sites, all practices complied with local agronomic protocols to ensure optimal crop growth, thereby excluding fertilization management, precipitation, and soil moisture dynamics from subsequent analyses.

2.3.3. Climatic–Geographic Factors

Field data collection included GPS-recorded geospatial parameters (longitude [LNG, °], latitude [LAT, °], elevation [ASL, m]) and the effective accumulated temperature (EAT, °C; accumulated ≥ 10 °C temperatures from April to October using Huiju Energy data). This comprehensive dataset enabled systematic evaluation of maize performance across diverse agroecological conditions, while maintaining methodological consistency.

2.3.4. Soil Sampling and Analysis

Composite topsoil samples (0–20 cm depth) were collected during whole-plant sampling using standardized procedures. Five subsamples obtained through quintuplicate sampling were thoroughly homogenized, from which three representative aliquots were selected via quartering for physicochemical analysis. Bulk density and soil structural parameters were determined from three independent replicate samples.
The soil organic matter (SOM) content was quantified using the potassium dichromate oxidation external-heating method (g·kg−1). The total nitrogen (TN) concentration was determined through Kjeldahl digestion (g·kg−1). For total phosphorus (TP) analysis, samples underwent sulfuric–perchloric acid digestion followed by molybdenum–antimony (Mo-Sb) colorimetric determination (g·kg−1). Total potassium (TK) levels were measured via hydrofluoric–perchloric (HF-HClO4) acid digestion coupled with flame photometric detection (g·kg−1).
The alkaline diffusion method was employed to measure the alkali-hydrolyzable nitrogen (AKN) content (mg·kg−1). Available phosphorus (AP) was extracted using sodium bicarbonate (NaHCO3) solution and quantified by molybdenum blue colorimetry (mg·kg−1). Available potassium (AK) concentrations were determined through ammonium acetate (NH4OAc) extraction followed by flame photometric analysis (mg·kg−1).
The soil pH was measured potentiometrically in 1:2.5 soil–water suspensions. Electrical conductivity (EC) was determined in 1:5 soil–water extracts using a conductivity meter (mS·cm−1). Bulk density (BD) was assessed via the core method, employing 100 cm3 sampling cylinders (g·cm−3). Aggregate stability was evaluated through wet-sieving fractionation into four size classes: large macroaggregates (>2 mm), small macroaggregates (0.25–2 mm), microaggregates (0.053–0.25 mm), and silt–clay fractions (<0.053 mm).

2.4. Calculations and Statistical Analysis

The harvest index was calculated as follows:
HI = mG 1 AG mS 1 AS + mG 1 AG
where HI = crop harvest index; mS = stover weight (kg); mG = grain weight (kg); AS = stover moisture content (%); and AG = grain moisture content (%).
A progressive analytical framework was employed to investigate the interactions between the maize HI and productivity parameters, as well as environmental factors, through three sequential phases. Initial descriptive analyses using boxplot visualizations characterized varietal differences in HI, DM, stover yield and grain yield, with Bonferroni-corrected multiple comparisons (α = 0.05) identifying statistically significant patterns. Subsequent associative analyses established baseline trait–HI relationships through linear regression, followed by nonparametric Spearman’s rank correlation analyses after Kolmogorov–Smirnov tests confirmed non-normal distributions, generating robust correlation heatmaps. The confirmatory phase employed advanced modeling to validate these findings, collectively forming an integrated workflow that addressed non-normality while maintaining statistical rigor and biological interpretability for comprehensive mechanistic understanding.
To identify key determinants of the maize HI, we implemented a tri-method analytical approach in R 4.4.1 to ensure comprehensive and robust results. First, univariate regression analysis ranked variables by absolute regression coefficients, providing initial identification of significant linear relationships while maintaining interpretability with conventional agronomic frameworks. Second, XGBoost modeling (max_depth = 4, eta = 0.1) with SHAP (SHapley Additive exPlanations) value analysis quantified factor importance and captured complex nonlinear relationships through ensemble tree methods. Third, partial least squares path modeling (PLS-PM) established structural equation networks to elucidate both direct and indirect pathways among HI determinants. The car package was employed to assess and address multicollinearity concerns, validating the need for this integrated approach. Methodological triangulation through these complementary techniques—each overcoming specific limitations of the others (e.g., univariate regression’s linear constraints, PLS-PM’s handling of collinearity)—enabled identification of statistically significant, ecologically relevant, and operationally meaningful factors governing HI variation in maize systems.

3. Results

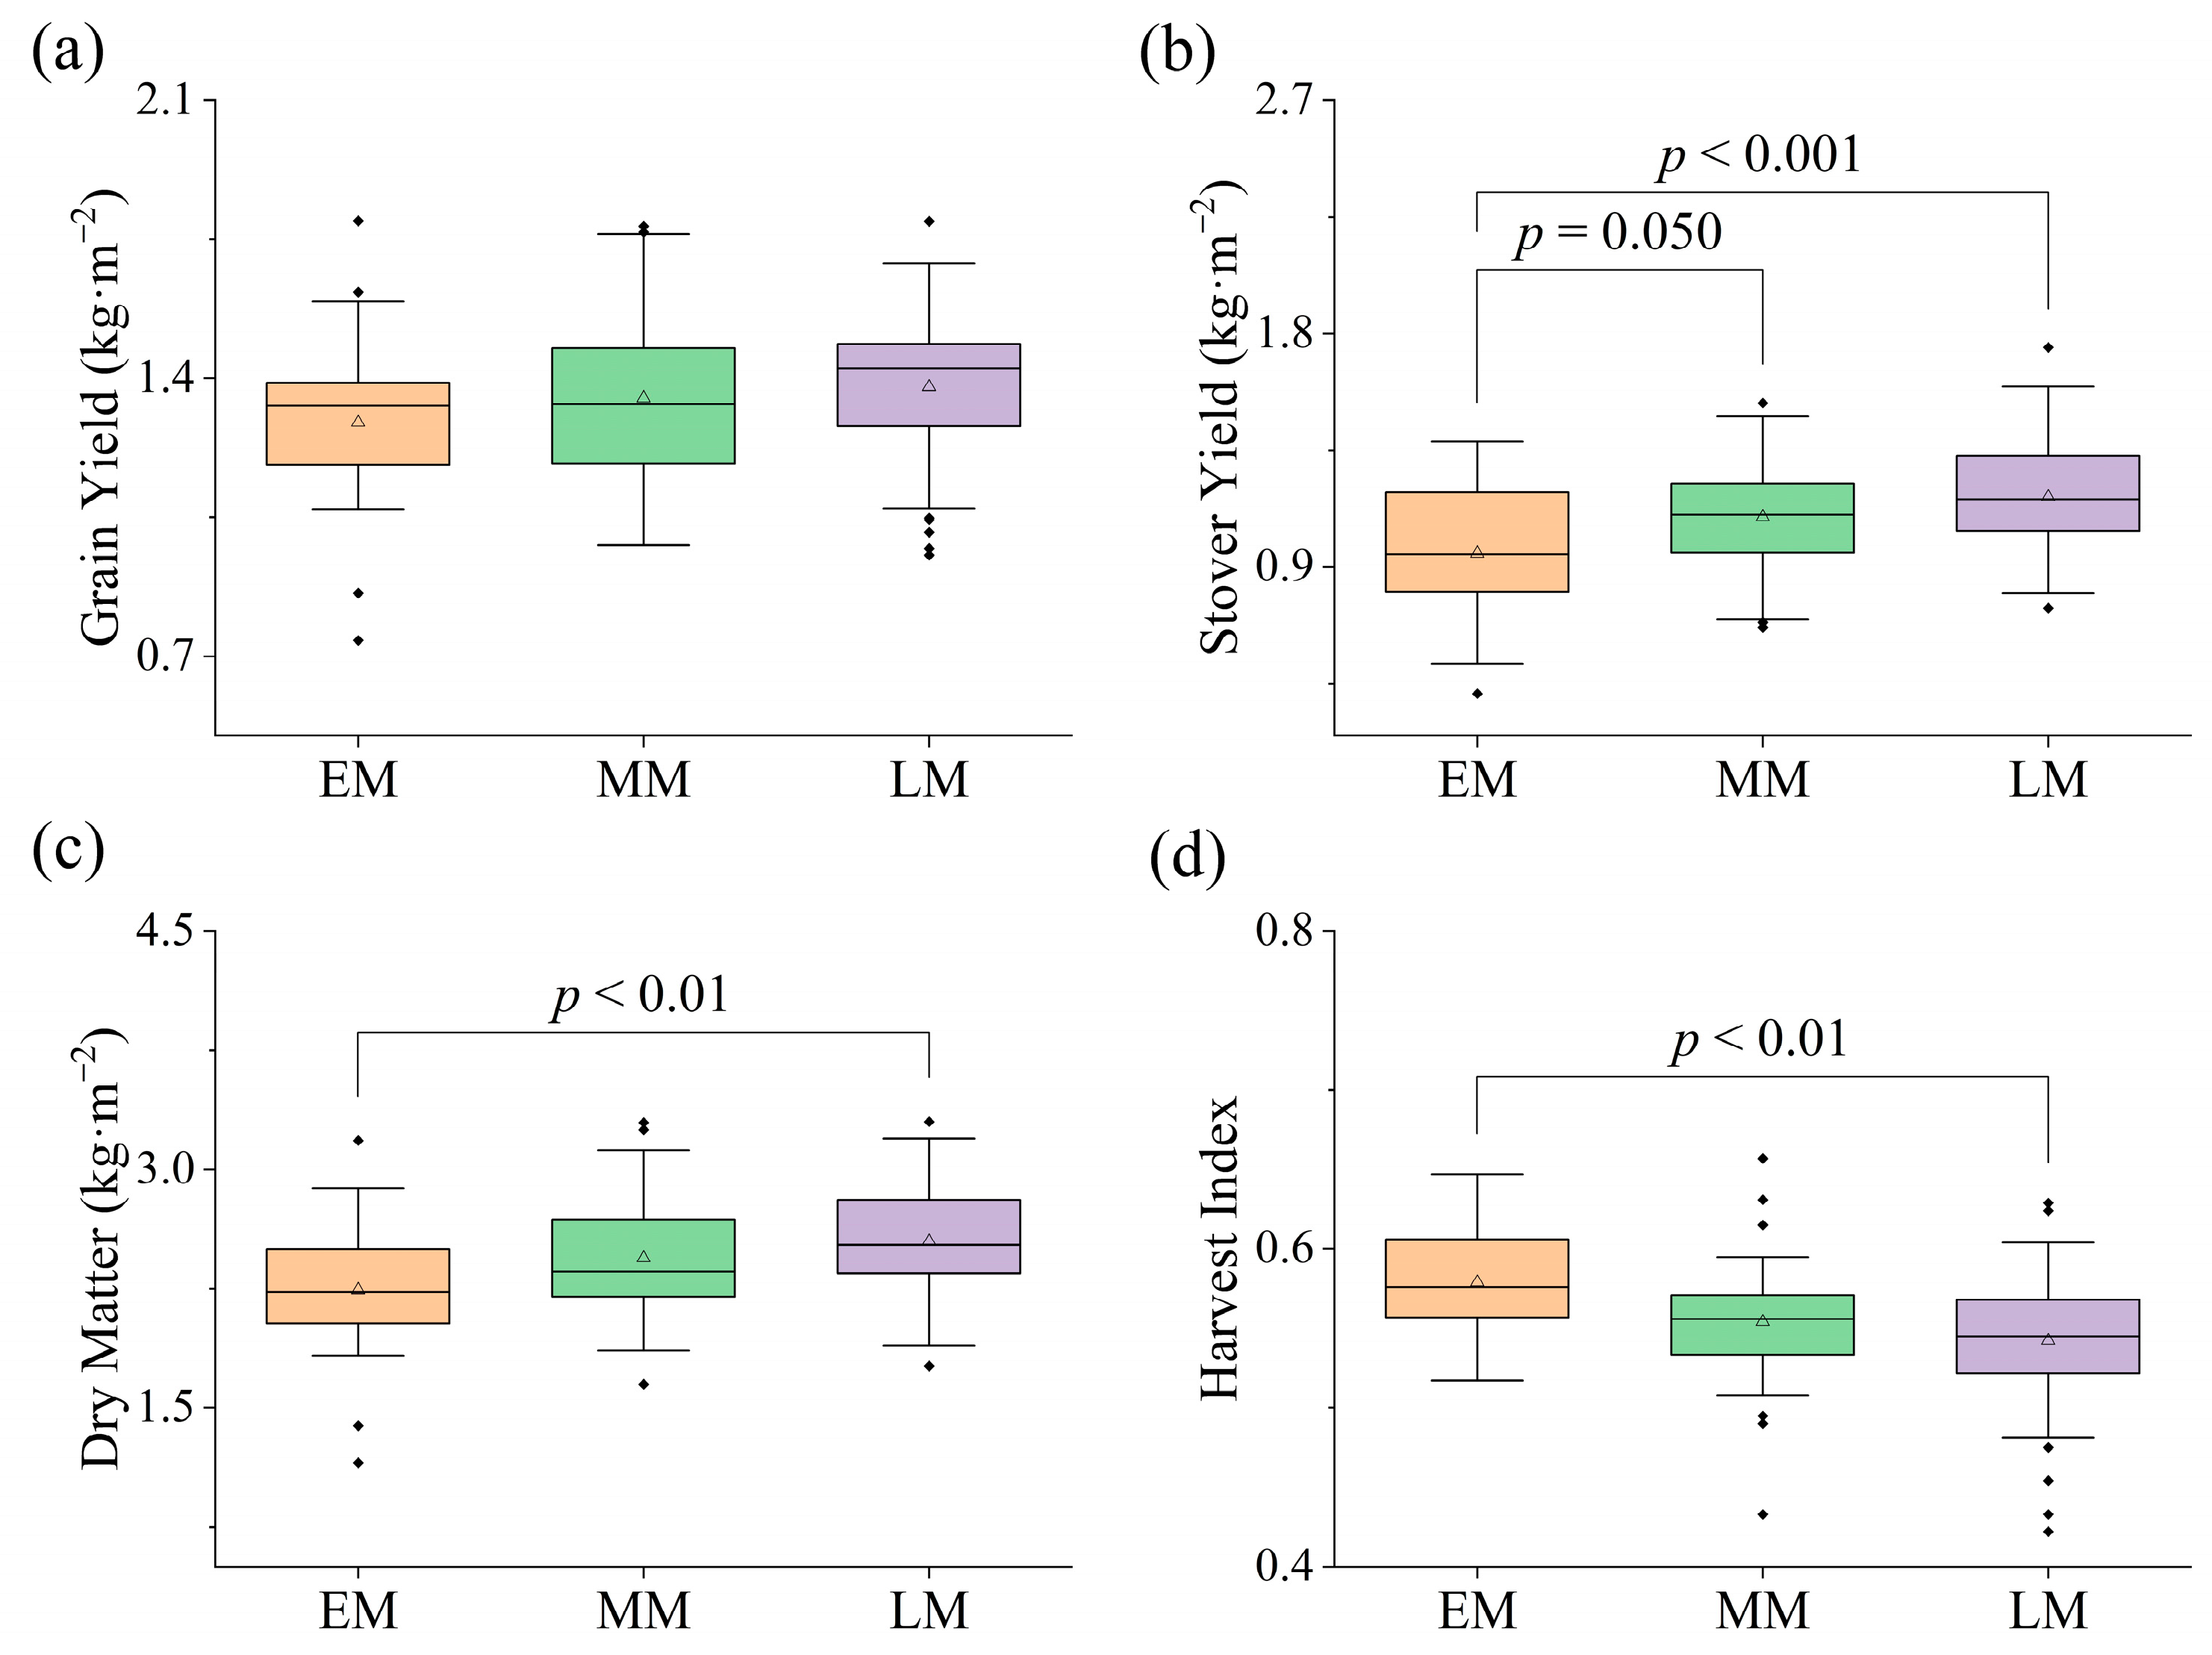
3.1. Comparison of Productivity Parameters Among Maize Varieties with Different Maturity Periods in Arid Regions

Maize varieties exhibited distinct patterns of the HI and productivity parameters across different maturity groups (Figure 2). Early-maturing (EM) cultivars demonstrated significantly higher HI values compared to both medium-maturing (MM) and late-maturing (LM) varieties (p < 0.01) (Figure 2a). Notably, DM accumulation showed highly significant differences between the EM and LM groups (p < 0.01) (Figure 2c), while stover yield exhibited even more pronounced variations (EM vs. LM: p < 0.001) (Figure 2b). Although less marked, EM cultivars also showed statistically significant advantages over MM varieties. In contrast, MM cultivars displayed comparable performance to other maturity groups for both the HI and DM (p > 0.05), with grain yield showing no significant varietal differences across all maturity groups (Figure 2a).

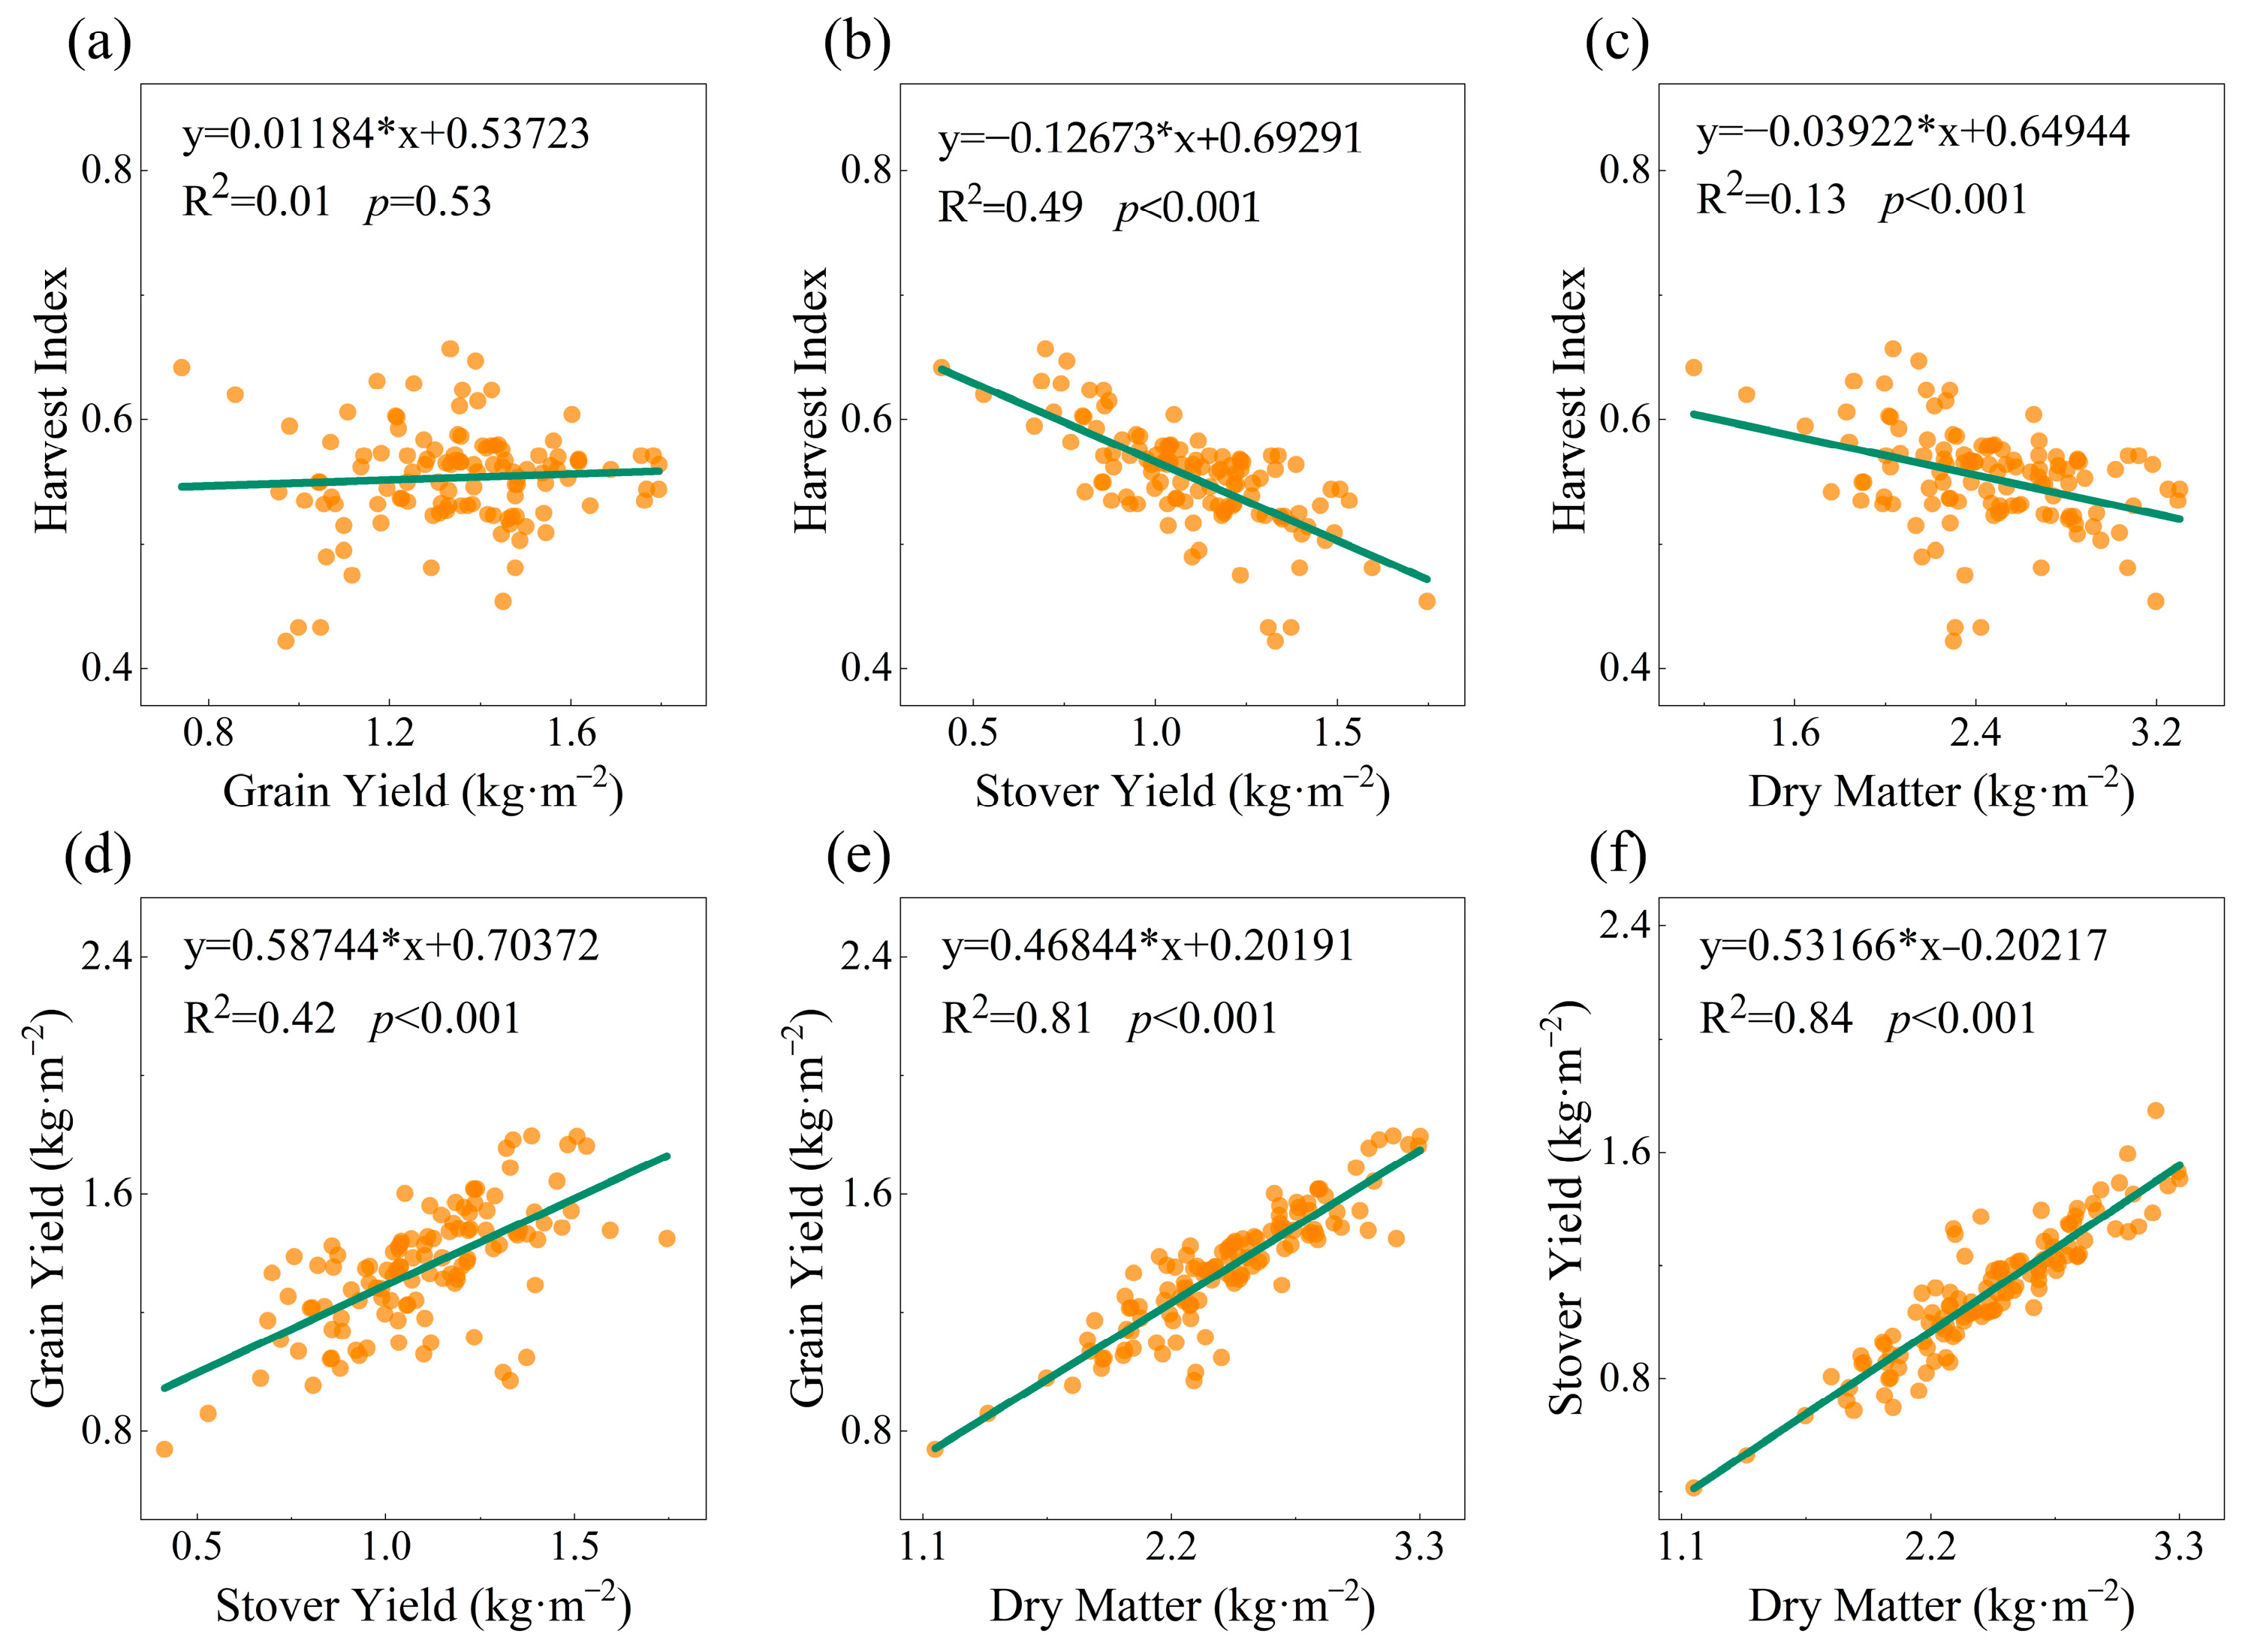
3.2. Inter-Relationships Between Productivity Parameters in Arid Regions

Systematic analysis of productivity parameters revealed distinct patterns in HI dynamics (Figure 3). The weak correlations between HI and both DM (R2 = 0.13) and grain yield (R2 = 0.01) demonstrate HI’s relative stability across varying productivity levels (Figure 3a,b). In contrast, the moderate negative correlation between HI and stover yield (R2 = 0.49) suggests significant constraints imposed by vegetative biomass accumulation on reproductive partitioning efficiency (Figure 3b). DM showed strong positive associations with both grain yield (R2 = 0.81) and stover yield (R2 = 0.84), confirming its fundamental role in yield formation (Figure 3e,f). However, the intermediate stover–grain yield relationship (R2 = 0.42) indicates that while moderate shoot development supports yield, excessive vegetative growth may compromise the HI through altered assimilate partitioning patterns (Figure 3d).

3.3. Effects of Planting Density on Productivity Parameters

The analysis revealed three distinct density-dependent patterns in productivity parameters (Figure 4): (1) At the individual plant level, both grain dry weight (R2 = 0.27, p < 0.001) and stover dry weight (R2 = 0.12, p < 0.001) show significant negative linear relationships with planting density, indicating progressively constrained biomass accumulation under intensified interplant competition (Figure 4a,b); (2) At the population level, stover weight (R2 = 0.01, p = 0.49) and DM (R2 = 0.01, p = 0.71) exhibit minimal density dependence, while grain yield (R2 = 0.01, p = 0.95) remains stable, demonstrating effective compensation of individual plant yield reductions through stand-level adjustments (Figure 4c–e); (3) The harvest index shows a marginal decreasing trend with increasing density (R2 = 0.01, p = 0.21), suggesting gradual declines in assimilate partitioning efficiency to grains under high-density conditions, likely due to enhanced competition for light resources (Figure 4f).

3.4. Determinants of Productivity Parameters Across Maize Maturity Groups

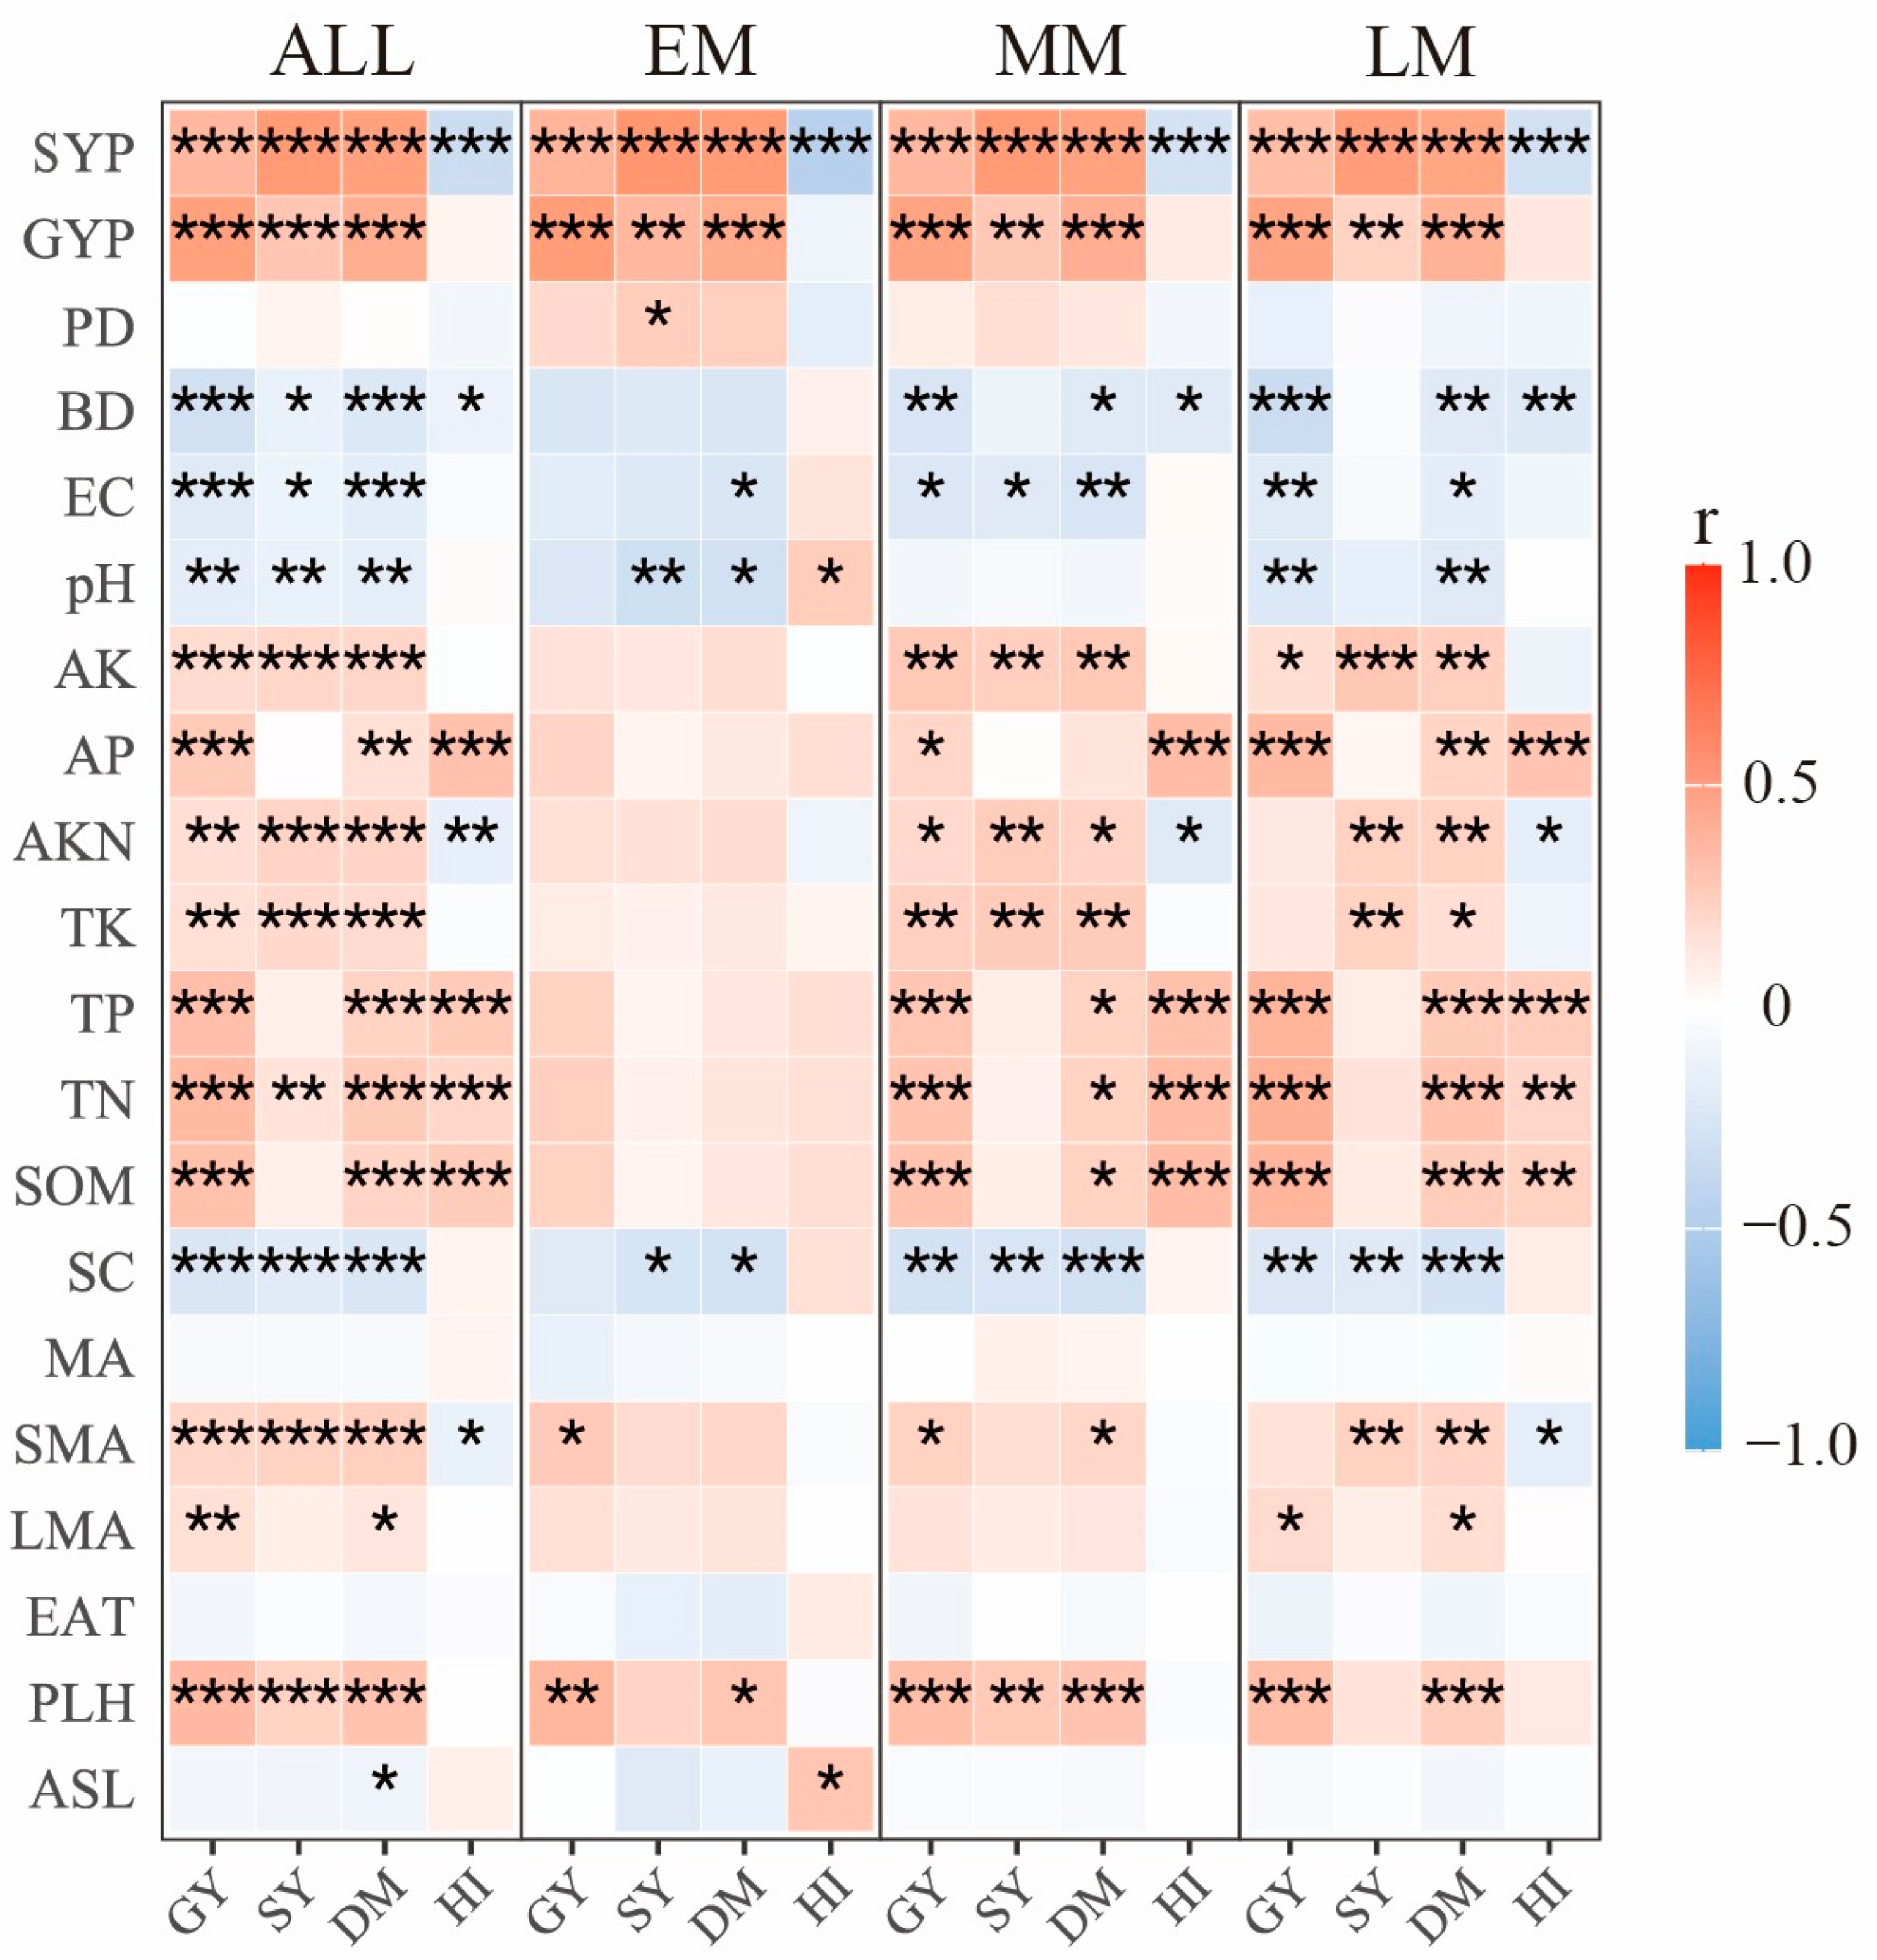
3.4.1. Correlation Heatmap Analysis of Productivity Parameters of Maize in Different Maturity Groups with Influencing Factors

The study demonstrated distinct environmental response patterns across maize maturity groups (Figure 5). Early-maturing cultivars exhibited the greatest environmental stability, with the HI showing significant correlations (p < 0.05) only with altitude, soil pH, and stover yield per plant (SYP). Medium-maturing varieties displayed intermediate sensitivity, with the HI significantly influenced by seven factors: SYP, bulk density (BD), available phosphorus (AP), total phosphorus (TP), total nitrogen (TN), soil organic matter (SOM), and available potassium (AK) (p < 0.05). Late-maturing varieties showed the highest environmental sensitivity, with the HI significantly associated with eight parameters: SYP, BD, AP, TP, TN, SOM, AK, and small macroaggregates (SMA) (p < 0.05).
This response gradient revealed progressively stronger dependence of HI formation on soil physicochemical properties with increasing growth duration. Notably, all varietal groups showed consistent directional responses to key soil fertility indicators (SOM, TN, TP, AP), but with significantly different response intensities (EM < MM < LM). These patterns reflect evolutionarily conserved nutrient utilization mechanisms from long-term domestication, with distinct adaptation strategies: early-maturing varieties employ “risk-averse” strategies, prioritizing stable reproductive growth, while late-maturing cultivars adopt “resource-acquisitive” strategies to maximize environmental resource utilization.
Analysis of yield components demonstrated differential regulatory patterns: grain yield was predominantly influenced by soil phosphorus dynamics (TP and AP), BD, TN, and SOM, consistent with phosphorus’s crucial role in energy metabolism and nitrogen–phosphorus synergy during grain filling. In contrast, stover yield was primarily regulated by AK, TK, and SMA, reflecting potassium’s physiological function in stem strength development and the soil structure’s impact on root system establishment.

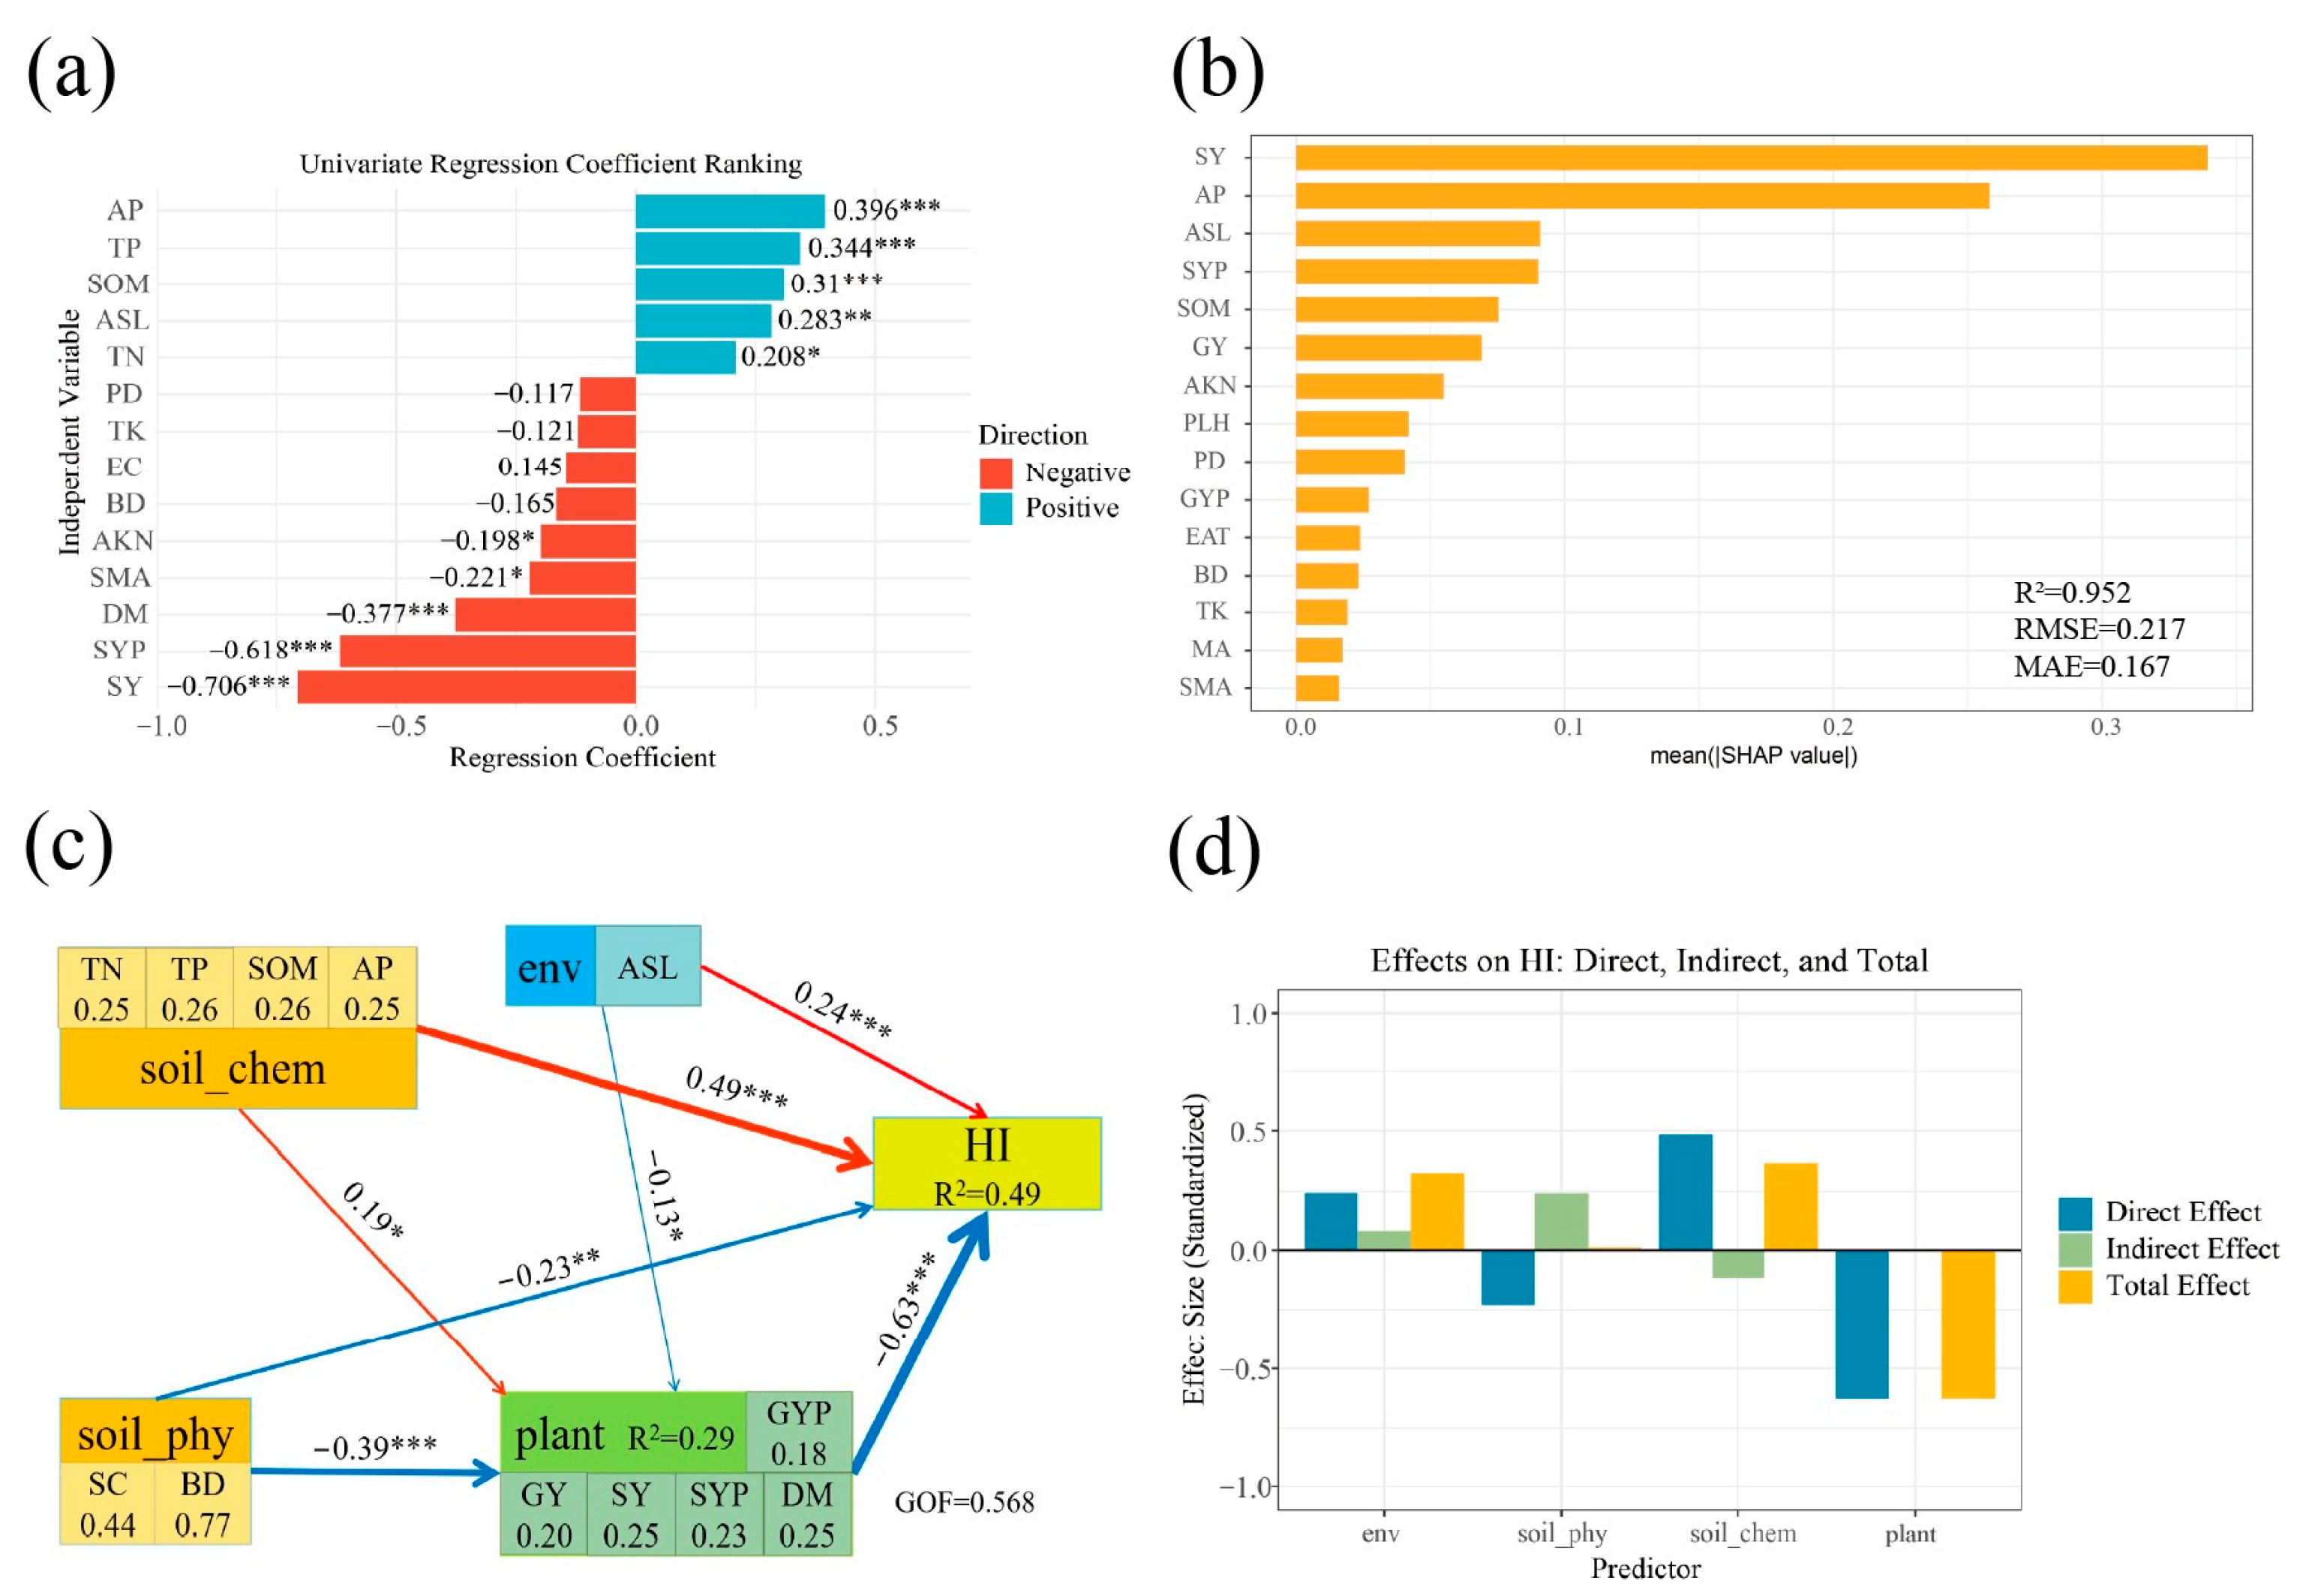
3.4.2. Determinants of Maize Harvest Index in Arid Ecosystems

The multivariate analysis presented in Figure 6 employed complementary approaches to identify key determinants of maize HI. XGBoost-SHAP analysis (Figure 6a) and univariate regression coefficients (Figure 6b) revealed that among the environmental factors, altitude, total phosphorus (TP), available phosphorus (AP), and soil organic matter (SOM) were the predominant drivers of HI variation. Regarding growth traits, both stover yield and stover yield per plant demonstrated the strongest associations with the HI, indicating that while stover biomass significantly influences the HI, the index itself maintains relative stability across different yield levels.
Partial least squares structural equation modeling (PLS-SEM; Figure 6c,d) further elucidated the complex hierarchical relationships governing HI formation. The model demonstrated that among the environmental factors, altitude exhibited a significant positive and direct effect on the harvest index (HI). Soil chemical properties, particularly total phosphorus (TP), available phosphorus (AP), soil organic matter (SOM), and total nitrogen (TN), were identified as key determinants influencing the HI. Furthermore, soil physical properties manifested substantial negative impacts on plant traits through structural and textural constraints that limited plant growth, ultimately diminishing the HI. Notably, specific plant characteristics—primarily straw yield and dry matter (DM) accumulation—showed significant negative direct effects on the HI. This inverse relationship suggests that enhanced vegetative growth rates under certain conditions may occur at the expense of reproductive development, thereby reducing harvest efficiency.

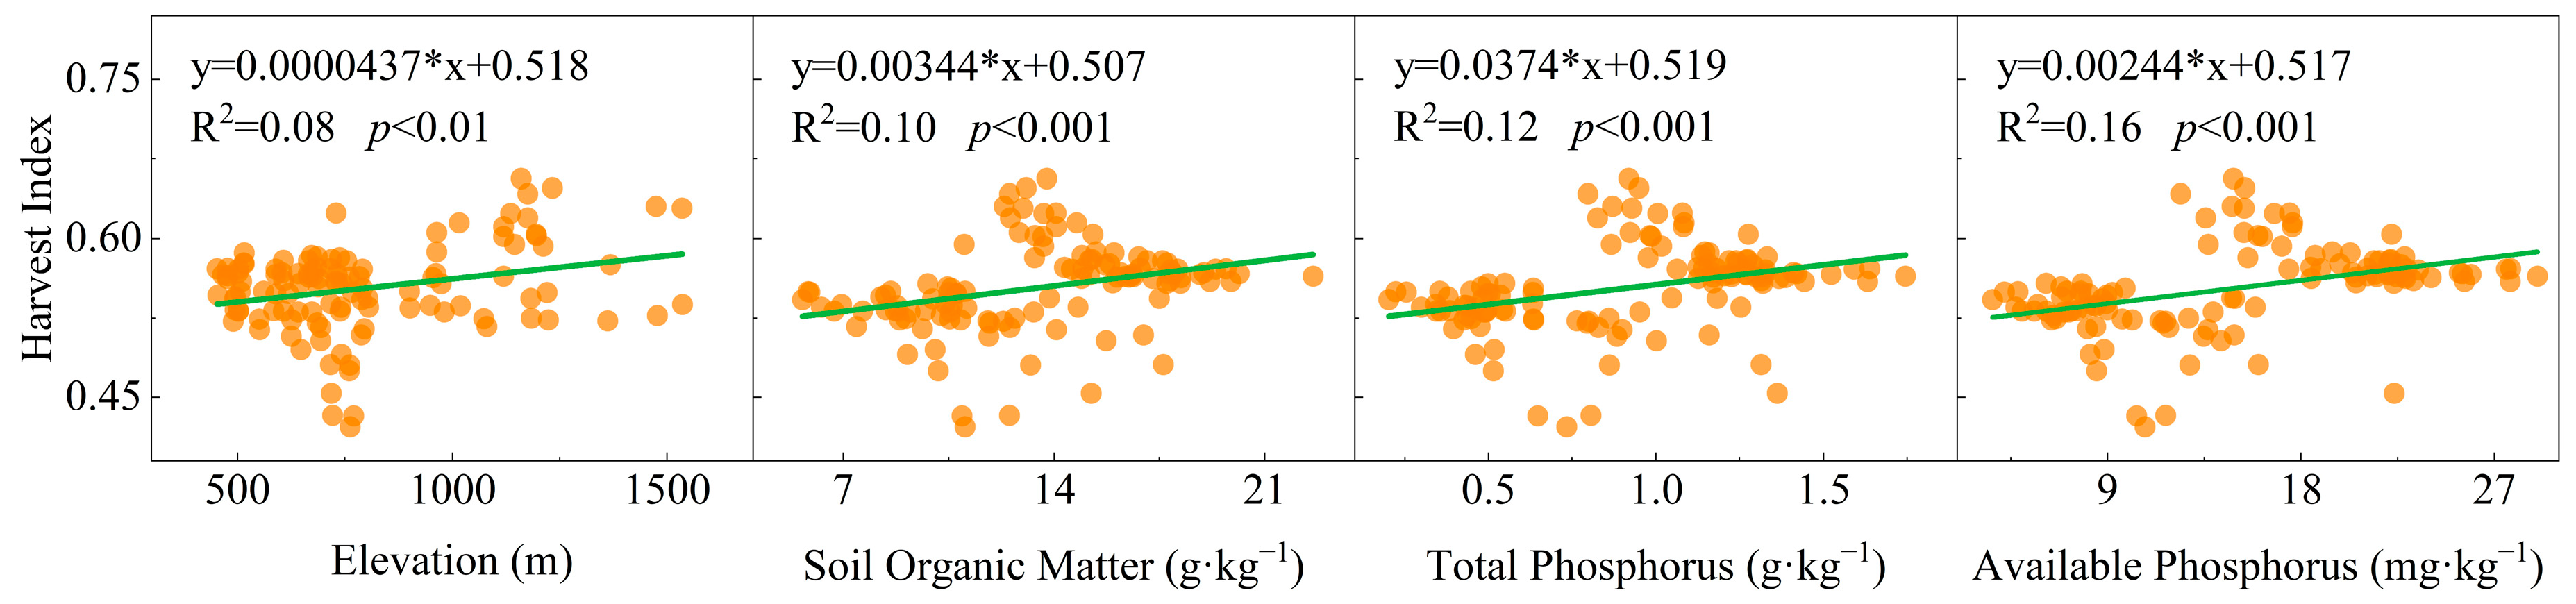
3.4.3. Linear Regression Analysis of the Harvest Index and Its Determinants

The analysis of Figure 7 shows the influence of four main factors on the harvest index. As the elevation increases, the harvest index shows a slight upward trend (R2 = 0.08, p < 0.01), with the harvest index increasing by 0.00437 on average for every 100 m increase in elevation. Regarding soil organic matter, the harvest index increases (R2 = 0.10, p < 0.001), and for every 1 g·kg−1 increase in soil organic matter, the harvest index increases by approximately 0.00344. As for total phosphorus, the harvest index rises (R2 = 0.12, p < 0.001), and for every 1 g·kg−1 increase in total phosphorus, the harvest index increases by about 0.0374. When it comes to available phosphorus, the harvest index increases (R2 = 0.16, p < 0.001), and for every 1 mg·kg−1 increase in available phosphorus, the harvest index increases by approximately 0.00244.

4. Discussion

4.1. Variation in Productivity Parameters Among Maize Maturity Groups

Extensive research has established a significant positive correlation between maize Relative Maturity (RM) and yield potential, with longer-maturity cultivars typically demonstrating greater productivity [46,47]. In Liaoning Province—a key maize production area in China—agricultural practices have traditionally favored longer-maturity varieties [48]. However, comparative field trials have shown equivalent yield performance between short- and long-maturity cultivars [49]. Our results reveal systematic differences in DM, stover yield, grain yield, and HI across maturity groups, with all traits except HI showing positive correlations with growth duration. Specifically, the HI exhibits an inverse relationship with maturation time. These findings corroborate Chen’s observations in Liaoning, where longer-maturity varieties produced greater biomass but lower harvest indices, while showing no significant grain yield advantage over their shorter-maturity counterparts [50].

4.2. Density-Dependent Relationships Between Productivity Parameters in Maize

In previous studies, it was generally believed that dry matter (DM) and the harvest index (HI), as the fundamental physiological determinants of grain yield formation, collectively constitute the basis of crop productivity [4,11]. However, historical cultivar evaluations across multiple cropping systems consistently demonstrate that yield improvements primarily result from enhanced DM rather than HI modification [18,51,52,53]. While existing research has characterized DM–HI relationships across yield gradients [31], the interaction mechanisms among stover yield, grain yield, and the HI remain incompletely understood. Our results demonstrate that the HI remains relatively stable across varying yield and DM levels, with observed variations primarily exhibiting negative correlations with stover yield. Specifically, the HI declines when stover yield growth rates exceed grain yield increments, even during ongoing DM accumulation. These findings corroborate global observations that yield breakthroughs in modern breeding programs principally depend on compensating HI plateaus through DM enhancement [51,54].
Recent studies have revealed distinct effects of agronomic practices on the HI, with nitrogen application significantly influencing the HI, while planting density exhibits a negligible impact [21]. Elevated planting densities intensify interplant competition for resources, leading to substantial reductions in individual plant biomass. In high-input agricultural systems, this competition primarily stems from diminished canopy light availability [55,56], resulting from light stress caused by high leaf-area indices that limit the photosynthetic capacity per plant. Contemporary research demonstrates that yield improvements under high-density planting coincide with increased organ biomass, but show no significant HI variation [32]. Our study provides novel mechanistic insights into yield formation under dense planting conditions by demonstrating that density effects operate through altered biomass partitioning ratios. Specifically, we observed that the grain weight per plant declines more precipitously than stover weight under high-density conditions, leading to accelerated stover accumulation, which marginally reduces the HI. These findings advance our understanding of yield architecture in modern high-density maize cultivation systems.

4.3. Geographic and Climatic Determinants of Harvest Index Variation

Our analysis reveals distinct environmental effects on maize HI, with the effective accumulated temperature (EAT) showing no significant influence, while elevation exerts pronounced impacts. Notably, higher elevations enhance the crop HI, despite suppressing vegetative growth. Topography serves as a critical climatic modulator in Asian cropping systems [57,58,59], primarily through its effects on the following: (1) aridity indices [60], (2) plant water-use strategies [61], and (3) thermal regimes [62]. Previous studies have established the strong topographic dependence of maize productivity, particularly demonstrating robust elevation–yield correlations [63,64]. The irrigated oasis agricultural system has evolved climate-adapted practices through long-term optimization, including selective cultivar adoption and precision fertigation management. Our findings suggest that current varietal selection protocols disproportionately emphasize climatic zoning, while undervaluing topography’s regulatory role in maize ecophysiological performance. The substantial elevation gradient across our study sites (452–1535 m) highlights the imperative of incorporating topographic parameters as essential variables for optimizing maize production systems in arid regions.

4.4. Soil Physicochemical Regulation of the Harvest Index in Maize

Contemporary research demonstrates that soil properties exert approximately threefold greater influence on the yield per unit area than phenological factors (e.g., sunshine duration and growing degree days), with soil organic carbon (SOC) and nitrogen–phosphorus (NP) nutrient availability emerging as primary yield determinants [65]. Our findings substantiate this pattern, revealing that key soil characteristics—particularly organic matter content, available phosphorus (AP), and total phosphorus (TP)—significantly regulate the maize HI. These results align with established understanding of maize NP physiology, where balanced NP fertilization consistently enhances summer maize productivity [66,67], especially in phosphorus-deficient regions, where P management critically governs both yield and HI optimization [65]. The critical levels of soil AP for optimal maize yields range from 11 mg·kg−1 [68] to 12.5 mg·kg−1 [69]. The average available phosphorus level (14.97 mg·kg−1) in the study area is slightly higher than the critical level. However, there are still multiple plots with available phosphorus levels below the critical level. Therefore, the effect of available phosphorus is quite significant. Notably, potassium fertilization efficacy plateaus when soil available potassium (AK) concentrations exceed 190 mg·kg−1 [70]. In our study system, the mean AK content (240 mg·kg−1) substantially surpassed maize’s physiological requirements [71], potentially explaining both the observed weak potassium–yield correlation and the negative HI–potassium relationship. This suggests that under potassium-sufficient conditions, additional potassium inputs may preferentially promote vegetative growth at the expense of reproductive allocation, thereby reducing the harvest index.
The agronomic benefits of soil organic carbon (SOC)—mediated through improved soil structure and enhanced nutrient cycling—have been well-established as key mechanisms promoting crop biomass accumulation [72,73,74,75,76]. Global meta-analyses indicate that while 76% of studies report positive SOC–yield correlations, 34% show neutral or negative responses [77], though the predominant relationship remains positive [78]. Maize-specific studies consistently identify SOC as a critical yield regulator [3,79]. Given that SOC comprises 58–65% of soil organic matter (SOM), our observed parallel effects of SOM and SOC on the HI highlight the fundamental importance of organic matter management for optimizing productivity in contemporary maize systems. A threshold of SOM has been identified in previous studies, with gains in yield leveling off at around 4~5% SOM. This threshold has been observed in field studies, regional analyses, and global data syntheses [79,80,81,82]. The average soil organic matter (SOM) level in the study area (13.38 g·kg−1) is far below the threshold level. This might explain why SOM plays an important role.

4.5. Study Limitations

While this systematic investigation across 12 counties in Xinjiang’s single-cropping maize systems provides critical insights into HI regulation in arid regions, two key limitations warrant consideration. First, the exclusive focus on single-cropping systems precludes extrapolation of findings to double-cropping, seed production, or silage maize systems, potentially limiting the broader applicability of our conclusions. Second, the characteristically elevated soil available potassium levels (mean 240 mg·kg−1), may have masked potassium’s true physiological effects on the HI and growth traits, introducing uncertainty when applying these results to low-potassium soils. Future research should incorporate diverse cropping systems and cross-regional soil potassium gradients to enhance the generalizability of HI regulation mechanisms and provide more robust theoretical foundations for optimizing maize productivity across different agroecological contexts.

5. Conclusions

This study systematically elucidates the interactive effects of soil properties, climatic conditions, and planting density on the maize HI through comprehensive multi-source data analysis in Xinjiang’s arid maize production systems. Key findings reveal that early-maturing cultivars exhibit a significantly higher mean HI (0.58) compared to medium- (0.55) and late-maturing varieties (0.54), despite their lower biomass accumulation and yield potential. Our results highlight the critical importance of incorporating altitudinal gradients when selecting cultivars for specific climatic zones. Soil analysis identified available phosphorus (AP), total phosphorus (TP), and soil organic matter (SOM) as significant positive regulators of the HI, while bulk density (BD) and electrical conductivity (EC) negatively impact the HI through root growth inhibition and resource competition. We observed a strong positive correlation between DM and grain yield (R2 = 0.81), and a significant negative correlation between HI and stover yield (R2 = 0.49). Notably, the HI remained relatively stable across varying DM and yield levels, suggesting that yield improvement requires simultaneous optimization of both biomass accumulation and partitioning efficiency. These findings provide a scientific foundation for developing precision management strategies in arid maize systems. Specifically, preferential phosphorus supplementation should be coupled with moderated potassium inputs, guided by crop nutrient requirements and soil nutrient profiles. Future research should expand to diverse ecoregions and incorporate long-term field experiments to refine theoretical models and enhance the sustainability of high-yield maize production in water-limited environments.

Author Contributions

Z.H.: writing—review and editing, writing—original draft, software, methodology, investigation, resources, formal analysis, data curation, conceptualization. H.W.: writing—review and editing, writing—original draft, software, methodology, investigation, resources, formal analysis, data curation, conceptualization. D.Z.: investigation, data curation. J.C.: investigation, formal analysis. Y.C.: investigation, formal analysis. Z.S.: supervision, methodology. X.L.: formal analysis, data curation. H.D.: writing—review and editing, resources, project administration, funding acquisition. All authors have read and agreed to the published version of the manuscript.

Funding

This research was jointly funded by the National Natural Science Foundation of China (Grant No. 32460352), the Tianchi Talent Introduction Program of Xinjiang Uygur Autonomous Region (Grant No. CZ001613), and Natural Science Foundation of Xinjiang Uygur Autonomous Region (Grant No. 2022D01F54). The Article Processing Charge (APC) was covered by the research funds of the research group.

Institutional Review Board Statement

Not applicable. This study focused on crop physiological parameters (harvest index, yield components) and soil properties analysis, which did not involve human participants, animal experimentation, or endangered plant species.

Data Availability Statement

The datasets presented in this article are not readily available because the data are part of an ongoing study. Requests to access the datasets should be directed to Hegan Dong.

Acknowledgments

The authors would like to thank all the reviewers and editors who participated in this review.

Conflicts of Interest

The authors declare that they have no known competing financial interests or personal relationships that could have appeared to influence the work reported in this paper.

References

  1. Huang, J.; Yu, H.; Guan, X.; Wang, G.; Guo, R. Accelerated Dryland Expansion under Climate Change. Nat. Clim. Change 2016, 6, 166–171. [Google Scholar] [CrossRef]
  2. Huang, J.; Li, Y.; Fu, C.; Chen, F.; Fu, Q.; Dai, A.; Shinoda, M.; Ma, Z.; Guo, W.; Li, Z.; et al. Dryland Climate Change: Recent Progress and Challenges. Rev. Geophys. 2017, 55, 719–778. [Google Scholar] [CrossRef]
  3. Chen, S.; Du, T.; Wang, S.; Parsons, D.; Wu, D.; Guo, X.; Li, D. Quantifying the Effects of Spatial-Temporal Variability of Soil Properties on Crop Growth in Management Zones within an Irrigated Maize Field in Northwest China. Agric. Water Manag. 2021, 244, 106535. [Google Scholar] [CrossRef]
  4. Donald, C.M.; Hamblin, J. The Biological Yield and Harvest Index of Cereals as Agronomic and Plant Breeding Criteria. In Advances in Agronomy; Brady, N.C., Ed.; Academic Press: Cambridge, MA, USA, 1976; Volume 28, pp. 361–405. [Google Scholar]
  5. Hay, R.K.M. Harvest Index: A Review of Its Use in Plant Breeding and Crop Physiology. Ann. Appl. Biol. 1995, 126, 197–216. [Google Scholar] [CrossRef]
  6. Ashman, T.-L.; Schoen, D.J. How Long Should Flowers Live? Nature 1994, 371, 788–791. [Google Scholar] [CrossRef]
  7. Weiner, J. Plant Reproductive Ecology: Patterns and Strategies; Oxford University Press: Oxford, UK, 1988; ISBN 978-0-19-506394-3. [Google Scholar]
  8. Johnson, J.M.-F.; Allmaras, R.R.; Reicosky, D.C. Estimating Source Carbon from Crop Residues, Roots and Rhizodeposits Using the National Grain-Yield Database. Agron. J. 2006, 98, 622–636. [Google Scholar] [CrossRef]
  9. Dai, J.; Bean, B.; Brown, B.; Bruening, W.; Edwards, J.; Flowers, M.; Karow, R.; Lee, C.; Morgan, G.; Ottman, M.; et al. Harvest Index and Straw Yield of Five Classes of Wheat. Biomass Bioenergy 2016, 85, 223–227. [Google Scholar] [CrossRef]
  10. Solomon, B.D.; Barnes, J.R.; Halvorsen, K.E. Grain and Cellulosic Ethanol: History, Economics, and Energy Policy. Biomass Bioenergy 2007, 31, 416–425. [Google Scholar] [CrossRef]
  11. Chen, G. Dry Matter Production and Distribution. Maize Sci. 1994, 2, 48–53. [Google Scholar]
  12. Brancourt-Hulmel, M.; Doussinault, G.; Lecomte, C.; Bérard, P.; Le Buanec, B.; Trottet, M. Genetic Improvement of Agronomic Traits of Winter Wheat Cultivars Released in France from 1946 to 1992. Crop Sci. 2003, 43, 37–45. [Google Scholar] [CrossRef]
  13. Xiao, Y.G.; Qian, Z.G.; Wu, K.; Liu, J.J.; Xia, X.C.; Ji, W.Q.; He, Z.H. Genetic Gains in Grain Yield and Physiological Traits of Winter Wheat in Shandong Province, China, from 1969 to 2006. Crop Sci. 2012, 52, 44–56. [Google Scholar] [CrossRef]
  14. Peng, S.; Laza, R.C.; Visperas, R.M.; Sanico, A.L.; Cassman, K.G.; Khush, G.S. Grain Yield of Rice Cultivars and Lines Developed in the Philippines since 1966. Crop Sci. 2000, 40, 307–314. [Google Scholar] [CrossRef]
  15. Duvick, D.N. The Contribution of Breeding to Yield Advances in Maize (Zea mays L.). In Advances in Agronomy; Academic Press: Cambridge, MA, USA, 2005; Volume 86, pp. 83–145. [Google Scholar]
  16. Li, J.; Xie, R.Z.; Wang, K.R.; Ming, B.; Guo, Y.Q.; Zhang, G.Q.; Li, S.K. Variations in Maize Dry Matter, Harvest Index, and Grain Yield with Plant Density. Agron. J. 2015, 107, 829–834. [Google Scholar] [CrossRef]
  17. Meghji, M.R.; Dudley, J.W.; Lambert, R.J.; Sprague, G.F. Inbreeding Depression, Inbred and Hybrid Grain Yields, and Other Traits of Maize Genotypes Representing Three Eras. Crop Sci. 1984, 24, 545–549. [Google Scholar] [CrossRef]
  18. Tollenaar, M. Genetic Improvement in Grain Yield of Commercial Maize Hybrids Grown in Ontario from 1959 to 1988. Crop Sci. 1989, 29, 1365–1371. [Google Scholar] [CrossRef]
  19. Echarte, L.; Andrade, F.H. Harvest Index Stability of Argentinean Maize Hybrids Released between 1965 and 1993. Field Crops Res. 2003, 82, 1–12. [Google Scholar] [CrossRef]
  20. Hou, P.; Gao, Q.; Xie, R.; Li, S.; Meng, Q.; Kirkby, E.A.; Römheld, V.; Müller, T.; Zhang, F.; Cui, Z.; et al. Grain Yields in Relation to N Requirement: Optimizing Nitrogen Management for Spring Maize Grown in China. Field Crops Res. 2012, 129, 1–6. [Google Scholar] [CrossRef]
  21. Ruiz, A.; Trifunovic, S.; Eudy, D.M.; Sciarresi, C.S.; Baum, M.; Danalatos, G.J.N.; Elli, E.F.; Kalogeropoulos, G.; King, K.; dos Santos, C.; et al. Harvest Index Has Increased over the Last 50 Years of Maize Breeding. Field Crops Res. 2023, 300, 108991. [Google Scholar] [CrossRef]
  22. Sun, J.; Zhan, T.; Liu, M.; Zhang, Z.; Wang, Y.; Liu, S.; Wu, G.; Liu, G.; Tsunekawa, A. Verification of the Biomass Transfer Hypothesis under Moderate Grazing across the Tibetan Plateau: A Meta-Analysis. Plant Soil 2021, 458, 139–150. [Google Scholar] [CrossRef]
  23. Zhang, Y.; Yang, G.-S.; Shi, F.-X.; Mao, R. Biomass Allocation between Leaf and Stem Regulates Community-Level Plant Nutrient Resorption Efficiency Response to Nitrogen and Phosphorus Additions in a Temperate Wetland of Northeast China. J. Plant Ecol. 2021, 14, 58–66. [Google Scholar] [CrossRef]
  24. Zhu, Y.-H.; Weiner, J.; Jin, Y.; Yu, M.-X.; Li, F.-M. Biomass Allocation Responses to Root Interactions in Wheat Cultivars Support Predictions of Crop Evolutionary Ecology Theory. Front. Plant Sci. 2022, 13, 858636. [Google Scholar] [CrossRef] [PubMed]
  25. Golan, G.; Weiner, J.; Zhao, Y.; Schnurbusch, T. Agroecological Genetics of Biomass Allocation in Wheat Uncovers Genotype Interactions with Canopy Shade and Plant Size. New Phytol. 2024, 242, 107–120. [Google Scholar] [CrossRef] [PubMed]
  26. Li, G.; Si, M.; Zhang, C.; Shen, Z.; Wang, S.; Shao, J. Responses of Plant Biomass and Biomass Allocation to Experimental Drought: A Global Phylogenetic Meta-Analysis. Agric. For. Meteorol. 2024, 347, 109917. [Google Scholar] [CrossRef]
  27. Zhou, L.; Zhou, X.; He, Y.; Fu, Y.; Du, Z.; Lu, M.; Sun, X.; Li, C.; Lu, C.; Liu, R.; et al. Global Systematic Review with Meta-Analysis Shows That Warming Effects on Terrestrial Plant Biomass Allocation Are Influenced by Precipitation and Mycorrhizal Association. Nat. Commun. 2022, 13, 4914. [Google Scholar] [CrossRef]
  28. Zhou, L.; Hong, Y.; Li, C.; Lu, C.; He, Y.; Shao, J.; Sun, X.; Wang, C.; Liu, R.; Liu, H.; et al. Responses of Biomass Allocation to Multi-Factor Global Change: A Global Synthesis. Agric. Ecosyst. Environ. 2020, 304, 107115. [Google Scholar] [CrossRef]
  29. Edmeades, G.O.; Bolaños, J.; Chapman, S.C.; Lafitte, H.R.; Bänziger, M. Selection Improves Drought Tolerance in Tropical Maize Populations: I. Gains in Biomass, Grain Yield, and Harvest Index. Crop Sci. 1999, 39, 1306–1315. [Google Scholar] [CrossRef]
  30. Hou, P.; Liu, Y.; Xie, R.; Ming, B.; Ma, D.; Li, S.; Mei, X. Temporal and Spatial Variation in Accumulated Temperature Requirements of Maize. Field Crops Res. 2014, 158, 55–64. [Google Scholar] [CrossRef]
  31. Liu, G.; Hou, P.; Xie, R.; Ming, B.; Wang, K.; Xu, W.; Liu, W.; Yang, Y.; Li, S. Canopy Characteristics of High-Yield Maize with Yield Potential of 22.5 Mg Ha−1. Field Crops Res. 2017, 213, 221–230. [Google Scholar] [CrossRef]
  32. Hou, P.; Liu, Y.; Liu, W.; Liu, G.; Xie, R.; Wang, K.; Ming, B.; Wang, Y.; Zhao, R.; Zhang, W.; et al. How to Increase Maize Production without Extra Nitrogen Input. Resour. Conserv. Recycl. 2020, 160, 104913. [Google Scholar] [CrossRef]
  33. Liu, Y.; Xie, R.; Hou, P.; Li, S.; Zhang, H.; Ming, B.; Long, H.; Liang, S. Phenological Responses of Maize to Changes in Environment When Grown at Different Latitudes in China. Field Crops Res. 2013, 144, 192–199. [Google Scholar] [CrossRef]
  34. Xu, W.; Liu, C.; Wang, K.; Xie, R.; Ming, B.; Wang, Y.; Zhang, G.; Liu, G.; Zhao, R.; Fan, P.; et al. Adjusting Maize Plant Density to Different Climatic Conditions across a Large Longitudinal Distance in China. Field Crops Res. 2017, 212, 126–134. [Google Scholar] [CrossRef]
  35. Liu, B.; Chen, X.; Meng, Q.; Yang, H.; van Wart, J. Estimating Maize Yield Potential and Yield Gap with Agro-Climatic Zones in China—Distinguish Irrigated and Rainfed Conditions. Agric. For. Meteorol. 2017, 239, 108–117. [Google Scholar] [CrossRef]
  36. Zhou, B.; Yue, Y.; Sun, X.; Wang, X.; Wang, Z.; Ma, W.; Zhao, M. Maize Grain Yield and Dry Matter Production Responses to Variations in Weather Conditions. Agron. J. 2016, 108, 196–204. [Google Scholar] [CrossRef]
  37. Liu, Y.; Hou, P.; Xie, R.; Li, S.; Zhang, H.; Ming, B.; Ma, D.; Liang, S. Spatial Adaptabilities of Spring Maize to Variation of Climatic Conditions. Crop Sci. 2013, 53, 1693–1703. [Google Scholar] [CrossRef]
  38. Hao, B.; Xue, Q.; Marek, T.H.; Jessup, K.E.; Hou, X.; Xu, W.; Bynum, E.D.; Bean, B.W. Radiation-Use Efficiency, Biomass Production, and Grain Yield in Two Maize Hybrids Differing in Drought Tolerance. J. Agron. Crop Sci. 2016, 202, 269–280. [Google Scholar] [CrossRef]
  39. Sinclair, T.R. Historical Changes in Harvest Index and Crop Nitrogen Accumulation. Crop Sci. 1998, 38, 638–643. [Google Scholar] [CrossRef]
  40. Amanullah; Iqbal, A.; Irfanullah; Hidayat, Z. Potassium Management for Improving Growth and Grain Yield of Maize (Zea mays L.) under Moisture Stress Condition. Sci. Rep. 2016, 6, 34627. [Google Scholar] [CrossRef]
  41. Jaynes, D.B.; Colvin, T.S.; Kaspar, T.C. Identifying Potential Soybean Management Zones from Multi-Year Yield Data. Comput. Electron. Agric. 2005, 46, 309–327. [Google Scholar] [CrossRef]
  42. Robertson, M.; Isbister, B.; Maling, I.; Oliver, Y.; Wong, M.; Adams, M.; Bowden, B.; Tozer, P. Opportunities and Constraints for Managing Within-Field Spatial Variability in Western Australian Grain Production. Field Crops Res. 2007, 104, 60–67. [Google Scholar] [CrossRef]
  43. Jan, B.; Anwar Bhat, M.; Bhat, T.A.; Yaqoob, M.; Nazir, A.; Ashraf Bhat, M.; Mir, A.H.; Wani, F.J.; Kumar Singh, J.; Kumar, R.; et al. Evaluation of Seedling Age and Nutrient Sources on Phenology, Yield and Agrometeorological Indices for Sweet Corn (Zea mays saccharata L.). Saudi J. Biol. Sci. 2022, 29, 735–742. [Google Scholar] [CrossRef]
  44. Li, N.; Lin, H.; Wang, T.; Li, Y.; Liu, Y.; Chen, X.; Hu, X. Impact of Climate Change on Cotton Growth and Yields in Xinjiang, China. Field Crops Res. 2020, 247, 107590. [Google Scholar] [CrossRef]
  45. Jiapaer, G.; Liang, S.; Yi, Q.; Liu, J. Vegetation Dynamics and Responses to Recent Climate Change in Xinjiang Using Leaf Area Index as an Indicator. Ecol. Indic. 2015, 58, 64–76. [Google Scholar] [CrossRef]
  46. Edwards, J.T.; Purcell, L.C.; Vories, E.D. Light Interception and Yield Potential of Short-Season Maize (Zea mays L.) Hybrids in the Midsouth. Agron. J. 2005, 97, 225–234. [Google Scholar] [CrossRef]
  47. Ke, F.; Ma, X. Responses of Maize Hybrids with Contrasting Maturity to Planting Date in Northeast China. Sci. Rep. 2021, 11, 15776. [Google Scholar] [CrossRef]
  48. Shi, Z.; Yang, C.; Li, F.; Wang, Z.; Lv, X.; Wang, H.; Zhu, M. Analysis of Reasons for Low Yield among Late-Maturing Maize Varieties in Liaoning Province. Seed 2012, 31, 73–76. [Google Scholar] [CrossRef]
  49. Yao, Y.; Wang, X.; Yu, B.; Feng, G.; Bai, X.; Chen, Z. Yield Comparison of Maize Hybrids with Different Maturity in Three Locations of Liaoning Province. China Seed Ind. 2012, 10, 57–59. [Google Scholar] [CrossRef]
  50. Chen, L.; Shi, Z.; Li, F.; Wang, Z.; Wang, H.; Lv, X. Comparison of Yield and Related Traits of Maize Varieties with Different Maturity Periods in Liaoning Province. Seed 2010, 29, 68–71. [Google Scholar] [CrossRef]
  51. Di Matteo, J.A.; Ferreyra, J.M.; Cerrudo, A.A.; Echarte, L.; Andrade, F.H. Yield Potential and Yield Stability of Argentine Maize Hybrids over 45 Years of Breeding. Field Crops Res. 2016, 197, 107–116. [Google Scholar] [CrossRef]
  52. Hu, C.; Dong, S.; Wang, K.; Sun, Q. Evolution of Maize Cultivars in Different Ages in China: II. Evolution of Material Production Characteristics. Maize Sci. 1998, 50–54. [Google Scholar]
  53. Russell, W.A. Evaluations for Plant, Ear, and Grain Traits of Maize Cultivars Representing Seven Eras of Breeding. Maydica 1985, 30, 85–96. [Google Scholar]
  54. Curin, F.; Severini, A.D.; González, F.G.; Otegui, M.E. Water and Radiation Use Efficiencies in Maize: Breeding Effects on Single-Cross Argentine Hybrids Released between 1980 and 2012. Field Crops Res. 2020, 246, 107683. [Google Scholar] [CrossRef]
  55. Poorter, H.; Niinemets, Ü.; Ntagkas, N.; Siebenkäs, A.; Mäenpää, M.; Matsubara, S.; Pons, T.L. A Meta-Analysis of Plant Responses to Light Intensity for 70 Traits Ranging from Molecules to Whole Plant Performance. New Phytol. 2019, 223, 1073–1105. [Google Scholar] [CrossRef] [PubMed]
  56. Postma, J.A.; Hecht, V.L.; Hikosaka, K.; Nord, E.A.; Pons, T.L.; Poorter, H. Dividing the Pie: A Quantitative Review on Plant Density Responses. Plant Cell Environ. 2021, 44, 1072–1094. [Google Scholar] [CrossRef] [PubMed]
  57. Farnsworth, A.; Lunt, D.J.; Robinson, S.A.; Valdes, P.J.; Roberts, W.H.G.; Clift, P.D.; Markwick, P.; Su, T.; Wrobel, N.; Bragg, F.; et al. Past East Asian Monsoon Evolution Controlled by Paleogeography, Not CO2. Sci. Adv. 2019, 5, eaax1697. [Google Scholar] [CrossRef]
  58. Zhang, R.; Jiang, D.; Ramstein, G.; Zhang, Z.; Lippert, P.C.; Yu, E. Changes in Tibetan Plateau Latitude as an Important Factor for Understanding East Asian Climate since the Eocene: A Modeling Study. Earth Planet. Sci. Lett. 2018, 484, 295–308. [Google Scholar] [CrossRef]
  59. Zhang, R.; Jiang, D.; Zhang, Z.; Cheng, Z.; Zhang, Q. Comparison of the Climate Effects of Surface Uplifts from the Northern Tibetan Plateau, the Tianshan, and the Mongolian Plateau on the East Asian Climate. J. Geophys. Res. Atmos. 2017, 122, 7949–7970. [Google Scholar] [CrossRef]
  60. Mohammed, R.; Scholz, M. Impact of Evapotranspiration Formulations at Various Elevations on the Reconnaissance Drought Index. Water Resour. Manag. 2017, 31, 531–548. [Google Scholar] [CrossRef]
  61. Liu, X.; Li, Z.; Li, Z.; Liu, M.; Xu, B.; Li, H.; Liu, F. Impacts of Various Soil Moisture Replenishment Patterns on Plant Water Use Strategies in the Third Pole Region. Catena 2025, 254, 108942. [Google Scholar] [CrossRef]
  62. Sun, Y.; Hu, T.; Zhang, X. Anthropogenic Influence on Altitudinally Amplified Temperature Change in the Tibetan Plateau. Environ. Res. Lett. 2024, 19, 054012. [Google Scholar] [CrossRef]
  63. Kumhálová, J.; Moudrý, V. Topographical Characteristics for Precision Agriculture in Conditions of the Czech Republic. Appl. Geogr. 2014, 50, 90–98. [Google Scholar] [CrossRef]
  64. Marques da Silva, J.R.; Silva, L.L. Evaluation of the Relationship between Maize Yield Spatial and Temporal Variability and Different Topographic Attributes. Biosyst. Eng. 2008, 101, 183–190. [Google Scholar] [CrossRef]
  65. Wang, N.; Ai, Z.; Zhang, Q.; Leng, P.; Qiao, Y.; Li, Z.; Tian, C.; Cheng, H.; Chen, G.; Li, F. Impacts of Nitrogen (N), Phosphorus (P), and Potassium (K) Fertilizers on Maize Yields, Nutrient Use Efficiency, and Soil Nutrient Balance: Insights from a Long-Term Diverse NPK Omission Experiment in the North China Plain. Field Crops Res. 2024, 318, 109616. [Google Scholar] [CrossRef]
  66. Ma, C.; Yuan, H.; Shi, N.; Sun, Z.; Liu, S.; Wang, X.; Li, B.; Li, S.; Liu, Z. Effects of Phosphate Application Rate on Grain Yield and Nutrition Use of Summer Maize under the Coastal Saline-Alkali Land. Agronomy 2023, 13, 2668. [Google Scholar] [CrossRef]
  67. Zou, H.; Li, D.; Ren, K.; Liu, L.; Zhang, W.; Duan, Y.; Lu, C. Response of Maize Yield and Nitrogen Recovery Efficiency to Nitrogen Fertilizer Application in Field with Various Soil Fertility. Front. Plant Sci. 2024, 15, 1349180. [Google Scholar] [CrossRef]
  68. Sucunza, F.A.; Gutierrez Boem, F.H.; Garcia, F.O.; Boxler, M.; Rubio, G. Long-Term Phosphorus Fertilization of Wheat, Soybean and Maize on Mollisols: Soil Test Trends, Critical Levels and Balances. Eur. J. Agron. 2018, 96, 87–95. [Google Scholar] [CrossRef]
  69. Bai, Z.; Li, H.; Yang, X.; Zhou, B.; Shi, X.; Wang, B.; Li, D.; Shen, J.; Chen, Q.; Qin, W.; et al. Erratum to: The Critical Soil P Levels for Crop Yield, Soil Fertility and Environmental Safety in Different Soil Types. Plant Soil 2013, 372, 39. [Google Scholar] [CrossRef]
  70. van Biljon, J.J.; Fouche, D.S.; and Botha, A.D.P. Threshold Values and Sufficiency Levels for Potassium in Maize Producing Sandy Soils of South Africa. S. Afr. J. Plant Soil 2008, 25, 65–70. [Google Scholar] [CrossRef]
  71. Cai, Z.C.; Qin, S.W. Dynamics of Crop Yields and Soil Organic Carbon in a Long-Term Fertilization Experiment in the Huang-Huai-Hai Plain of China. Geoderma 2006, 136, 708–715. [Google Scholar] [CrossRef]
  72. Jha, A.; Bonetti, S.; Smith, A.P.; Souza, R.; Calabrese, S. Linking Soil Structure, Hydraulic Properties, and Organic Carbon Dynamics: A Holistic Framework to Study the Impact of Climate Change and Land Management. J. Geophys. Res. Biogeosci. 2023, 128, e2023JG007389. [Google Scholar] [CrossRef]
  73. Johnston, A.E.; Poulton, P.R.; Coleman, K. Chapter 1 Soil Organic Matter: Its Importance in Sustainable Agriculture and Carbon Dioxide Fluxes. In Advances in Agronomy; Sparks, D.L., Ed.; Academic Press: Cambridge, MA, USA, 2009; Volume 101, pp. 1–57. [Google Scholar]
  74. Meurer, K.; Barron, J.; Chenu, C.; Coucheney, E.; Fielding, M.; Hallett, P.; Herrmann, A.M.; Keller, T.; Koestel, J.; Larsbo, M.; et al. A Framework for Modelling Soil Structure Dynamics Induced by Biological Activity. Glob. Change Biol. 2020, 26, 5382–5403. [Google Scholar] [CrossRef]
  75. Rubio, V.; Diaz-Rossello, R.; Quincke, J.A.; van Es, H.M. Quantifying Soil Organic Carbon’s Critical Role in Cereal Productivity Losses under Annualized Crop Rotations. Agric. Ecosyst. Environ. 2021, 321, 107607. [Google Scholar] [CrossRef]
  76. Schjønning, P.; de Jonge, L.W.; Munkholm, L.J.; Moldrup, P.; Christensen, B.T.; Olesen, J.E. Clay Dispersibility and Soil Friability—Testing the Soil Clay-to-Carbon Saturation Concept. Vadose Zone J. 2012, 11, vzj2011-0067. [Google Scholar] [CrossRef]
  77. Moinet, G.Y.K.; Hijbeek, R.; van Vuuren, D.P.; Giller, K.E. Carbon for Soils, Not Soils for Carbon. Glob. Change Biol. 2023, 29, 2384–2398. [Google Scholar] [CrossRef] [PubMed]
  78. Manlay, R.J.; Feller, C.; Swift, M.J. Historical Evolution of Soil Organic Matter Concepts and Their Relationships with the Fertility and Sustainability of Cropping Systems. Agric. Ecosyst. Environ. 2007, 119, 217–233. [Google Scholar] [CrossRef]
  79. Oldfield, E.E.; Bradford, M.A.; Wood, S.A. Global Meta-Analysis of the Relationship between Soil Organic Matter and Crop Yields. Soil 2019, 5, 15–32. [Google Scholar] [CrossRef]
  80. Oldfield, E.E.; Wood, S.A.; Bradford, M.A. Direct Evidence Using a Controlled Greenhouse Study for Threshold Effects of Soil Organic Matter on Crop Growth. Ecol. Appl. 2020, 30, e02073. [Google Scholar] [CrossRef]
  81. Pan, G.; Smith, P.; Pan, W. The Role of Soil Organic Matter in Maintaining the Productivity and Yield Stability of Cereals in China. Agric. Ecosyst. Environ. 2009, 129, 344–348. [Google Scholar] [CrossRef]
  82. Zvomuya, F.; Janzen, H.H.; Larney, F.J.; Olson, B.M. A Long-Term Field Bioassay of Soil Quality Indicators in a Semiarid Environment. Soil Sci. Soc. Am. J. 2008, 72, 683–692. [Google Scholar] [CrossRef]
Figure 1. The geographic distribution of maize sampling locations across the Xinjiang Uygur Autonomous Region, China. The map legend employs the following classification system: cultivar maturity groups (indicated by letters); sampling chronology (indicated by numbers): 22 and 23 represent the sampling conducted in 2022 and 2023, respectively.
Agriculture 15 01207 g001
Figure 2. Comparative analysis of productivity parameters across maize varieties with distinct maturity periods: (a) Grain yield; (b) Stover yield; (c) Dry matter; (d) Harvest index. In the box plots, the diamond represents an outlier. The upper boundary line of the box corresponds to the upper quartile (Q3), while the lower boundary line indicates the lower quartile (Q1). A horizontal line within the box denotes the median of the dataset. Additionally, the triangle inside the box signifies the arithmetic mean. p ≤ 0.05 indicates significant differences, while unmarked comparisons show no significance.
Agriculture 15 01207 g002
Figure 3. Relationship analysis among productivity parameters: correlation strengths are indicated by p-values, regression equations, and coefficients of determination (R2). (a) Linear regression analysis of grain yield per plant and harvest index; (b) Linear regression analysis of stover yield per plant and harvest index; (c) Linear regression analysis of dry matter and harvest index; (d) Linear regression analysis of grain yield per plant and stover yield per plant; (e) Linear regression analysis of grain yield per plant and dry matter; (f) Linear regression analysis of stover yield per plant and dry matter.
Agriculture 15 01207 g003
Figure 4. Density-dependent effects on yield components and related traits in maize cultivation systems: (a) grain yield per plant; (b) stover yield per plant; (c) grain yield; (d) stover yield; (e) dry matter; (f) harvest index; Each panel presents the adjusted coefficient of determination (R2) quantifying planting density effects on specific dry matter or yield parameters.
Agriculture 15 01207 g004
Figure 5. A correlation heatmap of yield-related traits (grain yield [GY], stover yield [SY], dry matter [DM], and harvest index [HI]) with environmental and agronomic factors across maize maturity groups (all varieties [ALL], early-maturing [EM], medium-maturing [MM], and late-maturing [LM]). The analyzed factors include topographic parameters (altitude [ASL], effective accumulated temperature [EAT]), soil physical properties (bulk density [BD], aggregate fractions: large macroaggregates [LMA] > 2 mm, small macroaggregates [SMA] 0.25–2 mm, microaggregates [MA] 0.053–0.25 mm, and silt–clay fraction [SC] < 0.053 mm), soil chemical properties (soil organic matter [SOM], total nitrogen [TN], total phosphorus [TP], total potassium [TK], alkali-hydrolyzable nitrogen [AKN], available phosphorus [AP], available potassium [AK], pH, and electrical conductivity [EC]), a management factor (planting density [PD]), and per-plant productivity measures (grain yield per plant [GYP], stover yield per plant [SYP], plant height [PLH]). Correlation strengths are color-coded, with statistical significance denoted by asterisks (* p < 0.05; ** p < 0.01; *** p < 0.001).
Agriculture 15 01207 g005
Figure 6. Multivariate analysis of harvest index determinants across three complementary approaches: (a) univariate regression coefficient ranking showing effect directionality (positive/negative associations); (b) XGBoost machine learning with SHAP (SHapley Additive exPlanations) values for nonlinear feature importance assessment; and (c,d) partial least squares structural equation modeling (PLS-SEM) quantifying direct, indirect, and total effects on the HI. The PLS-SEM results present standardized path coefficients, with arrow colors indicating positive (red) or negative (blue) relationships. The thickness of the lines is proportional to the absolute value of the standardized path coefficients (the larger the coefficient, the thicker the line). Statistical significance is indicated by asterisks (* p < 0.05; ** p < 0.01; *** p < 0.001). The XGBoost machine learning algorithm demonstrated an exceptionally high coefficient of determination (R2 = 0.952), indicating that 95.2% of the variance in the harvest index was explained by the model. The root means square error (RMSE = 0.217) and mean absolute error (MAE = 0.167) both exhibit values asymptotically approaching zero, reflecting minimal systematic deviation between the predicted and observed values. The PLS-SEM framework achieved a goodness-of-fit (GOF) index of 0.568 (reference criteria: ≥0.36 = moderate; ≥0.50 = excellent).
Agriculture 15 01207 g006
Figure 7. The impact of different environmental factors on the harvest index. The figure provides the linear regression equation and the adjusted coefficient of determination (R2) and p-values to quantify the extent of each environmental factor’s influence on the harvest index.
Agriculture 15 01207 g007
Table 1. Summary of variable groups, definitions, units, abbreviations, and descriptive statistics for maize productivity and environmental factors in arid regions.
Variable GroupingVariable NameUnitAbbreviationAverage ValueMinimumMaximumCoefficient of VariationNumber of Cases
genetic factorsearly-maturing EM 22
medium-maturingMM40
late-maturingLM54
agronomic practicesplanting densityplants·m−2PD8.767.2610.739.3%116
climatic and geographic conditionsaltitudemASL798.59452.001535.0033.3%
effective accumulated temperature°CEAT1909.271113.202413.5022.8%
soil chemical propertiessoil organic matterg·kg−1SOM13.385.6322.6127.9%
total nitrogenTN1.070.342.3841.1%
total phosphorusTP0.910.201.7541.7%
total potassiumTK24.7914.4440.8824.6%
alkali-hydrolyzable Nitrogenmg·kg−1AKN67.0223.04117.9926.9%
available phosphorusAP14.973.6328.9944.7%
available potassiumAK301.00113.52530.8430.7%
pH pH7.727.208.302.9%
soil physical propertiesbulk densityg·cm−3BD1.160.751.7217.3%
electrical conductivitymS·cm−1EC0.650.251.3536.7%
large macroaggregates%LMA11.61−1.0924.8845.5%
small macroaggregatesSMA29.3216.5542.2121.0%
microaggregatesMA30.7313.5249.0819.4%
silt–clay fractionSC28.348.2359.6028.2%
productivity parametersgrain yieldkg·m−2GY1.350.741.8015.3%
stover yieldSY1.100.411.7520.9%
dry matterDM2.451.153.3016.2%
grain yield per plantGYP0.160.090.2117.9%
stover yield per plantSYP0.130.050.2122.7%
plant heightcmPLH260.43192.90381.2013.5%
harvest index HI0.550.420.667.5%
Disclaimer/Publisher’s Note: The statements, opinions and data contained in all publications are solely those of the individual author(s) and contributor(s) and not of MDPI and/or the editor(s). MDPI and/or the editor(s) disclaim responsibility for any injury to people or property resulting from any ideas, methods, instructions or products referred to in the content.

